The Classification Impact of Different Types of Environmental Regulation on Chinese Provincial Carbon Emission Efficiency


1
School of Cultural Tourism and Public Administration, Fujian Normal University, Fuzhou 350117, China
2
School of Accounting and Finance, The Hong Kong Polytechnic University, Hong Kong 999077, China
3
School of Economics and Management, Fuzhou University, Fuzhou 350116, China
4
Department of Electrical and Electronic Engineering, The Hong Kong Polytechnic University, Hong Kong 999077, China
*
Author to whom correspondence should be addressed.
Sustainability 2023, 15(15), 12092; https://doi.org/10.3390/su151512092
Submission received: 22 May 2023
/
Revised: 28 July 2023
/
Accepted: 4 August 2023
/
Published: 7 August 2023
Abstract
:The evaluation of inter-provincial carbon emission efficiency and the analysis of its influencing factors hold great practical significance for reducing carbon emissions and promoting sustainable development in ecological management. To address the shortcomings of existing research in the classification evaluation of carbon emission efficiency and account for the impacts of different environmental regulatory policies on carbon emissions, this paper aims to examine the impact of formal and informal environmental regulations on carbon emission efficiency. This is accomplished by utilizing a combination of the data envelopment analysis (DEA) model, entropy weighting, and k-means cluster analysis methods. The fixed-effects model is also applied to examine the influences of different factors on carbon emission efficiency under different categories. To conduct the case studies, carbon emission management data from 30 provinces in China are collected, and the results show the following: (1) Formal environmental regulations exhibit a “U-shaped” relationship with carbon emission efficiency, whereas informal environmental regulations have an “inverted U-shaped” relationship with carbon emission efficiency. (2) Under the cluster analysis of carbon emission efficiency, formal environmental regulations are found to have a stronger incentive effect on inter-provincial carbon efficiency compared to informal environmental regulations. This study carries significant theoretical and practical implications for China’s timely attainment of its double-carbon target.
1. Introduction
Global greenhouse gas emissions and climate change pose a serious threat to ecological protection, and carbon emissions have become a hot topic in global economic growth and environmental protection. As the world’s largest developing country, China has proposed the ambitious goal of peaking carbon emissions in 2030 and achieving carbon neutrality in 2060. However, the Chinese government is currently facing a major challenge in meeting its carbon reduction targets and ensuring steady economic growth simultaneously. A series of environmental protection policies have been proposed by the government in response to the increasingly challenging environmental management problems, in which environmental regulation is considered an important tool for energy conservation and emission reduction.
Environmental regulation is an important initiative for environmental protection, aimed at achieving ecologically and economically sustainable development [1]. Formal environmental regulations are government-led, while informal environmental regulations are spontaneously formed by social groups. However, the public goods attribute of carbon emission management puts pressure on government environmental regulation policies, and many policymakers have attempted to establish a comprehensive system to deal with environmental pollution and emission reduction [2]. Due to the importance of ecological civilization construction, the government is committed to making the relationships between different types of environmental regulation and inter-provincial carbon emission efficiency clear. However, there is information asymmetry and weak supervision in formal environmental regulations in actual carbon emission management, which weakens the effectiveness of formal environmental regulations [3]. Compared with formal environmental regulations, informal environmental regulations are regarded as a way for social groups to spontaneously solve environmental pollution emissions. Considering that the impacts of informal environmental regulations on China’s inter-provincial carbon emission efficiency are much different from those of formal environmental regulations, this study aims to investigate whether different types of environmental regulation have an impact on China’s inter-provincial carbon emission efficiency and how they work.
The distinction between this investigation and prior relevant studies is that most existing studies focus on the impact of environmental regulations on carbon emission efficiency in individual sectors, such as its impact on grain production [4], the tourism industry [5], and the transportation industry [6]. There are few studies that focus on using cluster analysis as a framework to explore the mechanisms among the different types of environmental regulation and carbon emission efficiency in different regions. In addition, the objectivity of indicator selection has been overlooked in the usage of indicators in each model [7,8,9]. Based on the research background and motivation described above, this study proposes the following objectives:
- Using the entropy weight method to enhance the objectivity of indicator selection in the operational process.
- Considering the incentive effects of two types of environmental regulation on carbon emission efficiency.
- Using cluster analysis to identify regional characteristics in China, which will help to improve assessment of the effects of influencing factors on efficiency evaluation.
Many scholars engaged in carbon emission efficiency evaluation have obtained considerable achievements. That said, existing models could be vulnerable to missing impact factors, which play essential roles in efficiency evaluation. In addition, a limited number of existing studies focus on the influencing analysis of environmental regulation on carbon emission management, and even fewer studies have analyzed carbon emissions driven by influencing factors through the investigation of regional cluster analysis. Thus, to engage with this research gap, this paper proposes a DEA undesirable output model for carbon emission efficiency evaluation, integrates entropy weighting to screen carbon emission-related indicators, and performs a classification regression analysis of regional carbon emission efficiency influencing factors according to the results of the cluster analysis. The DEA undesirable output model proposed in this paper involves a strong disposability transformation of undesirable outputs, enabling the transformed outputs to be applied to traditional DEA efficiency evaluation. This method has become one of the primary mathematical approaches to solving undesirable output efficiency evaluation problems.
In this case study, carbon emission management data collected from 30 provinces in China, spanning the period from 2009 to 2019, are analyzed using classification analysis to evaluate the impacts of two types of environmental regulation on carbon emission efficiency. As a result, relevant research conclusions and policy recommendations for carbon emission governance are drawn.
2. Literature Review
In recent years, an increasing number of studies have explored methods of effectively evaluating the relationship between environmental regulations and carbon emission efficiency. This section reviews the literature regarding environmental regulations and carbon emission efficiency, to illustrate the focus of previous research.
2.1. Review of Environmental Regulations
Based on previous studies, environmental regulations can be divided into two categories—industrial pollution control and environmental protection in cities. At present, existing research defines environmental regulations within the framework of five distinct categories. (1) Based on public management. Féres et al. [7] classified environmental regulations into formal and informal types. Furthermore, Xie et al. [10] divided the formal type into command-and-control and economic incentive based on the different polluting behaviors of economic entities. (2) Based on different definitions. Cormier et al. [11] extended these categories into explicit and implicit types. (3) Based on the region of application. Costantini et al. [12] divided environmental regulations into export country, import country, and multilateral categories. (4) Based on different economic benefits. Environmental regulations are classified into cost-based and investment-based types [13,14]. (5) Testa et al. [15] categorized regulations into command-and-control, market-based, and voluntary types. Numerous recent studies have placed significant emphasis on environmental regulations across various domains. For example, Yuan et al. [16] studied the mechanisms of green development and the utility of industrial innovation on carbon emissions using panel data from the Chinese manufacturing industry. Yin et al. [17] analyzed the indirect impact mechanisms of digital finance and the implications of diverse environmental regulations on the advancement of high-quality economic growth and its consequences in the year 2022, providing a foundation for the construction of sensible environmental regulatory policies. Zheng et al. [18] investigated the influence of environmental regulations on green total factor productivity, utilizing a measurement model that incorporated a more lenient approach.
2.2. Reviews of Carbon Emission Efficiency
Carbon emission efficiency has received a lot of attention in recent years, and much research has focused on analyzing the influence of different factors on carbon emission efficiency. Among them, data envelopment analysis (DEA) has the capability to evaluate the efficiency of relative decision-making units with multiple inputs and outputs [19]. This efficiency evaluation method enables decision-making units to achieve a large number of effective units while remaining in their optimal conditions. While traditional CCR and BCC models of DEA allow for proportional adjustments of input and output items, this condition may not be applicable in all situations [20]. Scholars such as Malmquist, Fare, and Grosslopf made adjustments to models based on their specific use cases [21,22,23]. For example, Tone et al. [24] proposed an SBM model based on differential variables, which takes into full consideration the slack between inputs and outputs; they also proposed a dynamic weighted DEA method based on four categories, which takes into account factors that are desirable, undesirable, etc. These adjustments have enabled DEA to be widely applied in various fields such as banking, medicine, and finance [25]. Additionally, DEA has also been utilized to calculate carbon emission efficiency in various provinces. Wang et al. [26] used DEA to calculate carbon emission efficiency. Significant variations in carbon emission efficiency were observed across the eastern, central, and western regions of China, and the factors affecting carbon emissions in different regions were also different. Cheng et al. [27] used NDDF to construct a new efficiency measurement model to determine China’s industrial carbon emission efficiency, and their results showed that its efficiency had inter-group heterogeneity. Yan et al. [28] used the spatial Durbin model to explore the direct and indirect correlations between carbon emissions and steel trade. Sun et al. [29] examined the factors influencing carbon emission efficiency in relation to urbanization. Their findings revealed an “inverted U-shaped” correlation between urbanization and carbon emission efficiency, indicating that as urbanization progresses, there is an initial improvement followed by a plateauing effect. Additionally, the study highlighted the role of industrial structure in constraining the enhancement of carbon emission efficiency.
2.3. Review of Environmental Regulations and Carbon Emissions
Previous studies have pointed out that augmenting the stringency of environmental regulation can paradoxically result in a rise in carbon emissions, which Sinn [30] named the “green paradox”. Fossil fuel suppliers will expedite the extraction of fossil fuels because they anticipate that the government’s environmental regulations will become tighter in the future. So, the result is an increase in the current supply of fossil fuels, a decrease in prices, and increased purchasing and use of fossil fuels by industrial enterprises. Ultimately, this will increase the intensity of current carbon emissions [31]. Similarly, Jiang et al. [32] examined the correlation between inter-provincial carbon emission efficiency and environmental regulations in China, using the SBM-ML model for efficiency testing. Their findings showed that they had a nonlinear correlation.
As for the indirect influence of environmental regulations on carbon emissions, there are three main aspects: (1) Foreign investment and “pollution haven”. Zhang et al. [33] used the benchmark regression, threshold effect, and mediation effect models to verify the mechanism of FDI’s impact on carbon emissions. Their results showed that FDI has a strong direct effect and a weak indirect effect. (2) The reconfiguration of industrial structure. With the advancement of environmental regulations, the industrial structure will shift towards higher levels. Environmental regulations and industries have a non-linear connection with carbon emission, according to Chen et al. [34]. (3) Technological innovation. Porter [35] proposed the “Porter Hypothesis”, which suggests that an increase in environmental regulations will stimulate the innovation drive of enterprises.
2.4. Limitations of Existing Research
According to the our review of the literature, we find that existing studies have the following limitations:
- (1)
- Few studies focus on indicator screening in carbon emission efficiency evaluation. Considering that there are many factors that affect the effectiveness of carbon emissions in actual environmental management, indicator screening is essential in carbon emission efficiency evaluation; however, previous studies mainly rely on experts’ experience for indicator screening, resulting in strong subjectivity and a significant impact on efficiency evaluation.
- (2)
- Previous research on the intrinsic relationship between environmental regulations and carbon emission efficiency has been insufficient. As an important measure to reduce pollution emissions, environmental regulation has a significant impact on carbon emission efficiency. However, existing research has not focused on the differences in the impacts and mechanisms of different environmental regulations on regional carbon emission efficiency.
- (3)
- There is a lack of classification research on regional carbon emission efficiency in the existing literature. The existing classifications and evaluations of carbon emission efficiency mainly rely on expert experience for regional division, lacking objective classification based on the different characteristics of different regions.
3. Classification Analysis of Effects of Environmental Regulations on Carbon Emission Efficiency
To investigate the classification effects of different types of environmental regulation on inter-provincial carbon emission efficiency, the following sections elaborate on the details of the proposed methods.
3.1. Indicator Screening Based on Entropy Weight Method
As one of the objective weight methods, the entropy weight method reduces subjectivity in the calculation process. Based on changes in the indicators and information entropy, the entropy weight method can calculate the entropy of each indicator. Compared with the analytic hierarchy process, the entropy weight method has higher accuracy [36]. Additionally, the weight value calculated by the entropy weight method can be modified, which gives it higher adaptability in practice. Thus, in order to improve the objectivity of carbon emission efficiency evaluation, the entropy weight method is introduced for indicator screening using the following steps:
Step 1: To standardize carbon emission input indicators. Assuming that the carbon emission efficiency indicators include M input indicators {Ui; i = 1, …, M} and each indicator has T data points {xi,t; t = 1, …, T}, the standardized indicator Y = (yi,t) M × Y; the calculation can be performed utilizing the formula provided below:
where
denotes that is a positive indicator, which at higher values will be better, while denotes that is a negative indicator, which at lower values will be better.
Step 2: To figure out each input indicator’s entropy value. The quantity of information that can be seen in the indicator is indicated by the entropy value. It holds more information when the entropy value is higher and less information when the entropy value is lower. Considering the given definition, the entropy for the ith indicator can be computed in the following manner:
where represents the weight of the ith data point of the ith input indicator, which is calculated as follows:
Step 3: To calculate each input indicator’s weight. Based on Step 2, the following formula may be used to determine how much each input indicator should be weighted:
Step 4: To select input indicators based on the weights. In Step 3, based on practical needs, the corresponding data are selected as the input indicators. Finally, an objectivity carbon emission efficiency calculation model is constructed.
3.2. Carbon Emission Efficiency Modeling Based on Undesirable Output Model
The DEA model, proposed by Charnes et al. in 1978 [20], has become one of the main mathematical methods for solving efficiency evaluation problems. Its advantages include the ability to evaluate efficiency effectively for multiple inputs and outputs, with no need for the dimensionless processing of data, and no requirement for weight assumptions. With the successful application of the DEA model in fields such as economics, management, and systems science, more and more scholars have used the DEA model for carbon emission efficiency evaluation studies [37], among which the DEA undesirable output model has the widest application scope in carbon emission efficiency evaluation. Therefore, this paper introduces the DEA undesirable output model to calculate input–output efficiency in the carbon emission management problem, and it has the advantages of a calculation process that is relatively straightforward [38] and strong disposability transformation, meaning undesirable outputs can be converted into desirable outputs, making them applicable to traditional DEA efficiency calculation models [39]. This results not only in better application prospects but also stronger applicability in carbon emission governance problem [40].
Yang et al. emphasized the necessity of distinguishing weak and strong disposability among undesirable outputs in efficiency assessments, and proposed a model to distinguish them based on the technical features of undesirable output [41]. Sueyoshi et al. argued that, under the assumption of weak disposability for undesirable outputs, a decrease in desirable outputs would lead to a decrease in undesirable outputs, which cannot reflect the effects of managerial effort and technology innovation on efficiency evaluation [42]. Therefore, different disposability assumptions for undesirable outputs imply different production possibility sets [43], and many scholars believe that strong disposability is a better representation of the response of undesirable outputs in efficiency evaluation.
Step 1: Assuming there are n decision-making units (DMUs), denoted as DMUj (j = 1, …, n), when there exist n sets of multi-input and multi-output data, j represents the jth decision-making unit, n is the total number of decision-making units, and each set consists of m inputs xij (i = 1, …, m; j = 1, …, n), where i is the ith input and m is the total number of inputs. Desirable outputs are denoted as yrj (r = 1, …, s), and undesirable outputs are denoted as zfj (f = 1, …, h), respectively. Thus, the decision matrix is as follows:
Step 2: The transformation of carbon emission indicators into undesirable outputs. Based on previous studies, undesirable outputs are transformed into desirable ones [38].
Step 3: Calculation of the efficiency value of each decision-making unit. Based on the input matrix X(T), expected output matrix Y(T), and undesirable output matrix Z(T) shown in Formulas (5)–(7), the DEA undesirable output model can be used to solve the efficiency values of each decision-making unit. For a specific DMU0, its efficiency value can be obtained by solving the following linear model:
Step 4: The efficiency values (j = 1, …, n) of the n decision-making units can be obtained from Step 3. When = 1, it indicates that the input–output structure of the jth decision-making unit is effective for carbon emission reduction. When < 1, it indicates that the input–output structure of the jth decision-making unit still needs improvement for carbon emission reduction.
3.3. Classification Modeling of Effects of Environmental Regulations on Carbon Emission Efficiency
The definition of environmental regulation is a growing problem that requires more attention from scholars. Currently, there is no standard method to measure the indicators of environmental regulation. To address environmental governance problems effectively, China’s environmental regulations are full of policy directions and compulsory measures [39]. Based on these government administrative instructions, formal environmental regulations have been established. Therefore, the higher the government’s financial investment in environmental issues, the more emphasis it places on this field. Since China has committed to achieving sustainable development, environmental issues have garnered public attention, which has led to the emergence of informal environmental regulations in society that cannot be ignored. To clarify the relationship between environmental regulations and carbon emission efficiency, this study proposes the differentiation between formal environmental regulation enforced by administrative orders and informal environmental regulation formed via public participation, and presents the following theoretical hypothesis:
Type 1: Formal environmental regulation. The “green paradox” proposes that an increasing intensity of environmental regulation will lead to greater exploitation of fossil fuels in the current production industry, resulting in increased carbon emissions [30]. In the early stages of formal environmental regulation implementation, decision-makers face increased management costs as the intensity of environmental regulation improves. However, the intensity of the technological innovation effect stimulated by environmental regulation will exceed the intensity of the cost effect. Therefore, decision-makers are more willing to improve the level of technological innovation to adapt to the increase in environmental regulation intensity, resulting in improved economic efficiency and technological innovation efficiency. It should be noted that the effect of technological innovation based on the enhancement of environmental regulation intensity is limited. The “Porter hypothesis” points out that an increase in environmental regulation intensity can stimulate innovation enthusiasm, using technological innovation to compensate for management costs, which is called the “incentive effect” [35]. If there are not enough effects to compensate for the cost increase, the cost effect will become negative, which is the “weak Porter hypothesis”; meanwhile, if the effect can compensate for the increase in management costs, the cost effect will be positive, which is the “strong Porter hypothesis”.
Based on the above analysis, the following two hypotheses are generated:
H1a.
There is a non-linear relationship between formal environmental regulation and carbon emission efficiency.
H1b.
There is an incentive effect between formal environmental regulation and carbon emission efficiency.
Type 2: Informal environmental regulation. Compared with formal environmental regulation, informal environmental regulation can compensate for the deficiencies of government environmental management. As a regulation spontaneously formed by the public, informal environmental regulation can generate public opinion guidance, putting pressure on both the government and enterprises to manage the environment better. Under the influence of these pressures, decision-makers become more aware of pollution problems and will improve management technology to enhance carbon emission efficiency [40].
Thus, the following two hypotheses are also proposed:
H2a.
There exists a non-linear relationship between informal environmental regulation and carbon emission efficiency.
H2b.
There exists an incentive effect between informal environmental regulation and carbon emission efficiency.
Informal environmental regulation consists of a series of indicators. In order to effectively calculate the value of informal environmental regulation, the method introduced in 3.1 is used to select the series indicators. On the basis of the above, k-means cluster analysis is applied to classify the different regions in empirical studies.
Step 1: Normalized preprocessing.
where μ represents the mean of the entire dataset, σ denotes the standard deviation of the dataset, and x represents an individual observation.
Step 2: Preliminary classification. Based on the province clustering sample set, x = {x1, x2, …, xn}. For the n province clustering samples, select k samples as initial province clustering centers according to experience, and divide them into k categories.
Step 3: Reclassification. Find the clustering center zv and the class center point uv that match each province sample xi, thus forming a new k class, completing one iteration process. Take the average method to calculate the new class center points and make the clustering criterion function converge.
To generate the results of the classification impact of different types of environmental regulation on Chinese provincial carbon emission efficiency, the regression models should be written as follows:
For formal environmental regulation, the following equation is used to discuss its non-linear impact and incentive effect on carbon emission efficiency.
where FERi represents the level of formal environmental regulation associated with the ith province, xi represents the ith province’s control variable, and μi is the residual term for the ith province.
For informal environmental regulations, the following equations are used to discuss their non-linear effects and incentive effects on carbon efficiency.
where IFERi represents the level of informal environmental regulation associated with the ith province, xirepresents the ith province’s control variable, and μi is the residual term for the ith province.
The theoretical framework of this paper, based on the aforementioned calculation steps, is illustrated in Figure 1.
4. Case Studies of Chinese Carbon Emission Management
In this section, we present case studies that utilize carbon emission management data collected from 30 Chinese provinces spanning the period from 2009 to 2019. The empirical processes based on the above methods are presented in Section 4.1 and Section 4.2 to prove the effectiveness of this study.
4.1. Data Sources and Descriptive Statistics
The calculation results of carbon emission efficiency can vary depending on the perspectives of the input indicators, consequently affecting the analysis of the relationship between carbon emission efficiency and environmental regulations. The entropy approach may successfully reduce the subjectivity of indicator selection by providing an objective weight method. This method can not only reflect the actual influence of different indicators on carbon emission efficiency but also calculate values based on informatics theory [36]. The data used in this study were sourced from the environmental module-related indicators published on the official website of the National Bureau of Statistics of China
After selecting the input indicators, it is necessary to divide the indicators into “undesirable output” and “desirable output” in this process [1]. Therefore, gross domestic product (GDP) is designated as the “desirable output”, and carbon emission is categorized as the “undesirable output” [44,45].
Table 1 presents the results of the descriptive statistical analysis of carbon emission efficiency indicators, and these indicators were all selected from previous studies [1,34,46]. According to the proposed entropy weight method in Section 3.2, the top three indicators every year are extracted for the construction of the DEA undesirable output model for carbon emission efficiency evaluation, i.e., the number of industries above the designated size, investment in controlling waste gas, and natural gas supply. It is worth noting that the selected input indicator in Table 2 was obtained via the entropy weight method that was proposed in Section 3.1, and the original indicator set for carbon emission-related indicator screening was selected based on the previous studies [1,34,40,47,48].
Regarding the problem stemming from different perspectives on indicator selection, the method of Féres et al. [7] is a good way to solve it. In Féres’ study, formal environmental regulations and informal environmental regulations are classified as two categories of environmental regulation. Additionally, as existing studies on establishing the definition of environmental regulations differ, the results can also vary. Therefore, in this study, cumulative investment in environmental pollution control measures is used to measure formal environmental regulations [46]. Such investment is directly related to environmental protection activities and is used to prevent, reduce, and treat various pollution problems. The tighter the environmental regulations, the more money is spent on pollution management.
As for informal environmental regulation, the method of Pargal et al. [49] is the most representative. They use the entropy weight method to objectively weigh the three indicators of income level, education level, and population density in each province, and use the comprehensive score as the value of informal environmental regulation. Therefore, the per capita disposable income is set as the specific measure of income level, as residents in regions with higher disposable income have a higher demands for their living environments. The number of higher education students is set as the specific measure of education level, as environmental protection receives more attention in areas where people are better educated. For the indicator of population density, city population density is set as the specific measure, as the greater the population density in an area, the more people gather together to participate in environmental protection activities.
According to the research purpose of this paper, carbon emission efficiency and environmental regulations are the most important variables among the regression model. As a result, the regression model in this study used formal and informal environmental regulations as the independent variables and carbon emission efficiency as the dependent variable, as illustrated in Table 3. Additionally, four variables were used as control variables: technical innovation [50], foreign investment [51], gross domestic product (GDP), and industrial structure [52]. The reason these variables were chosen as control variables is explained below. The volume of transactions in the technology market is chosen as a measure of technological innovation, as technological advancement can promote industries to improve their carbon emission capacity, thereby increasing carbon emission efficiency. Regional GDP is used as a measure of gross domestic product, as the amount of carbon emissions brought on by economic growth increases with a region’s GDP. The number of foreign invested enterprises is used as an indicator for foreign investment, as a larger amount of foreign investment is more likely to increase the negative environmental impact on the invested area. For industrial structure, the measure employed is the count of large-scale industrial enterprises, as the more large-scale industrial enterprises a region has, the more energy it consumes in production and life, representing a larger amount of total carbon emission in the area. Table 4 displays the descriptive statistics from the regression model.
4.2. Process Analysis of Carbon Emission Efficiency
The carbon emission efficiency for the period from 2009 to 2019 was determined using the undesirable output model. It is evident from Figure 2 that Yunnan hasthe highest average carbon emission efficiency, reaching 0.9514. Hainan and Guangxi follow closely, with values of 0.8454 and 0.6726, respectively. Ningxia, Tianjin, and Shandong have the lowest average carbon emission efficiency, with respective values of 0.1820, 0.2051, and 0.2305. The average carbon emission efficiency throughout the 30 provinces is only 0.3788. It is worth noting that China has made significant improvements in carbon emission efficiency.
According to the formal environmental regulation and informal environmental regulation, calculated using the method in Section 3, the average value of the two types of environmental regulation can be obtained. As shown in Figure 3, Shandong has the highest value of formal environmental regulation, while Qinghai has the lowest. The intensity of formal environmental regulation in most provinces is maintained in the range of 200–400, which indicates that the intensity of formal environmental regulation is relatively weak. One possible explanation is that many local governments prioritize fast economic growth over environmental protection, resulting in weak environmental regulation for the sake of economic benefit.
Figure 4 displays the average informal environmental regulation for 30 Chinese provinces between 2009 and 2019. Unfortunately, the value of informal environmental regulation varies widely and is uneven in most provinces. Jiangsu, Henan, and Guangdong have significantly higher values for informal environmental regulation, while Ningxia, Inner Mongolia, and Hainan have the lowest values. This can be closely related to the environmental consciousness of the local population. The intensity of informal environmental regulations is higher in the eastern coastal areas than that in Gansu, Qinghai, and Ningxia provinces.
Finally, to better examine the influence of different types of environmental regulation on carbon emission efficiency at the provincial level in China, this study categorized the 30 Chinese provinces using k-means clustering methods. Cluster analysis involves placing the objects to be classified in a multidimensional space and classifying them based on the degree of their spatial relationships. It is an important method for studying geographical classification and zoning problems and is widely used in the study of economic spatial distribution. Using cluster analysis as a basis, the level of economic development, the total value of the secondary industry, carbon emissions, and unit energy consumption level in each province in 2019 were set as the clustering criteria. It is important to note that the k value for the cluster analysis was set at 3 based on expert experience. Based on the cluster analysis, the final clustering distance of each indicator is shown in Figure 5, while Figure 6 illustrates the distribution of the three categories of regions in China.
The first category includes Beijing, Shanghai, Guangdong, Hunan, Heilongjiang, and Hainan provinces. The final clustering distance for the total value of the secondary industry is −1.27923, the final clustering distance for unit energy consumption is −0.5945, the final clustering distance for the level of economic development is −0.52773, and the final clustering distance for carbon emissions is −0.87787.
The second group includes Ningxia, Tianjin, Hebei, Jilin, Qinghai, Guizhou, Inner Mongolia, Shaanxi, Gansu, Shanxi, Liaoning, and Xinjiang. The final clustering distance for the total value of the secondary industry is 0.16837, the final clustering distance for unit energy consumption is 0.88788, the final clustering distance for the level of economic development is −0.44933, and the final clustering distance for carbon emissions is −0.47219.
The third category includes Jiangsu, Jiangxi, Zhejiang, Chongqing, Fujian, Shandong, Sichuan, Anhui, Henan, Hubei, Guangxi, and Yunnan provinces. The final clustering distance for the total value of the secondary industry is 0.47124, the final clustering distance for unit energy consumption is −0.59070, the final clustering distance for the level of economic development is 0.71319, and the final clustering distance for carbon emissions is 0.91113.
5. Results
This section examines the different effects of environmental regulations on carbon emission efficiency for each category and primarily explains the calculation results of the regression model.
5.1. The Impact of Environmental Regulation on Carbon Emission Efficiency
In the current study, fixed-effects regression is applied to the empirical analysis. In fixed-effects regression, a positive correlation coefficient indicates a favorable impact, while a negative correlation coefficient indicates a detrimental impact.
Table 5 presents the coefficient of the impact of formal environmental regulation on carbon emission efficiency, which is −0.000403 and significant at a1% level of confidence. This indicates that carbon emission efficiency decreases by 0.000403% for every 1% increase in formal environmental regulation. Additionally, the primary term’s coefficient is negative, while its quadratic component is positive, as shown in Table 5. Both of these results are highly significant at the 1% level of confidence, indicating a clear nonlinear “U-shaped relationship” between formal environmental regulation and carbon emission efficiency [53]. The main reason for this may be that in the early stages of implementing formal environmental regulation, the increase in external costs may cause a temporary decrease in regional carbon emissions, known as the “retrogression effect” [54]. Decision-makers faced with cost increases due to environmental regulation may not choose to improve emission reduction technology, but rather, tend to invest more in end-of-pipe treatment or clean production inputs, which can decrease carbon emission efficiency [55]. However, as formal environmental regulation becomes progressively stronger, the positive incentive impact will become more apparent during the execution process, transitioning from the “retrogression effect” to the “incentive effect.” After crossing a turning point, the technical innovation compensation of formal environmental regulation will offset the economic efficiency loss caused by cost increases. At the same time, with the continuous strengthening of formal environmental regulation, low-end production and manufacturing industries gradually exit the market, improving market concentration and industry barriers and achieving an overall efficiency improvement in the production industry [56].
The relationship between informal environmental regulation and carbon emission efficiency exhibits an “inverted U-shaped” influence curve [57]. The effect coefficient of informal environmental regulation on carbon emission efficiency is clearly 0.552 at a 10% confidence level, indicating that for every 10% increase in informal environmental regulation, carbon emission efficiency will increase by 0.552%. It is worth noting that the primary term coefficient of informal environmental regulation is positive, while the quadratic component coefficient is negative. The innovative effect of informal environmental regulation on carbon emission efficiency is not significant in this process. The likely explanation is that suitable levels of informal environmental regulation, which effectively promote company innovation and enhance resource allocation efficiency, are favorable for increasing carbon emission efficiency. Based on this process, the compensatory effect of innovation outweighs the cost effect, resulting in improved carbon emission efficiency. However, when informal environmental regulation exceeds a certain threshold, excessive informal environmental regulation leads to the predominance of the cost effect, which not only fails to encourage enterprise innovation but also increases the pressure on enterprise operations, causing a decrease in carbon emission efficiency.
In conclusion, H1a and H2a are verified. As a result, the relationship between formal environmental regulation and carbon emission efficiency follows a “U-shaped” curve, while the correlation between informal environmental regulation and carbon emission efficiency follows an “inverted U-shaped” curve [58]. Additionally, it is demonstrated that formal environmental regulation has a positive incentive impact on carbon emission efficiency, thereby verifying H2a.
5.2. The Classification Impact of Environmental Regulation on Carbon Emission Efficiency
Using the above cluster analysis method, the 30 provinces of China are classified into three groups to explore the differentiated impacts of various types of environmental regulation on carbon emission efficiency.
5.2.1. Empirical Results in the First Area Category
The first category includes six provinces: Beijing, Shanghai, Guangdong, Hunan, Heilongjiang, and Hainan. Beijing and Shanghai are advanced development regions in China’s modernization process, where the secondary sector has been gradually improved and transformed during the development process, and the tertiary industry has already become a pillar of the economy. Guangdong, Hunan, and Heilongjiang account for a higher proportion of the secondary industry in China. In recent years, these provinces have undergone industrial structural transformation as China continuously promotes the concept of sustainable development. Hainan province, on the other hand, has a small number of secondary industries due to its unique geographical location advantage. Therefore, the amount of secondary industry there is relatively low compared to the other areas in the first category.
Table 6 shows that formal environmental regulation has a significant incentive effect on carbon emission efficiency, while the incentive effect of informal environmental regulation is not significant. One potential explanation for this pattern is that the majority of these regions are economically developed areas. During the regional economic development process, low-end and poor-quality production has gradually been eliminated. With local governments further increasing the intensity of formal environmental regulation, the relatively strict formal environmental regulation promotes local industries to develop technological innovation. This innovation helps to alleviate the cost pressure during the industry adjustment process and is sufficient to cover the expenses of technological innovation [59]. However, the presence of informal environmental regulation serves as a catalyst for China’s efforts to enhance carbon emission efficiency. The insufficient public interest in environmental protection issues poses a hindrance to enterprise innovation. At this time, H1b is verified.
Furthermore, the coefficient of the effect of informal environmental regulation on carbon emission efficiency is 4.927, reaching the 1% confidence level. This indicates that for every 1% increase in the intensity of informal environmental regulation, there is a corresponding increase of 4.927% in carbon emission efficiency. However, this study found that the primary term coefficient of informal environmental regulation is positive, while the quadratic component coefficient is negative. This indicates an “inverted U-shaped” relationship between informal environmental regulation and carbon emission efficiency in the first area category [29]. This suggests that increasing carbon emission efficiency is facilitated by informal environmental regulation at the proper intensity. However, when informal environmental regulation exceeds its inflection point of −0.4656, excessively high levels of informal environmental regulation lead to cost-effectiveness dominating, which not only fails to stimulate innovation but also increases the pressure of carbon emissions, causing China’s carbon emission efficiency to decline. In conclusion, hypothesis H2a is verified, while H2b is not verified.
5.2.2. Empirical Results in the Second Area Category
The second category includes twelve provinces: Inner Mongolia, Shanxi, Tianjin, Hebei, Jilin, Guizhou, Shanxi, Gansu, Qinghai, Ningxia, Liaoning, and Xinjiang. The regression model’s findings for the second category are presented in Table 7.
Unfortunately, neither of the two types of environmental regulation in the second category has a significant incentive effect on carbon emission efficiency. One potential reason is the strong drive for development present in these regions. Compared to the first category, these regions mainly cover China’s coal resources and have relatively backward economic development. In the process of industrial development, these regions mostly accept transfer industries from economically developed regions, and the majority of these businesses are heavy industries that produce a lot of pollutants. It is worth noting that under pressure to develop the economy, local governments do not suppress the production and development of these polluting industries. From the perspective of the polluting industries’ development, decision-makers tend to make short-term production investments and reduce carbon emissions by adopting end-of-pipe clean technologies [60]. This has led to cost effects dominating and incentive effects not being stimulated, resulting in H1b and H2b not being verified.
Similar to the first category, the secondary areas also exhibit a non-linear relationship. At a significance level of 1%, the coefficient of informal environmental regulation is significantly positive, while at a significance level of 5%, the quadratic component of informal environmental regulation shows a significantly negative effect. The regression analysis reveals an “inverted U-shaped” curve relationship between informal environmental regulation and carbon emission efficiency [29]. Therefore, H2a is supported.
5.2.3. Empirical Results in the Third Area Category
The third group includes twelve provinces: Jiangsu, Zhejiang, Fujian, Shandong, Anhui, Jiangxi, Henan, Hubei, Guangxi, Chongqing, Sichuan, and Yunnan. Table 8 shows that in the third category, neither type of environmental regulation has a significant incentive impact on carbon emission efficiency, and there is no significant non-linear relationship between environmental regulations and carbon emission efficiency.
Therefore, none of the hypotheses (H1a, H2a, H1b or H2b) are confirmed. This could be attributed to the fact that the regions in the third category are experiencing a phase of rapid industrialization, where there is a continuous increase in the proportion of secondary industries. Economic development is given priority, and the concept of “pollute first, control later” is upheld [61]. Consequently, the incentive effect of environmental regulations on carbon emission efficiency is not evident in the third category.
5.3. Robustness Test
The methods of Féres and Pargal are used to calculate the value of different types of environmental regulation [7,49], which will be utilized to further investigate the correlation between carbon emission efficiency and environmental regulations. However, existing studies have yet to reach a consensus on a unified standard to calculate the value of environmental regulations. As a result, different metrics will yield different impact results. Based on existing studies that replace key explanatory variables [62], the variable “Number of environmental protection cases proposed during the two sessions” will be added as a control variable to calculate the impact [63]. It is worth noting that the data used in the robustness test are the sum of the number of proposals submitted by each province for the National People’s Congress and the Chinese People’s Political Consultative Conference, as recorded in the China Environmental Yearbook and China Environmental Statistics Yearbook from 2009 to 2019. The results are shown in Table 9. Due to length limitations, this section does not show the results of the regression analysis based on classification. Fortunately, the study’s findings are stable, as the robustness test results of this paper do not change after adding new control variables.
6. Research Results and Discussion
The influence mechanism between carbon emission efficiency and both types of environmental regulation is an ongoing topic in academia. With respect to the aforementioned theoretical framework of environmental regulations, the undesirable output model is used to calculate carbon emission efficiency. The entropy weight method is employed to screen input–output indicators and determine variable weights, and the regression model is utilized to analyze the impact of the two distinct environmental regulations on carbon emission efficiency. k-means cluster analysis is used to divide China’s area into three parts. The results are based on data from Chinese sources for the period of 2009–2019. The purpose of this article is to provide more empirical data from China. The findings may be comprehensively summarized as follows.
6.1. Research Results
First, the greatest gap between the highest and lowest values of China’s inter-provincial carbon emission efficiency is observed, and the average carbon emission efficiency in China during the period from 2009 to 2019 is relatively low. While the efficiency of carbon emissions is barely greater than 0.5 in six provinces, the majority of China’s provinces have carbon emission efficiency standards that are less than 0.5. In other words, adjusting the structure of China’s inter-provincial carbon emissions still requires a lot of effort.
Second, formal environmental regulation and informal environmental regulation have different influence mechanisms in China. Formal environmental regulation’s effect on carbon emission efficiency has a “U-shaped” curve, while informal environmental regulation has an “inverted U-shaped” curve. Therefore, blindly enhancing environmental regulations and ignoring the actual situation will not only fail to improve inter-provincial carbon emission efficiency but also affect the manufacturing industry’s development. In comparison to informal environmental regulation, formal environmental regulation demonstrates a more significant incentivizing effect on carbon emission efficiency. This means that if China wants to realize its aims of environmental management and economic growth, China must place greater emphasis on formal environmental regulation.
Third, from the perspective of cluster analysis, China can be segmented into three parts based on clustering conditions. However, among the three area categories, only formal environmental regulation has an incentivizing effect in the first area category. The reason for this is that the incentivizing effect stimulated by formal environmental regulation depends on the resource endowment of various regions. In addition, compared to the results without classification, the nonlinear relationship in the classified results has also changed. Informal environmental regulation is more connected to the nonlinear relationship. The reason for this is that people are paying more attention to environmental pollution. Thus, it is also important that informal environmental regulation works well as an incentive.
6.2. Discussion
In order to improve carbon emission efficiency, it is essential to strengthen the intensity of formal environmental regulation. Differentiated environmental regulations should be formulated according to the development level of each individual region, making it a crucial force for coordinating carbon emission efficiency in China. It is also important to raise awareness of informal environmental regulation among the public. The government should elevate the public’s consciousness of environmental protection and guide all sectors of society to turn environmental needs into an effective driving force for supervising environmental management. Additionally, the government should strengthen and guide information exchange between environmental groups and government departments regarding policy and funds, maximizing the effect of informal environmental regulation.
In the first category, the government needs to strengthen top-level design, enhance the examination and approval system for environment-polluting industries, and reduce unreasonable carbon emission behavior at its source. Simultaneously, it is necessary to maintain the strength of informal environmental regulation, ensuring its incentivizing effect is appropriately exerted without causing adverse consequences. As for the second and third categories, relying solely on formal environmental regulation may not effectively improve carbon emission efficiency. Therefore, it is urgent to establish a formal environmental regulation system, strengthen current regulatory methods, and carefully consider the combination and application of various environmental control measures in a coordinated manner [63]. The innovation of these measures should be fully utilized to enhance carbon emission efficiency. Additionally, it is essential to strengthen the local population’s awareness of environmental protection.
7. Conclusions and Policy Implications
To address the global warming and greenhouse gas emission issues, this paper proposes a classification analysis of the factors influencing carbon emission efficiency under different types of environmental regulation. By integrating the DEA undesirable output model, indicator screening methods, and cluster analysis methods, an empirical study of 30 provinces in China was conducted. This study found that there is a U-shaped relationship between formal environmental regulations and carbon emission efficiency, while there is an inverted U-shaped relationship between informal environmental regulations and carbon emission efficiency. Our research conclusions can provide empirical analysis tools and decision-making reference suggestions for carbon emission governance.
However, there are still many interesting and more important issues that are worth further exploration:
- (1)
- This paper did not involve interval numbers in the study of carbon emission efficiency. In actual carbon emission governance practice, there may be interval-type indicators, such as changes in the concentration of carbon emission pollutants. Although there are relevant research results on interval numbers in efficiency evaluation, research on modeling based on interval values in carbon emission governance is still lacking. Therefore, in future research, it is necessary to focus on interval values in carbon emission governance research and further expand the application scope of carbon emission governance efficiency evaluation.
- (2)
- In the empirical study conducted in this paper, the impact of environmental regulations and other regional factors on carbon emission governance efficiency was analyzed. In fact, there are other decision-making factors involved in carbon emission governance, such as the level of urbanization, regional resource status, and regional environmental regulations and policies. Therefore, in future research, more comprehensive decision-making factors can be introduced into carbon emission governance research to further expand the applicability of carbon emission governance efficiency evaluation models.
- (3)
- Using a case study, this paper mainly conducted a classification study on regional carbon emission governance and did not analyze carbon emission governance among different industries. Future research can expand the study of carbon emission governance to include an analysis of different industries’ pollution control.
In the actual process of carbon emission governance, determining how to achieve the optimal carbon emission governance effect is a problem that must be considered by all provinces in China. Therefore, based on the research conclusions of this paper, the following policy suggestions are proposed:
Firstly, improving the carbon emission governance funding investment system and optimizing regional carbon emission governance resource allocation. According to the government’s environmental pollution control goals, it is necessary to increase investment in carbon emission governance costs to achieve pollution reduction and economic growth. In fact, increasing investment in carbon emission governance costs is not entirely for the purpose of pollution reduction. The key is to establish a sound environmental protection fund regulation system to improve the efficiency of carbon emission governance costs. Whether the improvement of carbon emission issues is significant is closely related to the rational allocation of resources.
Secondly, carbon emission governance should consider the regional economy, pollution carrying capacity, and technological innovation capabilities. The research results of this paper show that there are significant differences in the carbon emission governance status of different regions. Therefore, in regional carbon emission governance, it is necessary to follow the dynamic adjustment of regional economic development and environmental protection and maintain the flexibility of carbon emission governance. At the same time, based on the differences in actual regional conditions, pollution emission standards for carbon emission governance should be tailored.
Thirdly, adopting a diversified combination of regional carbon emission governance policy tools. In the carbon emission governance process, a sound carbon emission governance efficiency evaluation system should be established. According to the established evaluation system, policy tools such as command control, economic incentives, and public participation can be used to improve the carbon emission governance effect. Command control mainly plays the mandatory role of the legal system in carbon emission governance, effectively preventing illegal emission behaviors; economic incentives mainly use market-based economic means to promote energy conservation and emission reduction in enterprises and society.
Author Contributions
Conceptualization, F.Y. and R.Y.; methodology, F.Y. and L.-H.Y.; software, L.-H.Y.; validation, S.H. and H.L.; writing—original draft preparation, F.Y. and R.Y.; writing—review and editing, S.H. and H.L.; visualization, S.H. and H.L. All authors have read and agreed to the published version of the manuscript.
Funding
This research was supported by the National Natural Science Foundation of China (Nos. 72001043 and 72001042), the Natural Science Foundation of Fujian Province of China (Nos. 2022J01178 and 2020J05122), Hong Kong Sustain Tech Foundation, PolyU Project of Strategic Importance (No. P0039723), PolyU AF Competitive Grants (No. P0046075), and PolyU Start-up Fund for RAPs under the Strategic Hiring Scheme (No. P0044542).
Institutional Review Board Statement
Not applicable.
Informed Consent Statement
Informed consent was obtained from all subjects involved in the study.
Data Availability Statement
The data that support the findings of this study are available from the corresponding author upon reasonable request.
Conflicts of Interest
The authors declare no conflict of interest.
References
- Ye, F.F.; Wang, Y.M. The effects of two types of environmental regulations on economic efficiency: An analysis of Chinese industries. Energy Environ. 2019, 30, 898–929. [Google Scholar] [CrossRef]
- Schwirplies, C.; Ziegler, A. Offset carbon emissions or pay a price premium for avoiding them? A cross-country analysis of motives for climate protection activities. Appl. Econ. 2016, 48, 746–758. [Google Scholar] [CrossRef] [Green Version]
- Wurlod, J.D.; Noailly, J. The impact of green innovation on energy intensity: An empirical analysis for 14 industrial sectors in OECD countries. Energy Econ. 2018, 71, 47–61. [Google Scholar] [CrossRef] [Green Version]
- Fan, B.; Li, M. The Effect of Heterogeneous Environmental Regulations on Carbon Emission Efficiency of the Grain Production Industry: Evidence from China’s Inter-Provincial Panel Data. Sustainability 2022, 14, 14492. [Google Scholar] [CrossRef]
- Chen, Q.; Mao, Y.; Morrison, A.M. Impacts of Environmental Regulations on Tourism Carbon Emissions. Int. J. Environ. Res. Public Health 2021, 18, 12850. [Google Scholar] [CrossRef]
- Zhang, J.; Jin, W.; Philbin, S.P.; Lu, Q.C.; Ballesteros-Pérez, P.; Skitmore, M.; Li, H. Impact of environmental regulations on carbon emissions of transportation infrastructure: China’s evidence. Clean. Responsible Consum. 2021, 2, 100010. [Google Scholar] [CrossRef]
- Féres, J.; Reynaud, A. Assessing the impact of formal and informal regulations on environmental and economic performance of Brazilian manufacturing firms. Environ. Resour. Econ. 2012, 52, 65–85. [Google Scholar] [CrossRef]
- Hu, X.; Zhang, X.; Dong, L.; Li, H.; He, Z.; Chen, H. Carbon Emission Factors Identification and Measurement Model Construction for Railway Construction Projects. Int. J. Environ. Res. Public Health 2022, 19, 11379. [Google Scholar] [CrossRef]
- Chen, H.; Yi, J.; Chen, A.; Zhou, G. Application of PVAR model in the study of influencing factors of carbon emissions. Math. Biosci. Eng. 2022, 19, 13227–13251. [Google Scholar] [CrossRef]
- Xie, R.H.; Yuan, Y.J.; Huang, J.J. Different types of environmental regulations and heterogeneous influence on “green” productivity: Evidence from China. Ecol. Econ. 2017, 132, 104–112. [Google Scholar] [CrossRef]
- Cormier, D.; Magnan, M. Investors’ assessment of implicit environmental liabilities: An empirical investigation. J. Account. Public Policy 1997, 16, 215–241. [Google Scholar] [CrossRef]
- Costantini, V.; Crespi, F. Environmental regulation and the export dynamics of energy technologies. Ecol. Econ. 2008, 66, 447–460. [Google Scholar] [CrossRef] [Green Version]
- Han, S.R.; Li, P.; Xiang, J.J.; Luo, X.H.; Chen, C.Y. Does the institutional environment influence corporate social responsibility? Consideration of green investment of enterprises—Evidence from China. Environ. Sci. Pollut. Res. 2020, 29, 12722–12739. [Google Scholar] [CrossRef]
- Zhang, Z.X. Impact of environmental regulation on industrial green efficiency——Based on non-radial SBM model. J. Phys. Conf. Ser. 2021, 1744, 042179. [Google Scholar] [CrossRef]
- Testa, F.; Iraldo, F.; Frey, M. The effect of environmental regulation on firms’ competitive performance: The case of the building & construction sector in some EU regions. J. Environ. Manag. 2011, 92, 2136–2144. [Google Scholar]
- Yuan, B.L.; Xiang, Q.L. Environmental regulation, industrial innovation and green development of Chinese manufacturing: Based on an extended CDM model. J. Clean. Prod. 2018, 176, 895–908. [Google Scholar] [CrossRef]
- Yin, X.M.; Qi, L.Y.; Zhou, J.L. The impact of heterogeneous environmental regulation on high-quality economic development in China: Based on the moderating effect of digital finance. Environ. Sci. Pollut. Res. Int. 2023, 30, 24013–24026. [Google Scholar] [CrossRef] [PubMed]
- Zheng, H. Environmental regulation effect on green total factor productivity in the Yangtze River Economic Belt. J. Environ. Manag. 2023, 325, 116465. [Google Scholar] [CrossRef]
- Shah, W.U.H.; Hao, G.; Yan, H.; Yasmeen, R.; Lu, Y. Energy efficiency evaluation, changing trends and determinants of energy productivity growth across South Asian countries: SBM-DEA and Malmquist approach. Environ. Sci. Pollut. Res. 2023, 30, 19890–19906. [Google Scholar] [CrossRef]
- Charnes, A.; Cooper, W.W.; Rhodes, E. Measuring the efficiency of decision making units. Eur. J. Oper. Res. 1978, 2, 429–444. [Google Scholar] [CrossRef]
- Malmquist, S. Index numbers and indifference surfaces. Trab. Estadıstica 1953, 4, 209–242. [Google Scholar] [CrossRef]
- Fare, R.; Grosskopf, S.; Norris, M.; Zhang, Z. Productivity growth, technical progress, and efficiency change in industrialized countries: Reply. Am. Econ. Rev. 1994, 84, 66–83. [Google Scholar]
- Fare, R.; Grosskopf, S. Productivity and intermediate products: A frontier approach. Econ. Lett. 1996, 50, 65–70. [Google Scholar] [CrossRef]
- Tone, K.; Tsutsui, M. Dynamic DEA: A slacks based measure approach. Omega 2010, 38, 145–156. [Google Scholar] [CrossRef] [Green Version]
- Soltanifar, M.; Sharafi, H. A modified DEA cross efficiency method with negative data and its application in supplier selection. J. Comb. Optim. 2022, 43, 265–296. [Google Scholar] [CrossRef]
- Wang, S.; Wang, H.; Zhang, L.; Dang, J. Provincial Carbon Emissions Efficiency and Its Influencing Factors in China. Sustainability 2019, 11, 2355. [Google Scholar] [CrossRef] [Green Version]
- Cheng, Z.; Li, L.; Liu, J.; Zhang, H. Total-factor carbon emission efficiency of China’s provincial industrial sector and its dynamic evolution. Renew. Sustain. Energy Rev. 2018, 94, 330–339. [Google Scholar] [CrossRef]
- Yan, H.; Li, S. The spatial spillover effect of international steel trade on carbon dioxide emissions. Environ. Sci. Pollut. Res. 2023, 30, 26953–26963. [Google Scholar] [CrossRef]
- Sun, W.; Huang, C. How does urbanization affect carbon emission efficiency? Evidence from China. J. Clean. Prod. 2020, 272, 122828. [Google Scholar] [CrossRef]
- Sinn, H.W. Public policies against global warming: A supply side approach. Int. Tax Public Financ. 2008, 15, 360–394. [Google Scholar] [CrossRef]
- Van der Ploeg, F.; Withagen, C. Is there really a green paradox? J. Environ. Econ. Manag. 2012, 64, 342–363. [Google Scholar] [CrossRef] [Green Version]
- Jiang, P.; Li, M.; Zhao, Y.; Gong, X.; Jin, R.; Zhang, Y.; Liu, L. Does Environmental Regulation Improve Carbon Emission Efficiency? Inspection of Panel Data from Inter-Provincial Provinces in China. Sustainability 2022, 14, 10448. [Google Scholar] [CrossRef]
- Zhang, Y.; Song, Q.; Zhang, Y.; Ran, C. The Impact of FDI on Domestic Carbon Emissions--An Empirical Study: Based on Interprovincial Panel Data. Front. Econ. Manag. 2022, 3, 277–289. [Google Scholar]
- Chen, X.; Chen, Y.E.; Chang, C.P. The effects of environmental regulation and industrial structure on carbon dioxide emission: A non-linear investigation. Environ. Sci. Pollut. Res. 2019, 26, 30252–30267. [Google Scholar] [CrossRef] [PubMed]
- Porter, M.E.; Linde, C.V.D. Toward a new conception of the environment-competitiveness relationship. J. Econ. Perspect. 1995, 9, 97–118. [Google Scholar] [CrossRef] [Green Version]
- Wang, D.; Li, S.; Toktarbek, S.; Jiakula, N.; Ma, P.; Feng, Y. Research on the Coordination between Agricultural Production and Environmental Protection in Kazakhstan Based on the Rationality of the Objective Weighting Method. Sustainability 2022, 14, 3700. [Google Scholar] [CrossRef]
- Färe, R.; Grosskopf, S.; Lovell, C.K.; Pasurka, C. Multilateral productivity comparisons when some outputs are undesirable: A nonparametric approach. Rev. Econ. Stat. 1989, 71, 90–98. [Google Scholar] [CrossRef]
- Song, M.L.; Peng, J.; Wang, J.L.; Dong, L. Better resource management: An improved resource and environmental efficiency evaluation approach that considers undesirable outputs. Resour. Conserv. Recycl. 2018, 128, 197–205. [Google Scholar] [CrossRef]
- Wang, Y.M.; Liu, J.; Elhag, T.M.S. An integrated AHP–DEA methodology for bridge risk assessment. Comput. Ind. Eng. 2008, 54, 513–525. [Google Scholar] [CrossRef]
- Chen, L.; Wang, Y.M.; Lai, F.J. Semi-disposability of undesirable outputs in data envelopment analysis for environmental assessments. Eur. J. Oper. Res. 2017, 260, 655–664. [Google Scholar] [CrossRef]
- Yang, H.; Pollitt, M. The necessity of distinguishing weak and strong disposability among undesirable outputs in DEA: Environmental performance of Chinese coal-fired power plants. Energy Policy 2010, 38, 4440–4444. [Google Scholar]
- Sueyoshi, T.; Goto, M. Weak and strong disposability vs. natural and managerial disposability in DEA environmental assessment: Comparison between Japanese electric power industry and manufacturing industries. Energy Econ. 2012, 34, 686–699. [Google Scholar]
- Adler, N.; Volta, N. Accounting for externalities and disposability: A directional economic environmental distance function. Eur. J. Oper. Res. 2016, 250, 314–327. [Google Scholar] [CrossRef]
- Cook, W.D.; Seiford, L.M. Data envelopment analysis (DEA)–Thirty years on. Eur. J. Oper. Res. 2009, 192, 1–17. [Google Scholar] [CrossRef]
- Song, W.; Han, X. Heterogeneous two-sided effects of different types of environmental regulations on carbon productivity in China. Sci. Total Environ. 2022, 841, 156769. [Google Scholar] [CrossRef] [PubMed]
- Chen, L.; Li, W.; Yuan, K.; Zhang, X. Can informal environmental regulation promote industrial structure upgrading? Evidence from China. Appl. Econ. 2022, 54, 2161–2180. [Google Scholar] [CrossRef]
- Ye, F.F.; Yang, L.H.; Lu, H.T.; Wang, Y.M. A novel data-driven decision model based on extended belief rule base to predict China’s carbon emissions. J. Environ. Manag. 2022, 318, 115547. [Google Scholar] [CrossRef]
- Ye, F.F.; Yang, L.H.; Wang, Y.M.; Chen, L. An environmental pollution management method based on extended belief rule base and data envelopment analysis under interval uncertainty. Comput. Ind. Eng. 2020, 144, 106454. [Google Scholar] [CrossRef]
- Pargal, S.; Wheeler, D. Informal regulation of industrial pollution in developing countries: Evidence from Indonesia. J. Political Econ. 1996, 104, 1314–1327. [Google Scholar] [CrossRef]
- Geng, D.; Wang, L. Relationship between environmental pollution and industrial restructuring: Hubei province in China. Nat. Environ. Pollut. Technol. 2018, 17, 1227–1234. [Google Scholar]
- Yi, S.; Xiao-Li, A. Application of threshold regression analysis to study the impact of regional technological innovation level on sustainable development. Renew. Sustain. Energy Rev. 2018, 89, 27–32. [Google Scholar] [CrossRef]
- Hao, Y.; Wu, Y.; Wu, H.; Ren, S. How do FDI and technical innovation affect environmental quality? Evidence from China. Environ. Sci. Pollut. Res. 2020, 27, 7835–7850. [Google Scholar] [CrossRef] [PubMed]
- Xiong, B.; Wang, R. Effect of environmental regulation on industrial solid waste pollution in China: From the perspective of formal environmental regulation and informal environmental regulation. Int. J. Environ. Res. Public Health 2020, 17, 7798. [Google Scholar] [CrossRef] [PubMed]
- Yin, K.; Liu, L.; Gu, H. Green paradox or forced emission reduction—The dual effects of environmental regulation on carbon emissions. Int. J. Environ. Res. Public Health 2022, 19, 11058. [Google Scholar] [CrossRef]
- Wang, M. Study on the spatial effect of environmental regulation on carbon emission. Ecol. Econ. 2017, 33, 30–33. [Google Scholar]
- Wang, X.; Zhang, C.; Zhang, Z. Pollution haven or porter? The impact of environmental regulation on location choices of pollution-intensive firms in China. J. Environ. Manag. 2019, 248, 109248. [Google Scholar] [CrossRef]
- Borsatto, J.M.; Amui, L.B. Green innovation: Unfolding the relation with environmental regulations and competitiveness. Resources. Conserv. Recycl. 2019, 149, 445–454. [Google Scholar] [CrossRef]
- Zhang, L.; Wang, Q.; Zhang, M. Environmental regulation and CO2 emissions: Based on strategic interaction of environmental governance. Ecol. Complex. 2021, 45, 100893. [Google Scholar] [CrossRef]
- Xie, B.; Yang, C.; Song, W.; Song, L.; Wang, H. The impact of environmental regulation on capacity utilization of China’s manufacturing industry: An empirical research based on the sector level. Ecol. Indic. 2023, 148, 110085. [Google Scholar] [CrossRef]
- Zhang, G.; Deng, N.; Mou, H.; Zhang, Z.G.; Chen, X. The impact of the policy and behavior of public participation on environmental governance performance: Empirical analysis based on provincial panel data in China. Energy Policy 2019, 129, 1347–1354. [Google Scholar] [CrossRef]
- Mou, H.; Atkinson, M.M.; Tapp, S. Do balanced budget laws matter in recessions? Public Budg. Financ. 2018, 38, 28–46. [Google Scholar] [CrossRef]
- Wu, R.; Lin, B. Environmental regulation and its influence on energy-environmental performance: Evidence on the Porter Hypothesis from China’s iron and steel industry. Resour. Conserv. Recycl. 2022, 176, 105954. [Google Scholar] [CrossRef]
- Huang, X.; Tian, P. How does heterogeneous environmental regulation affect net carbon emissions: Spatial and threshold analysis for China. J. Environ. Manag. 2023, 330, 117161. [Google Scholar] [CrossRef] [PubMed]
Figure 1.
Theoretical framework.

Figure 2.
Average value of carbon emission efficiency in 2009–2019.

Figure 3.
Average value of formal environmental regulation in 2009–2019.

Figure 4.
Average value of informal environmental regulation in 2009–2019.
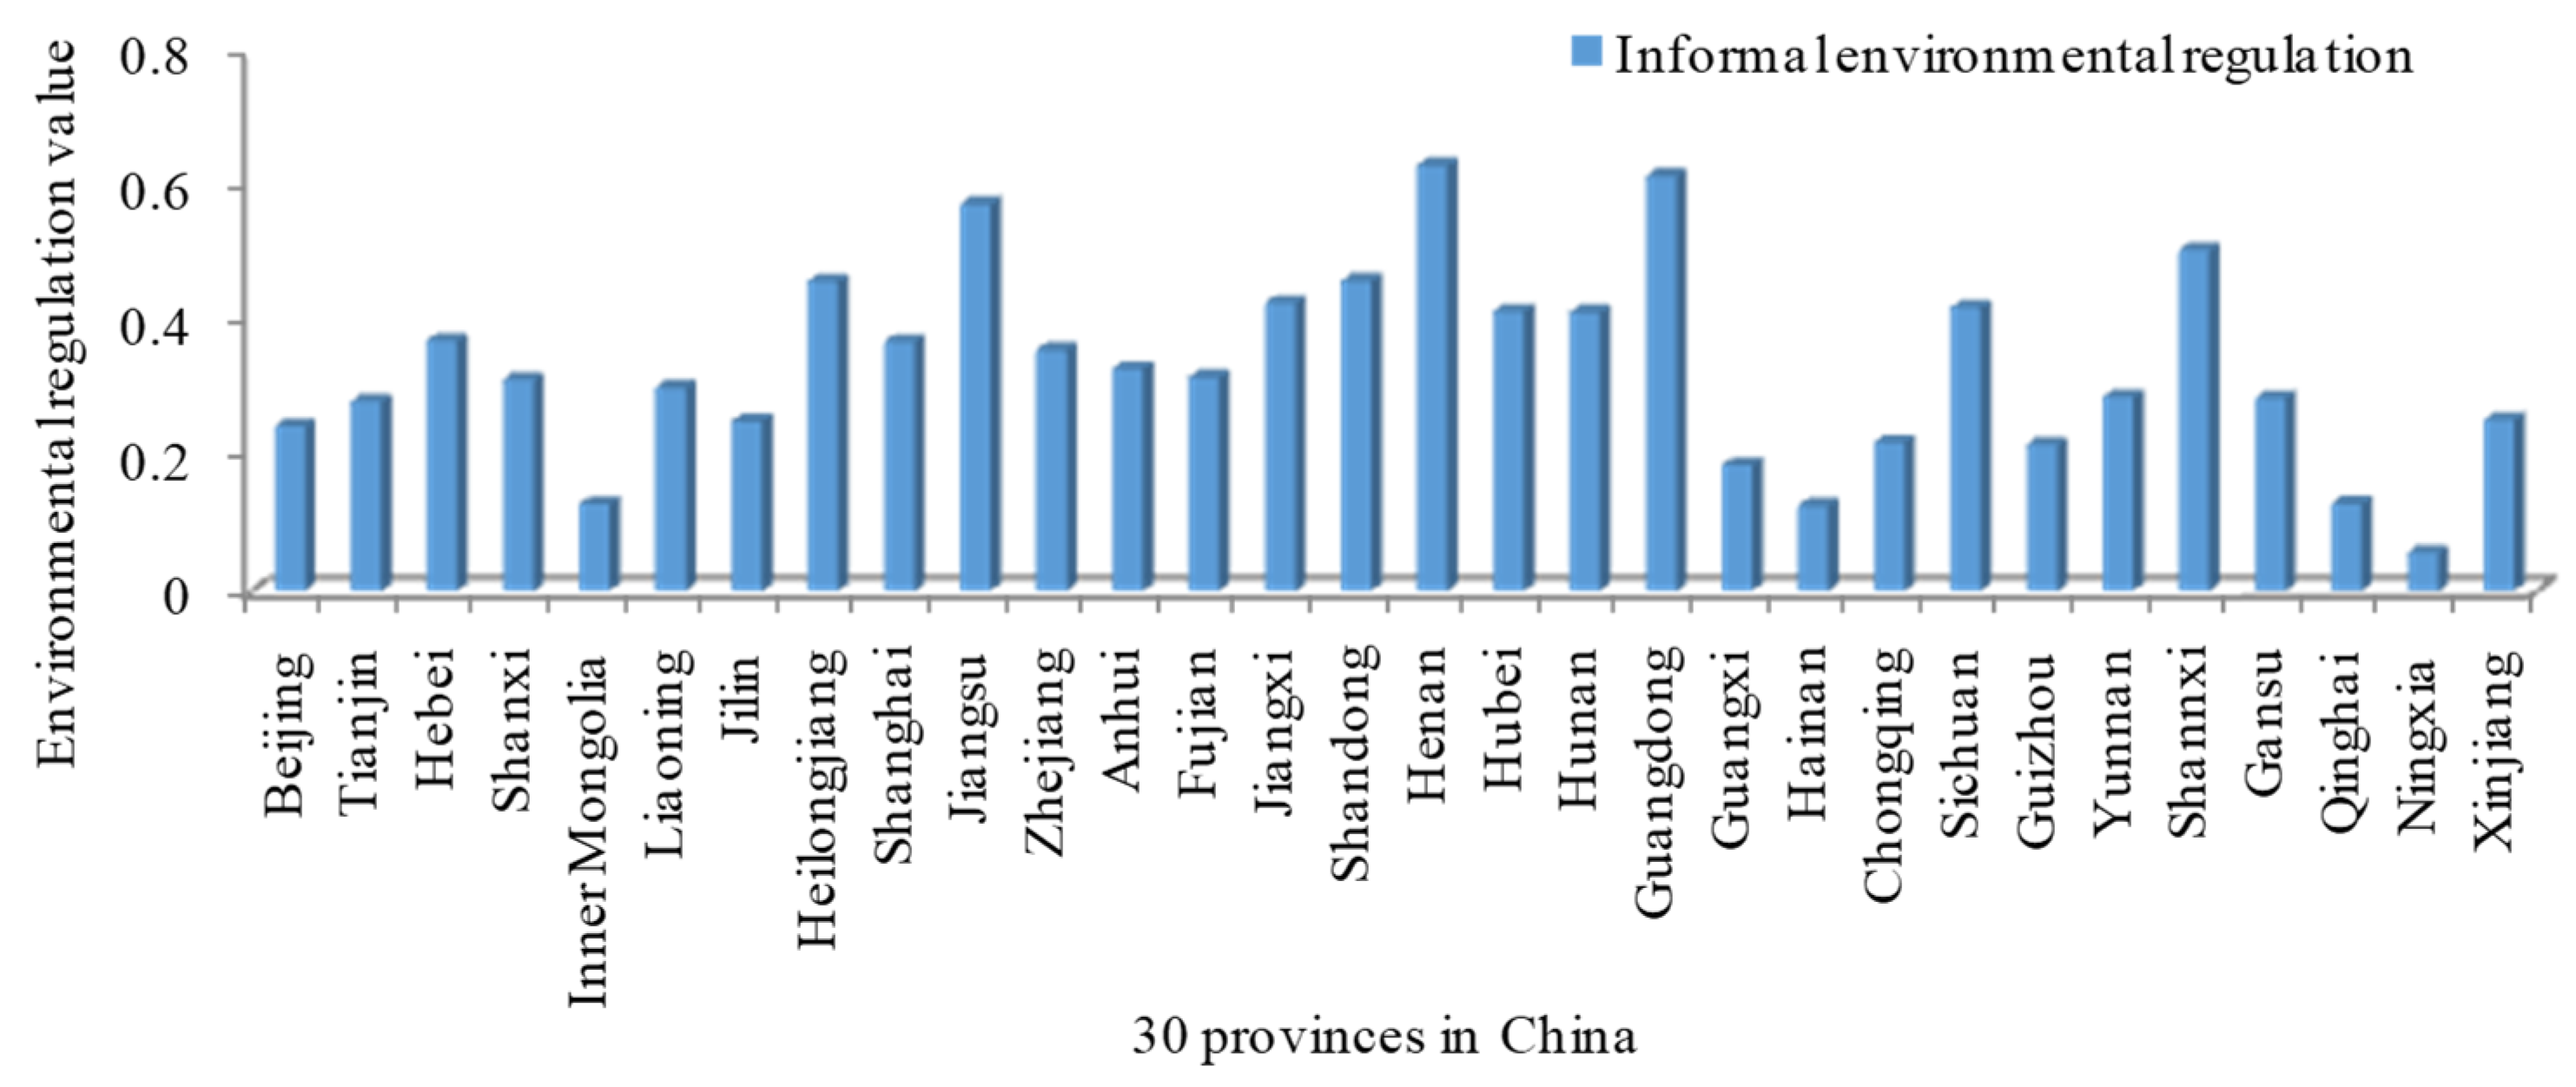
Figure 5.
Clustering distance.
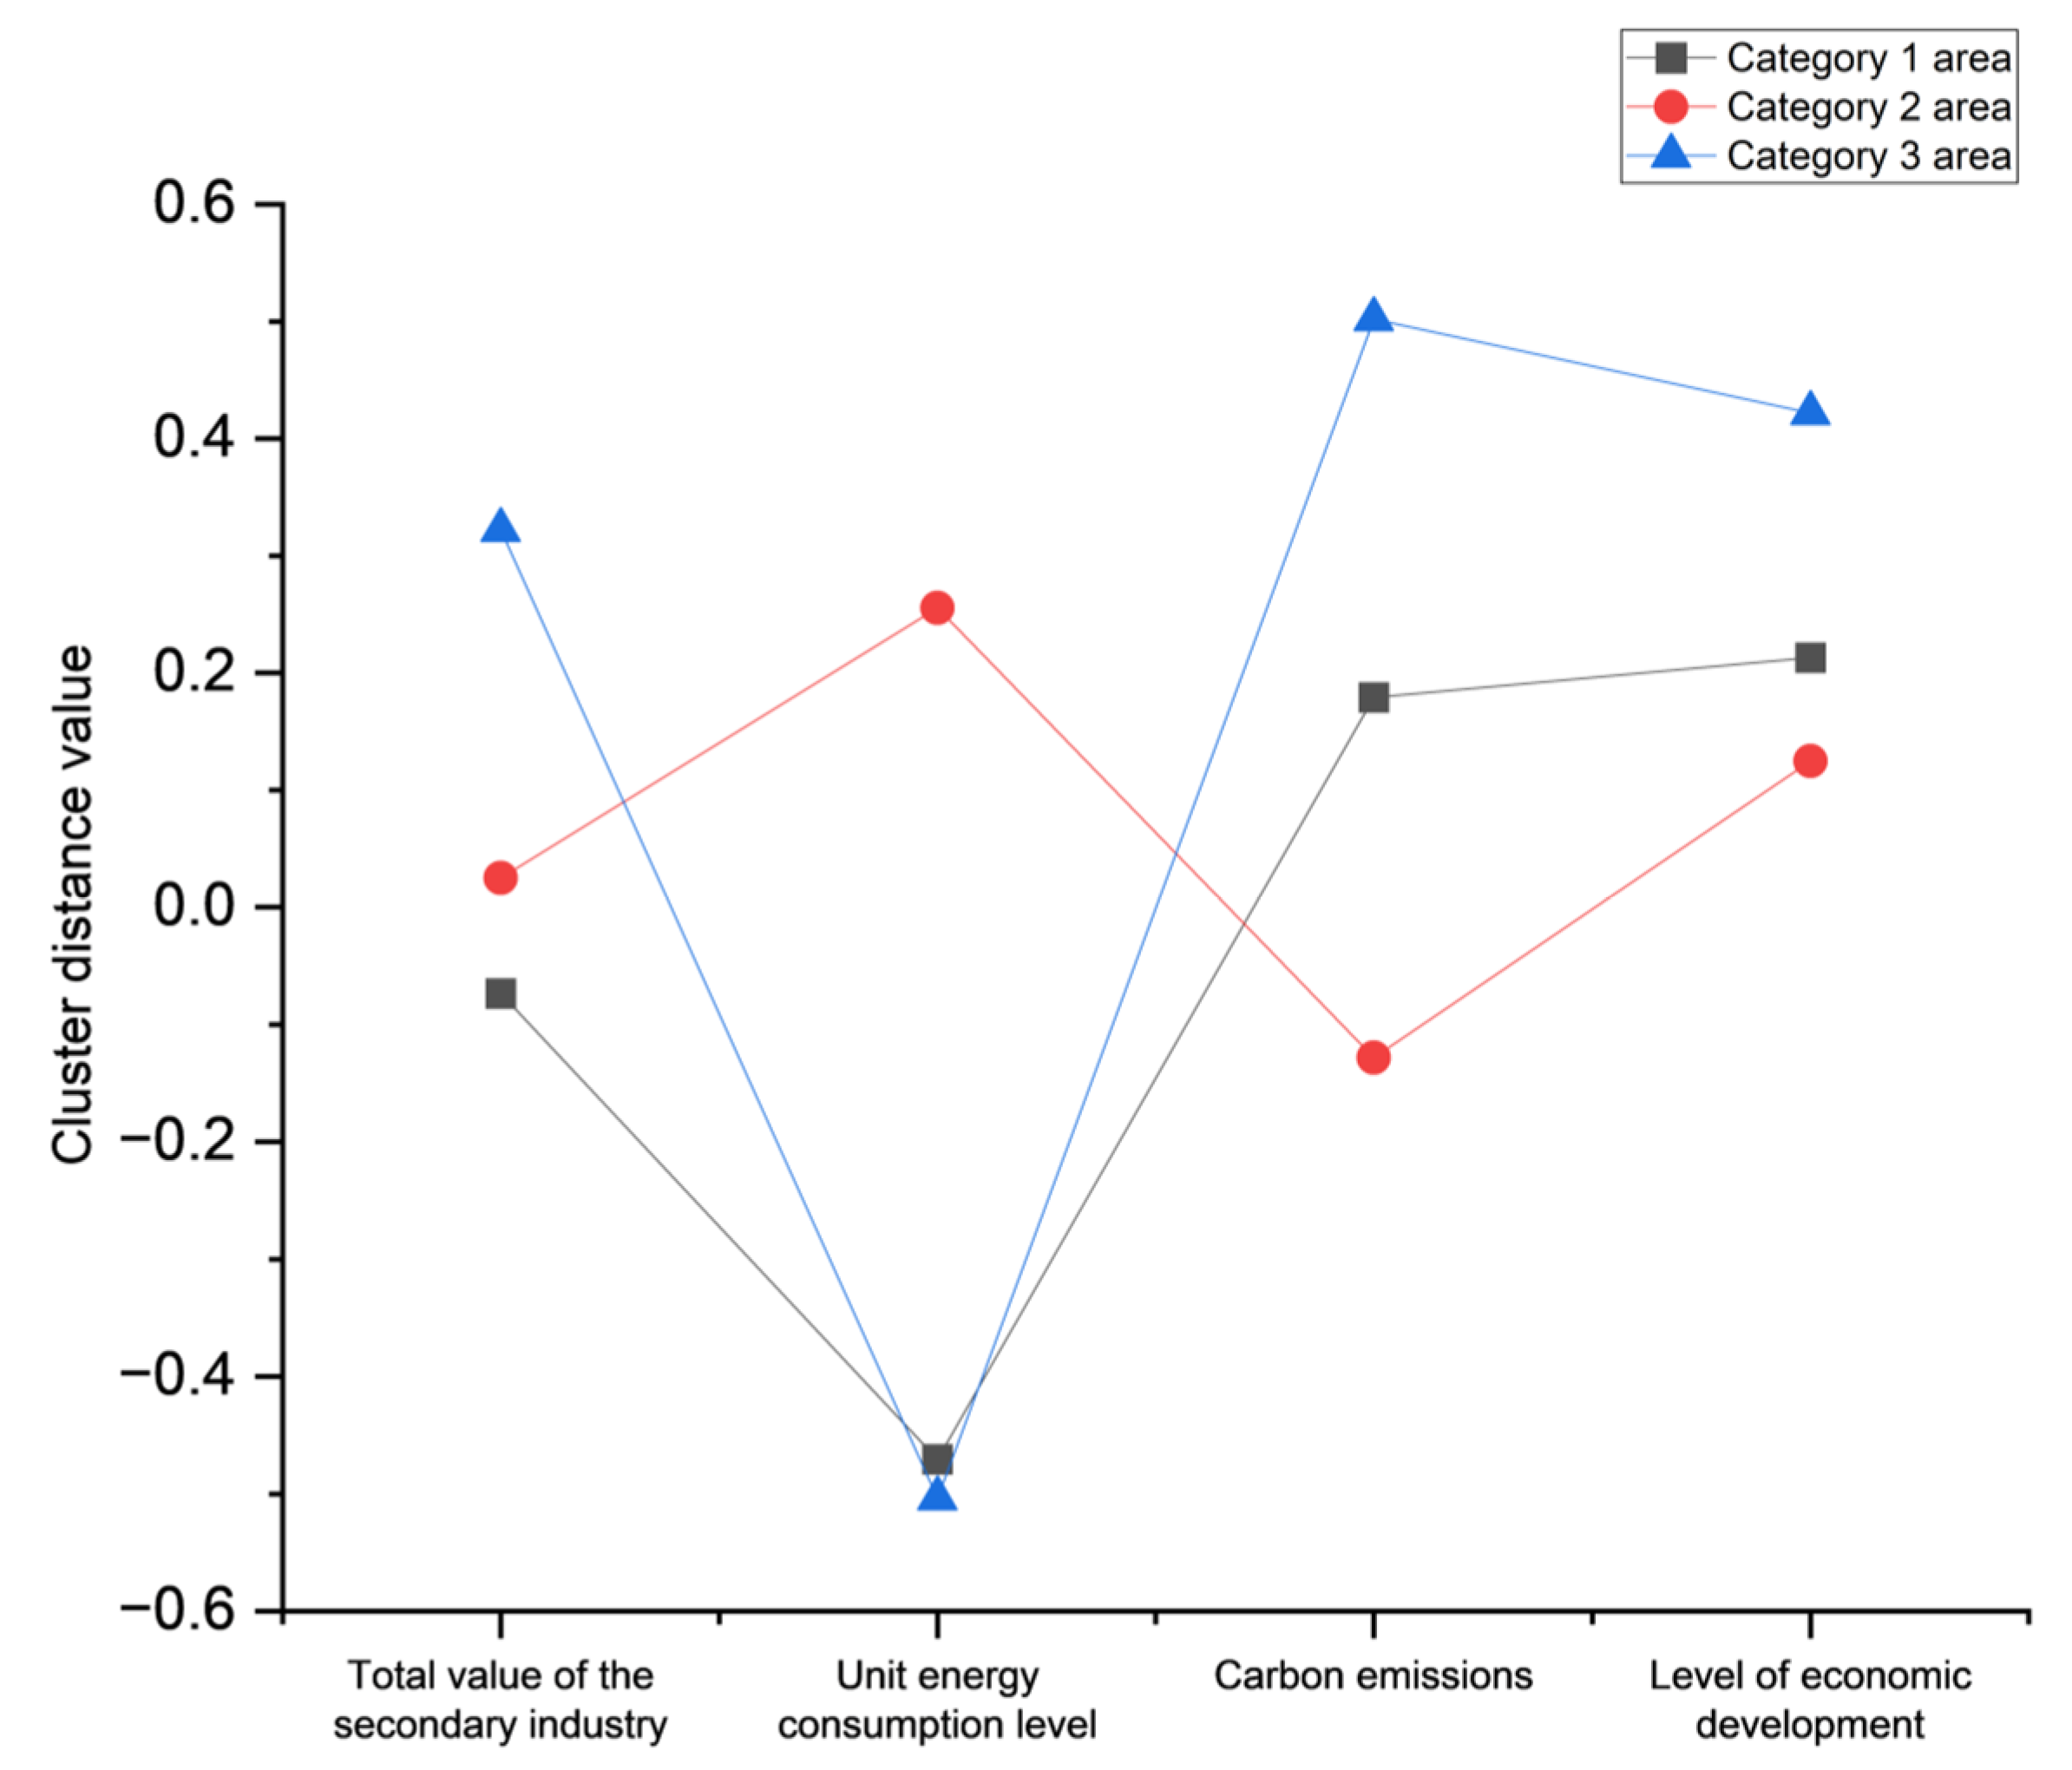
Figure 6.
Regional distribution map.


Table 1.
Descriptive statistics of indicators.
| Indicator | Min | Max | Mean | Std | Unit |
|---|---|---|---|---|---|
| Afforested area | 0.71 | 861.9 | 217 | 175 | 104 square meters |
| Number of industries above designated size | 335 | 64,364 | 12,708 | 13,969 | A unit |
| Natural gas supply | 0.01 | 288 | 36 | 42 | 104 ton |
| Coal consumption | 182.8 | 51,331 | 14,122 | 10,657 | 104 ton |
| Resident population | 557 | 12,489 | 4559 | 2795 | 104 people |
| Electricity consumption | 133.77 | 6696 | 1835 | 1341 | 108 ton |
| Investment in pollution control | 337 | 1,416,464 | 199,215 | 204,751 | 104 yuan |
| Investment in controlling waste gas | 140 | 1,281,351 | 128,960 | 157,174 | 104 yuan |
| Expenditure on environmental protection | 13.36 | 747 | 130 | 93 | 108 yuan |
Table 2.
Descriptive statistics of carbon emission efficiency indicators.
| Classification | Carbon Emission Efficiency Indicators | Max | Min | Mean | Std | Unit |
|---|---|---|---|---|---|---|
| Input indicators | Number of industries above designated size | 64,354 | 335 | 12,708 | 13,969 | A unit |
| Investment in controlling waste gas | 1,281,351 | 140 | 130,566 | 156,172 | 104 yuan | |
| Natural gas supply | 288.06 | 0.01 | 36 | 42 | 104 ton | |
| Output indicators | Gross domestic product | 107,986.9 | 937.7 | 21,841 | 18,741 | 108 yuan |
| Carbon emissions | 937.11 | 27 | 316 | 203 | 104 ton |
Table 3.
Definition of dependent and independent indicators in regression model.
| Variable | Calculation Process |
|---|---|
| Dependent variable | Carbon emission efficiency |
| Independent variables | Formal environmental regulation Informal environmental regulation |
| Control variables | Technical innovation |
| Foreign investment | |
| Gross domestic product | |
| Industrial structure |
Table 4.
Statistical analysis of indicators in regression model.
| Variable | Min | Max | Mean | Std. Dev |
|---|---|---|---|---|
| Carbon emission efficiency | 0.10 | 1.00 | 0.38 | 0.20 |
| Formal environmental regulation | 12.30 | 1416.20 | 267.65 | 204.09 |
| Informal environmental regulation | 0.01 | 0.86 | 0.33 | 0.15 |
| Foreign investment | 347.00 | 179,268.00 | 16,410.62 | 25,555.71 |
| Technical innovation | 0.56 | 5695.28 | 315.43 | 676.62 |
| Industrial structure | 335.00 | 64,364.00 | 12,708.99 | 13,969.59 |
| Gross domestic product | 939.70 | 107,986.90 | 21,841.24 | 18,741.34 |
Table 5.
Results of the impact of environmental regulation on carbon emission efficiency.
| Variable | Carbon Emission Efficiency (1) | Carbon Emission Efficiency (2) |
|---|---|---|
| Formal environmental regulation | −0.000403 *** | |
| (0.000114) | ||
| Formal environmental regulation2 | 4.39 ×10⁻⁷ *** | |
| (1.00 × 10⁻⁷) | ||
| Informal environmental regulation | 0.552 * | |
| (0.316) | ||
| Informal environmental regulation2 | −0.722 * | |
| (0.419) | ||
| Foreign investment | −2.14 × 10⁻⁶ * | −4.51 × 10⁻⁷ |
| (1.10 × 10⁻⁶) | (1.53 × 10⁻⁶) | |
| Technical innovation | 0.000221 *** | 0.000140 ** |
| (4.69 × 10⁻⁵) | (5.58 × 10⁻⁵) | |
| Industrial structure | 2.62 × 10⁻⁶ | 3.38 × 10⁻⁶ * |
| (1.92 × 10⁻⁶) | (1.99 × 10⁻⁶) | |
| GDP | −3.42 × 10⁻⁸ | −1.23 × 10⁻⁸ |
| (3.57 × 10⁻⁷) | (3.71 × 10⁻⁷) | |
| Cross-linked items of environmental regulation and technological innovation | −1.47 × 10⁻⁷ ** | −5.46 × 10⁻⁵ |
| (6.70 × 10⁻⁸) | (0.000153) | |
| Consistency | 0.389 *** | 0.219 *** |
| (0.0338) | (0.0714) | |
| R2 | 0.179 | 0.134 |
| Region | 30 | 30 |
Note: ***, **, and * denote statistical significance at 1%, 5%, and 10% levels, respectively. The square term of environmental regulations is used to illustrate whether there is a U-shaped relationship between different types of environmental regulations and carbon emission efficiency. Carbon emission efficiency (1) measures the relationship between formal environmental regulation and carbon emission efficiency, while carbon emission efficiency (2) measures the relationship between informal environmental regulation and carbon emission efficiency.
Table 6.
Results of the regression model in the first area category.
| Variable | Carbon Emission Efficiency (1) | Carbon Emission Efficiency (2) |
|---|---|---|
| Formal environmental regulation | −0.000328 | - |
| (0.000324) | - | |
| Formal environmental regulation2 | 4.07 × 10⁻⁷ * | - |
| (2.10 × 10⁻⁷) | - | |
| Informal environmental regulation | - | 4.927 *** |
| - | (1.290) | |
| Informal environmental regulation2 | - | −5.290 *** |
| - | (1.404) | |
| Foreign investment | −3.32 × 10⁻⁶ ** | 5.21 × 10⁻⁶ * |
| (1.54 × 10⁻⁶) | (2.78 × 10⁻⁶) | |
| Technical innovation | 0.000317 *** | 0.000124 |
| (8.73 × 10⁻⁵) | (0.000104) | |
| Industrial structure | 6.62 × 10⁻⁶ | 2.60 × 10⁻⁵ *** |
| (5.52 × 10⁻⁶) | (5.72 × 10⁻⁶) | |
| GDP | −4.25 × 10⁻⁷ | −1.17 × 10⁻⁸ |
| (8.14 × 10⁻⁷) | (7.88 × 10⁻⁷) | |
| Cross-linked items of environmental regulation and technological innovation | −2.57 × 10⁻⁷ ** | −0.000124 |
| (1.16 × 10⁻⁷) | (0.000326) | |
| Consistency | 0.391 *** | −1.082 *** |
| (0.0906) | (0.314) | |
| R2 | 0.457 | 0.533 |
| Region | 6 | 6 |
Note: ***, **, and * denote statistical significance at 1%, 5%, and 10% levels, respectively. The square term of environmental regulations is used to illustrate whether there is a U-shaped relationship between different types of environmental regulations and carbon emission efficiency. Carbon emission efficiency (1) measures the relationship between formal environmental regulation and carbon emission efficiency, while carbon emission efficiency (2) measures the relationship between informal environmental regulation and carbon emission efficiency.
Table 7.
Results of the regression model in the second area category.
| Variable | Carbon Emission Efficiency (1) | Carbon Emission Efficiency (2) |
|---|---|---|
| Formal environmental regulation | −0.000315 | |
| (0.000254) | ||
| Formal environmental regulation2 | 6.54 × 10⁻⁷ ** | |
| (3.27 × 10⁻⁷) | ||
| Informal environmental regulation | 1.363 *** | |
| (0.520) | ||
| Informal environmental regulation2 | −2.061 ** | |
| (0.954) | ||
| Foreign investment | −2.60 × 10⁻⁷ | 5.46 × 10⁻⁶ |
| (1.30 × 10⁻⁵) | (1.25 × 10⁻⁵) | |
| Technical innovation | 0.000222 ** | 0.000136 |
| (9.28 × 10⁻⁵) | (0.000208) | |
| Industrial structure | −6.00 × 10⁻⁶ | −6.44 × 10⁻⁶ |
| (4.30 × 10⁻⁶) | (4.17 × 10⁻⁶) | |
| GDP | −1.42 × 10⁻⁷ | −3.13 × 10⁻⁷ |
| (4.34 × 10⁻⁷) | (4.34 × 10⁻⁷) | |
| Cross-linked items of environmental regulation and technological innovation | −5.64 × 10⁻⁷ | −5.86 × 10⁻⁵ |
| (3.65 × 10−07) | (0.000438) | |
| Consistency | 0.342 *** | 0.112 |
| (0.0722) | (0.0906) | |
| R2 | 0.146 | 0.150 |
| Region | 12 | 12 |
Note: ***and **denote statistical significance at 1% and 5% levels, respectively. The square term of environmental regulations is used to illustrate whether there is a U-shaped relationship between different types of environmental regulations and carbon emission efficiency. Carbon emission efficiency (1) measures the relationship between formal environmental regulation and carbon emission efficiency, while Carbon emission efficiency (2) measures the relationship between informal environmental regulation and carbon emission efficiency.
Table 8.
Results of the regression model in the third area category.
| Variable | Carbon Emission Efficiency (1) | Carbon Emission Efficiency (2) |
|---|---|---|
| Formal environmental regulation | −0.000540 ** | - |
| (0.000266) | - | |
| Formal environmental regulation2 | 4.36 × 10⁻⁷ | - |
| (3.00 × 10⁻⁷) | - | |
| Informal environmental regulation | - | −0.730 |
| - | (0.636) | |
| Informal environmental regulation2 | - | 0.619 |
| - | (0.729) | |
| Foreign investment | −6.99 × 10⁻⁷ | 2.32 × 10⁻⁶ |
| (6.22× 10⁻⁶) | (6.32 × 10⁻⁶) | |
| Technical innovation | 0.000241 | 0.000269 |
| (0.000153) | (0.000285) | |
| Industrial structure | 3.03 × 10⁻⁶ | 3.07 × 10⁻⁶ |
| (2.86 × 10⁻⁶) | (2.84 × 10⁻⁶) | |
| GDP | 3.05 × 10⁻⁷ | 2.92 × 10⁻⁷ |
| (7.15 × 10⁻⁷) | (7.51 × 10⁻⁷) | |
| Cross-linked items of environmental regulation and technological innovation | −1.88 × 10⁻⁷ | −0.000267 |
| (2.92 × 10⁻⁷) | (0.000510) | |
| Consistency | 0.435 *** | 0.450 *** |
| (0.128) | (0.154) | |
| R2 | 0.093 | 0.066 |
| Region | 12 | 12 |
Note: *** and ** denote statistical significance at 1% and 5% levels, respectively. The square term of environmental regulations is used to illustrate whether there is a U-shaped relationship between different types of environmental regulations and carbon emission efficiency. Carbon emission efficiency (1) measures the relationship between formal environmental regulation and carbon emission efficiency, while carbon emission efficiency (2) measures the relationship between informal environmental regulation and carbon emission efficiency.
Table 9.
Robustness test.
| Variable | Carbon Emission Efficiency | ||
|---|---|---|---|
| Regression | Robustness Test | ||
| All regions | Formal environmental regulation | −0.000403 *** | −0.000392 *** |
| Informal environmental regulation | 0.552 * | 0.561 * | |
| Informal environmental regulation2 | 4.39 × 10⁻⁷ *** | 4.34 × 10⁻⁷ *** | |
| Informal environmental regulation2 | −0.722 * | −0.700 * | |
| Cross-linked items of formal environmental regulation and technological innovation | −1.47 × 10⁻⁷ ** | −1.49 × 10⁻⁷ ** | |
| Cross-linked items of informal environmental regulation and technological innovation | −5.46 × 10⁻⁵ | −6.74 × 10⁻⁵ | |
Note: ***, **, and * denote statistical significance at 1%, 5%, and 10% levels, respectively. The square term of environmental regulations is used to illustrate whether there is a U-shaped relationship between different types of environmental regulations and carbon emission efficiency. Carbon emission efficiency measures the relationship between two types of environmental regulation and carbon emission efficiency.
Disclaimer/Publisher’s Note: The statements, opinions and data contained in all publications are solely those of the individual author(s) and contributor(s) and not of MDPI and/or the editor(s). MDPI and/or the editor(s) disclaim responsibility for any injury to people or property resulting from any ideas, methods, instructions or products referred to in the content. |
© 2023 by the authors. Licensee MDPI, Basel, Switzerland. This article is an open access article distributed under the terms and conditions of the Creative Commons Attribution (CC BY) license (https://creativecommons.org/licenses/by/4.0/).
Share and Cite
MDPI and ACS Style
Ye, F.; You, R.; Lu, H.; Han, S.; Yang, L.-H. The Classification Impact of Different Types of Environmental Regulation on Chinese Provincial Carbon Emission Efficiency. Sustainability 2023, 15, 12092. https://doi.org/10.3390/su151512092
AMA Style
Ye F, You R, Lu H, Han S, Yang L-H. The Classification Impact of Different Types of Environmental Regulation on Chinese Provincial Carbon Emission Efficiency. Sustainability. 2023; 15(15):12092. https://doi.org/10.3390/su151512092
Chicago/Turabian StyleYe, Feifei, Rongyan You, Haitian Lu, Sirui Han, and Long-Hao Yang. 2023. "The Classification Impact of Different Types of Environmental Regulation on Chinese Provincial Carbon Emission Efficiency" Sustainability 15, no. 15: 12092. https://doi.org/10.3390/su151512092
Note that from the first issue of 2016, this journal uses article numbers instead of page numbers. See further details here.