
Modeling the Impacts of Soil Management on Avoided Deforestation and REDD+ Payments in the Brazilian Amazon: A Systems Approach
 , , ,
, , ,
Abstract
:1. Introduction
2. Methods
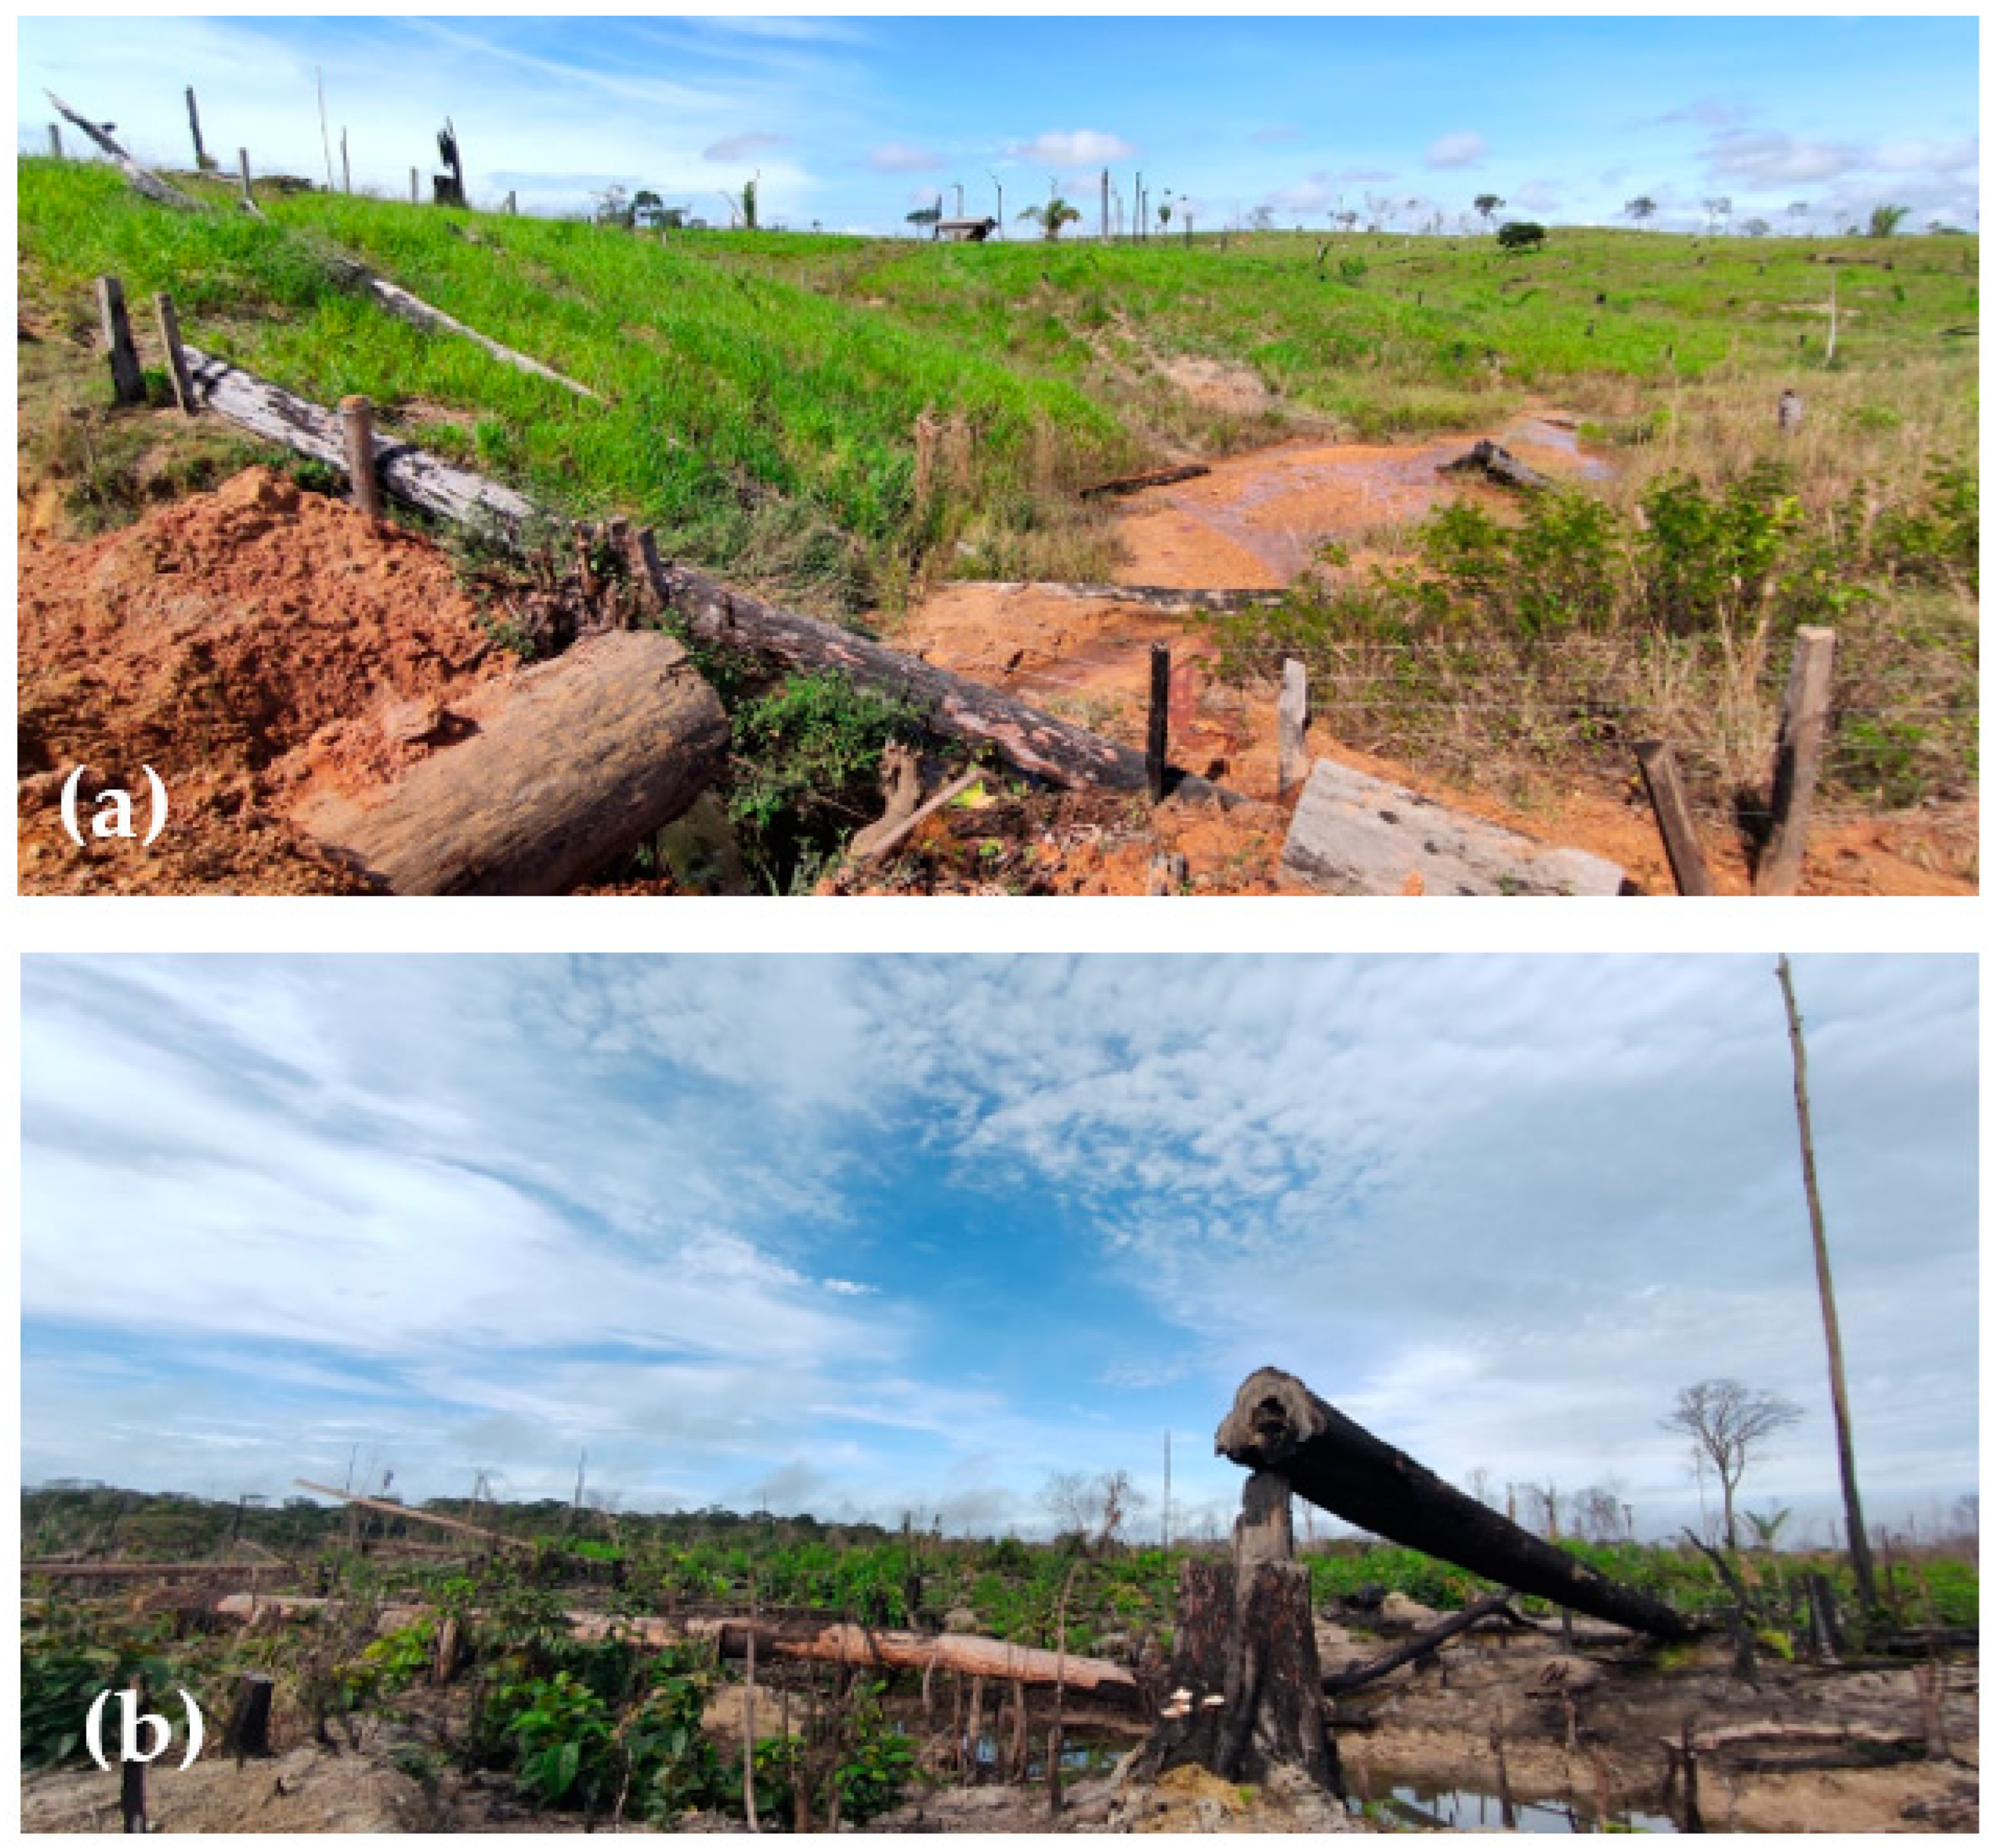
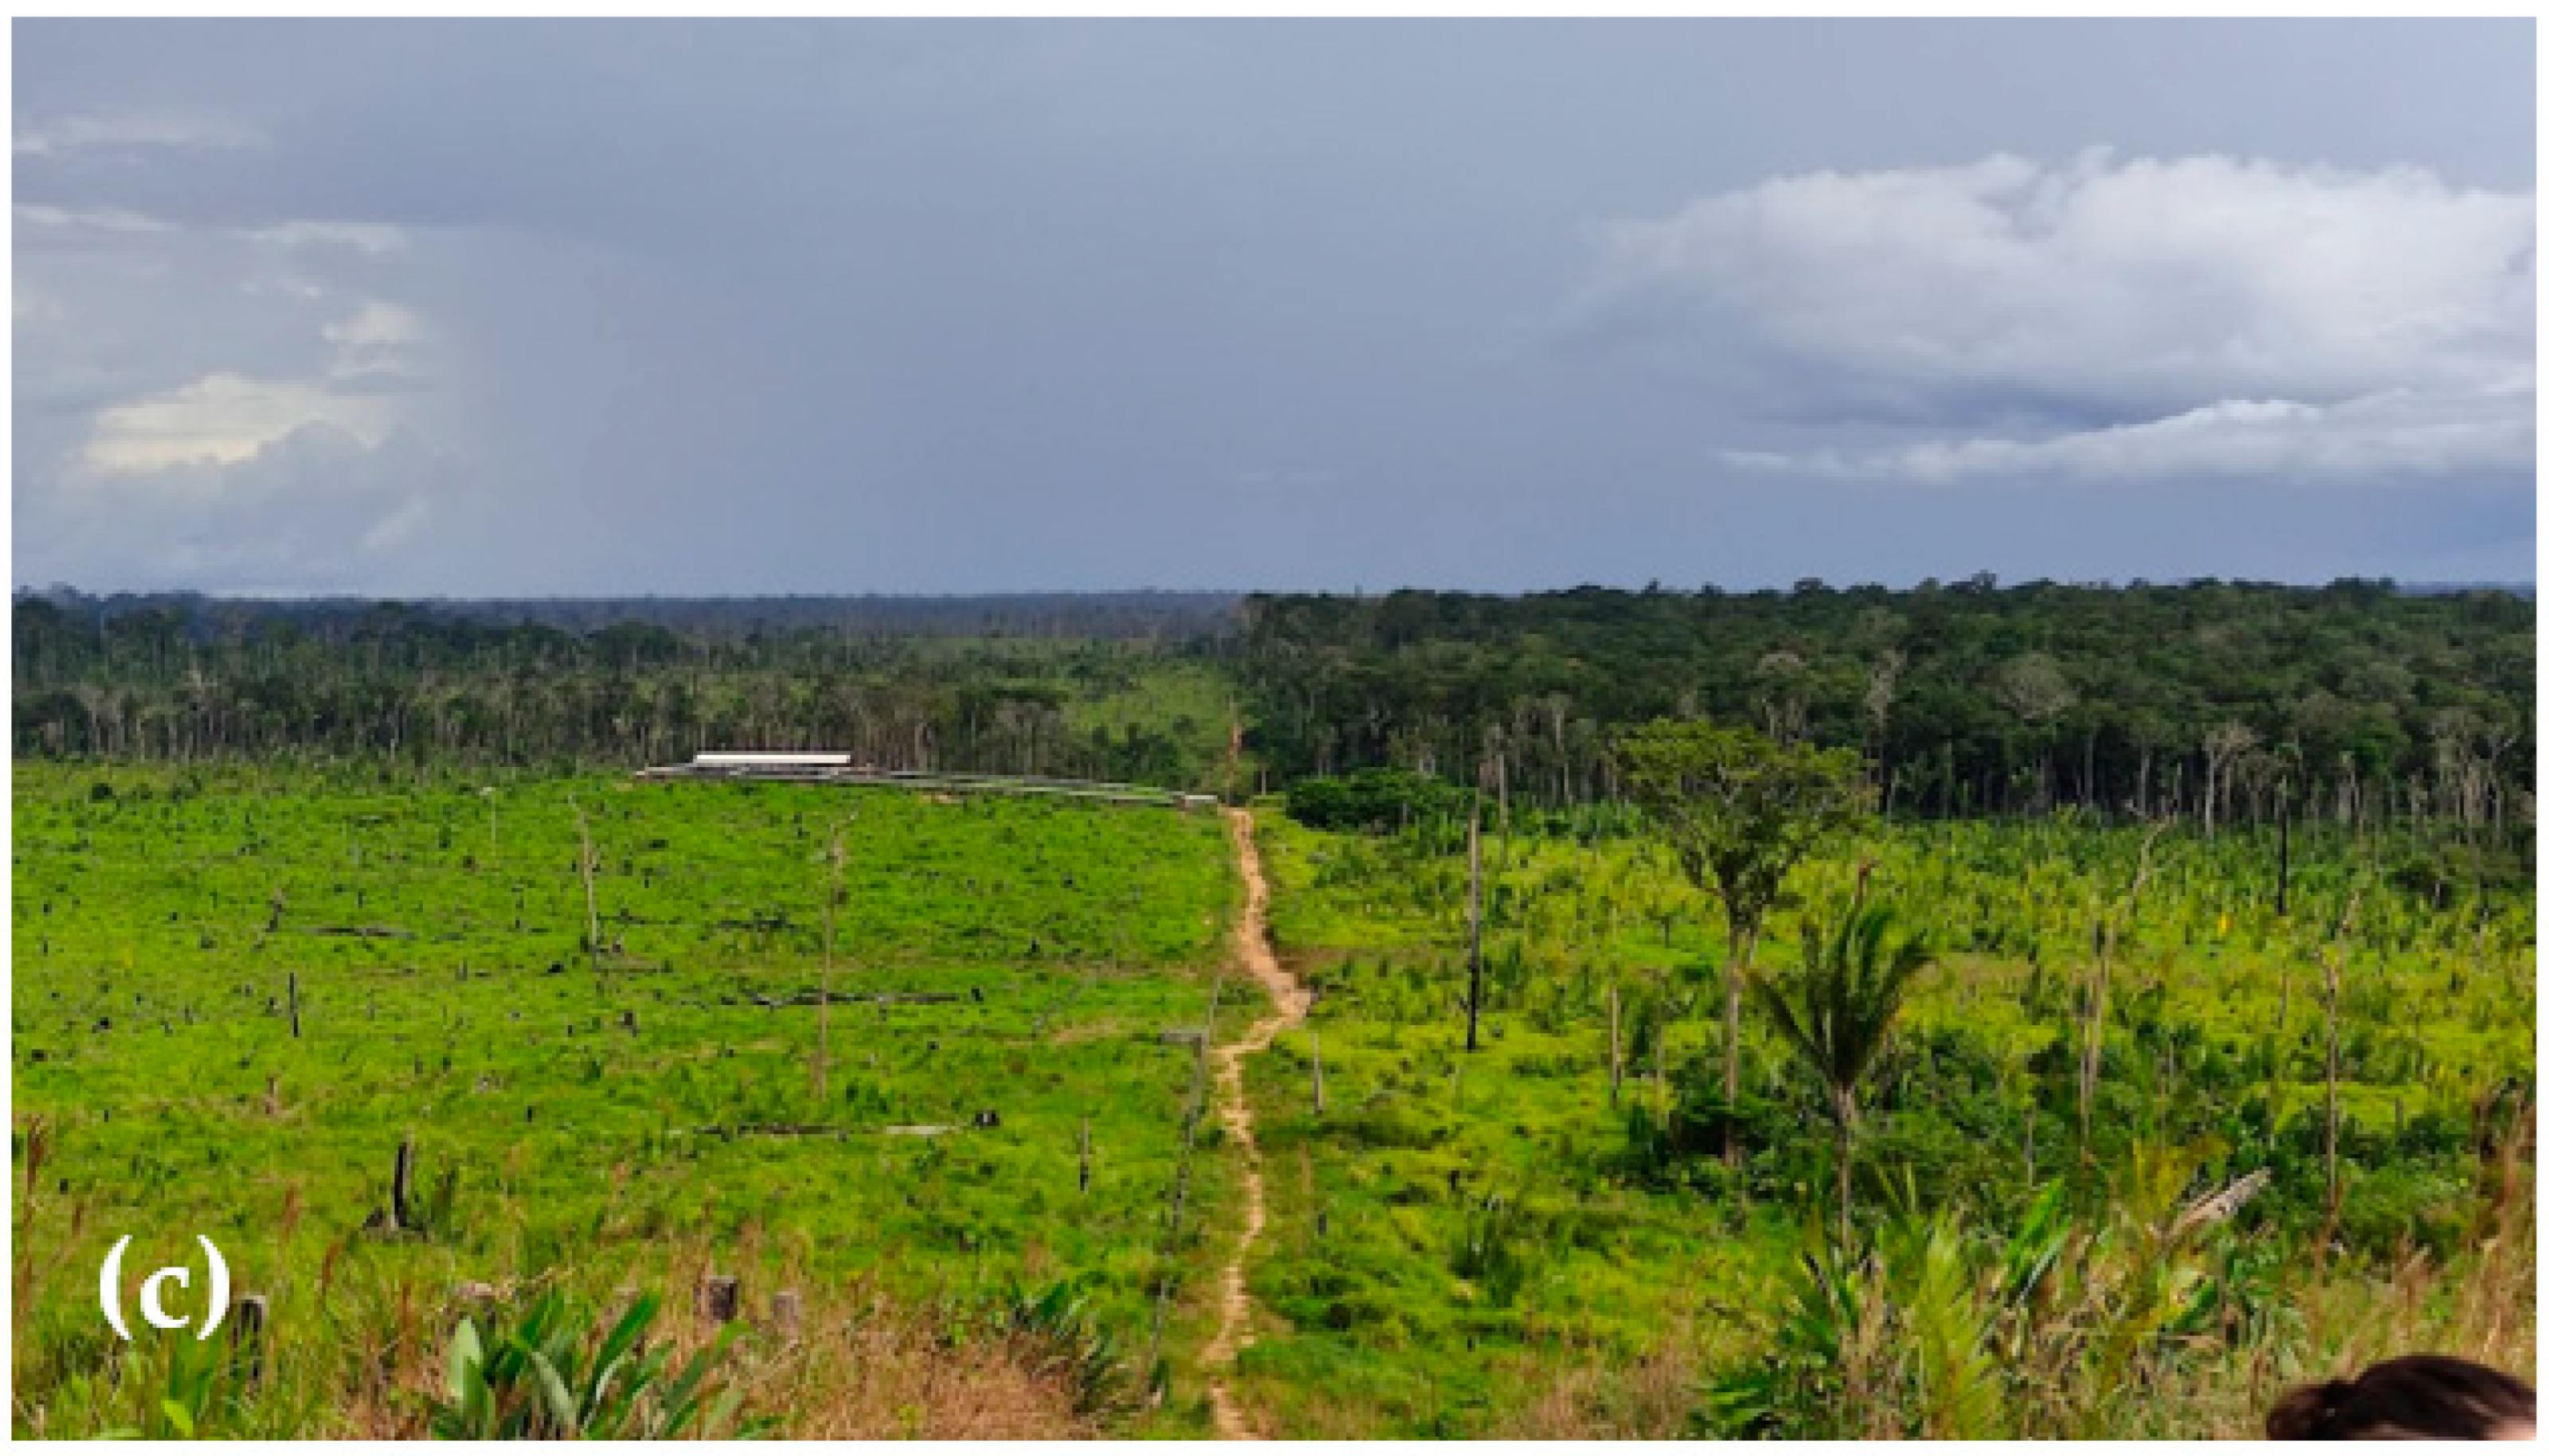
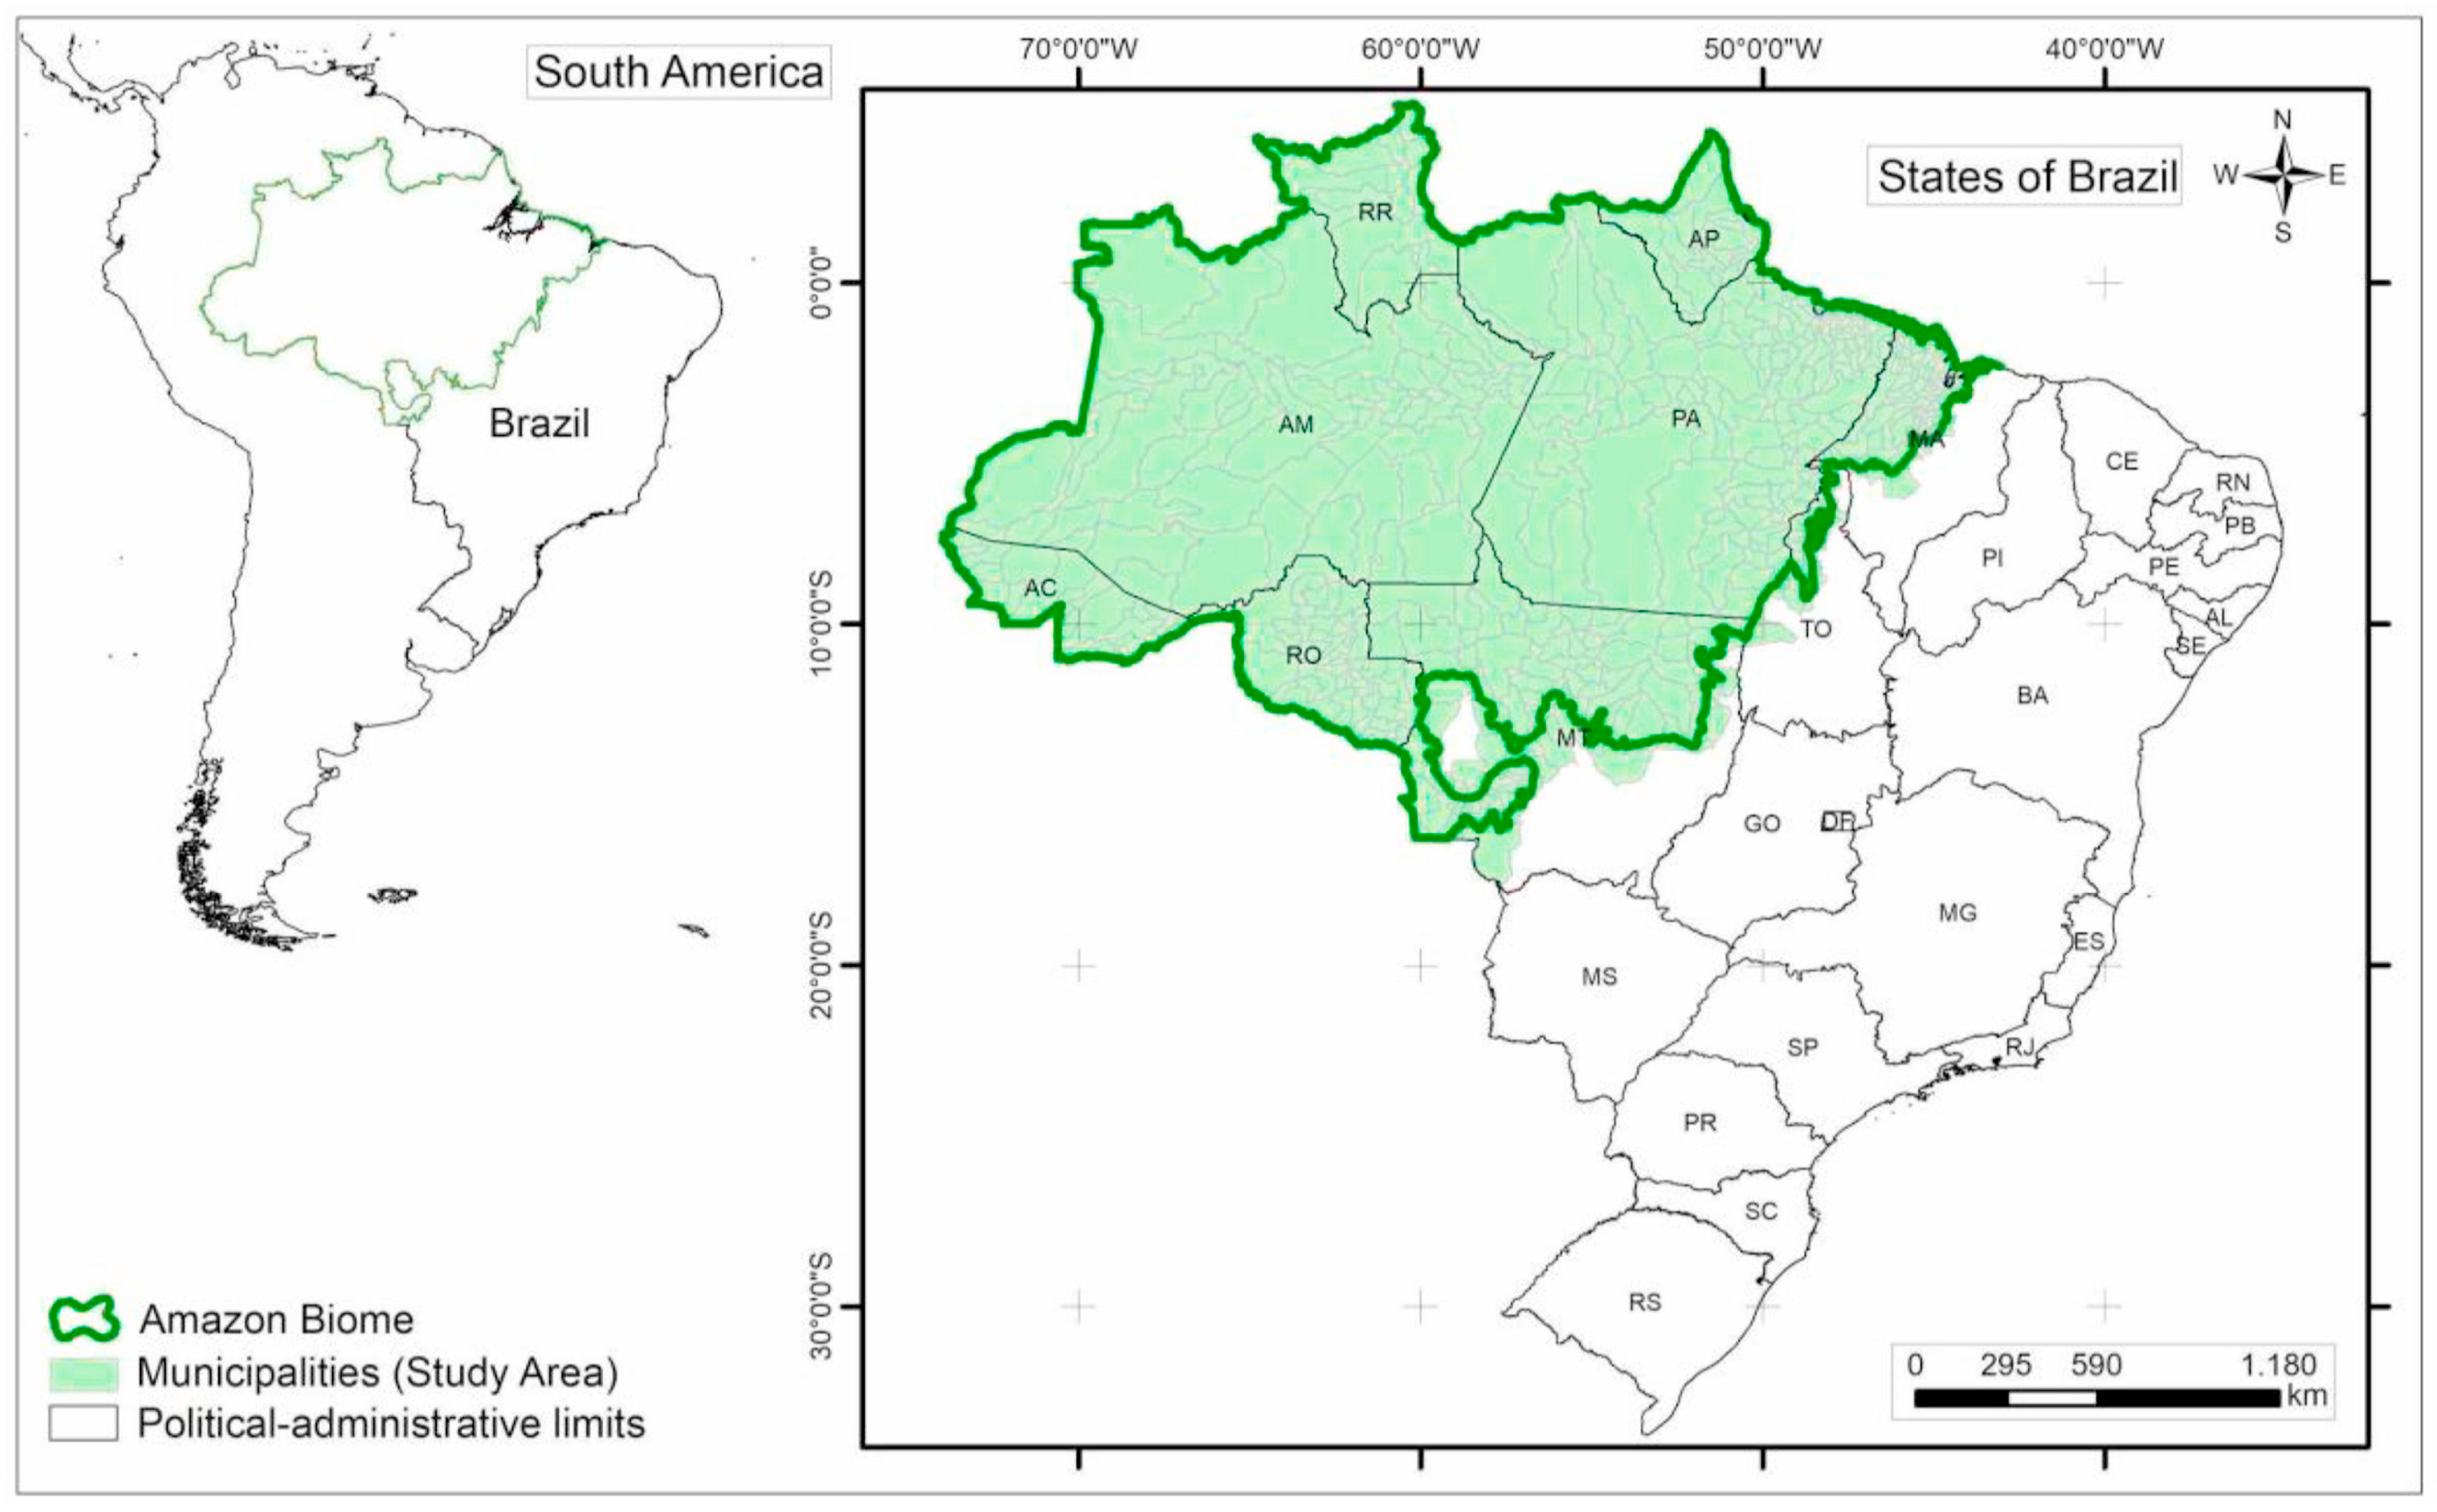
2.1. Study Area
2.2. Modeling Approach
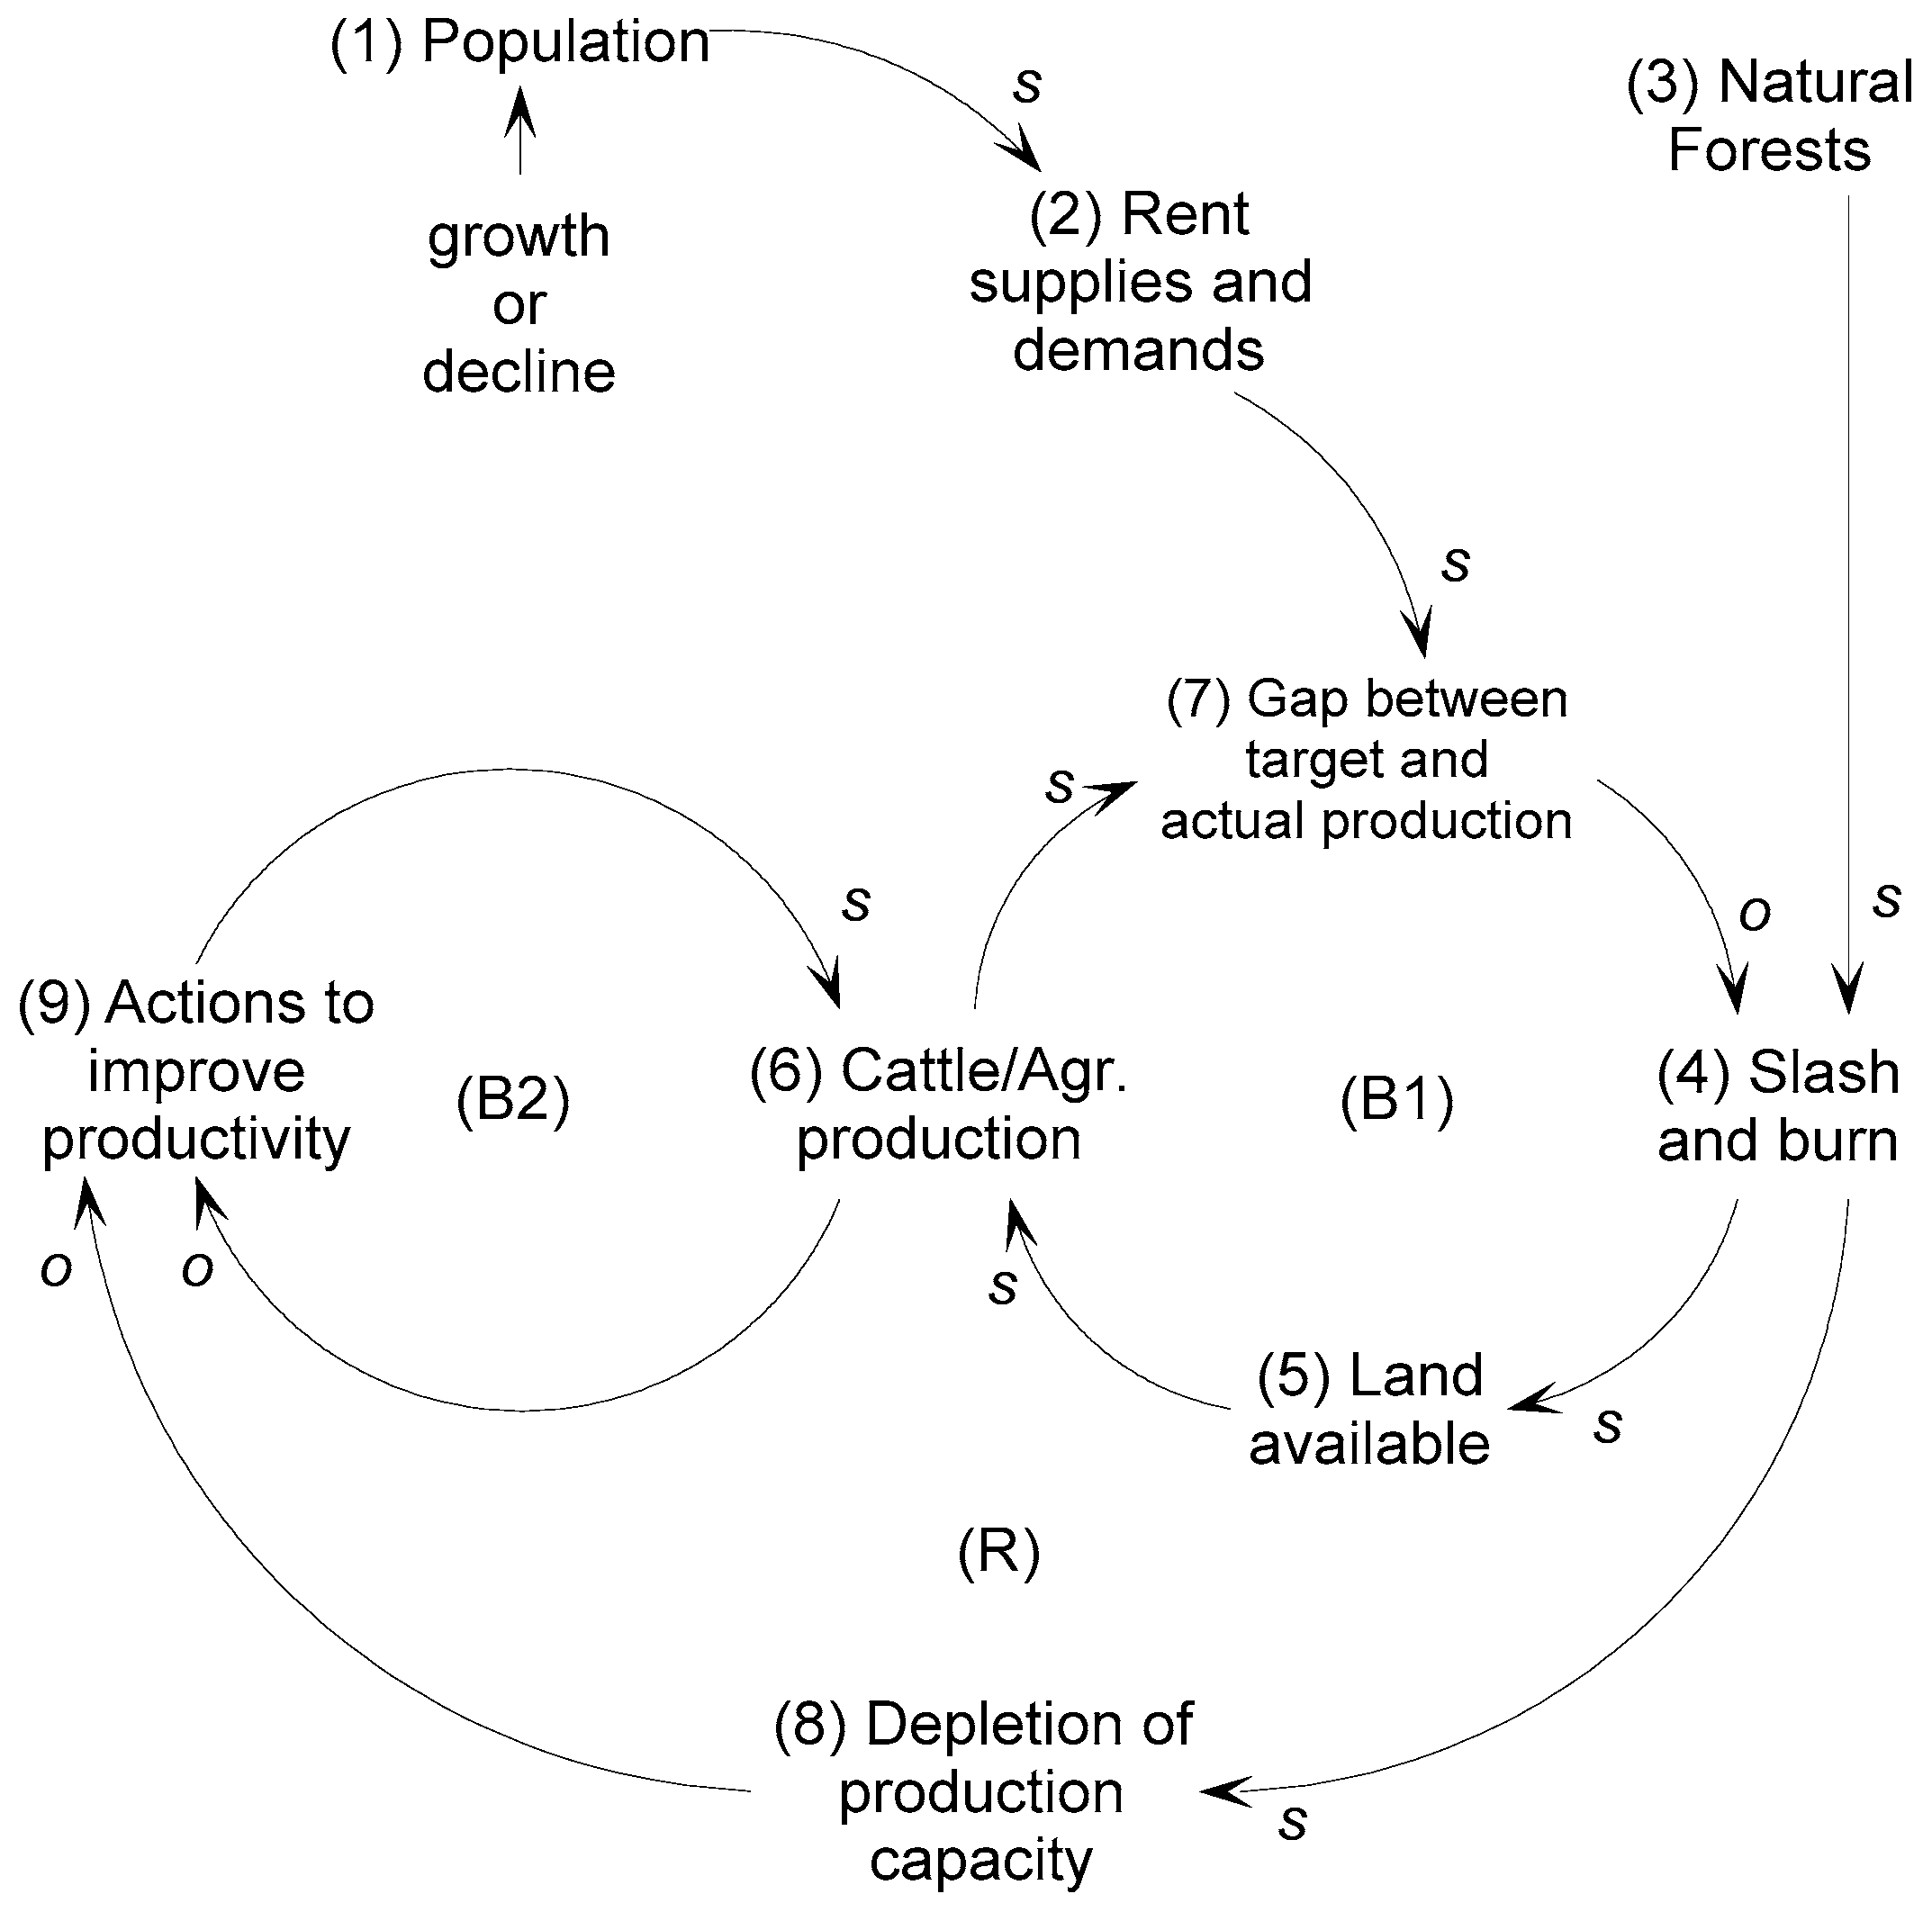
2.3. The System Thinking Concept
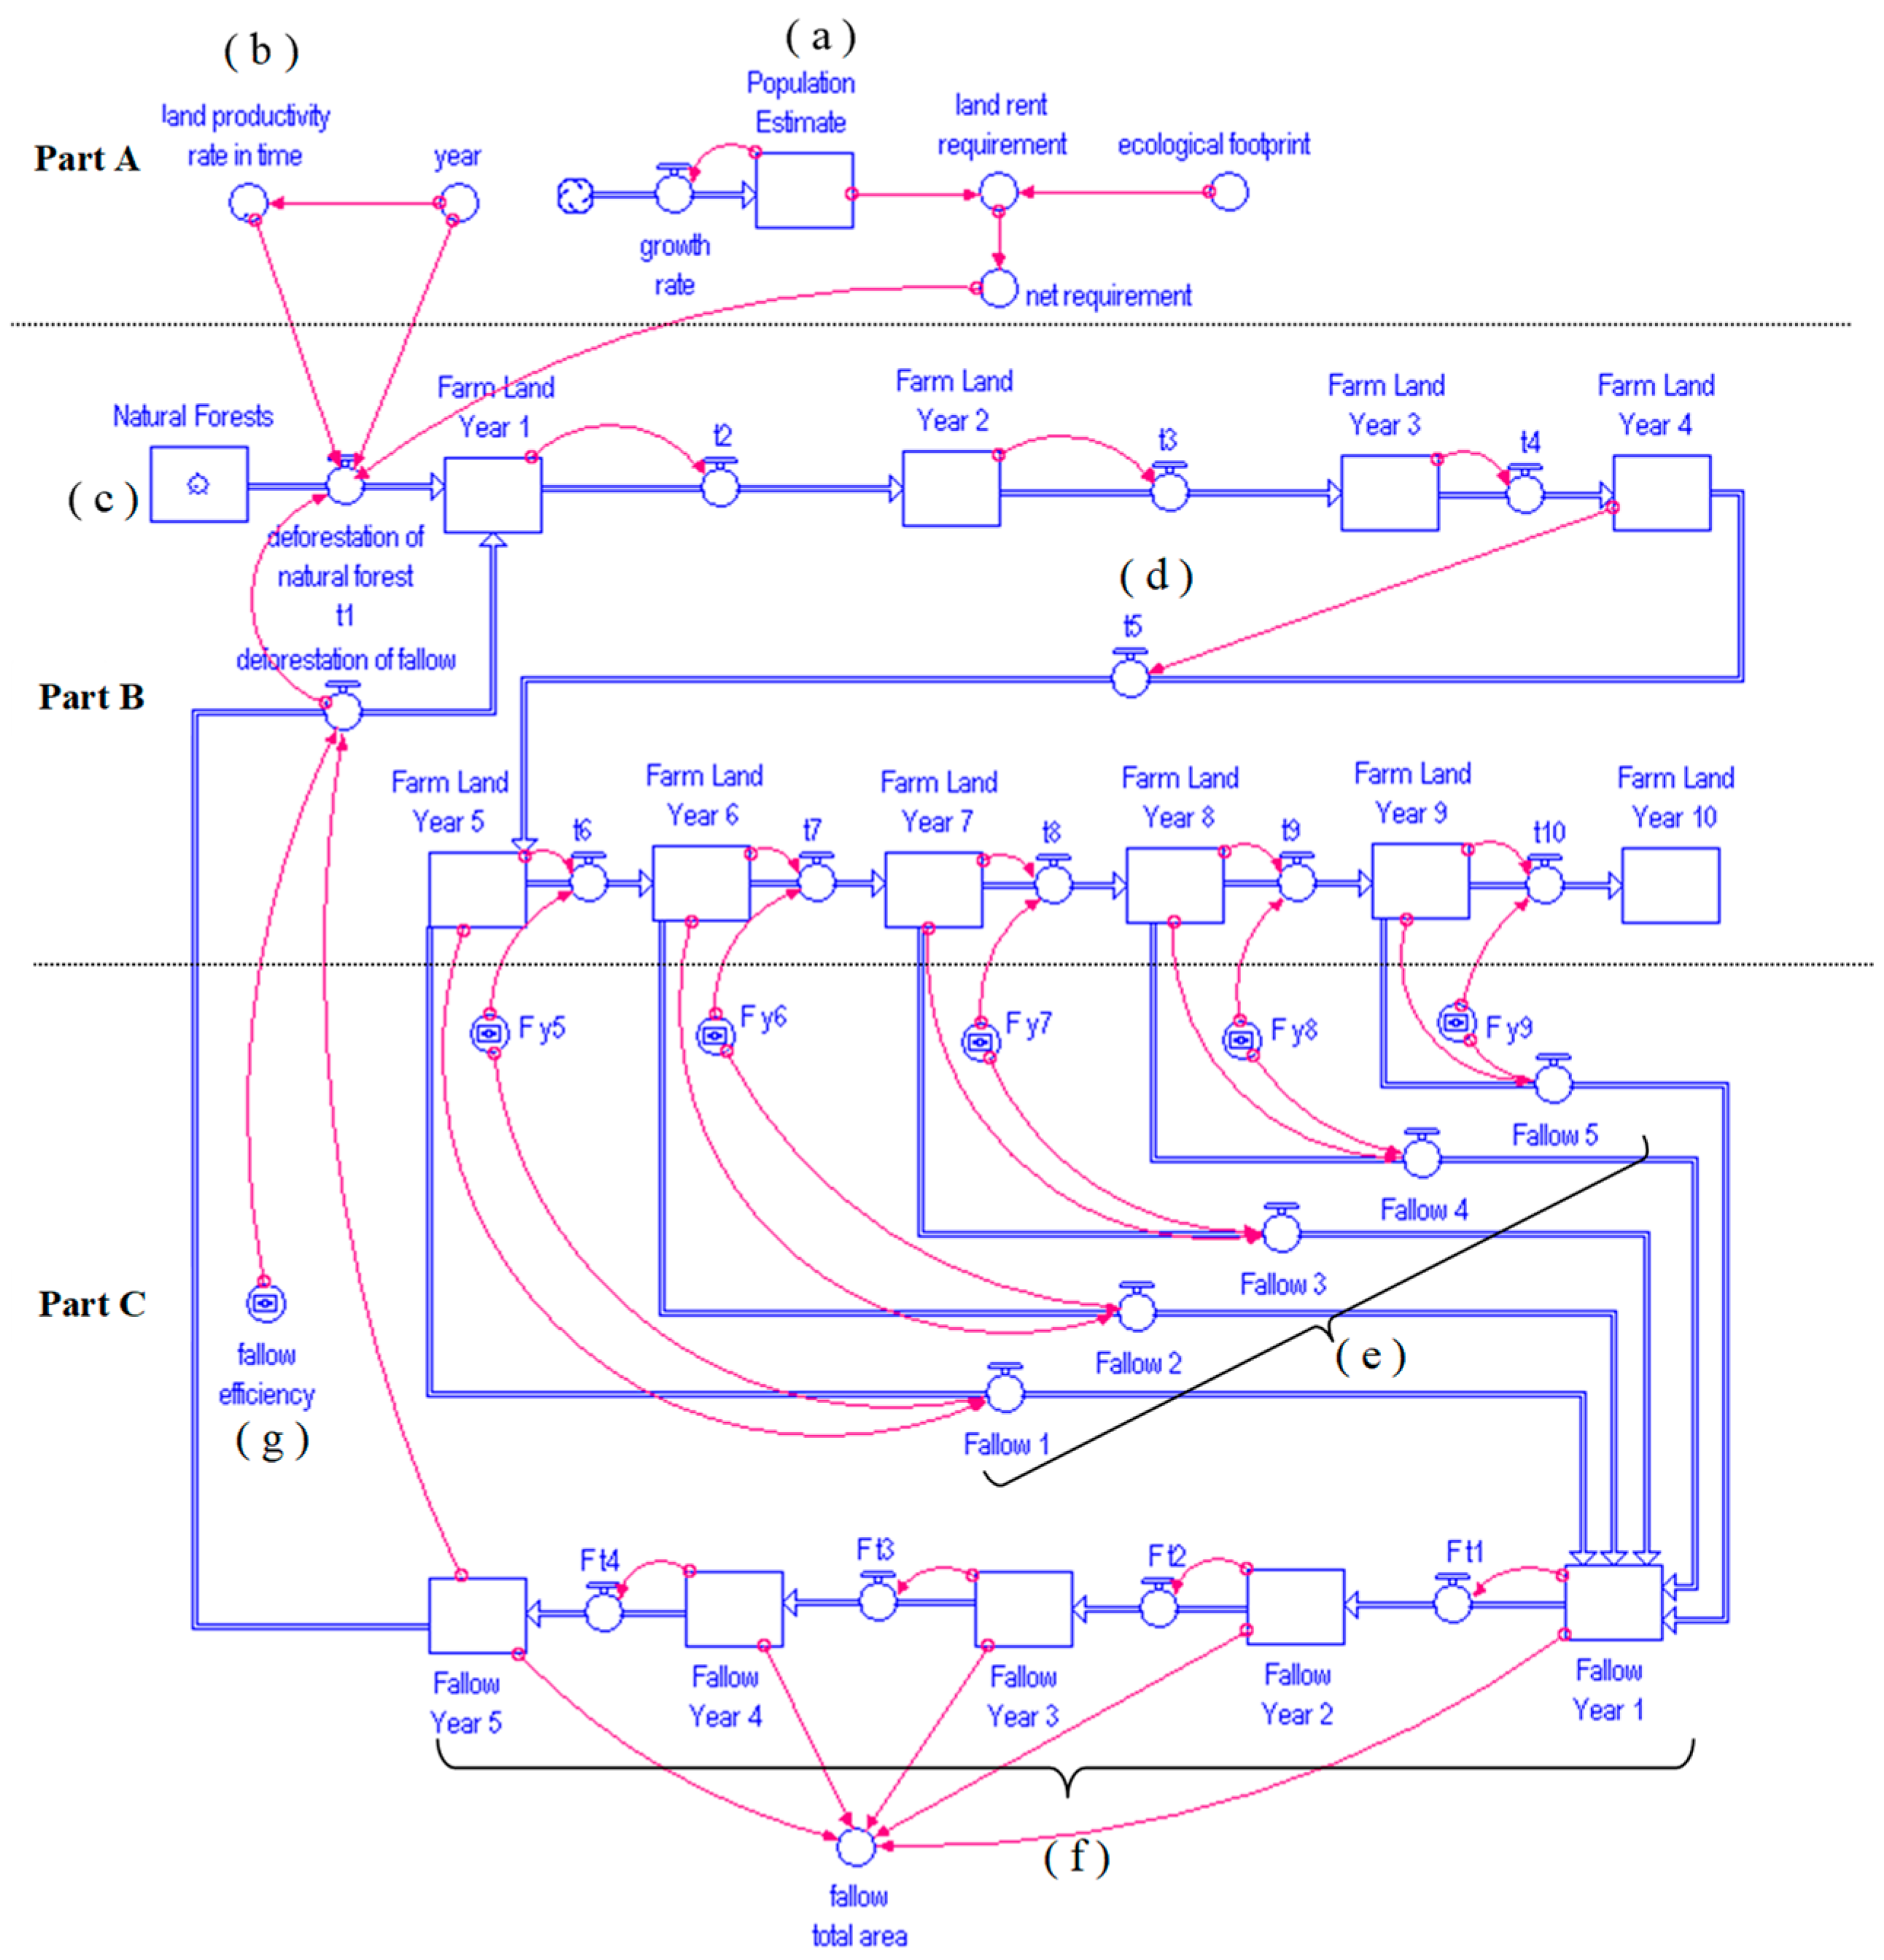
2.4. The Systems Modeling and Simulation of Soil Management on Avoided Deforestation
- Part A: population effects on land requirements;
- Part B: stock of natural forests and stock of open land;
- Part C: the fallow regime;
- Part D: the accounting of land use.
The Opportunity Costs of Land
2.5. Model Verification and Validation
2.6. Model Limitations
3. Results and Discussion
3.1. The Narrative Policy Framework (NPF)
3.2. System Modeling of Land Use in the Amazon
- (a)
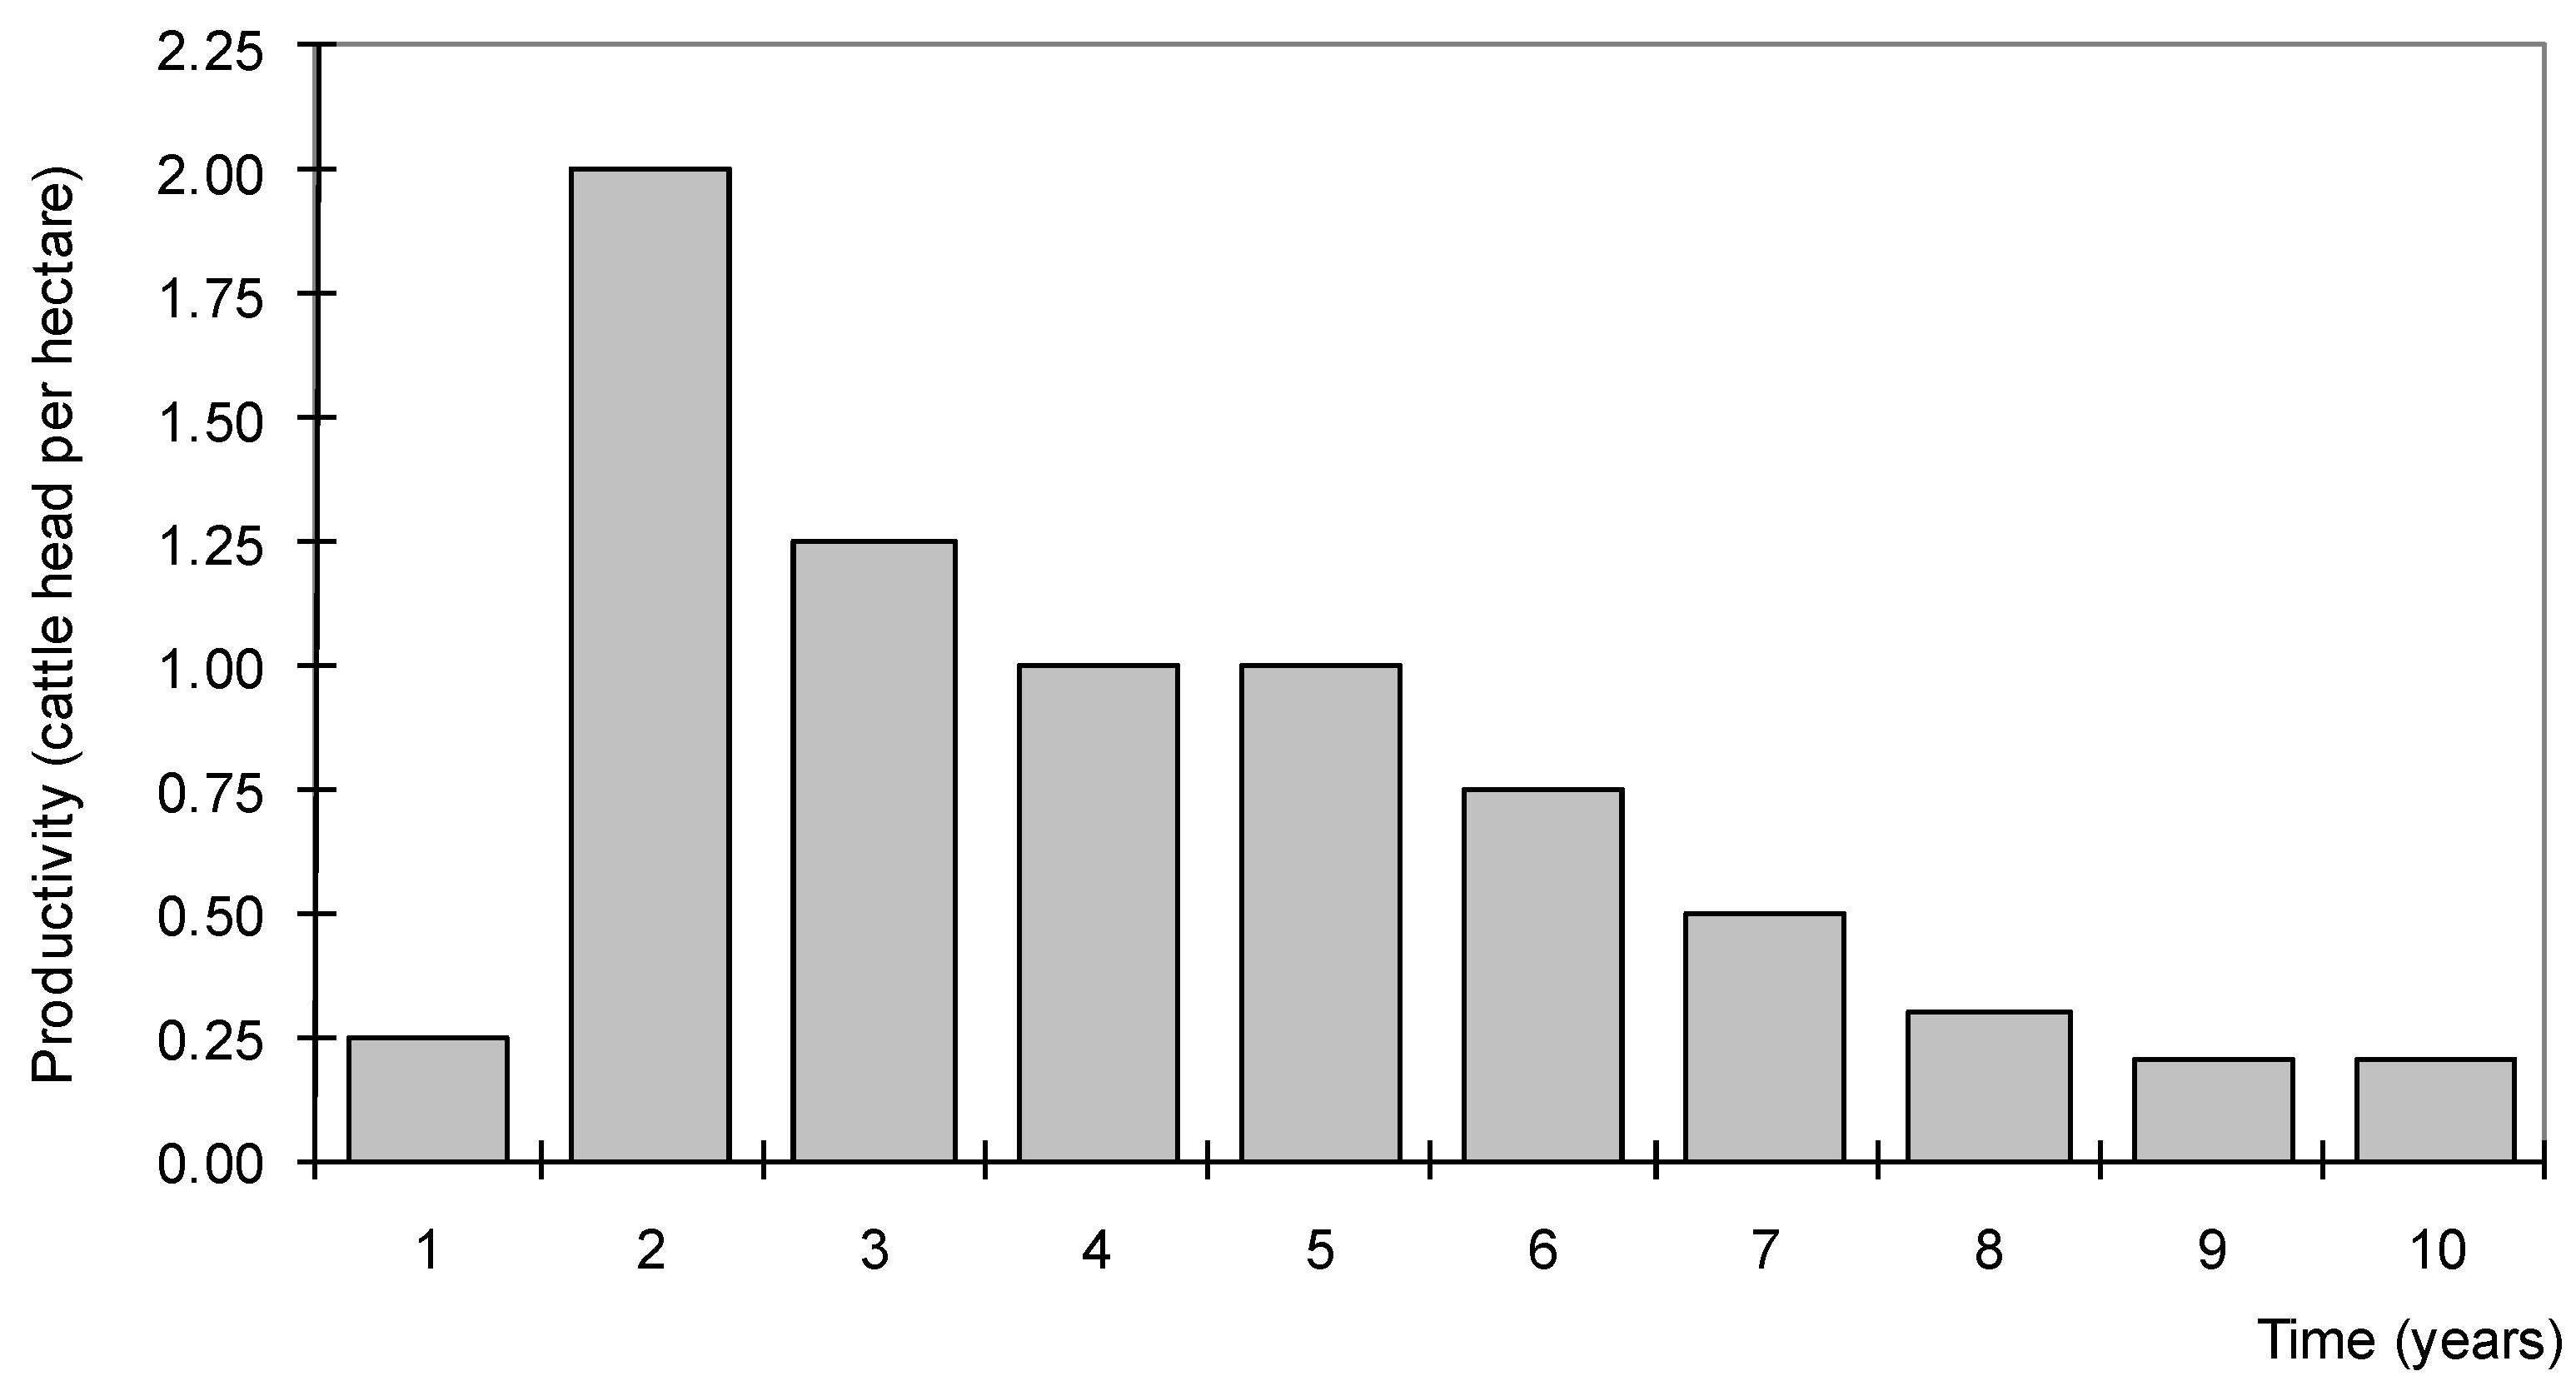
- Part A—Land net requirements and land productivity rate:
- (b)
- Part B—Stock of natural forests and stocks of farmland:
- (c)
- Part C—The soil management system and total area lie fallow:
- (b)
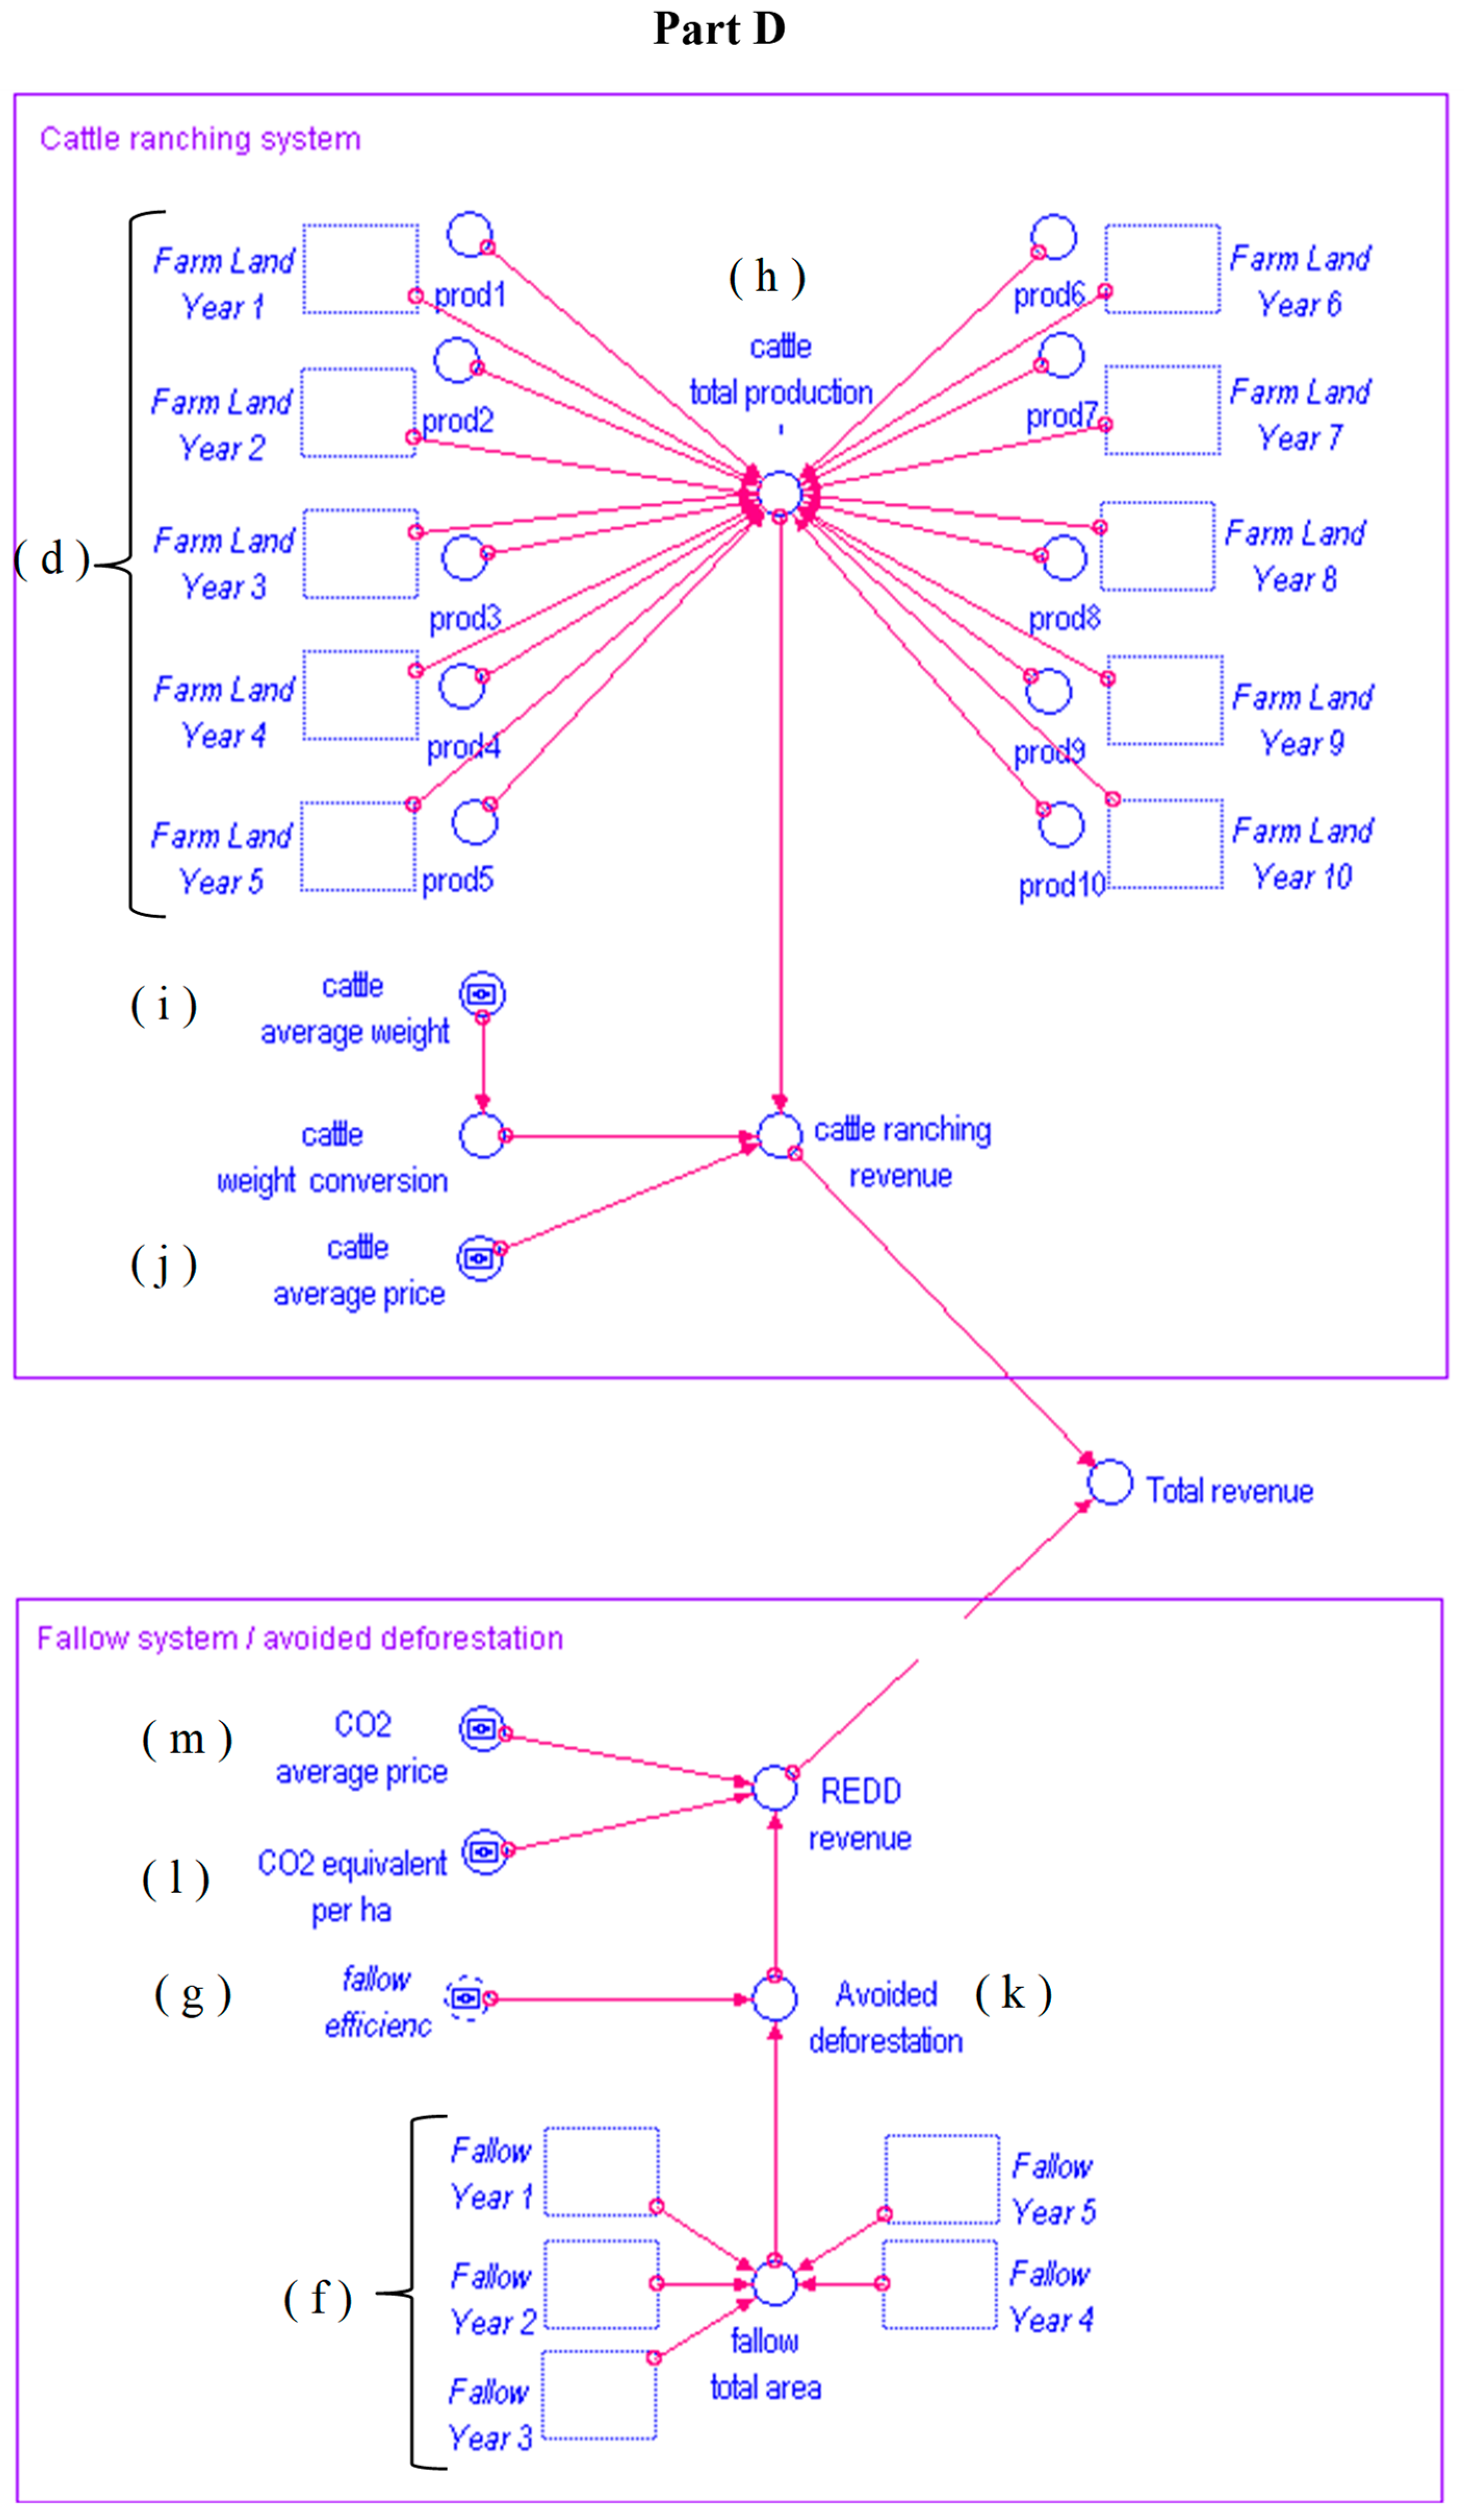
- Part D—The accounting of land use:
3.3. Model Verification and Validation
- (a)
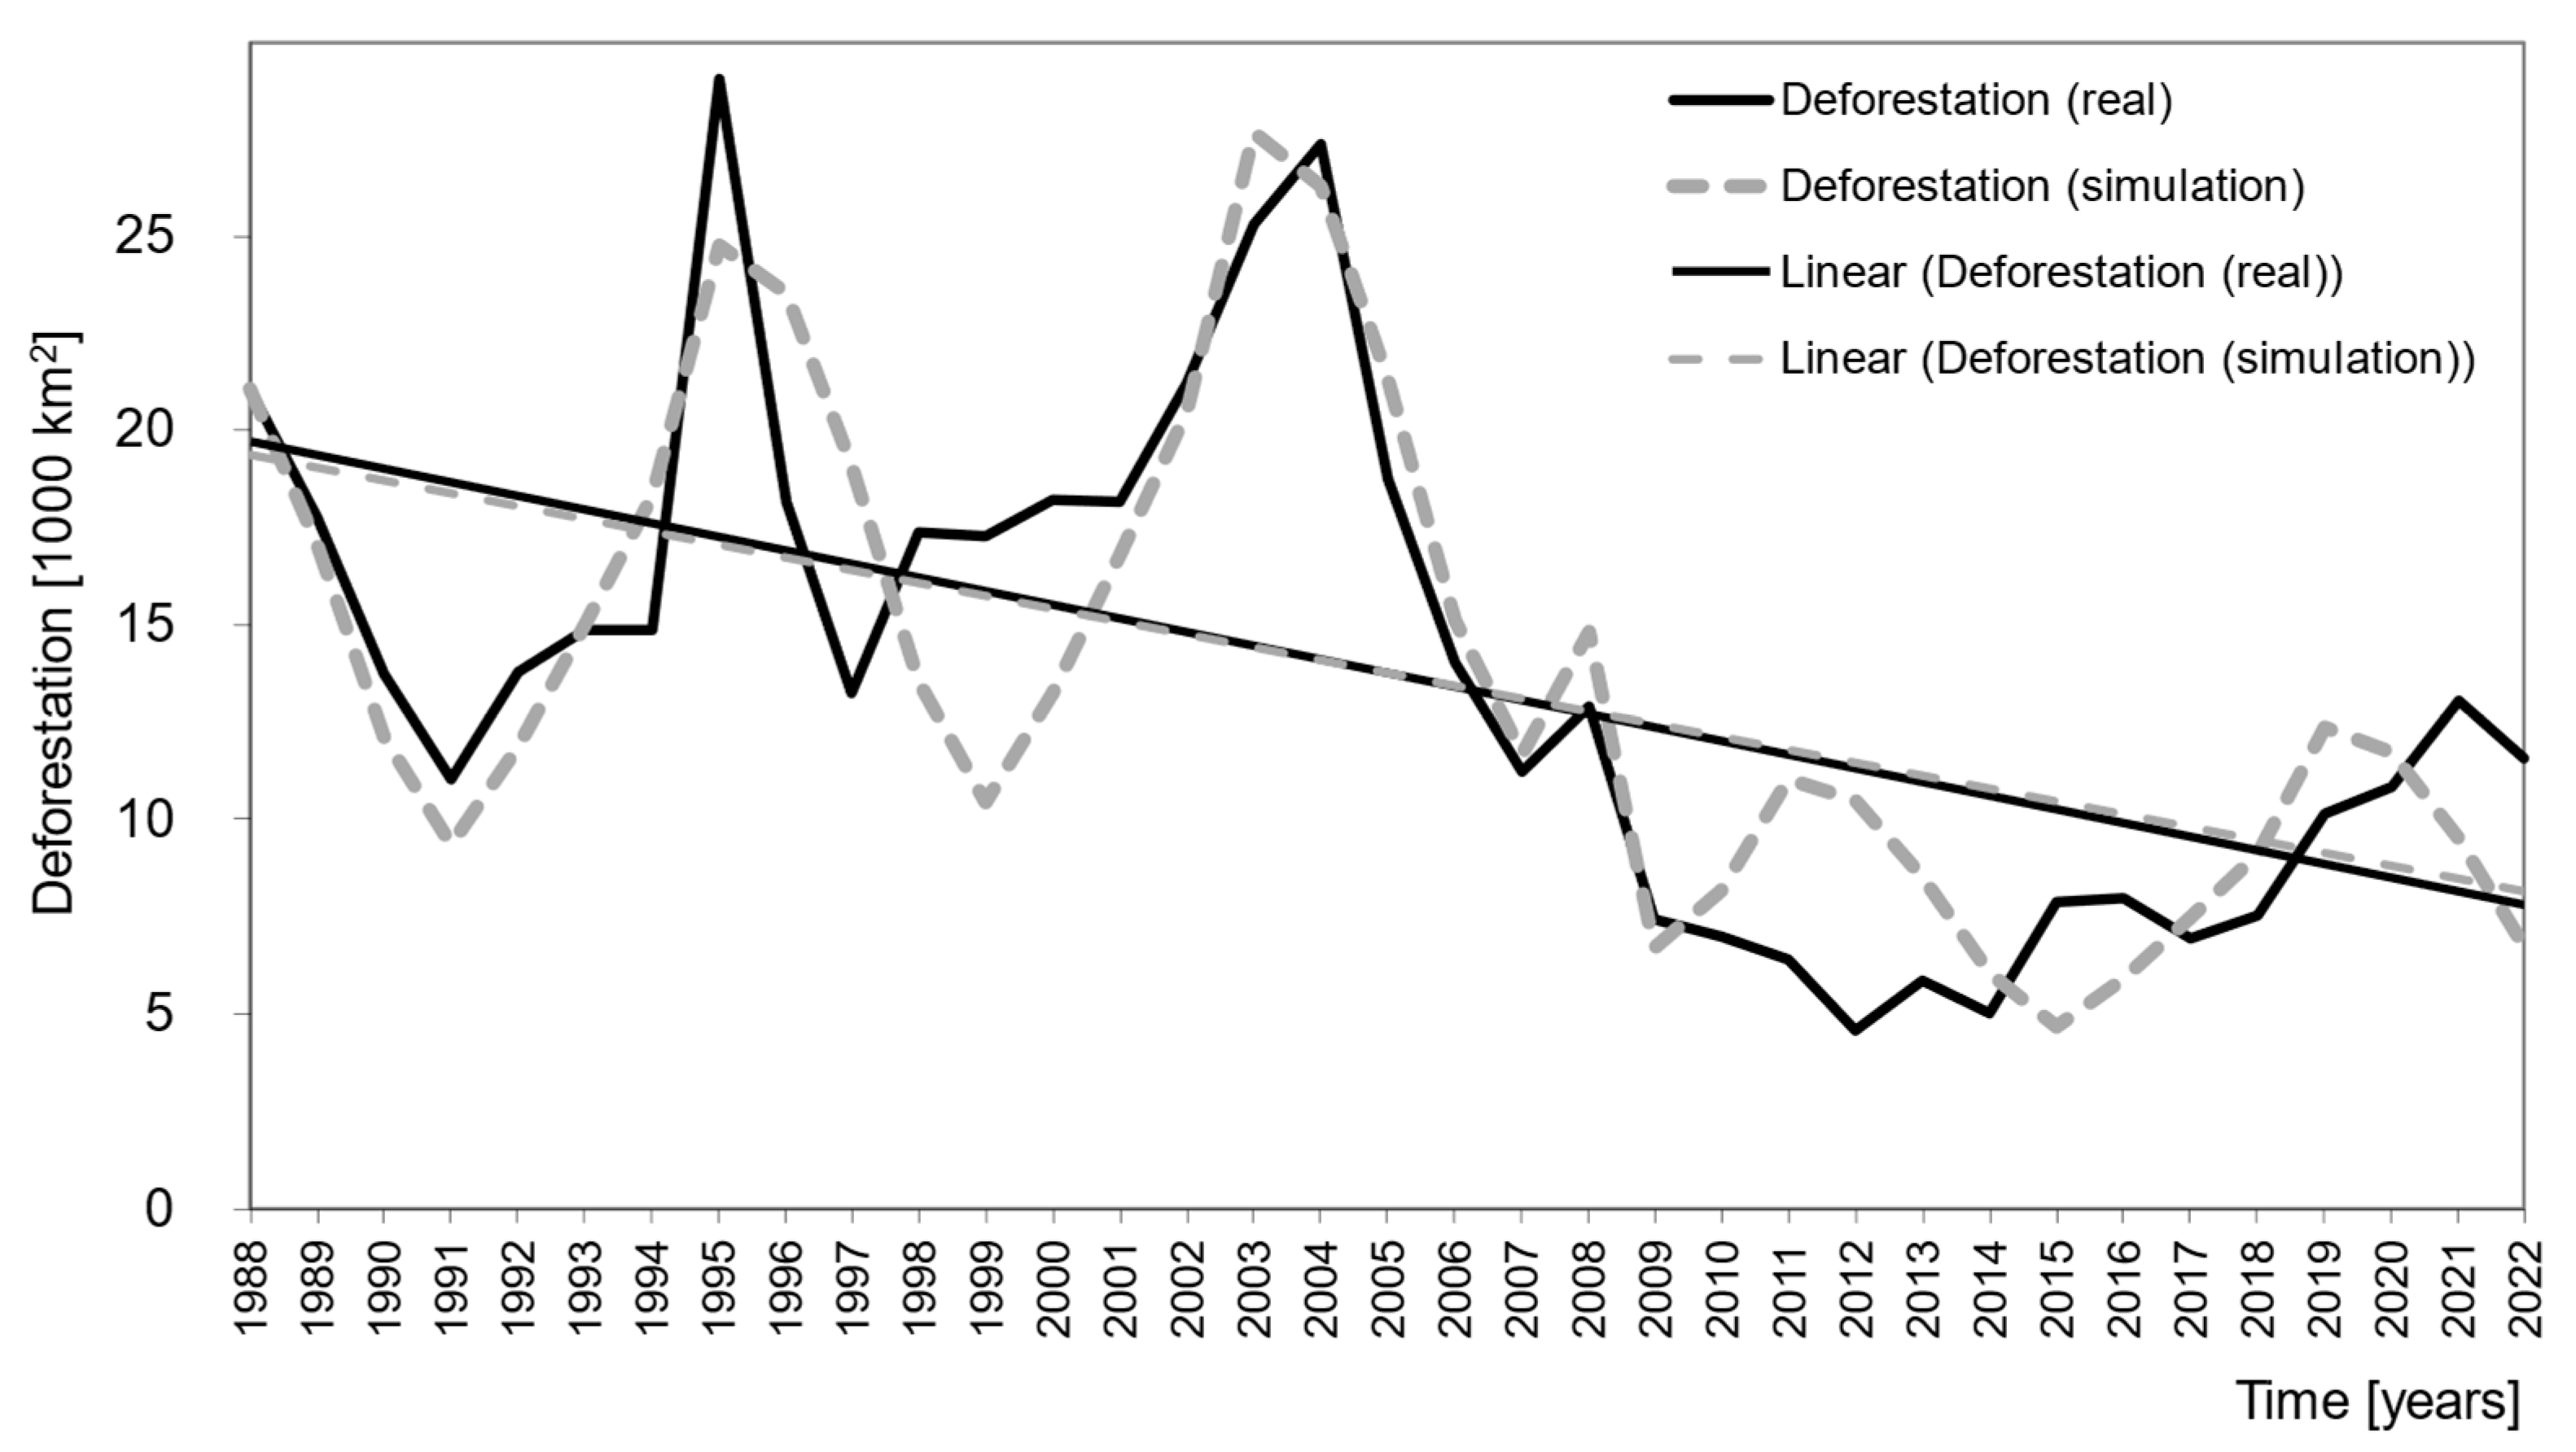
- the deforestation pattern in the Brazilian Amazon, from 1988–2022 (Figure 8)—the statistical evaluation based on OLS single regression of the (1) data from the Brazilian Institute of Spatial Research [38], versus the (2) simulated data resulted in a R2 = 0.93, with no intercept (regression with the intercept, shown no significance on the parameter. R2 estimates = 0.75, confidence > 99%) (confidence level of 99%, F = 784.1, Durbin Watson = 1.244, no auto correlation with 5% significance (Critical values → n = 35, k’ = 1, dL = 1.402, dU = 1.519), and good fit of residuals).
- (b)
- the income from ranching (Appendix B)—the (1) data from the Ministry of Agriculture, Ranching [78], versus the (2) data produced from simulation resulted in an R2 = 0.90 for income in USD and R2 = 0.99 for income in Brazilian Reais (BRL), both with no intercept (confidence level of 99%, F = 94.5 for USD, F = 2190 for BRL).
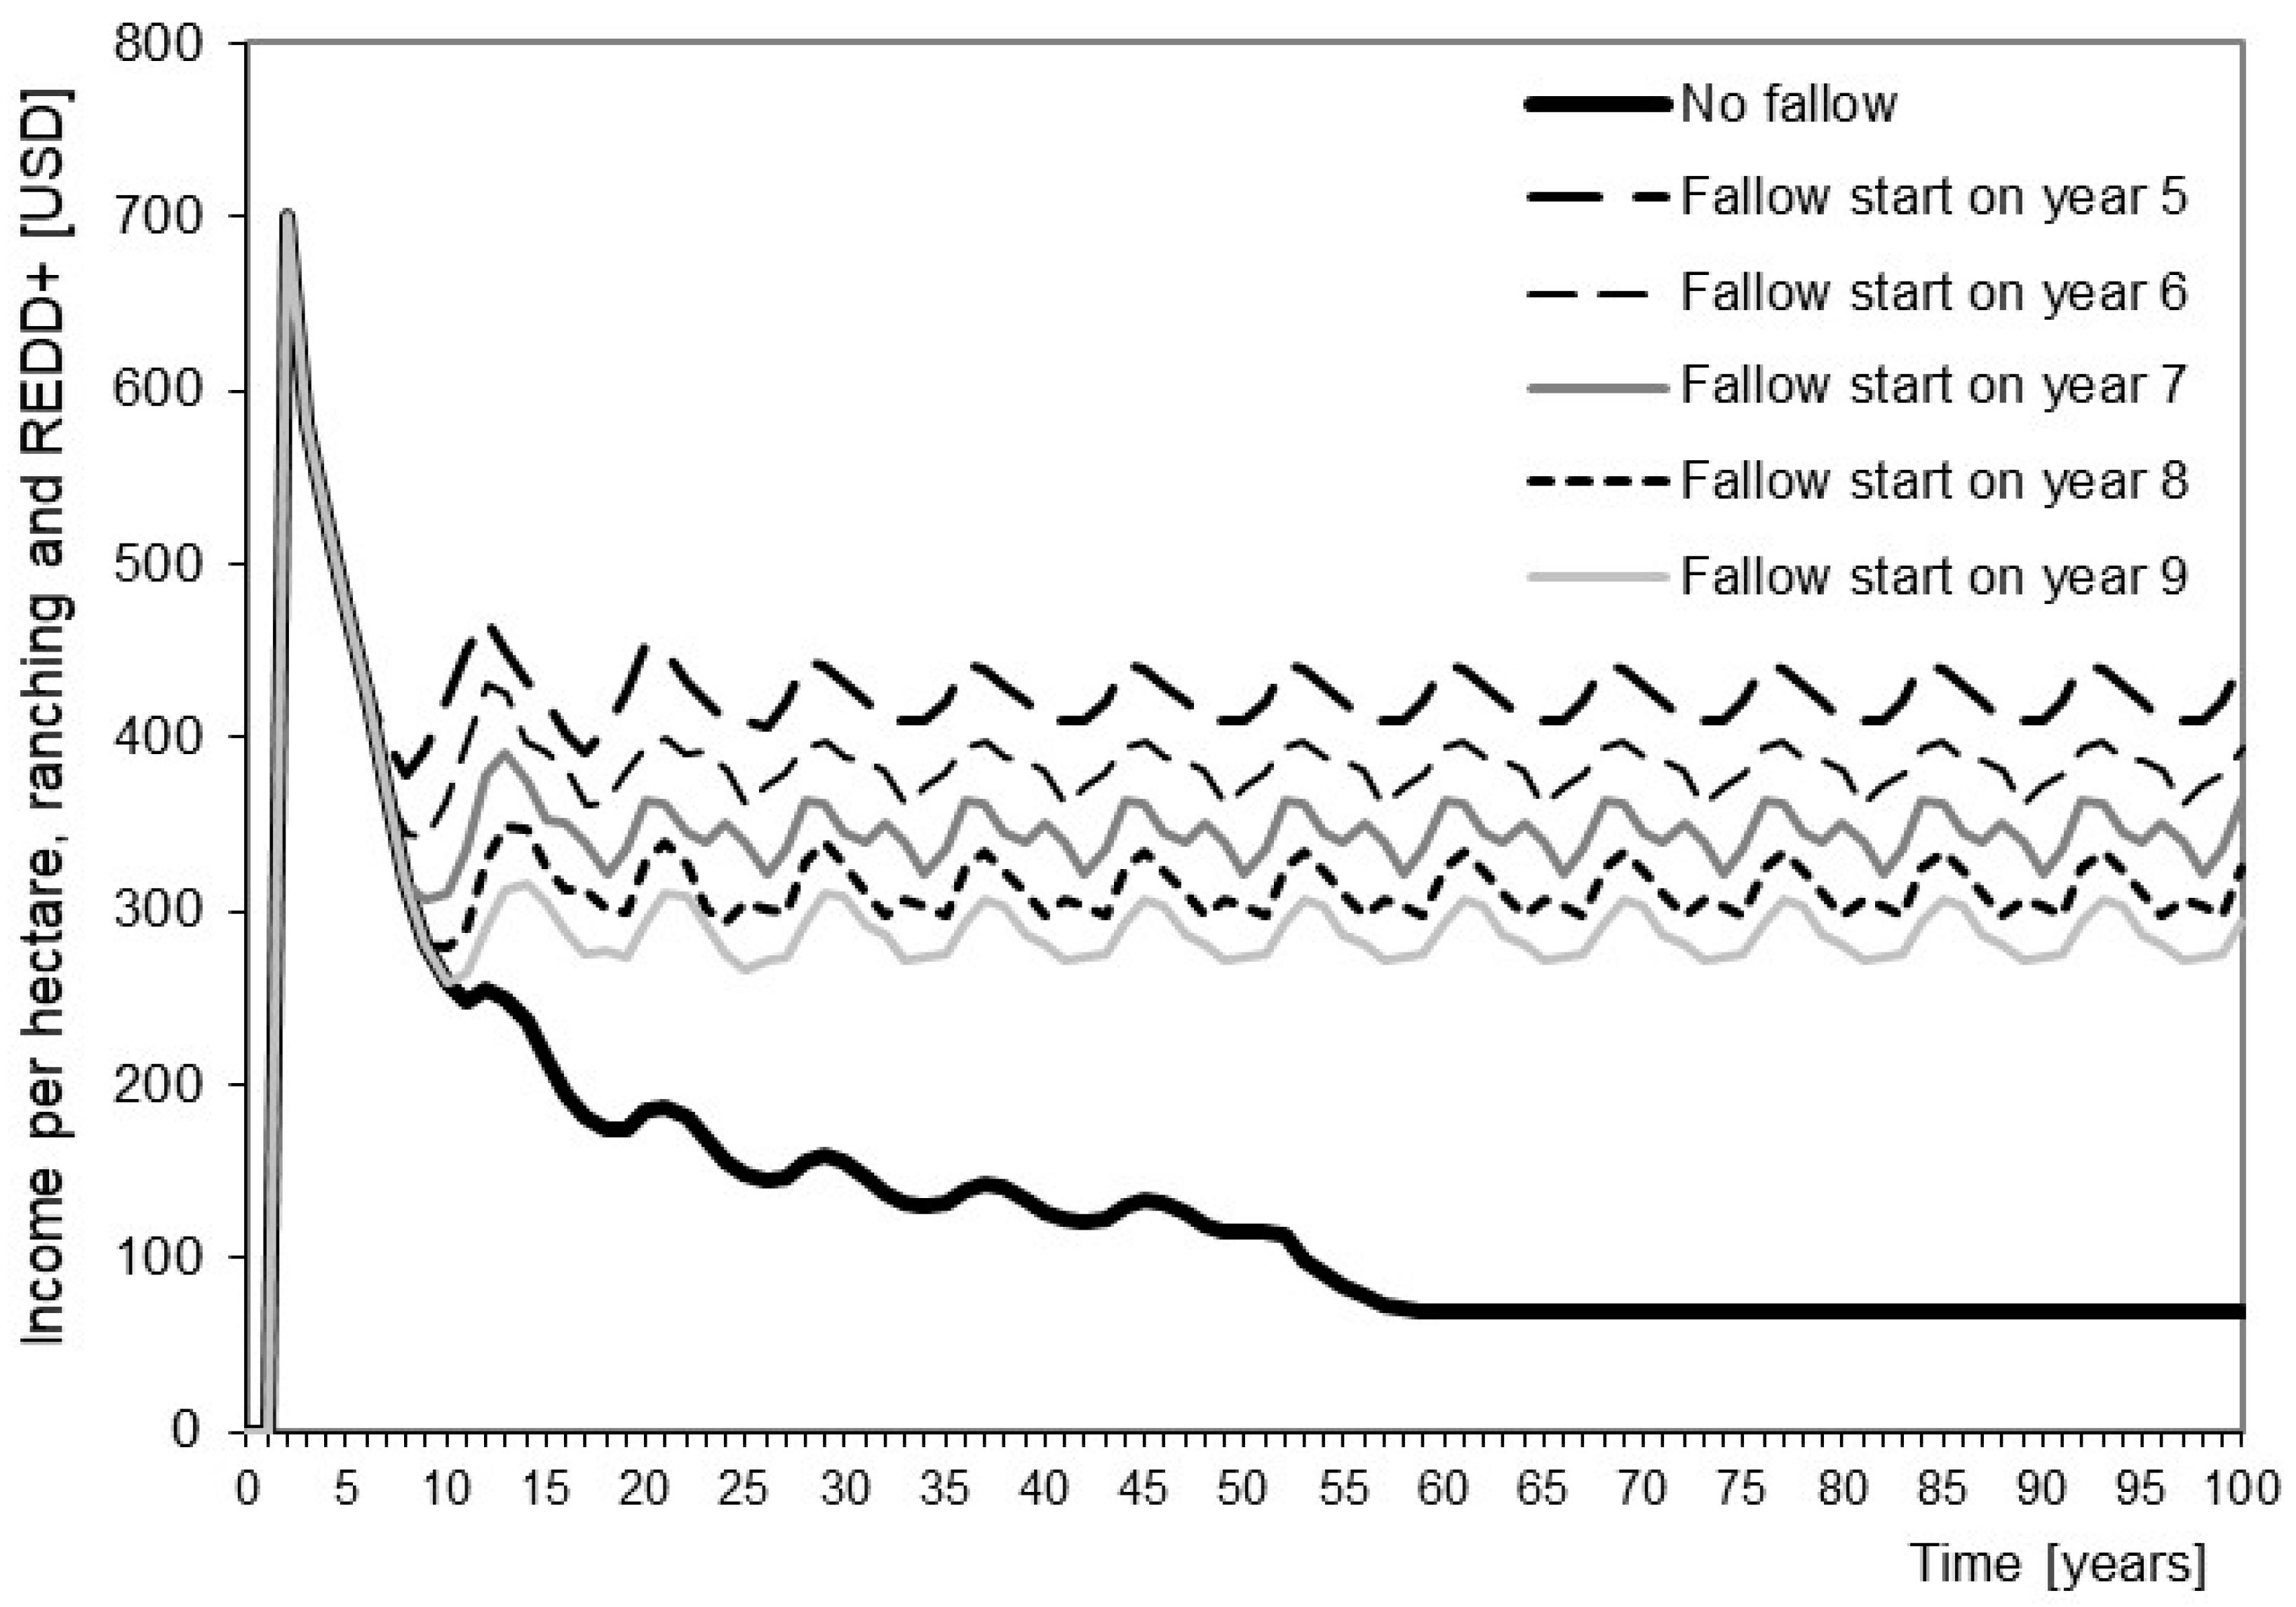
3.4. Income from Ranching and Fallow
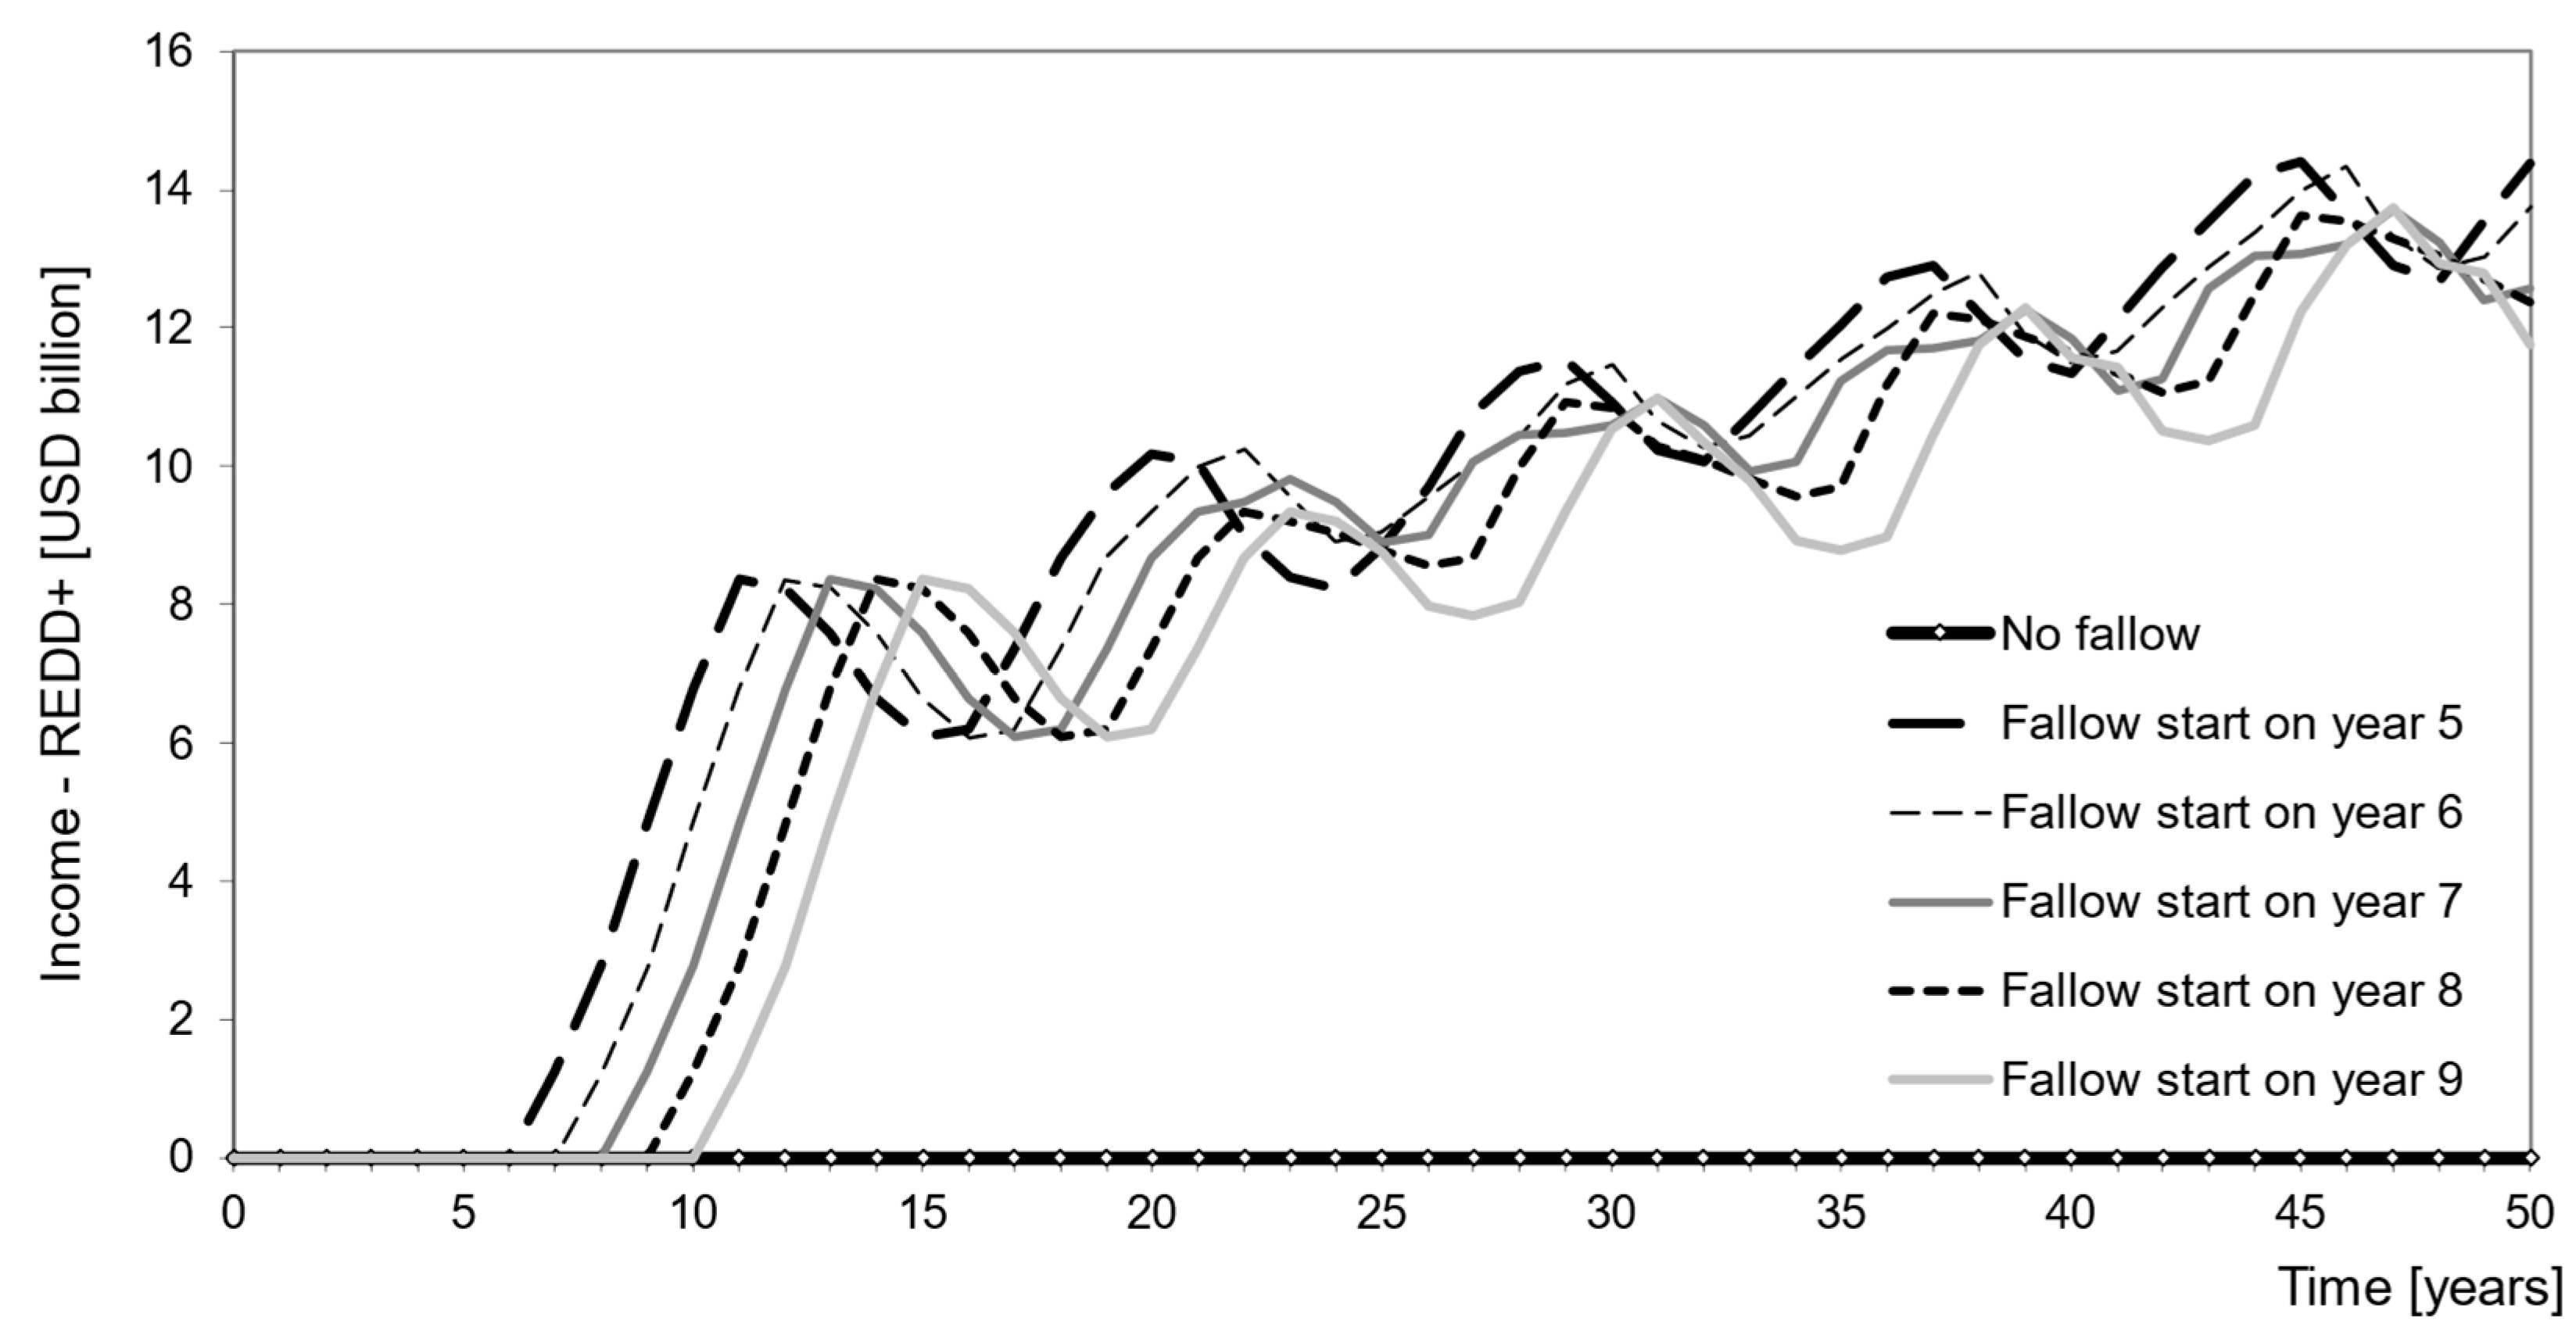
3.5. Income from Avoided Deforestation
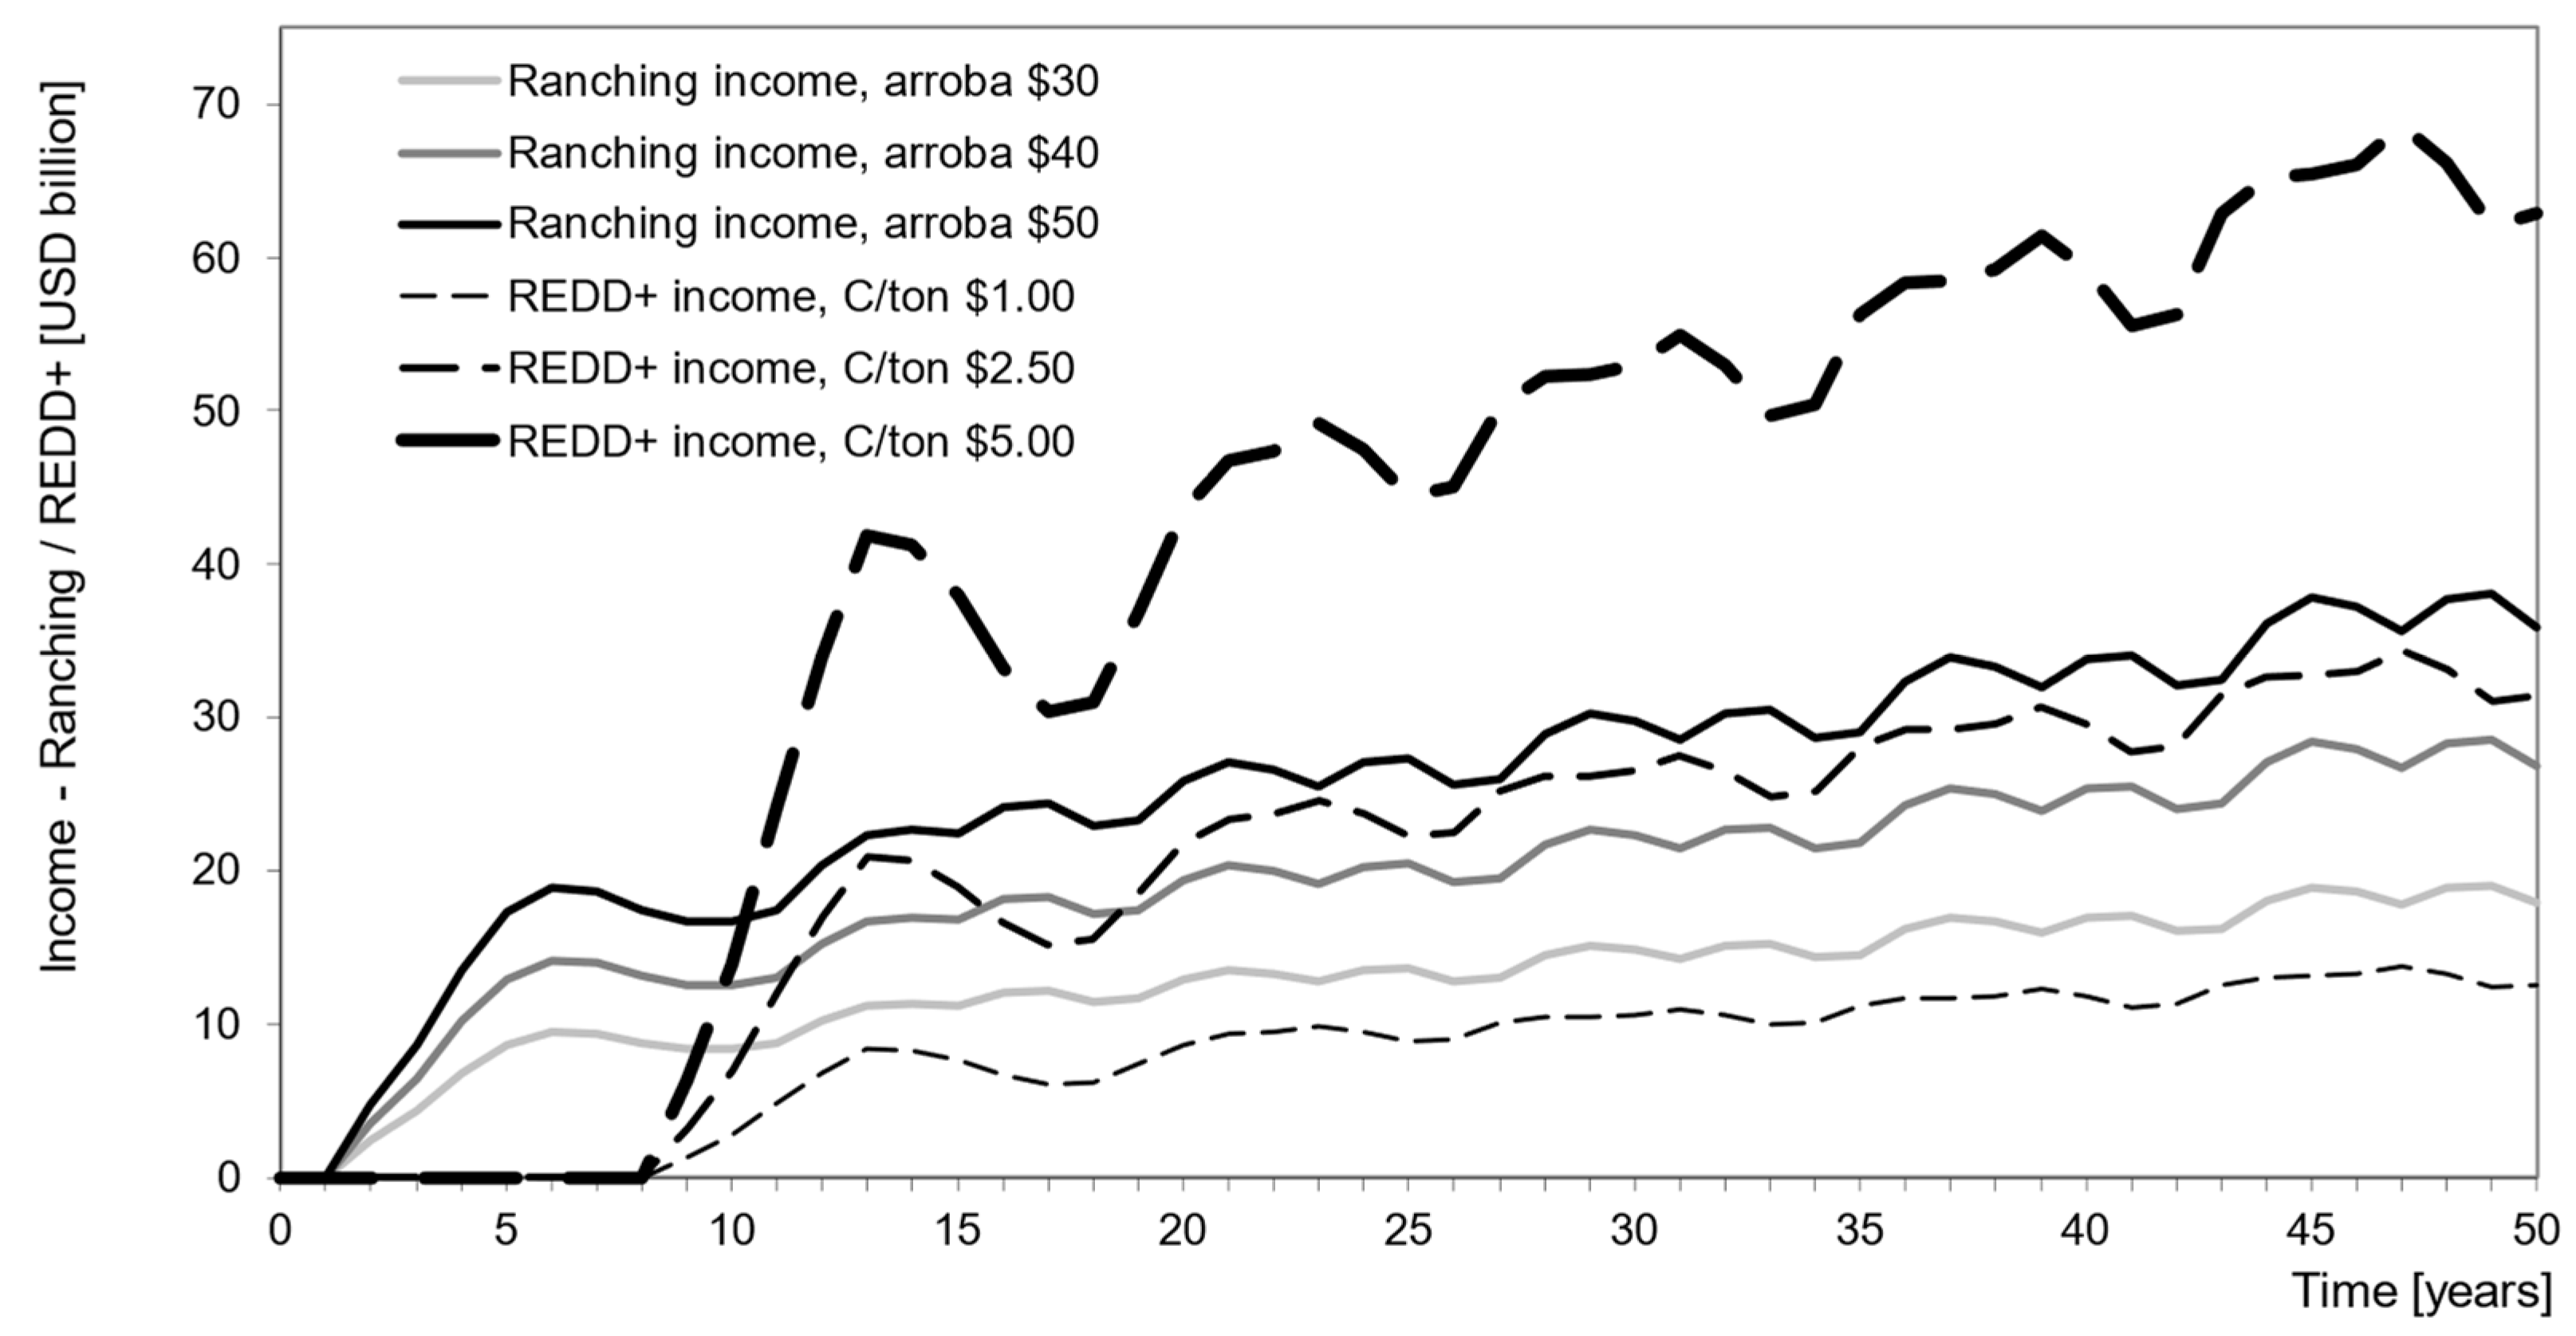
3.6. Income Sensitivity to Carbon and Cattle Prices
3.7. Opportunity Cost of Land
3.8. Sinergies of the Conservation Policy, Socio-Economic Objectives, and Practical Applications
4. Conclusions
Author Contributions
Funding
Informed Consent Statement
Data Availability Statement
Acknowledgments
Conflicts of Interest
Appendix A. Algorithms Specification and Programming Syntax
- □
- Fallow_Year_1(t) = Fallow_Year_1(t − dt) + (Fallow_1 + Fallow_2 + Fallow_3 + Fallow_4 + Fallow_5 − F_t1 ×dt
- INIT Fallow_Year_1 = 0
- INFLOWS:
- → Fallow_1 = Farm_Land_Year_5*F_y5
- → Fallow_2 = Farm_Land_Year_6*F_y6
- → Fallow_3 = arm_Land_Year_7*F_y7
- → Fallow_4 = Farm_Land_Year_8*F_y8
- → Fallow_5 = Farm_Land_Year_9*F_y9
- OUTFLOWS:
- → F_t1 = Fallow_Year_1
- □
- Fallow_Year_2(t) = Fallow_Year_2(t − dt) + (F_t1 − F_t2) * dt
- INIT Fallow_Year_2 = 0
- INFLOWS:
- → F_t1 = Fallow_Year_1
- OUTFLOWS:
- → F_t2 = Fallow_Year_2
- □
- Fallow_Year_3(t) = Fallow_Year_3(t − dt) + (F_t2 − F_t3) * dt
- INIT Fallow_Year_3 = 0
- INFLOWS:
- → F_t2 = Fallow_Year_2 OUTFLOWS:
- → F_t3 = Fallow_Year_3
- □
- Fallow_Year_4(t) = Fallow_Year_4(t − dt) + (F_t3 − F_t4) * dt
- INIT Fallow_Year_4 = 0
- INFLOWS:
- → F_t3 = Fallow_Year_3 OUTFLOWS:
- → F_t4 = Fallow_Year_4
- □
- Fallow_Year_5(t) = Fallow_Year_5(t − dt) + (F_t4 −deforestation_fallow) * dt
- INIT Fallow_Year_5 = 0
- INFLOWS:
- → F_t4 = Fallow_Year_4 OUTFLOWS:
- → deforestation_fallow = Fallow_Year_5*fallow_efficiency
- □
- Farm_Land_Year_1(t) = Farm_Land_Year_1(t − dt) + (deforestation_fallow + deforestation_natural_forest_t1- t2) * dt
- INIT Farm_Land_Year_1 = 0
- INFLOWS:
- → deforestation_fallow = Fallow_Year_5*fallow_efficiency
- → deforestation natural_forest_t1 = (net_requirement*year*land_productivity_rate_in_time)-deforestation_fallow
- OUTFLOWS:
- → t2 = Farm_Land_Year_1
- □
- Farm_Land_Year_10(t) = Farm_Land_Year_10(t − dt) + (t10) * dt
- INIT Farm_Land_Year_10 = 0
- INFLOWS:
- → t10 = Farm_Land_Year_9*(1-F_y9)
- □
- Farm_Land_Year_2(t) = Farm_Land_Year_2(t − dt) + (t2 − t3) * dt
- INIT Farm_Land_Year_2= 0
- INFLOWS:
- → t2 = Farm_Land_Year_1
- OUTFLOWS:
- → t3 = Farm_Land_Year_2
- □
- Farm_Land_Year_3(t) = Farm_Land_Year_3(t − dt) + (t3 − t4) * dt
- INIT Farm_Land_Year_3 = 0
- INFLOWS:
- → t3 = Farm_Land_Year_2
- OUTFLOWS:
- → t4 = Farm_Land_Year_3
- □
- Farm_Land_Year_4(t) = Farm_Land_Year_4(t − dt) + (t4 − t5) * dt
- INIT Farm_Land_Year_4 = 0
- INFLOWS:
- → t4 = Farm_Land_Year_3
- OUTFLOWS:
- → t5 = Farm_Land_Year_4
- □
- Farm_Land_Year_5(t) = Farm_Land_Year_5(t − dt) + (t5 − Fallow_1 − t6) * dt
- INIT Farm_Land_Year_5 = 0
- INFLOWS:
- → t5 = Farm_Land_Year_4
- OUTFLOWS:
- → Fallow_1 = Farm_Land_Year_5*F_y5
- → t6 = Farm_Land_Year_5*(1-F_y5)
- □
- Farm_Land_Year_6(t) = Farm_Land_Year_6(t − dt) + (t6 − Fallow_2 − t7) * dt
- INIT Farm_Land_Year_6 = 0
- INFLOWS:
- → t6 = Farm_Land_Year_5*(1-F_y5)
- OUTFLOWS:
- → Fallow_2 = Farm_Land_Year_6*F_y6
- → t7 = Farm_Land_Year_6*(1-F_y6)
- □
- Farm_Land_Year_7(t) = Farm_Land_Year_7(t − dt) + (t7 − Fallow_3 − t8) * dt
- INIT Farm_Land_Year_7 = 0
- INFLOWS:
- → t7 = Farm_Land_Year_6*(1-F_y6)
- OUTFLOWS:
- → Fallow_3 = Farm_Land_Year_7*F_y7
- → t8 = Farm_Land_Year_7*(1-F_y7)
- □
- Farm_Land_Year_8(t) = Farm_Land_Year_8(t − dt) + (t8 − Fallow_4 − t9) * dt
- INIT Farm_Land_Year_8 = 0
- INFLOWS:
- → t8 = Farm_Land_Year_7*(1-F_y7)
- OUTFLOWS:
- → Fallow_4 = Farm_Land_Year_8*F_y8
- → t9 = Farm_Land_Year_8*(1-F_y8)
- □
- Farm_Land_Year_9(t) = Farm_Land_Year_9(t − dt) + (t9 − Fallow_5 − t10) * dt
- INIT Farm_Land_Year_9 = 0
- INFLOWS:
- → t9 = Farm_Land_Year_8*(1-F_y8)
- OUTFLOWS:
- → Fallow_5 = Farm_Land_Year_9*F_y9
- → t10 = Farm_Land_Year_9*(1-F_y9)
- □
- Natural_Forests(t) = Natural_Forests(t − dt) +(deforestation_natural_forest_t1) * dt
- INIT Natural_Forests = 50
- OUTFLOWS:
- → deforestation_natural_forest_t1 = (net_requirement*year*
- land_productivity_rate_in_time)-deforestation_fallow
- ○
- average_price_@_cattle_U$ = 50 (30,40,50)
- ○
- average__C_price = 0 (0,1.0,2.5,5.0)
- ○
- Avoided_deforestation = fallow_efficiency*total_area_fallow
- ○
- C_per_ha = 200
- ○
- ecological_footprint = 10
- ○
- fallow_efficiency = 1
- ○
- F_y5 = 0 (0,1)
- ○
- F_y6 = 0 (0,1)
- ○
- F_y7 = 0 (0,1)
- ○
- F_y8 = 0 (0,1)
- ○
- F_9y = 0 (0,1)
- ○
- land_rent_requirement = Population_Estimate*ecological_footprint
- ○
- net_requirement = DERIVN(land_rent_requirement,1)
- ○
- prod1 = 2
- ○
- prod2 = 1.25
- ○
- prod3 = 1
- ○
- prod4 = 1
- ○
- prod5 = 0.75
- ○
- prod6 = 0.5
- ○
- prod7 = 0.3
- ○
- prod8 = 0.2
- ○
- prod9 = 0.2
- ○
- prod10 = 0.2
- ○
- revenue_U$_ranching = total_cattle_production*weight_conversion_@*average_price_@_cattle_U$
- ○
- revenue_U$_REDD = C_per_ha*average_C_price*Avoided_deforestation
- ○
- total_area_fallow = Fallow_Year_1+Fallow_Year_2+ Fallow_Year_3+Fallow_Year_4+Fallow_Year_5
- ○
- total_area_farming = Farm_Land_Year_1+Farm_Land_Year_2
- +Farm_Land_Year_3+Farm_Land_Year_ 4+Farm_Land_Year_5
- +Farm_Land_Year_6+Farm_Land_Year_7+Farm_Land_Year_8
- +Farm_Land_Year_9+Farm_Land_Year_10
- ○
- total_revenue = revenue_U$_ranching+revenue_U$_REDD
- ○
- total_cattle_production = (Farm_Land_Year_1*prod1)
- Farm_Land_Year_2*prod2)+(Farm_Land_Year_3*prod3*)
- +(Farm_Land_Year_4*prod4)+(Farm_Land_Year_5*prod5)
- +(Farm_Land_Year_6*prod6)+ (Farm_Land_Year_7*prod7)
- +(Farm_Land_Year_8*prod8)+(Farm_Land_Year_9*prod9)
- +(Farm_Land_Year_10*prod10)
- ○
- weight_conversion_@= (average_cattle_weight/2)/15
- ○
- year = counter(1,9)
- ○
- land_productivity_rate_in_time = GRAPH(year)
- 🕸
- (1.00, 2.00), (2.00, 1.25), (3.00, 1.00), (4.00, 1.00), (5.00, 0.75), (6.00, 0.5), (7.00, 0.3), (8.00, 0.2), (9.00,0.2), (10.0, 0.2), (11.0, 0.2)
Appendix B

References
- Luizão, F.J.; Fearnside, P.M.; Cerri, C.E.P.; Lehmann, J. The Maintenance of Soil Fertility in Amazonian Managed Systems. In Amazonia and Global Change; Geophysical Monograph Series; Keller, M., Bustamante, M., Gash, J., da Silva Dias, P., Eds.; American Geophysical Union (AGU): Washington, DC, USA, 2009; Volume 186, pp. 311–336. [Google Scholar]
- Lal, R. Global Potential of Soil Carbon Sequestration to Mitigate the Greenhouse Effect. Crit. Rev. Plant Sci. 2003, 22, 151–184. [Google Scholar] [CrossRef]
- Frare, J.C.V.; Martins, G.C.; Ramos, S.; de Freitas, L.; de Oliveira, I.A. Amazônia 4.0: Importância da matéria orgânica do solo para a manutenção dos sistemas produtivos. Res. Soc. Dev. 2023, 12, e28512240261. [Google Scholar] [CrossRef]
- Silva-Olaya, A.M.; Olaya-Montes, A.; Polanía-Hincapié, K.L.; Cherubin, M.R.; Duran-Bautista, E.H.; Ortiz-Morea, F.A. Silvopastoral Systems Enhance Soil Health in the Amazon Region. Sustainability 2022, 14, 320. [Google Scholar] [CrossRef]
- Alvim, P.T. Ecological and Economic Factors Associated with the Sustainability of Agriculture in the Amazon Region. In Sustainable Agriculture for Food, Energy and Industry: Strategies Towards Achievement, Braunschweig, Germany; James & James Science Publishers: London, UK, 1998. [Google Scholar]
- Moran, E.F.; Brondizio, E.S.; Tucker, J.M.; Silva-Forsberg, M.C.D.; McCrackena, S.; Falesi, I. Effects of soil fertility and land-use on forest succession in Amazonia. For. Ecol. Manag. 2000, 139, 93–108. [Google Scholar] [CrossRef]
- Brondizio, E.S.; McCracken, S.D.; Moran, E.F.; Nelson, D.R.; Siqueira, A.D.; Rodriguez-Pedraza, C. The Colonist Footprint: Toward a Conceptual Framework of Land Use and Deforestation Trajectories among Small Farmers in the Amazonian Frontier. Deforestation and Land Use in the Amazon; Wood, C.H., Porro, R., Eds.; University Press of Florida: Gainesville, FL, USA, 2002. [Google Scholar]
- Moran, E.F.; Ostrom, E. Seeing the Forest and the Trees: Human-Environment Interactions in Forest Ecosystems; MIT Press: Cambridge, MA, USA, 2005. [Google Scholar]
- Lusiana, B.; van Noordwijk, M.; Cadisch, G. Land sparing or sharing? Exploring livestock fodder options in combination with land use zoning and consequences for livelihoods and net carbon stocks using the FALLOW model. Agric. Ecosyst. Environ. 2012, 159, 145–160. [Google Scholar] [CrossRef]
- Hiratsuka, M.; Tsuzuki, H.; Suzuki, K.; Nanaumi, T.; Furuta, T.; Niitsuma, K.; Amano, M. Living biomass of fallow areas under a REDD+ project in mountainous terrain of Northern Laos. J. For. Res. 2018, 23, 56–63. [Google Scholar] [CrossRef]
- Nepstad, D.; McGrath, D.; Stickler, C.; Alencar, A.; Azevedo, A.; Swette, B.; Hess, L. Slowing Amazon deforestation through public policy and interventions in beef and soy supply chains. Science 2014, 344, 1118–1123. [Google Scholar] [CrossRef]
- Nepstad, D.; Lovett, P.; Irawan, S.; Watts, J.; Pezo Quevedo, D.A.; Somarriba, E.; Fernandes, E. Leveraging Agricultural Value Chains to Enhance Tropical Tree Cover and Slow Deforestation (Leaves): Synthesis Report; World Bank: Washington, DC, USA, 2019. [Google Scholar]
- Stabile, M.C.; Guimarães, A.L.; Silva, D.S.; Ribeiro, V.; Macedo, M.N.; Coe, M.T.; Alencar, A. Solving Brazil’s land use puzzle: Increasing production and slowing Amazon deforestation. Land Use Policy 2020, 91, 104362. [Google Scholar] [CrossRef]
- Koch, N.; zu Ermgassen, E.K.; Wehkamp, J.; Oliveira Filho, F.J.; Schwerhoff, G. Agricultural productivity and forest conservation: Evidence from the Brazilian Amazon. Am. J. Agric. Econ. 2019, 101, 919–940. [Google Scholar] [CrossRef] [Green Version]
- Verra. Methodologies. 2023. Available online: www.verra.org/methodologies-main (accessed on 5 February 2023).
- Pauly, M.; Tosteson, J. Safeguarding natural forests through the voluntary REDD+ scheme. Nat. Plants 2022, 8, 861–866. [Google Scholar] [CrossRef]
- Nepstad, D.; Soares-Filho, B.; Merry, F.; Moutinho, P.; Rodrigues, H.O.; Bowman, M.; Schwartzman, S.; Almeida, O.; Rivero, S. The Costs and Benefits of Reducing Carbon Emissions from Deforestation and Forest Degradation in the Brazilian Amazon; United Nations Framework Convention on Climate Change (UNFCCC): Bali, Indonesia; Woods Hole Research Center: Woods Hole, MA, USA, 2007. [Google Scholar]
- Börner, J.; Wunder, S. Paying for avoided deforestation in the Brazilian Amazon: From cost assessment to scheme design. Int. For. Rev. 2008, 10, 496–511. [Google Scholar] [CrossRef]
- Sandker, M.; Nyame, S.K.; Forster, J.; Collier, N.; Shepherd, G.; Yeboah, D.; Ezzine-de Blas, D.; Machwitz, M.; Vaatainen, S.; Garedew, E.; et al. REDD payments as incentive for reducing forest loss. Conserv. Lett. 2010, 3, 114–121. [Google Scholar] [CrossRef]
- Neuderta, R.; Olschofsky, K.; Küblerb, D.; Prillb, L.; Köhlb, M.; Wätzold, F. Opportunity costs of conserving a dry tropical forest under REDD+: The case of the spiny dry forest in southwestern Madagascar. For. Policy Econ. 2018, 95, 102–114. [Google Scholar] [CrossRef]
- Dos Santos, A.M.; da Silva, C.F.A.; de Almeida Junior, P.M.; Rudke, A.P.; de Melo, S.N. Deforestation drivers in the Brazilian Amazon: Assessing new spatial predictors. J. Environ. Manag. 2021, 294, 113020. [Google Scholar] [CrossRef]
- Jusys, T. Fundamental causes and spatial heterogeneity of deforestation in Legal Amazon. Appl. Geogr. 2016, 75, 188–199. [Google Scholar] [CrossRef]
- Assunção, J.; Gandour, C.; Rocha, R. Deforestation slowdown in the Brazilian Amazon: Prices or policies? Environ. Dev. Econ. 2015, 20, 697–722. [Google Scholar] [CrossRef] [Green Version]
- Soler, L.S.; Verburg, P.H.; Alves, D.S. Evolution of land use in the Brazilian Amazon: From frontier expansion to market chain dynamics. Land 2014, 3, 981–1014. [Google Scholar] [CrossRef] [Green Version]
- Walker, N.F.; Patel, S.A.; Kalif, K.A. From Amazon pasture to the high street: Deforestation and the Brazilian cattle product supply chain. Trop. Conserv. Sci. 2013, 6, 446–467. [Google Scholar] [CrossRef] [Green Version]
- Ometto, J.P.; Aguiar, A.P.D.; Martinelli, L.A. Amazon deforestation in Brazil: Effects, drivers and challenges. Carbon Manag. 2011, 2, 575–585. [Google Scholar] [CrossRef]
- Barona, E.; Ramankutty, N.; Hyman, G.; Coomes, O.T. The role of pasture and soybean in deforestation of the Brazilian Amazon. Environ. Res. Lett. 2010, 5, 024002. [Google Scholar] [CrossRef]
- Mammadova, A.; Behagel, J.; Masiero, M.; Pettenella, D. Deforestation as a Systemic Risk: The Case of Brazilian Bovine Leather. Forests 2022, 13, 233. [Google Scholar] [CrossRef]
- Arias-Gaviria, J.; Suarez, C.F.; Marrero-Trujillo, V. Drivers and effects of deforestation in Colombia: A systems thinking approach. Reg. Environ. Chang. 2021, 21, 1–14. [Google Scholar] [CrossRef]
- Olabisi, L.S. The system dynamics of forest cover in the developing world: Researcher versus community perspectives. Sustainability 2010, 2, 1523–1535. [Google Scholar] [CrossRef] [Green Version]
- Lim, C.L.; Prescott, G.W.; De Alban, J.D.T.; Ziegler, A.D.; Webb, E.L. Untangling the proximate causes and underlying drivers of deforestation and forest degradation in Myanmar. Conserv. Biol. 2017, 31, 1362–1372. [Google Scholar] [CrossRef] [Green Version]
- Musi, C.; Anggoro, S.; Sunarsih, S. System dynamic modelling and simulation for cultivation of forest land: Case study Perum Perhutani, Central Java, INDONESIA. J. Ecol. Eng. 2017, 18, 25–34. [Google Scholar] [CrossRef]
- Yurike, Y.; Elmhirst, R.; Karimi, S.; Febriamans, R. Deforestation in Dharmasraya District, West Sumatra, Indonesia A Causal Loop Diagrams (CLD) Model. Asian J. Sci. Res. 2018, 11, 177–184. [Google Scholar]
- Zhang, C.; Feng, Z.; Ren, Q.; Hsu, W.L. Using systems thinking and modelling: Ecological land utilisation efficiency in the Yangtze Delta in China. Systems 2022, 10, 16. [Google Scholar] [CrossRef]
- West, T.A.; Grogan, K.A.; Swisher, M.E.; Caviglia-Harris, J.L.; Sills, E.O.; Roberts, D.A.; Putz, F.E. Impacts of REDD+ payments on a coupled human-natural system in Amazonia. Ecosyst. Serv. 2018, 33, 68–76. [Google Scholar] [CrossRef]
- Wehkamp, J.; Aquino, A.; Fuss, S.; Reed, E.W. Analyzing the perception of deforestation drivers by African policy makers in light of possible REDD+ policy responses. For. Policy Econ. 2015, 59, 7–18. [Google Scholar] [CrossRef]
- Amazonia 2030. Fatos da Amazônia 2021; Instituto Clima e Sociedade (ICS): Rio de Janeiro, Brazil, 2021. [Google Scholar]
- INPE. PRODES—Brazilian Amazon Forest Deforestation Monitoring through Satellite. 2023. Available online: http://terrabrasilis.dpi.inpe.br/app/dashboard/deforestation/biomes/legal_amazon/rates (accessed on 5 February 2023).
- Berryman, A.A. Population Systems: A General Introduction; Plenum Press: New York, NY, USA, 1981. [Google Scholar]
- Grant, W.E. Ecology and natural resource management: Reflections from a systems perspective. Ecol. Model. 1998, 108, 67–76. [Google Scholar] [CrossRef]
- Beck, M. Telling stories with models and making policy with stories: An exploration. Clim. Policy 2018, 18, 928–941. [Google Scholar] [CrossRef]
- Ackoff, R.L. OR: After the post mortem. Syst. Dyn. Rev. 2001, 17, 341–346. [Google Scholar] [CrossRef]
- Senge, P.M. The Fifth Discipline: The Art and Practice of the Learning Organization; Doubleday/Currency: New York, NY, USA, 2006. [Google Scholar]
- Hecht, S.; Norgaard, R.; Posio, E. The economics of cattle ranching in the eastern Amazon. Interciencia 1988, 13, 233–240. [Google Scholar]
- Piva, L.R.O. Plataforma Digital Integrada Para Dados de Biomassa e Carbono na Floresta Amazônica. Doctoral Dissertation, Forest Engineering, Universidade Federal do Paraná—UFPR, Curitiba, Brazil, 2021. [Google Scholar]
- Araujo, E.C.G.; Sanquetta, C.R.; Dalla Corte, A.P.; Pelissari, A.L.; Orso, G.A.; Silva, T.C. Global review and state-of-the-art of biomass and carbon stock in the Amazon. J. Environ. Manag. 2023, 331, 117251. [Google Scholar] [CrossRef] [PubMed]
- Fernandes, E.C.M.; Biot, Y.; Castilla, C.; Canto, A.D.C.; Matos, J.C.; Garcia, S.; Perin, R.; Wanderli, E. The impact of selective logging and forest conversion for subsistence agriculture and pastures on terrestrial nutrient dynamics in the Amazon. Ciência E Cult. 1997, 49, 34–47. [Google Scholar]
- Fernandes, E.C.M.; Wandelli, E.; Perin, R.; Garcia, S. Restoring Productivity to Degraded Pasture Lands in the Amazon through Agroforestry Practices. In Biological Approaches to Sustainable Soil Systems; Uphoff, N., Ball, A.S., Fernandes, E., Herren, H., Eds.; CRC/Taylor and Francis: Boca Raton, FL, USA, 2006; pp. 305–321. [Google Scholar]
- Cochrane, T.T.; Sanchez, P. Land Resources, Soils, and Their Management in the Amazon Region. In Agriculture and Land-use Research; Hecht, S., Ed.; Cali, CIAT: Amazonia, Brazil, 1982; pp. 137–209. [Google Scholar]
- Barros, H.S.; Fearnside, P.M. Soil carbon stock changes due to edge effects in central Amazon forest fragments. For. Ecol. Manag. 2016, 379, 30–36. [Google Scholar] [CrossRef] [Green Version]
- IBGE. Pesquisa Trimestral do Abate de Animais. Relatório: Indicadores IBGE, Estatística da Produção Pecuária, July–September 2022. 2023. Available online: www.ibge.gov.br/estatisticas/economicas/agricultura-e-pecuaria/9203-pesquisas-trimestrais-do-abate-de-animais.html (accessed on 5 February 2023).
- Farmnews. Preço do Boi Gordo. 2023. Available online: www.farmnews.com.br/mercado/boi-gordo-no-1-semestre (accessed on 5 February 2023).
- FAO. Global Forest Resources Assessment (FRA). Report Brazil. 2020. Available online: www.fao.org/3/ca9976en/ca9976en.pdf (accessed on 5 February 2023).
- CDP. Global Corporate Use of Carbon Pricing—Disclosures to Investors; CDP: New York, NY, USA, 2014. [Google Scholar]
- Cabral, E.; Luna, N. Carbon Credits: The multimillion dollar offshore scheme in the Peruvian Amazon. Paradise Papers (2017). 2017. Available online: https://paradisepapers.ojo-publico.com/investigacion/carbon-credits-the-multimillion-dollar-offshore-scheme-in-the-peruvian-amazon (accessed on 5 February 2023).
- Smallhorn-West, P.F.; Pressey, R.L. Why does conservation minimize opportunity costs? Conserv. Sci. Pract. 2022, 4, e12808. [Google Scholar] [CrossRef]
- Swallow, B.; van Noordwijk, M.; Dewi, S.; Murdiyarso, D.; White, D.; Gockowski, J.; Hyman, G.; Budidarsono, S.; Robiglio, V.; Meadu, V.; et al. Opportunities for Avoided Deforestation with Sustainable Benefits; ASB Partnership for the Tropical Forest Margins: Nairobi, Kenya, 2007; Volume 42. [Google Scholar]
- Adams, V.M.; Pressey, R.L.; Naidoo, R. Opportunity costs: Who really pays for conservation? Biol. Conserv. 2010, 143, 439–448. [Google Scholar] [CrossRef]
- Yang, H.; Li, X. Potential variation in opportunity cost estimates for REDD+ and its causes. For. Policy Econ. 2018, 95, 138–146. [Google Scholar] [CrossRef]
- de Figueiredo Silva, F.; Fulginiti, L.E.; Perrin, R.K. The Cost of Forest Preservation in the Brazilian Amazon. J. Agric. Resour. Econ. 2019, 44, 497–512. [Google Scholar]
- Macal, C.M. Model Verification and Validation. 2005. Available online: http://jtac.uchicago.edu/conferences/05/resources/V&V_macal_pres.pdf (accessed on 5 February 2023).
- Lookingbill, T.R.; Gardner, R.H.; Wainger, L.A.; Tague, C.L. Landscape Modeling. In Encyclopedia of Ecology; Jørgensen, S.E., Fath, B.D., Eds.; Elsevier: Oxford, UK, 2008. [Google Scholar]
- Merckx, T.; Pereira, H.M. Reshaping agri-environmental subsidies: From marginal farming to large-scale rewilding. Basic Appl. Ecol. 2015, 16, 95–103. [Google Scholar] [CrossRef] [Green Version]
- McGregor, M.J.; Rola-Rubzen, M.F.; Murray-Prior, R. Micro and macro-level approaches to modelling decision making. Agric. Syst. 2001, 69, 63–83. [Google Scholar] [CrossRef]
- Larocque, G.R. Ecological Data Analysis and Modelling: Forest Models. In Encyclopedia of Ecology, 2nd ed.; Fath, B.D., Ed.; Elsevier: Oxford, UK, 2019; Volume 2. [Google Scholar]
- Okida, D.T.S.; de Carvalho Júnior, O.A.; Ferreira de Carvalho, O.L.; Gomes, R.A.T.; Guimarães, R.F. Relationship between Land Property Security and Brazilian Amazon Deforestation in the Mato Grosso State during the Period 2013–2018. Sustainability 2021, 13, 2085. [Google Scholar] [CrossRef]
- Sanquetta, C.R.; Bastos, A.D.S.; Sanquetta, M.N.I.; do Rosário, P.H.C.K.; Dalla Corte, A.P.; Piva, L.R.O. Estoque de biomassa e carbono em pastagens cultivadas no norte de Rondônia. BIOFIX Sci. J. 2019, 5, 102–107. [Google Scholar] [CrossRef] [Green Version]
- Bastos, A.D.S.; Sanquetta, C.R.; Maniesi, V.; Sanquetta, M.N.I.; Corte, A.P.D. Amazon plinthosols: Carbon stocks and physical properties under different land uses. Ciência Florest. 2021, 31, 749–765. [Google Scholar] [CrossRef]
- Araujo, E.C.G.; Pelissari, A.L.; Dalla Corte, A.P.; Sanquetta, C.R. Carbon stock assessment and comparison in soybean plantations in Southwest Brazilian Amazon. Rev. Agro@ Mbiente On-line 2022, 16. [Google Scholar] [CrossRef]
- IBGE. População. 2022. Available online: www.ibge.gov.br/estatisticas/sociais/populacao.html (accessed on 18 December 2022).
- WWF. Living Planet Report 2022. 2022. Available online: https://livingplanet.panda.org (accessed on 18 December 2022).
- MMA—Ministério do Meio Ambiente. Plan for the Prevention and Control of Deforestation in the Legal Amazon (PPCDAm). 2023. Available online: http://redd.mma.gov.br/en/legal-and-public-policy-framework/ppcdam (accessed on 5 February 2023).
- Song, X.P.; Hansen, M.C.; Potapov, P.; Adusei, B.; Pickering, J.; Adami, M.; Tyukavina, A. Massive soybean expansion in South America since 2000 and implications for conservation. Nat. Sustain. 2021, 4, 784–792. [Google Scholar] [CrossRef]
- Camargo, P.B.; Trumbore, S.E.; Martinelli, L.A.; Davidson, E.A.; Nepstad, D.C.; Victoria, R.L. Soil carbon dynamics in regrowing forest of eastern Amazonia. Glob. Chang. Biol. 1999, 5, 693–702. [Google Scholar] [CrossRef]
- Houghton, R.A.; Skole, D.L.; Nobre, C.A.; Hackler, J.L.; Lawrence, K.T.; Chomentowski, W.H. Annual fluxes of carbon from deforestation and regrowth in the Brazilian Amazon. Nature 2000, 403, 301–304. [Google Scholar] [CrossRef]
- Feldpausch, T.R.; Rondon, M.A.; Fernandes, E.C.M.; Riha, S.J.; Wandelli, E. Carbon and nutrient accumulation in secondary forests regenerating on pastures in central Amazonia. Ecol. Appl. 2004, 14, S164–S176. [Google Scholar] [CrossRef] [Green Version]
- Styger, E.; Fernandes, E.C.M. Contributions of managed fallows to soil fertility recovery. In Biological Approaches to Sustainable Soil Systems; Uphoff, N., Ball, A.S., Fernandes, E., Herren, H., Eds.; CRC/Taylor and Francis: Boca Raton, FL, USA, 2006. [Google Scholar]
- MAPA—Ministério da Agricultura e Pecuária. Valor Bruto das Produção Agropecuária (VBP). 2022. Available online: www.gov.br/agricultura/pt-br/assuntos/noticias/valor-da-producao-agropecuaria-de-2022-esta-estimado-em-r-1-185-trilhao (accessed on 25 July 2023).
- Hayden, M.T.; Mattimoe, R.; Jack, L. Sensemaking and the influencing factors on farmer decision-making. J. Rural Stud. 2021, 84, 31–44. [Google Scholar] [CrossRef]
- FAO. Brazil—ENREDD+ National REDD+ Strategy. 2023. Available online: www.fao.org/faolex/results/details/en/c/LEX-FAOC172762 (accessed on 6 June 2023).
- Torres, B.; Eche, D.; Torres, Y.; Bravo, C.; Velasco, C.; García, A. Identification and Assessment of Livestock Best Management Practices (BMPs) Using the REDD+ Approach in the Ecuadorian Amazon. Agronomy 2021, 11, 1336. [Google Scholar] [CrossRef]
- Zuluaga, A.; Etter, A.; Nepstad, D.; Chará, J.; Stickler, C.; Warren, M. Colombia’s pathway to a more sustainable cattle sector: A spatial multi-criteria analysis. Land Use Policy 2021, 109, 105596. [Google Scholar] [CrossRef]
- Weatherley-Singh, J.; Gupta, A. Drivers of deforestation and REDD+ benefit-sharing: A meta-analysis of the (missing) link. Environ. Sci. Policy 2015, 54, 97–105. [Google Scholar] [CrossRef]
- Pressey, R.L.; Visconti, P.; McKinnon, M.C.; Gurney, G.G.; Barnes, M.D.; Glew, L.; Maron, M. The mismeasure of conservation. Trends Ecol. Evol. 2021, 36, 808–821. [Google Scholar] [CrossRef] [PubMed]
- IPEA Instituto de Pesquisa Econômica Aplicada. Exchange Rate—R$/US$ (Annual Average). 2023. Available online: www.ipeadata.gov.br/ExibeSerie.aspx?serid=31924 (accessed on 26 July 2023).


| Sources of Income | Ranching Income 1 | ||||
|---|---|---|---|---|---|
| USD 0 | USD 30 | USD 40 | USD 50 | ||
| REDD+ income 2 | $0.0 | 0.0 | 13.0 | 19.4 | 25.9 |
| $1.0 | 8.7 | 21.6 | 28.1 | 34.6 | |
| $2.5 | 21.7 | 34.6 | 41.1 | 47.6 | |
| $5.0 | 43.4 | 56.3 | 62.8 | 69.3 | |
Disclaimer/Publisher’s Note: The statements, opinions and data contained in all publications are solely those of the individual author(s) and contributor(s) and not of MDPI and/or the editor(s). MDPI and/or the editor(s) disclaim responsibility for any injury to people or property resulting from any ideas, methods, instructions or products referred to in the content. |
© 2023 by the authors. Licensee MDPI, Basel, Switzerland. This article is an open access article distributed under the terms and conditions of the Creative Commons Attribution (CC BY) license (https://creativecommons.org/licenses/by/4.0/).
Share and Cite
Brasil, A.A.; Angelo, H.; de Almeida, A.N.; Matricardi, E.A.T.; Chaves, H.M.L.; de Paula, M.F. Modeling the Impacts of Soil Management on Avoided Deforestation and REDD+ Payments in the Brazilian Amazon: A Systems Approach. Sustainability 2023, 15, 12099. https://doi.org/10.3390/su151512099
Brasil AA, Angelo H, de Almeida AN, Matricardi EAT, Chaves HML, de Paula MF. Modeling the Impacts of Soil Management on Avoided Deforestation and REDD+ Payments in the Brazilian Amazon: A Systems Approach. Sustainability. 2023; 15(15):12099. https://doi.org/10.3390/su151512099
Chicago/Turabian StyleBrasil, Alexandre Anders, Humberto Angelo, Alexandre Nascimento de Almeida, Eraldo Aparecido Trondoli Matricardi, Henrique Marinho Leite Chaves, and Maristela Franchetti de Paula. 2023. "Modeling the Impacts of Soil Management on Avoided Deforestation and REDD+ Payments in the Brazilian Amazon: A Systems Approach" Sustainability 15, no. 15: 12099. https://doi.org/10.3390/su151512099