Abstract
The main reason for this research is to support the Korean government building retrofitting program initiated to evaluate energy usage trends, propose energy-saving technologies, and focus on reducing the energy demand in residential buildings through energy efficiency improvement. This is achieved by assessing the energy saved after introducing a simple retrofitting measure to an existing residential building. The energy savings in the building were realized after collecting relevant data from the house occupants, analyzing electricity bills, and introducing energy conservation measures (ECMS), leading to an improvement in the energy performance of the building. The building envelope saved 2098 kWh and 6307 kWh of energy via the heating and cooling equipment with an initial incremental cost of USD 500, fuel cost savings of USD 306, and a simple payback of 1.6 years. The analysis takes the occupants 2.6 years to recoup the initial cost of USD 2400 invested with an electricity savings of 2144 kWh. Also, 3.3 tons of CO2 emissions per year were reduced, equivalent to 3.3 people reducing energy use by 20%. Finally, the actual and simulated data are almost the same for the consumption period, with only a slight difference in October and December, given 0.92 as the Pearson Correlation coefficients.
1. Introduction
The building sector is one of the sectors with the highest greenhouse gas emissions due to its high-energy consumption rate [1]. One-third of the harmful gas emissions worldwide are caused by the energy used in buildings [2] because buildings consume around 40% of the world’s total energy consumption [3]. Energy use in high-density cities accounts for a significant proportion of urban greenhouse gases (GHG) [4,5,6]. The residential sector is considered the second-largest consumer of Energy in Asia, with about 25% of the total energy consumed in South Korea coming from buildings [7]. Since the building sector is highly energy-intensive [3], methods to decrease greenhouse gas emissions by increasing building energy efficiency are critical issues that play a prominent role in energy saving and sustainability. It is paramount that the energy used by buildings is duly optimized [8] to achieve energy savings after building retrofits [9] via the adoption of Energy Efficiency Measures (EEMs), which decrease the amount of energy needed while providing the same level of comfort. To increase the building energy performance by reducing the energy consumption in residential buildings, energy-efficient materials, efficient Heating, Ventilation, and Air Conditioning (HVAC) devices, Light Emitting Diode (LED) lighting systems, Building Management Systems (BMSs), and solar photovoltaic are to be incorporated into the building during building retrofits [10,11].
An essential component of a successful retrofit project is using verified methods and tools such as energy audits, energy monitoring systems, infrared thermography, and blower doors to measure energy efficiency. Among these, the energy audit is an essential process that guides auditors in obtaining comprehensive knowledge of a building’s energy consumption profile and provides practical and systematic approaches to identify efficient energy usage and potential savings [1]. Through cost–benefit analyses and detailed reports, the energy audit assists in identifying and quantifying energy-saving opportunities, assessing the energy performance and carbon footprint of existing buildings, and evaluating the applicability of new energy-efficient technologies [11,12]. The audit process typically consists of four subgroups: walk-through assessment, survey, retrofitting, and data collection for controlling purposes. It is crucial to note that while an energy audit does not directly result in energy savings [13], it plays a crucial role in establishing areas that require improvement and uncovering opportunities for energy conservation, as well as assessing the applicability of new energy-efficient technologies [9]. Thus, selecting suitable Energy Efficiency Measures (EEMs) tailored to specific retrofitting cases becomes essential to optimize the retrofit process by considering energy and cost impacts.
Many researchers have demonstrated that energy efficiency measures in building retrofits can substantially reduce building energy use after energy audits [4]. Khalilnejad et al. [14] conducted virtual energy audits using a non-intrusive and automated method for buildings’ time-series smart-meter data. Mauriello et al. [15] evaluated a building via a one-week, in-home field study in five homes and a semi-structured interview with professional energy auditors. They used a temporal thermographic sensor system to analyze building envelope performance quantitatively. Woo and Moore [16] demonstrated a building energy audit process in a high-density multi-residential modular development in Melbourne, Australia, collecting extensive data on indoor air quality, occupant feedback, and utility usage. The analysis involved pre-survey, walk-through inspection, data collection, and formulation of energy efficiency solutions without software. Kerimray et al. [17] integrated a detailed building stock module into Kazakhstan’s 16-region TIMES energy systems model using statistical data and building energy audit reports. They found networked gas and district heating economically viable substitutes for coal in rural areas and flats, respectively, even with clean technology subsidies. These studies highlight the effectiveness of energy audits in identifying inefficiencies and proposing retrofit solutions.
Efforts are needed to gather reliable data on building energy performance and compare it across different locations and building types to advance energy efficiency practices. The energy consumption of Nigerian buildings remains uncertain. Mambo and Kebe [18] conducted an energy audit of 105 buildings in Nigeria. They identified prevalent issues such as using energy-inefficient products, inadequate daylighting utilization, the absence of building energy management systems, the low adoption of renewable energy systems, and the poor consideration of bioclimatic factors in building orientation. It is important to note that the objectives of improving buildings’ energy efficiency will result in (a) less energy consumption while still maintaining occupants’ comfort level, (b) saving energy and money, and (c) minimizing harmful emissions. However, focusing on constructing high-rise residential buildings in Korean metropolitan cities has led to neglecting energy retrofitting in existing residential buildings [19].
Improving the energy performance of old residential buildings in Korea is imperative to address their high energy consumption, resulting in high utility costs and inadequate indoor comfort. With buildings accounting for 56% of Seoul’s total energy and 87% of the city’s electricity consumption [19], the Korean government initiated the Building Retrofit Program (BRP) in 2008 to reduce greenhouse gas emissions by 40% by 2030. The program enhances energy efficiency by installing new or retrofitting existing equipment, insulation improvements, heating and cooling enhancements, and lighting upgrades. This research supports the government’s initiative by evaluating energy usage trends, proposing cost-effective energy-saving measures, and reducing residential building energy demand through efficiency improvements. This study involves data analysis from occupants, examining electricity bills, and implementing energy conservation measures (ECMs) to enhance building energy performance from 50 low-rise residential buildings. This research introduces a novel approach utilizing RETScreen software for auditing low-rise residential buildings to identify energy efficiency measures, assess energy savings potential, and quantify CO2 emission reductions. This approach is the first in the region, offering valuable insights for energy audits and mitigation strategies in the residential sector.
2. Literature on Building Retrofitting Measures
Green buildings and architecture are necessary for sustainable building development [20]. Buildings are responsible for global high-energy consumption and carbon emissions [21]. Retrofitting measures mitigate the effect of climate change on buildings by improving their energy performance at beneficial cost-effectiveness [22]. The most critical aspect of retrofitting is structural refurbishment, which aids in added strength, stability, and safety [23]. Although retrofitting existing buildings offers significant opportunities to reduce global energy use and greenhouse gas emissions [24], an insight into the applicable building retrofit measures within a climate zone will guide the optimization framework to attaining sustainability in architecture and the built environment [22]. Retrofitting measures are essential for reducing energy consumption in residential and commercial buildings and cooling and heating requirements in hot and cold climates [25]. Many researchers in the past have worked on different retrofitting measures to improve the energy efficiency of buildings [26,27,28,29,30,31].
In 2021, Rabani et al. [32] studied optimizing energy use and improving building thermal and visual comfort conditions. They employed an optimization method that allowed for the simultaneous optimization of various aspects, such as the building envelope, energy supply, fenestration, shading devices, and control methods. Qu et al. [33] examined three types of passive interior retrofits, namely internal wall insulation, glazing upgrade, and airtightness improvement, for a historic building renovation. Their evaluation considered energy-saving potential, affordability, and thermal comfort performance and proposed five assessment indicators, including energy reduction rate and specific initial cost. Fina et al. [34] investigated the profitability of implementing active and passive retrofitting measures in buildings in 2021. They developed an optimization model to quantify the impact of renovation measures on the heat load. Their findings revealed that the profitability of passive retrofitting measures, specifically building envelope renovation, depends significantly on additional costs associated with CO2 emissions and the default heating system.
Furthermore, Shirazi and Ashuri [35] explored retrofitting measures to enhance the operational energy consumption of different building categories in the United States (U.S.) in 2020. They assessed the embodied impacts associated with these measures and compared their environmental efficiency. The study identified that retrofitting residential buildings, mainly through attic/knee insulation and HVAC unit replacement, had the highest environmental impacts. This underscored the significant environmental effects of retrofitting foundation wall insulation and upgrading windows in dwellings constructed before the 1970s.
In a study by Pallonetto et al. [36], the energy savings achieved via retrofitting measures on Irish residential buildings were investigated. By progressively retrofitting detached dwellings to become all electric, energy savings of up to 45% and CO2 reductions of approximately 29% were achieved compared to the pre-retrofitted buildings. Andrade-Cabrera et al. [37], in 2017, developed an automated calibration methodology for retrofitted buildings using parametric Energy Conservation Measures (ECMs) functions. Through Particle Swarm Optimization, retrofit functions were calibrated based on a baseline model representative of the building before the retrofit. The analysis demonstrated that the proposed methodology could effectively calibrate retrofitted building models with acceptable accuracy, generating lumped parameter building models with similar dynamics for different ECMs across various building energy models. In another study by Pallonetto et al. [38], conducted in 2016, the impact of building retrofit measures on the carbon footprint of dwellings was examined using EnergyPlus. The retrofit measures resulted in an overall reduction in carbon footprint from 43.3 to 30.8 kg/m2 CO2, considering a pre-retrofitted dwelling as the baseline. The case study accounted for a mix of energy supply sources, including fossil fuel for space heating, electricity for household equipment, and conventional gasoline cars for transportation.
The reviewed literature presents various methodologies to optimize energy utilization, improve thermal and visual comfort, and evaluate the environmental implications of retrofitting measures. Additionally, these studies emphasize the importance of carefully considering specific retrofitting options, such as building envelope refurbishment, attic/knee insulation, and HVAC unit replacement, to achieve substantial energy savings and mitigate CO2 emissions. Moreover, the literature review underscores the necessity of reliable data on building energy performance and highlights the potential efficacy of automated calibration methodologies for retrofitting building models. The findings from this review offer valuable insights that guide our current research, which is dedicated to supporting the Korean government’s Building Retrofit Program. The primary objective of this study is to assess energy usage trends and propose cost-effective energy-saving measures in low-rise residential buildings, utilizing the RETScreen software for energy audits and mitigation strategies. Consequently, this research seeks to advance energy efficiency practices and promote sustainability in the built environment, thereby addressing the challenges associated with elevated energy consumption and inadequate indoor comfort in existing residential structures within Korea.
3. Materials and Methods
Building energy audit is a significant activity in effectively controlling energy consumption leading to cost savings in a building. Energy auditing involves a comprehensive building energy efficiency assessment, including feasibility analyses and suggestions for suitable measures. After introducing a simple retrofitting step, this study evaluates the total energy saved in an old residential apartment in Korea. This was conducted by considering cost-effective approaches to minimize energy use in the building and improve the occupant’s comfort.
3.1. Selection of the Study Area
A voluntary sample survey was conducted in 2020 for 50 buildings in Buk District, Daegu, Korea. This was performed to analyze low-rise residential apartments’ energy performance and users’ behavior. The sample size was insignificant because of COVID-19, which limits interaction leading to social distancing in Korea. Hence, only 50 households voluntarily participated in the survey because of their strong interest in the research. The choice to survey 50 buildings was made to avoid research bias that could arise from selecting only one building as a representative sample. Figure 1 shows the location of the survey site. The past year’s electricity bills were collected from each household and analyzed. This was carried out to quantify the building’s energy use and performance. The survey included questions related to the building type, building age, characteristics, electrical equipment, lighting equipment, and building HVAC, as shown in Table 1. The data collected determined the occupancy rate, schedule, window-to-wall ratio, heating and cooling setpoint, and building envelope performance.
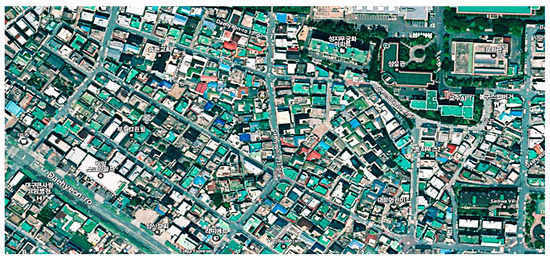
Figure 1.
The satellite image of the location.

Table 1.
Categorization of the survey contents [39].
From the information obtained from the occupant, 52% of the buildings are above 80 m2 in area. Furthermore, 38% have an area between 60 and 80 m2, while the remaining 10% have areas between 50 and 60 m2. In addition, from the orientation of 50 buildings obtained, 57% were southwest facing, and the remaining 43% were either southeast or south facing. Also, 80% of the buildings surveyed were built in the 1980s, while 20% were constructed in the 1990s. The information on the building year collected via the questionnaire was used to calculate the walls’ U-value. The U-value was determined based on the adjustment in the policy of the thermal conductivity of walls in Korea, as shown in Table 2. This was carried out to estimate the building’s energy performance.
Table 2.
Korean thermal properties of walls between 1980 and 2000.
Out of the 50 low-rise residential buildings surveyed, 78% of the households had single-glazed windows, and 22% had double-glazed windows. The window’s thermal transmittance was calculated according to the criteria highlighted for the building envelope in Korea, as shown in Table 3. The heating set temperature, cooling set temperature, equipment, and cooling/heating schedule were obtained and recorded. This was carried out by counting the number of equipment, operating hours, and duty cycles of each gadget. Furthermore, the electricity consumption of each household was calculated from the information obtained.
Table 3.
The U-values of the Korean building envelope [39].
For the lighting, the number of lights, operating time, and duty cycles were changed into consumption schedule (hour/day), lighting power (W), and light load per area (W/m2), respectively. In addition, from the set heating and cooling temperature information obtained for both occupied and unoccupied periods, 65% of the building residents set their space heating and cooling temperature at 20 °C and 22 °C for both actual and scheduled when the building is occupied. The remaining 35% were set between 16 °C and 18 °C for the unoccupied period. Moreover, 60% of the house occupants set the space heating and space cooling temperature at 22 °C and 25 °C, respectively, for both actual and scheduled. Furthermore, from the monthly distribution for the electricity consumption of the fifty buildings shown in Figure 2, building 22 has the highest annual electricity consumption, followed by building 13. Hence, building 22 is used as a referenced building for the retrofitting measure to analyze the building’s energy performance. This provided the necessary results to benchmark the selected facilities’ energy performance.
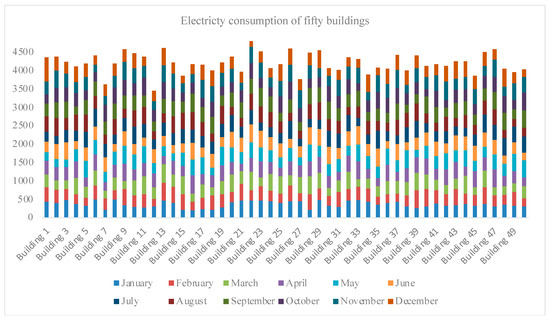
Figure 2.
Monthly actual electricity consumption for fifty buildings.
3.2. Referenced Building Information
The referenced residential building considered for this analysis is located in the Buk-gu District of Daegu City, South Korea. It is a low-rise residential structure built in 1982, encompassing an area of 88 m2 and comprising three bedrooms, a living room, a kitchen, and a bathroom. Detailed information about the building’s heating and cooling equipment was obtained, including the monthly electricity expenditure in USD/kWh. The temperature settings for space heating and cooling were recorded during occupied and unoccupied periods, and the heating/cooling changeover temperature was. Occupancy rates were also documented for scheduled and unscheduled times, as shown in Table 4. During scheduled hours, the occupied building was heated to keep the temperature from going above 20 °C for the space heating during the winter season. It was cooled to keep the temperature from rising above 25 °C for space cooling during the summer. Unoccupied periods were regulated for optimal energy conservation, with the temperature set at 15 °C for space heating during winter and 0 °C for space cooling during summer when the air conditioner was turned off.
Table 4.
Korean thermal properties of walls between 1980 and 2000.
Furthermore, data was collected regarding the lighting and electrical equipment used in the residential apartment, including quantities, operating hours, power ratings, and duty cycles. Information on hot water usage was also gathered, including daily water consumption, temperature, occupancy rates, and operating hours. Additionally, details on the building’s infiltration method, volume, and air change rate were recorded. In January 2020, a simple retrofitting measure was implemented in the building, and the energy performance was evaluated using Measurement and Verification (M&V). The decision to analyze the energy performance was prompted by the occupants’ realization that the electricity consumption between October 2018 and December 2019 was significantly higher than the benchmarked electricity usage in Daegu, Korea, during the same period. Finally, RETScreen Expert software was utilized to calculate energy savings resulting from the retrofit, fuel cost savings, payback period, and greenhouse gas (GHG) emissions.
3.3. Data Analysis
The four years of electricity data used for this analysis was obtained from the Korean Electric Power Cooperation (KEPCO) under the authority of the building occupants. After collecting all relevant information from the building occupants, the electricity data were prepared in an Excel sheet. This was later imported into the software using the performance analysis capability of the software. The first analysis of the building was conducted in January 2022, where the electricity data for the years 2018 and 2019 were analyzed using the software. This was carried out to assess the year the occupant consumed more energy and usage. After that, the software’s simulation capability introduced an energy audit that included a simple retrofitting measure into the building. The energy saved from the building, the fuel cost savings, the simple payback period, and GHG emission reduction by carrying out the measures were analyzed. Finally, the electricity data for 2020 to 2021 was imported into the software to ascertain that the effort introduced into the building yielded actual energy savings.
3.4. Data Validation
A real-time energy monitoring system was implemented in the reference building to validate the results obtained from the software. This involved installing a smart meter at the end-use of selected home appliances to record real-time energy consumption. The smart meter, a real-time monitoring device (RTMD), is a cost-effective solution for collecting accurate meter data based on actual consumption. The data collected from the meter were sent to the computer and later retrieved by downloading the data into a Microsoft Excel sheet. Data collection using the RTMD spanned a period of one year, from January 2021 to December 2021. The data obtained are then used to develop metrics to display and quantify the real effects of comprehensive energy upgrades by comparing them with the electrical bills of the same year obtained from the occupants. This method was employed because it allows the occupants to know the actual energy consumed from each appliance and the amount spent. The analysis employed the correlation coefficient, as expressed in the Equation below.
The Pearson correlation coefficient is a statistical measure to assess the linear association between two variables. Its values range from −1 to 1, where −1 indicates a perfect negative correlation, 0 indicates no correlation, and 1 indicates a perfect positive correlation. In Equation (1), x and y denote sets of data points, while n represents the number of data points in those sets. Σxy is the sum of the products of corresponding values in x and y, while Σx and Σy represent the sums of values in x and y, respectively. The sums of the squared values of x and y are obtained by squaring each value and summing them up. The denominator of the formula represents the product of the standard deviations of x and y, reflecting their variability. The numerator, nΣxy − ΣxΣy, signifies the covariance between x and y. The Pearson correlation coefficient is widely employed in statistical analysis to determine the strength and direction of the relationship between two variables.
4. Results and Discussion
In South Korea, the total electricity consumption in 2018 reached 545 TWh, a 34% increase compared to 2008 [40]. Specifically, residential electricity consumption experienced a 20% growth from 56 TWh to 68 TWh during the same period. Data from KEPCO indicates that the average electricity consumption per household in Daegu metropolitan city for 2018, 2019, and 2020 was 240 kWh, 233 kWh, and 241 kWh, respectively [41]. Analyzing the electricity consumption of the reference building in 2019 using RETScreen software revealed that it deviated significantly from the benchmark set by average residential buildings in Daegu, as shown in Figure 3. Notably, the highest electricity consumption occurred in December, with monthly consumption of 600 kWh, followed by January, with 441 kWh, as depicted in Figure 4. This energy performance abnormality suggests irregularity in the building’s electricity consumption patterns. In Korea, electricity is typically used for space cooling during the summer months (June to August), while gas is commonly used for space heating during winter. Therefore, when space heating is needed, the reference building’s higher consumption during the winter indicates an anomaly in its energy performance.
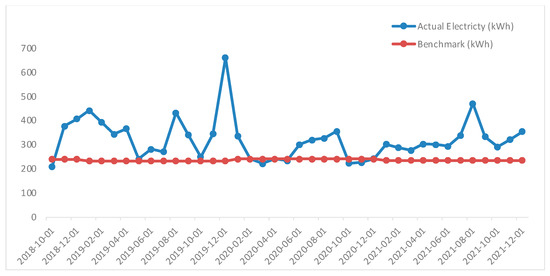
Figure 3.
Monthly actual electricity and benchmark consumption for the whole data.
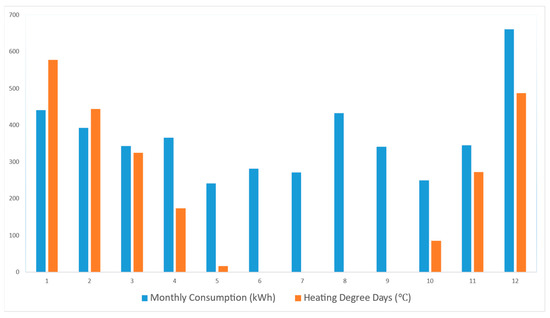
Figure 4.
Monthly electricity usage and heating degree days for 2019.
4.1. Regression Analysis before the Measures
The regression analysis of the complete data established the correlation connecting the heating degree days (HDD) and electricity consumed in the building, as shown in the time-series graph in Figure 5. The HDD is an estimation outline to assess the demand for energy needed to heat a building during summer, which did not follow the same pattern as the consumption. It is worth noting that the heating requirements for a specific building at a particular place are directly proportional to the number of HDDs at that location. However, from the time-series graph, the HDD in the facility location went down in the last quarter of 2019, and invariably the energy consumed in the building went up, citing an abnormality in the energy performance in the building. In addition, the line graph of the actual electricity consumed using the regression analysis agrees with the baseline predicted until December 2019, when the actual electricity consumed skyrocketed more than predicted, as given in Figure 6. This is shown in Figure 7, where the cumulative sum graph (CUSUM) changed direction in December 2019. The CUSUM graph of the building energy consumption has two equal parts with opposites slopes. The first part of the graph on the left indicates that the energy consumed in the referenced building is more than the baseline predicted by the system. Hence, the slope is positive because the system is under-predicted.
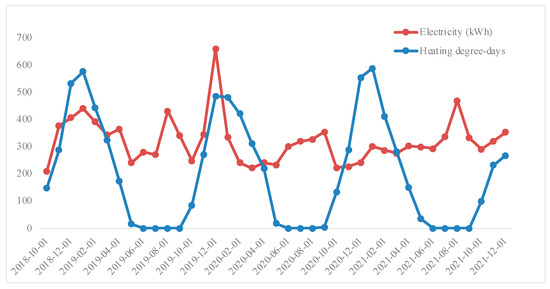
Figure 5.
Times series graph for electricity usage and heating degree days before retrofits.
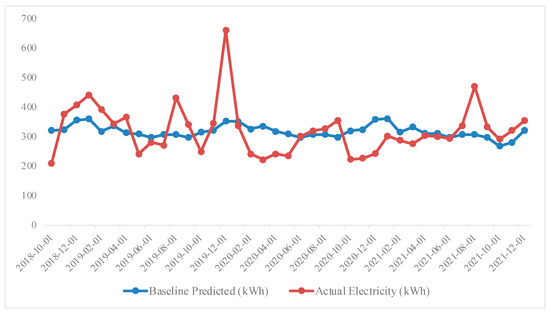
Figure 6.
Line graph of the actual electricity consumed to the baseline predicted before retrofits.
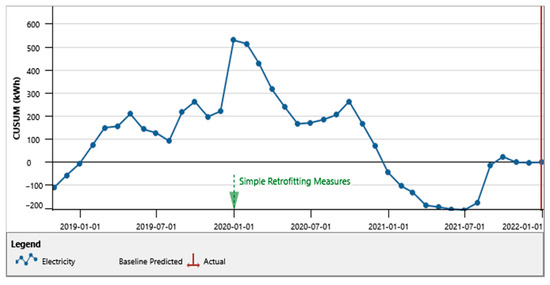
Figure 7.
CUSUM of the total electricity consumed by the building before retrofits.
On the contrary, the graph on the right side indicates that the energy consumed in the building is less than the baseline predicted. This means that the system over-predicted, making the slope to be negative. For a building to conserve energy, the actual energy consumed should be less than the baseline predicted. However, the opposite was the case for the first part of the graph in Figure 7 because it indicates that the building consumed more energy in 2019, with the highest consumption in December. This means that the system is under-predicted, making the slope positive. It should be noted that the slope of the graph changed at a reference year, which took place in January 2020. This was when the occupants introduced some retrofitting measures into the building.
4.2. Regression Analysis before the Measures
Retrofitting is carried out to improve the energy performance of buildings because they provide comfort without compromising functional needs [42]. These needs include but are not limited to thermal, visual, and acoustic. In January 2020, the reference building underwent retrofitting by implementing simple energy conservation measures (ECMs). The retrofit included changing the heating and cooling systems and four minor retrofitting measures on the lighting, equipment, hot water, and building envelope. In Table 5, the simulation model considered level 1 of the light pane, as the retrofitting measures for lighting were relatively minor compared to level 2. Data regarding floor area, lighting load per unit area, and operating hours were collected for the base case.
Table 5.
The base case and the proposed case for the building light.
In contrast, information for the proposed case was added to achieve desired energy savings. The proposed measure involved requesting occupants to reduce the operating hours of lighting from 50 h per week to 40 h per week. The reduction was ensured through effective occupancy monitoring and raising awareness about energy conservation benefits resulting in 20% energy savings for the building, corresponding to the conservation of 1377 kWh of electricity.
For the electrical equipment, six pieces of equipment were proposed to the occupant for a behavioral change in the building. This was ensured through effective occupancy monitoring and raising awareness about energy conservation benefits. The television operating hours of 28 h per week and duty cycle of 100%, having a power rating of 120 Watts were reduced to 21 h per week and 75%, respectively. In addition, different measures were taken, such as refrigerator, computer, iron, microwave oven, and bread toaster, as shown in Table 6. The standard introduced saved 767 kWh of electricity consumed in the building by the equipment, equivalent to 42% of the total energy saved.
Table 6.
The base case and the proposed case for the electrical equipment in the building.
Furthermore, the boiler used in the building was changed from an inefficient boiler to a more efficient heating system having a seasonal efficiency of 80% with an initial incremental cost of USD 1500. The boiler change saved an estimated 1202 kWh of energy after adjusting the hot water temperature from 60 °C to 55 °C and reducing the operating hours from 12 to 8 h per day shown in Table 7. This was achieved after estimating the occupancy rate and the daily hot water consumed by the occupants.
Table 7.
The base case and the proposed case for the hot water usage in the building.
Also, the cooling system in the building was changed, replacing it with an energy-efficient air conditioner featuring a coefficient of performance (COP) of 4. This modification incurred an initial additional cost of USD 400. The selected air conditioner operates in an energy-conserving manner by automatically shutting off the compressor and fan once the desired temperature is reached. It is an energy-efficient model with a smart thermostat for remote control, multi-stage cooling, and advanced air purification technology. The AC also features a sleep mode, eco-friendly refrigerant, quiet operation, and an energy usage monitoring system for optimizing electricity consumption.
Significant energy savings were achieved by reducing the air change rate to 0.9 air changes per hour (ac/h) through caulking measures around the door and window frames to eliminate gaps and cracks. Table 8 details the energy saved, with a total of 6005 kWh conserved. Considering the building’s status as an older residential structure, a recommended air change rate of 0.9 ac/h was suggested, corresponding to the fresh air volume’s introduction into the building [43]. This rate equates to 634 cubic meters of natural air infiltration per hour. The comprehensive caulking and air leakage prevention measures involved an initial additional cost of USD 500 but resulted in substantial energy savings of 52.8%.
Table 8.
The base case and the proposed case for the natural air infiltration in the building.
Implementing retrofitting measures involved changes to the building envelope played a crucial role in reducing energy consumption and enhancing energy efficiency. Specifically, the retrofitting addressed issues like cracks and gaps in windows and doors that negatively affected natural air infiltration. Materials such as window veils, caulking guns, and sealants were utilized to address these concerns, resulting in a total cost of USD 500, including labor. In context, the initial investment for upgrading the air conditioner was USD 400, and an additional USD 500 was allocated for the building envelope retrofitting. As mentioned, these investments were essential to significantly improve the building’s energy performance, leading to substantial energy savings and reduced greenhouse gas emissions. Through these combined efforts, the building now operates with enhanced energy efficiency, ensuring a greener and more sustainable future.
Implementing the simple retrofitting measures significantly reduced energy consumption, as indicated in Table 9. The building envelope retrofitting saved 2098 kWh in heating equipment and 6307 kWh in cooling equipment, incurring an initial additional cost of USD 500. This led to fuel cost savings of USD 306 and a payback period of 1.6 years. The fuel cost savings for the heating and cooling equipment were USD 234 and USD 101, respectively, with 6.4 years and 4 years of payback periods. The occupants took 2.6 years to recover the total initial investment of USD 2400 in retrofitting measures, resulting in a total electricity savings of 2144 kWh.
Table 9.
The included measure table for the overall retrofitting measures.
Furthermore, the analysis included calculating the annual gross reduction in greenhouse gas (GHG) emissions and comparing the base case and proposed case systems. Before implementing any measures, the building emitted 8.8 tons of CO2 per year. After retrofitting, the emissions were reduced to 5.5 tons of CO2 per year, resulting in a gross annual reduction of 3.3 tons of CO2 emissions. This reduction is equivalent to the energy savings achieved by 3.3 individuals reducing their energy consumption by 20%. Figure 8 provides a visual representation of these emissions reductions.
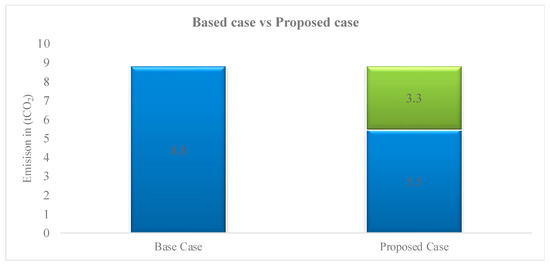
Figure 8.
The gross annual GHG emission reduction chart of the RETScreen.
4.3. Regression Analysis before the Measures
It is a fact that old residential buildings in Korea were built without proper energy measures [19]. Most buildings were designed with little consideration of energy efficiency measures [44,45]. Understanding a building’s energy use is essential to collecting data and analyzing electricity bills [46]. This is followed by considering the building envelope, heating, cooling, ventilation, lighting, and electronic equipment when sourcing ways to reduce energy consumption [47,48]. Since the energy saved in a building cannot be measured directly because it represents the absence of energy consumption. A baseline period was set to establish the relationship between energy consumption and factors influencing consumption. The relationship was used to estimate energy consumption. The predicted values were compared to the actual energy consumption in the building after implementing the ECM with the difference given the energy savings. To calculate the energy saved after the measure, the electricity bills for 2020 and 2021 were collected from the occupants to run the analysis. As shown below in Figure 9, the building consumed less energy than predicted after undergoing simple retrofitting measures. This is due to the change in the system because of a change in the slope of the graph.
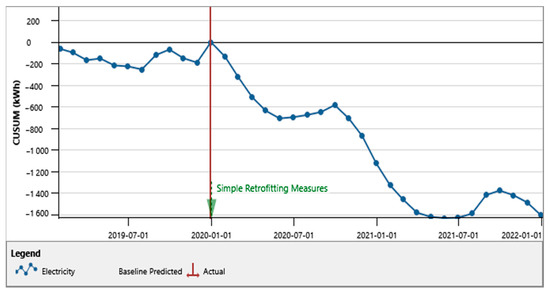
Figure 9.
CUSUM of the total electricity consumed by the building after retrofits.
A cumulative sum (CUSUM) is a difference between the actual electricity consumed in the building and the electricity predicted by the system for each period. It represents all the reduction in the energy consumed by the building compared to what the building would have consumed if it acted according to the baseline amount. It should be noted that the cumulative sum is zero at the end of the baseline period, where the chart’s slope starts to go down. Hence, when the differences are added together, it creates a running total known as the cumulative total savings of the electricity consumed in the building.
According to [19], the Measurement and Verification analysis (M&V) is the process of planning, measuring, collecting, and analyzing data to verify and report energy savings within an individual facility resulting from implementing ECMs. Through the Measurement and Verification analysis (M&V), as shown in Figure 10, the actual net savings recorded from the building is 1604 kWh. This is 25% (540 kWh) less than the actual electricity savings obtained during the measures. The difference is due to many factors, including COVID-19, which restrains the occupants from going to the office due to social distance rules in Korea. Another reason is climate change, which necessitates using more energy in the building. The final reason is due to the occupants’ behavioral change that is dynamic and not static.
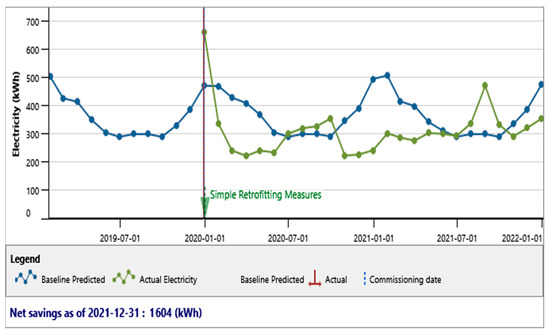
Figure 10.
M&V of the total electricity saved in the building after retrofits.
4.4. Monitoring and Validation (M&V) Analysis
Following the retrofitting of the building, an energy monitoring and verification (M&V) analysis was conducted to track its energy usage. This comparative study aimed to assess the effectiveness of the retrofitting measures and obtain accurate information on the building’s energy performance. The actual energy consumption was verified and compared with simulated results by installing an energy monitoring device. During the analysis, it was observed that the highest daily electricity consumption reached 9 kWh, with total energy consumption of 265 kWh in August and 252 kWh in July. These months correspond to the summer period in Korea, characterized by increased electricity usage for space cooling.
Figure 11 compares the actual data obtained from the installed device and the simulated data for 2021. The two datasets exhibited a close resemblance throughout the consumption period, except for slight deviations in October and December. The experiment comprised 50 simulations conducted with varying operation parameters. Among these simulations, we meticulously identified the one that demonstrated the most promising convergence and delivered highly accurate results. To ensure robustness in our analysis, we employed statistical analysis techniques, specifically focusing on the coefficient of correlation. This allowed us to assess the strength of the linear relationship between the data obtained from measurements and the actual data. As a result of our rigorous analysis, we achieved a Pearson correlation coefficient of 0.92, signifying a robust and significant correlation between the actual values and the simulated results. This strong correlation provides a solid foundation for the validity and reliability of our simulation outcomes.
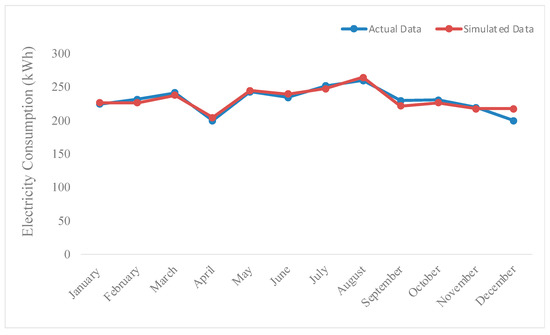
Figure 11.
The graph of actual data against the simulated data for the year 2021.
Additionally, the regression analysis of the dataset (Figure 12) further confirms the strong correlation between the actual and simulated values. These findings highlight the reliability and predictive capability of the software in analyzing the energy performance of retrofitted buildings. The close alignment between the actual and simulated data, supported by the high Pearson correlation coefficient, validates the software’s accuracy in predicting energy consumption.
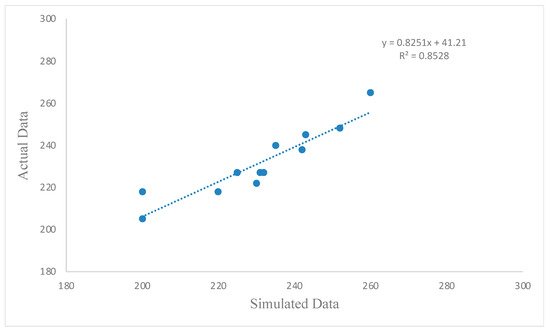
Figure 12.
Graph of regression analysis for the actual and simulated data for 2021.
5. Conclusions
This study assesses the impact of implementing mitigation technologies to decarbonize a residential building in South Korea by evaluating energy savings, cost reductions, and CO2 emission reductions. A survey was conducted among 50 buildings to collect data on building characteristics, electrical equipment, lighting equipment, and HVAC systems. Four years of electricity data from KEPCO were utilized, with a reference building serving as a benchmark for retrofitting measures. The implemented measures resulted in significant energy savings for lighting (1377 kWh) and electrical equipment (767 kWh), as well as notable energy savings in the building envelope due to improved heating and cooling systems (2098 kWh and 6307 kWh, respectively). The initial investment cost for these measures was USD 500, with fuel cost savings of USD 306 and a simple payback period of 1.6 years. The implemented measures also led to a reduction of 3.3 tons of CO2 emissions per year, equivalent to a 20% reduction in energy use by 3.3 individuals. The occupants of the building recouped the initial investment cost of USD 2400 over 2.6 years, resulting in a total electricity savings of 2144 kWh.
Furthermore, there were fuel cost savings of USD 234 and USD 101, with payback periods of 6.4 years and 4 years for heating and cooling equipment, respectively. However, the actual net savings obtained from the building were 1604 kWh, which is 25% (540 kWh) lower than the predicted electricity savings during the implementation of measures. This difference can be attributed to various factors, including the impact of COVID-19 on occupant behavior due to social distancing rules, the increasing energy demand due to climate change, and dynamic changes in occupants’ behavior. Finally, the actual and simulated data exhibited close alignment throughout the consumption period, with a Pearson correlation coefficient of 0.92, except for slight variations observed in October and December.
6. Recommendation and Future Research
The findings underscore the importance of cost-effective approaches to minimize energy consumption and improve occupant comfort. Future research would focus on conducting long-term analyses to assess the sustainability of implemented measures and expanding this study to include a larger sample size and diverse building types. Based on the results obtained, several recommendations can be made. Firstly, policymakers should consider incentivizing the adoption of energy-efficient technologies and retrofitting measures in residential buildings to promote sustainable practices. Secondly, further research should be conducted to explore innovative approaches for optimizing energy consumption and reducing emissions in the residential sector. This may involve leveraging emerging technologies or exploring new strategies for behavior change among building occupants. By continuing to advance knowledge in this field and implementing energy-saving measures on a broader scale, we can contribute to a more sustainable and energy-efficient future in residential buildings in South Korea and globally.
Author Contributions
Conceptualization, A.B.O.; methodology, A.Y. and H.X.L.; software, A.B.O.; validation, A.B.O. and H.X.L.; formal analysis, A.B.O. and A.Y.; investigation, A.B.O. and D.S.; data curation, A.Y.; writing—original draft preparation, A.B.O.; writing—review and editing, A.B.O., A.Y. and D.S.; visualization, D.S.; supervision, H.X.L.; project administration, A.B.O., H.X.L. and D.S.; funding acquisition, D.S.; All authors have read and agreed to the published version of the manuscript.
Funding
This work was supported by a National Research Foundation of Korea (NRF) grant funded by the Korean government (MSIT) (No. NRF-2021R1A5A8033165) and (No. NRF-2021R1I1A3049503).
Data Availability Statement
The authors do not have permission to share the data.
Conflicts of Interest
The authors declare that they have no known competing financial interests or personal relationships that could have appeared to influence the work reported in this paper.
References
- Ali, S.B.M.; Hasanuzzaman, M.; Rahim, N.; Mamun, M.; Obaidellah, U. Analysis of energy consumption and potential energy savings of an institutional building in Malaysia. Alex. Eng. J. 2021, 60, 805–820. [Google Scholar] [CrossRef]
- Bataineh, K.M.; Alrabee, A. Improving the energy efficiency of the residential buildings in Jordan. Buildings 2018, 8, 85. [Google Scholar] [CrossRef]
- Ruggeri, A.G.; Gabrielli, L.; Scarpa, M. Energy retrofit in european building portfolios: A review of five key aspects. Sustainability 2020, 12, 7465. [Google Scholar] [CrossRef]
- Kontokosta, C.E.; Spiegel-Feld, D.; Papadopoulos, S. The impact of mandatory energy audits on building energy use. Nat. Energy 2020, 5, 309–316. [Google Scholar] [CrossRef]
- Kontokosta, C.E.; Spiegel-Feld, D.; Papadopoulos, S. Mandatory building energy audits alone are insufficient to meet climate goals. Nat. Energy 2020, 5, 282–283. [Google Scholar] [CrossRef]
- Aoul, K.A.T.; Hagi, R.; Abdelghani, R.; Syam, M.; Akhozheya, B. Building envelope thermal defects in existing and under-construction housing in the uae; infrared thermography diagnosis and qualitative impacts analysis. Sustainability 2021, 13, 2230. [Google Scholar] [CrossRef]
- Hwang, D.K.; Cho, J.; Moon, J. Feasibility study on energy audit and data-driven analysis procedure for building energy efficiency: Benchmarking in Korean hospital buildings. Energies 2019, 12, 3006. [Google Scholar] [CrossRef]
- Adewale, A.A.; Adekitan, A.I.; Idoko, O.J.; Agbetuyi, F.A.; Samuel, I.A. Energy audit and optimal power supply for a commercial building in Nigeria. Cogent Eng. 2018, 5, 1546658. [Google Scholar] [CrossRef]
- Yilmazoglu, M.Z. Decreasing energy consumption and carbon footprint in a school building: A comparative study on energy audits. Int. J. Glob. Warm. 2017, 13, 237–257. [Google Scholar] [CrossRef]
- Zhang, C.; Yuan, N.; Mao, Q. Energy audit and potential conservation analysis of a large comprehensive commercial building. Therm. Sci. 2018, 22, 567–576. [Google Scholar] [CrossRef]
- Ye, Y.; Hinkelman, K.; Lou, Y.; Zuo, W.; Wang, G.; Zhang, J. Evaluating the energy impact potential of energy efficiency measures for retrofit applications: A case study with U.S. medium office buildings. Build. Simul. 2021, 14, 1377–1393. [Google Scholar] [CrossRef]
- Salvadori, G.; Fantozzi, F.; Rocca, M.; Leccese, F. The energy audit activity focused on the lighting systems in historical buildings. Energies 2016, 9, 998. [Google Scholar] [CrossRef]
- Günkaya, Z.; Özkan, A.; Banar, M. The effect of energy-saving options on environmental performance of a building: A combination of energy audit–life cycle assessment for a university building. Environ. Sci. Pollut. Res. 2021, 28, 8822–8832. [Google Scholar] [CrossRef] [PubMed]
- Khalilnejad, A.; Karimi, A.M.; Kamath, S.; Haddadian, R.; French, R.H.; Abramson, A.R. Automated pipeline framework for processing of large-scale building energy time series data. PLoS ONE 2020, 15, e0240461. [Google Scholar] [CrossRef]
- Mauriello, M.L.; McNally, B.; Froehlich, J.E. Thermporal: An easy-to-deploy temporal thermographic sensor system to support residential energy audits. Conf. Hum. Factors Comput. Syst. Proc. 2019, 1–14. [Google Scholar] [CrossRef]
- Woo, J.; Moore, T. An end-user-focused building energy audit: A high-density multi-residential development in Melbourne, Australia. In Energy Performance in the Australian Built Environment; Rajagopalan, P., Andamon, M., Moore, T., Eds.; Springer: Singapore, 2019. [Google Scholar]
- Kerimray, A.; Suleimenov, B.; De Miglio, R.; Rojas-Solórzano, L.; Torkmahalleh, M.A.; Gallachóir, B.P. Investigating the energy transition to a coal free residential sector in Kazakhstan using a regionally disaggregated energy systems model. J. Clean. Prod. 2018, 196, 1532–1548. [Google Scholar] [CrossRef]
- Mambo, A.D. Building Energy Audit in Nigeria: Some Guides for Energy Efficiency Building Regulations; Springer International Publishing: New York, NY, USA, 2018; Volume 1. [Google Scholar]
- Owolabi, A.B.; Nsafon, B.E.K.; Roh, J.W.; Suh, D.; Huh, J.S. Measurement and verification analysis on the energy performance of a retrofit residential building after energy efficiency measures using RETScreen Expert. Alexandria Eng. J. 2020, 59, 4643–4657. [Google Scholar] [CrossRef]
- Favi, C.; Di Giuseppe, E.; D’orazio, M.; Rossi, M.; Germani, M. Building retrofit measures and design: A probabilistic approach for LCA. Sustainability 2018, 10, 3655. [Google Scholar] [CrossRef]
- Zarrella, A.; Prataviera, E.; Romano, P.; Carnieletto, L.; Vivian, J. Analysis and application of a lumped-capacitance model for urban building energy modeling. Sustain. Cities Soc. 2020, 63, 102450. [Google Scholar] [CrossRef]
- Hong, Y.; Ezeh, C.I.; Deng, W.; Hong, S. Building Energy Retrofit Measures in. Energies 2019, 12, 32. [Google Scholar]
- Bansal, K. Structural retrofitting in historic buildings–the case of Hearst Greek theatre, California. Int. J. Eng. Technol. 2018, 7, 1–7. [Google Scholar] [CrossRef][Green Version]
- Gonzalez-Caceres, A.; Rabani, M.; Martínez, P.A.W. A systematic review of retrofitting tools for residential buildings. IOP Conf. Ser. Earth Environ. Sci. 2019, 294, 012035. [Google Scholar] [CrossRef]
- Sayigh, A. Mediterranean Green Buildings & Renewable Energy: Selected Papers from the World Renewable Energy Network′s Med Green Forum; Springer: Cham, Switzerland, 2017. [Google Scholar]
- Henriques, C.O.; Coelho, D.H.; Antunes, C.H. A multi-objective input-output model to assess E4 impacts of building retrofitting measures to improve energy efficiency. Technol. Econ. Dev. Econ. 2015, 21, 483–494. [Google Scholar] [CrossRef]
- Stadler, M.; Groissböck, M.; Cardoso, G.; Marnay, C. Optimizing Distributed Energy Resources and building retrofits with the strategic DER-CAModel. Appl. Energy 2014, 132, 557–567. [Google Scholar] [CrossRef]
- Mohareb, E.; Hashemi, A.; Shahrestani, M.; Sunikka-Blank, M. Retrofit planning for the performance gap: Results of a workshop on addressing energy, health and comfort needs in a protected building. Energies 2017, 10, 1177. [Google Scholar] [CrossRef]
- Håkansson, A.; Höjer, M.; Howlett, R.J.; Jain, L.C. Sustainability in Energy and Buildings: Proceedings of the 4th International Conference on Sustainability in Energy and Buildings (SEB’12). Smart Innov. Syst. Technol. 2013, 22, 567–580. [Google Scholar] [CrossRef]
- Favi, C.; Meo, I.; Di Giuseppe, E.; Iannaccone, M.; D’orazio, M.; Germani, M. Towards a probabilistic approach in LCA of building retrofit measures. Energy Procedia 2017, 134, 394–403. [Google Scholar] [CrossRef]
- Jenkins, D.P. Using dynamic simulation to quantify the effect of carbon-saving measures for a U.K. supermarket. J. Build. Perform. Simul. 2008, 1, 275–288. [Google Scholar] [CrossRef]
- Rabani, M.; Madessa, H.B.; Nord, N. Achieving zero-energy building performance with thermal and visual comfort enhancement through optimization of fenestration, envelope, shading device, and energy supply system. Sustain. Energy Technol. Assess. 2021, 44, 101020. [Google Scholar] [CrossRef]
- Qu, K.; Chen, X.; Wang, Y.; Calautit, J.; Riffat, S.; Cui, X. Comprehensive energy, economic and thermal comfort assessments for the passive energy retrofit of historical buildings—A case study of a late nineteenth-century Victorian house renovation in the U.K. Energy 2021, 220, 119646. [Google Scholar] [CrossRef]
- Fina, B.; Auer, H.; Friedl, W. Profitability of contracting business cases for shared photovoltaic generation and renovation measures in a residential multi-apartment building. J. Clean. Prod. 2020, 265, 121549. [Google Scholar] [CrossRef]
- Shirazi, A.; Ashuri, B. Embodied Life Cycle Assessment (LCA) comparison of residential building retrofit measures in Atlanta. Build. Environ. 2020, 171, 106644. [Google Scholar] [CrossRef]
- Pallonetto, F.; De Rosa, M.; Finn, D.P. Environmental and economic benefits of building retrofit measures for the residential sector by utilizing sensor data and advanced calibrated models. Adv. Build. Energy Res. 2020, 16, 89–117. [Google Scholar] [CrossRef]
- Andrade-Cabrera, C.; Burke, D.; Turner, W.J.; Finn, D.P. Ensemble Calibration of lumped parameter retrofit building models using Particle Swarm Optimization. Energy Build. 2017, 155, 513–532. [Google Scholar] [CrossRef]
- Pallonetto, F.; Oxizidis, S.; Duignan, R.; Neu, O.; Finn, D. Demand response optimization of all-electric residential buildings in a dynamic grid environment: Irish case study. In Proceedings of the 13th International Conference of the International Building Performance Simulation Association, Chambery, France, 25–28 August 2013; pp. 1616–1623. [Google Scholar]
- Yang, S.; Cho, H.M.; Yun, B.Y.; Hong, T.; Kim, S. Energy usage and cost analysis of passive thermal retrofits for low-rise residential buildings in Seoul. Renew. Sustain. Energy Rev. 2021, 151, 111617. [Google Scholar] [CrossRef]
- IEA. Korea 2020. [Online]. Available online: https://www.iea.org/reports/korea-2020 (accessed on 24 April 2023).
- 전력데이터 개방 포털시스템. Available online: https://bigdata.kepco.co.kr/cmsmain.do?scode=S01&pcode=000171&redirect=Y#; (accessed on 22 November 2021).
- El-Darwish, I.; Gomaa, M. Retrofitting strategy for building envelopes to achieve energy efficiency. Alexandria Eng. J. 2017, 56, 579–589. [Google Scholar] [CrossRef]
- RETScreen. Available online: https://www.nrcan.gc.ca/maps-tools-and-publications/tools/modelling-tools/retscreen/7465 (accessed on 22 November 2021).
- Chirarattananon, S.; Kubaha, K. Potential Energy and Power Demand Savings from Application of New Building Energy Code in Thailand. Available online: https://www.academia.edu/60398673/Revised_Building_Energy_Code_of_Thailand_Potential_Energy_and_Power_Demand_Savings (accessed on 24 April 2023).
- Levine, M.D.; Price, L.; Martin, N. Mitigation options for carbon dioxide emissions from buildings: A global analysis. Energy Policy 1996, 24, 937–949. [Google Scholar] [CrossRef]
- Thovhakale, B. Retrofitting to lower energy consumption: Comparing two commercial buildings in Sandton, Johannesburg. Master’s Thesis, University of Johannesburg, Johannesburg, South Africa, 2011; pp. 1–128. [Google Scholar]
- Chwieduk, D. Towards sustainable-energy buildings. Appl. Energy 2003, 76, 211–217. [Google Scholar] [CrossRef]
- Yalcintas, M.; Kaya, A. Conservation vs. renewable energy: Cases studies from Hawaii. Energy Policy 2009, 37, 3268–3273. [Google Scholar] [CrossRef]


Disclaimer/Publisher’s Note: The statements, opinions and data contained in all publications are solely those of the individual author(s) and contributor(s) and not of MDPI and/or the editor(s). MDPI and/or the editor(s) disclaim responsibility for any injury to people or property resulting from any ideas, methods, instructions or products referred to in the content. |
© 2023 by the authors. Licensee MDPI, Basel, Switzerland. This article is an open access article distributed under the terms and conditions of the Creative Commons Attribution (CC BY) license (https://creativecommons.org/licenses/by/4.0/).