Article

Eco-Geography of Dioscorea composita (Hemsl.) in México and Central America under the Influence of Climate Change

by
Jocelyn M. Velázquez-Hernández
1,
José Ariel Ruíz-Corral
2,*,
Noé Durán-Puga
1,
Diego R. González-Eguiarte
1,
Fernando Santacruz-Ruvalcaba
3,
Giovanni Emmanuel García-Romero
4,
Jesús Germán de la Mora-Castañeda
5,
Carlos Félix Barrera-Sánchez
2 and
Agustín Gallegos-Rodríguez
6
1
Departamento de Producción Sustentable, Universidad de Guadalajara, Zapopan 45110, Jalisco, Mexico
2
Departamento de Ciencias Ambientales, Universidad de Guadalajara, Zapopan 45110, Jalisco, Mexico
3
Departamento de Producción Agrícola, Universidad de Guadalajara, Zapopan 45110, Jalisco, Mexico
4
Dirección del Medio Ambiente del Municipio de Guadalajara, Guadalajara 44638, Jalisco, Mexico
5
Facultad de Ciencias Biológicas y Agropecuarias, Universidad de Colima, Tecomán 28100, Colima, Mexico
6
Departamento de Producción Forestal, Universidad de Guadalajara, Zapopan 45110, Jalisco, Mexico
*
Author to whom correspondence should be addressed.
Sustainability 2023, 15(16), 12320; https://doi.org/10.3390/su151612320
Submission received: 27 June 2023 / Revised: 20 July 2023 / Accepted: 31 July 2023 / Published: 12 August 2023
(This article belongs to the Special Issue Impacts of Climate Change on Biodiversity)

Abstract

:
Dioscorea composita is a plant with historical recognition for the production of secondary metabolites of pharmaceutical importance, including diosgenin, and with great nutritional and ethnobotanical value in its center of origin (México and Central America). Furthermore, it is considered a promising therapeutic agent against cancer. Currently, México is one of the two most important countries producing this yam; however, climate change is altering the environmental conditions of its natural habits, threatening its preservation and productivity. This is why this research was focused on characterizing the eco-geography of D. composita and predicting its potential geographic distribution under climate change scenarios in México-Central America. A collection of 408 geo-referenced accessions was used to determine its climatic adaptation, ecological descriptors, and the current and future potential geographic distribution, which was modeled with the MaxEnt model through the Kuenm R-package. For future climate scenarios, an ensemble of the GCMs HadGEM-ES and CCSM4 was used. Results showed that D. composita adapts to warm and humid and very humid agro-climates and, the most contributing variables for its presence are annual and seasonal moisture availability indices, the seasonal photoperiod, annual thermal range, and Bio14 and Bio11. The current potential distribution (692,123 km2) of D. composita might decrease by the year 2050 RCP4.5 (365,680 km2) and might increase by 2050 under the scenario RCP8.5 (763,589 km2), showing this plant could be a good crop option for this climate change scenario. The findings obtained provide valuable information that will allow for the effective utilization of this plant, both in terms of developing new pharmaceutical products and implementing appropriate conservation strategies.

1. Introduction

Dioscorea composita Hemsl is a wild species that has its origin in México and Central America [1], although some authors consider Mexico as the most probable center of origin [2,3]. This plant has been historically recognized for the production of secondary metabolites of pharmaceutical importance, including diosgenin [4]. However, due to advances in the chemical synthesis of these compounds, the relevance of natural diosgenin in medicine has diminished over time [3]; consequently, the industry’s interest in this plant decreased, which caused the diverse aspects of this plant to remain understudied until now. Nevertheless, recently, the interest in this species has resurfaced, since it has been discovered that it may constitute a promising therapeutic agent against cancer [5,6]. In addition, D. composita is a plant with socioeconomic importance that has great nutritional and ethnobotanical value [3]. Currently, it can be considered a nutraceutical plant used in states of southeastern México [7].
Climate change is causing variations in temperature and precipitation patterns, as well as in the frequency of extreme weather events [8], triggering alterations in the range of species distribution, and modifying the composition and characteristics of ecosystems. México and Central America are some of the most impacted regions by climate change, due to their geographic and orographic characteristics, together with the unequal territorial distribution of natural resources [9]. Climate scenarios modeled for the middle of this century predict increases in temperature from 1 to 3 °C and a decrease in precipitation of around 10%, causing diverse environmental combinations that provoke particular climatic conditions, which alter the agro-climatic conditions of these regions adversely [10], which include the central and northern part of México [11,12], as well as tropical and subtropical zones [13]. Central America has experienced the ravages of this phenomenon, with drought mainly in El Salvador, Guatemala, and Honduras in 2014 and 2015, endangering temperate and cloudy forests [9]. These changes in weather patterns impact the current distribution areas of numerous wild species in México and Central America. In the Mexican occurrence sites of D. composita, it is estimated that by the year 2050, the annual mean temperature will increase 2–3 °C and annual precipitation will decrease 10–50 mm, in relation to the average climatology in 1961–2010 [14]; whilst, for the Central American occurrence sites, an increase of 2.5–3 °C and a decrease of 25–70 mm of precipitation are expected by the year 2050 [15]. These environmental conditions imposed by climate change lead to the need to increasingly use species with greater tolerance to drought and heat; in this regard, recently, the molecular mechanism of WRKY TF (namely, DcWRKY5) was isolated from the plant of D. composita and proved to act as a positive regulator of the drought and salt tolerance in this plant, which has potential applications in transgenic breeding [16]. However, many aspects of this species remain unstudied, which limits a comprehensive assessment of its comparative advantages and potential uses. Moreover, the possible effects of climate change on the presence and potential distribution of D. composita have not yet been assessed. This is why the objectives of this research were to characterize the eco-geography and environmental adaptation of D. composita, as well as to predict its current and future potential distribution under climate change scenarios in its region of origin.
Different algorithms have been used to evaluate the species distribution, such as the Generalized Additive Model (GAM) and Genetic Algorithm for Rule Set Production (GARP) [17]. However, MaxEnt stands out as the most widely used algorithm in this field due to its ability to provide accurate and reliable results, its flexibility in handling large datasets, and its efficiency in terms of execution time [18]. Furthermore, it has allowed for identifying optimal conditions for Dioscorea species cultivation and production of diosgenin in significant quantities [19]. The knowledge generated through research with MaxEnt has not only contributed to the development of more efficient production methods but has also laid the foundations for the proper conservation of these species [20].

2. Materials and Methods

2.1. Occurrence Data

After data curation to mainly discard duplicate and erroneous information [21], a database of D. composita occurrence sites in México–Central America was conformed considering a final list of 408 geo-referenced accessions (Table 1). University herbaria, digital herbariums, floristic inventories, and scientific articles were considered as data sources. We only considered the species occurrence sites in México–Central America because they are considered the natural populations of D. composita (this region is its center of origin); therefore, they are adequate to characterize the eco-geography of this species and the final purposes of this research [22].

2.2. Climatic Data

Raster images of temperature, precipitation, evapotranspiration (ETP), and photoperiod were used, from the Agroclimatic Information System for México–Central America (SIAMEXCA) [23], which have a resolution of 30″ arc and correspond to climatic normals for the period 1961–2010. Additional parameters were derived from these images using the IDRISI Selva software 17.0 [24], adding a total of 31 variables (Table 2). For climate change scenarios, we used raster images from the year 2050, RCPs 4.5 and 8.5, derived from an ensemble of two GCMs corresponding to the Coupled Model Inter-comparison Project Phase 5 (CMIP5): HadGEM-ES (European Network for Earth System-Met Office Hadley Center) and CCSM4 (Community Climate System Model), since they have been shown to adequately address and describe continental vegetation, including various types of vegetation [25], in addition to showing good adjustment to the climatic conditions of México and Central America [26,27,28]. The models have formerly been used successfully to predict the suitability of crops under climate change scenarios [29].

2.3. Environmental Characterization of the Occurrence Sites

Environmental conditions of the D. composita occurrence sites were characterized by extracting values from raster images corresponding to 31 variables (Table 2). This extraction was made with the system ArcMap 10.8 [30] and by using geographical coordinates for each site. With the extracted data, a data matrix was built in Microsoft Excel [28].

2.4. Selection of Environmental Variables

To obtain accurate biological information, species distribution models must be built with predictor variables that have a direct influence on the presence of the species [31]. Thus, it is important to make a good selection of variables, avoiding, among other aspects, the multi-collinearity of variables, which can cause a misinterpretation of the model, due to the high level of correlation between variables [30]. Moreover, severe multi-collinearity can increase the variance of regression coefficients, making them unstable [32]. Before any statistical analysis, we applied the Shapiro--Wilk test for data normality and found no normality for all variables (p < 0.05). Thus, we used Spearman’s r for correlation analysis. Data from the environmental data matrix were used to perform the correlation analyses; this statistical analysis was carried out with programs developed in the R software version 4.05 [33]. To determine the presence of multi-collinearity, a threshold value of correlation coefficient > 0.8 [34] was established. Thus, variables correlated with a coefficient < 0.8 were selected. Furthermore, a preliminary Maxent modeling was performed with the 31 environmental variables (Table 2) to identify, via the Jackknife Test, the variables with the greatest contribution to the presence of D. composita. Combining these two criteria, no collinearity and the greatest contribution to the species presence, a final list of environmental variables was obtained and used to run Maxent in the Kuenm R-Package again to output an optimal niche model.

2.5. Eco-Geography of D. composita: Determination of Climatic Adaptation and Ecological Descriptors

The climatic adaptation of D. composita was determined by identifying the occurrence of the species in different agro-climatic regions; for this, the map of agro-climatic regions for México and Central America was used [22]. In this way, a list of the agro-climatic conditions in which this species is present was derived.
For the determination of the ecological descriptors, the extracted data matrix was used, considering only information from 20 environmental variables, which were selected after the correlation analysis to discriminate variables that were highly correlated [22].

2.6. Ecological Niche Modeling

The MaxEnt algorithm was used for ecological niche modeling (ENM) of D. composita in the current climate scenarios as well as in the climate change scenarios addressed in this research. MaxEnt model was implemented with the assistance of the Kuenm R-package [33,35], which automates and optimizes the ENM process. The preliminary models were created using Kuenm’s Kuenm_ceval function, which utilizes occurrence data and environmental predictors, and their efficiency was evaluated through the cal_eval function that determines their statistical significance. To ensure accuracy, ten replicates were performed via cross-validation, using logistic outputs for current and future climatic scenarios. Final model assessments included partial ROC calculations and omission rates (based on E = 5%) using an independent dataset. The functions kuenm_mod and kuenm_feval were used to finalize the models and perform evaluations, respectively [35]. The quality of the model was assessed with the AUC value from the ROC curve, and the Akaike Information Criterion (AIC), which was corrected for small sample sizes (AICc) [34]. Thus, the final niche model was selected according with the criteria sequence shown in Table 3. In order to identify any potential model transfer extrapolation risks, mobility-oriented parity (MOP) analyses were conducted using the kuenm_mmop function [35].
For this research, models were tested using a sequential order of the FC (L, LQ, H, LQH, LQHP, LQHPT) and regularization multiplier (RM) values of 0.1 to 10 with 0.1 increases, a maximum omission rate of 5%, and run 25 k-fold replicates of each configuration; 500 iterations were used [36]. Two models were generated for each parameter setting, one based on the complete set of occurrences and the other based only on the training data.
Finally, binary maps of suitable/unsuitable areas were obtained to represent the potential and future distribution areas of D. composita by using the threshold method Balance Training Omission, Predicted Area and Threshold Value (BTOPATV).

3. Results

3.1. Statistical Analysis and Environmental Variables Selection

Twenty environmental variables were selected and used to characterize the eco-geography of D. composita (Table 4). However, for the purpose of the species distribution modeling, the preliminary ENM with MaxEnt revealed that seven variables are the ones that contribute the most to the eco-geographical distribution of D. composita: annual moisture availability index, November–April photoperiod, BIO07, May–October moisture index, November–April moisture availability index, BIO14, and BIO11, which were used for the final ENM processes with Kuenm R-package [37].

3.2. Eco-Geography of D. composita

Figure 1 shows the current geographical distribution of D. composita in the agro-climatic regions of México and Central America. The occurrence sites for this species are distributed mainly from the north of Veracruz in México to some areas of Guatemala, Belize, and El Salvador. In this area, most of the D. composita accessions are located in the agro-climates humid and warm (209 accessions, 51.2%); and very humid and warm (83, 20.3%), remarking the preference of this species for humid and warm climates.
The map of Figure 1 also shows presence sites in other regions of México with different environmental conditions, proving the ability of D. composita to colonize new habitats and adapt to other environmental conditions. Thus, D. composita is currently distributed in 10 agro-climates that go from temperate to very warm and from semi-arid to very humid environments (Table 4).
Climatic characterization of each accession site is described in the Supplemental File. Based on such data, the ecological descriptors of D. composita were calculated and are shown in Table 5. Ecological descriptors include the minimum, maximum and optimal range for the presence of this plant; the optimal ranges match with the highest frequency of the species occurrence sites. Since this climatic characterization derives from its center of origin, the most original habitats of D. composita were taken into account to do it; hence, this climatic characterization should be considered as a valid reference of its eco-geography. These results may be worthy to perform the species agro-ecological zonation and other applications now that Latin American governments are more involved in the inventory of native plant genetic resources [38].
Four important climatic aspects for the presence of D. composita may be distinguished in Table 5 data: moisture availability, temperature conditions, thermal range, and photoperiod, most of them important as annually as well as seasonal parameters. The species is present in the Mesoamerica region, from 5 to 3001 m above sea level, although its optimal elevation range is 5–1125 m.
It is quite interesting to notice that some of the ecological descriptors included in Table 5 are not commonly reported in this table expressed by the annual and seasonal moisture indices, such as the moisture available index (MAI). We obtained D. composita distributes in the range from 0.42 to 3.75, with an optimal interval from 1.1 to 2.9, which is in correspondence with the optimal interval of the annual precipitation from 1940 to 3839 mm (Table 5). The thermal oscillation also influences the distribution and development of tubers; the optimal range determined for D. composita is from 10.1 to 12.9 °C, whereas the photoperiod was selected as an important seasonal variable in the period of spring–summer (May–October) as well as in autumn–winter (November–April), with optimal ranges of 12.9–13.15 h and 11.27–11.5 h, respectively. The optimal range for the annual mean temperature (23–28 °C) proves that D. composita is a species whose natural habitat is the warm thermal zones (Table 5).

3.3. Modeling the Potential Distribution of Dioscorea composita

Kuenm R-package enabled to obtain 341 MaxEnt models (Figure 2), all of them significant; however, only one model met all the selection criteria established (Table 3). The parameters of the final model are shown in Table 6.
The Jackknife test revealed that the variables with the greatest contribution to the distribution niche model of D. composita are AMAI (38.4%), NAPH (20.7%), and ATO (17.1%) (Table 7).
Furthermore, results from the Jackknife analysis also indicated that when testing the three cases “with only variable”, “without variable”, and “with all variables”, the variable with the highest gain was BIO07 (annual mean thermal oscillation), with a regularized training gain > 1.1 (Figure 3). Other important environmental variables were NAPH (November–April mean photoperiod), AMAI (annual mean moisture availability index), MOMAI (May–October mean moisture availability index), NAMAI (November–April mean moisture availability index), BIO07 (Temperature Annual Range) BIO14 (precipitation of the driest month), and BIO11 (mean temperature of the coldest quarter), all of them with regularized training gains > 1.0 (Figure 3).
Figure 4 shows the current and potential distribution of D. composita. The total potential distribution area for D. composita accounted 692,123 km2, and is located in Durango, Nayarit, Jalisco, Colima, Michoacán, Guanajuato, San Luis Potosí, Tamaulipas, Quintana Roo, Yucatán, Campeche, Tabasco, Veracruz, Guerrero, Oaxaca, and Chiapas, in México, and in some areas of Guatemala, Belize, El Salvador, Honduras, and Nicaragua.

3.4. Impact of Climate Change on the Potential Distribution of D. composita

Figure 5 shows the environmental suitability areas for D. composita in the year 2050 under two different climate paths (2050 RCP 4.5 and RCP 8.5). Both contraction and expansion areas for D. composita resulted from modelling its potential distribution under both climate paths.
Table 8 indicates that when considering both contraction and expansion areas, a negative balance is predicted under RCP 4.5, suggesting that climate change would have an adverse impact on the environmental suitability for D. composita. The contraction in the environmental suitability area in México would affect the states of Durango, Michoacán, San Luis Potosí, Tamaulipas, Oaxaca, Quintana Roo, Yucatán, Campeche, Veracruz, and Chiapas, whilst other affected areas would be located in Guatemala, Belize, El Salvador, and Honduras. Opposite, with RCP 8.5, a positive balance is predicted, which includes an increase in the environmental suitability area for D. composita. The expansion of the environmental suitability would imply the territory of México in the states of Durango, Jalisco, Michoacán, Tamaulipas, Yucatán, and Campeche, as well as the territory of Guatemala, El Salvador, Honduras, and Nicaragua.

4. Discussion

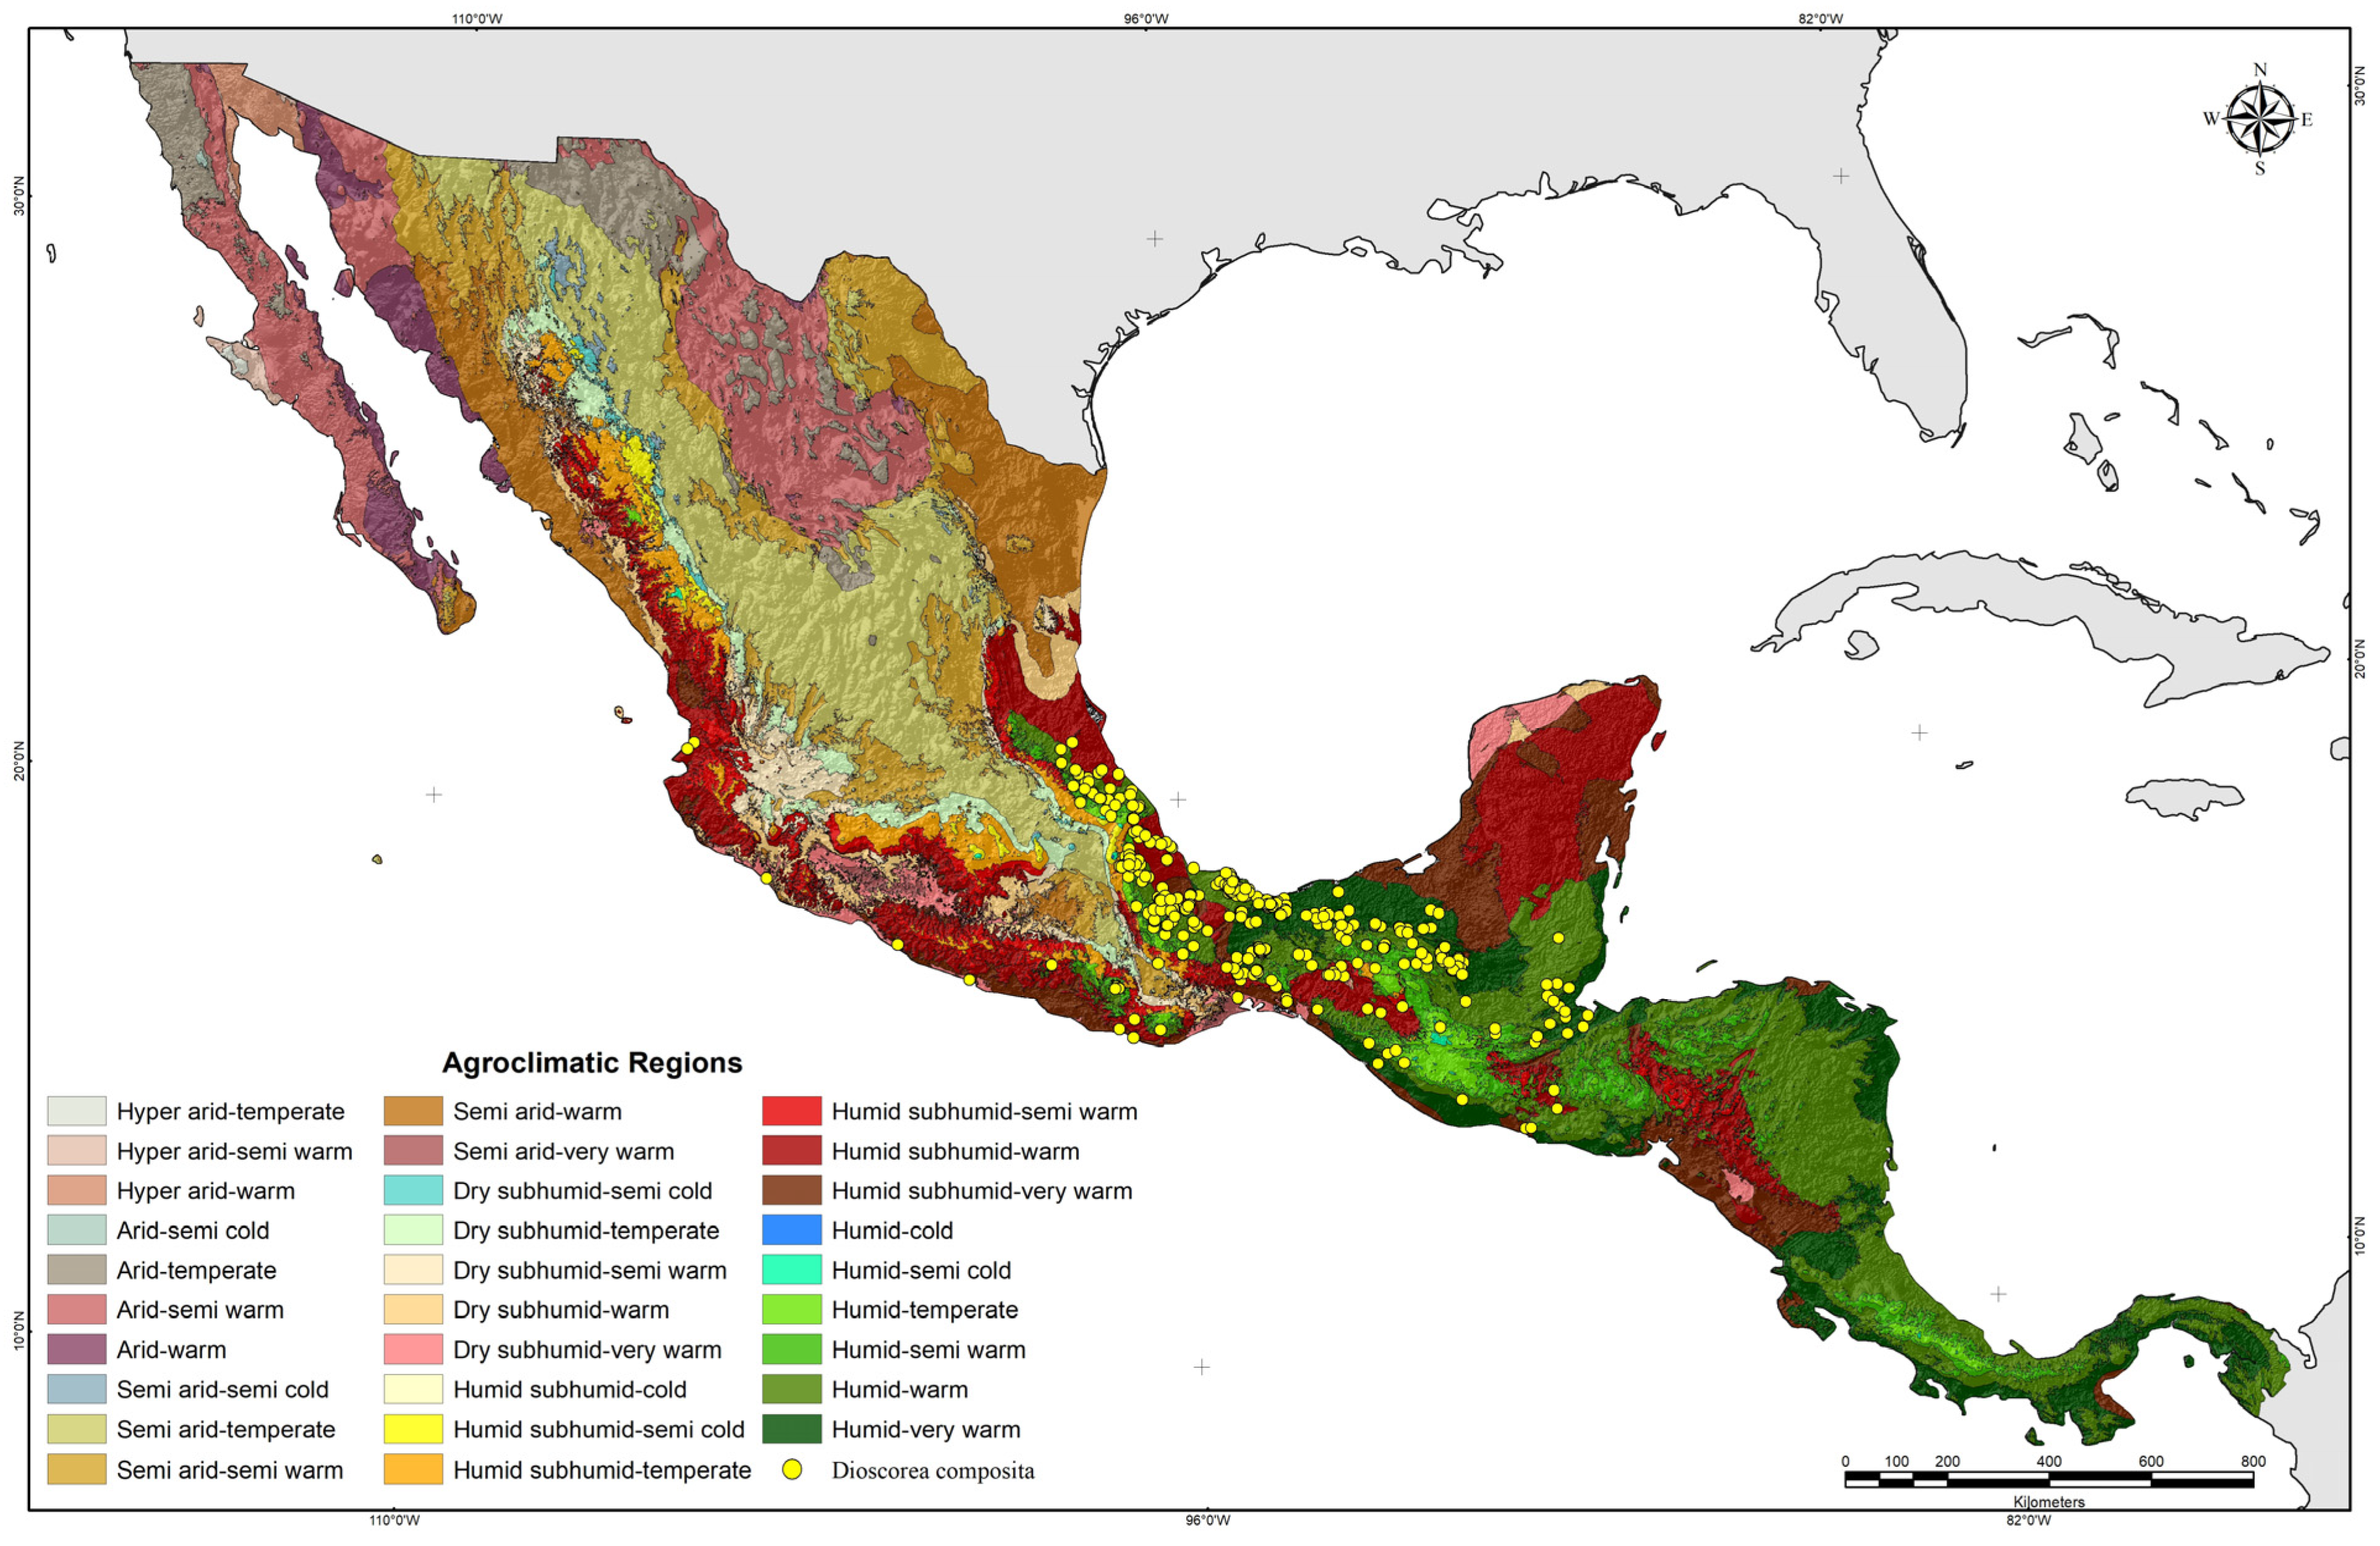
D. composita occurrence sites are concentrated in a region of humid warm climates that goes from the north of Veracruz, México, to the north of Guatemala. Since México–Central America is the most likely center of origin for D. composita [1], this geographic area could be suggested as a possible center of origin of this species, although this hypothetical assertion must be proven with phylogenetically targeted genomic, morphological, and Earth system data [39]. In addition, as expected, niche modeling with MaxEnt showed this region to have the highest environmental suitability for D. composita, which appends another argument to support such a hypothetical suggestion, since it is known that the centers of the origin of the species meet the best environmental conditions for their growth [40].
Even when D. composita mostly distributes in humid warm climates, the occurrence sites in other environmental conditions evidences the species’ capabilities to adapt to an ampler climatic scope. This provides D. composita the possibility of better adaptation to novel climates brought on by global warming [19,41,42].
The former results match with previous reports that state that the species of the genus Dioscorea are distributed in warm climates as well as in temperate zones [43], even at elevations above 2200 m [44]. Likewise, our results agree with previous findings that Dioscorea species are also adapted to both tropical and subtropical zones [45,46].
According to the annual mean precipitation range characterization for 18 species of Dioscorea genus with a presence in India [4], they distribute in environments with annual precipitation ranging from 2165 to 3778 mm, reinforcing the wetland plants’ character. In our research, we obtained a range of 737 to 4874 annual millimeters; the value of 737 mm corresponds with an accession located on the borderline of Mexican states Guerrero and Oaxaca, near the Pacific coast. In fact, 12 of 27 occurrence sites located near the Pacific coastline register annual precipitation lower than 1500 mm, indicating that D. composita has adapted to drier environments. These accessions could be of interest for a possible breeding program focused on giving rise to varieties better capable of coping with climate change drought episodes.
The photoperiod was also determined to be an important variable for D. composita distribution. Short days have been reported to favor Dioscorea species tubers, whereas a photoperiod of more than 12 h has been shown to promote the growth of leaf area, long stems, and vigorous vines [47,48].
Results evidenced that annual thermal oscillation (ATO) and annual thermal range (ATR) contributed to explaining D. composita presence and distribution; the optimal intervals determined for D. composita are 10.1–12.9 °C and 16.9–20.2 °C, respectively (Table 4). These values are indicative of a species not typically from thermo-regulated climates, as might be expected due to its presence in mostly humid and warm climates, but rather of a species that tolerates the occurrence of extreme temperatures. According to the Köppen-García Climate Classification System [49], these environments correspond to extreme thermal climates (ATO = 7–14 °C).
Growth of the Dioscorea species requires temperatures in a range from 25 to 30 °C to exhibit normal development; we obtained a very similar range (23–28 °C, Table 4) as an optimal interval in this parameter [45]. This author also reports that the growth of Dioscorea species is restricted by temperatures below 20 °C; such conditions are present in the occurrence sites located in the original region of the distribution of D. composita (yellow color area in map of Figure 3). However, for the rest of the distribution sites, temperatures keep below 20 °C many days during the year (Supplemental File), denoting that D. composita is subject to adaptation in other environments.
Warm temperatures favor foliage growth, but they also favor high respiration rates, which retard tuber growth and alter the production of diosgenin [50]. However, the optimal range determined in this research for the mean maximum temperature in the hot season (May–October) was 29–35 °C, which supposes certain comfort status of D. composita even under temperatures considered extreme (>32 °C) for many plant species [51,52].
A niche model with an AUC value greater than 0.7 can make good estimations [53]. We classify the accuracy of the models according to their AUC value in five categories: 0.50–0.60—insufficient model; 0.60–0.70—poor model; 0.70–0.80—average acceptable model; 0.80–0.90—good model, and 0.90–1.00—excellent model [54,55]. According to this classification, the obtained models for all climatic scenarios studied are excellent to describe the potential distribution of D. composita and constitute an adequate tool to derive the eco-geographic characterization of the territories where this species is distributed [21].
The results of the Jackknife test revealed that the variables that mainly determine the presence and disribution of D. composita are AMAI, NAPH, ATO, MOMAI, NAMAI, Bio14, and Bio11 (Table 7). These results partially match with previous reports [37], which mention that the most important variables in the growth and development of the species, especially in the production of diosgenin, are precipitation and solar radiation. For Solanum tuberosum, with which the species of the genus Dioscorea are compared for the production of tubers, the most important environmental variables are annual precipitation and average soil temperature, in such a way that at higher soil temperature and lower soil moisture, the distribution of the species that produce tubers is limited [56].
Most studies about the effects of climate change on the environmental suitability for species report more contraction than expansion areas for their potential distribution [57]. However, these types of climate change effects should not be considered as generalizations, since the new environmental conditions brought about by climate change can represent comparative advantages for diverse species, mostly causing the expansion of their potential distribution areas [58]; Moreover, some species could remain in their current distribution areas without being significantly affected by climate change. In this way, species of origin and adaptation to temperate environments would observe their potential distribution reduced by the year 2050, as in the case of Solanum tuberosum [56]; while species of tropical origin and adaptation to warm environments would benefit from the expansion of their potential distribution areas; an example is Dioscorea alata, which is predicted to have a significant increase in production and potential distribution area by the 2040s [57].
Environmental factors are the main drivers of changes in the distribution of Dioscorea species [59]. Based on the values in Table 8, which describe the dynamics of environmental suitability for D. composita under different climate change scenarios, it is concluded that scenario RCP 4.5 would have a negative impact on the species, with a decrease in its potential distribution area. Loss of biodiversity, as a consequence of climate change, has been observed in similar environments in other species such as passion fruit, which, being a climbing species, will also be affected in scenario RCP 4.5, decreasing its potential area due to increased temperature and decreased precipitation (and hence, reduced water availability), and new physico-chemical soil characteristics [60].
Based on the results, the year 2050 RCP 8.5 climatology would have a positive effect on the environmental suitability of D. composita. However, studies on the effects of climate change indicate mainly impacts on areas of environmental suitability, resulting in contraction areas being greater than expansion areas [57]. Notwithstanding the foregoing, the response of each plant species may differ, with some decreasing their distribution, others changing or expanding it, and perhaps some not being affected at all [58]. While climate change has the potential to negatively affect the distribution and biodiversity of plant species, specific effects may vary depending on the species and the scenario considered. In the case of D. composita, the RCP 8.5 scenario suggests a positive effect on its potential distribution area. Furthermore, the variation in the impacts of climate change on population growth rates is mainly due to differences in the climatic response of the species populations [61].
It is important to consider the inherent biases in the algorithms of both the ecological niche model and climate change models, which may affect the accuracy and reliability of the results. The understanding and adequate mitigation of these biases are essential to improve the usefulness and reliability of these models in decision-making related to the conservation and management of plant species and ecosystems [62].

5. Conclusions

D. composita is predominantly distributed in a concentrated region of southern México and Central America characterized by warm and humid climates. The modeling of environmental suitability has identified a potential center of origin for D. composita; spanning from northern Veracruz, México to northern Guatemala. Several key parameters, including moisture availability indices, photoperiod, thermal oscillation, precipitation, and temperature, significantly influence its distribution.
Considering climate change scenarios for 2050, the study indicates a decrease in envi-ronmental suitability under the RCP 4.5 scenario and an increase under the RCP 8.5 scenario, suggesting that D. composita could become a favorable crop option under the latter emissions scenario.
The knowledge derived from this research contributes to a better understanding of the plant–environment interactions of D. composita, enabling the determination of its potential as a crop in the current and future climates, as well as the development of strategies for the conservation of its natural populations in México and Central America. These findings are particularly valuable given the growing public interest in D. composita for its nutraceutical properties. This knowledge will facilitate the effective utilization of this plant resource, both in the development of new pharmaceutical products and the implementation of appropriate conservation measures.
It is recommended to continue the morphological and genetic characterization of the populations of this species, to identify traits of tolerance to drought, excess water and heat, in the process of a possible genetic improvement program to obtain possible varieties’ adaptable to new climatic environments derived from climate change.

Supplementary Materials

The following supporting information can be downloaded at: https://www.mdpi.com/article/10.3390/su151612320/s1.

Author Contributions

Conceptualization, J.M.V.-H., J.A.R.-C. and N.D.-P.; Methodology, J.M.V.-H. and A.G.-R.; Software, N.D.-P. and C.F.B.-S.; Validation, J.A.R.-C.; Formal analysis, J.M.V.-H. and J.G.d.l.M.-C.; Investigation, J.A.R.-C.; Resources, J.A.R.-C., F.S.-R., G.E.G.-R. and C.F.B.-S.; Data curation, J.M.V.-H., F.S.-R., G.E.G.-R. and C.F.B.-S.; Writing—original draft, J.M.V.-H.; Writing—review & editing, J.A.R.-C., D.R.G.-E., F.S.-R. and A.G.-R.; Visualization, N.D.-P., D.R.G.-E., G.E.G.-R. and J.G.d.l.M.-C.; Supervision, J.A.R.-C. and N.D.-P. All authors have read and agreed to the published version of the manuscript.

Funding

This research received no external funding.

Data Availability Statement

A data base is added as supplementary file.

Conflicts of Interest

The authors declare no conflict of interest.

References

  1. Couto, R.S.; Martins, A.C.; Bolson, M.; Lopez, R.C.; Smidt, E.C.; Braga, J.M.A. Time calibrated tree of Dioscorea (Dioscoreaceae) indicates four origins of yams in the Neotropics since the Eocene. Bot. J. Linn. Soc. 2018, 188, 144–160. [Google Scholar] [CrossRef]
  2. Martin, F.W.; Ortiz, S. New chromosome numbers in some Dioscorea species. Cytologia 1966, 31, 105–107. [Google Scholar] [CrossRef] [Green Version]
  3. Álvarez, Q.V.; Caso, B.L.; Aliphat, F.M.; Galmiche, T.Á. Plantas medicinales con propiedades frías y calientes en la cultura Zoque de Ayapa. Tabasco, México. Boletín Latinoam. Caribe Plantas Med. Aromáticas 2017, 16, 428–454. [Google Scholar]
  4. Zhang, S.; Fan, M.; Ye, G.; Zhang, H.; Xie, J. Biorefinery of Dioscorea composita Hemsl with ferric chloride for saponins conversion to diosgenin and recycling the waste to biomethane. Ind. Crops Prod. 2019, 135, 122–129. [Google Scholar] [CrossRef]
  5. Wei, M.; Bai, Y.; Ao, M.; Jin, W.; Yu, P.; Zhu, M.; Yu, L. Novel method utilizing microbial treatment for cleaner production of diosgenin from Dioscorea zingiberensis CH Wright (DZW). Bioresour. Technol. 2013, 146, 549–555. [Google Scholar] [CrossRef] [PubMed] [Green Version]
  6. Román-Cortés, N.R.; García-Mateos, M.D.R.; Castillo-González, A.M.; Sahagún-Castellanos, J.; Jiménez-Arellanes, M.A. Características nutricionales y nutracéuticas de hortalizas de uso ancestral en México. Rev. Fitotec. Mex. 2018, 41, 245–253. [Google Scholar] [CrossRef] [Green Version]
  7. Odimegwu, J.I.; Sangwan, N.S.; Chanotiya, C.S.; Steve, O.; Abiodun, O.O. Developmental ultrastrutcture microscopy in drug discovery from Dioscorea species. BioRxiv 2023. [Google Scholar] [CrossRef]
  8. García, M.G.; Jaramillo, V.J.; Martínez, Y.A.; Maass, M.; Sarukhán, J.; Nava, M.M.; Araiza, S. ¿Pueden los bosques tropicales resistir o recuperarse del impacto de los huracanes? Rev. Digit. Univ. 2020, 21. [Google Scholar] [CrossRef]
  9. Bolaños, G.B. Biopolíticas del cambio climático para Centroamérica. Trace 2018, 74, 135–158. [Google Scholar] [CrossRef] [Green Version]
  10. Ruiz-Corral, J.A.; Medina-García, G.; Flores-López, H.E.; Ramírez-Díaz, J.L.; De la Cruz-Larios, L.; Villalpando-Ibarra, J.F.; Ruiz-Álvarez, O. Impacto del cambio climático sobre la estación de crecimiento en el estado de Jalisco, México. Rev. Mex. Cienc. Agrícolas 2016, 13, 2627–2638. [Google Scholar]
  11. Lobato, S.R.; Altamirano, C.M.A. Detección de la tendencia local del cambio de la temperatura en México. Tecnol. Cienc. Agua 2017, 8, 101–116. [Google Scholar] [CrossRef]
  12. Rodríguez, M.V.M.; Medina, G.G.; Díaz, P.G.; Ruiz, C.J.A.; Estrada, A.J.E.; Mauricio, R.J.E. ¿Por qué México es un país altamente vulnerable al cambio climático? Rev. Mex. Cienc. Agrícolas 2021, 25, 45–57. [Google Scholar] [CrossRef]
  13. Mora, C.; Caldwell, I.R.; Caldwell, J.M.; Fisher, M.R.; Brandon, M.G.; Running, S.W. Suitable days for plant growth disappear under projected climate change: Potential human and biotic vulnerability. PLoS ONE Biol. 2015, 587, e1002167. [Google Scholar] [CrossRef] [Green Version]
  14. Ruiz-Corral, J.A.; Medina-García, G.; Ramírez-Díaz, J.L.; Flores López, H.E.; Ramírez Ojeda, G.; Manríquez-Olmos, J.D.; Mora Orozco, C.D.L. Cambio climático y sus implicaciones en cinco zonas productoras de maíz en México. Rev. Mex. Cienc. Agrícolas 2011, 2, 309–323. [Google Scholar]
  15. Barrera-Sánchez, C.F.; Ruiz-Corral, J.A.; Zarazúa, V.P.; Lépiz, I.R.; González, E.D.R. Cambio climático y distribución potencial de frijol lima en Mesoamérica y Aridoamérica. Rev. Mex. Cienc. Agrícolas 2020, 11, 1361–1375. [Google Scholar] [CrossRef]
  16. Yu, S.; Yang, L.; Gao, K.; Zhou, J.; Lan, X.; Xie, J.; Zhong, C. Dioscorea composita WRKY5 positively regulates AtSOD1 and AtABF2 to enhance drought and salt tolerances. Plant Cell Rep. 2023, 42, 1–14. [Google Scholar] [CrossRef] [PubMed]
  17. Toriz-Robles, N.; Ramírez-Guzmán, M.E.; Fernández-Ordoñez, Y.M.; Soria-Ruiz, J.; Ybarra-Moncada, M.C. Comparación de modelos lineales y no lineales para estimar el riesgo de contaminación de suelos. Agrociencia 2019, 53, 269–283. [Google Scholar]
  18. Çoban, H.O.; Örücü, Ö.K.; Arslan, E.S. MaxEnt Modeling for Predicting the Current and Future Potential Geographical Distribution of Quercus libani Olivier. Sustainability 2020, 12, 2671. [Google Scholar] [CrossRef] [Green Version]
  19. Shen, L.; Xu, J.; Luo, L.; Hu, H.; Meng, X.; Li, X.; Chen, S. Predicting the potential global distribution of diosgenin-contained Dioscorea especie. Chin. Med. 2018, 13, 58. [Google Scholar] [CrossRef]
  20. Khan, A.M.; Li, Q.; Saqib, Z.; Khan, N.; Habib, T.; Khalid, N.; Tariq, A. MaxEnt Modelling and Impact of Climate Change on Habitat Suitability Variations of Economically Important Chilgoza Pine (Pinus gerardiana Wall.) in South Asia. Forests 2022, 13, 715. [Google Scholar] [CrossRef]
  21. Kong, F.; Tang, L.; He, H.; Yang, F.; Tao, J.; Wang, W. Assessing the impact of climate change on the distribution of Osmanthus fragrans using Maxent. Environ. Sci. Pollut. Res. 2021, 28, 34655–34663. [Google Scholar] [CrossRef] [PubMed]
  22. Sánchez-González, J.D.J.; Ruiz, C.J.A.; García, G.M.; Ojeda, G.R.; Larios, L.D.L.C.; Holland, J.B.; García, R.G.E. Ecogeography of teosinte. PLoS ONE 2018, 13, e0192676. [Google Scholar] [CrossRef] [PubMed] [Green Version]
  23. Ruiz-Corral, J.A.; Medina-García, G.; García-Romero, G. Sistema de información agroclimática para México-Centroamérica. Rev. Mex. Cienc. Agrícolas 2018, 9, 1–10. [Google Scholar] [CrossRef] [Green Version]
  24. Eastman, J.R. Idrisi Selva Manual; Clark Labs, Clark University: Worcester, MA, USA, 2012; 322p. [Google Scholar]
  25. Bellouin, N.; Boucher, O.; Haywood, J.; Johnson, C.; Jones, A.; Rae, J.; Woodward, S. Improved Representation of Aerosols for HadGEM2; Hadley Centre Technical Note 73; Met Office Hadley Centre: Exeter, UK, 2007; 42p.
  26. Instituto de Ecología (INE). México Cuarta Comunicación Nacional ante la Convención Marco de las Naciones Unidas sobre Cambio Climático; Secretaría de Medio Ambiente y Recursos Naturales (SEMARNAT): Mexico City, Mexico, 2009; 274p. [Google Scholar]
  27. Conde, C.; Estrada, F.; Martinez, B.; Sánchez, O.; Gay, C. Regional climate change scenarios for México. Atmósfera 2011, 24, 125–140. [Google Scholar]
  28. Mejía, V.B.; Garmendia, Y.; Pineda, K.V.; Garcia, J.A.; Molina, J.R. Efectos del Cambio climático en Centroamérica. Rev. Iberoam. De Bioeconomía Y Cambio Climático 2022, 8, 2018–2044. [Google Scholar] [CrossRef]
  29. Zuza, E.J.; Maseyk, K.; Bhagwat, S.A.; De Sousa, K.; Emmott, A.; Rawes, W.; Araya, Y.N. Climate suitability predictions for the cultivation of macadamia (Macadamia integrifolia) in Malawi using climate change scenarios. PLoS ONE 2021, 16, e0257007. [Google Scholar] [CrossRef]
  30. Environmental Systems Research Institute (ESRI). ArcGIS Desktop: Release 10; Environmental Systems Research Institute: Redlands, CA, USA, 2010; 15p. [Google Scholar]
  31. Newbold, T. Applications and limitations of museum data for conservation and ecology, with particular attention to species distribution models. Prog. Phys. Geogr. 2010, 34, 3–22. [Google Scholar] [CrossRef]
  32. Boria, R.A.; Olson, L.; Goodman, S.M.; Anderson, R.P. Spatial filtering to reduce sampling bias can improve the performance of ecological niche models. Ecol. Model. 2014, 275, 73–77. [Google Scholar] [CrossRef]
  33. Core, T.R. R: A Language and Environment for Statistical Computing; R Foundation for Statistical Computing: Vienna, Austria, 2021. [Google Scholar]
  34. Jayasinghe, S.L.; Kumar, L. Modeling the climate suitability of tea [Camellia sinensis (L.) O. Kuntze] in Sri Lanka in response to current and future climate change scenarios. Agric. For. Meteorol. 2019, 272, 102–117. [Google Scholar] [CrossRef]
  35. Cobos, M.E.; Peterson, A.T.; Osorio, O.L.; Jiménez, G.D. An exhaustive analysis of heuristic methods for variable selection in ecological niche modeling and species distribution modeling. Ecol. Inform. 2019, 53, 100983. [Google Scholar] [CrossRef]
  36. Cao, Y.; DeWalt, R.E.; Robinson, J.L.; Tweddale, T.; Hinz, L.; Pessino, M. Using Maxent to model the historic distributions of stonefly species in Illinois streams: The effects of regularization and threshold selections. Ecol. Model. 2013, 259, 30–39. [Google Scholar] [CrossRef]
  37. Flores, T.M.; Ortiz, E.; Villaseñor, J.L. Modelos de nicho ecológico como herramienta para estimar la distribución de comunidades vegetales. Rev. Mex. Biodivers. 2019, 90, e902829. [Google Scholar] [CrossRef]
  38. Goettsch, B.; Urquiza, H.T.; Koleff, P.; Acevedo, G.F. Extinction risk of Mesoamerican crop wild relatives. Plants People Planet 2021, 3, 775–795. [Google Scholar] [CrossRef]
  39. Bowles, A.M.; Williamson, C.J.; Williams, T.A.; Lenton, T.M.; Donoghue, P.C. The origin and early evolution of plants. Trends Plant Sci. 2022, 28, 312–329. [Google Scholar] [CrossRef]
  40. Purseglove, J.W. Tropical Crops: Monocotyledons, 1st ed.; Experimental Agriculture: London, UK, 1972; p. 287. [Google Scholar]
  41. Villers, R.L.; Trejo, V.I. El Cambio Climático y la Yegetación en México; Instituto de Geografía, UNAM: Mexico City, Mexico, 2000; pp. 57–66. [Google Scholar]
  42. Kipling, R.P.; Topp, C.F.; Bannink, A.; Bartley, D.J.; Blanco, P.I.; Cortignani, R.; Eory, V. To what extent is climate change adaptation a novel challenge for agricultural modellers? Environ. Model. Softw. 2019, 120, 104492. [Google Scholar] [CrossRef]
  43. Téllez, V.O.; Ramírez, R.R.O. Las dioscóreas (Dioscoreaceae) del Estado de Morelos, México. An. Inst. Biol. Ser. Botánica 1992, 63, 67–99. [Google Scholar]
  44. Saikia, B.; Rawat, J.S.; Tag, H.; Das, A.K. An investigation on the taxonomy and ecology of Dioscorea in Arunachal Pradesh, India. J. Frontline Res. 2011, 1, 44–53. [Google Scholar]
  45. Rodríguez, W. Botánica, domesticación y fisiología del cultivo de ñame (Dioscorea alata). Agron. Mesoam. 2000, 11, 133–152. [Google Scholar] [CrossRef]
  46. González, V.M.E. El ñame (Dioscorea spp.). Características, usos y valor medicinal. Aspectos de importancia en el desarrollo de su cultivo. Cultiv. Trop. 2012, 33, 5–15. [Google Scholar]
  47. Coursey, D.G. Yams: Dioscorea spp. In Evolution of Crop Plants, 2nd ed.; Wiley: London, UK, 1976; pp. 70–74. [Google Scholar]
  48. Puga, B.E. Manejo Agronómico del Cultivo de Ñame, 2nd ed.; Guía Técnica MIDA: Panama City, Panama, 1995; p. 230. [Google Scholar]
  49. García, E. Modificaciones al Sistema de Clasificación Climática de Köppen (Para Adaptarlo a las Condiciones de la República Mexicana), 5th ed.; Instituto de Geografía UNAM-Enriqueta García: Mexico City, Mexico, 2004; p. 90. [Google Scholar]
  50. Onwueme, I.C. Sett weight effects on time of tuber formation, and on tuber yield characteristics, in water yam (Dioscorea alata L.). J. Agric. Sci. 1978, 91, 317–319. [Google Scholar] [CrossRef]
  51. Ruiz-Corral, J.A.; Medina, G.G.; González, A.I.J.; Flores, L.H.E.; Ramírez, O.G.; Ortiz, T.C.; Byerly, M.K.F.; Martínez, P.A.R.A. Requerimientos Agroecológicos de Cultivos, 2nd ed.; INIFAP-Prometeo Editores: Guadalajara Jalisco, Mexico, 2013; p. 564. [Google Scholar]
  52. FAO. ECOCROP Food and Agriculture Organization of the United Nations Database. Available online: https://www.fao.org/statistics/en/ (accessed on 5 May 2022).
  53. Phillips, S.J.; Anderson, R.P.; Schapire, R.E. Maximum entropy modeling of species geographic distributions. Ecol. Model. 2006, 190, 231–259. [Google Scholar] [CrossRef] [Green Version]
  54. Reynoso, S.R.; Pérez, H.M.J.; López, B.W.; Hernández, R.J.; Muñoz, F.H.J.; Cob, U.J.V.; Reynoso, S.M.D. El nicho ecológico como herramienta para predecir áreas potenciales de dos especies. Rev. Mex. Cienc. For. 2018, 9, 47–68. [Google Scholar] [CrossRef] [Green Version]
  55. Navarro, G.M.A.; Jove, C.C.A.; Ignacio, A.J.M. Modelamiento de nichos ecológicos de flora amenazada para escenarios de cambio climático en el departamento de Tacna-Perú. Colomb. For. 2020, 23, 51–67. [Google Scholar] [CrossRef]
  56. Khalil, T.; Asad, S.A.; Khubaib, N.; Baig, A.; Atif, S.; Umar, M.; Baig, S. Climate change and potential distribution of potato (Solanum tuberosum) crop cultivation in Pakistan using Maxent. AIMS Agric. Food 2021, 6, 663–676. [Google Scholar] [CrossRef]
  57. Sork, V.; Davis, F.; Westfall, R.; Flints, A.; Ikegami, M.; Wang, H.; Grivet, D.D. Gene movements and genetic association with regional gradients in California valley oak (Quercus lobata Née) in the face of climate change. Mol. Ecol. 2010, 19, 3806–3823. [Google Scholar] [CrossRef]
  58. Ovando, H.N.; Tun, J.; Mendoza, G.G.; Parra, T.V. Efecto del cambio climático en la distribución de especies clave en la vegetación de duna costera en la península de Yucatán, México. Rev. Mex. Biodivers. 2020, 91. [Google Scholar] [CrossRef]
  59. Du, Z.X.; Wu, J.; Meng, X.X.; Li, J.H.; Huang, L.F. Predicting the global potential distribution of four endangered Panax species in middle-and low-latitude regions of China by the geographic information system for global medicinal plants (GMPGIS). Molecules 2017, 22, 1630. [Google Scholar] [CrossRef] [Green Version]
  60. Munar, A.M.; Carlosama, A.R.; España, J.L.M. Potenciales áreas cultivables de pasifloras en una región tropical considerando escenarios de cambio climático. Rev. De Investig. Agrar. Ambient. 2022, 13, 109–129. [Google Scholar] [CrossRef]
  61. Louthan, A.M.; Morris, W. Climate change impacts on population growth across a species’ range differ due to nonlinear responses of populations to climate and variation in rates of climate change. PLoS ONE 2021, 16, e0247290. [Google Scholar] [CrossRef]
  62. Varela, S.; Mateo, R.G.; García-Valdés, R.; Fernández-González, F. Macroecología y ecoinformática: Sesgos, errores y predicciones en el modelado de distribuciones. Ecosistemas 2014, 23, 46–53. [Google Scholar]
Figure 1. Current distribution of D. composita in the agro-climatic regions of México and Central America.
Sustainability 15 12320 g001
Figure 2. Models obtained and evaluated by Kuenm R-Package for D. composita.
Sustainability 15 12320 g002
Figure 3. Jackknife test of the relative importance of predictor environmental variables in MaxEnt model for D. composita in México and Central America. The dark blue bars show that the variable with the greatest individual contribution is BIO07.
Sustainability 15 12320 g003
Figure 4. Current (black points) and potential distribution (Environmental suitability areas) for D. composta in México and Central America.
Sustainability 15 12320 g004
Figure 5. Current and potential distribution of D. composita under three climatic scenarios: (a) 1961–2010; (b) year 2050, rcp 4.5; (c) year 2050, rcp 8.5. Areas of contraction and expansion of environmental suitability are shown in orange and green colors, respectively.
Sustainability 15 12320 g005
Table 1. Sources of occurrence data for D. composita in México–Central America.
InstitutionAccessions
Universidad Nacional Autónoma de México (Instituto de Biología)179
Instituto Nacional de Ecología y Cambio Climático131
Instituto Nacional de Estadística, Geografía e Informática (Dep. Botánica)3
Universidad Autónoma de Veracruz (Centro de Investigaciones Tropicales)1
Universidad Autónoma de Veracruz (Instituto de Investigaciones Biológicas)10
Colegio de la Frontera Sur (Unidad Tapachula)5
Universidad Autónoma de Chiapas5
Universidad Autónoma de Puebla4
Universidad Juárez Autónoma de Tabasco5
Universidad Autónoma Benito Juárez de Oaxaca4
Universidad Autónoma de Guerrero8
JSTOR Plant Science and the Global Plants Initiative3
Trópicos.org1
Red de Herbarios del Noroeste de México.16
Comisión Nacional para el Conocimiento y Uso de la Biodiversidad (Herbario Digital)7
Global Biodiversity Information Facility (GBIF)26
Total408
Table 2. Environmental variables considered in this research.
VariableDescriptionTemporal Scale
BIO01(Annual mean temperature)Annual
BIO05(Maximum temperature of the warmest month)Month
BIO06(Minimum temperature of the coldest month)Month
BIO07Temperature annual rangeAnnual
BIO08(Mean temperature of the wettest quarter)Quarter
BIO09(Mean temperature of the driest quarter)Quarter
BIO10(Mean temperature of the warmest quarter)Quarter
BIO11(Mean temperature of the coldest quarter)Quarter
BIO12Annual precipitationAnnual
BIO13Precipitation of the wettest monthMonth
BIO14Precipitation of the driest monthMonth
BIO16Precipitation of the wettest quarterQuarter
BIO17Precipitation of the driest quarterQuarter
BIO18Precipitation of the warmest quarterQuarter
BIO19Precipitation of the coldest quarterQuarter
N-AMTNovember-April mean temperatureSeasonal
M-OMTMay–October mean temperatureSeasonal
M-OXTMay–October maximum temperatureSeasonal
N-AXTNovember–April maximum temperatureSeasonal
AXTAnnual maximum temperatureAnnual
M-OITMay–October minimum temperatureSeasonal
N-AITNovember–April minimum temperatureSeasonal
AITAnnual minimum temperatureAnnual
ATOAnnual thermal oscillationAnnual
M-OPMay–October precipitationSeasonal
N-APNovember–April PrecipitationSeasonal
M-OPHMay–October photoperiodSeasonal
N-APHNovember–April photoperiodSeasonal
AMAIAnnual moisture availability indexAnnual
M-OMIMay–October moisture availability indexSeasonal
N-AMINovember–April moisture availability indexSeasonal
Table 3. Selection criteria to select the optimal ecological niche model.
Criteria
All candidate models
Statistically significant models
Models meeting omission rate criteria
Models meeting AICc criteria
Models meeting high AUC value
Statistically significant models meeting omission rate criteria
Statistically significant models meeting AICc criteria
Statistically significant models meeting high AUC value
Statistically significant models meeting omission rate criteria, AICc criteria, and AUC criteria
Table 4. Intervals of annual moisture availability index and annual mean temperature for 10 agro-climatic regions of México–Central America where D. composita is currently distributed.
Agro-Climatic RegionAnnual Moisture Availability IndexAnnual Mean Temperature (°C)
Semi-arid, very warm0.2 to 0.5>26
Dry, sub-humid, very warm0.5 to 0.65>26
Dry, sub-humid, temperate0.5 to 0.6512 to 18
Humid, sub-humid, semi-warm0.65 to 1.018 to 22
Humid, sub-humid, warm0.65 to 1.022 to 26
Humid, sub-humid, very warm0.65 to 1.0>26
Humid, temperate>1.012 to 18
Humid, semi-warm>1.018 to 22
Humid, warm>1.022 to 26
Humid, very warm>1.0>26
Table 5. Ecological descriptors of D. composita, based on 1961–2010 average values.
VariableMinimumMaximumOptimum
Annual mean moisture index0.494.951.128–2.932
May–October mean moisture index0.9210.522.02–4.78
November–April mean moisture index0.0263.820.62–2.62
Annual mean precipitation73748741940–3839
May–October mean precipitation (mm)64836581524–2880
November–April mean precipitation (mm)261657416–1059
Annual mean temperature12.12923–28
Annual mean maximum temperature173528–33.5
Annual mean minimum temperature7.22318–22.5
May–October mean temperature1131.924–29
May–October mean maximum temperature15.539.429–35
May–October mean minimum temperature6.5124.519–23
November–April mean temperature11.630.322–26.9
November–April mean maximum temperature17.835.726.5–32
November–April mean minimum temperature5.524.917.5–21.8
May–October mean photoperiod12.3013.5912.90–11.15
November–April mean photoperiod10.4411.7011.27–11.50
Annual mean thermal oscillation8.2221.1010.1–12.9
Annual range of temperature11.7322.416.87–20.15
Elevation530015–1125
Table 6. Characteristics of the model selected to depict the potential distribution of D. composita in México–Central America.
ParameterValue
AUC of the ROC Curve0.946
Mean AUC Ratio1.668
Omission rate (%)1.22
AICc10,559.57
Delta AICc0
W AICc0.999
Optimum regularization multiplier2.0
Table 7. Contribution of seven environmental variables to depict the presence and distribution of D. composita.
Environmental VariablesContribution (%)Permutation Importance (%)
Annual moisture availability index38.43.5
November–April photoperiod20.726.8
Annual thermal oscillation17.19.5
May–October moisture index9.142.7
November–April moisture availability index8.46.2
Precipitation of the driest month3.72.9
Mean temperature of the coldest quarter2.58.3
Table 8. Current (1961–2010) and predicted environmental suitability by the year 2050 for Dioscorea composita in México–Central America.
Area (km2)
1961–20102050 RCP4.52050 RCP8.5
Environmental suitability692,123365,680763,589
Suitability expansion 46,826154,530
Suitability contraction 373,26983,064
Suitability without change 318,854609,059
Disclaimer/Publisher’s Note: The statements, opinions and data contained in all publications are solely those of the individual author(s) and contributor(s) and not of MDPI and/or the editor(s). MDPI and/or the editor(s) disclaim responsibility for any injury to people or property resulting from any ideas, methods, instructions or products referred to in the content.

