
AI and Big Data-Empowered Low-Carbon Buildings: Challenges and Prospects


Abstract
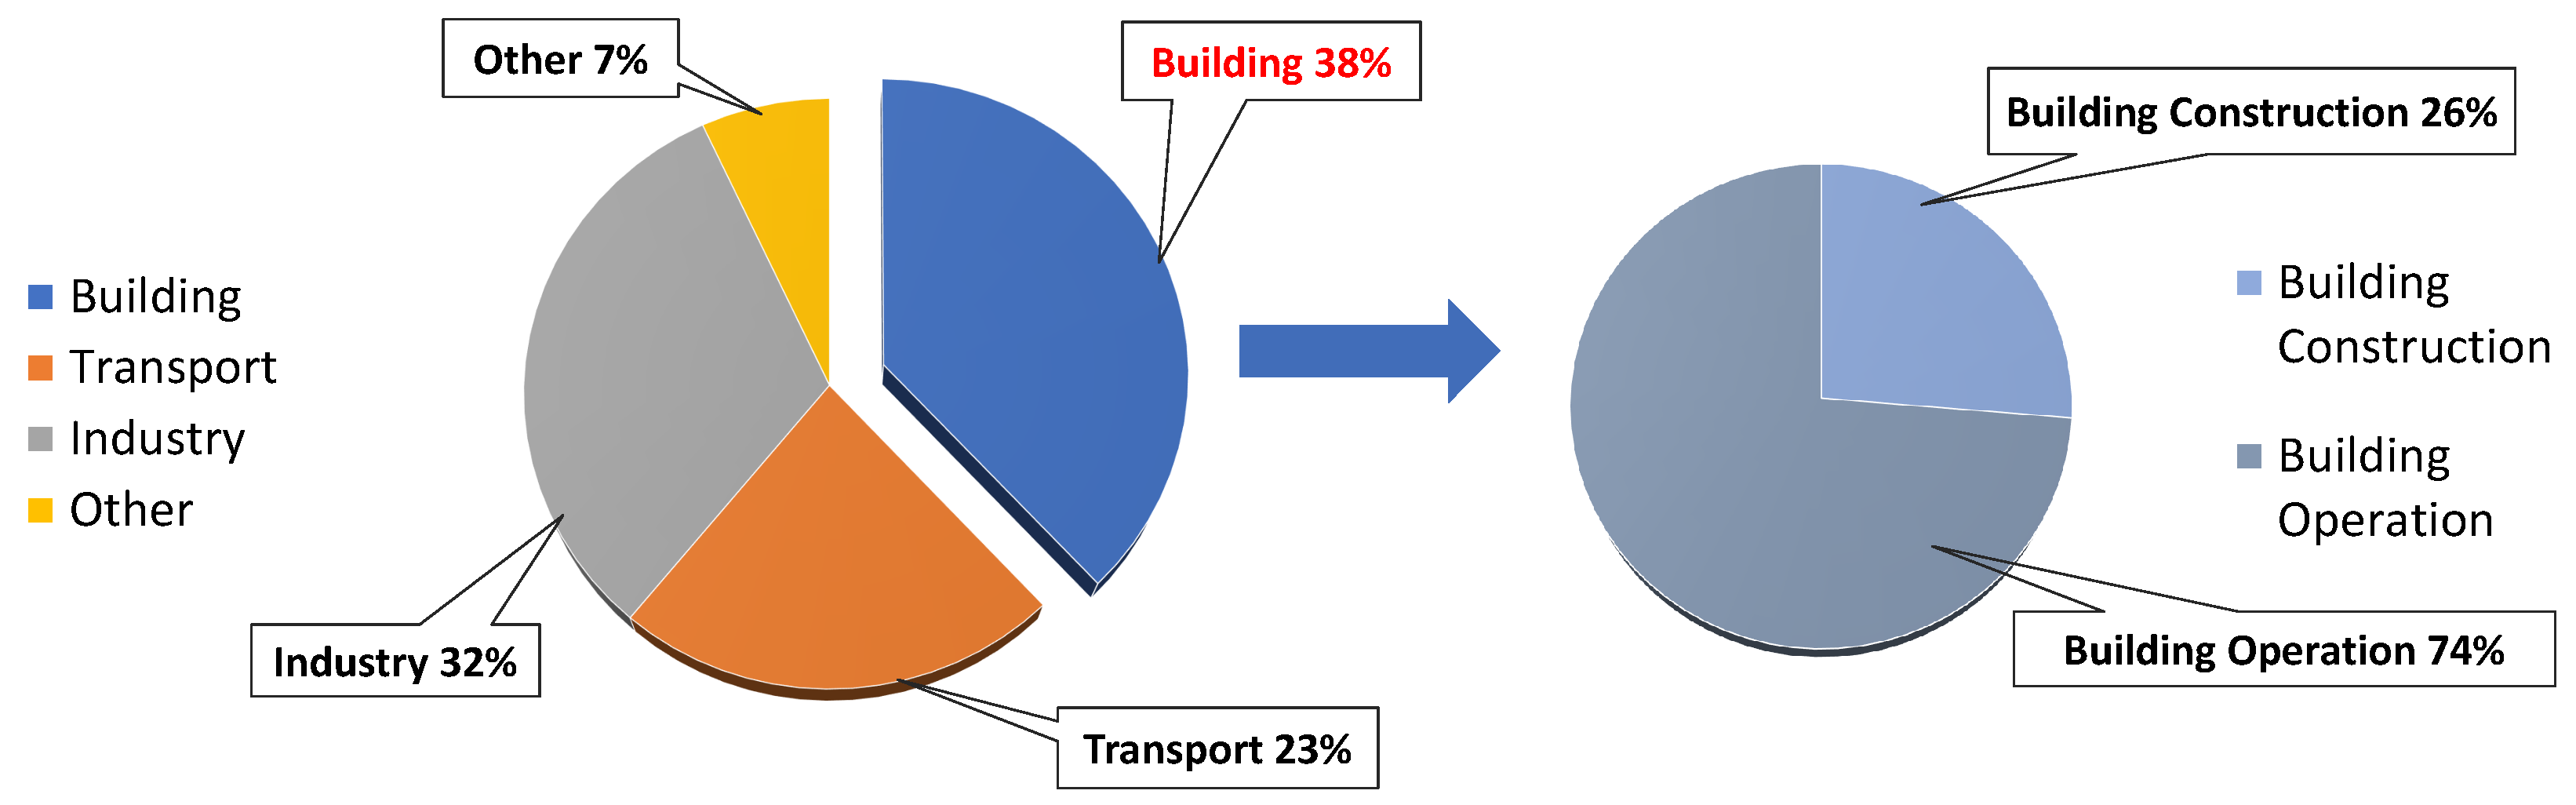
:1. Introduction
2. AI and Big Data Technology in Building Energy Saving and Carbon Reduction
2.1. Data Preprocessing and Analysis
2.2. Building Energy Consumption Detection and Prediction Based on Machine Learning Method
3. Machine Learning-Based Approaches for Building Low Carbon
- The distribution of people in the building has a significant influence on the energy consumption of the building, but currently, only relying on the camera to capture has limitations: the recognition effect of the dark area is not ideal; when the line of sight is blocked, it is inaccurate; the camera is affected by the installation position; and there are visual blind spots. Sometimes, camera installation is not allowed due to privacy protection [34].
- In addition, due to the large randomness of human behavior trajectories, the current work is not solid enough on the analysis and research based on human behavior.
- To achieve significant building energy conservation and carbon reduction goals, it is necessary to precisely control a large number of building electrical appliances in the building. This requires the collection of the electricity consumption information of local units in the building (such as user rooms), but the detailed electricity consumption information may hide users’ privacy data [35], for example, the user’s activity pattern can be inferred by analyzing the user’s daily electricity consumption.
3.1. Grid Generation Control Approach
3.2. System Operation Optimization Approach
3.3. Application for Electricity Markets
3.4. Applications for Electric Vehicles
4. Big Data Driven Carbon Emission Accounting
4.1. Regional Building Accounting Method
4.2. Single Building Accounting Method
5. Challenges and Prospects
- Collect more comprehensive data: Traditional methods of calculating carbon emissions may need more key data, such as actual energy use. Big data platforms can collect more comprehensive data to provide more comprehensive emission reduction calculations.
- Automated calculation process: The big data platform can use modern computing technology to quickly select different accounting standards to automate the calculation process and provide real-time data analysis and reporting, improving calculation efficiency and accuracy.
- Promote sustainable development: By establishing a big data platform to supervise building operation data, real-time monitoring and the accurate calculation of building carbon emissions can be realized, and energy waste and emission reduction opportunities can be identified. The platform will help the construction industry and relevant government agencies better understand the energy use of buildings, develop more effective emission reduction plans, and promote the sustainable development of the construction industry.
6. Conclusions
Author Contributions
Funding
Data Availability Statement
Conflicts of Interest
Nomenclature
| KNN | K-Nearest Neighbors |
| PCA | Principal Component Analysis |
| SVM | Support Vector Machine |
| BPNN | Back-Propagation Neural Network |
| GPR | Gaussian Process Regression |
| ANNs | Artificial Neural Networks |
| LSTM | Long Short-Term Memory Neural Network |
| RMSE | Root Mean Square Error |
| MAE | Mean Absolute Error |
| MAPE | Mean Absolute Percentage Error |
| CNN | Convolutional Neural Network |
| STIRPAT | Stochastic Impacts by Regression on Population, Affluence and Technology |
| CBCEM | Stochastic Impacts by Regression on Population, Affluence and Technology |
References
- IPCC. IPCC Fifth Assessment Report—Synthesis Report. Figshare. 2014. Available online: https://www.ipcc.ch/site/assets/uploads/2018/05/SYR_AR5_FINAL_full_wcover.pdf (accessed on 4 June 2023).
- Hoegh-Guldberg, O.; Jacob, D.; Bindi, M.; Brown, S.; Camilloni, I.; Diedhiou, A.; Djalante, R.; Ebi, K.; Engelbrecht, F.; Guiot, J.; et al. Impacts of 1.5 °C Global Warming on Natural and Human Systems. In Global Warming of 1.5 °C; Masson-Delmotte, V., Zhai, P., Pörtner, H., Roberts, D., Skea, J., Shukla, P., Pirani, A., Moufouma-Okia, W., Péan, C., Pidcock, R., et al., Eds.; IPCC Secretariat International: Geneva, Switzerland, 2018; pp. 175–311. [Google Scholar]
- Skillington, K.; Crawford, R.H.; Warren-Myers, G.; Davidson, K. A review of existing policy for reducing embodied energy and greenhouse gas emissions of buildings. Energy Policy 2022, 168, 112920. [Google Scholar] [CrossRef]
- Huang, H.; Zhou, Y.; Huang, R.; Wu, H.; Sun, Y.; Huang, G.; Xu, T. Optimum insulation thicknesses and energy conservation of building thermal insulation materials in Chinese zone of humid subtropical climate. Sustain. Cities Soc. 2020, 52, 101840. [Google Scholar] [CrossRef]
- United Nations Environment Programme. 2022 Global Status Report for Buildings and Construction. Figshare. 2022. Available online: https://www.unep.org/resources/publication/2022-global-status-report-buildings-and-construction (accessed on 4 June 2023).
- Jestin-Fleury, N. International energy agency. World energy outlook. Politique Étrangère 1994, 59, 564–565. [Google Scholar]
- Amasyali, K.; El-Gohary, N.M. A review of data-driven building energy consumption prediction studies. Renew. Sustain. Energy Rev. 2018, 81, 1192–1205. [Google Scholar] [CrossRef]
- Vahabi, N.; Michailidis, G. Unsupervised multi-omics data integration methods: A comprehensive review. Front. Genet. 2022, 13, 854752. [Google Scholar] [CrossRef]
- Zhao, L.; Huang, H.; Wang, W.; Zheng, Z. An accurate approach of device-free localization with attention empowered residual network. Appl. Soft Comput. 2023, 137, 110164. [Google Scholar] [CrossRef]
- Zhou, H.; Tian, X.; Yu, J.; Zhao, Y.; Lin, B.; Chang, C. Identifying buildings with rising electricity-consumption and those with high energy-saving potential for government’s management by data mining approaches. Energy Sustain. Dev. 2022, 66, 54–68. [Google Scholar] [CrossRef]
- Huang, H.; Zhao, H.; Li, X.; Ding, S.; Zhao, L.; Li, Z. An Accurate and Efficient Device-Free Localization Approach Based on Sparse Coding in Subspace. IEEE Access 2018, 6, 61782–61799. [Google Scholar] [CrossRef]
- Śmieja, M.; Struski, Ł.; Tabor, J.; Zieliński, B.; Spurek, P. Processing of missing data by neural networks. Adv. Neural Inf. Process. Syst. 2018, 31. Available online: https://api.semanticscholar.org/CorpusID:29167738 (accessed on 4 June 2023).
- Honghai, F.; Guoshun, C.; Cheng, Y.; Bingru, Y.; Yumei, C. A SVM regression based approach to filling in missing values. In Proceedings of the International Conference on Knowledge-Based and Intelligent Information and Engineering Systems, Melbourne, Australia, 14–16 September 2005; Springer: Cham, Swizerland, 2005; pp. 581–587. [Google Scholar]
- Xie, Y.; Wang, S.; Zhang, G.; Fan, Y.; Fernandez, C.; Blaabjerg, F. Optimized multi-hidden layer long short-term memory modeling and suboptimal fading extended Kalman filtering strategies for the synthetic state of charge estimation of lithium-ion batteries. Appl. Energy 2023, 336, 120866. [Google Scholar] [CrossRef]
- Deng, Z.; Xu, L.; Liu, H.; Hu, X.; Duan, Z.; Xu, Y. Prognostics of battery capacity based on charging data and data-driven methods for on-road vehicles. Appl. Energy 2023, 339, 120954. [Google Scholar] [CrossRef]
- Sendra-Arranz, R.; Gutiérrez, A. A long short-term memory artificial neural network to predict daily HVAC consumption in buildings. Energy Build. 2020, 216, 109952. [Google Scholar] [CrossRef]
- Wang, S.; Xu, X. Simplified building model for transient thermal performance estimation using GA-based parameter identification. Int. J. Therm. Sci. 2006, 45, 419–432. [Google Scholar] [CrossRef]
- Acheampong, A.O.; Boateng, E.B. Modelling carbon emission intensity: Application of artificial neural network. J. Clean. Prod. 2019, 225, 833–856. [Google Scholar] [CrossRef]
- Yu, L.; Qin, S.; Zhang, M.; Shen, C.; Jiang, T.; Guan, X. A review of deep reinforcement learning for smart building energy management. IEEE Internet Things J. 2021, 8, 12046–12063. [Google Scholar] [CrossRef]
- Li, Q.; Meng, Q.; Cai, J.; Yoshino, H.; Mochida, A. Predicting hourly cooling load in the building: A comparison of support vector machine and different artificial neural networks. Energy Convers. Manag. 2009, 50, 90–96. [Google Scholar] [CrossRef]
- Seyedzadeh, S.; Rahimian, F.P.; Glesk, I.; Roper, M. Machine learning for estimation of building energy consumption and performance: A review. Vis. Eng. 2018, 6, 1–20. [Google Scholar] [CrossRef]
- Autoregressive Denoising Diffusion Models for Multivariate Probabilistic Time Series Forecasting. arXiv 2021, arXiv:2101.12072.
- First De-Trend then Attend: Rethinking Attention for Time-Series Forecasting. arXiv 2022, arXiv:2212.08151.
- Khan, Z.A.; Ullah, A.; Haq, I.U.; Hamdy, M.; Mauro, G.M.; Muhammad, K.; Hijji, M.; Baik, S.W. Efficient short-term electricity load forecasting for effective energy management. Sustain. Energy Technol. Assess. 2022, 53, 102337. [Google Scholar] [CrossRef]
- Khan, Z.A.; Hussain, T.; Ullah, A.; Rho, S.; Lee, M.; Baik, S.W. Towards efficient electricity forecasting in residential and commercial buildings: A novel hybrid CNN with a LSTM-AE based framework. Sensors 2020, 20, 1399. [Google Scholar] [CrossRef] [Green Version]
- Khan, Z.A.; Hussain, T.; Ullah, A.; Ullah, W.; Del Ser, J.; Muhammad, K.; Sajjad, M.; Baik, S.W. Modelling Electricity Consumption During the COVID19 Pandemic: Datasets, Models, Results and a Research Agenda. Energy Build. 2023, 294, 113204. [Google Scholar] [CrossRef] [PubMed]
- Ngo, N.T.; Pham, A.D.; Truong, T.T.H.; Truong, N.S.; Huynh, N.T. Developing a hybrid time-series artificial intelligence model to forecast energy use in buildings. Sci. Rep. 2022, 12, 15775. [Google Scholar] [CrossRef] [PubMed]
- Khalil, M.; McGough, A.S.; Pourmirza, Z.; Pazhoohesh, M.; Walker, S. Machine Learning, Deep Learning and Statistical Analysis for forecasting building energy consumption—A systematic review. Eng. Appl. Artif. Intell. 2022, 115, 105287. [Google Scholar] [CrossRef]
- Zhou, Y.; Wang, L.; Qian, J. Application of Combined Models Based on Empirical Mode Decomposition, Deep Learning, and Autoregressive Integrated Moving Average Model for Short-Term Heating Load Predictions. Sustainability 2022, 14, 7349. [Google Scholar] [CrossRef]
- Guefano, S.; Tamba, J.G.; Azong, T.E.W.; Monkam, L. Forecast of electricity consumption in the Cameroonian residential sector by Grey and vector autoregressive models. Energy 2021, 214, 118791. [Google Scholar] [CrossRef]
- Fan, C.; Wang, J.; Gang, W.; Li, S. Assessment of deep recurrent neural network-based strategies for short-term building energy predictions. Appl. Energy 2019, 236, 700–710. [Google Scholar] [CrossRef]
- Luo, X.; Oyedele, L.O. Forecasting building energy consumption: Adaptive long-short term memory neural networks driven by genetic algorithm. Adv. Eng. Inform. 2021, 50, 101357. [Google Scholar] [CrossRef]
- Su, K.; Wei, D.Z.; Lin, W.X. Influencing factors and spatial patterns of energy-related carbon emissions at the city-scale in Fujian province, Southeastern China. J. Clean. Prod. 2020, 244, 118840. [Google Scholar] [CrossRef]
- Ravi, S.; Climent-Pérez, P.; Florez-Revuelta, F. A review on visual privacy preservation techniques for active and assisted living. Multimed. Tools Appl. 2023, 1–41. [Google Scholar] [CrossRef]
- Wang, W.; Huang, H.; Zhang, L.; Su, C. Secure and efficient mutual authentication protocol for smart grid under blockchain. Peer-to-Peer Netw. Appl. 2021, 14, 2681–2693. [Google Scholar] [CrossRef]
- Yang, T.; Zhao, L.; Li, W.; Zomaya, A.Y. Reinforcement learning in sustainable energy and electric systems: A survey. Annu. Rev. Control. 2020, 49, 145–163. [Google Scholar] [CrossRef]
- Zhou, Y.; Lee, W.J.; Diao, R.; Shi, D. Deep reinforcement learning based real-time AC optimal power flow considering uncertainties. J. Mod. Power Syst. Clean Energy 2021, 10, 1098–1109. [Google Scholar] [CrossRef]
- Xi, L.; Wu, J.; Xu, Y.; Sun, H. Automatic generation control based on multiple neural networks with actor-critic strategy. IEEE Trans. Neural Netw. Learn. Syst. 2020, 32, 2483–2493. [Google Scholar] [CrossRef] [PubMed]
- Li, Y.; Wang, R.; Yang, Z. Optimal scheduling of isolated microgrids using automated reinforcement learning-based multi-period forecasting. IEEE Trans. Sustain. Energy 2021, 13, 159–169. [Google Scholar] [CrossRef]
- Lu, R.; Hong, S.H. Incentive-based demand response for smart grid with reinforcement learning and deep neural network. Appl. Energy 2019, 236, 937–949. [Google Scholar] [CrossRef]
- Wang, Z.; Hong, T. Reinforcement learning for building controls: The opportunities and challenges. Appl. Energy 2020, 269, 115036. [Google Scholar] [CrossRef]
- Yu, L.; Sun, Y.; Xu, Z.; Shen, C.; Yue, D.; Jiang, T.; Guan, X. Multi-agent deep reinforcement learning for HVAC control in commercial buildings. IEEE Trans. Smart Grid 2020, 12, 407–419. [Google Scholar] [CrossRef]
- Lu, R.; Hong, S.H.; Yu, M. Demand response for home energy management using reinforcement learning and artificial neural network. IEEE Trans. Smart Grid 2019, 10, 6629–6639. [Google Scholar] [CrossRef]
- Yu, L.; Xie, W.; Xie, D.; Zou, Y.; Zhang, D.; Sun, Z.; Zhang, L.; Zhang, Y.; Jiang, T. Deep reinforcement learning for smart home energy management. IEEE Internet Things J. 2019, 7, 2751–2762. [Google Scholar] [CrossRef] [Green Version]
- Xu, X.; Jia, Y.; Xu, Y.; Xu, Z.; Chai, S.; Lai, C.S. A multi-agent reinforcement learning-based data-driven method for home energy management. IEEE Trans. Smart Grid 2020, 11, 3201–3211. [Google Scholar] [CrossRef] [Green Version]
- Du, Y.; Zandi, H.; Kotevska, O.; Kurte, K.; Munk, J.; Amasyali, K.; Mckee, E.; Li, F. Intelligent multi-zone residential HVAC control strategy based on deep reinforcement learning. Appl. Energy 2021, 281, 116117. [Google Scholar] [CrossRef]
- Capper, T.; Gorbatcheva, A.; Mustafa, M.A.; Bahloul, M.; Schwidtal, J.M.; Chitchyan, R.; Andoni, M.; Robu, V.; Montakhabi, M.; Scott, I.J.; et al. Peer-to-peer, community self-consumption, and transactive energy: A systematic literature review of local energy market models. Renew. Sustain. Energy Rev. 2022, 162, 112403. [Google Scholar] [CrossRef]
- Cao, D.; Hu, W.; Xu, X.; Dragičević, T.; Huang, Q.; Liu, Z.; Chen, Z.; Blaabjerg, F. Bidding strategy for trading wind energy and purchasing reserve of wind power producer—A DRL based approach. Int. J. Electr. Power Energy Syst. 2020, 117, 105648. [Google Scholar] [CrossRef]
- Lu, R.; Hong, S.H.; Zhang, X. A dynamic pricing demand response algorithm for smart grid: Reinforcement learning approach. Appl. Energy 2018, 220, 220–230. [Google Scholar] [CrossRef]
- Yadlapalli, R.T.; Kotapati, A.; Kandipati, R.; Koritala, C.S. A review on energy efficient technologies for electric vehicle applications. J. Energy Storage 2022, 50, 104212. [Google Scholar] [CrossRef]
- Li, S.; Hu, W.; Cao, D.; Dragičević, T.; Huang, Q.; Chen, Z.; Blaabjerg, F. Electric vehicle charging management based on deep reinforcement learning. J. Mod. Power Syst. Clean Energy 2021, 10, 719–730. [Google Scholar] [CrossRef]
- Tang, X.; Chen, J.; Pu, H.; Liu, T.; Khajepour, A. Double deep reinforcement learning-based energy management for a parallel hybrid electric vehicle with engine start–stop strategy. IEEE Trans. Transp. Electrif. 2021, 8, 1376–1388. [Google Scholar] [CrossRef]
- Lu, Y.; Cui, P.; Li, D. Carbon emissions and policies in China’s building and construction industry: Evidence from 1994 to 2012. Build. Environ. 2016, 95, 94–103. [Google Scholar] [CrossRef]
- Wang, R.; Wang, Q.; Yao, S. Evaluation and difference analysis of regional energy efficiency in China under the carbon neutrality targets: Insights from DEA and Theil models. J. Environ. Manag. 2021, 293, 112958. [Google Scholar] [CrossRef]
- Johnston, D.; Lowe, R.; Bell, M. An exploration of the technical feasibility of achieving CO2 emission reductions in excess of 60% within the UK housing stock by the year 2050. Energy Policy 2005, 33, 1643–1659. [Google Scholar] [CrossRef]
- Zhu, Q.; Peng, X.; Wu, K. Calculation and decomposition of indirect carbon emissions from residential consumption in China based on the input–output model. Energy Policy 2012, 48, 618–626. [Google Scholar] [CrossRef]
- Yang, T.; Pan, Y.; Yang, Y.; Lin, M.; Qin, B.; Xu, P.; Huang, Z. CO2 emissions in China’s building sector through 2050: A scenario analysis based on a bottom-up model. Energy 2017, 128, 208–223. [Google Scholar] [CrossRef]
- Langevin, J.; Harris, C.B.; Reyna, J.L. Assessing the potential to reduce US building CO2 emissions 80% by 2050. Joule 2019, 3, 2403–2424. [Google Scholar] [CrossRef] [Green Version]
- Villamar, D.; Soria, R.; Rochedo, P.; Szklo, A.; Imperio, M.; Carvajal, P.; Schaeffer, R. Long-term deep decarbonisation pathways for Ecuador: Insights from an integrated assessment model. Energy Strategy Rev. 2021, 35, 100637. [Google Scholar] [CrossRef]
- Müller, A. Energy Demand Assessment for Space Conditioning and Domestic Hot Water: A Case Study for the Austrian Building Stock. Ph.D. Thesis, Vienna University of Technology, Vienna, Austria, 2015. [Google Scholar]
- Kranzl, L.; Hummel, M.; Müller, A.; Steinbach, J. Renewable heating: Perspectives and the impact of policy instruments. Energy Policy 2013, 59, 44–58. [Google Scholar] [CrossRef]
- Mata, É.; Kalagasidis, A.S.; Johnsson, F. A modelling strategy for energy, carbon, and cost assessments of building stocks. Energy Build. 2013, 56, 100–108. [Google Scholar] [CrossRef] [Green Version]
- Sandberg, N.H.; Næss, J.S.; Brattebø, H.; Andresen, I.; Gustavsen, A. Large potentials for energy saving and greenhouse gas emission reductions from large-scale deployment of zero emission building technologies in a national building stock. Energy Policy 2021, 152, 112114. [Google Scholar] [CrossRef]
- Sandberg, N.H.; Sartori, I.; Vestrum, M.I.; Brattebø, H. Using a segmented dynamic dwelling stock model for scenario analysis of future energy demand: The dwelling stock of Norway 2016–2050. Energy Build. 2017, 146, 220–232. [Google Scholar] [CrossRef]
- Chen, G.; Chen, H.; Chen, Z.; Zhang, B.; Shao, L.; Guo, S.; Zhou, S.; Jiang, M. Low-carbon building assessment and multi-scale input–output analysis. Commun. Nonlinear Sci. Numer. Simul. 2011, 16, 583–595. [Google Scholar] [CrossRef]
- Peng, C. Calculation of a building’s life cycle carbon emissions based on Ecotect and building information modeling. J. Clean. Prod. 2016, 112, 453–465. [Google Scholar] [CrossRef]
- Huang, B.; Gao, X.; Xu, X.; Song, J.; Geng, Y.; Sarkis, J.; Fishman, T.; Kua, H.; Nakatani, J. A life cycle thinking framework to mitigate the environmental impact of building materials. One Earth 2020, 3, 564–573. [Google Scholar] [CrossRef]
- Li, X.; Wang, C.; Kassem, M.A.; Wu, S.Y.; Wei, T.B. Case study on carbon footprint life-cycle assessment for construction delivery stage in China. Sustainability 2022, 14, 5180. [Google Scholar] [CrossRef]
- Zhang, X.; Liu, K.; Zhang, Z. Life cycle carbon emissions of two residential buildings in China: Comparison and uncertainty analysis of different assessment methods. J. Clean. Prod. 2020, 266, 122037. [Google Scholar] [CrossRef]
- Lian, Z.; Wang, W.; Huang, H.; Su, C. Layer-Based Communication-Efficient Federated Learning with Privacy Preservation. IEICE Trans. Inf. Syst. 2022, E105.D, 256–263. [Google Scholar] [CrossRef]
- Huang, H.; Zeng, X.; Zhao, L.; Qiu, C.; Wu, H.; Fan, L. Fusion of Building Information Modeling and Blockchain for Metaverse: A Survey. IEEE Open J. Comput. Soc. 2022, 3, 195–207. [Google Scholar] [CrossRef]


| Main Method | Advantages | Disadvantages |
|---|---|---|
| Normalization/standardization | It can avoid the mismatch of different feature weights and improve the convergence speed and effect of the model. | Outliers can affect normalization, and normalization can make some eigenvalues too small. |
| Common algorithms for data cleaning: regression imputation, hash-based deduplication, cluster-based outlier detection | Can improve data quality and avoid negative effects on the model. | Data cleaning may delete useful information, while filling missing values may introduce noise. |
| Common algorithms for data augmentation: random scaling, random speed perturbation, sentence rearrangement | Can increase the diversity of training data and improve model generalization ability. | Data augmentation may introduce noise, and increasing the number of training data also increases computational cost. |
| Feature selection | Can reduce the dimensionality of the feature space and improve model efficiency and generalization ability. | Feature selection may delete useful information and reduce model accuracy. |
| Feature scaling | It can avoid the mismatch of different feature weights and improve the convergence speed and effect of the model. | It may lead to errors and reduced model accuracy. |
| Model | Referring Studies | Field |
|---|---|---|
| Autoregressive (AR) model | Developing a hybrid time series artificial intelligence model to forecast energy use in buildings [27] | Traditional statistical model |
| Moving average (MA) model | Machine Learning, Deep Learning and Statistical Analysis for forecasting building energy consumption—A systematic review [28] | Traditional statistical model |
| Autoregressive moving average (ARMA) model | Application of Combined Model Based on Empirical Mode Decomposition, Deep Learning, and Autoregressive Integrated Moving Average Model for Short-Term Heating Load Predictions [29] | Traditional statistical model |
| Vector autoregressive (VAR) model | Forecast of electricity consumption in the Cameroonian residential sector by Grey and vector autoregressive model [30] | Traditional statistical model |
| Autoregressive integrated moving average (ARIMA) model | Application of Combined Model Based on Empirical Mode Decomposition, Deep Learning, and Autoregressive Integrated Moving Average Model for Short-Term Heating Load Predictions [29] | Traditional statistical model |
| Multi-layer perceptron (MLP) | Modelling carbon emission intensity: Application of artificial neural Network [18] | Machine learning and deep learning |
| Recurrent neural network (RNN) | Assessment of deep recurrent neural network-based strategies for short-term building energy predictions [31] | Machine learning and deep learning |
| Long and short-term memory network (LSTM) | Forecasting building energy consumption: Adaptive long-short term memory neural networks driven by genetic algorithm [32] | Machine learning and deep learning |
| Autoregressive neural networks | Autoregressive Denoising Diffusion Models for Multivariate Probabilistic Time Series Forecasting [22] | Machine learning and deep learning |
| Attention model | First De-Trend then Attend: Rethinking Attention for Time Series Forecasting [23] | Machine learning and deep learning |
Disclaimer/Publisher’s Note: The statements, opinions and data contained in all publications are solely those of the individual author(s) and contributor(s) and not of MDPI and/or the editor(s). MDPI and/or the editor(s) disclaim responsibility for any injury to people or property resulting from any ideas, methods, instructions or products referred to in the content. |
© 2023 by the authors. Licensee MDPI, Basel, Switzerland. This article is an open access article distributed under the terms and conditions of the Creative Commons Attribution (CC BY) license (https://creativecommons.org/licenses/by/4.0/).
Share and Cite
Huang, H.; Dai, D.; Guo, L.; Xue, S.; Wu, H. AI and Big Data-Empowered Low-Carbon Buildings: Challenges and Prospects. Sustainability 2023, 15, 12332. https://doi.org/10.3390/su151612332
Huang H, Dai D, Guo L, Xue S, Wu H. AI and Big Data-Empowered Low-Carbon Buildings: Challenges and Prospects. Sustainability. 2023; 15(16):12332. https://doi.org/10.3390/su151612332
Chicago/Turabian StyleHuang, Huakun, Dingrong Dai, Longtao Guo, Sihui Xue, and Huijun Wu. 2023. "AI and Big Data-Empowered Low-Carbon Buildings: Challenges and Prospects" Sustainability 15, no. 16: 12332. https://doi.org/10.3390/su151612332
APA StyleHuang, H., Dai, D., Guo, L., Xue, S., & Wu, H. (2023). AI and Big Data-Empowered Low-Carbon Buildings: Challenges and Prospects. Sustainability, 15(16), 12332. https://doi.org/10.3390/su151612332