Article

Optimizing Living Service Amenities for Diverse Urban Residents: A Supply and Demand Balancing Analysis

1
College of Landscape Architecture and Arts, Northwest A&F University, Xianyang 712100, China
2
School of Planning, University of Cincinnati, Cincinnati, OH 45221, USA
*
Author to whom correspondence should be addressed.
Sustainability 2023, 15(16), 12392; https://doi.org/10.3390/su151612392
Submission received: 17 July 2023 / Revised: 10 August 2023 / Accepted: 12 August 2023 / Published: 15 August 2023

Abstract

:
Urban residents’ well-being relies on fair access to living service amenities. To plan better living service amenities, planners need to balance supply and demand and find gaps and opportunities. We performed a spatial analysis of 2645 residential complexes in Xi’an, Shaanxi, China’s built-up area, using POI (Point of Interest), AOI (Area of Interest), and census and property data. We measured the supply status of 14 living service amenities by their number and distance and estimated the demand status of residents by their number and age. We also used location entropy and coupling coordination degree to measure the balance status. The results showed a spatial mismatch between supply and demand, with more amenities in the urban center where fewer and older residents lived, and fewer amenities in the suburbs where more and younger residents lived. The urban center had a location benefit but a lower coupling degree. The imbalance was mainly due to land finance and geographical segregation from unequal resource distribution. We also gave a visualization tool for planners to check any residential complex’s status and make informed decisions for amenity planning and construction.

1. Introduction

Urban living service amenities are public facilities that meet people’s needs, including tangible facilities and commodities as well as intangible environmental conditions and public services [1]. These amenities affect people’s choices about where to live and work [2], the urban environment and spatial structure, and the normal operations of an urban system [3]. The layout of amenities should correspond with the demand of residents and ensure equal access to living service amenities [4]. From 1978 to 2021, the urbanization rate of China increased from 18% to 65%, and the number of cities increased from 193 to 685 [5,6]. The rapid urban population growth has increased the residents’ demand for living service amenities [7]. However, the provision of amenities in new areas often lags behind population growth [8], resulting in an imbalance between supply and demand [9] and a spatial mismatch. For example, disadvantaged communities with low access to public services are concentrated in the suburbs [10], while high-quality public service resources are often concentrated in the urban center [11]. Residents living in the suburbs may commute to the city center to access these resources, which may increase travel distance, traffic congestion, and resource waste [12]. Therefore, it is essential to evaluate the supply–demand balance of living service amenities in an equitable way [13,14] to ensure different residents with an equally reasonable layout of amenities and resource sharing [15].
As a multidisciplinary and multifaceted research field, supply and demand analysis has attracted extensive and in-depth attention from scholars. The related theories have gradually expanded their focus to multiple suppliers’ and residents’ needs [16]. In foreign countries, from World War II to the 1970s, the welfare state system in developed countries held governments responsible for distributing public service amenities [17]. The analyses focused on the per capita equality of public service allocation [18] at the administrative district scale, but neglected people’s needs, the spatial distribution of amenities, and the benefits of services. However, in the 1970s, due to the stagflation in the European and North American economies, neoliberalism and opposition to government intervention emerged [19]. This led to the subsequent development of a new public management theory advocating market access for public services [20]. In contrast, in the late 1990s, the influence of neoliberalism on economic globalization and the growth of knowledge-based economies was increasingly criticized [21]. Consequently, a new approach emerged that integrated government intervention with free-market forces, resulting in multiple suppliers of living service amenities and the multi-supply theory of public services, influenced by regulation theory and the new public service theory [21]. Moreover, social differentiation and its influencing factors [22] informed the analysis of living service amenities by highlighting the goal of social justice in service supply [23] and the needs of different resident groups [24]. Similarly, in China, different theories influenced the amenity plan in different periods. For example, the welfare state theory guided the amenity plan in China during the planned economy period (1949–1978), when the government assumed a dominant role in amenity planning based on development plans [25]. Then, the new public management theory influenced the amenity plan in China during the market economy period (1978–present), when the government reduced its intervention and encouraged more market access for public services [26]. Finally, neo-endogenous development theory further influenced China during the new urbanization period (2014–present), when the government pursued high-quality development and balanced urban–rural development based on the principle of “people-oriented” [27]. As a result, the planning and the market were integrated into the amenity plan and construction [28] to be more responsive to the residents’ needs [29].
The main aspects of the analysis include the types, scales, and needs of living service amenities. Previous studies have investigated various types of living service amenities such as education [9], healthcare services [30], elderly care [31], urban green space [32], sports [33], and recreation [34]. These studies tend to address the site selection and layout optimization of living services amenities. Regarding the scale of analysis, there are city [14], district [30,35], and sub-district [1,16,36] scales, which aim to tackle the spatial mismatch between the amenities and residents at different scales. Different residents differ in their demand for living service amenities, and many studies have focused on the demand preferences of different groups [37], such as children [30], women [38], and the elderly [31], which explore the balance of supply and demand of living service amenities under different scenarios.
The methodologies used by the scholars fall into accessibility-based methods, index construction methods, and spatial matching methods. The widely used accessibility calculation methods include Euclidean distance, network analysis [39], the Gaussian-based two-step floating catchment area method [40], the P-Median Model [41], etc. The index construction methods, such as the Lorentz curve and Gini coefficient methods [42], social demand index [43], and Shannon–Wiener Index [36], facilitate quantitative analysis of supply and demand. The spatial matching methods, such as the gravity model method, the coupled coordination model, and bivariate spatial autocorrelation analysis [44], reveal the spatial matching relationship between residents and amenities. Meanwhile, the development of information technology and big data of higher spatial and temporal resolution has enabled researchers to effectively examine the spatial characteristics of the supply–demand relationship related to urban amenities [45]. The data sources such as POI, heatmap [14], and mobile phone signaling data [7] reflect the spatial distribution of amenities and residents as the basis. By drawing on these approaches, we have conducted in-depth analyses of the spatial characteristics of the demand–supply balance.
Based on previous studies, scholars have revealed that in large cities, there is a spatial mismatch between the residents and the living service amenities, and the spatial distribution is uneven [46]. Recently, scholars have proposed a more general solution to address this problem: a population-oriented spatial layout of service amenities, which can balance the spatial distribution of service amenities and make their scale appropriate to the demand of the residents [36]. However, the diverse demands based on population composition in different residential complexes are currently not fully considered in living service amenity planning and supply–demand balancing analysis. A residential complex is a group of residential buildings managed by a neighborhood committee where urban residents live. As a fine-grained unit of analysis in Chinese cities, it is suitable for socioeconomic studies, but data availability is a major obstacle. This issue has been repeatedly mentioned in the related studies as a direction for future research [1,16,47].
This study proposes to use novel AOI (Area of Interest) data from Amap to delineate the spatial boundaries and areas of residential complexes, which enables spatial matching with multiple living service amenities. Moreover, by integrating census data and property data, this study estimates the population size and composition of different age groups in each residential complex to assess the supply and demand balance of the living service amenities more accurately. Furthermore, we apply the location entropy and coupling coordination degree methods to analyze the balance between amenities and residents and derive some suggestions and applications for planning practice.
Nowadays, the populations and urban lands of many cities in developing countries in Asia, Africa, and Latin America continue to sprawl, and it is important to analyze the relationship between supply and demand in amenity planning. This study develops a new analytical and planning framework that leverages multiple-source data and multidisciplinary approaches to address the spatial mismatch of living service amenities according to diverse residents’ demands at the residential complex scale. This study provides a novel approach to acquiring and analyzing data for urban public facility planning. The approach is also a low-cost and easy-to-obtain method for obtaining population distribution and is useful for the area that lacks research material due to limited statistical data. It also offers visualization tools to support decision making in the planning and management of amenities and urban residential areas.

2. Materials and Methods

2.1. Study Area

As the capital of Shaanxi Province and an important central city in western China, Xi’an serves as a significant national base for scientific research, education, and industry. It is a famous cultural and tourist city in China and the world. It also functions as the hub of the Silk Road Economic Belt and the New Asia–Europe Continental Bridge. According to the 2021 Xi’an National Economic and Social Development Statistics Bulletin, the city has a population of 13,163,000, with an urbanization rate of 79.49% and a GDP of $155.64 billion [48]. Xi’an has a long history of urban development, with more than 3100 years of city building history and more than 1100 years as the national capital. Referring to the Spatial Planning of Xi’an [49], Xi’an’s main urban built-up area, surrounded by the Xi’an Ring Expressway and the Ba River, is identified as the study area of this study. Taking the 2465 residential complexes in the study area as the basic units, their supply and demand relationships with the surrounding living service amenities are analyzed. The study area and the basic units are shown in Figure 1.

2.2. Data Collection and Processing

This study employs multi-source spatial and non-spatial data, including POI (Point of Interest) and AOI (Area of Interest), the Seventh Census Data of Xi’an, administrative divisions, and property information.
  • POI are point-like data that represent various geographic entities in daily life, containing information such as latitude, longitude, and address, which can present the spatial distribution of urban elements in detail [50]. We obtained six dimensions of POI closely related to the daily lives of residents in September 2022 from the Map Lab API (https://lbs.amap.com) and the Urban Residential Complex Planning and Design Standards [51], as shown in Figure 2;
  • We obtained the 2022 AOI data of the Xi’an residential complexes from the Map Lab, which can reflect the spatial size and land use scale of each residential complex for land use identification [52];
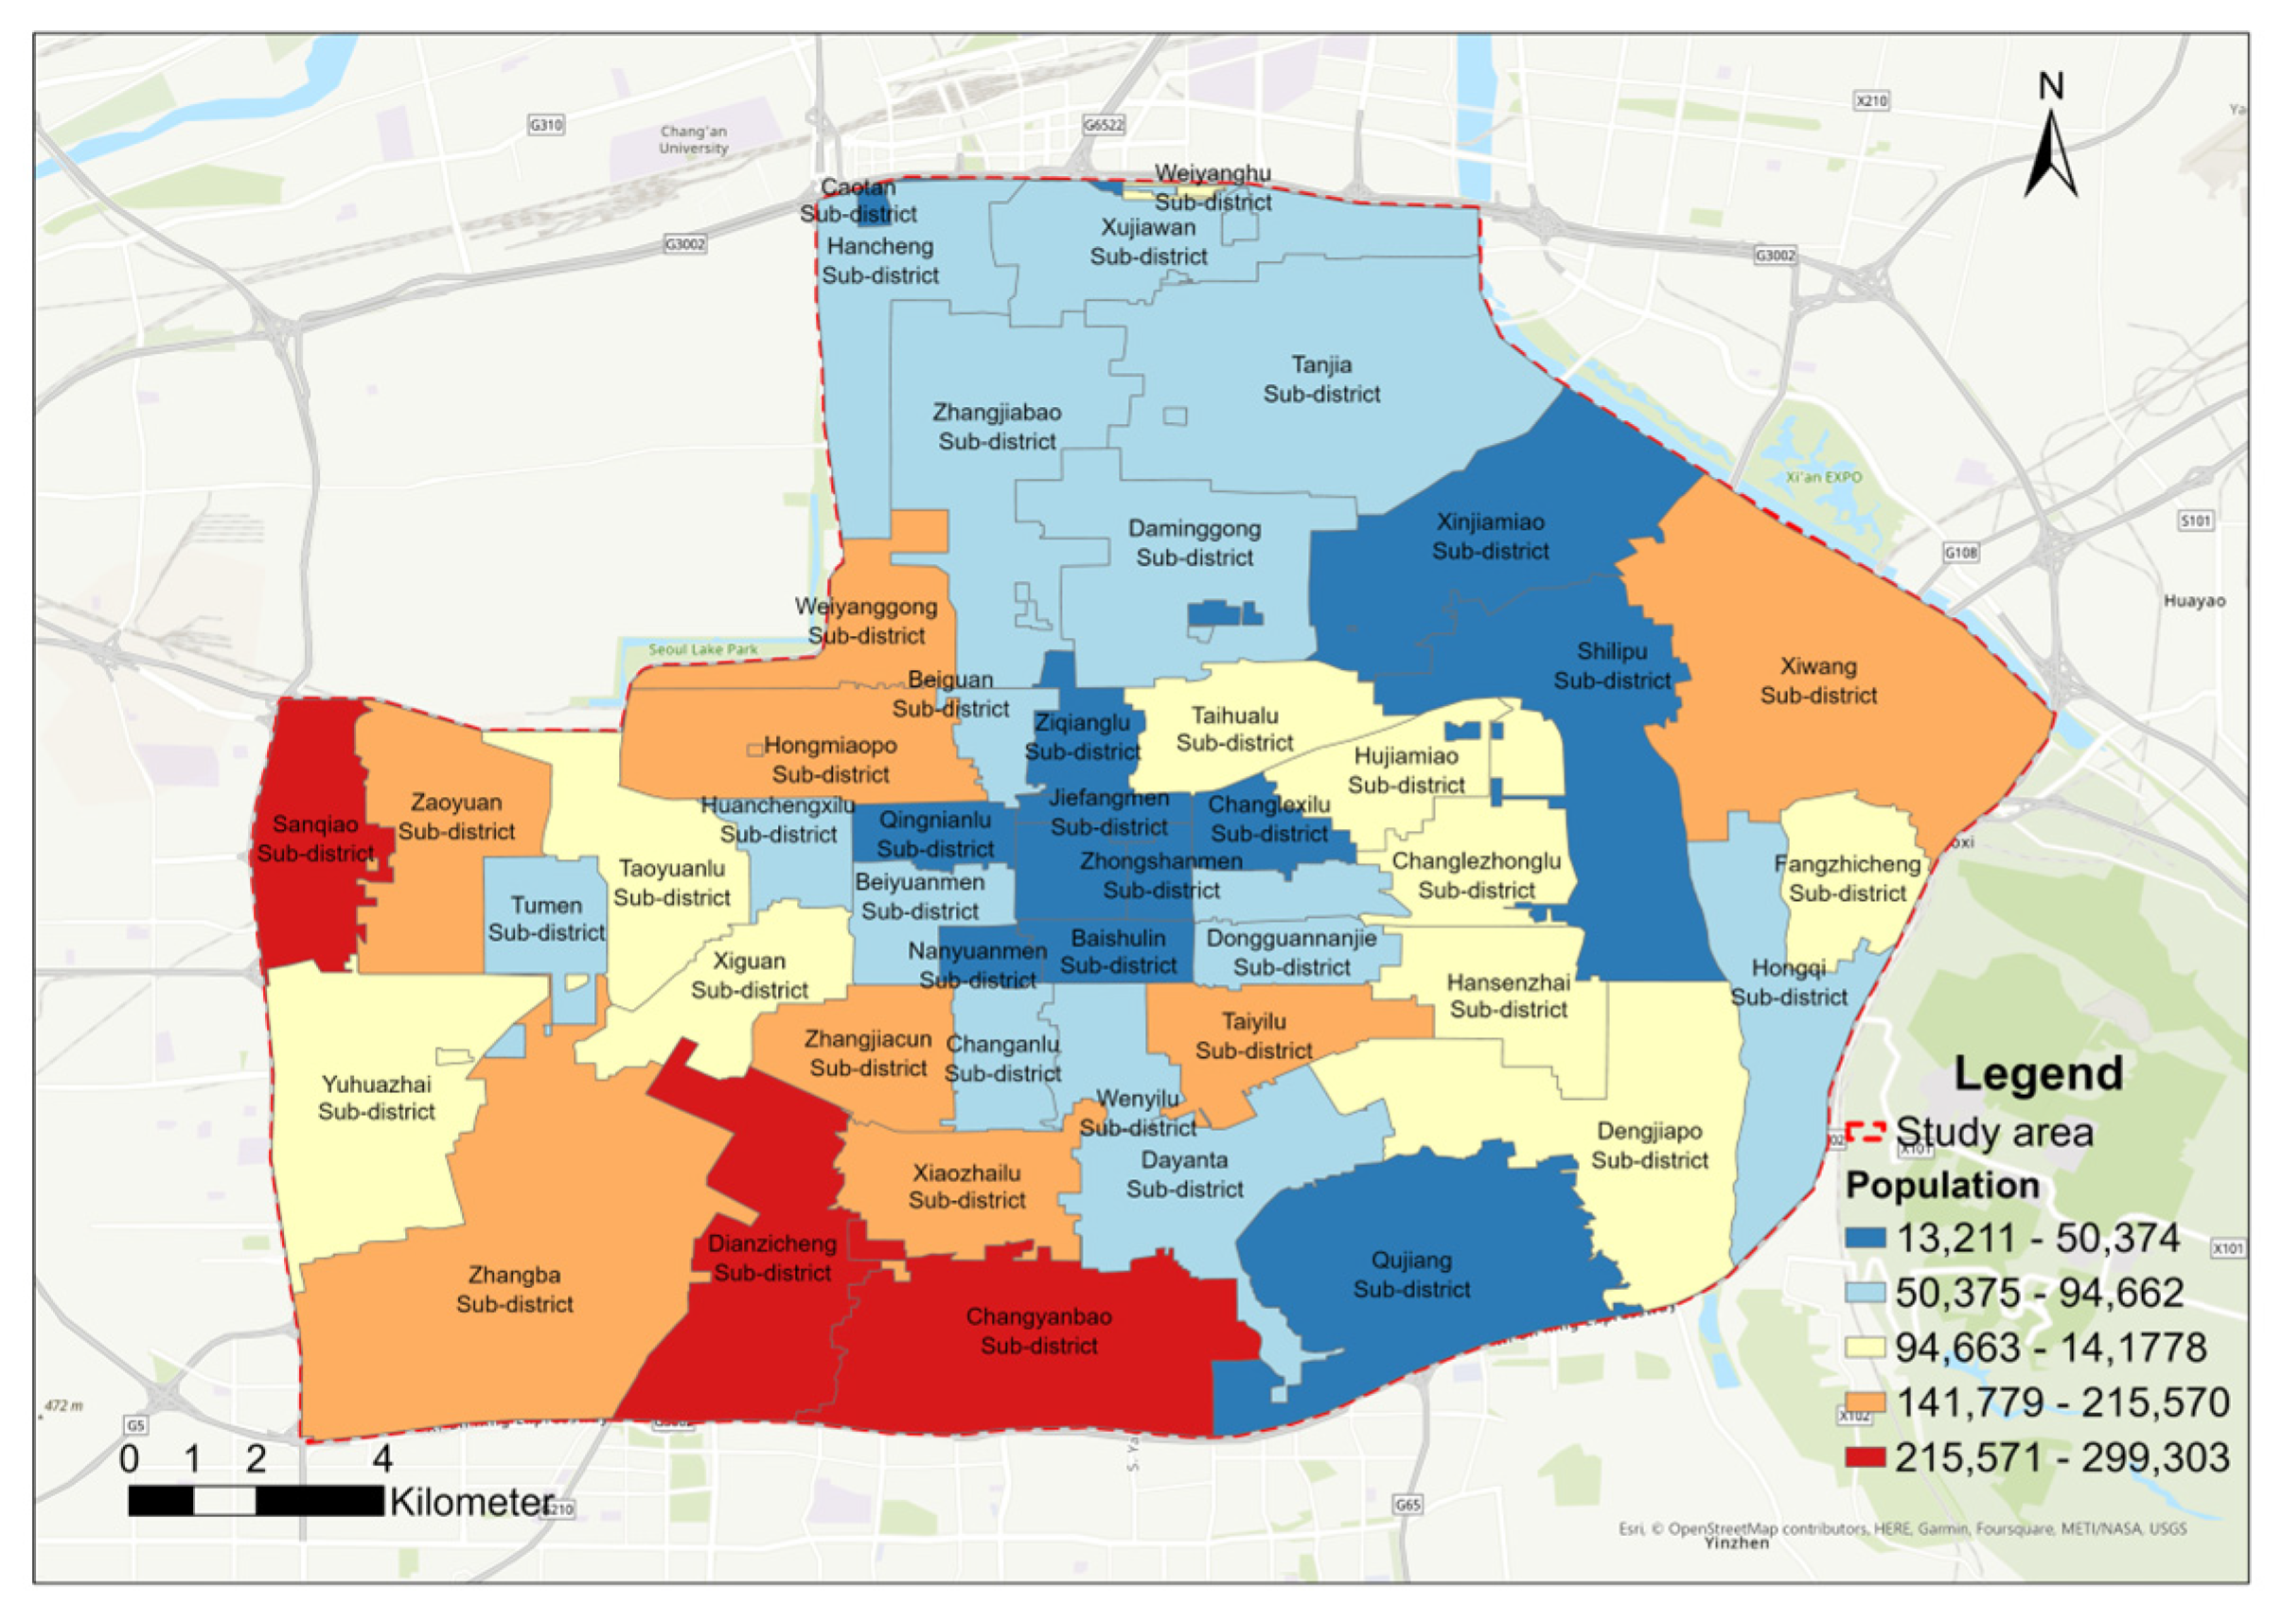
  • We obtained the Seventh Census Data for 2021 from the websites of the statistical bureaus of each district or county of Xi’an, which include information such as population number, household number, gender, age composition, and education level, as shown in Figure 3;
  • We obtained the spatial data of the administrative divisions of Xi’an City from River Map 4.1 (Shuijingzhu; Chengdu, Sichuan Province), as shown in Figure 3;
  • We obtained the property data from Anjuke Property (https://anjuke.com) in September 2022, which include information such as spatial location, greening rate, floor area ratio, household number, housing price, etc.
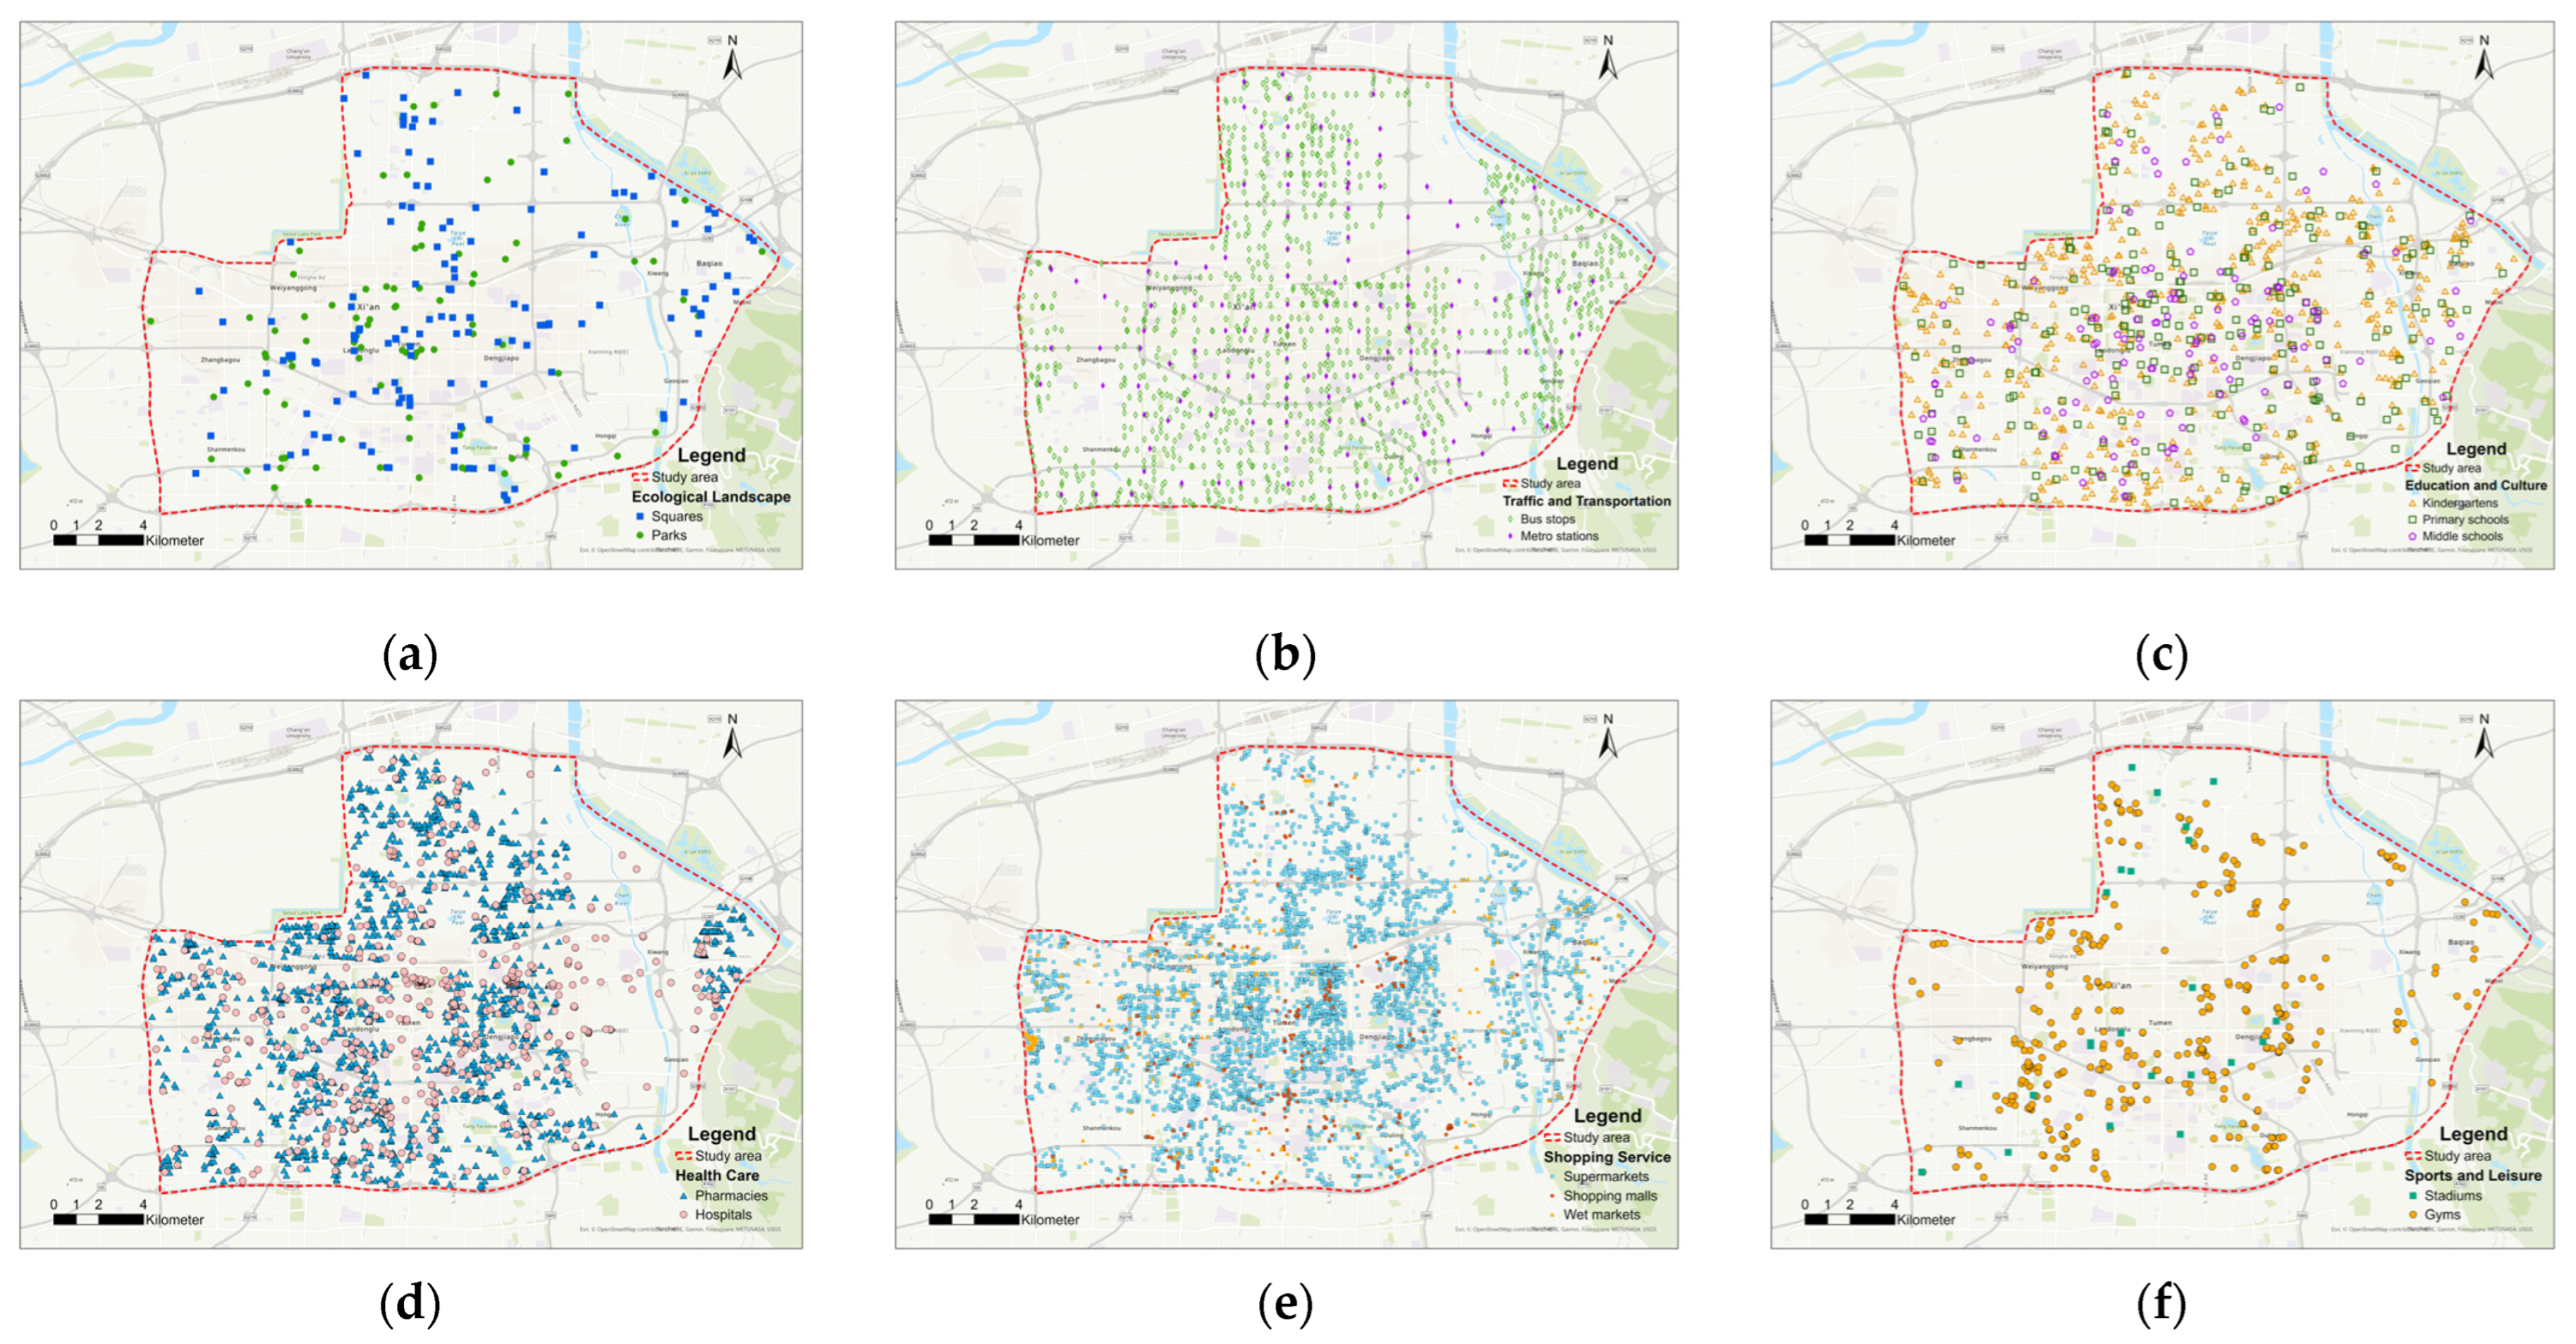
Figure 2. (a) Spatial distribution of the POI for landscape; (b) spatial distribution of the POI for traffic and transportation; (c) spatial distribution of the POI for education and culture; (d) spatial distribution of the POI for healthcare; (e) spatial distribution of the POI for shopping service; (f) spatial distribution of the POI for sports and leisure.
Sustainability 15 12392 g002
Figure 3. The boundaries of the sub-districts and population distributions.
Sustainability 15 12392 g003
Based on the quality and accuracy of the original data, the data processing includes format conversion, vectorization, projection, attribute connection, and supplementation. All data were saved in a Geodatabase and proceeded in ArcGIS 10.6 (ESRI, Redland, CA, USA).
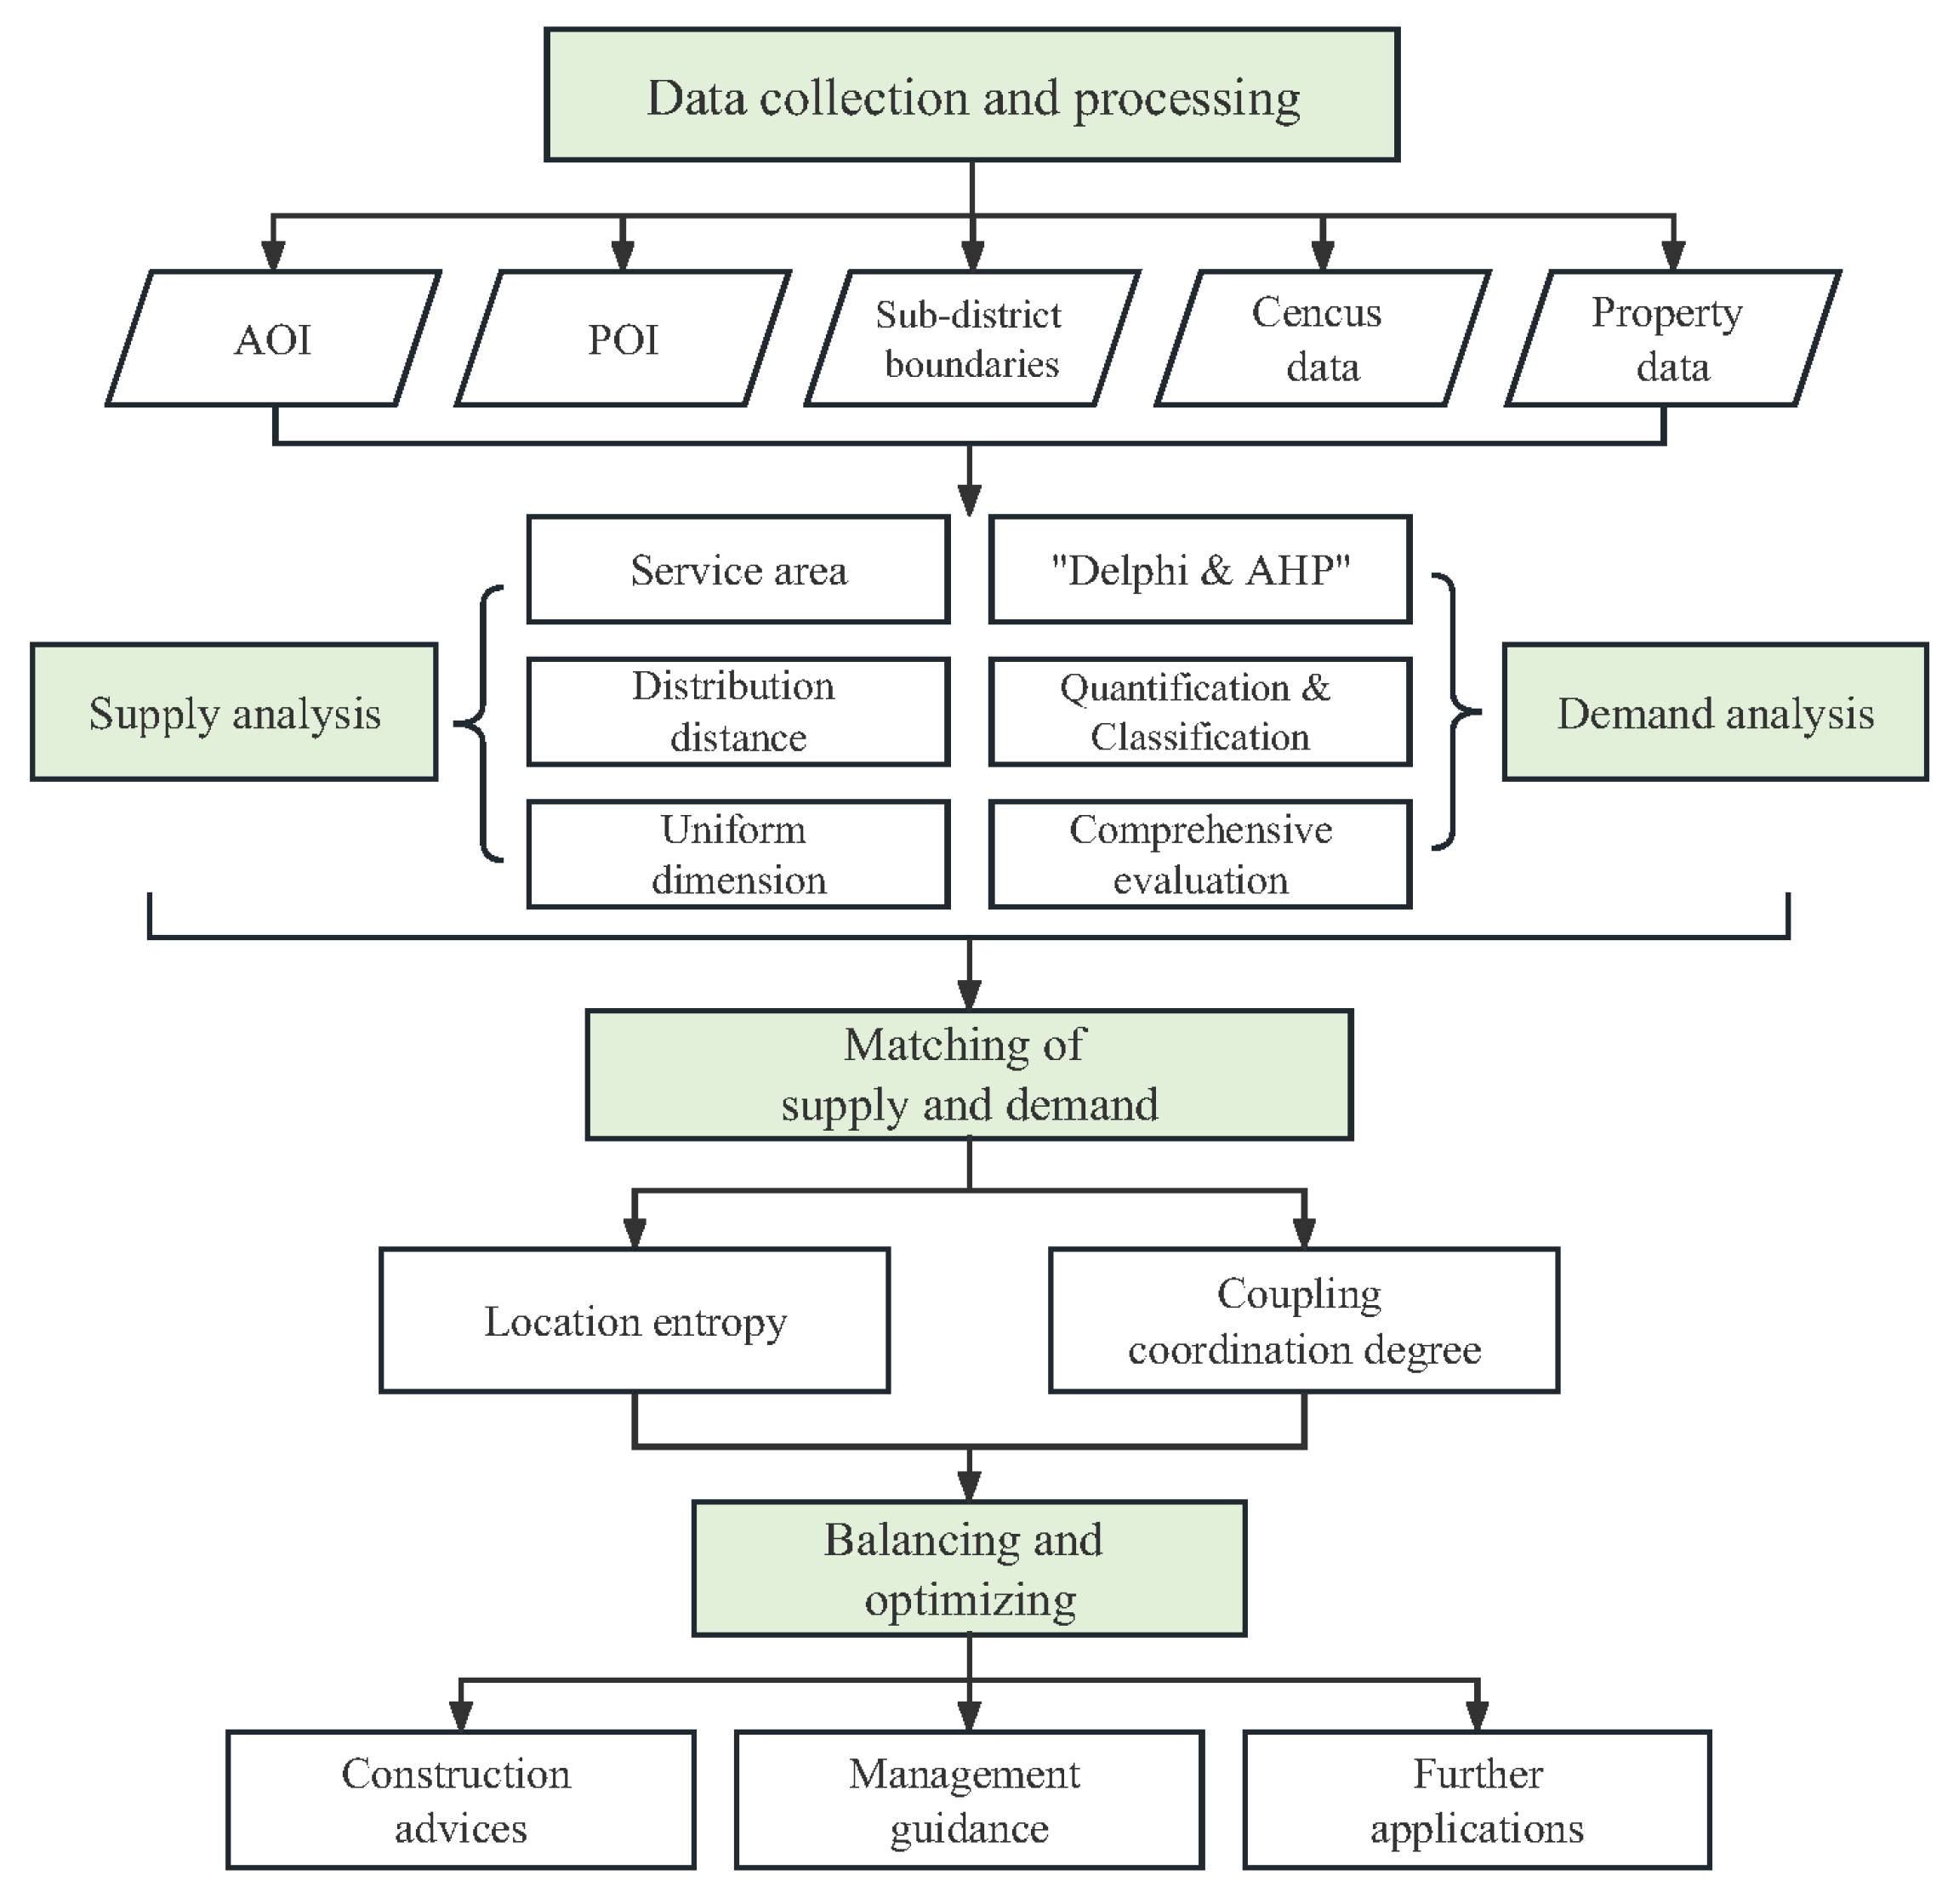
Following data collection and processing, we carried out three types of analysis. We presented advice, guidance, and further applications based on the state of the study area and the results of the analysis. The technology roadmap was shown in Figure 4.

2.3. Living Service Amenity Selection and Measurement

This study analyzed the supply and demand of living service amenities within a 1 km radius of residential complexes. We selected six dimensions of amenity based on the 2020 Urban Physical Examination Work Plan [53] and the urban sustainability goals [54,55]: ecological landscape, traffic and transportation, education and culture, healthcare, shopping service, and sports and leisure. Each dimension includes several types of amenities, totaling fourteen types around the residential complexes, as shown in Table 1. We also measured the accessibility of each basic unit by calculating the average distance to the nearest amenities.
The population size and age composition of each basic unit are derived from the census data to analyze residents’ demand for amenities. To convert the census data to the sub-district level, we first calculate the average household size for each sub-district from the household number and population size in the census data. Then, we multiply the average household size by the household number in each basic unit to obtain the total number of residents in each basic unit. We assign the age composition ratio of each sub-district in census data to its basic units.

2.4. Supply Analysis of Urban Living Service Amenities

The supply analysis mainly considers the number and accessibility of amenities around each basic unit. The number of amenities is determined by a 1 km circle around basic units, intersecting with the POI of fourteen types of amenities, and then normalizing the number of amenities among basic units to obtain the quantity index of the amenities (1).
Q i k = q i k q m i n k q m a x k q m i n k
where  Q i k  is the quantity index of category  k  living service amenities in the basic unit  i k   14;    q i k  is the number of category  k  living service amenities within 1 km of the basic unit  i ; and  q m a x k  and  q m i n k  are the maximum and minimum number of category  k  living service amenities among all basic units. For the quantity index, the normalized value of zero means there cannot be found the specific amenities within 1 km.
Accessibility is based on the spatial distribution of amenities, according to the European Distance tool in ArcGIS to generate distance raster data and then extract the distance from the basic unit to amenities within a 1 km radius. We calculate the distance index by normalizing the average distance from each basic unit to multiple types of amenities (2).
A i k = a m a x k a i k a m a x k a m i n k
where  A i k  is the distance index of basic unit  i  and the surrounding category  k  living service amenities;  a i k  is the average distance between the basic unit  i  and the nearest category  k  living service amenities; and  a m a x k  and  a m i n k  are the maximum and minimum distance of all basic units from the nearest category  k  living service amenities. For the distance index, the absolute distance value is not zero but the normalized value is zero, which means this basic unit has the worst accessibility within all residential complexes in the study area.
We multiply the quantity and distance indices of each type of amenity around each basic unit and sum them to obtain aggregated supply (3).
S i = Q i k · A i k
where  S i  is the aggregated supply of living service amenities of the basic unit  i Q i k  is the quantity index of the category  k  living service amenities of the basic unit  i ; and  A i k  is the distance index of the basic unit  i  and the surrounding category  k  living service amenity.
We normalize the aggregated supply of each basic unit to obtain its supply index, as some values exceed 1. The higher the supply index, the better the supply status of amenities for the basic unit, and vice versa. We divide the supply index into five levels: very low, low, moderate, high, and very high (4).
S i = S i S m i n S m a x S m i n
where  S i  is the supply index of the basic unit  i S i  is the aggregated supply of the basic unit  i ; and  S m a x  and  S m i n  are the maximum and minimum values of the aggregated supply in all basic units.

2.5. Demand Analysis of Urban Living Service Amenities

We map the property data with latitude and longitude information to generate a point layer. We use the Spatial Join function in ArcGIS to link the property data to residential complexes and obtain household numbers. In the supply analysis, we assume equal relative importance for each amenity. However, in the demand analysis, we assign weights for three age groups based on the Seventh Census Data of Xi’an, as different age groups have different demands for amenities. For example, the demand of kids and teenagers (0–14 years old) mainly focuses on educational resources, sports fields, etc., the demand for the working-age group (15–60 years old) focuses on transportation amenities, shopping centers, etc., and the demand for the aged population (more than 60 years old) focuses on green spaces, healthcare services, etc. In addition, a more nuanced age breakdown would seem to be more convincing, but that is how the national statistics are broken down, which may have its own rationale. The weight of each type is determined by the Delphi method and the Analytic Hierarchy Process (AHP) [56]. The combination of Delphi and AHP facilitates the joint provision of solutions from both qualitative and quantitative aspects of decision-making to ensure the reliability and robustness of the results compared to other commonly used type weight determination methods (e.g., Entropy method, TOPSIS, MADM, etc.) [57]. Questionnaires are designed and distributed to professionals in urban planning and eventually form twelve valid results, which are averaged to determine the demanding weights after consistency checks.
We multiply the percentage of age group in the total population, demanding weights, and population number to calculate the aggregated demand (5).
D i = p = 1 3 G i p · w k p · P o p i
where  D i  is the aggregated demand of the basic unit  i G i p  is the age composition ratio of the basic unit  i p  = 1,2,3 represents the proportion of the population in the age group of 0–14 years old, 15–60 years old, 60 years old and above, respectively,  G i p [ 0,1 ] w p k  is the demand weight of the pth age group for the category  k  living service amenity; and  P o p i  is the population of the basic unit  i .
We normalize the aggregated demand of each basic unit to obtain the demand index. The higher the demand index, the greater the demand for amenities in the basic unit, and vice versa. We divide the demand index into five levels: very low, low, moderate, high, and very high (6).
D i = D i D m i n D m a x D m i n
where  D i  is the demand index of the basic unit  i D i  is the aggregated demand of the basic unit  i ; and  D m a x  and  D m i n  are the maximum and minimum values of the aggregated demand among the basic units.

2.6. Supply and Demand Matching of Living Service Amenities

We use location entropy and coupling coordination degree to measure the current supply–demand matching status and its spatial distributions for each basic unit.

2.6.1. Location Entropy

Location entropy is a widely used measure of environmental equity [58]. We use location entropy to compare the relative supply and demand levels of each basic unit and determine its locational advantage. A location entropy greater than 1 means that the basic unit has more supply than the average level; otherwise, it has less supply. We calculate location entropy with the following Equation (7).
L Q i = S i / D i S / D
where  L Q i  is the location entropy of the basic unit  i S i  is the supply index of the basic unit  i D i  is the demand index of the basic unit  i S  is the sum of the supply index of all the basic units as a whole; and  D  is the sum of the demand index of all the basic units as a whole.

2.6.2. Coupling Coordination Degree

“Coupling” refers to how two or more systems interact and influence each other [59]. The degree of coupling coordination shows the structure and order of the critical subsystems and reveals the development trend of the system from disorder to order [60]. We use Equations below (8)–(10) to calculate it.
C i = 2 S i × D i S i + D i
T i = α S i + β D i
D i C C D = C i × T i
where  S i  and  D i  are the supply index and demand index of the basic unit  i , respectively;  C i  is the coupling degree of the basic unit  i , which indicates the degree of interaction and influence between them; and  T i  is the harmony index of the basic unit  i , reflecting the matching effect or synergistic contribution between supply and demand.  α  and  β  represent the importance of supply and demand, respectively, and  α + β = 1 D i C C D  is the coupling coordination degree between the basic unit  i  and its surrounding living service amenities, which represents the level of coordinated development between the two.
We consider both supply and demand of amenities equally important for matching analysis in China’s new era of high-quality development, so we set  α = β = 0.5  [61]. We classify coupling degree according to Table 2 [62].

3. Results

3.1. Supply Index Spatial Distribution of Different Living Service Amenities

3.1.1. Overall Spatial Distribution of the Supply Index

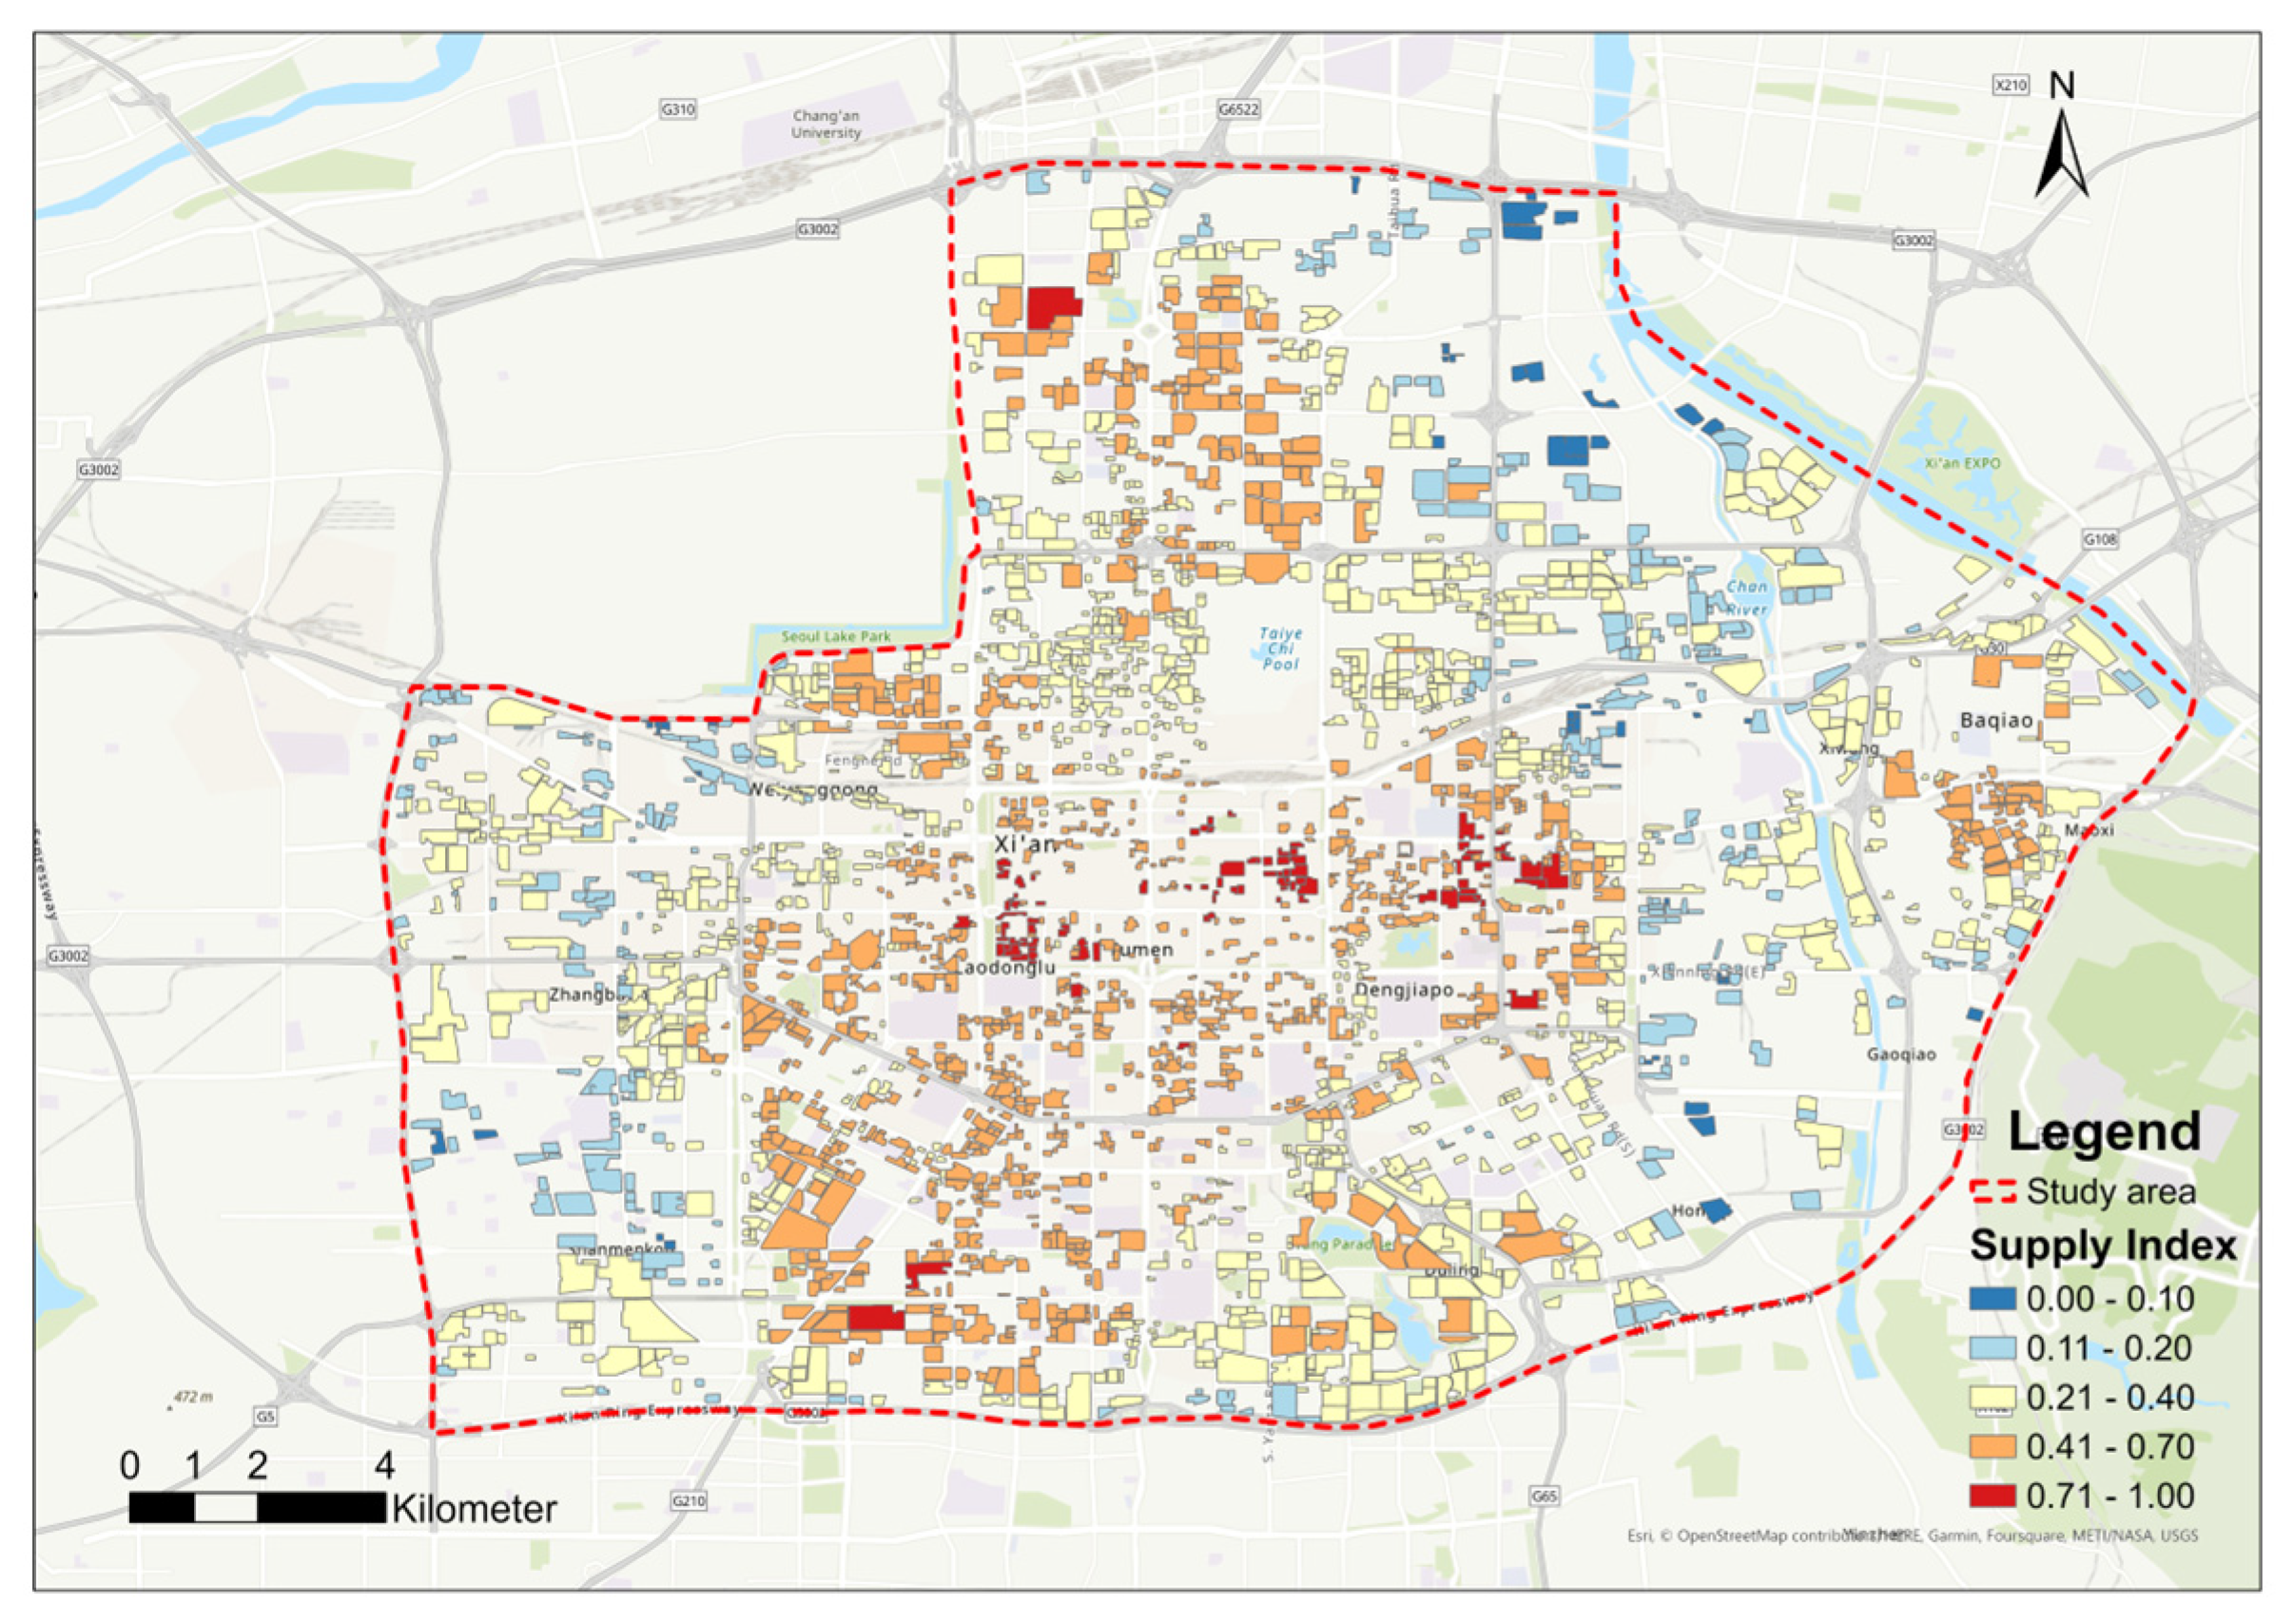
We use three modes to describe the spatial patterns of the results: concentric circle, fan-shaped, and multicenter [63]. The supply index of amenities in Xi’an shows a concentric circle or fan-shaped pattern: high levels in the urban center, low levels in the suburbs, and a north–south axis with high values (Figure 5). The basic units with high supply index are mostly in the city center (e.g., Xiyi Road, Beiyuanmen, Nanyuanmen, Wenyi Road, Chang’an Road, Zhangjiacun, Zhongshanmen, and Changlefang sub-districts). Some nuclei with a high supply index also appear in the Zhangjiabao sub-district (north), Textile City sub-districts (east), and Zhangba and Electronic City sub-districts (southwest). The basic units with a low supply index are mainly in the eastern and western edges.

3.1.2. Spatial Distribution of the Supply Index of Ecological Amenities

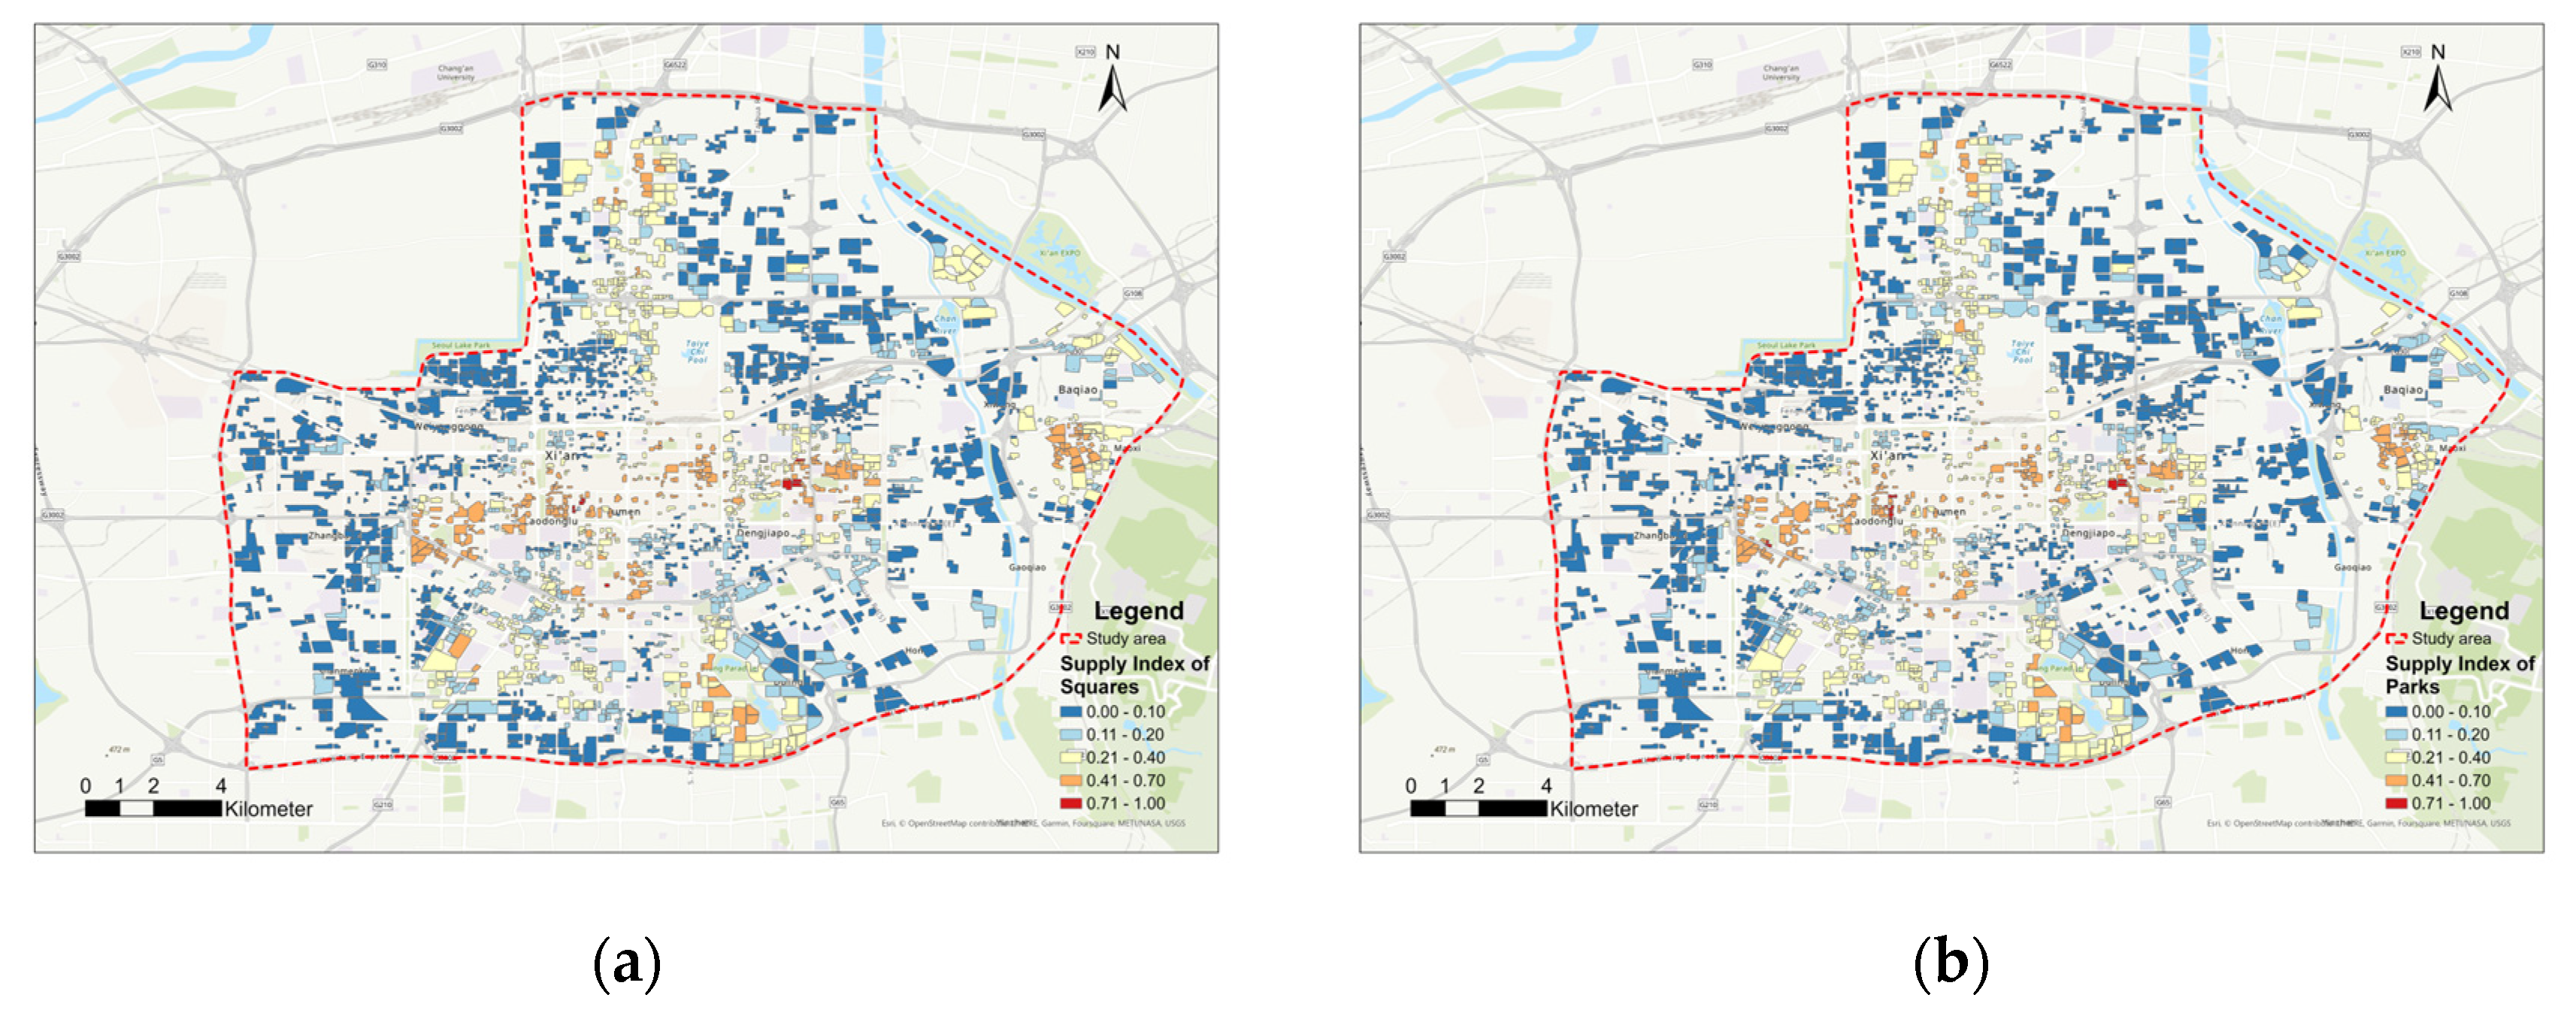
The supply index of square and park amenities shows a multicenter pattern: high levels in the urban center and low levels in the suburbs (Figure 6). There are also several nuclei with a high supply index in the study area (e.g., Zhangjiabao sub-district in the north, Electronic City sub-district in the southwest, Textile City sub-district in the east, Changyanbao and Qujiang sub-districts in the south). The basic units with a low supply index are mainly in the western edge and the eastern belt. Squares and parks are mostly concentrated in the city center, while the suburbs lack them.

3.1.3. Spatial Distribution of the Supply Index of Traffic and Transportation Living Service Amenities

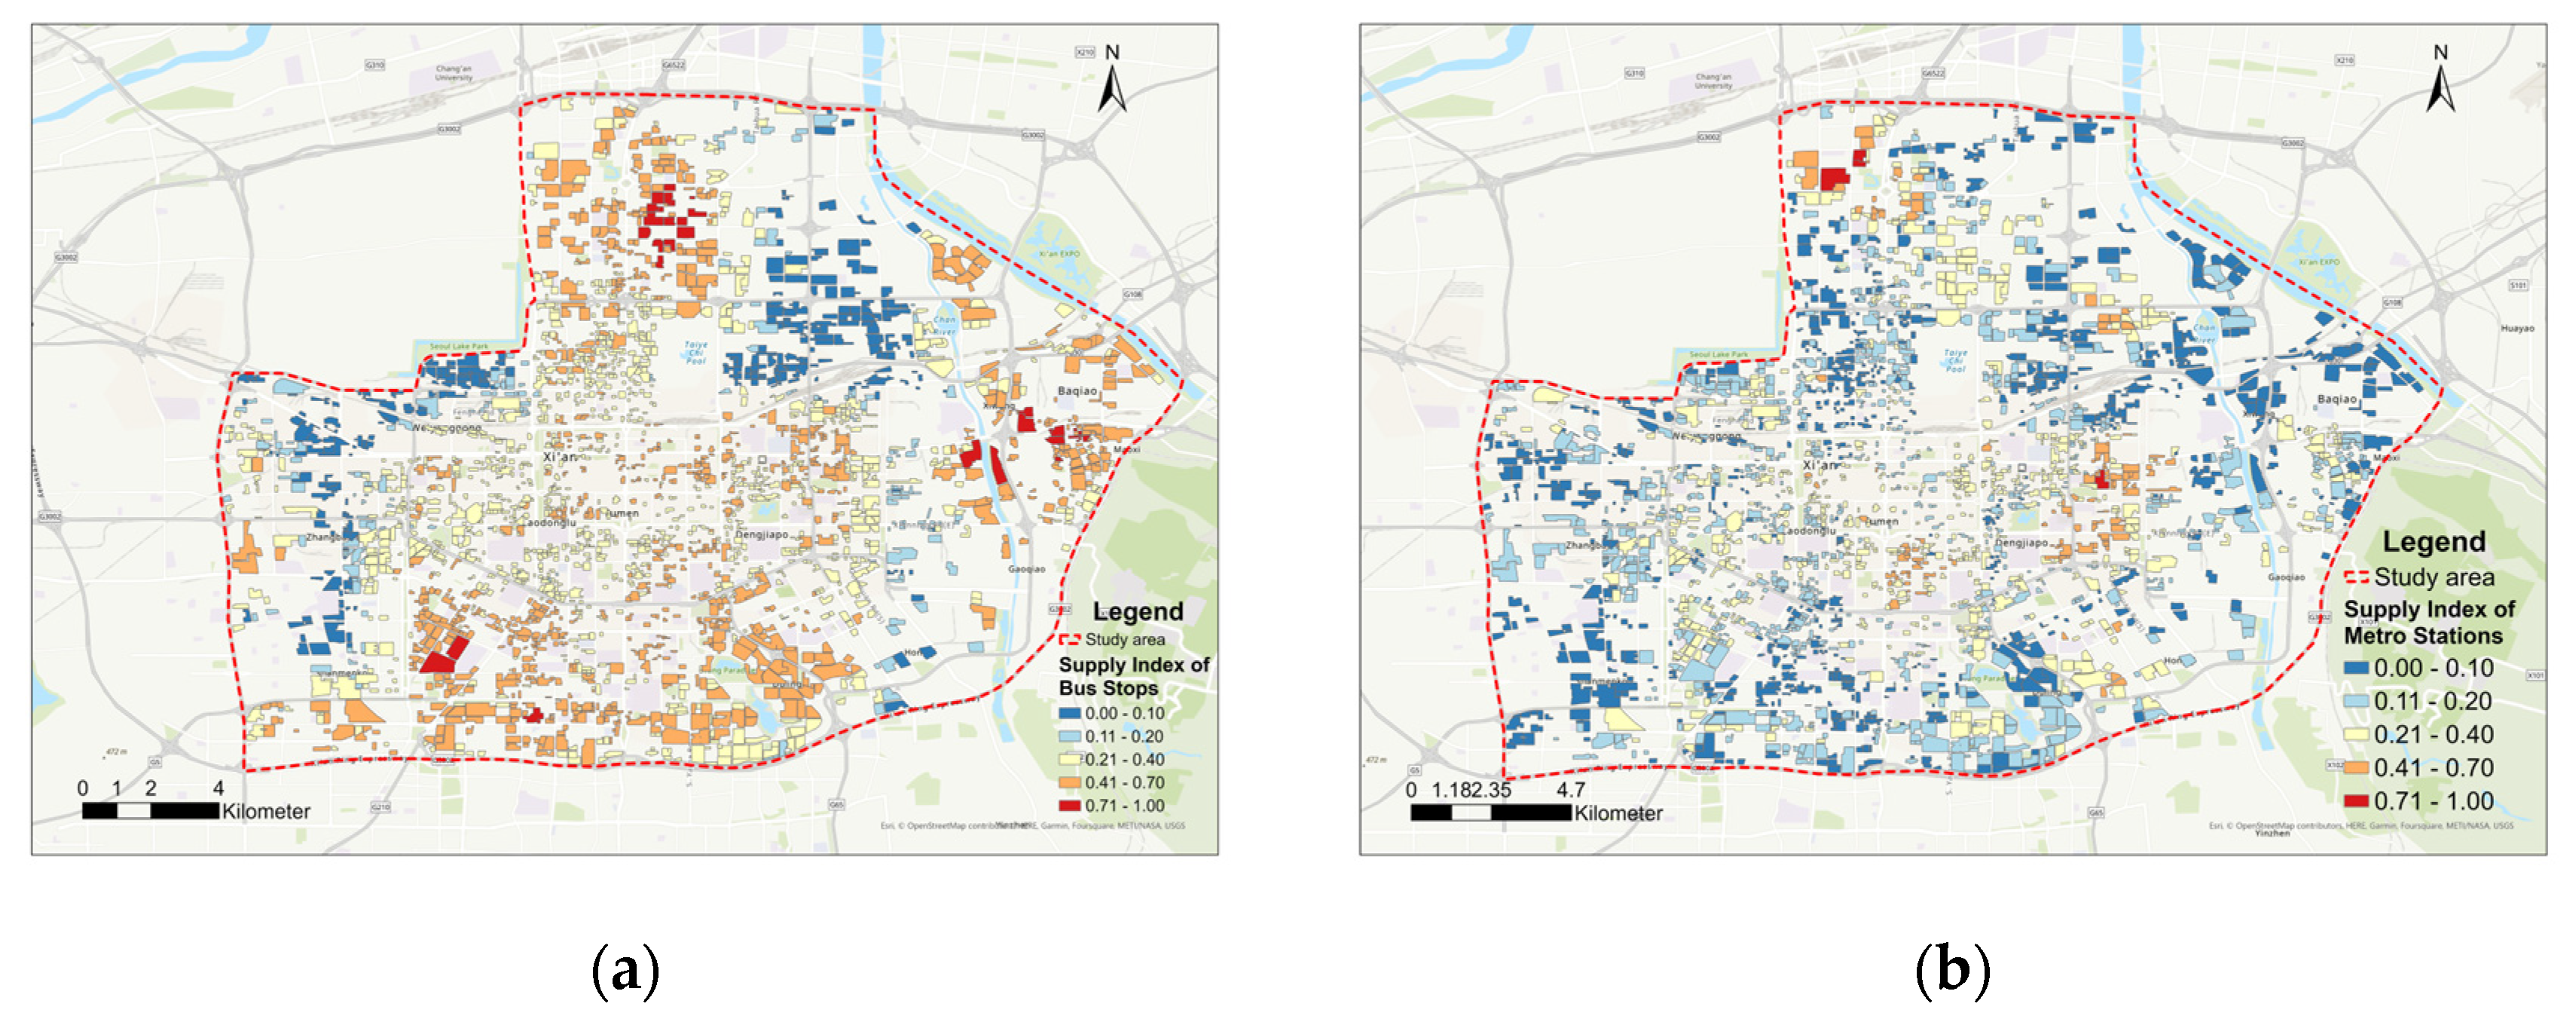
The traffic and transportation amenities supply index showed a fan-shaped distribution, with low levels in the urban center and high levels in the suburbs (Figure 7). It also had several highlands at the city edge and decaying areas in the middle of the city center and periphery. The basic units with high supply index were mainly in the Zhangjiabao sub-district (north), Textile City sub-district and Xiwang sub-district (east), and Zhangba sub-district, Electronic City sub-district, Changyanbao sub-district, and Qujiang Sub-district (south). The basic units with a low supply index were mainly in the northeast and west. This showed that public transit in Xi’an linked the city center with peripheral residential areas effectively, reflecting a large suburban population.
The metro station amenities supply index was more even, with no clear spatial pattern. The basic units with high supply index were mainly on Chang’an Road and Wenyi Road (city center), Changle Middle Road and Hansenzhai sub-district (east), and Zhangjiabao sub-district and Daminggong sub-district (north). The low bus stop supply index was balanced by metro stations’ spatial distribution, which matched each other and showed metro rail transit’s wide service scope in Xi’an with high social equity and accessibility.

3.1.4. Spatial Distribution of the Supply Index of Education and Culture Living Service Amenities

The kindergarten amenities supply index had a “low-high-low” concentric circle distribution, with low levels in the urban center, high levels at the periphery, and low levels in the suburbs (Figure 8). The supply index was high in the Hongmiaopo sub-district, Changyanbao sub-district, and Taihua Road sub-district. The basic units with a low supply index were mainly in the Dayanta sub-district and Textile City sub-district. The old urban areas of Xi’an lacked residential amenities like kindergartens because of historical development reasons, while the new residential areas around them filled this gap. But the suburbs still had insufficient support.
The primary and middle school amenities supply index showed a concentric circle distribution, but middle school amenities were more clustered. The basic units with high supply index overlapped, mainly in the Changlefang sub-district, Hujiamiao sub-district, and South, and North Yumen sub-district. The basic units with a low supply index were mostly in the suburbs. Primary and middle school amenities in Xi’an had a big difference between the urban center and the suburbs, and they were spatially clustered. This was because educational resources were mainly in the old urban areas in the early stage of urban development when educational amenities were built along with the city center. It also depended on the service targets and nature of both, with middle school amenities having a larger service scope than primary school amenities. So, in the city’s further development, we should pay attention to the social equity of educational resources and ensure the real equity of the socially disadvantaged population in their right to education.

3.1.5. Spatial Distribution of the Supply Index of Healthcare Living Service Amenities

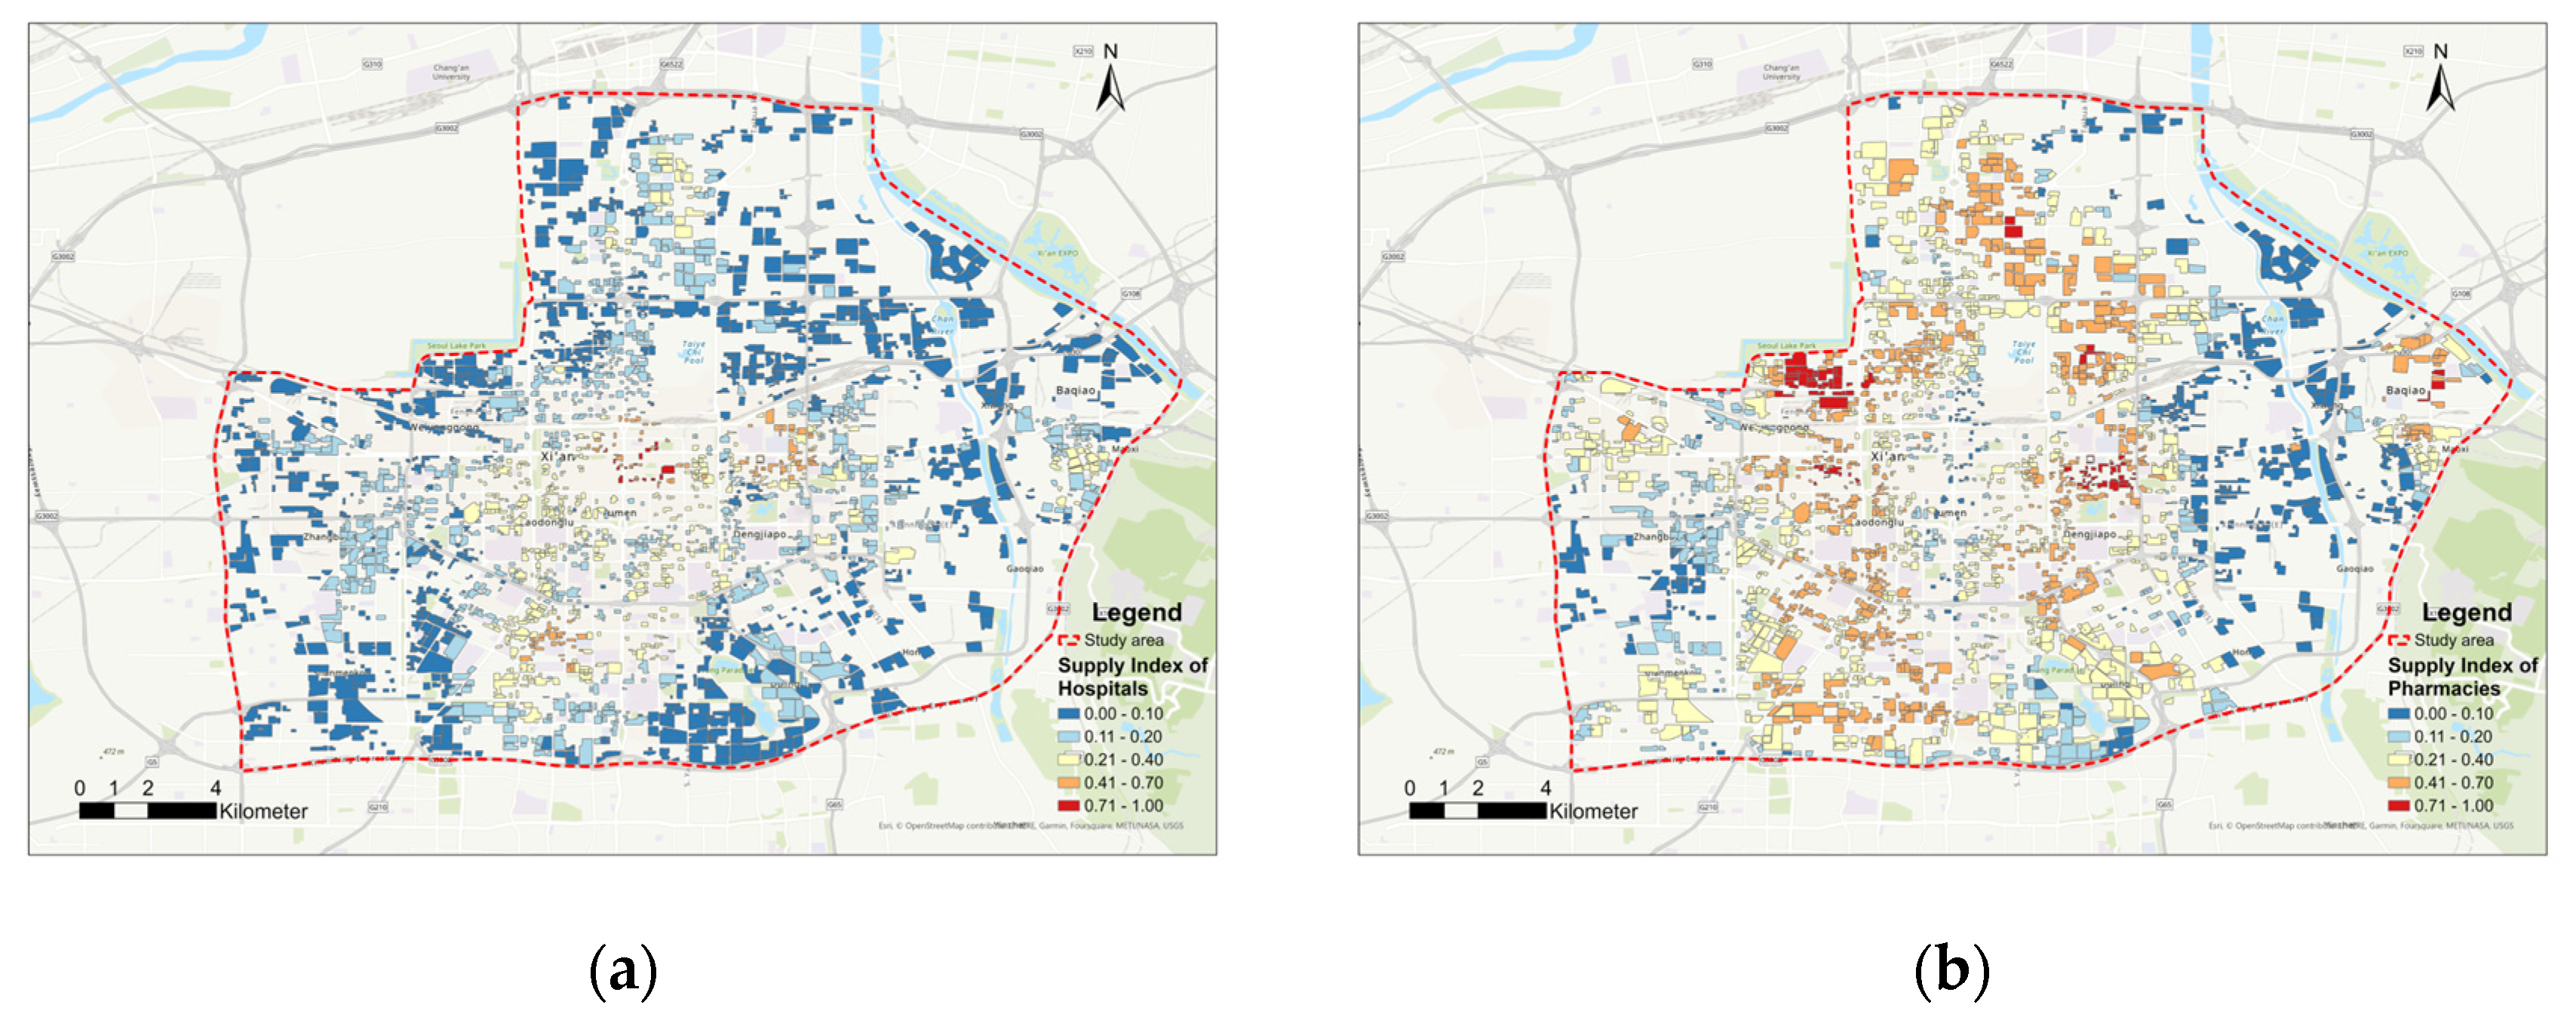
The healthcare amenities supply index showed a multicenter distribution, with high levels in the city center and low levels in the suburbs (Figure 9). The basic units with high supply index were mainly in the Xiyi Road sub-district, Zhongshanmen sub-district, and Changlefang sub-district. The basic units with a low supply index were mostly in the suburbs. Hospital amenities in Xi’an had a big difference between the urban center and suburbs and were similar to middle school amenities. This means that scarce resources like educational and medical resources are usually in the city center with high urban land value and are spatially clustered.
The pharmacy amenities supply index had a concentric circle distribution, with low levels in the urban center, high levels in the periphery, and low levels in the suburbs. The basic units with high supply index were mainly in the Hongmiaopo sub-district, Changlefang sub-district, and Zhangjiabao sub-district. The basic units with a low supply index were mostly in the Hujiamiao sub-district and Shilipu sub-district. This was because of the high land rent in the built-up areas of the city center, which made it hard to demolish and rebuild high-density construction. It was also because of the stores along the streets of modern high-rise buildings that offered good conditions for opening pharmacy amenities.

3.1.6. Spatial Distribution of the Supply Index of Shopping Service Amenities

The shopping service amenities supply index showed a multicenter distribution. But supermarkets, shopping malls, and wet markets had low spatial overlap in the study area (Figure 10).
The shopping mall amenities supply index showed a multicenter distribution, with high levels in the south and low levels in the north. The basic units with a high supply index were mainly in the city center and south areas, while the north area had a highland in the Zhangjiabao sub-district. The supermarket amenities supply index showed a fan-shaped distribution, with high levels in the city center and low levels in the suburbs. It also had enclaves with a high supply index in the east and west areas. The wet market amenities supply index showed a fan-shaped distribution, with a high level in the west and a low level in the east. The basic units with a high supply index were mainly in the Yuhuazhai sub-district, which clustered spatially. Compared with bus stops’ spatial distribution and some supermarkets near residential areas, this confirmed that most people lived in the suburbs of Xi’an’s main urban area.

3.1.7. Spatial Distribution of the Supply Index of Sports and Leisure Amenities

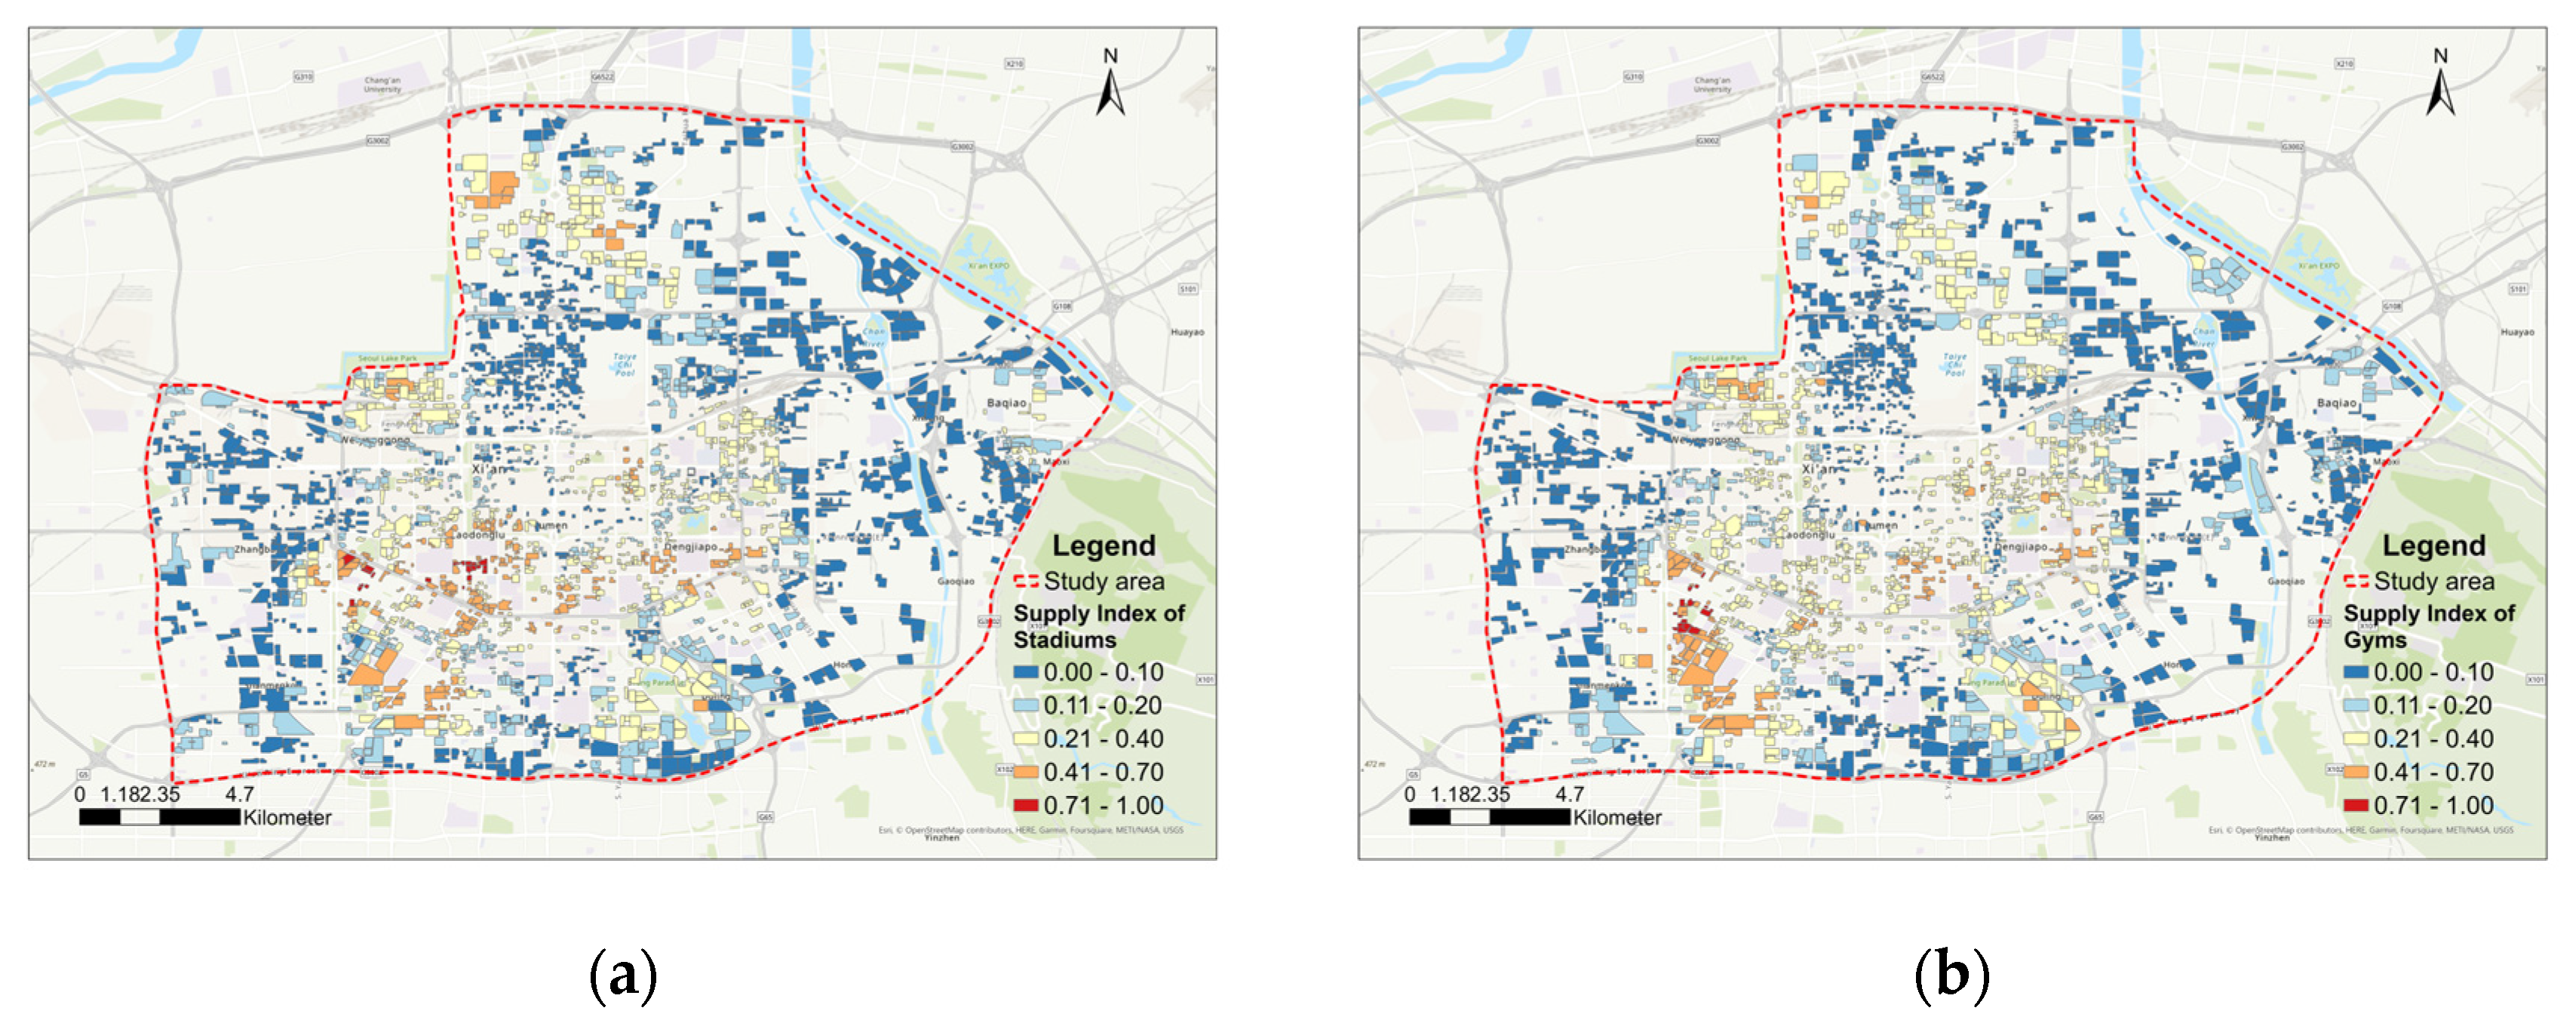
The sports and leisure amenities supply index showed a concentric circle distribution, with high levels in the city center and low levels in the suburbs (Figure 11). Stadium and gym amenities had similar and overlapping spatial distribution. The basic units with a high supply index were mainly in the Zhangba sub-district and Electronic City sub-district. Gyms in Xi’an were in the new urban area in the southwest, showing that commercial high-rise buildings, like office buildings, supported modern indoor sports.

3.2. Demand Index Evaluation and Spatial Distribution for Each Residential Complex

3.2.1. The Spatial Distribution of Population Age Composition in the Study Area

We used the age composition data of each sub-district from the Seventh Census Data to assign age groups to each basic unit since collecting population data at the residential complex level is difficult and involves personal privacy. Figure 12 shows the results. The population aged 0–14 had a high level in the suburbs and a low level in the city center. The areas north of the North Ring Expressway, east of Chan River, and west of the West Second Ring Expressway had high values. The population aged 15–60 had a high level in the south and a low level in the northeast. The Qujiang and Changyanbao sub-districts south of the study area had high values. The population aged 60 and above had a high level in the city center and a low level in the suburbs. The Textile City sub-district in the east had a high-value nucleus.
The population age ratio showed that Xi’an’s main urban area had an aging population in the city center and a younger population in the suburbs. The newborns were mostly in the northern and eastern fringes. The young adults were mostly in the new areas around the city center, especially in the south. The elderly were mostly in the old urban areas and the Textile City sub-districts in the east. The young newcomers mainly lived in the outskirts, where identity and spatial segregation were evident.

3.2.2. Spatial Distribution of the Demand Index for Age-Based Analysis

We compiled the demand weights of the three age groups for different amenities based on the questionnaire results (Table 3). All three age groups considered healthcare and sports to be critical. Children valued education and sports more. The mid-age group (15–60 years) preferred traffic and shopping amenities. The elderly cared less about education and shopping amenities.
The demand analysis results showed low levels in the city center and high levels in the suburbs, reflecting the suburban population concentration (Figure 13). The basic units with a high demand index were mostly in the Zhangjiabao and Hancheng sub-districts (north), Zhanba sub-district (south), Zaoyuan sub-district (west), and Daminggong sub-district (northeast). The demand index showed that most people lived in the new districts with specific development policies or in the suburbs with lower housing prices. Comparing this with the supply index, we found a spatial mismatch between the supply and demand of amenities in Xi’an.

3.3. Supply and Demand Balancing Status for Each Residential Complex

3.3.1. Results of Location Entropy Analysis

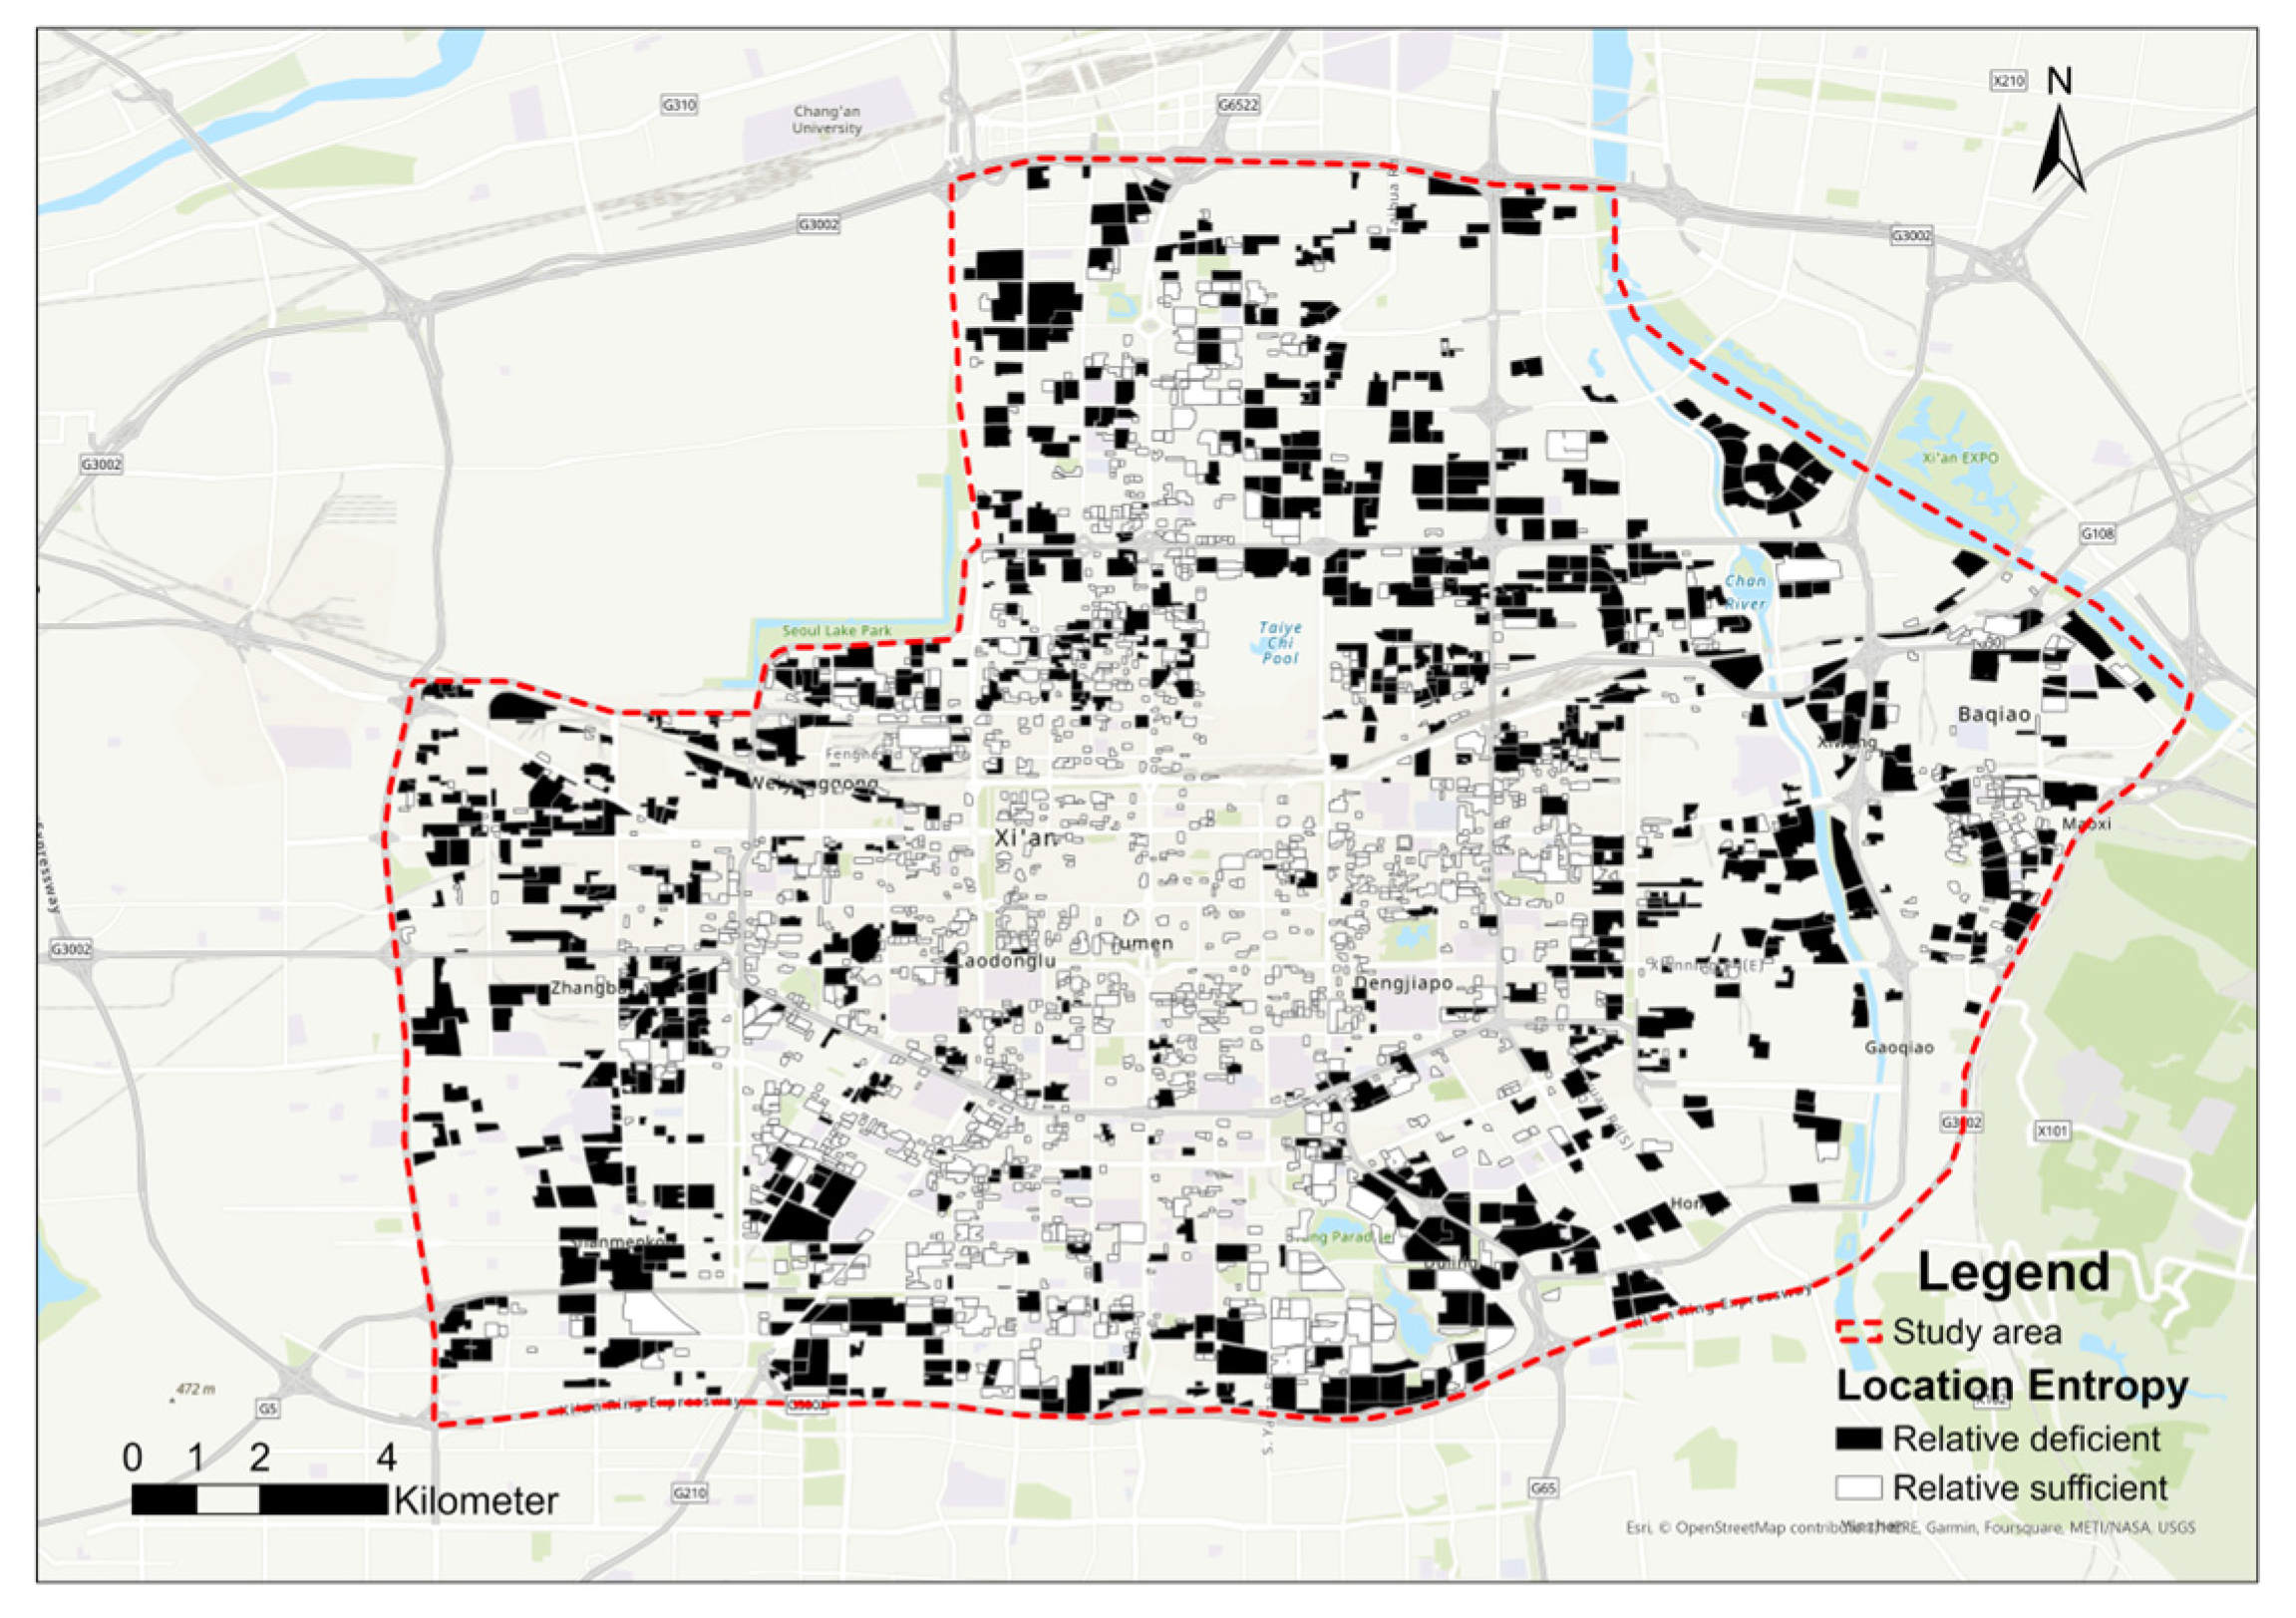
We calculated the location entropy based on basic units’ supply and demand indices. Figure 14 shows the results. The basic units with location entropy greater than one were mainly in the city center and the southern area. The southern area had higher overall location entropy than the northern area. The basic units with a location entropy less than one were mainly in the Weiyanggong, Hancheng, Tanjia, and Xinjiamiao sub-districts (north), Sanqiao, Yuhuazhai, Zhangba, and Zaoyuan sub-districts (west), and Xiwang, Shilipu, and Hongqi sub-districts (east). The location entropy analysis showed that the basic units in the city center had more sufficient supply than those in the surrounding areas. The basic units with location advantages were concentrated in the city center, while the suburbs lacked relative location advantages. The nuclei with location advantages appeared in the eastern and northern areas of the city. The southern area formed a continuous space with location advantages, reflecting Xi’an’s urban development direction.

3.3.2. Results of Coupling Analysis

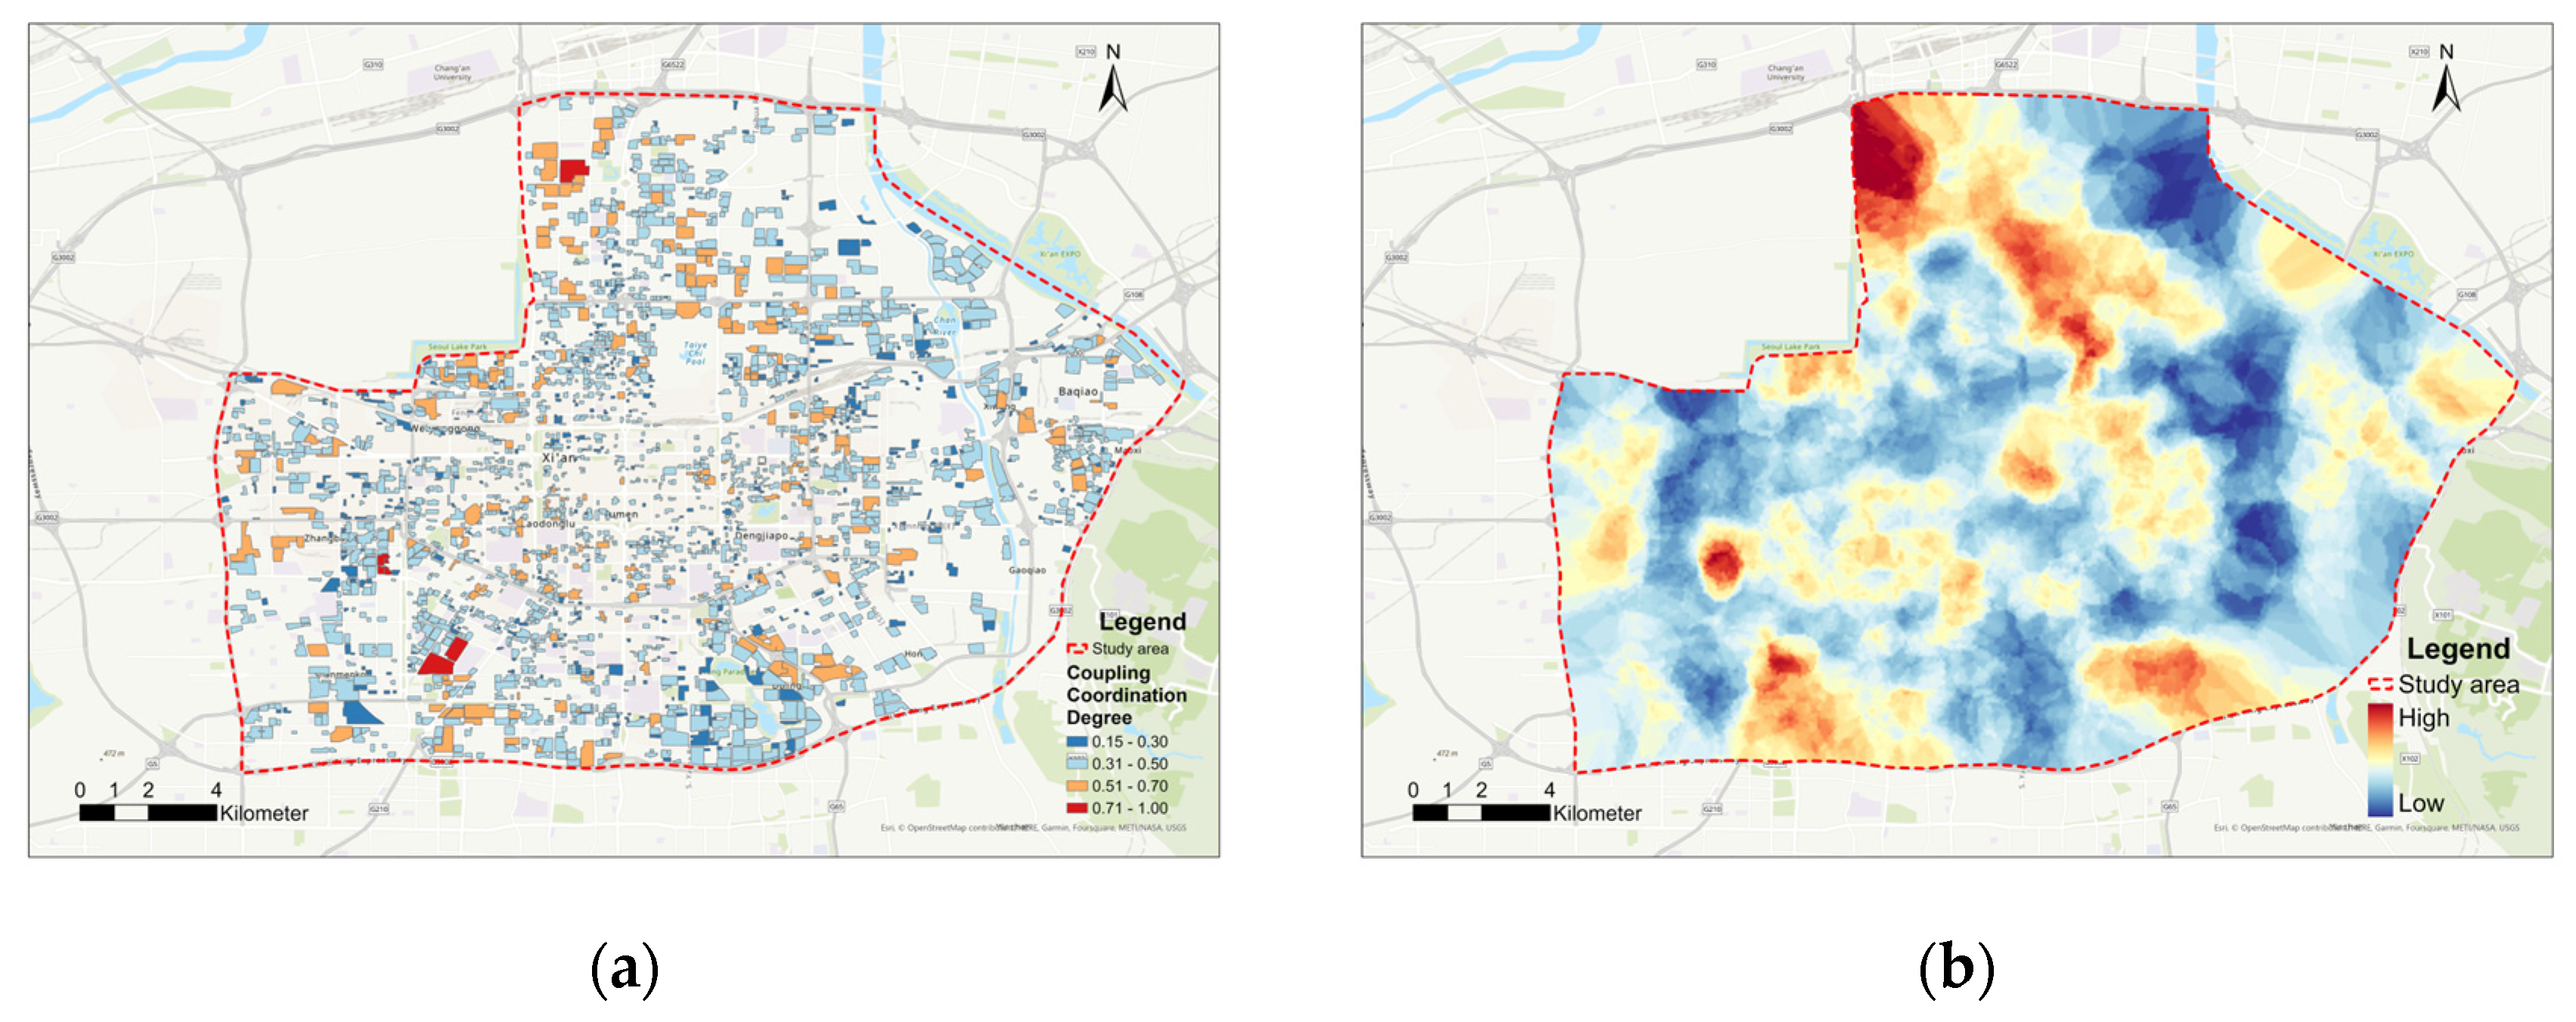
We calculated the coupling coordination degree based on each basic unit’s supply and demand indices. Figure 15 shows the results. The basic units with higher coupling degrees are scattered around the city center’s periphery, with few superiors balanced. Most of the basic units were slightly balanced or slightly unbalanced. The kriging interpolation showed that four nuclei with high coupling coordination degrees formed in the Zhangjiabao (north), Zhangba (southwest), Daminggong (northwest), and Zhongshanmen (central) sub-districts. The city center had a high supply index but lacked coupling coordination, with low-value depressions appearing. In contrast, a high-value belt of coordination formed around the city center. The area outside the East and West Third Ring Expressways had a better coupling coordination degree, although they were comparatively disadvantaged in location entropy.
Unlike the basic unit with a high coordination degree in the city center, which had a point-like distribution, three zones of high coupling coordination degree formed in Xi’an’s north, southwest, and southeast. A low-value ring of coupling coordination developed in the downtown area’s periphery. It is mainly reflected in the strip-like area between the West Second and Third Ring Expressways and between Xingfu Road and Chan River.

4. Discussion

We found a spatial mismatch between the supply and demand of amenities in Xi’an. The urban center had a high concentration of amenities but few elderly residents. The suburbs had more and younger residents but scarce amenities. The city center had a location advantage but a low coupling coordination degree. A high-value belt of coordination formed around the city center.
This mismatch reflects the imbalance between urbanization and public service provision in China. Two main factors contribute to this imbalance: fiscal policy and geographical segregation. On one hand, local governments rely heavily on land finance as a source of revenue [64]. They convert rural land to urban uses, generating huge profits from leasing land for development [65]. As exclusive urban landowners, local governments in China had strong incentives to pursue rural–urban land conversion as an extra-budgetary revenue source [66]. However, they neglect to construct living service amenities in new areas, resulting in a lag behind population growth. On the other hand, urban residents face unequal access to resources and services due to geographical segregation [67]. People cluster and distribute according to their social characteristics and perceptions of their neighborhoods [68]. This leads to different sizes and age compositions of residents in different areas, as shown by our results [69].
Xi’an’s cultural heritage poses a challenge to urban renewal. As the ancient capital of thirteen dynasties, Xi’an has a long history and a wealth of cultural resources. Many famous imperial tombs and world heritage sites, such as the Terracotta Warriors, are located in or near the city.
However, these historic sites also hinder urban renewal, which is a comprehensive process that includes various aspects [70]. Urban renewal aims to improve deteriorated buildings and living environments [71]. But in Xi’an, protecting heritage sites and maintaining the overall spatial pattern around the Ming city wall limit the renewal of the inner city [72]. The inner city has decayed residential complexes with poor property management. Urban construction and renewal are subject to many restrictions, such as architectural style, building height, and underground space use.
As a result, even though the city center is well-supplied with amenities, most people prefer to live in the suburbs where they can enjoy large-scale development and a better quality of life. This exacerbates the spatial mismatch between the supply and demand of amenities that we found in our study.
Many state-owned enterprises also affect urban land use in Xi’an. After The People’s Republic of China was established, 17 of the 156 Key Projects during the First Five-year Plan in the 1950s were located in Xi’an. They built a modern foundation for industry, science, technology, education, health, and culture in Xi’an. Today, we can still see their traces in different areas of the city: within the Ming Great Wall, in the Textile City sub-district with rich supply and population, in the Qujiang sub-district with famous cultural heritage sites, and under the Xingfu Road tunnel. Moreover, The Third Front Movement was a huge industrial project by China in its interior since 1964 [73]. It aimed to build a strategic defense-focused rearguard with industries such as aviation, aerospace, armaments, and nuclear in Xi’an. These enterprises have greatly helped Xi’an’s development, but they also create challenges for its future. They occupied a lot of land with good locations since the 20th century. They included not only their plants, institutions, and offices, but also housing for their workers and families. In this study, we found 316 such residential complexes with an average area of 16,450 m2. They still make up 12.8% of the total basic units after fast urbanization. Most of their amenities are not well-developed because they were built early without proper urban planning and close to industrial land. Additionally, urban renewal or housing relocation for them is expensive due to rising land prices. This worsens the imbalance between supply and demand for living service amenities in the region.
The imbalance between supply and demand for amenities in Xi’an is rooted in the uneven distribution of resources [74]. It relates to the housing prices that affect people’s choices of where to live. Residents in expensive or well-built areas can enjoy quality public service. But low-income groups have to live in cheap areas along urban fringes with poor access to amenities [72]. This is similar to the mismatching issue of Chinese cities’ morphological and functional polycentricity [75]. At the same time, Dadashpoor et al. [76] argued that this shows distributive inequity from underlying urban processes that create injustice in public amenities.
“Decentralized-strategy” can address the contradiction between the over-concentration of urban resources and population shifting from the center to the suburbs. It aims to prevent over-concentration through balanced planning and legislation, equalization of public services, redistribution of resources, and decentralization and control of administrative bodies [77]. This can alleviate the imbalance between the supply and demand of urban resources [78]. Moreover, changes in the living environment conditions at the micro level, such as residential complexes, can also affect the residents’ access to social resources [79]. So, by enhancing the equity and accessibility of social resources in a residential complex, we can reduce the contradiction between supply and demand in the region and the city. This can also improve the living quality of residents and complement urban planning at the macro level.

4.1. Suggestions for Living Service Amenities Planning and Construction in Xi’an

Firstly, regularly evaluate the supply–demand relationship of urban amenities. Due to the high mobility of urban residents, the supply of and demand for urban amenities will continue to change. Governments need to regularly investigate the distribution of residents, accurately assess areas where supply and demand do not match, and dynamically guide amenity allocations.
Secondly, improve the supply–demand mismatching of amenities using differentiated strategies. To reduce amenities inequality, the government could use the “supplementary principle” before the “compensation principle” to address the unequal distribution of public amenities. This means prioritizing the inequity of irreplaceable amenities, such as kindergartens, and so on. Scarce resources, such as educational and medical resources, which are usually in the urban center with high land values and are spatially clustered, can strongly affect population distribution and house prices. The government should promote equal access to basic public services to achieve a balanced supply–demand relationship. For example, high-quality regional hospitals and schools should be provided firstly in the southwestern and southeastern areas, where young adults and their children are concentrated. Park and stadium amenities should also be constructed in the western and northern areas to provide recreational opportunities for the residents. Attention should also be paid to promoting the development of shopping malls and wet markets in the eastern areas.
Thirdly, strengthen integrated urban development, with the city center as the hub, connecting the Qujiang New District, Aerospace New City, and Hi-tech Industries Development Zone. This will reduce costs and barriers to the settlement of urban residents. Young people are concentrated in the suburbs while the city center is experiencing aging. Therefore, the government should carry out an organic transformation of the old urban areas and attract more young residents to move in. Considering the large proportion of older adults in urban centers, age-appropriate retrofitting should be emphasized, such as traffic and landscape amenities, that are more important for the elderly. Also, to promote more young people to live in the city center, the government could consider implementing policies, such as housing subsidies or increasing the number of talent apartments. This could help revitalize inner urban areas and promote sustainable development.

4.2. Further Applications and Limitations

This study can help plan and construct living service amenities for each residential complex by providing information on their supply and demand status. We applied the results to a randomly selected basic unit as a case for improvement (Figure 16). This unit has a high supply index (0.4292) and a low demand index (0.0034) with a population of 183. It also has a high location entropy (22.52) and a low coupling coordination degree (0.28), showing a serious imbalance between supply and demand. This means there are too many amenities around this unit with too few residents. Most living service amenities are supermarkets with an average distance of 180 m. There are no stadiums or middle schools nearby. To balance supply and demand, we can consider building more residential complexes to attract more residents. We should match the amenities to the residents’ needs rather than increasing some types of amenities. For instance, this residential complex should focus on hospitals and stadiums, which are more important for the population aged 15–60 (74.12%). For the adequately supplied amenities, such as supermarkets, shopping malls, and squares, we should upgrade them instead of building new ones because they have high location entropy (73.28, 39.23, and 59.06). Also, we should build more wet markets and middle schools because they are lacking in this area. Moreover, we can visualize all the basic units in this study to understand their supply and demand status in terms of quantity, distance, supply index, and location entropy. This can help us make better decisions for planning and constructing amenities.
This study has some limitations. First, we used Euclidean distances instead of real network distances to calculate the distances between residential complexes and living amenities. Second, we converted the population and age structure data from the sub-district to the residential complex level, which may not reflect the actual situation of each residential complex. Third, the age categories in census data were too broad to capture the differences in demand among different age groups. For instance, current census data in China groups people aged 15–60 into one category, but this group may have diverse demands for living service amenities. Therefore, we need to refine the age groups to better represent the residents’ characteristics, demands, and activities. Fourth, the service range and level of amenities vary, resulting in differences in statistical zoning effect and daily necessity availability. In further research, amenities should be classified to calculate their service range and accessibility separately. The amenities, such as middle schools and hospitals, have a wider geographical range of service. They should be counted as the supply for more residential complexes. That would make more informed decisions in urban planning and management for service amenities.
In future research, we need further investigations to understand the diverse demands of urban residents for various amenities. For example, we need to know their demographic and age composition and their social identity. We should also extract and analyze the differences in thinking patterns and value judgments of different social groups. Moreover, we should explain their behavioral choices and demand factors more. This can improve the accuracy of the supply and demand analysis. It can also add sociological and statistical dimensions to urban planning.

5. Conclusions

This study explores the spatial mismatch between living amenity supply and urban residents’ demand with different sizes and age compositions using spatial analysis and quantitative assessment methods based on urban multi-source data. We established a supply and demand balance analysis framework to analyze 2645 residential complexes in Xi’an’s main built-up area.
First, the amenities supply index is high in the urban center and low in the suburbs, except for some high-value nuclei. The supply index differs by amenity types, such as public transport, education, healthcare, shopping, and sports and leisure. The demand index is low in the urban center and high in the suburbs. The urban center has fewer and older residents, while the suburbs have more and younger residents.
Second, residential complex location entropy shows a pattern of sufficiency in the urban center and deficiency in the suburbs. The residential complex coupling coordination degree shows four nuclei in the southwest, southeast, north, and center of the study area. The urban center has a high supply index but a low coupling coordination degree due to the imbalance between supply and demand. A coordination belt with high value surrounds the urban center. The supply and demand of amenities in Xi’an are literally influenced by fiscal policy and geographical segregation. They are practically affected by historical sites hindering urban renewal and state-owned enterprises’ influence on urban land use.
Third, we propose planning strategies to improve residential complex supply and demand balance in Xi’an based on residents’ size and age composition, to improve the quality of life and urban equity. The government should regularly assess the supply and demand of urban amenities and guide amenity allocations accordingly. It also should improve the balance between supply and demand for supporting amenities with differentiated strategies to promote the equalization of basic public services. And it should strengthen integrated urban development and reduce costs and barriers to the settlement of urban residents. We can analyze and visualize any residential complex to guide amenity planning and construction for further application.

Author Contributions

Conceptualization, K.W. and X.F.; methodology, K.W.; software, K.W.; validation, W.W., T.L. and S.W.; formal analysis, K.W.; investigation, W.W.; resources, T.L.; data curation, S.W.; writing—original draft preparation, K.W.; writing—review and editing, X.F.; visualization, W.W.; supervision, X.F.; project administration, X.W.; funding acquisition, X.F. All authors have read and agreed to the published version of the manuscript.

Funding

This research was performed and supported while Xin Fu held funding (Z1090221023, 2022JM-204) from the Northwest A&F University, China and Shaanxi Science and Technology Agency, China.

Acknowledgments

We thank Wenxiao Jia and Xiang Li for their helpful comments in earlier drafts of the manuscript.

Conflicts of Interest

The authors declare no conflict of interest.

References

  1. Ren, Q.; Ni, J.; Li, H.; Mao, G.; Hsu, W.; Yang, J. Analysis on Spatial Characteristics of Supply–Demand Relationship of Amenities in Expanding Central Urban Areas—A Case Study of Huai’an, China. Land 2022, 11, 1137. [Google Scholar] [CrossRef]
  2. Bereitschaft, B. Do “creative” and “non-creative” workers exhibit similar preferences for urban amenities? An exploratory case study of Omaha, Nebraska. J. Urban Int. Res. Placemaking Urban Sustain. 2017, 10, 198–216. [Google Scholar] [CrossRef] [Green Version]
  3. Knox, P.; Pinch, S. Urban Social Geography: An Introduction; Routledge: London, UK, 2014. [Google Scholar]
  4. Wang, W.; Zhou, Z.; Chen, J.; Cheng, W.; Chen, J. Analysis of location selection of public service facilities based on urban land accessibility. Int. J. Environ. Res. Public Health 2021, 18, 516. [Google Scholar] [CrossRef]
  5. National Bureau of Statistics of China. China City Statistical Yearbook; China Statistics Press: Beijing, China, 2022; p. 308. [Google Scholar]
  6. Yang, J.; Wu, T.; Gong, P. Implementation of China’s new urbanization strategy requires new thinking. Sci. Bull. 2017, 62, 81–82. [Google Scholar] [CrossRef]
  7. Shi, Y.; Yang, J.; Shen, P. Revealing the correlation between population density and the spatial distribution of urban public service facilities with mobile phone data. Isprs Int. J. Geo-Inf. 2020, 9, 38. [Google Scholar] [CrossRef] [Green Version]
  8. Barbosa, H.; Hazarie, S.; Dickinson, B.; Bassolas, A.; Frank, A.; Kautz, H.; Sadilek, A.; Ramasco, J.J.; Ghoshal, G. Uncovering the socioeconomic facets of human mobility. Sci. Rep. 2021, 11, 8616. [Google Scholar] [CrossRef]
  9. Hu, L.; He, S.; Luo, Y.; Su, S.; Xin, J.; Weng, M. A social-media-based approach to assessing the effectiveness of equitable housing policy in mitigating education accessibility induced social inequalities in Shanghai, China. Land Use Policy 2020, 94, 104513. [Google Scholar] [CrossRef]
  10. Li, H.; Wang, Q.; Shi, W.; Deng, Z.; Wang, H. Residential clustering and spatial access to public services in Shanghai. Habitat. Int. 2015, 46, 119–129. [Google Scholar] [CrossRef]
  11. Stanley, B.W.; Dennehy, T.J.; Smith, M.E.; Stark, B.L.; York, A.M.; Cowgill, G.L.; Novic, J.; Ek, J. Service access in premodern cities: An exploratory comparison of spatial equity. J. Urban Hist. 2016, 42, 121–144. [Google Scholar] [CrossRef] [Green Version]
  12. Wu, J.; Cai, Z.; Li, H. Accessibility of medical facilities in multiple traffic modes: A study in Guangzhou, China. Complexity 2020, 2020, 8819836. [Google Scholar] [CrossRef]
  13. He, J.; Dang, Y.; Zhang, W.; Chen, L. Perception of urban public safety of floating population with higher education background: Evidence from urban China. Int. J. Environ. Res. Public Health 2020, 17, 8663. [Google Scholar] [CrossRef]
  14. Shen, J.; Cheng, J.; Huang, W.; Zeng, F. An Exploration of Spatial and Social Inequalities of Urban Sports Facilities in Nanning City, China. Sustainability 2020, 12, 4353. [Google Scholar] [CrossRef]
  15. Barr, N. Economics of the Welfare State; Oxford University Press: Oxford, MS, USA, 2020. [Google Scholar]
  16. Rich, R.C. Neglected issues in the study of urban service distributions: A research agenda. Urban Stud. 1979, 16, 143–156. [Google Scholar] [CrossRef]
  17. Allen, J.; Cochrane, A.; Henry, N.; Massey, D.; Sarre, P. Rethinking the Region: Spaces of Neo-Liberalism; Routledge: London, UK, 2012. [Google Scholar]
  18. Pierson, P. The New Politics of the Welfare State. World Polit. 1996, 48, 143–179. [Google Scholar] [CrossRef]
  19. Bonoli, G. Classifying Welfare States: A Two-dimension Approach. J. Soc. Policy 1997, 26, 351–372. [Google Scholar] [CrossRef]
  20. Chen, T.; Hui, E.C.; Lang, W.; Tao, L. People, recreational facility and physical activity: New-type urbanization planning for the healthy communities in China. Habitat. Int. 2016, 58, 12–22. [Google Scholar] [CrossRef]
  21. Cho, C.M. Study on Effects of Resident-Perceived Neighborhood Boundaries on Public Services Accessibility and Its Relation to Utilization: Using Geographic Information System, Focusing on the Case of Public parks in Austin, Texas; Texas A&M University: College Station, TX, USA, 2003. [Google Scholar]
  22. Scott, D.; Jackson, E.L. Factors that limit and strategies that might encourage people‘s use of public parks. J. Park. Recreat. Adm. 1996, 14, 1–17. [Google Scholar]
  23. Gar-on Yeh, A.; Wu, F. The transformation of the urban planning system in China from a centrally-planned to transitional economy. Prog. Plann. 1999, 51, 167–252. [Google Scholar] [CrossRef]
  24. Naughton, B. Growing Out of the Plan: Chinese Economic Reform, 1978–1993; Cambridge University Press: Cambridge, UK, 1995. [Google Scholar]
  25. Wang, X.; Hui, E.C.; Choguill, C.; Jia, S. The new urbanization policy in China: Which way forward? Habitat. Int. 2015, 47, 279–284. [Google Scholar] [CrossRef]
  26. Hu, A. The Distinctive Transition of China’s Five-Year Plans. Mod. China 2013, 39, 629–639. [Google Scholar] [CrossRef]
  27. Li, J.; Li, J.; Yuan, Y.; Li, G. Spatiotemporal distribution characteristics and mechanism analysis of urban population density: A case of Xi’an, Shaanxi, China. Cities 2019, 86, 62–70. [Google Scholar] [CrossRef]
  28. Karra, M.; Fink, G.; Canning, D. Facility distance and child mortality: A multi-country study of health facility access, service utilization, and child health outcomes. Int. J. Epidemiol. 2017, 46, 817–826. [Google Scholar] [CrossRef] [Green Version]
  29. Guo, M.; Liu, B.; Tian, Y.; Xu, D. Equity to Urban Parks for Elderly Residents: Perspectives of Balance between Supply and Demand. Int. J. Environ. Res. Public Health 2020, 17, 8506. [Google Scholar] [CrossRef]
  30. Schrammeijer, E.A.; Malek, Ž.; Verburg, P.H. Mapping demand and supply of functional niches of urban green space. Ecol. Indic. 2022, 140, 109031. [Google Scholar] [CrossRef]
  31. Wu, J.; Li, Q. Method for Forecasting Urban National Sports and Fitness Demand Based on Ant Colony Algorithm. Comput. Intel. Neurosc. 2021, 2021, 1–7. [Google Scholar] [CrossRef]
  32. Gu, X.; Tao, S.; Dai, B. Spatial accessibility of country parks in Shanghai, China. Urban Urban Gree 2017, 27, 373–382. [Google Scholar] [CrossRef]
  33. Wei, W.; Ren, X.; Guo, S. Evaluation of Public Service Facilities in 19 Large Cities in China from the Perspective of Supply and Demand. Land 2022, 11, 149. [Google Scholar] [CrossRef]
  34. Deng, Y.; Liu, J.; Luo, A.; Wang, Y.; Xu, S.; Ren, F.; Su, F. Spatial Mismatch between the Supply and Demand of Urban Leisure Services with Multisource Open Data. In ISPRS Int. J. Geo-Inf. 2020, 9, 466. [Google Scholar] [CrossRef]
  35. Chen, Y.; Hu, Y.; Lai, L. Demography-Oriented Urban Spatial Matching of Service Facilities: Case Study of Changchun, China. Land 2022, 11, 1660. [Google Scholar] [CrossRef]
  36. Li, Z.; Chen, H.; Yan, W. Exploring spatial distribution of urban park service areas in Shanghai based on travel time estimation: A method combining multi-source data. Isprs Int. J. Geo-Inf. 2021, 10, 608. [Google Scholar] [CrossRef]
  37. Vadrevu, L.; Kanjilal, B. Measuring spatial equity and access to maternal health services using enhanced two step floating catchment area method (E2SFCA)—A case study of the Indian Sundarbans. Int. J. Equity Health 2016, 15, 87. [Google Scholar] [CrossRef] [Green Version]
  38. Lee, J.; Miller, H.J. Measuring the impacts of new public transit services on space-time accessibility: An analysis of transit system redesign and new bus rapid transit in Columbus, Ohio, USA. Appl. Geogr. 2018, 93, 47–63. [Google Scholar] [CrossRef]
  39. Dai, D. Black residential segregation, disparities in spatial access to health care facilities, and late-stage breast cancer diagnosis in metropolitan Detroit. Health Place 2010, 16, 1038–1052. [Google Scholar] [CrossRef]
  40. Hakimi, S.L. Optimum distribution of switching centers in a communication network and some related graph theoretic problems. Oper. Res. 1965, 13, 462–475. [Google Scholar] [CrossRef]
  41. Welch, T.F. Equity in transport: The distribution of transit access and connectivity among affordable housing units. Transp. Policy 2013, 30, 283–293. [Google Scholar] [CrossRef]
  42. Yang, J.; Guo, A.; Li, X.; Huang, T. Study of the impact of a high-speed railway opening on China’s accessibility pattern and spatial equality. Sustainability 2018, 10, 2943. [Google Scholar] [CrossRef] [Green Version]
  43. Talen, E.; Anselin, L. Assessing spatial equity: An evaluation of measures of accessibility to public playgrounds. Environ. Plan. A 1998, 30, 595–613. [Google Scholar] [CrossRef] [Green Version]
  44. Zhen, F.; Cao, Y.; Qin, X.; Wang, B. Delineation of an urban agglomeration boundary based on Sina Weibo microblog ‘check-in’data: A case study of the Yangtze River Delta. Cities 2017, 60, 180–191. [Google Scholar] [CrossRef]
  45. Wu, H.; Wang, L.; Zhang, Z.; Gao, J. Analysis and optimization of 15-minute community life circle based on supply and demand matching: A case study of Shanghai. PLoS ONE 2021, 16, e256904. [Google Scholar] [CrossRef]
  46. Liu, H.; Remme, R.P.; Hamel, P.; Nong, H.; Ren, H. Supply and demand assessment of urban recreation service and its implication for greenspace planning-A case study on Guangzhou. Landsc. Urban Plan. 2020, 203, 103898. [Google Scholar] [CrossRef]
  47. The Central People’s Government of the People’s Republic of China. Statistical Bulletin on National Economic and Social Development of Xi’an in 2021. Available online: http://www.shaanxi.gov.cn/zfxxgk/fdzdgknr/tjxx/tjgb_240/sqgb/202204/t20220408_2216664.html (accessed on 8 November 2022).
  48. Xi’an Natural Resources and Planning Bureau. Spatial Planning (2021–2035) Draft Public Notice of Xi’an. Available online: https://www.xa.gov.cn/index/tttp/636a2fa2f8fd1c4c21276937.html (accessed on 10 November 2022).
  49. Xiuyuan, Z.; Shihong, D.; Qiao, W. Hierarchical semantic cognition for urban functional zones with VHR satellite images and POI data. ISPRS J. Photogramm. 2017, 132, 170–184. [Google Scholar]
  50. Ministry of Housing and Urban Rural Development of the People's Republic of China. Announcement of the Ministry of Housing and Urban-Rural Development on the Release of the National Standard Urban Residential Area Planning and Design Standard. Available online: https://www.mohurd.gov.cn/gongkai/fdzdgknr/tzgg/201811/20181130_238590.html (accessed on 12 November 2022).
  51. Li, X.; Hu, T.; Gong, P.; Du, S.; Chen, B.; Li, X.; Dai, Q. Mapping Essential Urban Land Use Categories in Beijing with a Fast Area of Interest (AOI)-Based Method. Remote Sens. 2021, 13, 477. [Google Scholar] [CrossRef]
  52. Ministry of Housing and Urban Rural Development of the People’s Republic of China. Letter from the Ministry of Housing and Urban-Rural Development on Support for the 2020 Urban Health Check; Ministry of Housing and Urban-Rural Development: Beijing, China, 2020.
  53. Huang, L.; Wu, J.; Yan, L. Defining and measuring urban sustainability: A review of indicators. Landsc. Ecol. 2015, 30, 1175–1193. [Google Scholar] [CrossRef]
  54. Xie, X.; Luan, X.; Xue, Y. Research on City Center Identification and Optimization Strategy Based on POI Data—Taking the Four Districts of Qingdao as an Example. J. Phys. Conf. Ser. 2021, 1955, 012016. [Google Scholar] [CrossRef]
  55. Zhen, W.; Georges, A. Comparison of Multi-Criteria Group Decision-Making Methods for Urban Sewer Network Plan Selection. Civileng 2020, 1, 3. [Google Scholar]
  56. Ludovic-Alexandre, V.; Franck, M.; Jean-Claude, B. Using a Delphi process and the Analytic Hierarchy Process (AHP) to evaluate the complexity of projects. Expert. Syst. Appl. 2011, 38, 5388–5405. [Google Scholar]
  57. Peng, L.; Zhang, L.; Li, X.; Wang, P.; Zhao, W.; Wang, Z.; Jiao, L.; Wang, H. Spatio-Temporal Patterns of Ecosystem Services Provided by Urban Green Spaces and Their Equity along Urban–Rural Gradients in the Xi’an Metropolitan Area, China. Remote Sens. 2022, 14, 4299. [Google Scholar] [CrossRef]
  58. Li, Y.; Li, Y.; Zhou, Y.; Shi, Y.; Zhu, X. Investigation of a coupling model of coordination between urbanization and the environment. J. Environ. Manag. 2012, 98, 127–133. [Google Scholar] [CrossRef]
  59. Wang, J.; Wang, S.; Li, S.; Feng, K. Coupling analysis of urbanization and energy-environment efficiency: Evidence from Guangdong province. Appl. Energ. 2019, 254, 113650. [Google Scholar] [CrossRef]
  60. Wu, X.; Zhang, Y.; Wang, L. Coupling relationship between regional urban development and eco-environment: Inspiration from the old industrial base in Northeast China. Ecol. Indic. 2022, 142, 109259. [Google Scholar] [CrossRef]
  61. Zhao, J.; Xiao, Y.; Sun, S.; Sang, W.; Axmacher, J.C. Does China‘s increasing coupling of ‘urban population’ and ‘urban area’ growth indicators reflect a growing social and economic sustainability? J. Environ. Manag. 2022, 301, 113932. [Google Scholar] [CrossRef]
  62. Burgess, E.W. The Growth of the City: An Introduction to a Research Project; Springer: Berlin/Heidelberg, Germany, 2008. [Google Scholar]
  63. Yuanyuan, Y.; Yansui, L.; Yurui, L.; Jintao, L. Measure of urban-rural transformation in Beijing-Tianjin-Hebei region in the new millennium: Population-land-industry perspective. Land Use Policy 2018, 79, 595–608. [Google Scholar]
  64. Wu, Y.; Zhu, H.; Zheng, S. The Local Land Finance Transformation with the Synergy of Increment and Inventory: A Case Study in China. Land 2022, 11, 1529. [Google Scholar] [CrossRef]
  65. Yong, L.; Wenze, Y.; Peilei, F.; Yi, P.; Zhengtao, Z. Financing China‘s Suburbanization: Capital Accumulation through Suburban Land Development in Hangzhou. Int. J. Urban Reg. 2016, 40, 1112–1133. [Google Scholar]
  66. Pierre, M.P.; Yves, Z. Urban spatial structure, employment and social ties. J. Urban Econ. 2018, 104, 77–93. [Google Scholar]
  67. He, Q.; Boterman, W.; Musterd, S.; Wang, Y. Perceived social distance, socioeconomic status and adaptive residential mobility in urban China. Habitat. Int. 2022, 120, 102500. [Google Scholar] [CrossRef]
  68. Sako, M.; Wouter, P.V.G.; Marjolijn, D.; Jan, L. Adaptive behaviour in urban space: Residential mobility in response to social distance. Urban Stud. 2016, 53, 227–246. [Google Scholar]
  69. Ma, D.; Wang, Y.; Zhou, D.; Zhu, Z.; Yang, Y. The renew plans of urban thermal environment optimization for traditional districts in Xi’an, China. Environ. Sci. Pollut. R. 2023, 30, 5700–5716. [Google Scholar] [CrossRef]
  70. Yung, E.H.K.; Zhang, Q.; Chan, E.H.W. Underlying social factors for evaluating heritage conservation in urban renewal districts. Habitat. Int. 2017, 66, 135–148. [Google Scholar] [CrossRef]
  71. Lan, F.; Wu, Q.; Zhou, T.; Da, H. Spatial Effects of Public Service Facilities Accessibility on Housing Prices: A Case Study of Xi’an, China. Sustainability 2018, 10, 4503. [Google Scholar] [CrossRef] [Green Version]
  72. Fan, J.; Zou, B. Industrialization from scratch: The “Construction of Third Front” and local economic development in China‘s hinterland. J. Dev. Econ. 2021, 152, 102698. [Google Scholar] [CrossRef]
  73. Zhu, L.; Guo, Y.; Zhang, C.; Meng, J.; Ju, L.; Zhang, Y.; Tang, W. Assessing Community-Level Livability Using Combined Remote Sensing and Internet-Based Big Geospatial Data. Remote Sens. 2020, 12, 4026. [Google Scholar] [CrossRef]
  74. Wenze, Y.; Tianyu, W.; Yong, L.; Qun, Z.; Xinyue, Y. Mismatch of morphological and functional polycentricity in Chinese cities: An evidence from land development and functional linkage. Land Use Policy 2019, 88, 104176. [Google Scholar]
  75. Dadashpoor, H.; Rostami, F.; Alizadeh, B. Is inequality in the distribution of urban facilities inequitable? Exploring a method for identifying spatial inequity in an Iranian city. Cities 2016, 52, 159–172. [Google Scholar] [CrossRef]
  76. Marieke, O.; Mark, W.; Jan-Kees, H. The institutional space of community initiatives for renewable energy: A comparative case study of the Netherlands, Germany and Denmark. Energy Sustain. Soc. 2014, 4, 11. [Google Scholar]
  77. Daniel, Z. Why Some Cities Provide More Public Goods than Others: A Subnational Comparison of the Provision of Public Goods in German Cities in 1912. Stud. Comp. Int. Dev. 2008, 43, 273–289. [Google Scholar]
  78. Augustinus, E.M.D.H.; Brigit, A.M.S. Health, environment and quality of life: An epidemiological perspective on urban development. Landsc. Urban Plan 2003, 65, 53–62. [Google Scholar]
  79. Taleai, M.; Sliuzas, R.; Flacke, J. An integrated framework to evaluate the equity of urban public facilities using spatial multi-criteria analysis. Cities 2014, 40, 56–69. [Google Scholar] [CrossRef]
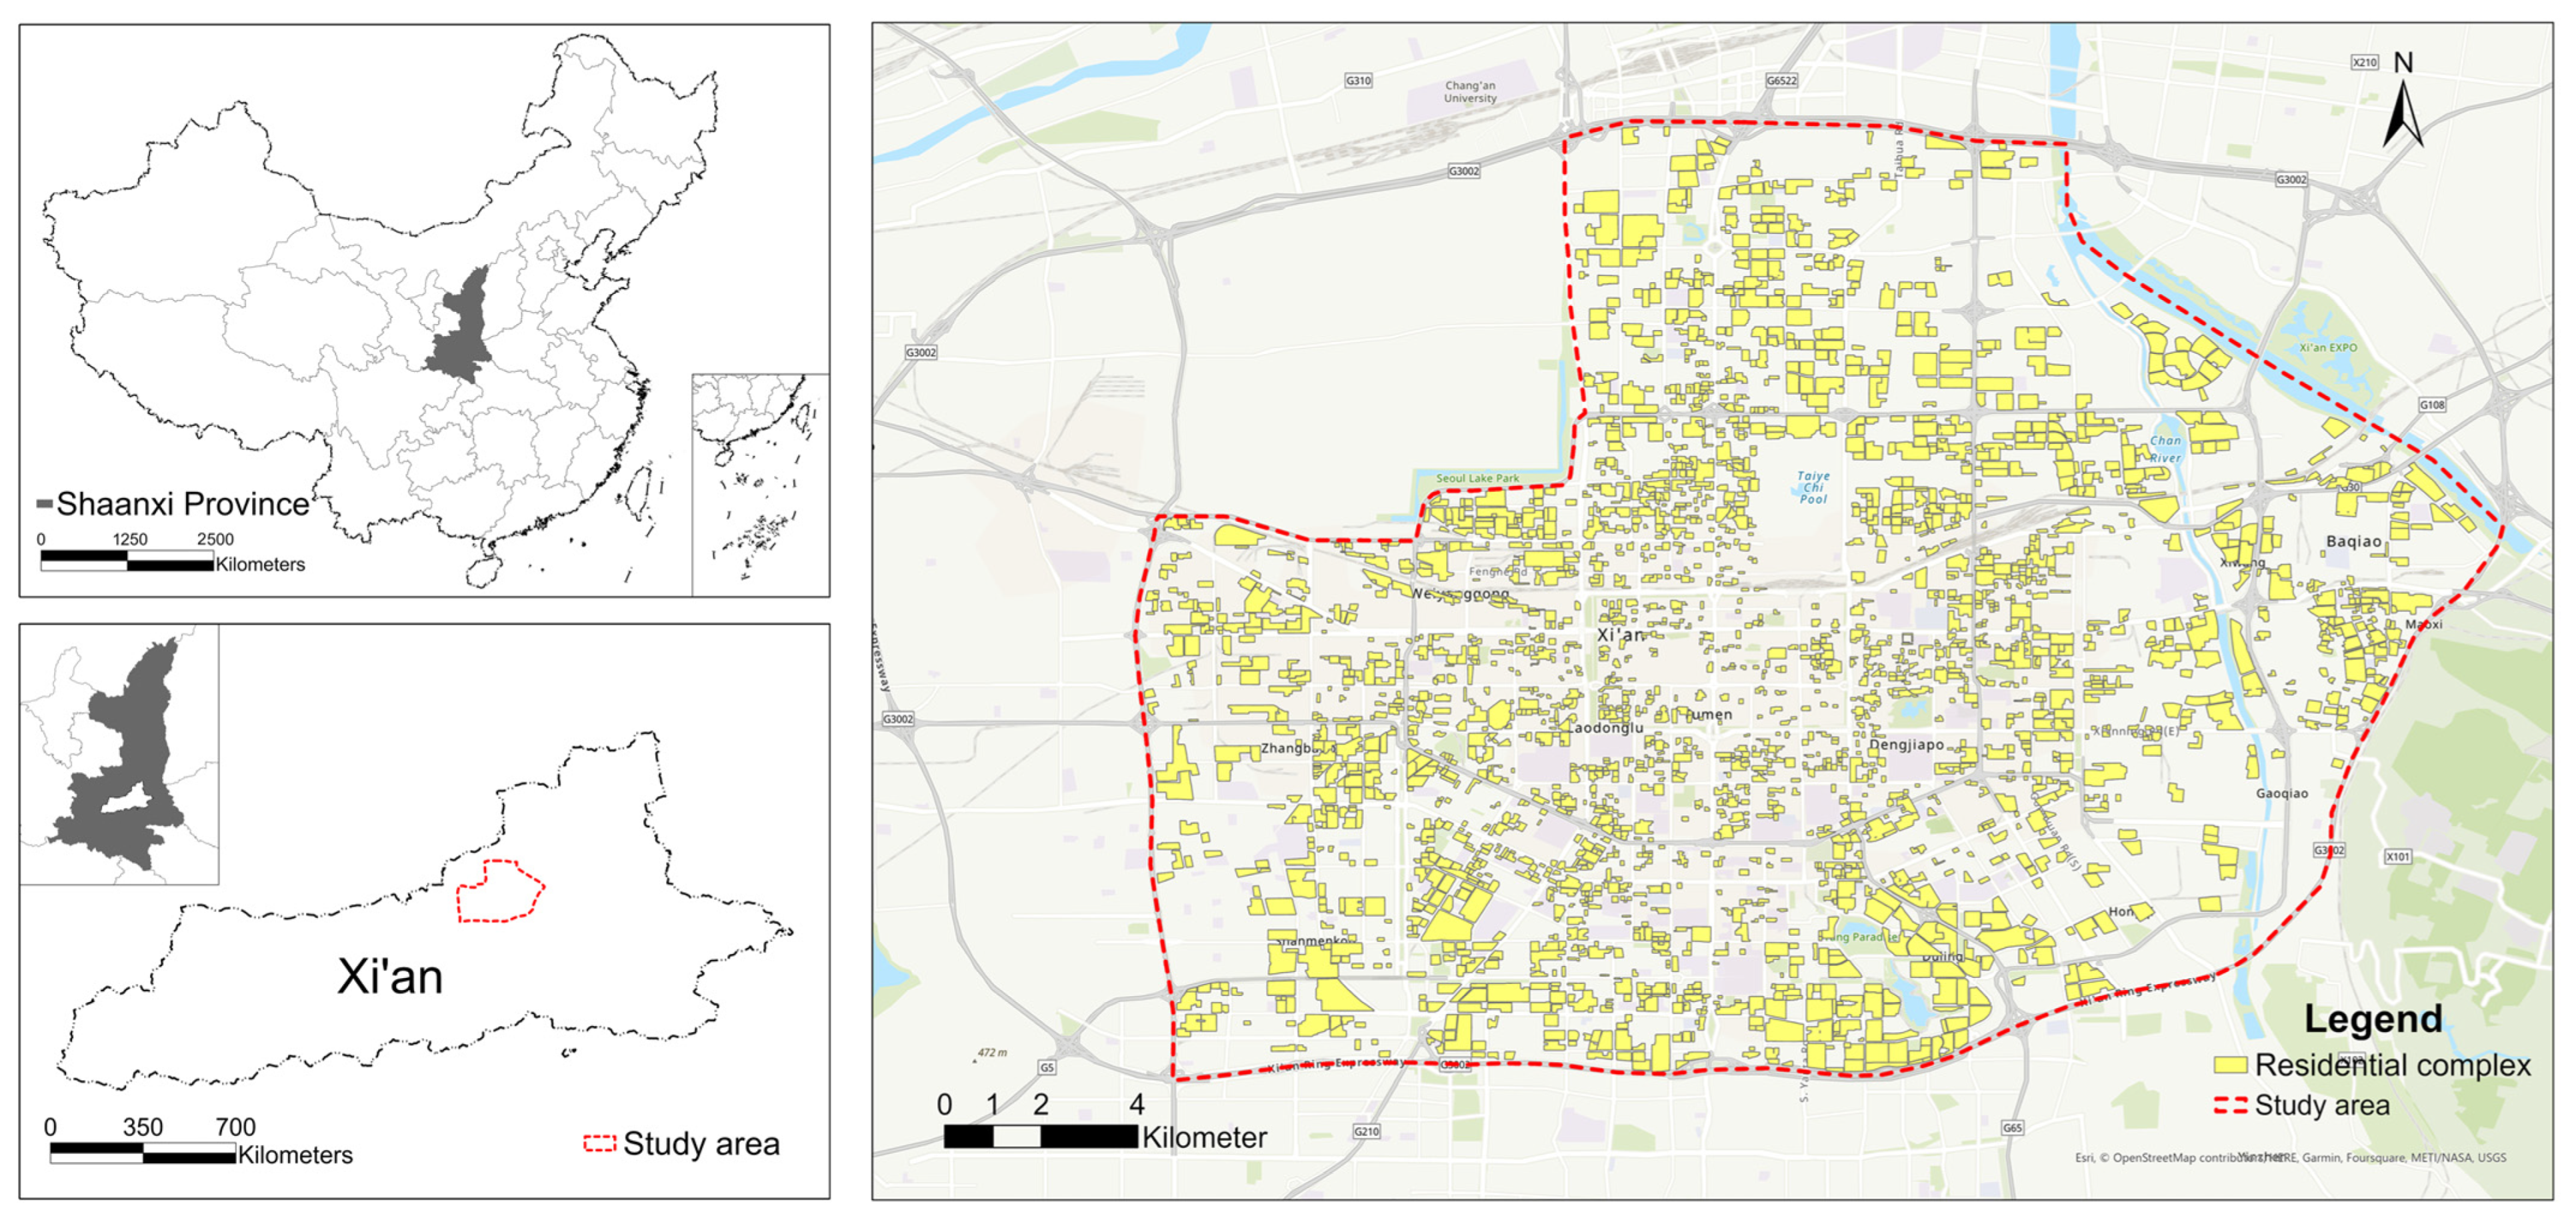
Figure 1. Study area and the basic units in the City of Xi’an, Shaanxi, China.
Sustainability 15 12392 g001
Figure 4. The data flowchart for supply and demand balancing analysis.
Sustainability 15 12392 g004
Figure 5. Spatial distribution of the supply index for each basic unit.
Sustainability 15 12392 g005
Figure 6. (a) Spatial distribution of the supply index for squares; (b) spatial distribution of the supply index for parks.
Sustainability 15 12392 g006
Figure 7. (a) Spatial distribution of the supply index for bus stops; (b) spatial distribution of the supply index for metro stations.
Sustainability 15 12392 g007
Figure 8. (a) Spatial distribution of the supply index for kindergartens; (b) spatial distribution of the supply index for primary schools; (c) spatial distribution of the supply index for middle schools.
Sustainability 15 12392 g008
Figure 9. (a) Spatial distribution of the supply index for hospitals; (b) spatial distribution of the supply index for pharmacies.
Sustainability 15 12392 g009
Figure 10. (a) Spatial distribution of the supply index for supermarkets; (b) spatial distribution of the supply index for shopping malls; (c) spatial distribution of the supply index for wet markets.
Sustainability 15 12392 g010
Figure 11. (a) Spatial distribution of the supply index for stadiums; (b) spatial distribution of the supply index for gyms.
Sustainability 15 12392 g011
Figure 12. (a) Spatial distribution of age group 0–14 years for each residential complex; (b) spatial distribution of age group 15–60 years for each residential complex; (c) spatial distribution of age group 60 years and above for each residential complex.
Sustainability 15 12392 g012
Figure 13. Spatial distribution of the demand index for each basic unit.
Sustainability 15 12392 g013
Figure 14. Spatial distribution of location entropy for each basic unit.
Sustainability 15 12392 g014
Figure 15. (a) Spatial distribution of coupling coordination degree for each basic unit; (b) the kriging interpolation of coupling coordination degree.
Sustainability 15 12392 g015
Figure 16. A case of the basic unit for a detailed supply and demand description of amenities.
Sustainability 15 12392 g016
Table 1. Measurements of different living service amenities.
Living Service
Amenity Dimensions
Measuring Types
Ecological
Landscape
The number of squares (i.e., open spaces) around the residential complex
The number of parks around the residential complex
Traffic and
Transportation
The number of bus stops around the residential complex
The number of metro stations around the residential complex
Education and CultureThe number of kindergartens around the residential complex
The number of primary schools around the residential complex
The number of middle schools around the residential complex
HealthcareThe number of pharmacies around the residential complex
The number of hospitals around the residential complex
Shopping ServiceThe number of supermarkets around the residential complex
The number of shopping malls around the residential complex
The number of wet markets around the residential complex
Sports and LeisureThe number of stadiums around the residential complex
The number of gyms around the residential complex
Table 2. Classification criteria of the coupling degree.
Serial NumberCoordination IntervalCoordination Level
1 0.0   <   D i C C D ≤ 0.3Seriously unbalanced
2 0.3   <   D i C C D ≤ 0.5Slightly unbalanced
3 0.5   <   D i C C D ≤ 0.7Slightly balanced
4 0.7   <   D i C C D ≤ 1.0Superior balanced
Table 3. Weights for different demand types.
Age GroupTier 1 DimensionTier 2 TypeComposite Type Weight
DimensionWeightTypeWeight
Age Group
0–14 Years
Ecological Landscape0.0963Squares0.35560.0342
Parks0.64440.0620
Traffic and Transportation0.1259Bus Stops0.40630.0511
Metro stations0.59380.0747
Education and Culture0.2458Kindergartens0.24300.0597
Primary Schools0.32100.0789
Middle Schools0.43600.1072
Healthcare0.2333Pharmacies0.38530.0899
Hospitals0.61470.1434
Shopping Service0.1022Supermarkets0.41580.0425
Shopping Malls0.28380.0290
Wet Markets0.30040.0307
Sports and Leisure0.1966Stadiums0.64930.1277
Gyms0.35070.0690
Age Group
15–60 Years
Ecological Landscape0.0795Squares0.32570.0259
Parks0.67430.0536
Traffic and Transportation0.1855Bus Stops0.32180.0597
Metro stations0.67820.1258
Education and Culture0.1458Kindergartens0.19520.0285
Primary Schools0.28060.0409
Middle Schools0.52420.0764
Healthcare0.2594Pharmacies0.36810.0955
Hospitals0.63190.1639
Shopping Service0.1476Supermarkets0.19900.0294
Shopping Malls0.33140.0489
Wet Markets0.46960.0693
Sports and Leisure0.1821Stadiums0.44030.0802
Gyms0.55970.1019
Age Group 60
Years and Above
Ecological Landscape0.1433Squares0.41470.0594
Parks0.58530.0839
Traffic and Transportation0.1520Bus Stops0.59230.0900
Metro stations0.40770.0620
Education and Culture0.0608Kindergartens0.34590.0210
Primary Schools0.33950.0206
Middle Schools0.31450.0191
Healthcare0.3929Pharmacies0.27920.1097
Hospitals0.72080.2832
Shopping Service0.1011Supermarkets0.22880.0231
Shopping Malls0.16590.0168
Wet Markets0.60520.0612
Sports and Leisure0.1500Stadiums0.60350.0905
Gyms0.39650.0595
Disclaimer/Publisher’s Note: The statements, opinions and data contained in all publications are solely those of the individual author(s) and contributor(s) and not of MDPI and/or the editor(s). MDPI and/or the editor(s) disclaim responsibility for any injury to people or property resulting from any ideas, methods, instructions or products referred to in the content.