
Optimizing Living Service Amenities for Diverse Urban Residents: A Supply and Demand Balancing Analysis


Abstract
:1. Introduction
2. Materials and Methods
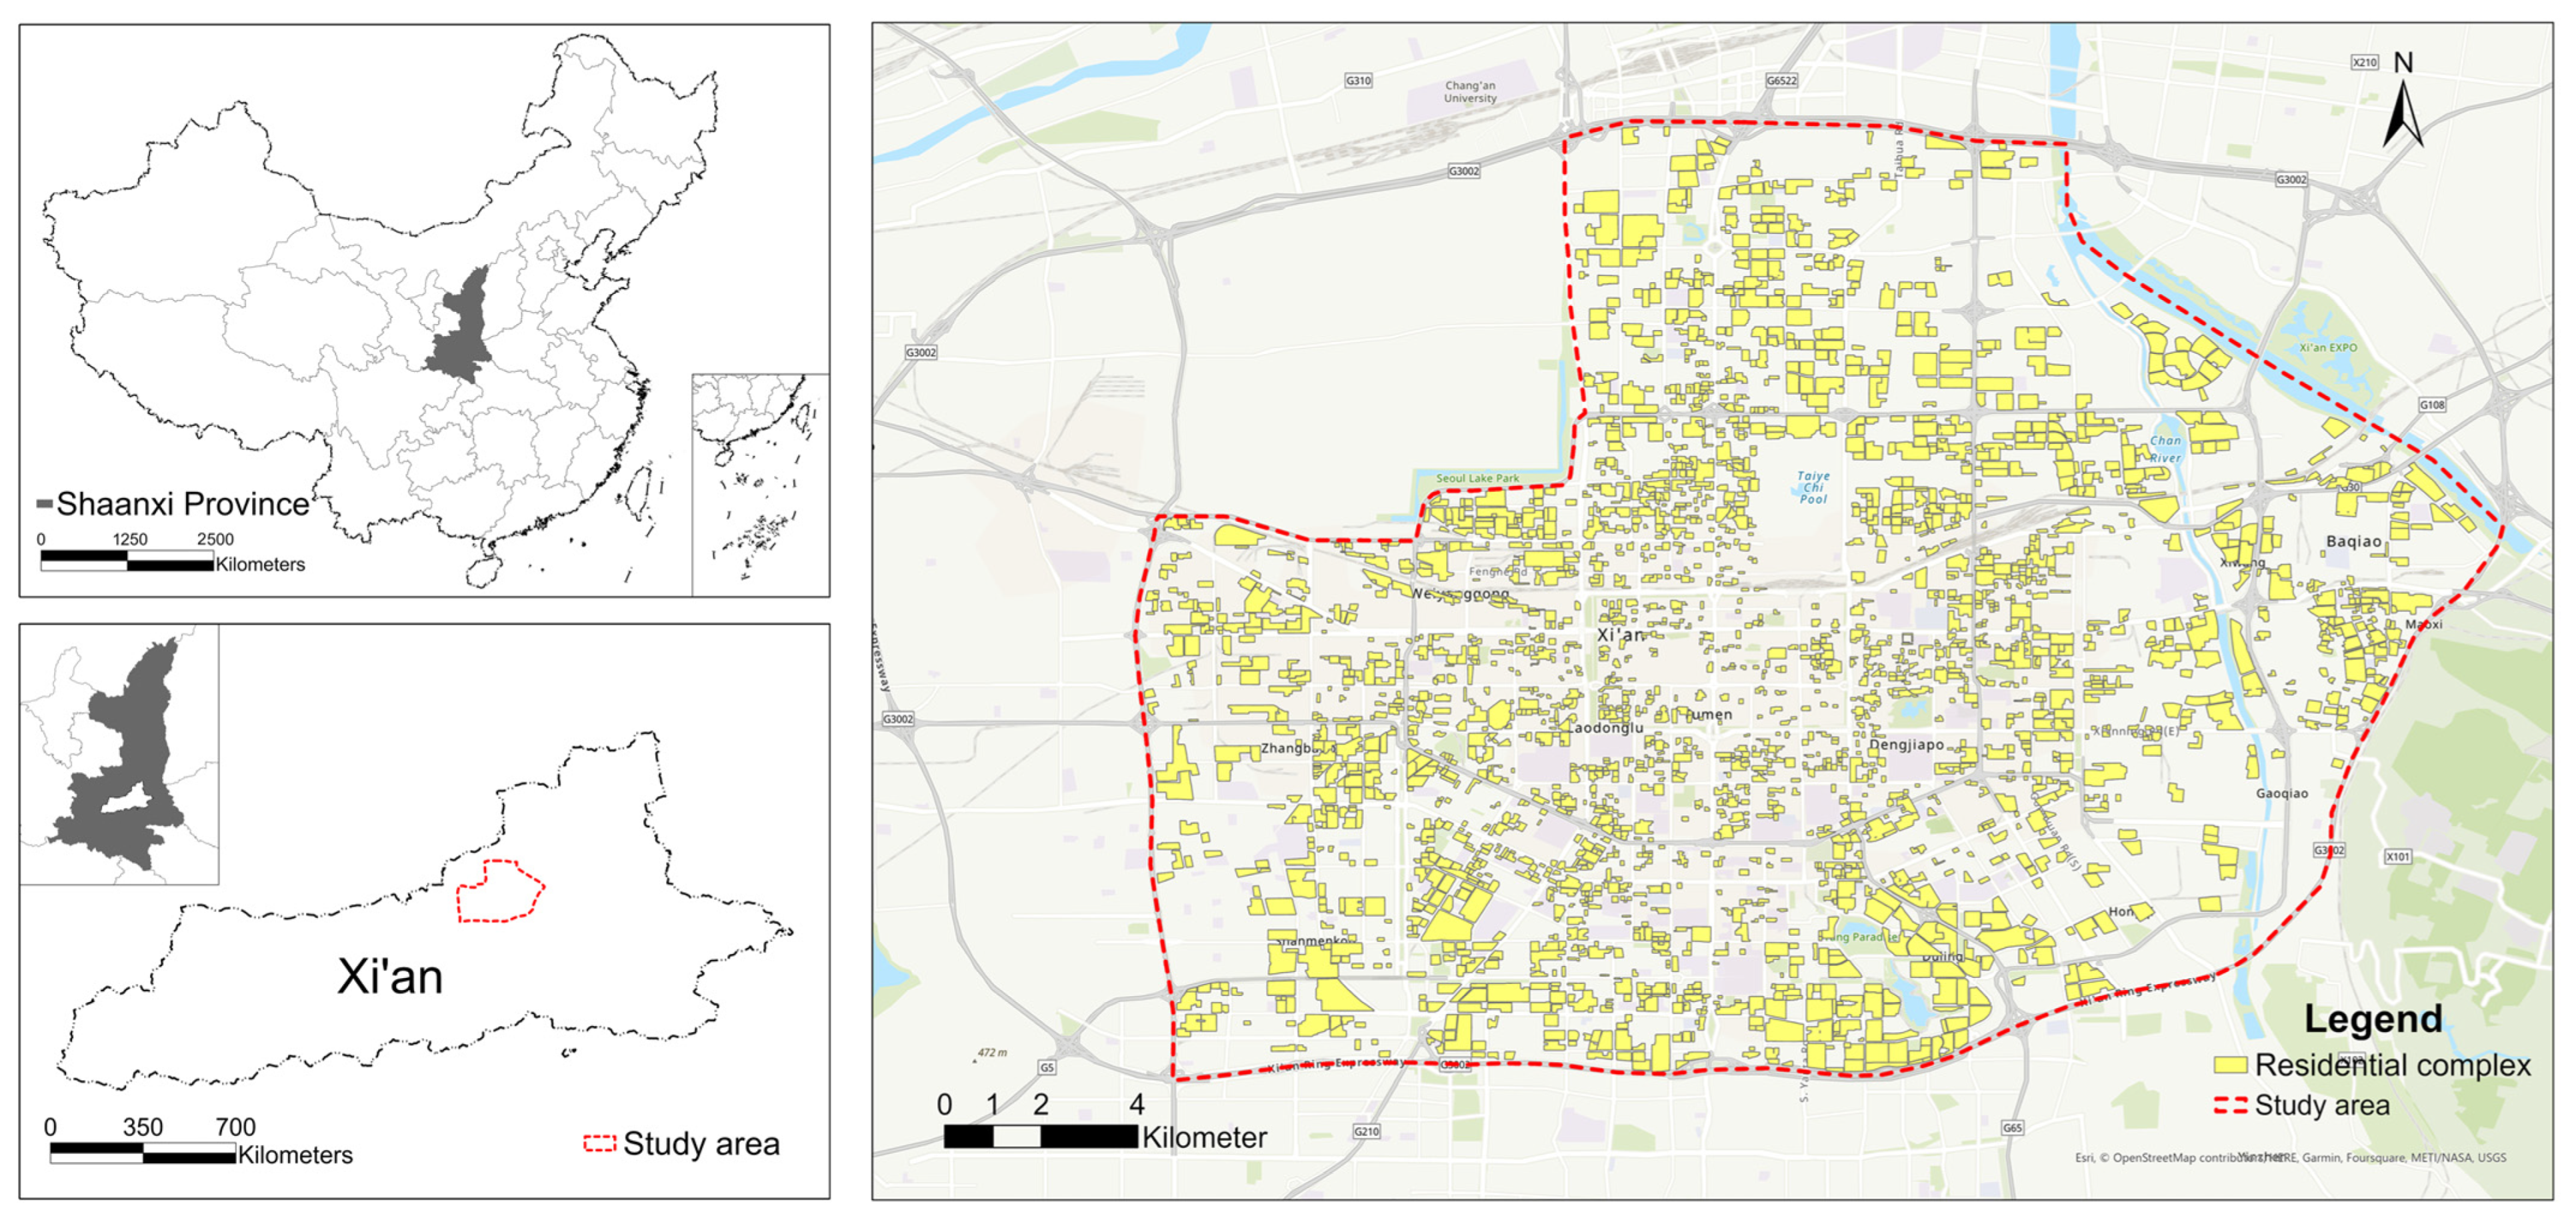
2.1. Study Area
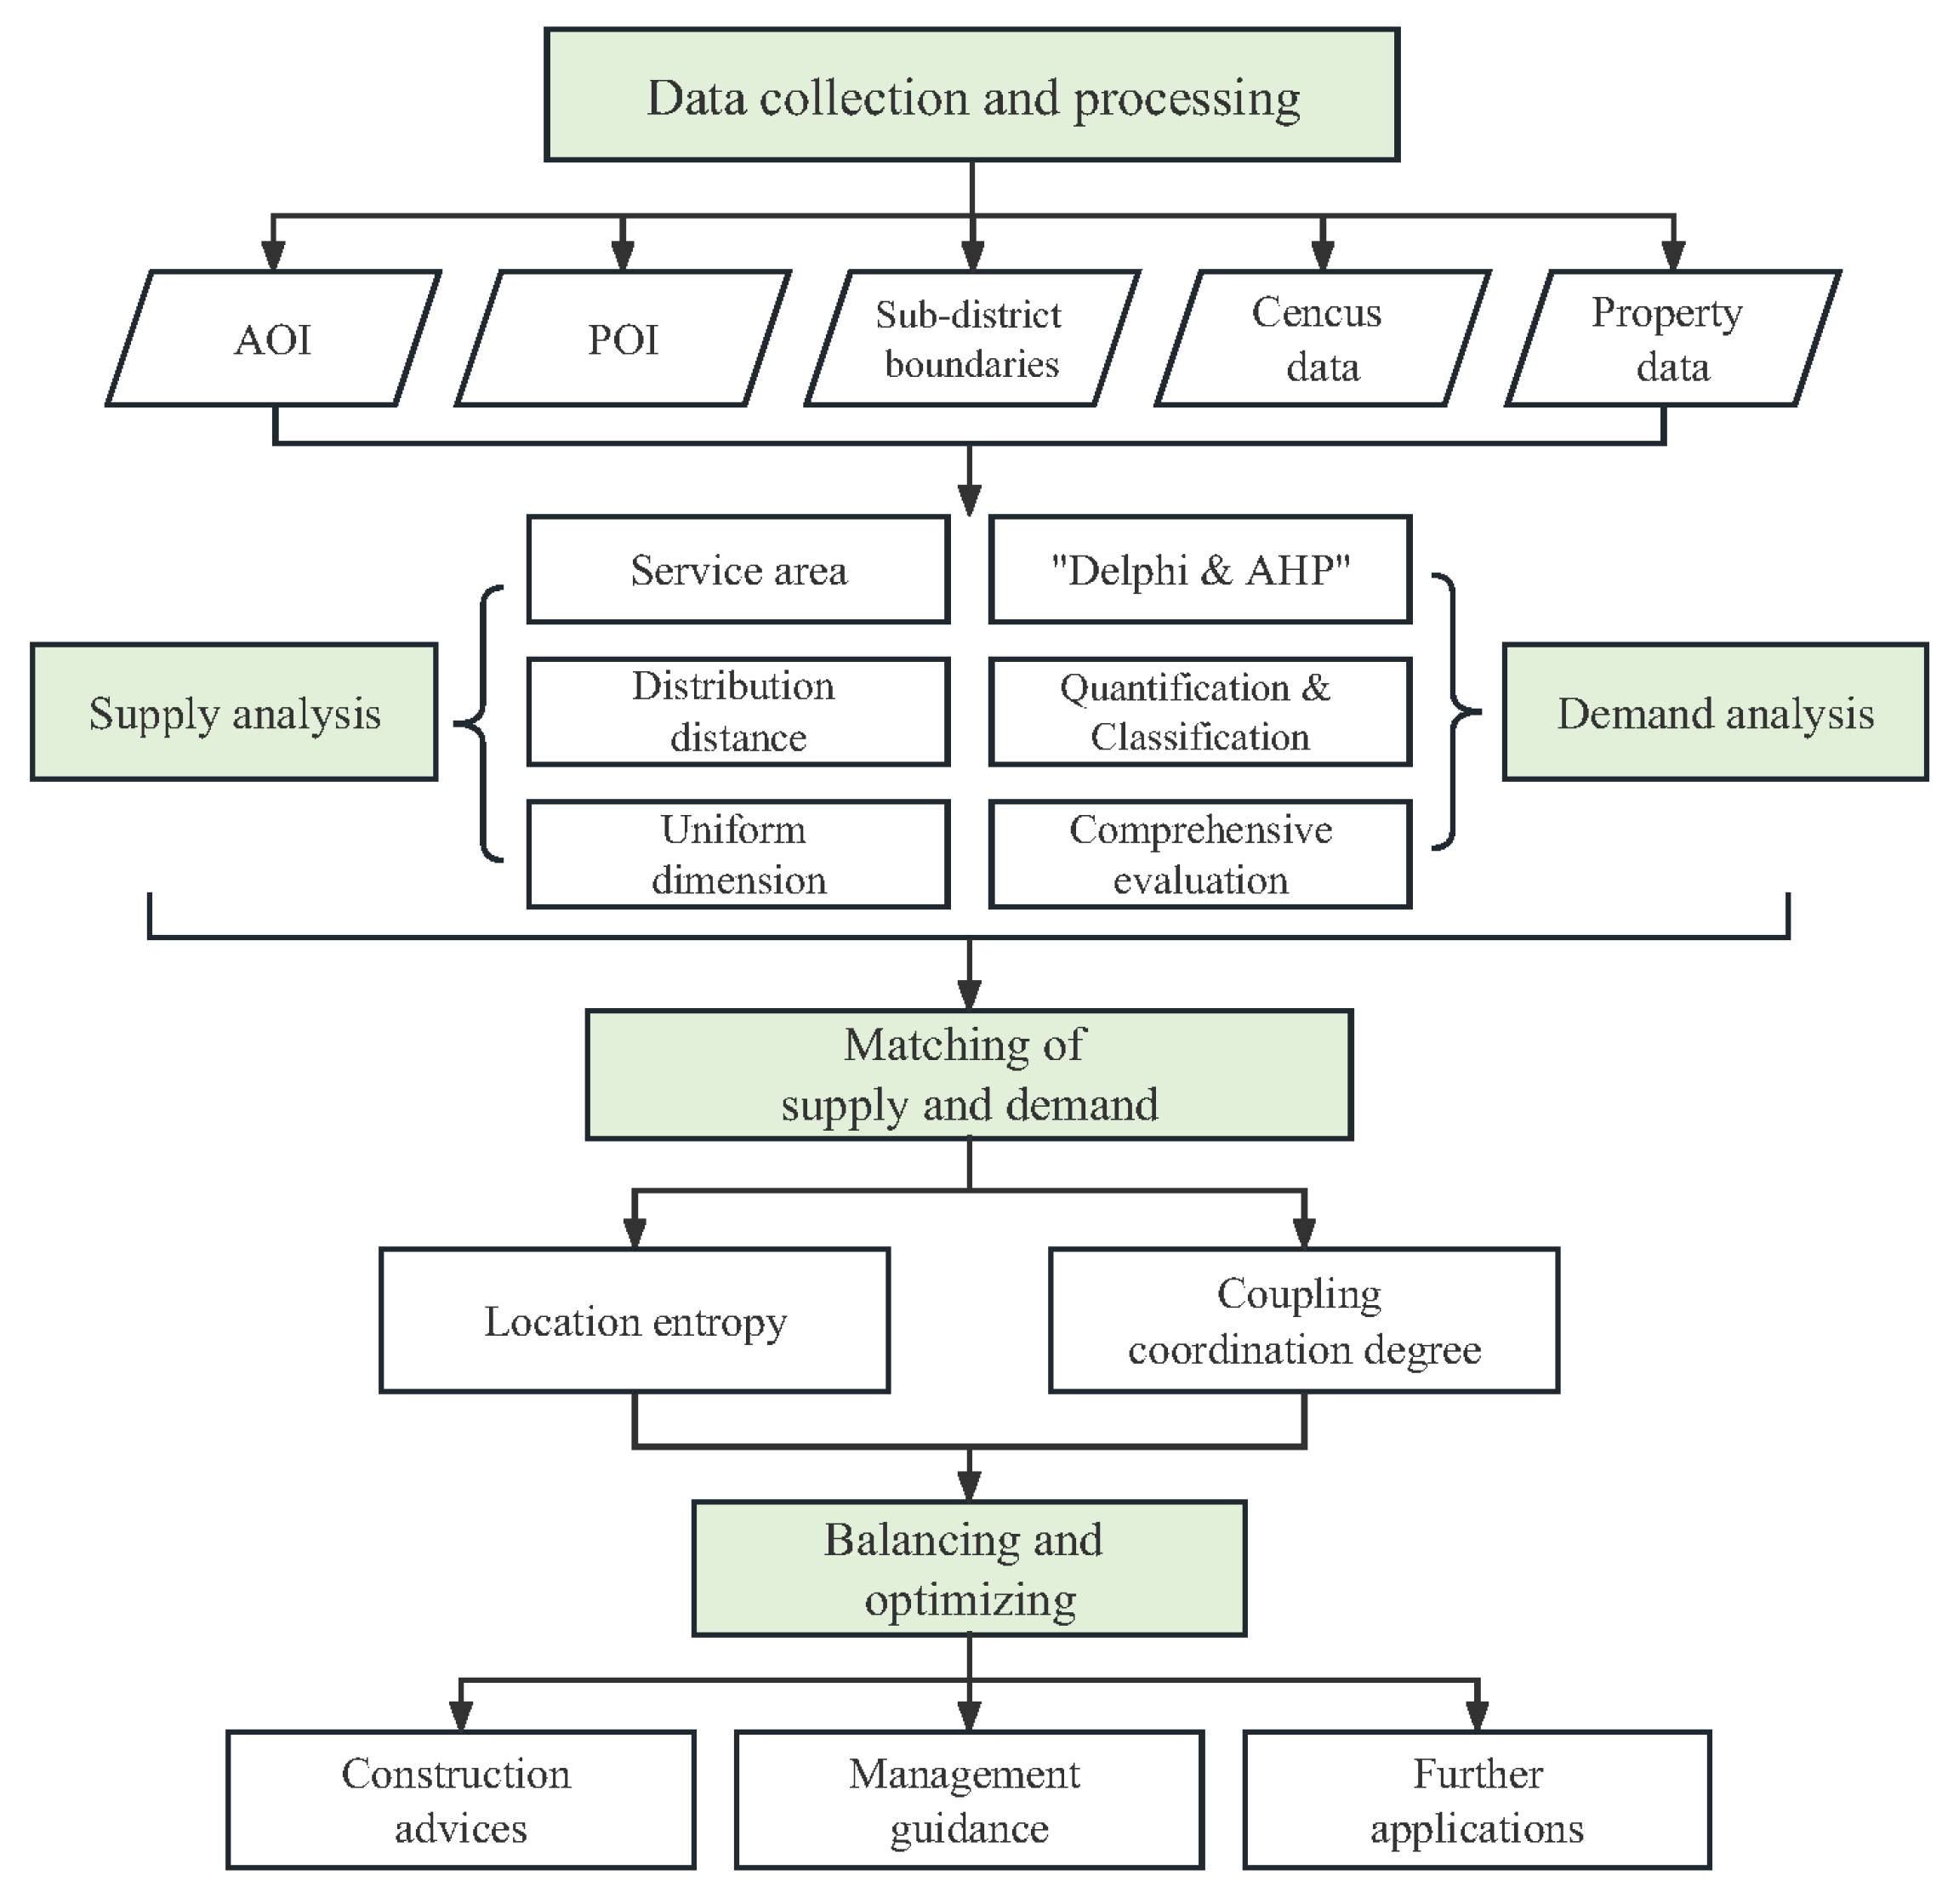
2.2. Data Collection and Processing
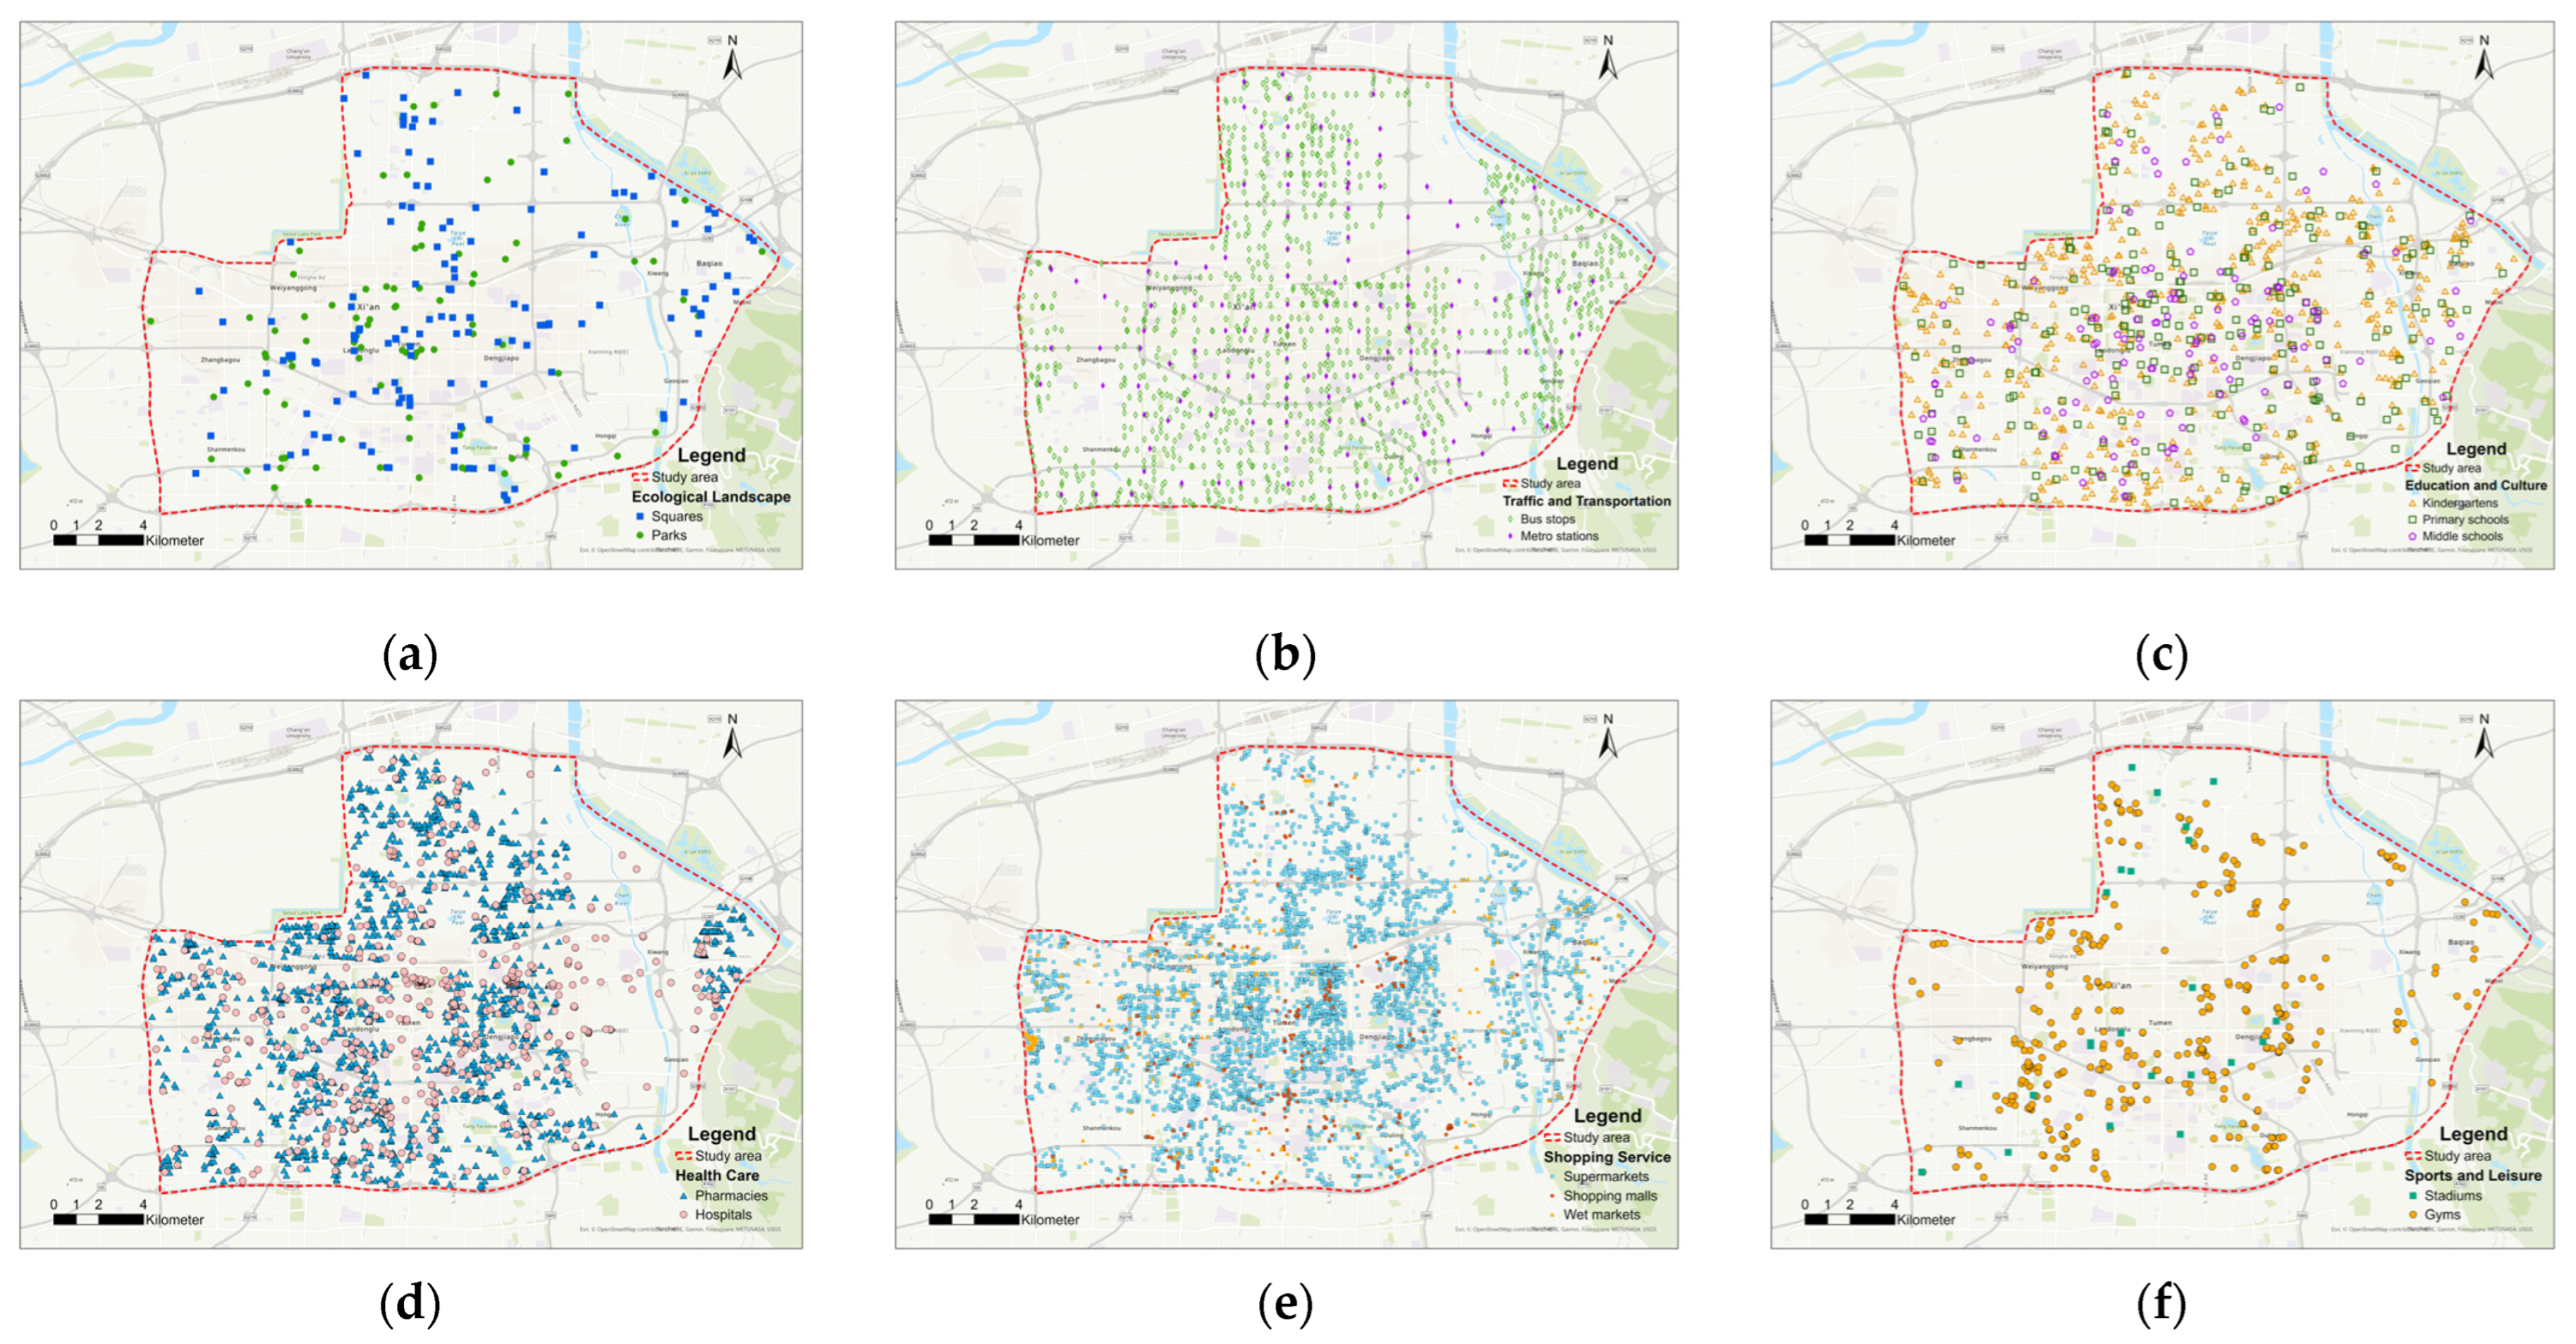
- POI are point-like data that represent various geographic entities in daily life, containing information such as latitude, longitude, and address, which can present the spatial distribution of urban elements in detail [50]. We obtained six dimensions of POI closely related to the daily lives of residents in September 2022 from the Map Lab API (https://lbs.amap.com) and the Urban Residential Complex Planning and Design Standards [51], as shown in Figure 2;
- We obtained the 2022 AOI data of the Xi’an residential complexes from the Map Lab, which can reflect the spatial size and land use scale of each residential complex for land use identification [52];
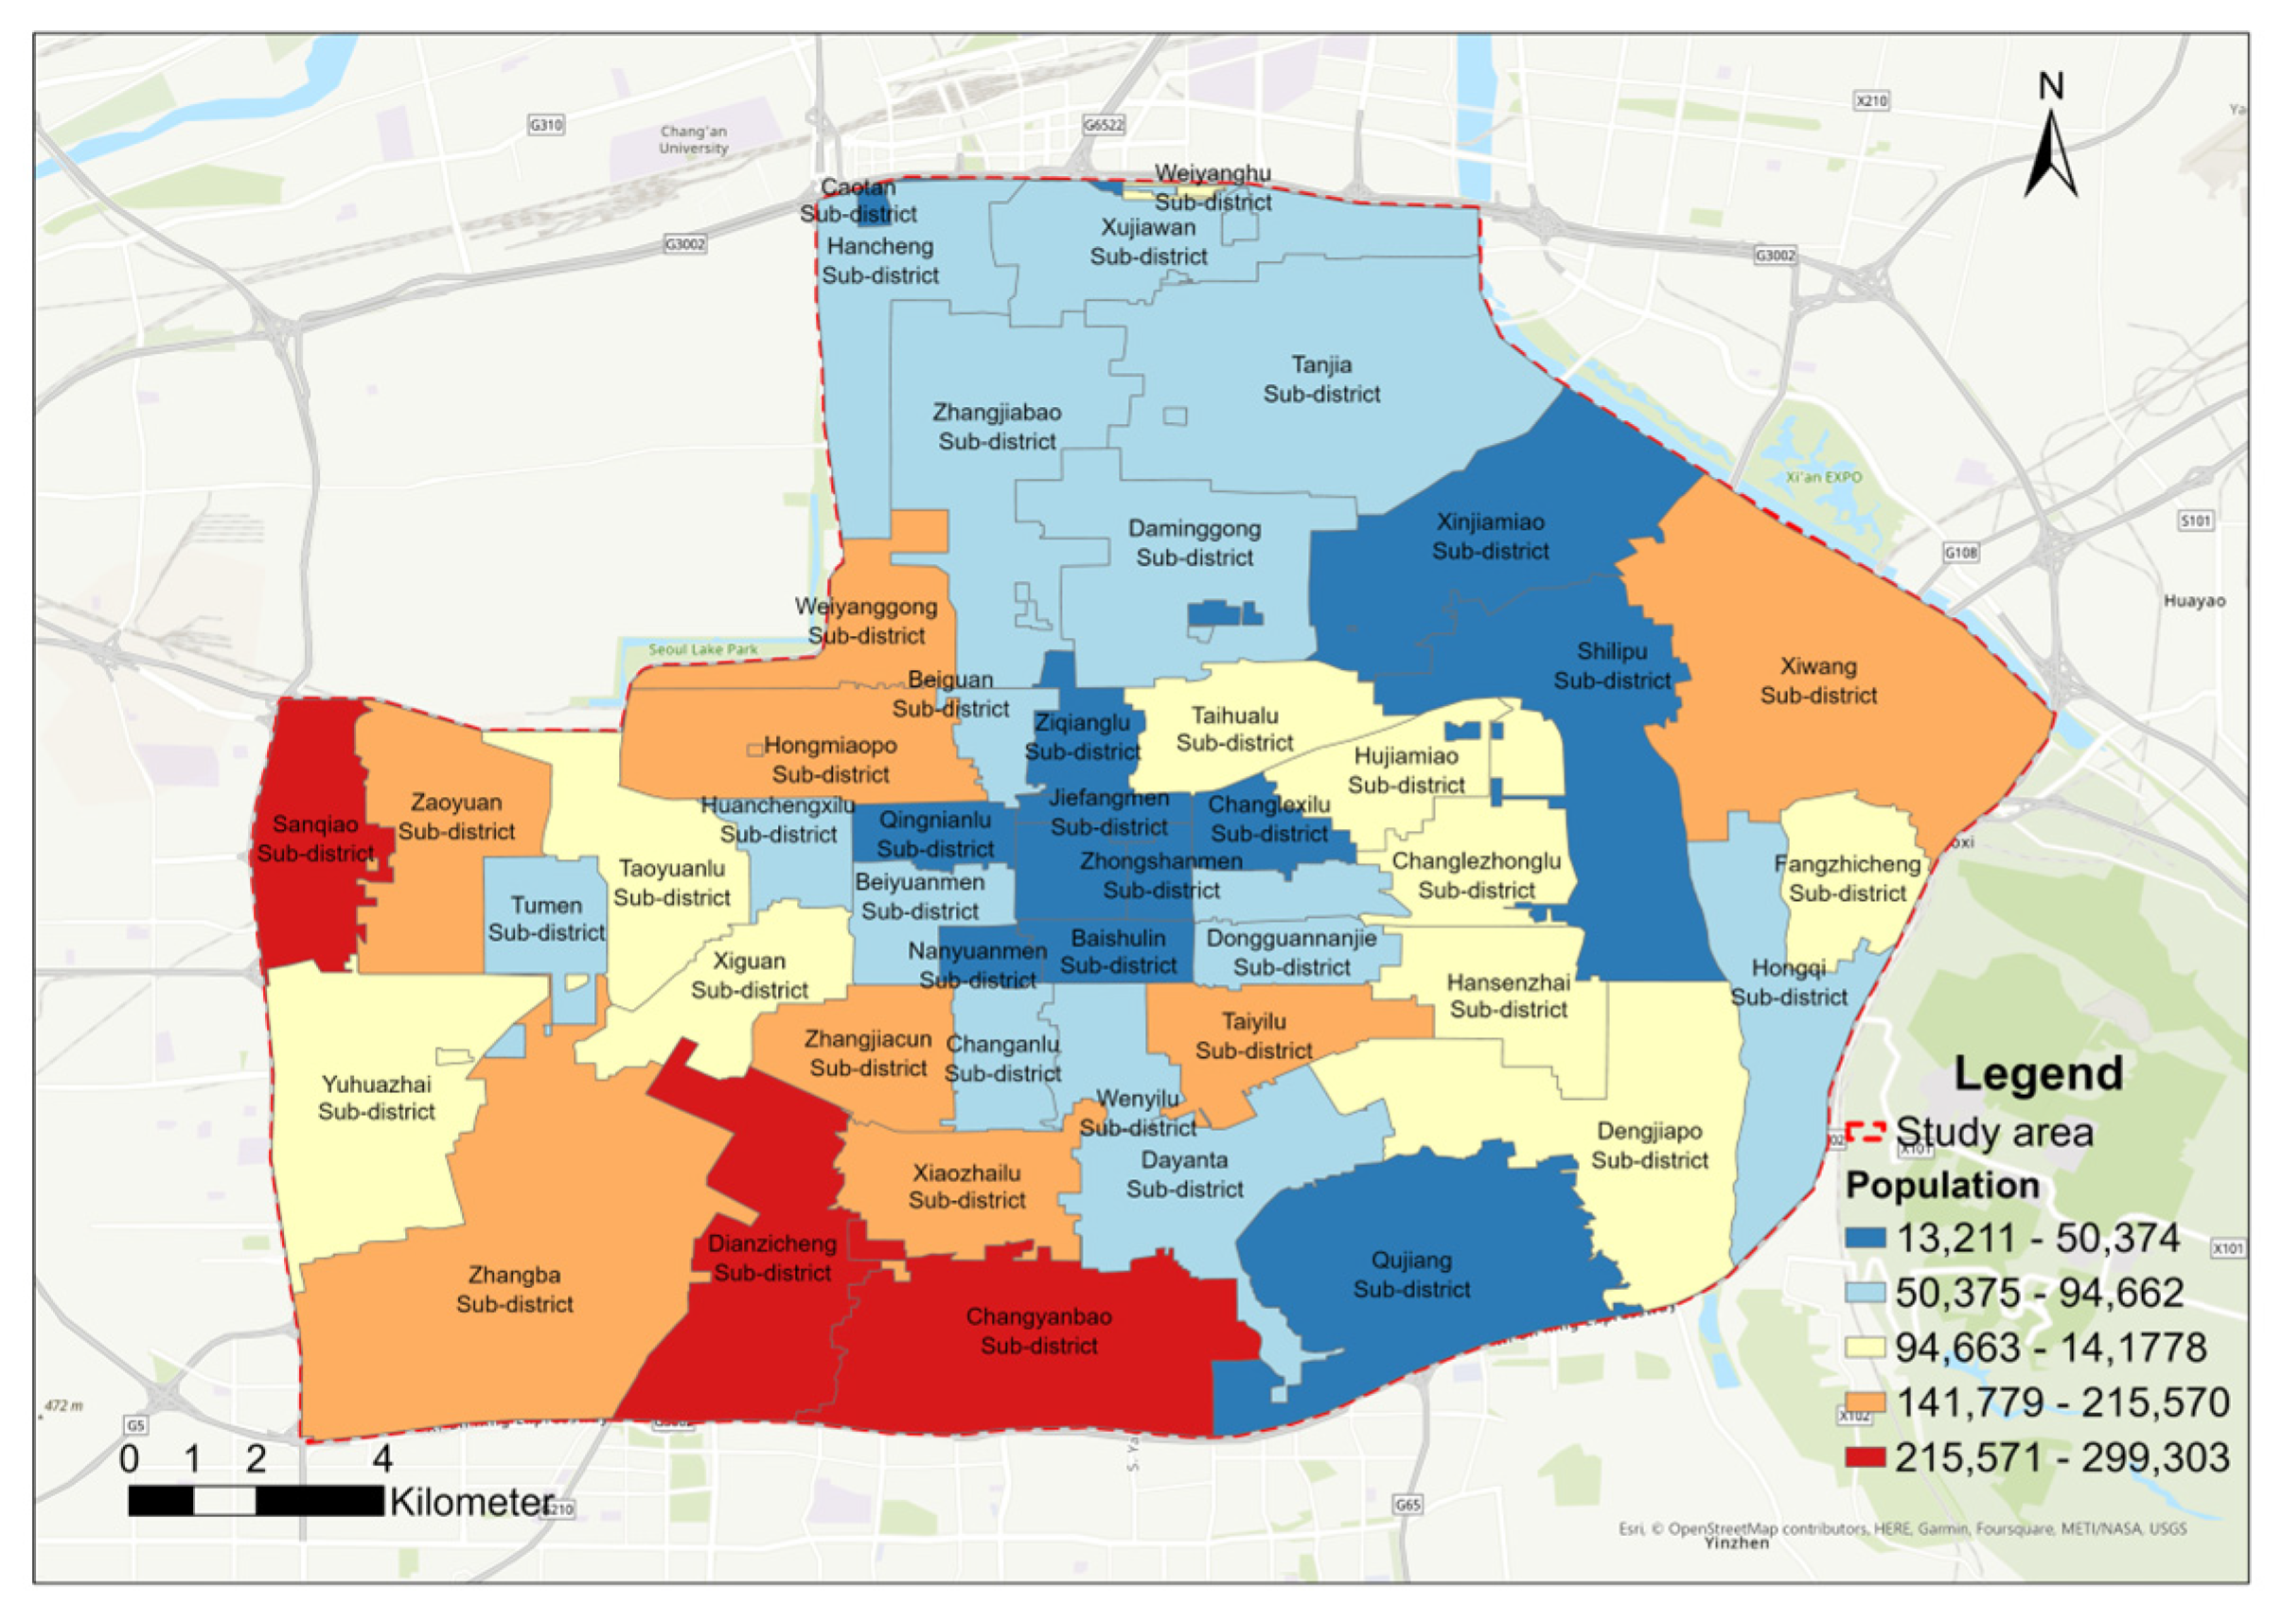
- We obtained the Seventh Census Data for 2021 from the websites of the statistical bureaus of each district or county of Xi’an, which include information such as population number, household number, gender, age composition, and education level, as shown in Figure 3;
- We obtained the spatial data of the administrative divisions of Xi’an City from River Map 4.1 (Shuijingzhu; Chengdu, Sichuan Province), as shown in Figure 3;
- We obtained the property data from Anjuke Property (https://anjuke.com) in September 2022, which include information such as spatial location, greening rate, floor area ratio, household number, housing price, etc.
2.3. Living Service Amenity Selection and Measurement
2.4. Supply Analysis of Urban Living Service Amenities
2.5. Demand Analysis of Urban Living Service Amenities
2.6. Supply and Demand Matching of Living Service Amenities
2.6.1. Location Entropy
2.6.2. Coupling Coordination Degree
3. Results
3.1. Supply Index Spatial Distribution of Different Living Service Amenities
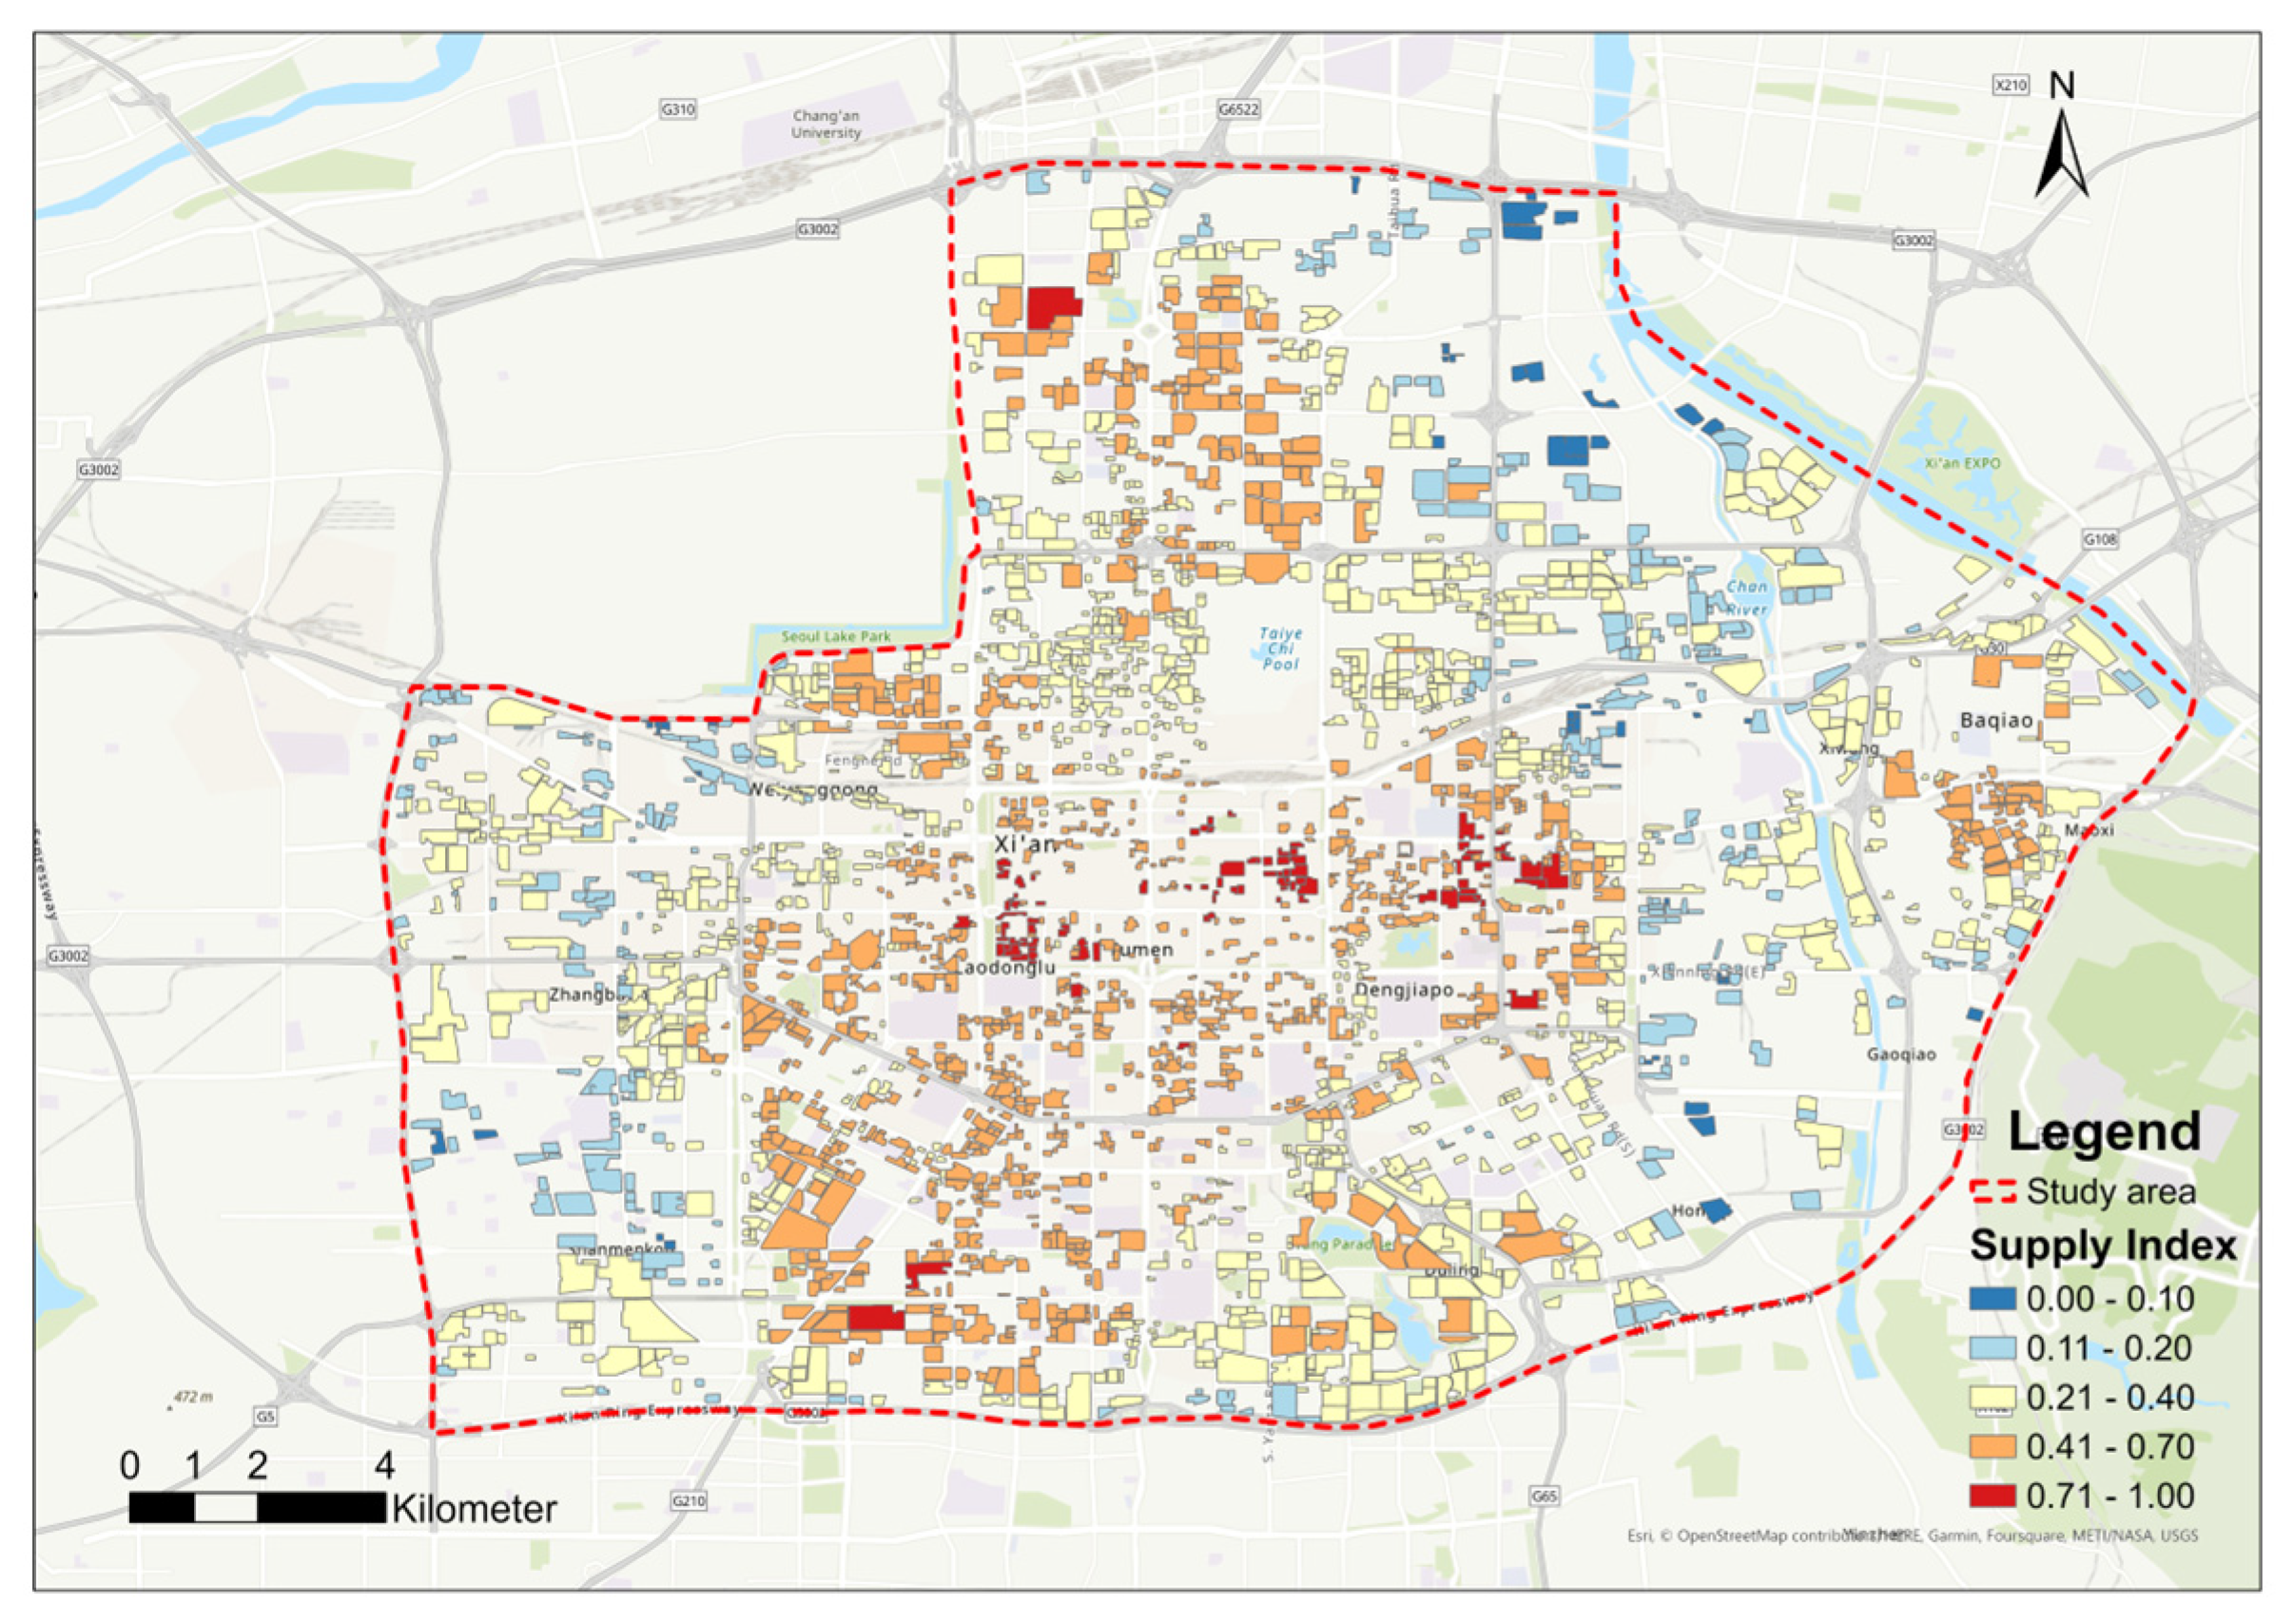
3.1.1. Overall Spatial Distribution of the Supply Index
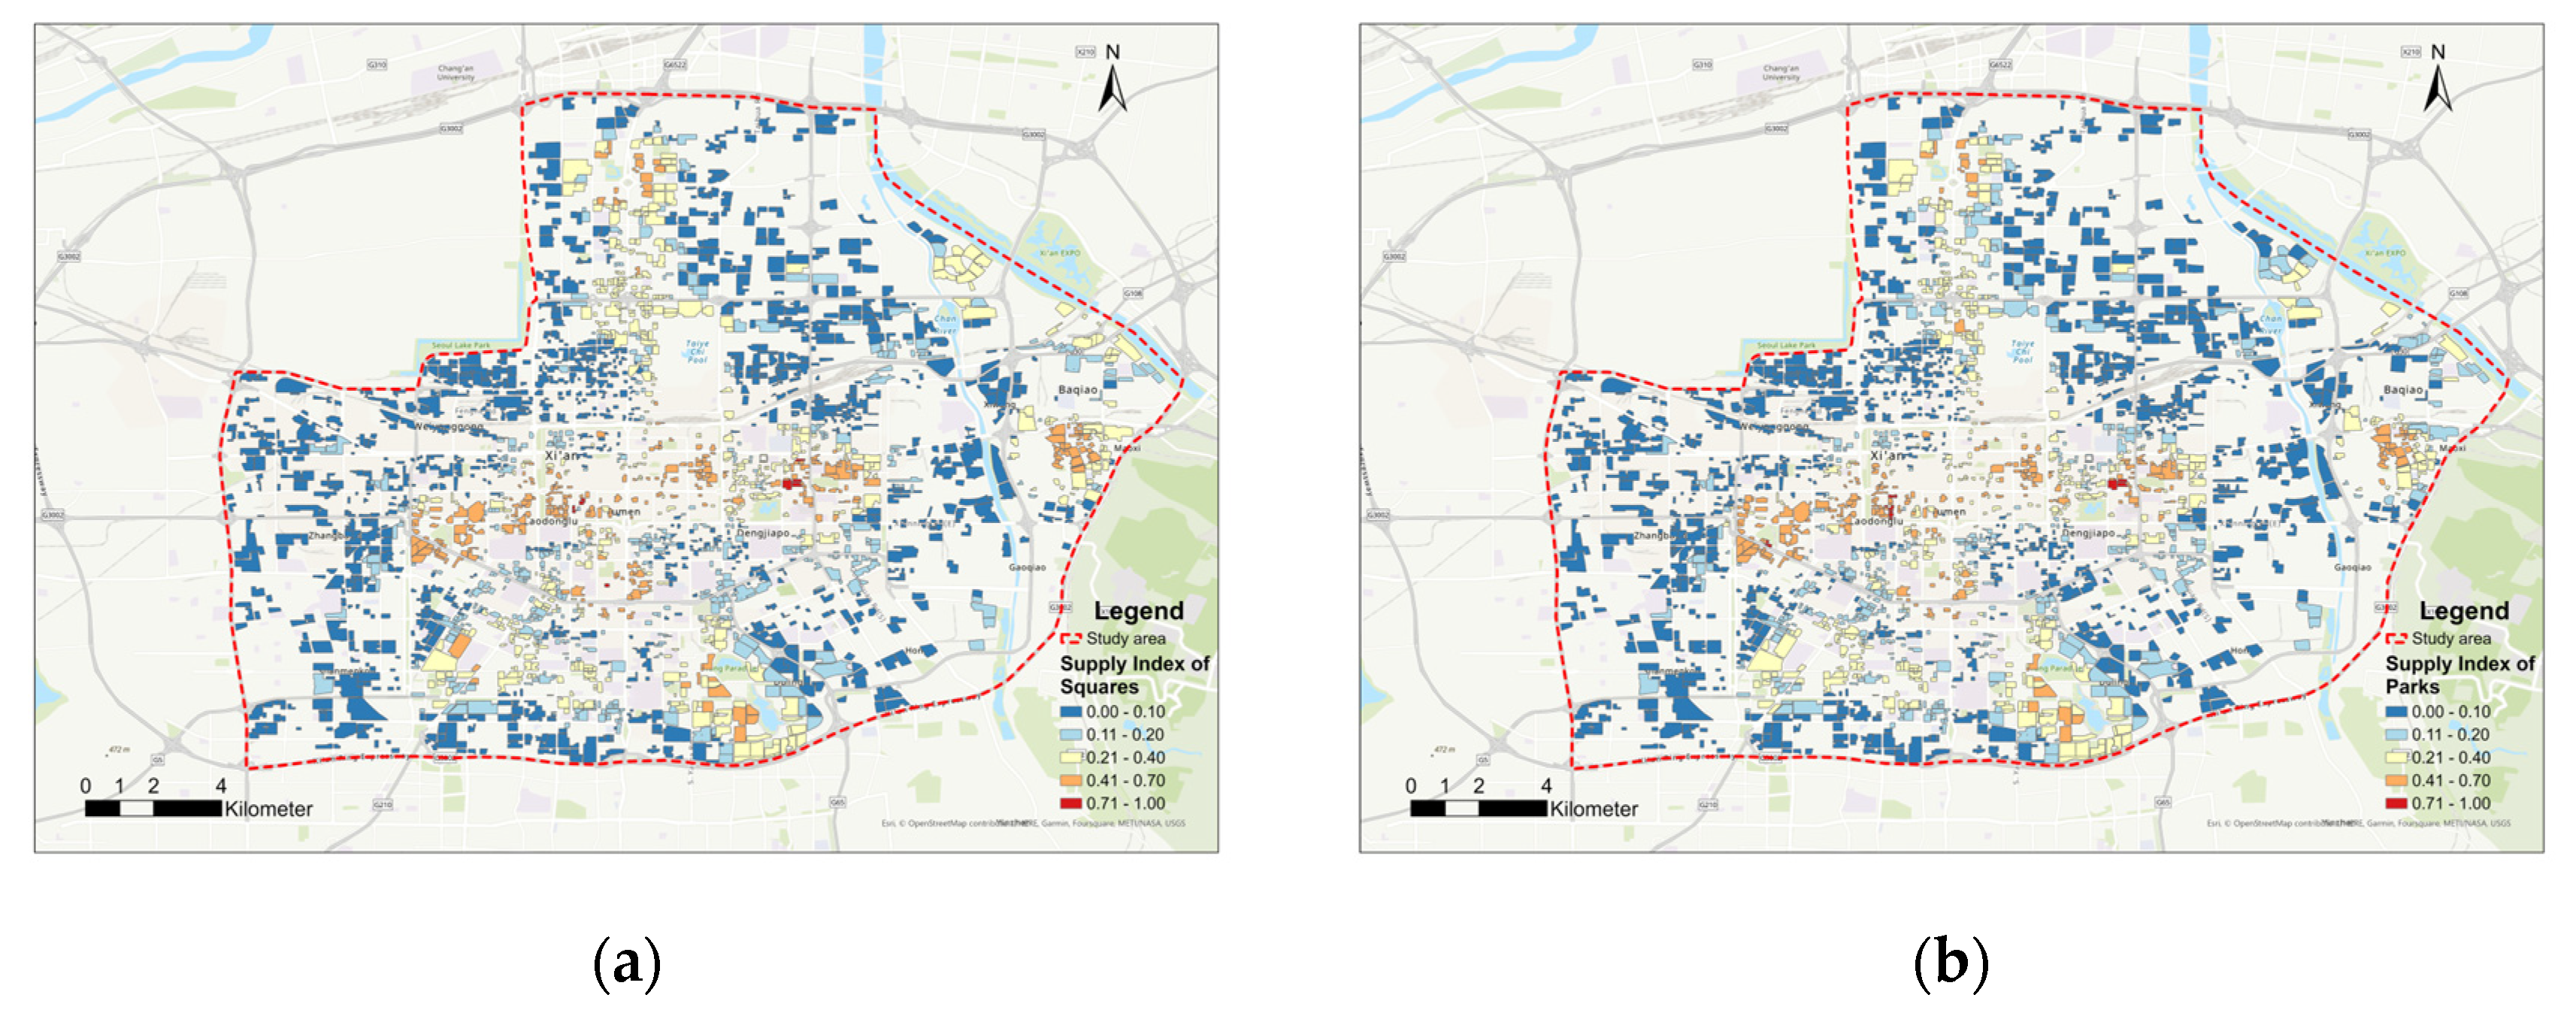
3.1.2. Spatial Distribution of the Supply Index of Ecological Amenities
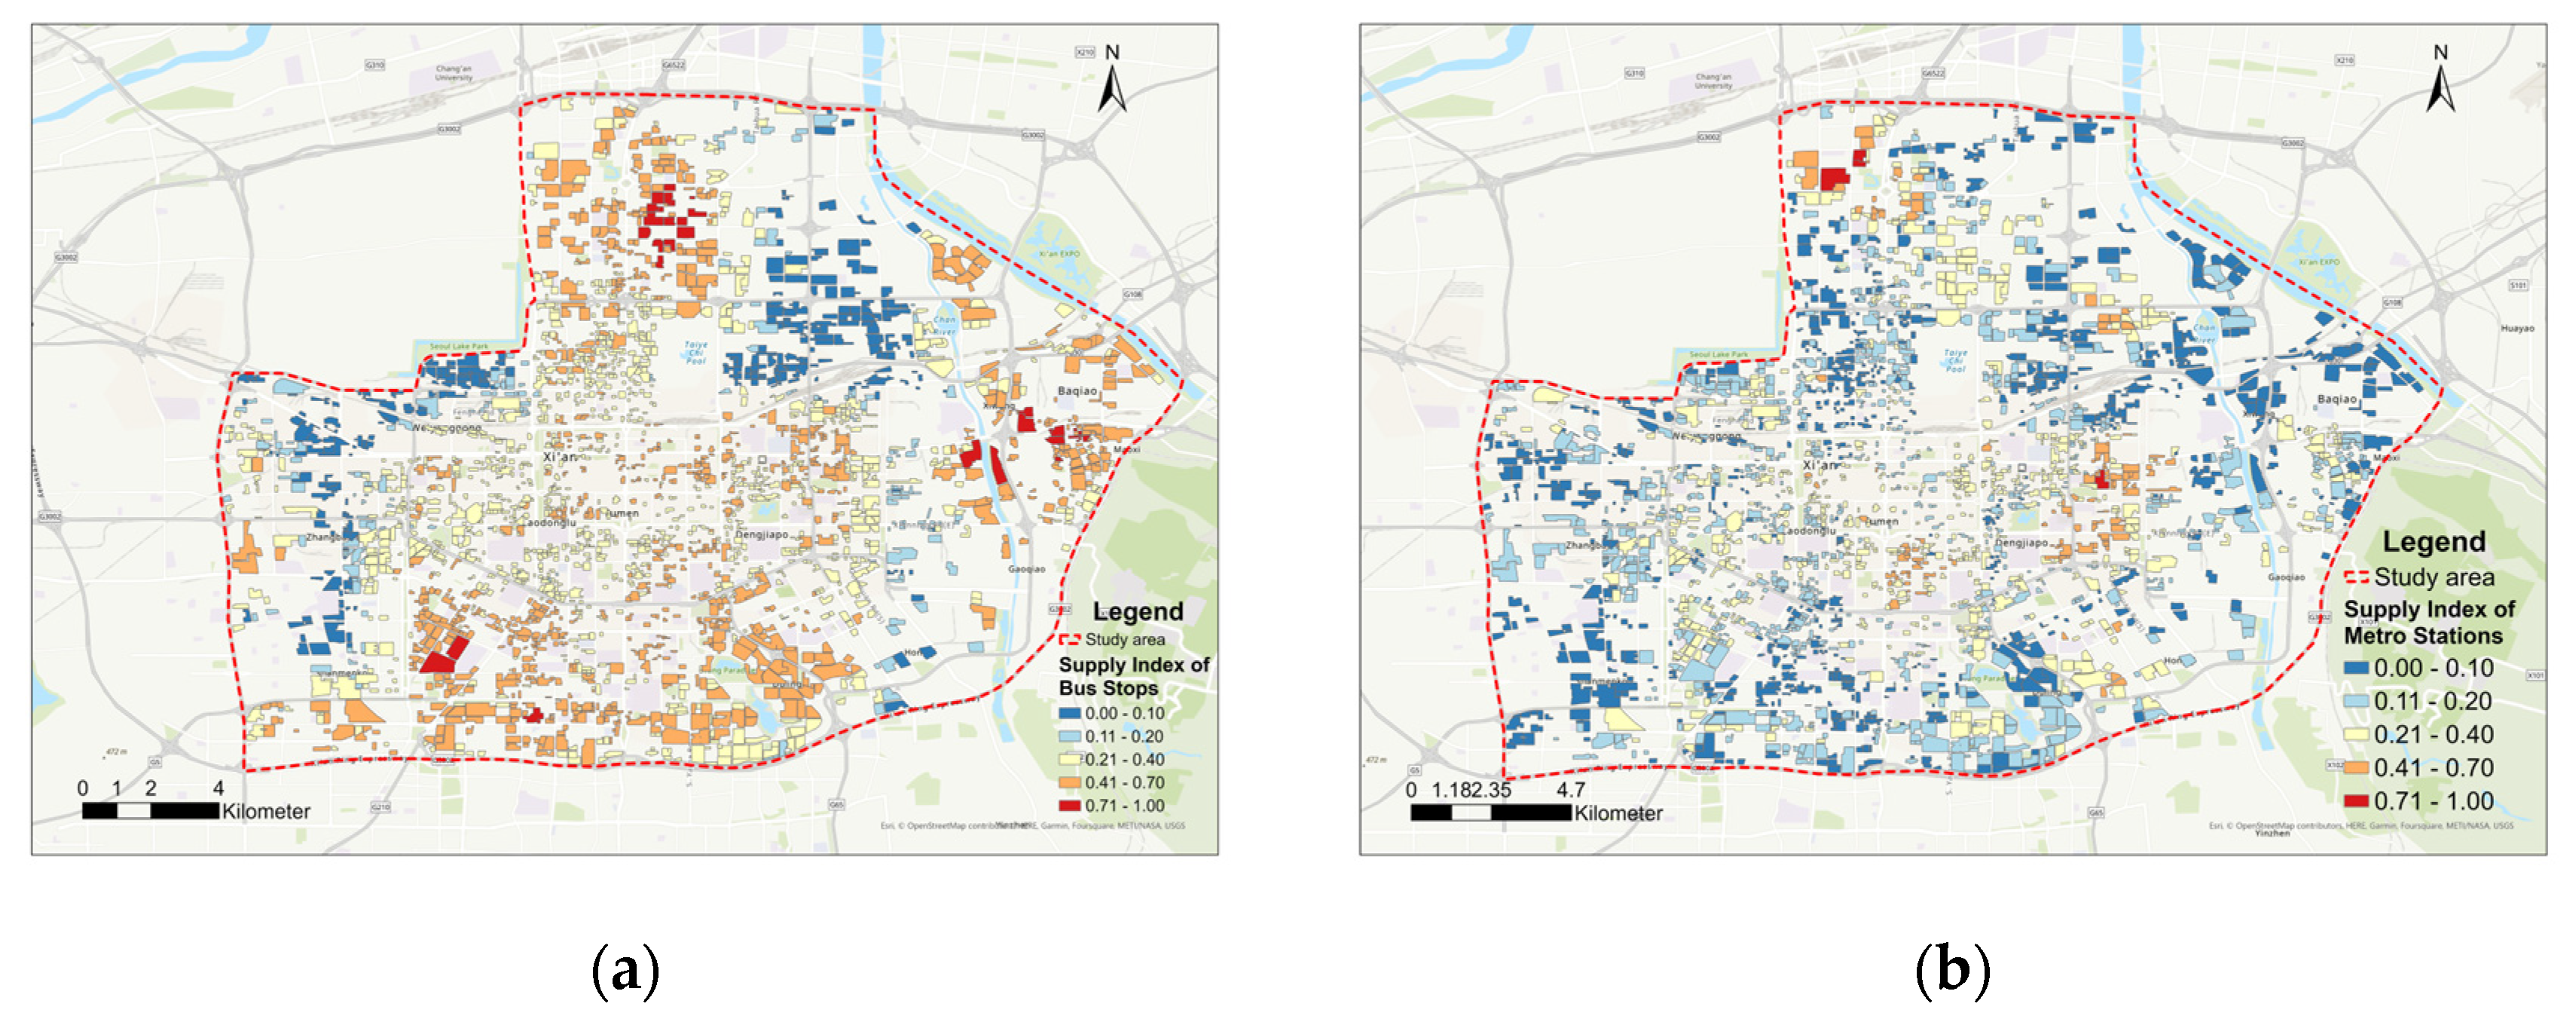
3.1.3. Spatial Distribution of the Supply Index of Traffic and Transportation Living Service Amenities
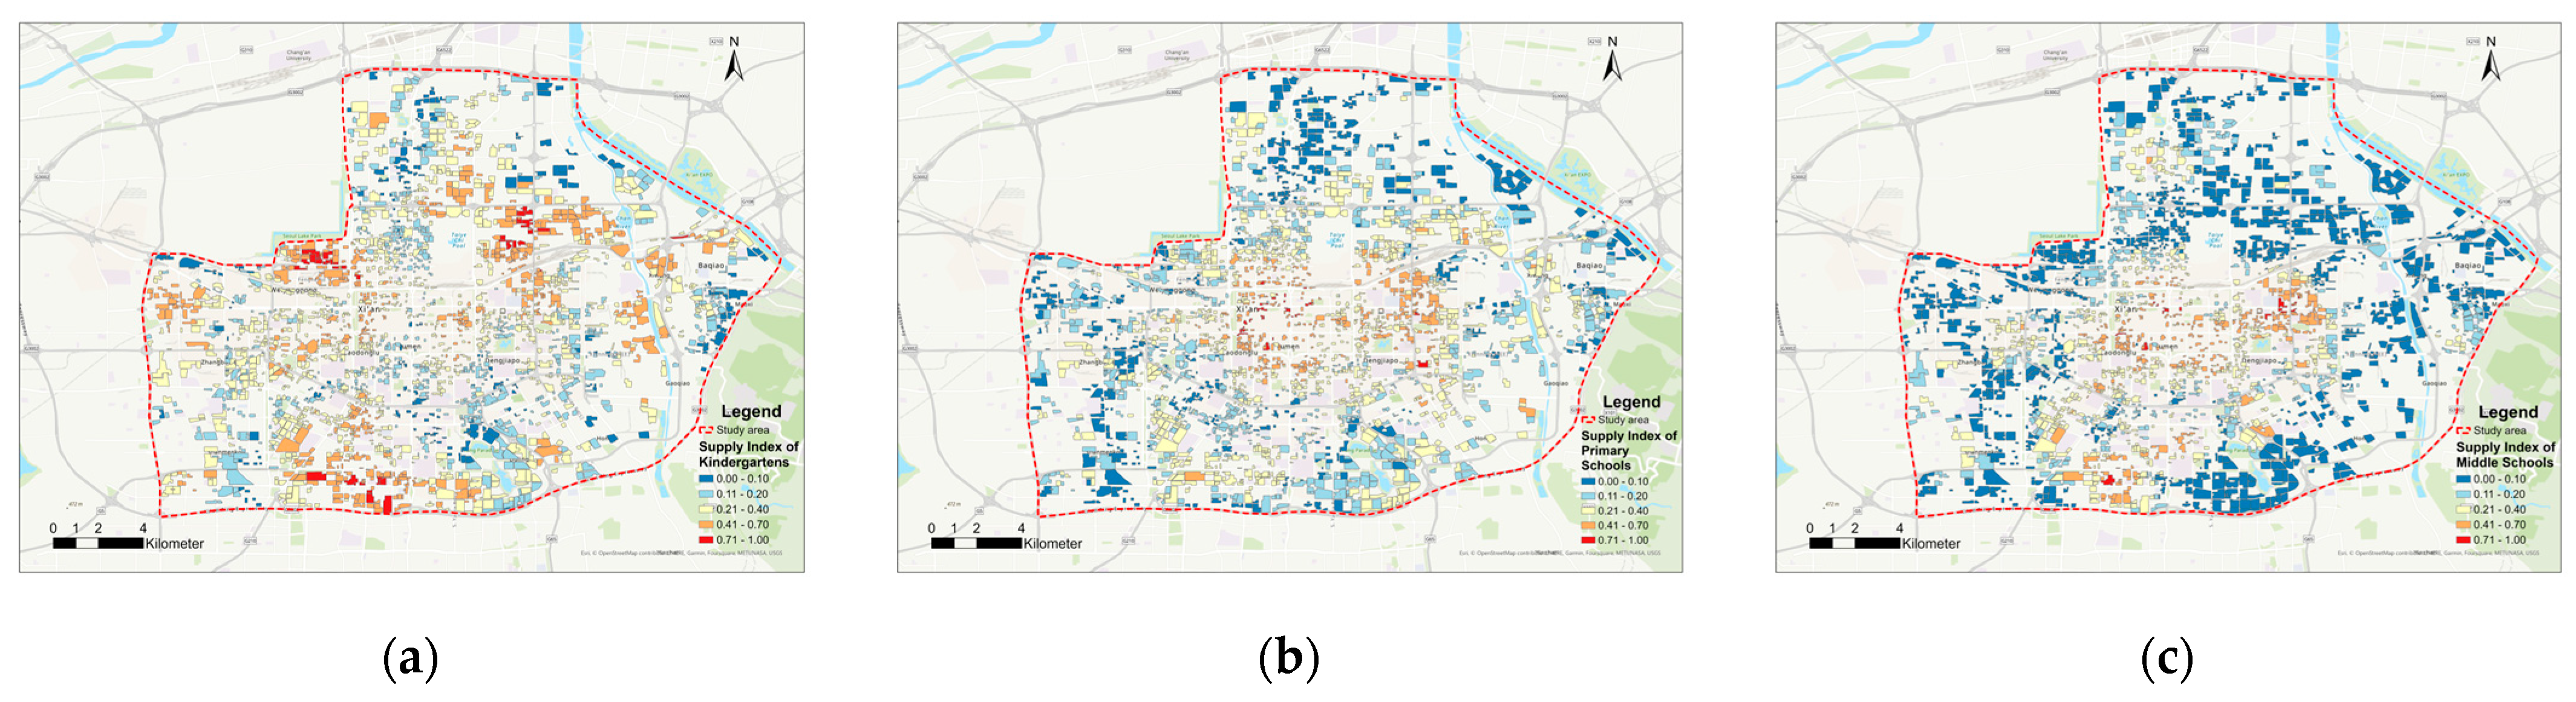
3.1.4. Spatial Distribution of the Supply Index of Education and Culture Living Service Amenities
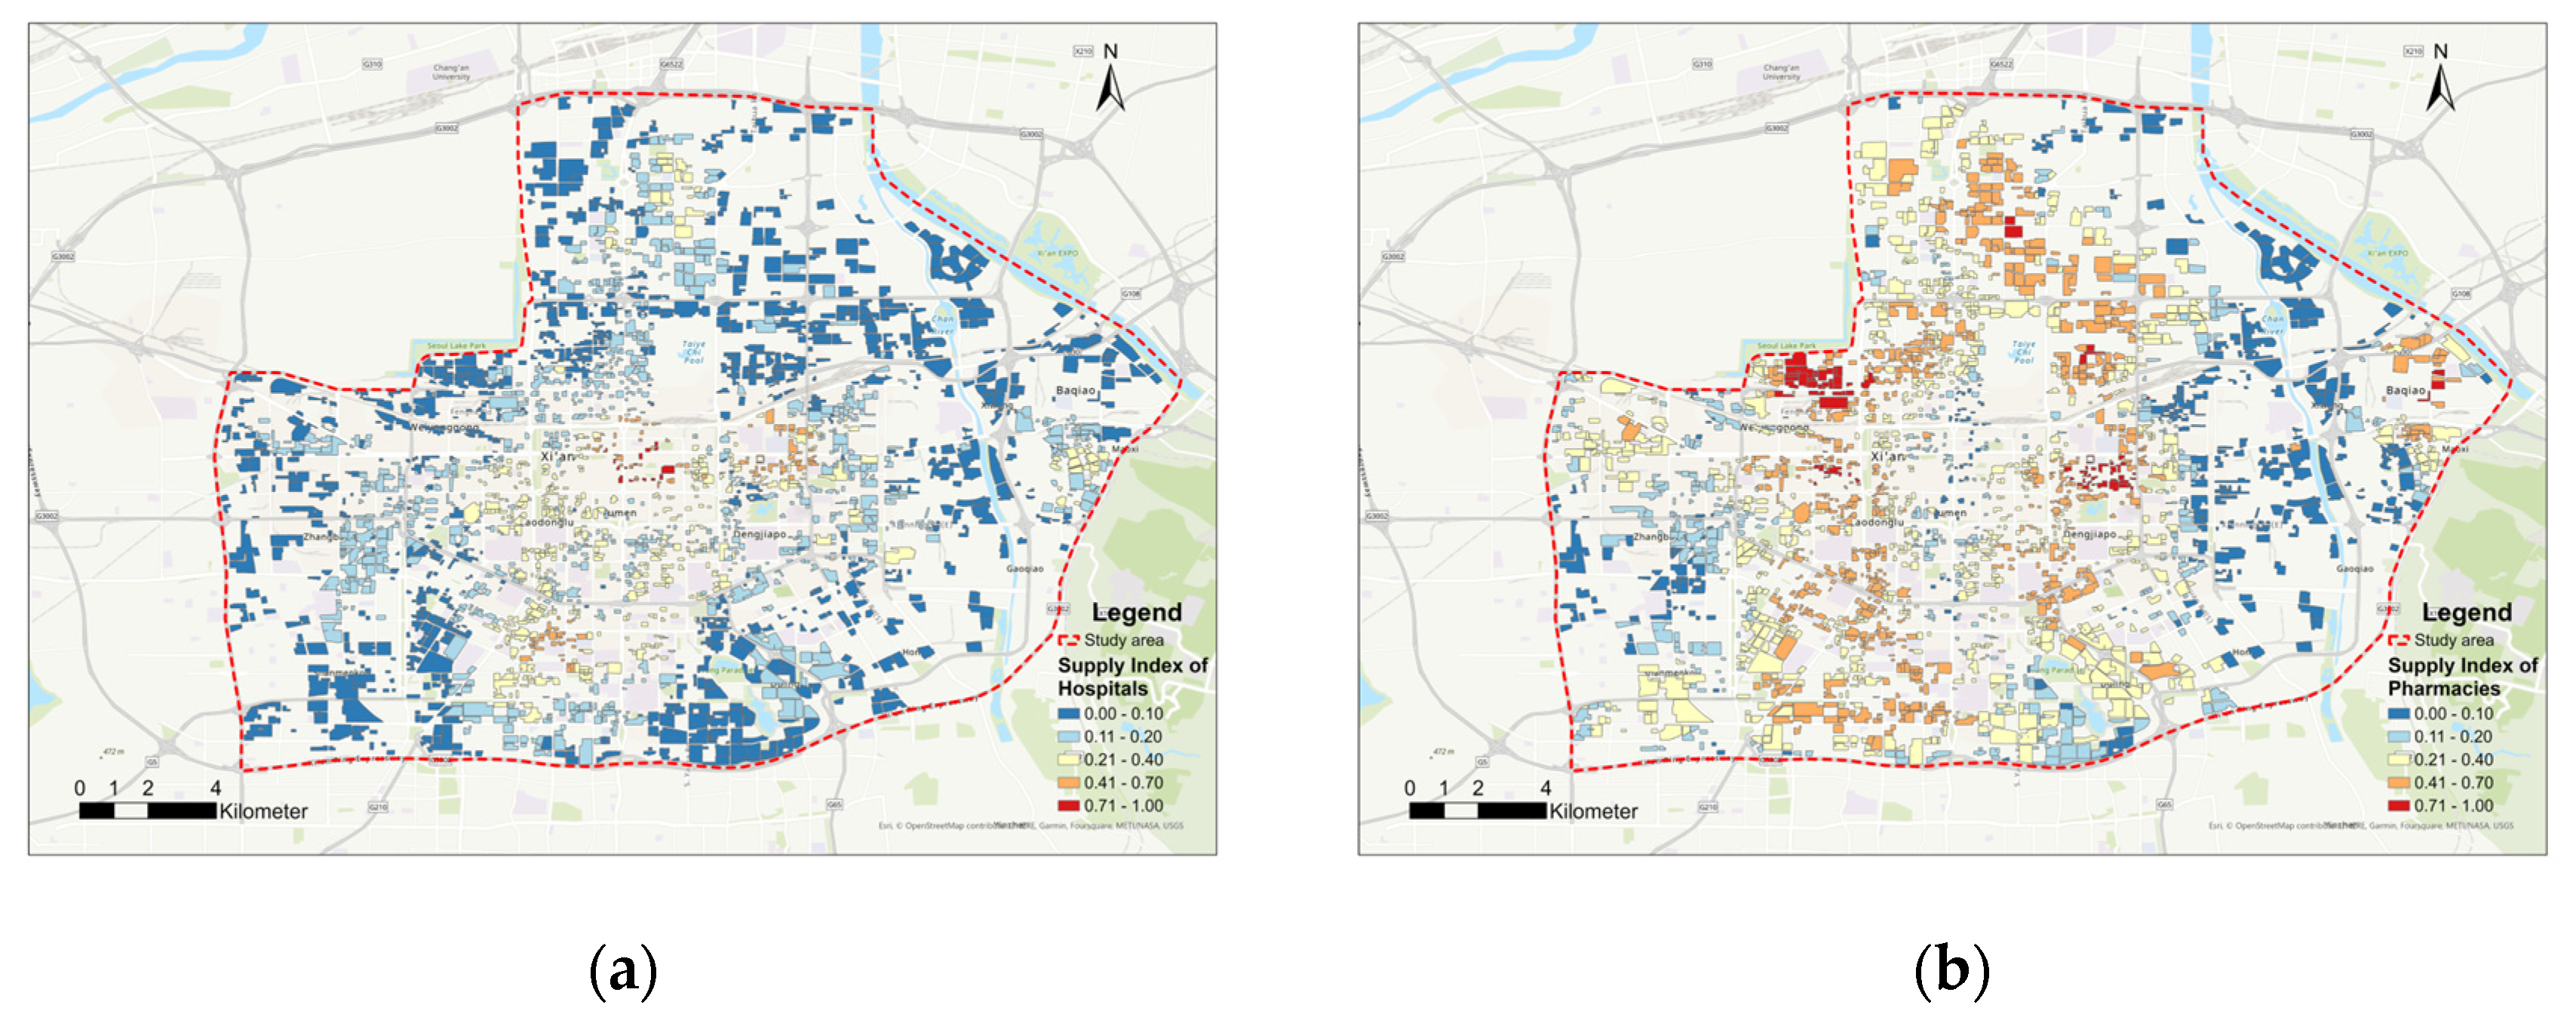
3.1.5. Spatial Distribution of the Supply Index of Healthcare Living Service Amenities
3.1.6. Spatial Distribution of the Supply Index of Shopping Service Amenities
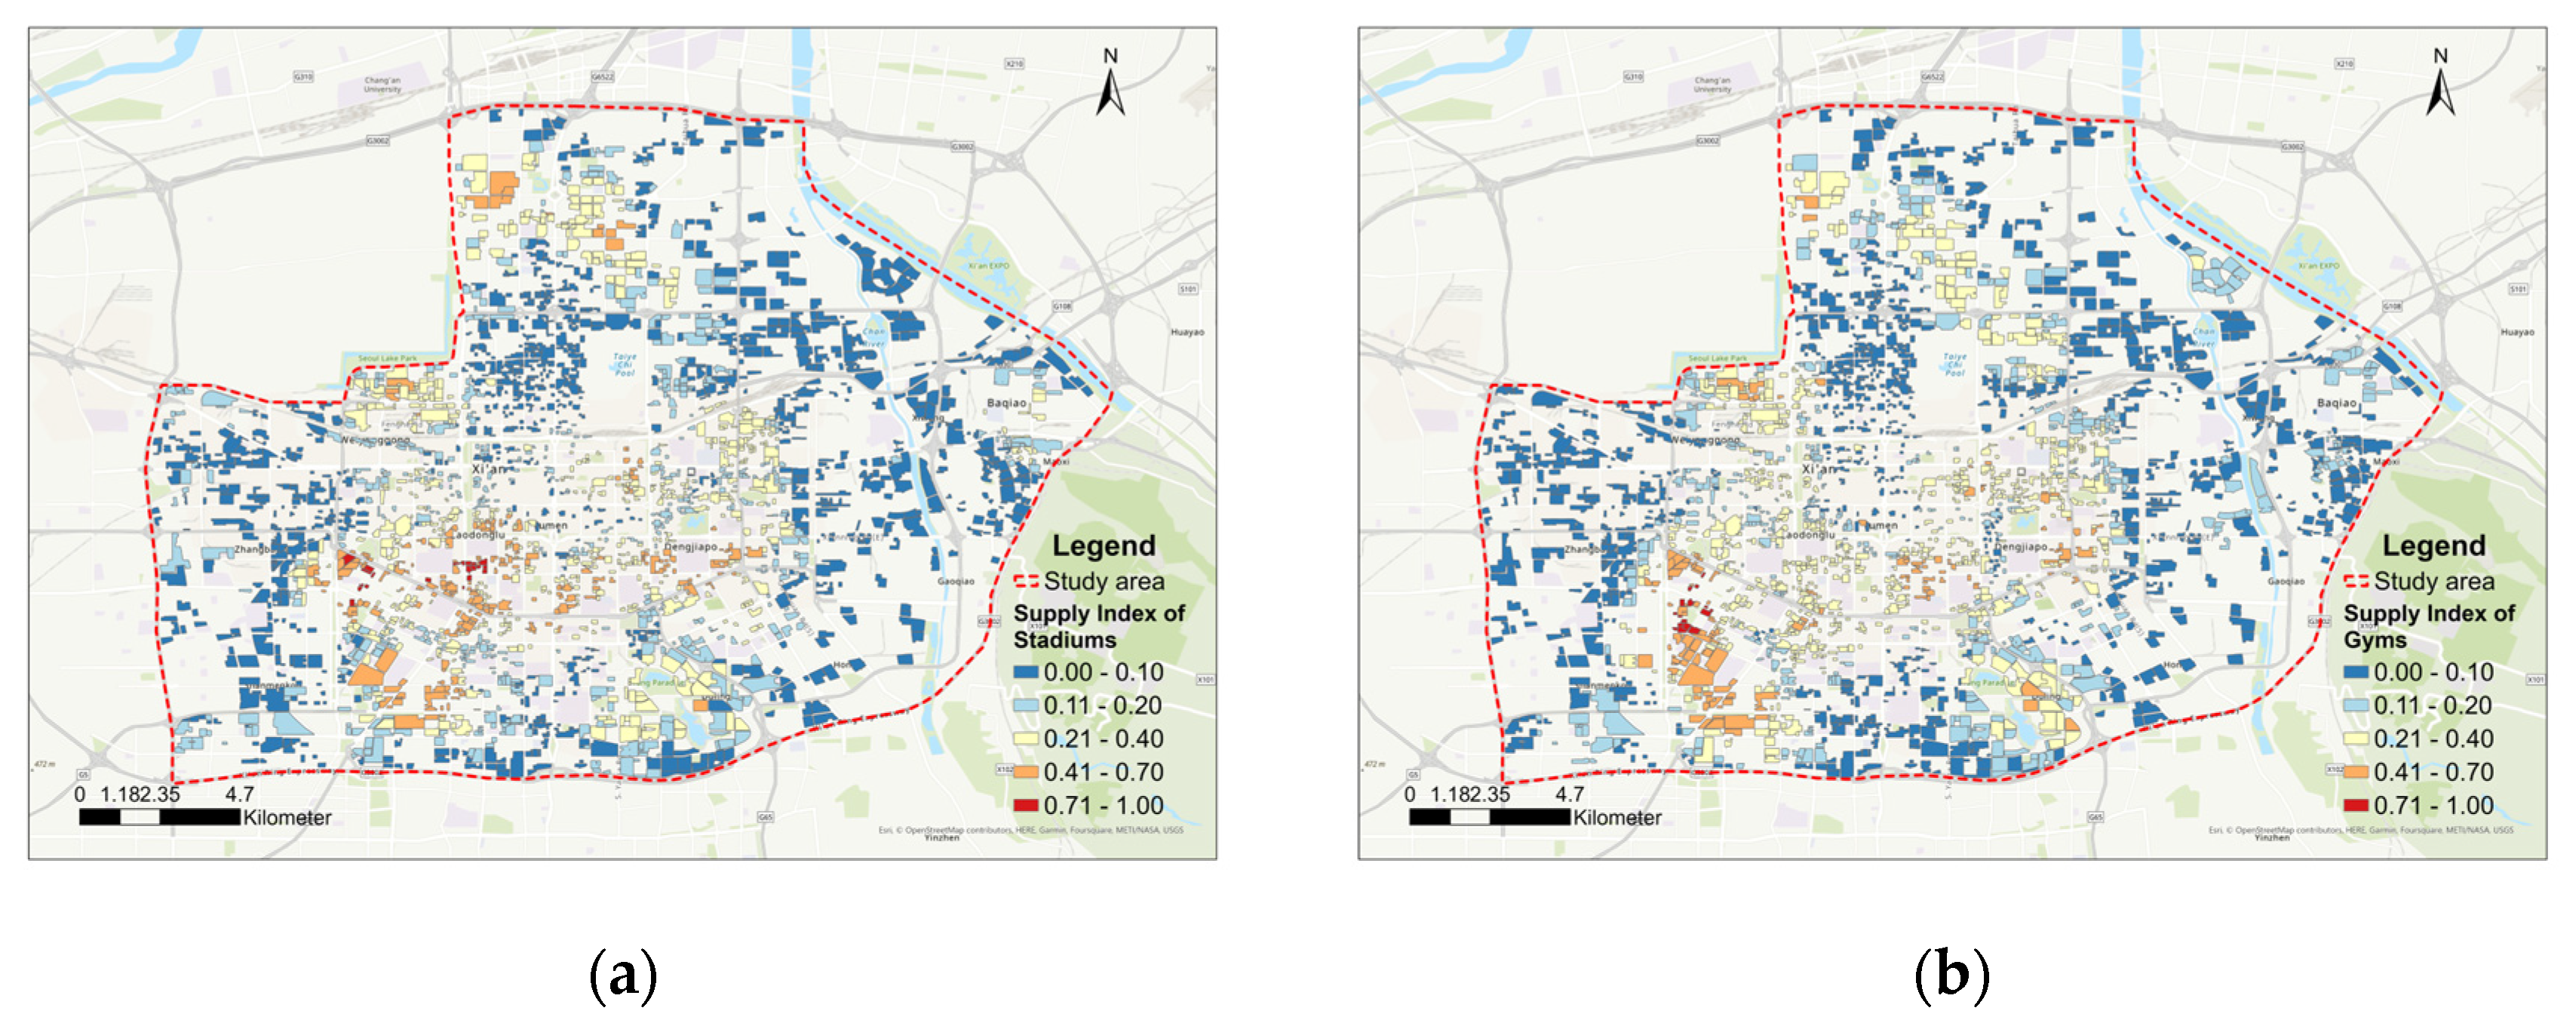
3.1.7. Spatial Distribution of the Supply Index of Sports and Leisure Amenities
3.2. Demand Index Evaluation and Spatial Distribution for Each Residential Complex
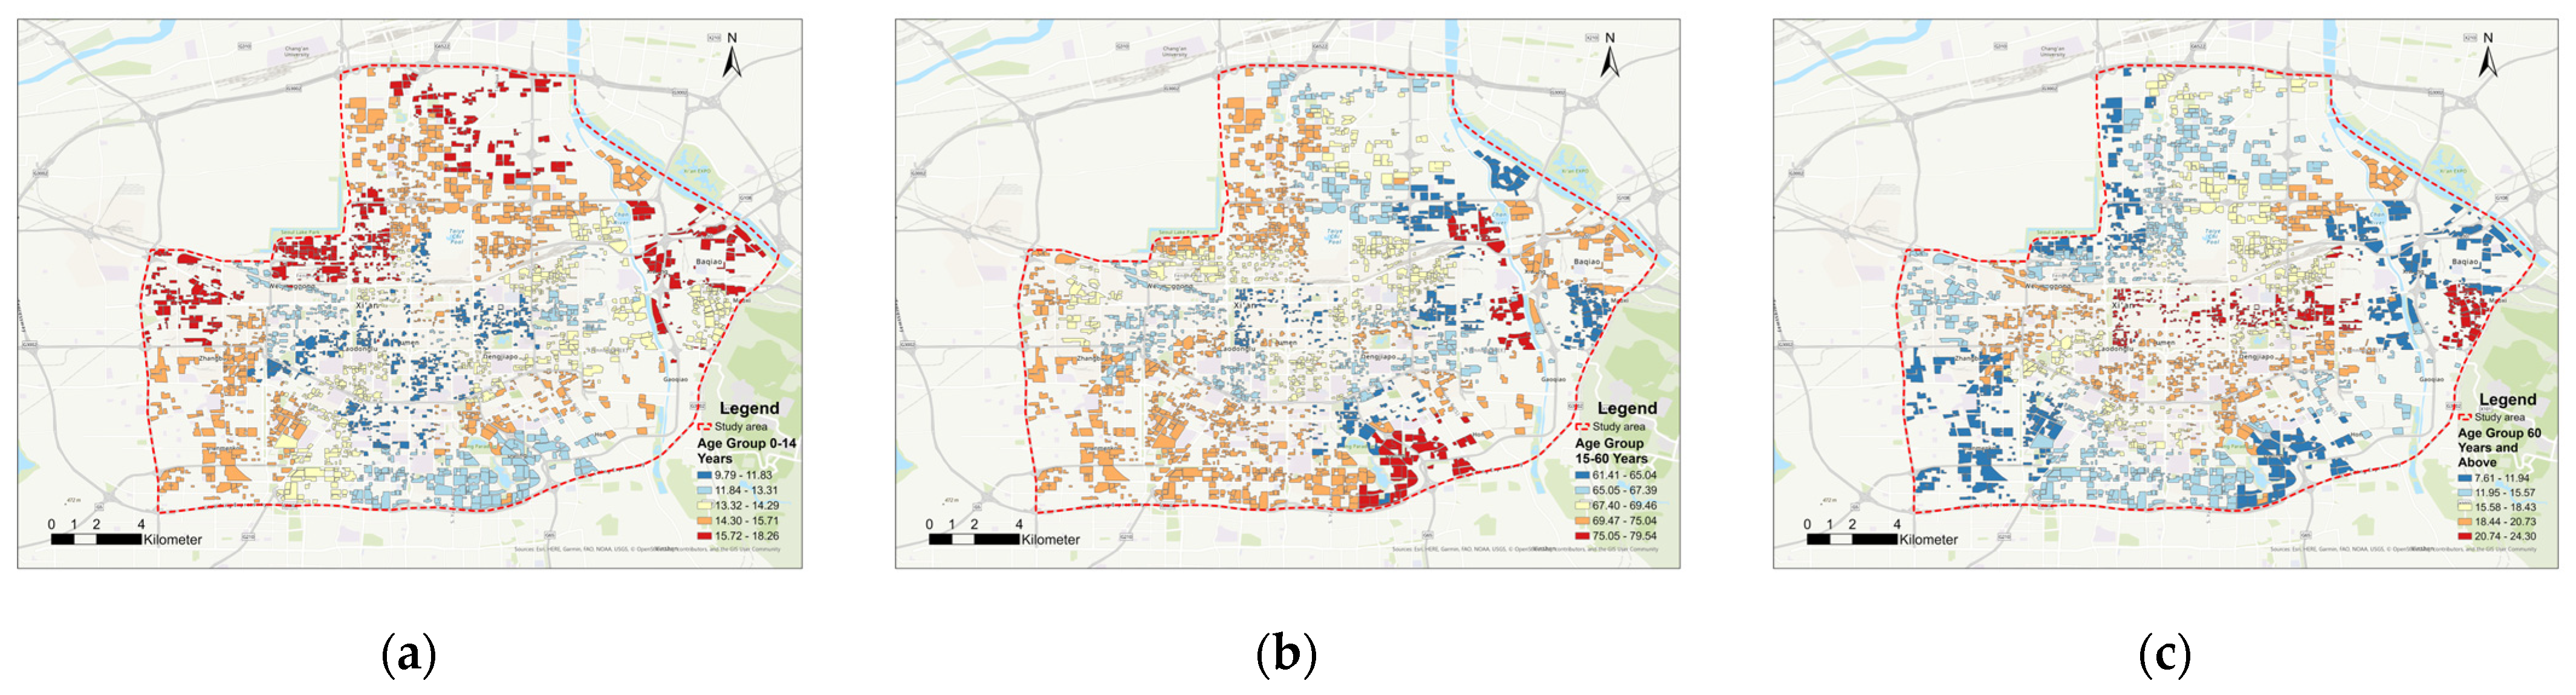
3.2.1. The Spatial Distribution of Population Age Composition in the Study Area
3.2.2. Spatial Distribution of the Demand Index for Age-Based Analysis
3.3. Supply and Demand Balancing Status for Each Residential Complex
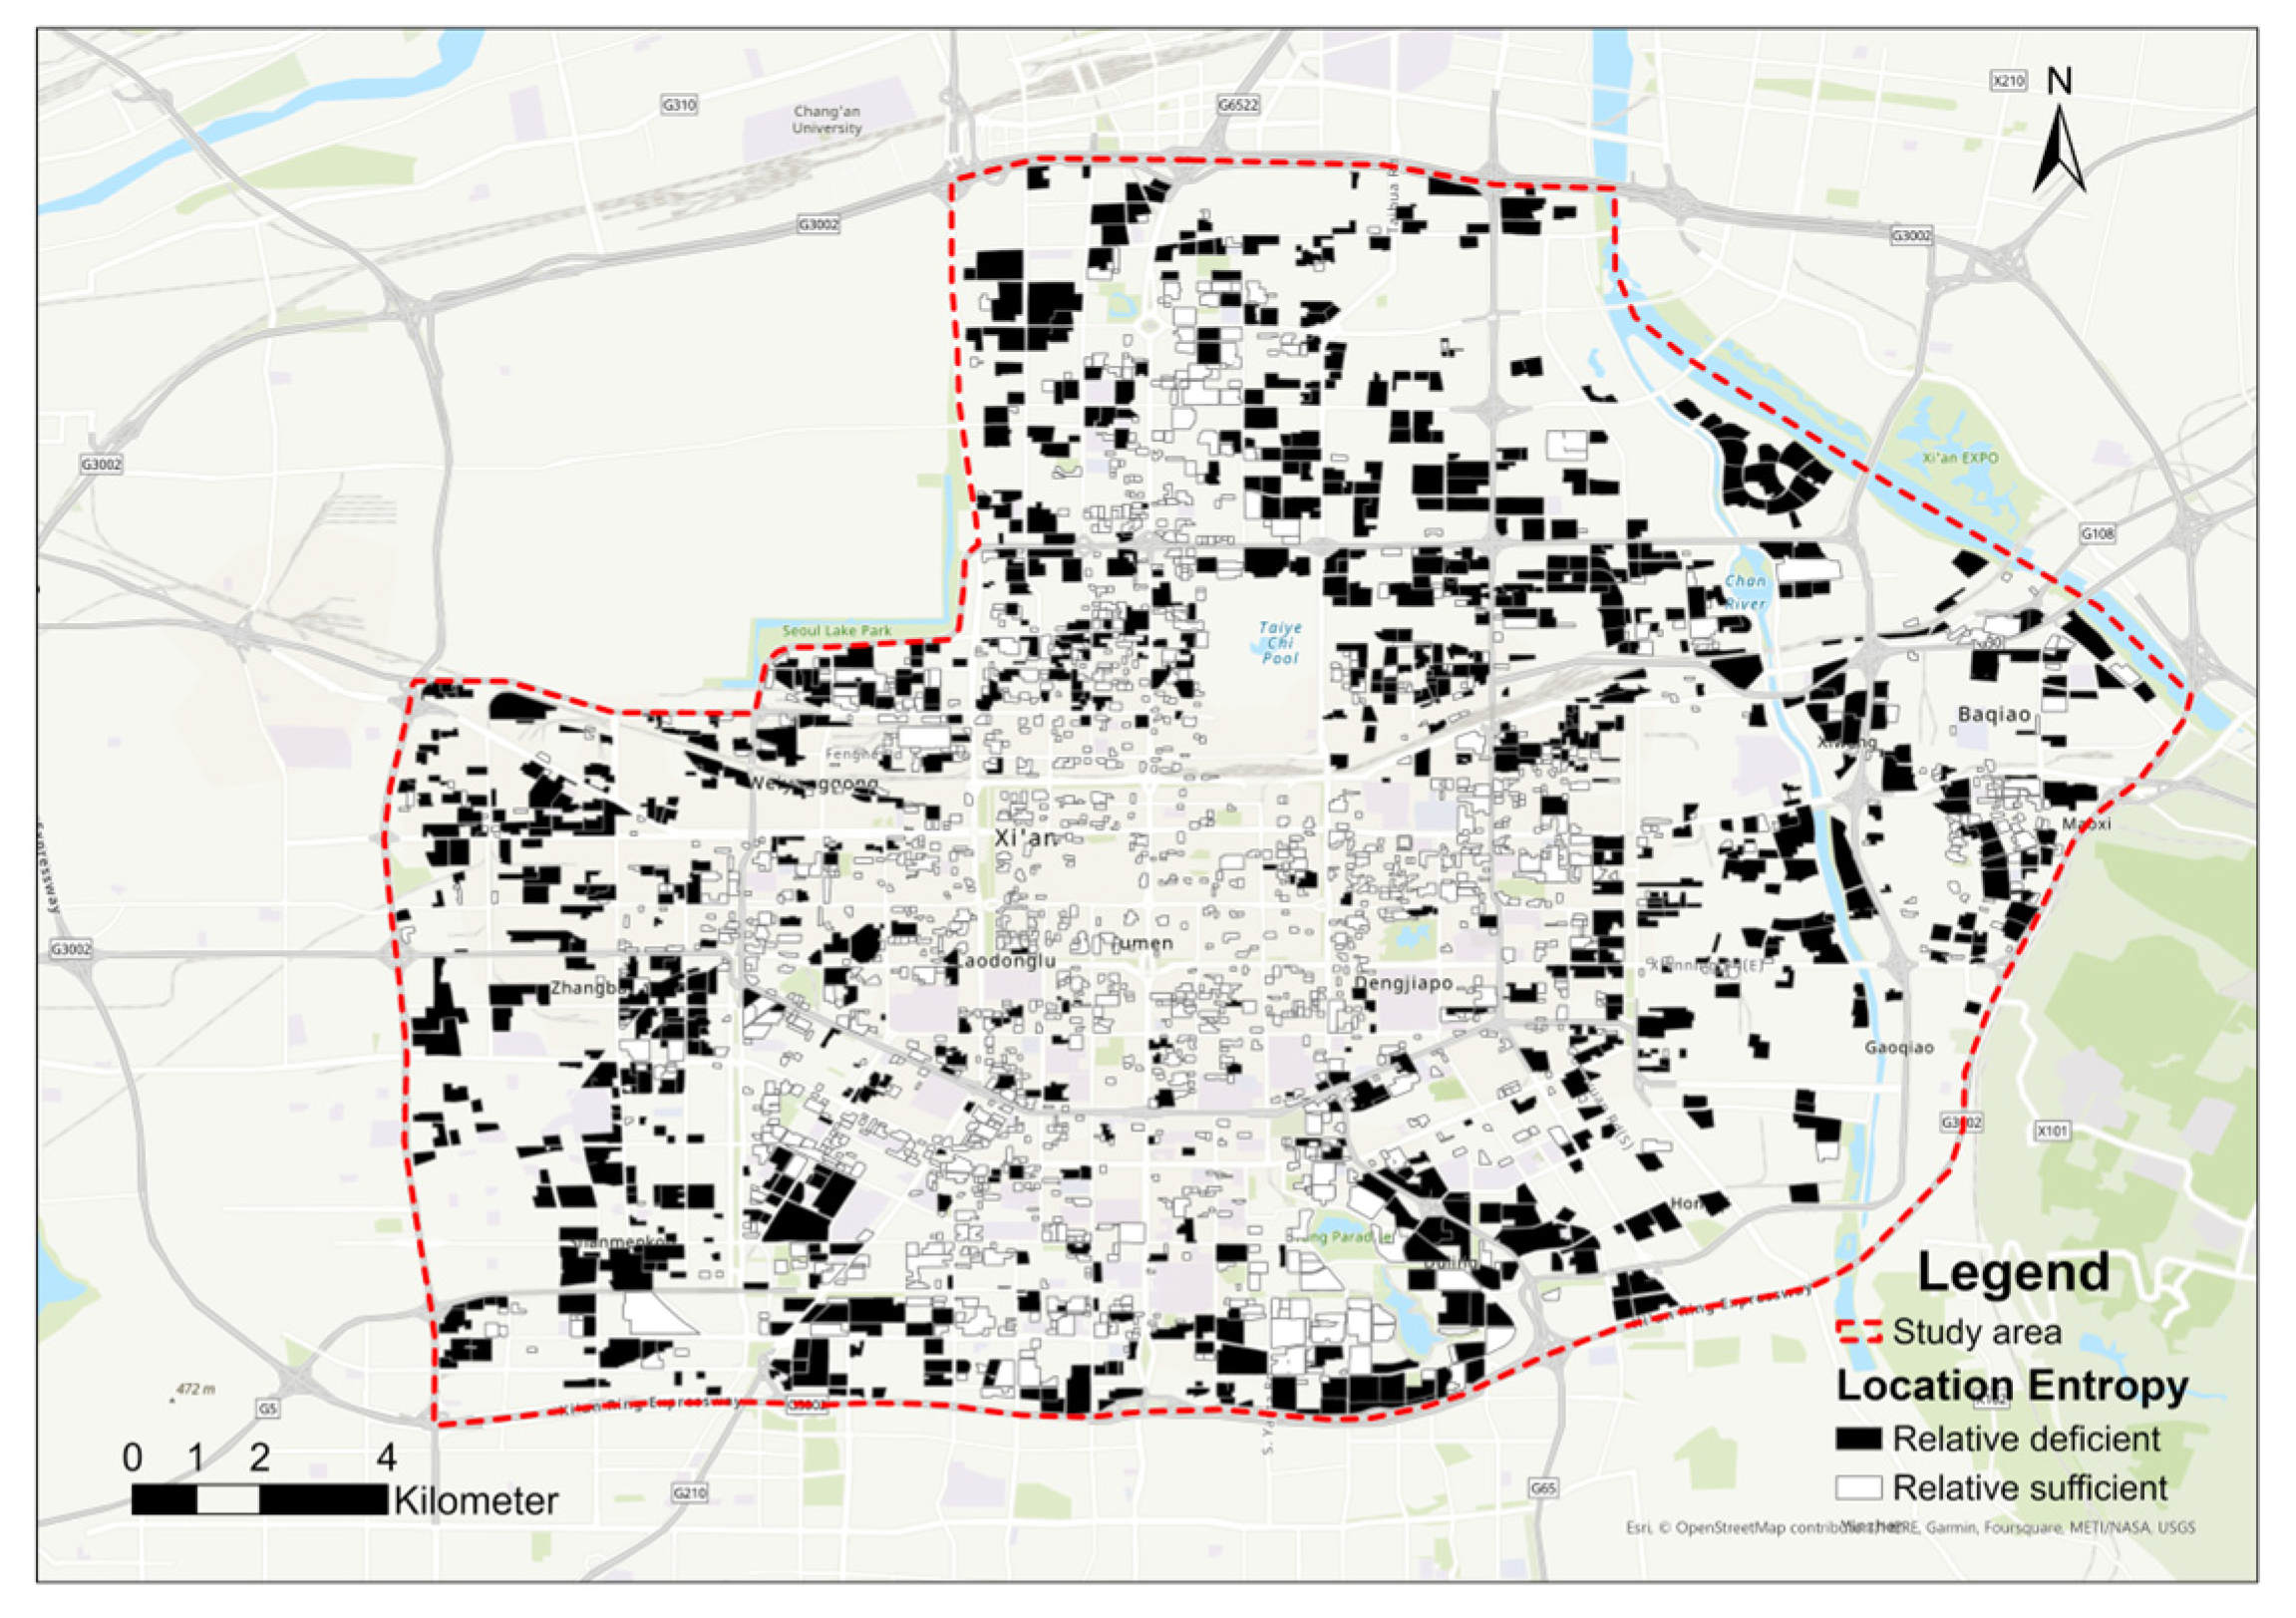
3.3.1. Results of Location Entropy Analysis
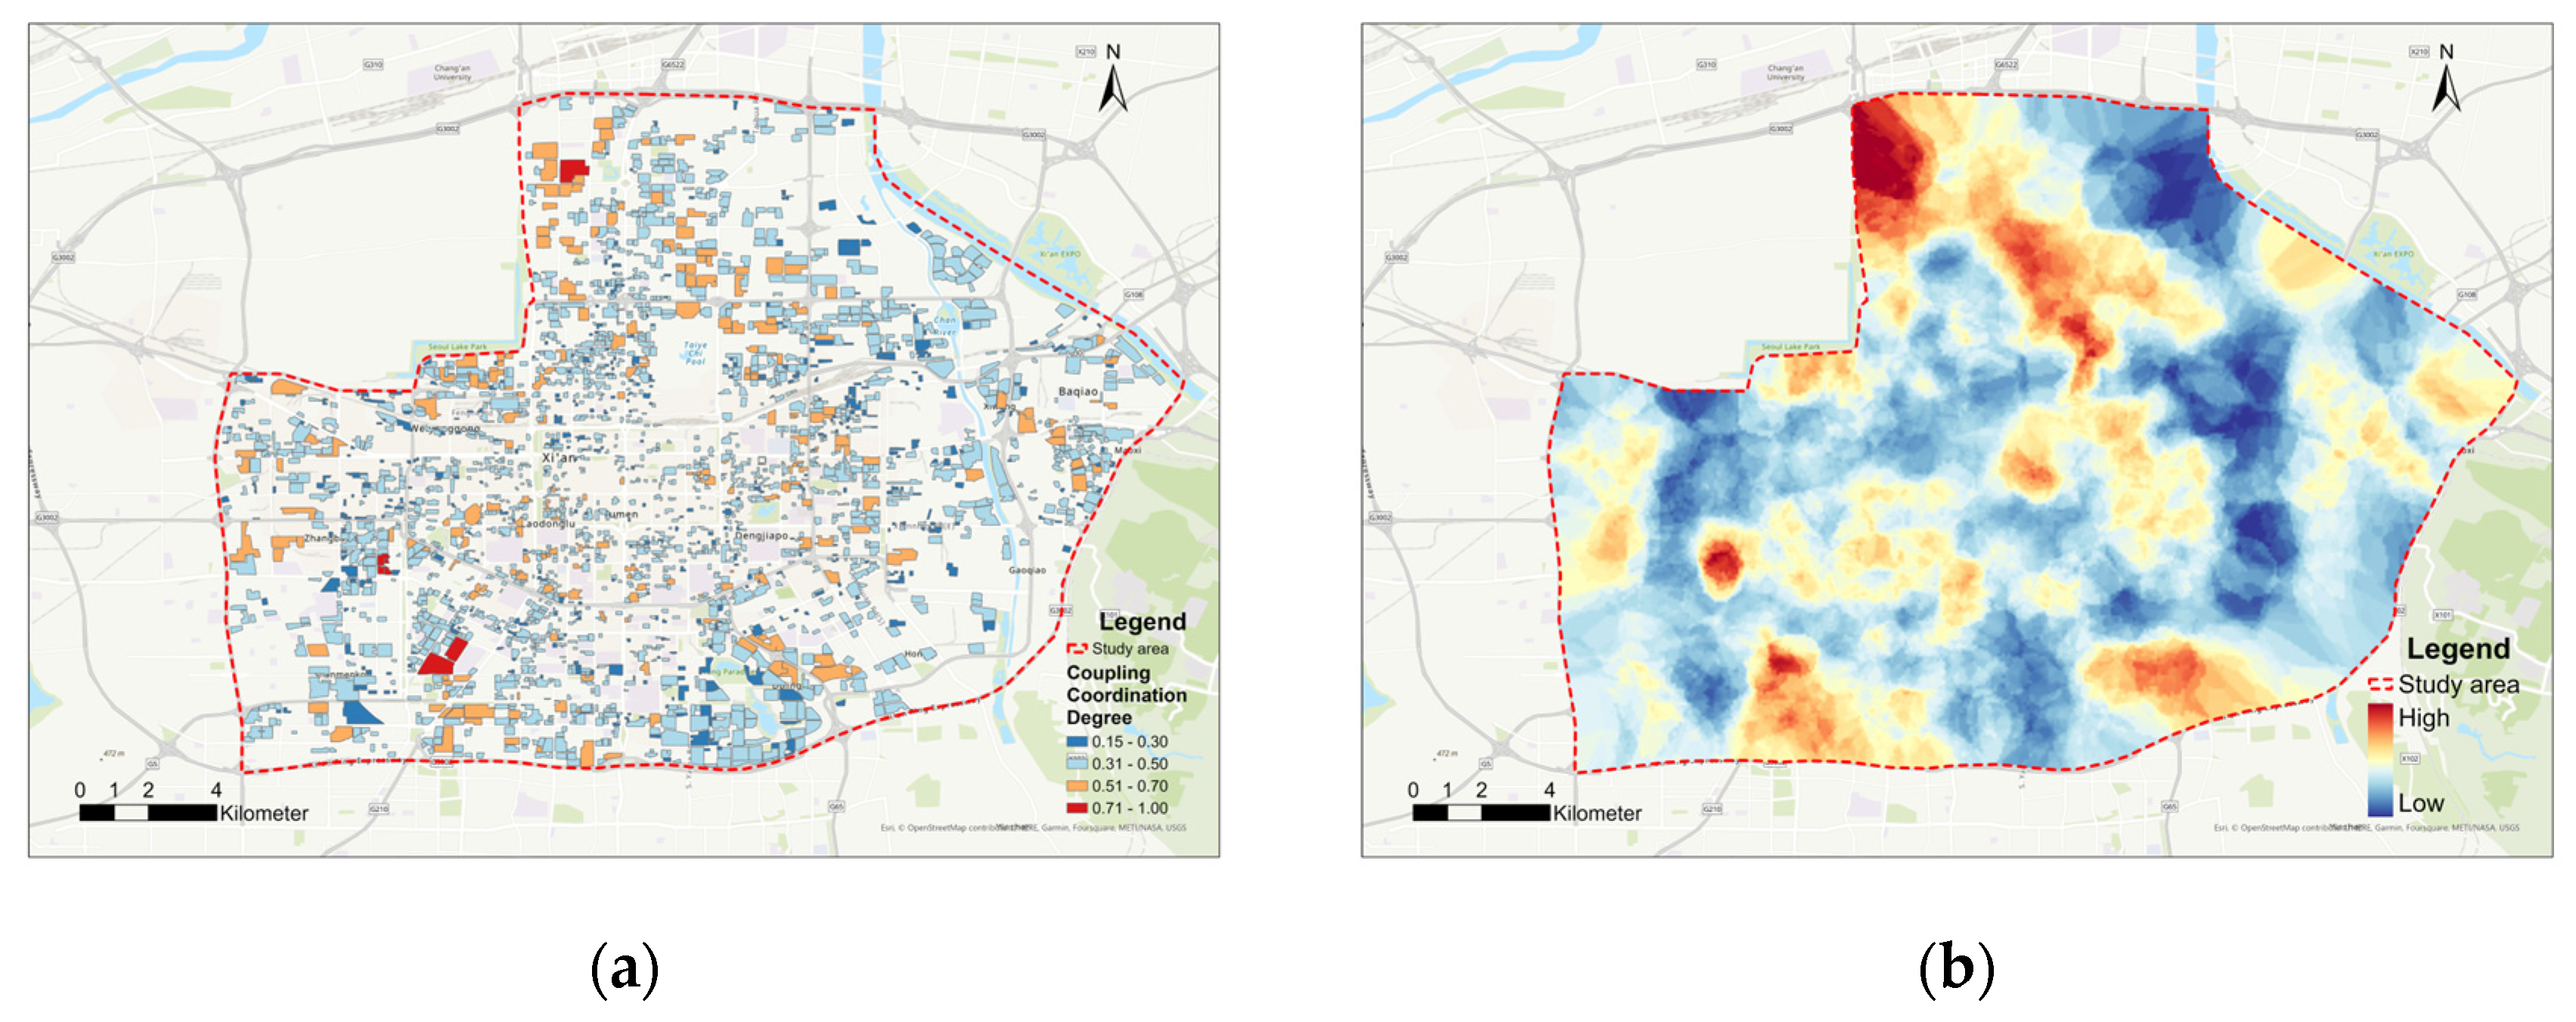
3.3.2. Results of Coupling Analysis
4. Discussion
4.1. Suggestions for Living Service Amenities Planning and Construction in Xi’an
4.2. Further Applications and Limitations
5. Conclusions
Author Contributions
Funding
Acknowledgments
Conflicts of Interest
References
- Ren, Q.; Ni, J.; Li, H.; Mao, G.; Hsu, W.; Yang, J. Analysis on Spatial Characteristics of Supply–Demand Relationship of Amenities in Expanding Central Urban Areas—A Case Study of Huai’an, China. Land 2022, 11, 1137. [Google Scholar] [CrossRef]
- Bereitschaft, B. Do “creative” and “non-creative” workers exhibit similar preferences for urban amenities? An exploratory case study of Omaha, Nebraska. J. Urban Int. Res. Placemaking Urban Sustain. 2017, 10, 198–216. [Google Scholar] [CrossRef] [Green Version]
- Knox, P.; Pinch, S. Urban Social Geography: An Introduction; Routledge: London, UK, 2014. [Google Scholar]
- Wang, W.; Zhou, Z.; Chen, J.; Cheng, W.; Chen, J. Analysis of location selection of public service facilities based on urban land accessibility. Int. J. Environ. Res. Public Health 2021, 18, 516. [Google Scholar] [CrossRef]
- National Bureau of Statistics of China. China City Statistical Yearbook; China Statistics Press: Beijing, China, 2022; p. 308. [Google Scholar]
- Yang, J.; Wu, T.; Gong, P. Implementation of China’s new urbanization strategy requires new thinking. Sci. Bull. 2017, 62, 81–82. [Google Scholar] [CrossRef]
- Shi, Y.; Yang, J.; Shen, P. Revealing the correlation between population density and the spatial distribution of urban public service facilities with mobile phone data. Isprs Int. J. Geo-Inf. 2020, 9, 38. [Google Scholar] [CrossRef] [Green Version]
- Barbosa, H.; Hazarie, S.; Dickinson, B.; Bassolas, A.; Frank, A.; Kautz, H.; Sadilek, A.; Ramasco, J.J.; Ghoshal, G. Uncovering the socioeconomic facets of human mobility. Sci. Rep. 2021, 11, 8616. [Google Scholar] [CrossRef]
- Hu, L.; He, S.; Luo, Y.; Su, S.; Xin, J.; Weng, M. A social-media-based approach to assessing the effectiveness of equitable housing policy in mitigating education accessibility induced social inequalities in Shanghai, China. Land Use Policy 2020, 94, 104513. [Google Scholar] [CrossRef]
- Li, H.; Wang, Q.; Shi, W.; Deng, Z.; Wang, H. Residential clustering and spatial access to public services in Shanghai. Habitat. Int. 2015, 46, 119–129. [Google Scholar] [CrossRef]
- Stanley, B.W.; Dennehy, T.J.; Smith, M.E.; Stark, B.L.; York, A.M.; Cowgill, G.L.; Novic, J.; Ek, J. Service access in premodern cities: An exploratory comparison of spatial equity. J. Urban Hist. 2016, 42, 121–144. [Google Scholar] [CrossRef] [Green Version]
- Wu, J.; Cai, Z.; Li, H. Accessibility of medical facilities in multiple traffic modes: A study in Guangzhou, China. Complexity 2020, 2020, 8819836. [Google Scholar] [CrossRef]
- He, J.; Dang, Y.; Zhang, W.; Chen, L. Perception of urban public safety of floating population with higher education background: Evidence from urban China. Int. J. Environ. Res. Public Health 2020, 17, 8663. [Google Scholar] [CrossRef]
- Shen, J.; Cheng, J.; Huang, W.; Zeng, F. An Exploration of Spatial and Social Inequalities of Urban Sports Facilities in Nanning City, China. Sustainability 2020, 12, 4353. [Google Scholar] [CrossRef]
- Barr, N. Economics of the Welfare State; Oxford University Press: Oxford, MS, USA, 2020. [Google Scholar]
- Rich, R.C. Neglected issues in the study of urban service distributions: A research agenda. Urban Stud. 1979, 16, 143–156. [Google Scholar] [CrossRef]
- Allen, J.; Cochrane, A.; Henry, N.; Massey, D.; Sarre, P. Rethinking the Region: Spaces of Neo-Liberalism; Routledge: London, UK, 2012. [Google Scholar]
- Pierson, P. The New Politics of the Welfare State. World Polit. 1996, 48, 143–179. [Google Scholar] [CrossRef]
- Bonoli, G. Classifying Welfare States: A Two-dimension Approach. J. Soc. Policy 1997, 26, 351–372. [Google Scholar] [CrossRef]
- Chen, T.; Hui, E.C.; Lang, W.; Tao, L. People, recreational facility and physical activity: New-type urbanization planning for the healthy communities in China. Habitat. Int. 2016, 58, 12–22. [Google Scholar] [CrossRef]
- Cho, C.M. Study on Effects of Resident-Perceived Neighborhood Boundaries on Public Services Accessibility and Its Relation to Utilization: Using Geographic Information System, Focusing on the Case of Public parks in Austin, Texas; Texas A&M University: College Station, TX, USA, 2003. [Google Scholar]
- Scott, D.; Jackson, E.L. Factors that limit and strategies that might encourage people‘s use of public parks. J. Park. Recreat. Adm. 1996, 14, 1–17. [Google Scholar]
- Gar-on Yeh, A.; Wu, F. The transformation of the urban planning system in China from a centrally-planned to transitional economy. Prog. Plann. 1999, 51, 167–252. [Google Scholar] [CrossRef]
- Naughton, B. Growing Out of the Plan: Chinese Economic Reform, 1978–1993; Cambridge University Press: Cambridge, UK, 1995. [Google Scholar]
- Wang, X.; Hui, E.C.; Choguill, C.; Jia, S. The new urbanization policy in China: Which way forward? Habitat. Int. 2015, 47, 279–284. [Google Scholar] [CrossRef]
- Hu, A. The Distinctive Transition of China’s Five-Year Plans. Mod. China 2013, 39, 629–639. [Google Scholar] [CrossRef]
- Li, J.; Li, J.; Yuan, Y.; Li, G. Spatiotemporal distribution characteristics and mechanism analysis of urban population density: A case of Xi’an, Shaanxi, China. Cities 2019, 86, 62–70. [Google Scholar] [CrossRef]
- Karra, M.; Fink, G.; Canning, D. Facility distance and child mortality: A multi-country study of health facility access, service utilization, and child health outcomes. Int. J. Epidemiol. 2017, 46, 817–826. [Google Scholar] [CrossRef] [Green Version]
- Guo, M.; Liu, B.; Tian, Y.; Xu, D. Equity to Urban Parks for Elderly Residents: Perspectives of Balance between Supply and Demand. Int. J. Environ. Res. Public Health 2020, 17, 8506. [Google Scholar] [CrossRef]
- Schrammeijer, E.A.; Malek, Ž.; Verburg, P.H. Mapping demand and supply of functional niches of urban green space. Ecol. Indic. 2022, 140, 109031. [Google Scholar] [CrossRef]
- Wu, J.; Li, Q. Method for Forecasting Urban National Sports and Fitness Demand Based on Ant Colony Algorithm. Comput. Intel. Neurosc. 2021, 2021, 1–7. [Google Scholar] [CrossRef]
- Gu, X.; Tao, S.; Dai, B. Spatial accessibility of country parks in Shanghai, China. Urban Urban Gree 2017, 27, 373–382. [Google Scholar] [CrossRef]
- Wei, W.; Ren, X.; Guo, S. Evaluation of Public Service Facilities in 19 Large Cities in China from the Perspective of Supply and Demand. Land 2022, 11, 149. [Google Scholar] [CrossRef]
- Deng, Y.; Liu, J.; Luo, A.; Wang, Y.; Xu, S.; Ren, F.; Su, F. Spatial Mismatch between the Supply and Demand of Urban Leisure Services with Multisource Open Data. In ISPRS Int. J. Geo-Inf. 2020, 9, 466. [Google Scholar] [CrossRef]
- Chen, Y.; Hu, Y.; Lai, L. Demography-Oriented Urban Spatial Matching of Service Facilities: Case Study of Changchun, China. Land 2022, 11, 1660. [Google Scholar] [CrossRef]
- Li, Z.; Chen, H.; Yan, W. Exploring spatial distribution of urban park service areas in Shanghai based on travel time estimation: A method combining multi-source data. Isprs Int. J. Geo-Inf. 2021, 10, 608. [Google Scholar] [CrossRef]
- Vadrevu, L.; Kanjilal, B. Measuring spatial equity and access to maternal health services using enhanced two step floating catchment area method (E2SFCA)—A case study of the Indian Sundarbans. Int. J. Equity Health 2016, 15, 87. [Google Scholar] [CrossRef] [Green Version]
- Lee, J.; Miller, H.J. Measuring the impacts of new public transit services on space-time accessibility: An analysis of transit system redesign and new bus rapid transit in Columbus, Ohio, USA. Appl. Geogr. 2018, 93, 47–63. [Google Scholar] [CrossRef]
- Dai, D. Black residential segregation, disparities in spatial access to health care facilities, and late-stage breast cancer diagnosis in metropolitan Detroit. Health Place 2010, 16, 1038–1052. [Google Scholar] [CrossRef]
- Hakimi, S.L. Optimum distribution of switching centers in a communication network and some related graph theoretic problems. Oper. Res. 1965, 13, 462–475. [Google Scholar] [CrossRef]
- Welch, T.F. Equity in transport: The distribution of transit access and connectivity among affordable housing units. Transp. Policy 2013, 30, 283–293. [Google Scholar] [CrossRef]
- Yang, J.; Guo, A.; Li, X.; Huang, T. Study of the impact of a high-speed railway opening on China’s accessibility pattern and spatial equality. Sustainability 2018, 10, 2943. [Google Scholar] [CrossRef] [Green Version]
- Talen, E.; Anselin, L. Assessing spatial equity: An evaluation of measures of accessibility to public playgrounds. Environ. Plan. A 1998, 30, 595–613. [Google Scholar] [CrossRef] [Green Version]
- Zhen, F.; Cao, Y.; Qin, X.; Wang, B. Delineation of an urban agglomeration boundary based on Sina Weibo microblog ‘check-in’data: A case study of the Yangtze River Delta. Cities 2017, 60, 180–191. [Google Scholar] [CrossRef]
- Wu, H.; Wang, L.; Zhang, Z.; Gao, J. Analysis and optimization of 15-minute community life circle based on supply and demand matching: A case study of Shanghai. PLoS ONE 2021, 16, e256904. [Google Scholar] [CrossRef]
- Liu, H.; Remme, R.P.; Hamel, P.; Nong, H.; Ren, H. Supply and demand assessment of urban recreation service and its implication for greenspace planning-A case study on Guangzhou. Landsc. Urban Plan. 2020, 203, 103898. [Google Scholar] [CrossRef]
- The Central People’s Government of the People’s Republic of China. Statistical Bulletin on National Economic and Social Development of Xi’an in 2021. Available online: http://www.shaanxi.gov.cn/zfxxgk/fdzdgknr/tjxx/tjgb_240/sqgb/202204/t20220408_2216664.html (accessed on 8 November 2022).
- Xi’an Natural Resources and Planning Bureau. Spatial Planning (2021–2035) Draft Public Notice of Xi’an. Available online: https://www.xa.gov.cn/index/tttp/636a2fa2f8fd1c4c21276937.html (accessed on 10 November 2022).
- Xiuyuan, Z.; Shihong, D.; Qiao, W. Hierarchical semantic cognition for urban functional zones with VHR satellite images and POI data. ISPRS J. Photogramm. 2017, 132, 170–184. [Google Scholar]
- Ministry of Housing and Urban Rural Development of the People's Republic of China. Announcement of the Ministry of Housing and Urban-Rural Development on the Release of the National Standard Urban Residential Area Planning and Design Standard. Available online: https://www.mohurd.gov.cn/gongkai/fdzdgknr/tzgg/201811/20181130_238590.html (accessed on 12 November 2022).
- Li, X.; Hu, T.; Gong, P.; Du, S.; Chen, B.; Li, X.; Dai, Q. Mapping Essential Urban Land Use Categories in Beijing with a Fast Area of Interest (AOI)-Based Method. Remote Sens. 2021, 13, 477. [Google Scholar] [CrossRef]
- Ministry of Housing and Urban Rural Development of the People’s Republic of China. Letter from the Ministry of Housing and Urban-Rural Development on Support for the 2020 Urban Health Check; Ministry of Housing and Urban-Rural Development: Beijing, China, 2020.
- Huang, L.; Wu, J.; Yan, L. Defining and measuring urban sustainability: A review of indicators. Landsc. Ecol. 2015, 30, 1175–1193. [Google Scholar] [CrossRef]
- Xie, X.; Luan, X.; Xue, Y. Research on City Center Identification and Optimization Strategy Based on POI Data—Taking the Four Districts of Qingdao as an Example. J. Phys. Conf. Ser. 2021, 1955, 012016. [Google Scholar] [CrossRef]
- Zhen, W.; Georges, A. Comparison of Multi-Criteria Group Decision-Making Methods for Urban Sewer Network Plan Selection. Civileng 2020, 1, 3. [Google Scholar]
- Ludovic-Alexandre, V.; Franck, M.; Jean-Claude, B. Using a Delphi process and the Analytic Hierarchy Process (AHP) to evaluate the complexity of projects. Expert. Syst. Appl. 2011, 38, 5388–5405. [Google Scholar]
- Peng, L.; Zhang, L.; Li, X.; Wang, P.; Zhao, W.; Wang, Z.; Jiao, L.; Wang, H. Spatio-Temporal Patterns of Ecosystem Services Provided by Urban Green Spaces and Their Equity along Urban–Rural Gradients in the Xi’an Metropolitan Area, China. Remote Sens. 2022, 14, 4299. [Google Scholar] [CrossRef]
- Li, Y.; Li, Y.; Zhou, Y.; Shi, Y.; Zhu, X. Investigation of a coupling model of coordination between urbanization and the environment. J. Environ. Manag. 2012, 98, 127–133. [Google Scholar] [CrossRef]
- Wang, J.; Wang, S.; Li, S.; Feng, K. Coupling analysis of urbanization and energy-environment efficiency: Evidence from Guangdong province. Appl. Energ. 2019, 254, 113650. [Google Scholar] [CrossRef]
- Wu, X.; Zhang, Y.; Wang, L. Coupling relationship between regional urban development and eco-environment: Inspiration from the old industrial base in Northeast China. Ecol. Indic. 2022, 142, 109259. [Google Scholar] [CrossRef]
- Zhao, J.; Xiao, Y.; Sun, S.; Sang, W.; Axmacher, J.C. Does China‘s increasing coupling of ‘urban population’ and ‘urban area’ growth indicators reflect a growing social and economic sustainability? J. Environ. Manag. 2022, 301, 113932. [Google Scholar] [CrossRef]
- Burgess, E.W. The Growth of the City: An Introduction to a Research Project; Springer: Berlin/Heidelberg, Germany, 2008. [Google Scholar]
- Yuanyuan, Y.; Yansui, L.; Yurui, L.; Jintao, L. Measure of urban-rural transformation in Beijing-Tianjin-Hebei region in the new millennium: Population-land-industry perspective. Land Use Policy 2018, 79, 595–608. [Google Scholar]
- Wu, Y.; Zhu, H.; Zheng, S. The Local Land Finance Transformation with the Synergy of Increment and Inventory: A Case Study in China. Land 2022, 11, 1529. [Google Scholar] [CrossRef]
- Yong, L.; Wenze, Y.; Peilei, F.; Yi, P.; Zhengtao, Z. Financing China‘s Suburbanization: Capital Accumulation through Suburban Land Development in Hangzhou. Int. J. Urban Reg. 2016, 40, 1112–1133. [Google Scholar]
- Pierre, M.P.; Yves, Z. Urban spatial structure, employment and social ties. J. Urban Econ. 2018, 104, 77–93. [Google Scholar]
- He, Q.; Boterman, W.; Musterd, S.; Wang, Y. Perceived social distance, socioeconomic status and adaptive residential mobility in urban China. Habitat. Int. 2022, 120, 102500. [Google Scholar] [CrossRef]
- Sako, M.; Wouter, P.V.G.; Marjolijn, D.; Jan, L. Adaptive behaviour in urban space: Residential mobility in response to social distance. Urban Stud. 2016, 53, 227–246. [Google Scholar]
- Ma, D.; Wang, Y.; Zhou, D.; Zhu, Z.; Yang, Y. The renew plans of urban thermal environment optimization for traditional districts in Xi’an, China. Environ. Sci. Pollut. R. 2023, 30, 5700–5716. [Google Scholar] [CrossRef]
- Yung, E.H.K.; Zhang, Q.; Chan, E.H.W. Underlying social factors for evaluating heritage conservation in urban renewal districts. Habitat. Int. 2017, 66, 135–148. [Google Scholar] [CrossRef]
- Lan, F.; Wu, Q.; Zhou, T.; Da, H. Spatial Effects of Public Service Facilities Accessibility on Housing Prices: A Case Study of Xi’an, China. Sustainability 2018, 10, 4503. [Google Scholar] [CrossRef] [Green Version]
- Fan, J.; Zou, B. Industrialization from scratch: The “Construction of Third Front” and local economic development in China‘s hinterland. J. Dev. Econ. 2021, 152, 102698. [Google Scholar] [CrossRef]
- Zhu, L.; Guo, Y.; Zhang, C.; Meng, J.; Ju, L.; Zhang, Y.; Tang, W. Assessing Community-Level Livability Using Combined Remote Sensing and Internet-Based Big Geospatial Data. Remote Sens. 2020, 12, 4026. [Google Scholar] [CrossRef]
- Wenze, Y.; Tianyu, W.; Yong, L.; Qun, Z.; Xinyue, Y. Mismatch of morphological and functional polycentricity in Chinese cities: An evidence from land development and functional linkage. Land Use Policy 2019, 88, 104176. [Google Scholar]
- Dadashpoor, H.; Rostami, F.; Alizadeh, B. Is inequality in the distribution of urban facilities inequitable? Exploring a method for identifying spatial inequity in an Iranian city. Cities 2016, 52, 159–172. [Google Scholar] [CrossRef]
- Marieke, O.; Mark, W.; Jan-Kees, H. The institutional space of community initiatives for renewable energy: A comparative case study of the Netherlands, Germany and Denmark. Energy Sustain. Soc. 2014, 4, 11. [Google Scholar]
- Daniel, Z. Why Some Cities Provide More Public Goods than Others: A Subnational Comparison of the Provision of Public Goods in German Cities in 1912. Stud. Comp. Int. Dev. 2008, 43, 273–289. [Google Scholar]
- Augustinus, E.M.D.H.; Brigit, A.M.S. Health, environment and quality of life: An epidemiological perspective on urban development. Landsc. Urban Plan 2003, 65, 53–62. [Google Scholar]
- Taleai, M.; Sliuzas, R.; Flacke, J. An integrated framework to evaluate the equity of urban public facilities using spatial multi-criteria analysis. Cities 2014, 40, 56–69. [Google Scholar] [CrossRef]


| Living Service Amenity Dimensions | Measuring Types |
|---|---|
| Ecological Landscape | The number of squares (i.e., open spaces) around the residential complex |
| The number of parks around the residential complex | |
| Traffic and Transportation | The number of bus stops around the residential complex |
| The number of metro stations around the residential complex | |
| Education and Culture | The number of kindergartens around the residential complex |
| The number of primary schools around the residential complex | |
| The number of middle schools around the residential complex | |
| Healthcare | The number of pharmacies around the residential complex |
| The number of hospitals around the residential complex | |
| Shopping Service | The number of supermarkets around the residential complex |
| The number of shopping malls around the residential complex | |
| The number of wet markets around the residential complex | |
| Sports and Leisure | The number of stadiums around the residential complex |
| The number of gyms around the residential complex |
| Serial Number | Coordination Interval | Coordination Level |
|---|---|---|
| 1 | ≤ 0.3 | Seriously unbalanced |
| 2 | ≤ 0.5 | Slightly unbalanced |
| 3 | ≤ 0.7 | Slightly balanced |
| 4 | ≤ 1.0 | Superior balanced |
| Age Group | Tier 1 Dimension | Tier 2 Type | Composite Type Weight | ||
|---|---|---|---|---|---|
| Dimension | Weight | Type | Weight | ||
| Age Group 0–14 Years | Ecological Landscape | 0.0963 | Squares | 0.3556 | 0.0342 |
| Parks | 0.6444 | 0.0620 | |||
| Traffic and Transportation | 0.1259 | Bus Stops | 0.4063 | 0.0511 | |
| Metro stations | 0.5938 | 0.0747 | |||
| Education and Culture | 0.2458 | Kindergartens | 0.2430 | 0.0597 | |
| Primary Schools | 0.3210 | 0.0789 | |||
| Middle Schools | 0.4360 | 0.1072 | |||
| Healthcare | 0.2333 | Pharmacies | 0.3853 | 0.0899 | |
| Hospitals | 0.6147 | 0.1434 | |||
| Shopping Service | 0.1022 | Supermarkets | 0.4158 | 0.0425 | |
| Shopping Malls | 0.2838 | 0.0290 | |||
| Wet Markets | 0.3004 | 0.0307 | |||
| Sports and Leisure | 0.1966 | Stadiums | 0.6493 | 0.1277 | |
| Gyms | 0.3507 | 0.0690 | |||
| Age Group 15–60 Years | Ecological Landscape | 0.0795 | Squares | 0.3257 | 0.0259 |
| Parks | 0.6743 | 0.0536 | |||
| Traffic and Transportation | 0.1855 | Bus Stops | 0.3218 | 0.0597 | |
| Metro stations | 0.6782 | 0.1258 | |||
| Education and Culture | 0.1458 | Kindergartens | 0.1952 | 0.0285 | |
| Primary Schools | 0.2806 | 0.0409 | |||
| Middle Schools | 0.5242 | 0.0764 | |||
| Healthcare | 0.2594 | Pharmacies | 0.3681 | 0.0955 | |
| Hospitals | 0.6319 | 0.1639 | |||
| Shopping Service | 0.1476 | Supermarkets | 0.1990 | 0.0294 | |
| Shopping Malls | 0.3314 | 0.0489 | |||
| Wet Markets | 0.4696 | 0.0693 | |||
| Sports and Leisure | 0.1821 | Stadiums | 0.4403 | 0.0802 | |
| Gyms | 0.5597 | 0.1019 | |||
| Age Group 60 Years and Above | Ecological Landscape | 0.1433 | Squares | 0.4147 | 0.0594 |
| Parks | 0.5853 | 0.0839 | |||
| Traffic and Transportation | 0.1520 | Bus Stops | 0.5923 | 0.0900 | |
| Metro stations | 0.4077 | 0.0620 | |||
| Education and Culture | 0.0608 | Kindergartens | 0.3459 | 0.0210 | |
| Primary Schools | 0.3395 | 0.0206 | |||
| Middle Schools | 0.3145 | 0.0191 | |||
| Healthcare | 0.3929 | Pharmacies | 0.2792 | 0.1097 | |
| Hospitals | 0.7208 | 0.2832 | |||
| Shopping Service | 0.1011 | Supermarkets | 0.2288 | 0.0231 | |
| Shopping Malls | 0.1659 | 0.0168 | |||
| Wet Markets | 0.6052 | 0.0612 | |||
| Sports and Leisure | 0.1500 | Stadiums | 0.6035 | 0.0905 | |
| Gyms | 0.3965 | 0.0595 | |||
Disclaimer/Publisher’s Note: The statements, opinions and data contained in all publications are solely those of the individual author(s) and contributor(s) and not of MDPI and/or the editor(s). MDPI and/or the editor(s) disclaim responsibility for any injury to people or property resulting from any ideas, methods, instructions or products referred to in the content. |
© 2023 by the authors. Licensee MDPI, Basel, Switzerland. This article is an open access article distributed under the terms and conditions of the Creative Commons Attribution (CC BY) license (https://creativecommons.org/licenses/by/4.0/).
Share and Cite
Wang, K.; Wang, W.; Li, T.; Wen, S.; Fu, X.; Wang, X. Optimizing Living Service Amenities for Diverse Urban Residents: A Supply and Demand Balancing Analysis. Sustainability 2023, 15, 12392. https://doi.org/10.3390/su151612392
Wang K, Wang W, Li T, Wen S, Fu X, Wang X. Optimizing Living Service Amenities for Diverse Urban Residents: A Supply and Demand Balancing Analysis. Sustainability. 2023; 15(16):12392. https://doi.org/10.3390/su151612392
Chicago/Turabian StyleWang, Kangxu, Weifeng Wang, Tongtong Li, Shengjun Wen, Xin Fu, and Xinhao Wang. 2023. "Optimizing Living Service Amenities for Diverse Urban Residents: A Supply and Demand Balancing Analysis" Sustainability 15, no. 16: 12392. https://doi.org/10.3390/su151612392
APA StyleWang, K., Wang, W., Li, T., Wen, S., Fu, X., & Wang, X. (2023). Optimizing Living Service Amenities for Diverse Urban Residents: A Supply and Demand Balancing Analysis. Sustainability, 15(16), 12392. https://doi.org/10.3390/su151612392