Article

The Modified Soil Moisture Constraint Scheme Significantly Enhances the Evapotranspiration Simulation Accuracy of the MOD16 Model

State Key Laboratory of Eco-Hydraulics in Northwest Arid Region, Xi’an University of Technology, Xi’an 710048, China
*
Author to whom correspondence should be addressed.
Sustainability 2023, 15(16), 12460; https://doi.org/10.3390/su151612460
Submission received: 8 July 2023 / Revised: 2 August 2023 / Accepted: 11 August 2023 / Published: 16 August 2023

Abstract

:
Remotely sensed (RS) evapotranspiration (ET) models can make full use of the land surface information retrieved using remote sensing and are therefore widely used in large-scale ET estimates. The MODIS Global Evapotranspiration model (MOD16) is one of the most commonly used remote sensing ET models. MOD16 parameterizes the moisture constraints on soil evaporation (Es) using atmospheric vapor pressure deficit (VPD) and relative humidity (RH). This moisture constraint algorithm has been criticized by many studies due to the weak correlation between soil moisture and VPD or RH over short timescales (e.g., hourly and daily). In this study, we introduce a modified moisture constraint algorithm of ET, based on the ratio of antecedent accumulated precipitation to soil equilibrium evaporation, in order to improve the ET simulation capabilities of the MOD16 model. The original and modified MOD16 models are evaluated at 14 ChinaFlux sites and 286 basins in China, using eddy covariance measurements and water-balance-based ET estimates. The results show that the modified MOD16 model outperforms the original MOD16 model at both the site and basin scales. Compared with the original model, the modified model increases the value of KGE by an average of 0.17 at the flux site scale and by 0.01 at the basin scale. Using soil moisture measurements from flux sites as a reference, we further found that the modified MOD16 model also has a better soil moisture simulation capacity than the original model. This study highlights the importance of reliable soil moisture constraints in remotely sensed ET models.

1. Introduction

Evapotranspiration (ET) is an important component of the global water cycle [1,2], and the largest water flux beyond precipitation in terrestrial water budgets [3]. About 60% of annual land precipitation is returned to the atmosphere via ET, with the percentage increasing to as much as 90% in arid and semiarid regions [4]. Moreover, ET is a vital energy flux determined by the partition of available energy into sensible and latent heat fluxes [5,6]. Therefore, it is essential to precisely quantify ET estimation in order to comprehensively understand regional water cycles and to better manage water resources for agriculture, industry, and other hydrological practices.
Traditional ET estimation methods mainly rely on in situ measurements, such as eddy covariance (EC) and the lysimeter and Bowen ratios [7]. However, these techniques may not adequately meet the demand for ET estimates at regional and large scales due to the variability of ET across different types of land cover [8]. In addition, the instruments required for ET measurements are often located in only several sparsely distributed locations, limiting their spatial representativeness and causing high maintenance costs [9]. In comparison to conventional methods, remote sensing (RS) techniques are generally regarded as effective and reliable tools for monitoring regional ET [10]. The RS methods can be used to estimate the land surface parameters such as leaf area index (LAI), albedo, and land surface temperature, at large scales. These parameters are required for ET estimation [11]. With the development of RS technology, a number of RS-based ET modeling techniques have been developed over the past several decades. These methods include: (1) empirical statistical methods [12,13]; (2) surface energy balance (SEB) methods [14,15]; (3) and other physical models, such as the Priestley–Taylor-based approach [16] and the Penman–Monteith (PM) equation [6,17,18]. Among those methods, the PM method is notable for considering both physiological and environmental factors that affect ET and has been recommended by the Food and Agriculture Organization of the United Nations (FAO) [19].
The Moderate Resolution Imaging Spectroradiometer (MODIS) MOD16 product is widely used to perform global ET estimates. The MOD16 model was developed by Mu et al. [20] on the basis of the PM method. The global ET product (MOD16/ET) derived from the MOD16 model requires MODIS remotely sensed data (i.e., land cover, albedo) and meteorological data as inputs. This product provides 8-day ET estimation with a spatial resolution of 1 km2 [21]. Many studies have focused on validating the ET product using in situ-measured data under diverse climatic and land cover conditions worldwide. For example, Kim et al. [22] validated the MOD16 product at 17 flux tower locations in Asia and found that the ET product performed well in forested sites. Hu et al. [5] assessed the performance of MOD16 at 15 ground sites across Europe and revealed that the MOD16 product performed better in sites located in temperate and humid climates than in semi-arid sites. In China, Tang et al. [23] found that the MOD16 ET product performed better with EC measurements than with large-aperture scintillometer (LAS) measurements but underestimated ET at four irrigated cropland sites. In summary, while the MOD16 product can serve as a reference point for use in global ET estimation with reliable accuracy, it is important to note that deviations exist between in situ ET data and MOD16 ET products under various climate and land surface conditions [24]. Thus, further improvement of the MOD16 algorithm is necessary to enhance its accuracy and suitability for use in ET estimation.
The parameterization of the MOD16 model has a significant impact on accurately estimating ET. The main challenge of the PM-based model is to determinate the surface resistance, which depends on factors such as LAI, stomatal conductance, soil moisture status, leaf physiological attributes, and soil attributes [11]. Soil moisture can impact the conversion of radiation into latent and sensible heat, which in turn affect the formation of ET [25]. In many PM-based models, the effect of soil moisture information on ET is implicitly considered, which may contribute to uncertainties in the estimation of ET results [26]. For instance, in the MOD16 model, soil moisture is described through the function of vapor pressure deficit (VPD) and relative humidity (RH, %). This assumes a relationship between soil moisture status and the evaporative demand of the surface atmosphere [26]. However, there exist some questions related to this assumption that require further discussion. First, the changing patterns of VPD do not always correspond with soil moisture. In detail, VPD is more related to atmospheric mechanisms, such as air temperature and solar radiation, and is less coupled with the variations in soil moisture [27]. Furthermore, the relationship between VPD and soil moisture is uncoupled at short timescales (i.e., daily to weekly), which can result in model errors [26]. VPD is highly sensitive to changes in air temperature and exhibits regular daily and seasonal fluctuations. Indeed, the short-term changes in soil moisture tend to be relatively stable, while the spatial variation can be quite large [28]. In summary, there is a need to modify the soil moisture constraint algorithm of the MOD16 model.
Here, this study aims to insert a modified soil moisture constraint algorithm into the MOD16 model in order to improve the accuracy of ET estimations. The objectives of this study are as follows: (1) To explore whether the modified MOD16 performs better than the original MOD16 model in ET estimation. (2) To explain why the two algorithms show differences in the performance of ET estimation. This work is organized as follows. Section 2 provides details of the modified MOD16 algorithm. Section 3 evaluates the performance of the original and modified model methods using observed ET data from 14 flux sites and 286 basins. Then, Section 4 explores the reasons for the differences in performance between the two algorithms and discusses potential uncertainties in the results.

2. Methodology and Data

2.1. Improvements on the MOD16 Algorithm

ET is the sum of evaporation from rain water intercepted by the canopy before it reaches the ground (Ei), the transpiration through stomata on plant leaves and stems (Et), and evaporation from wet and moist soil (Es) [6]. The modified ET algorithms based on the Penman–Monteith (PM) equation [18] are as follows:
E = E i + E t + E s
E i = s × A c + ρ × C p × F c × V P D / r h r c × F wet / λ s + P a × C p × r v c / λ × ε × r h r c
E t = s × A c + ρ × C p × F c × V P D / r a × 1 F wet / λ s + γ × 1 + r s / r a
E s = s × A s + ρ × C p × 1 F c × V P D / r as / λ s + γ × r tot / r as × F wet + 1 F wet × F sm
where s is the slope of the curve relating saturated water vapor pressure to temperature (kPa °C−1); Ac and As (MJ m−2 day−1) are the available energy allocated to the canopy and soil surfaces, respectively; ρ is the air density (kg m−3); Cp is the specific heat capacity of air (MJ kg−1 °C−1); Fc is the fractional vegetation cover (dimensionless); VPD is the atmospheric vapor-pressure deficit (kPa); Fwet is the relative surface wetness (dimensionless); λ is the latent heat of evaporation (MJ kg−1); Pa is the atmospheric pressure (kPa); ε is the ratio of the molecular weight of water to dry air (i.e., 0.622); γ is the psychrometric constant (kPa °C−1); Fsm is soil water constraint (dimensionless).
In the MOD16 model, Fsm follows the soil moisture constraint equation detailed by Fisher et al. [29] and is defined as the function of VPD and RH. It is based on the complementary relationship hypothesis [30] assuming that soil moisture is reflected in the adjacent atmospheric moisture [29]. For ease of presentation, hereafter, Fsm is referred as to fVPD:
f VPD = R H / 100 V P D / β
where β is the relative sensitivity to VPD. In the old algorithm by Mu et al. [20], the value of β is 0.1 kPa and has been revised as 0.2 kPa in the modified algorithm by Mu et al. [6]. We set the parameter β at 0.25 kPa in alignment with the latest version by Running et al. [31].
The changes of soil moisture have been proved not only to be impacted by the atmospheric factors (i.e., temperature and humidity), but also the variability of precipitation. According to the method proposed by Morillas et al. [32], we introduce a soil moisture constraint algorithm based on the ratio of previous precipitation and soil equilibrium evaporation to improve the ET simulation of the MOD16 model. Equation (6) is used to calculate fdrying during the effective precipitation days (Pi > Pmin = 0.5 mm day−1).
f drying = min i 30 i P i i 30 i E eq , s , i , 1     when   P i > P min f LP × exp α × Δ t     when   P i < P min
where fdrying is the modified soil water constraint (dimensionless); Pi is the accumulated daily precipitation (mm); fLP is the value for the last effective precipitation day (dimensionless); α (day−1) is a parameter controlling the rate of soil drying, higher α values reflecting higher soil drying speed; Δt is the number of days between this and the current day i.
Apart from the variation in the Fsm calculation method, other parameters and algorithms of the MOD16 model remain unchanged and are consistent with the settings of Running et al. [31].

2.2. Data Sources and Processing

There are two types of data used in this study: meteorological data and surface flux data. Meteorological data were collected from approximately 800 national standard meteorological stations (Figure 1) and provided by the China Meteorological Administration. Then, these collected data were interpolated into raster data with a resolution of 0.05° × 0.05° using the Anusplin method [33]. The Anusplin method is an effective interpolation approach that can accurately model the impact of terrain on interpolated variables [34]. Several studies have demonstrated that this method has a higher interpolation accuracy than other interpolation methods, such as inverse distance weighting (IDW) or ordinary kriging [35,36].
Land surface data, including albedo and leaf area index (LAI), were obtained from the GLASS AVHRR product, which provides a resolution of 0.05 degrees and 8-day compositing periods in the simulation projection. To be consistent with the time step of the MOD16 model, these land surface data were then converted into daily data from 1981 to 2018. The albedo data were used to obtain the net radiation based on the methodology proposed by Allen et al. [37]. In this study, the land cover type was classified based on the International Geosphere-Biosphere Programme (IGBP) land cover classification, and land cover data were obtained from the MCD12C1 product. The MOD16 algorithm cannot calculate ET from persistent wetlands and water bodies, as it does not provide relevant parameters for the two land cover types. Here, ET estimates from persistent wetlands and water bodies were obtained from a Chinese open water evaporation dataset (https://osf.io/qd28m/, (accessed on 23 June 2023)). This dataset was developed based on the modified Penman model, considering the impact of heat storage and area on evaporation estimations [38].
To assess the performance of ET estimates from the modified and original MOD16 methods, evaluations were conducted on both the site and basin scales. The performance of the two methods was evaluated using daily evapotranspiration (ET) observations at 14 ChinaFlux sites and soil moisture observations at 7 out the 14 ChinaFlux sites (see Table 1). It is worth noting that soil moisture observations were only available at 7 of 14 ChinaFlux sites. We use the symbol * to denote the stations at which soil moisture observations were made (see Table 2). These flux sites include multiple land cover types, including forests, grasslands, and croplands (see Figure 1 and Table 2).
On the basin scale, the performance of the two soil moisture methods was evaluated using a water balance approach. This approach is based on the assumption that the total storage change (∆S) can be ignored when estimating annual values [39]. Therefore, the mean annual evapotranspiration (ET) can be calculated following the water balance equation:
E T = P R
where P is precipitation (mm) and R is runoff.
In total, the 286 test basins used in this study (Figure 1) cover various climate conditions and land cover types. The natural runoff data of the study basins were provided by the Hydrological Bureau of the Ministry of Water Resources of China. Furthermore, the evaluation of two methods on the basin scale was limited to the period from 1982 to 2000 due to the unavailability of runoff data beyond this timeframe.
The soil moisture product generated from the China Land Data Assimilation System (CLDAS) was used to evaluate the performance of the two soil moisture constraint algorithms. The dataset has a spatial resolution of 1/16 degree and a temporal resolution of 1 day [40]. The NCAR/CLM3.5 land surface models generated the CLDAS soil moisture products by integrating the ground observations, satellite observations, and numerical model products as forcing data [41]. The product was evaluated for consistency with in situ observations of soil moisture and is widely used for hydrological applications.

2.3. Model Performance Assessment

To assess the performance of the two soil moisture constraint methods, the coefficient of determination (R2, Equation (8)), the percent relative bias (bias, Equation (9)), and the Kling–Gupta efficiency (KGE, Equation (10)) were used. R2 is a metric that can evaluate the goodness of fit between predictions and observations. The range of R2 lies between 0 and 1, with a value of 1 indicating a perfect match between the predicted and observed values [42]. Bias can measure the deviation between predictions and observations, with positive (negative) values indicating overestimation (underestimation) [43]. The Kling–Gupta efficiency (KGE) [44] is a comprehensive indicator of model performance which considers the correlation, bias, and variability between simulations and observations [45]. Negative KGE values indicate a bad model performance and positive KGE values indicate a good model performance, with an optimal value of 1.0.
R 2 = i = 1 n ( x i x ¯ ) ( y i y ¯ ) i = 1 n ( x i x ¯ ) 2 i = 1 n ( y i y ¯ ) 2 2
Bias = i = 1 n y i x i i = 1 n x i × 100 %
KGE = 1 ( r 1 ) 2 + ( σ sim σ obs 1 ) 2 + ( μ s i m μ o b s 1 ) 2
where xi and yi are the observation and simulation data of grid i, respectively; r is the liner correlation between the observation and simulation data; σ o b s and σ s i m are the standard deviation in observations and simulations, respectively; μ o b s is the mean observation value; and μ s i m is the mean simulation value.

3. Results

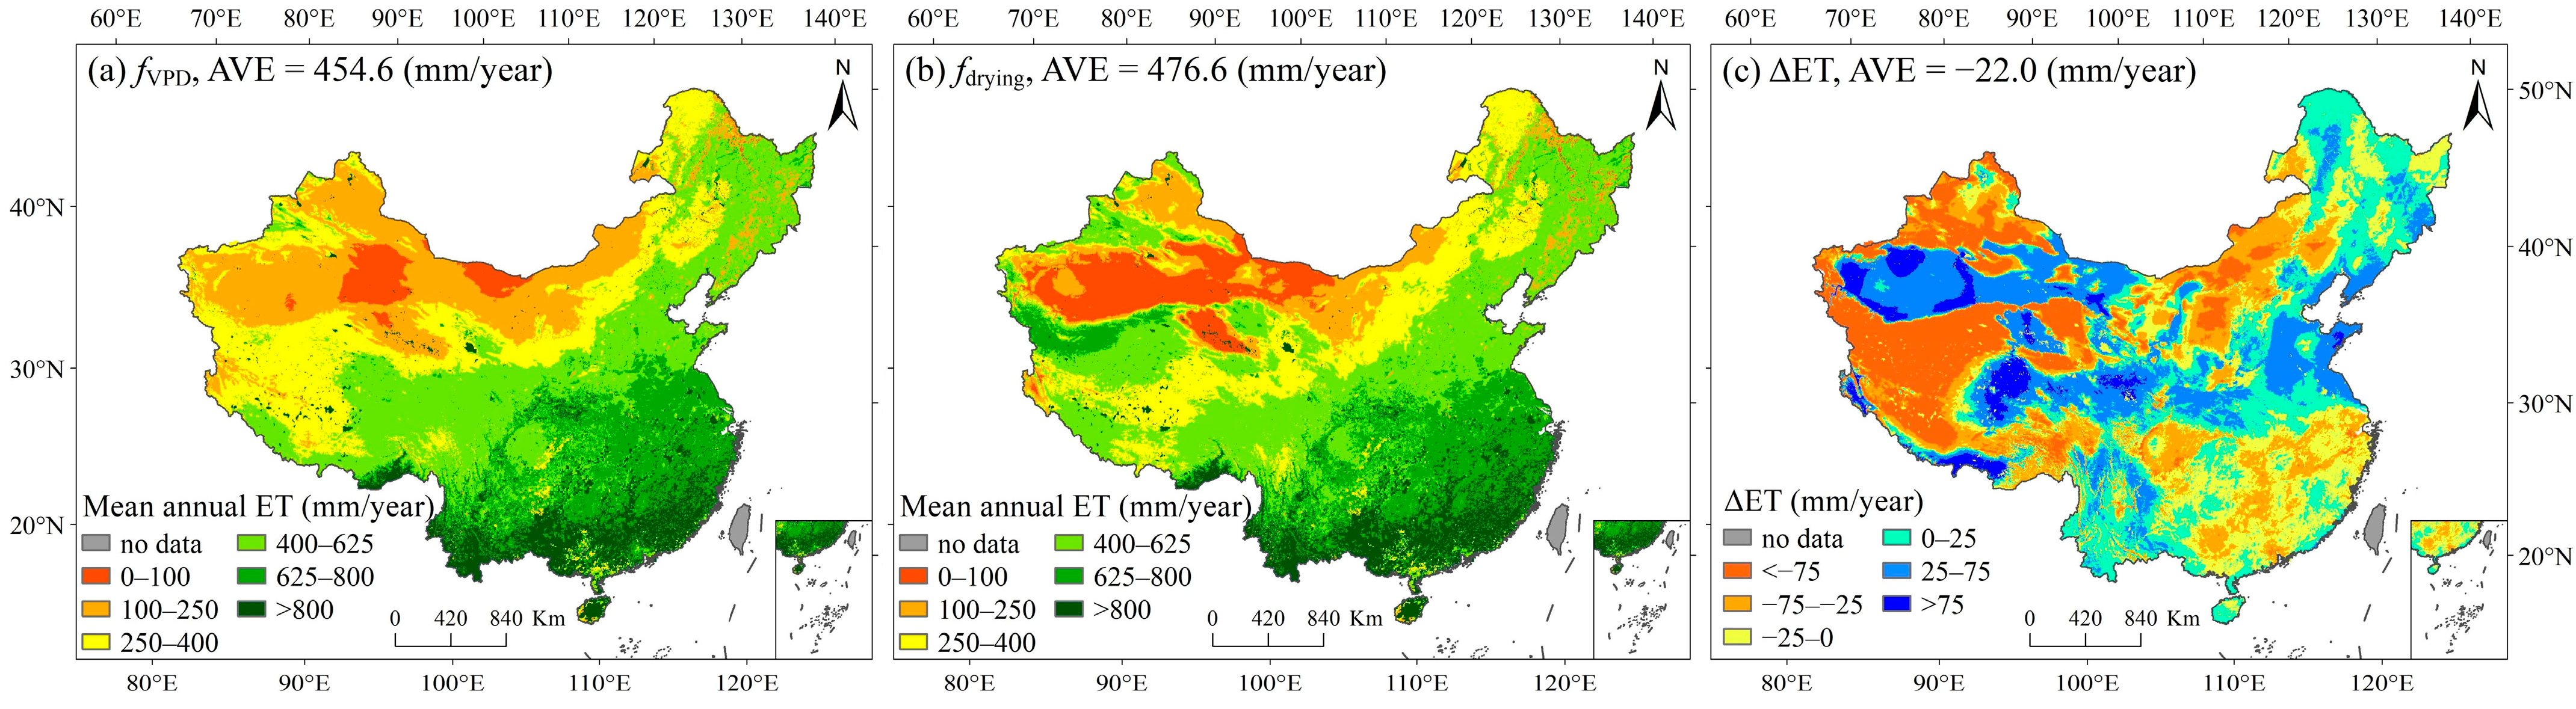
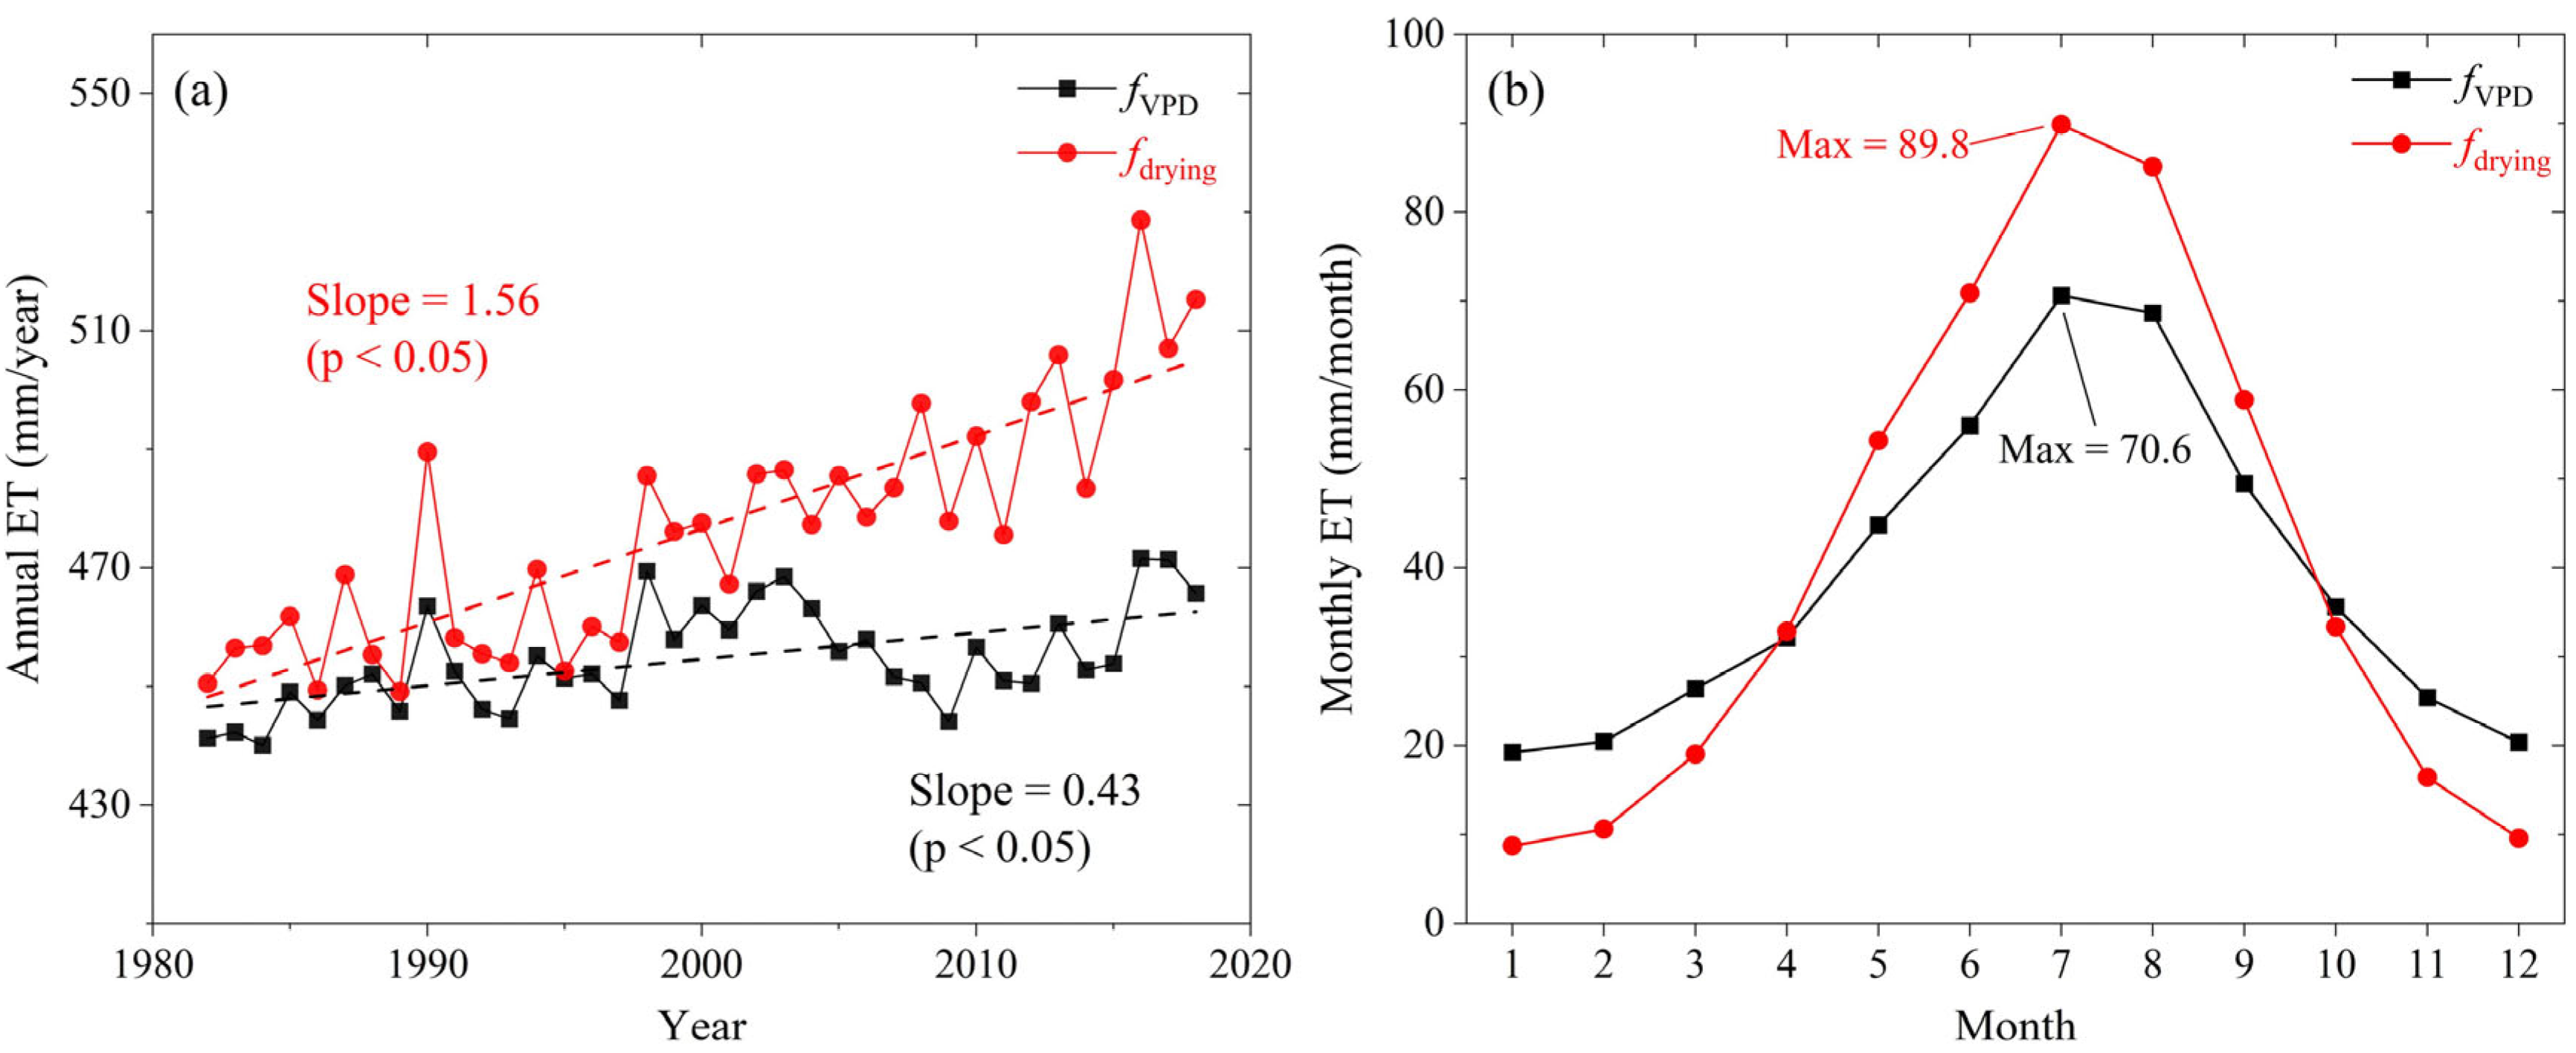
3.1. The Spatiotemporal Feature of ET Estimates

We compared the spatial patterns of ET estimations and their difference calculated by the modified and original MOD16 methods in China from 1982 to 2018. As is shown in Figure 2a,b, both methods have a similar spatial pattern of mean annual ET estimates, with higher values in the southern and eastern regions of China and lower values in the northern and western regions of China. On a national scale, the difference in the mean annual ET estimates between the modified and original algorithms indicates that the modified algorithm leads to generally higher mean annual ET estimates, especially in arid and semiarid regions (Figure 2c). The mean annual ET values of the modified and original algorithms are 476.6 mm/year and 454.6 mm/year, respectively, with an average ∆ET of −22.0 mm/year.
Figure 3 exhibits a comparison of the variability in annual and monthly average ET estimates from the modified and original MOD16 methods from 1982 to 2018. It is apparent that the modified method produces a larger annual ET value than the original method. The annual ET values estimated by the two methods both have a significant increasing trend (p < 0.05) (Figure 3a). However, the trend determined by the modified method is larger than that of the original method, at 1.56 mm/yr2 for the modified model and 0.43 mm/yr2 for the original model. On the seasonal scale, the ET estimates from the two methods both show an inverted V-shape variation, with peaks in July at 89.8 mm/month (modified) and 70.6 mm/month (original) (Figure 3b). From April to September, the modified monthly ET is higher than the original one, and the largest difference of 19.2 mm is observed in July. In other months, the modified monthly ET is lower than the original ET.

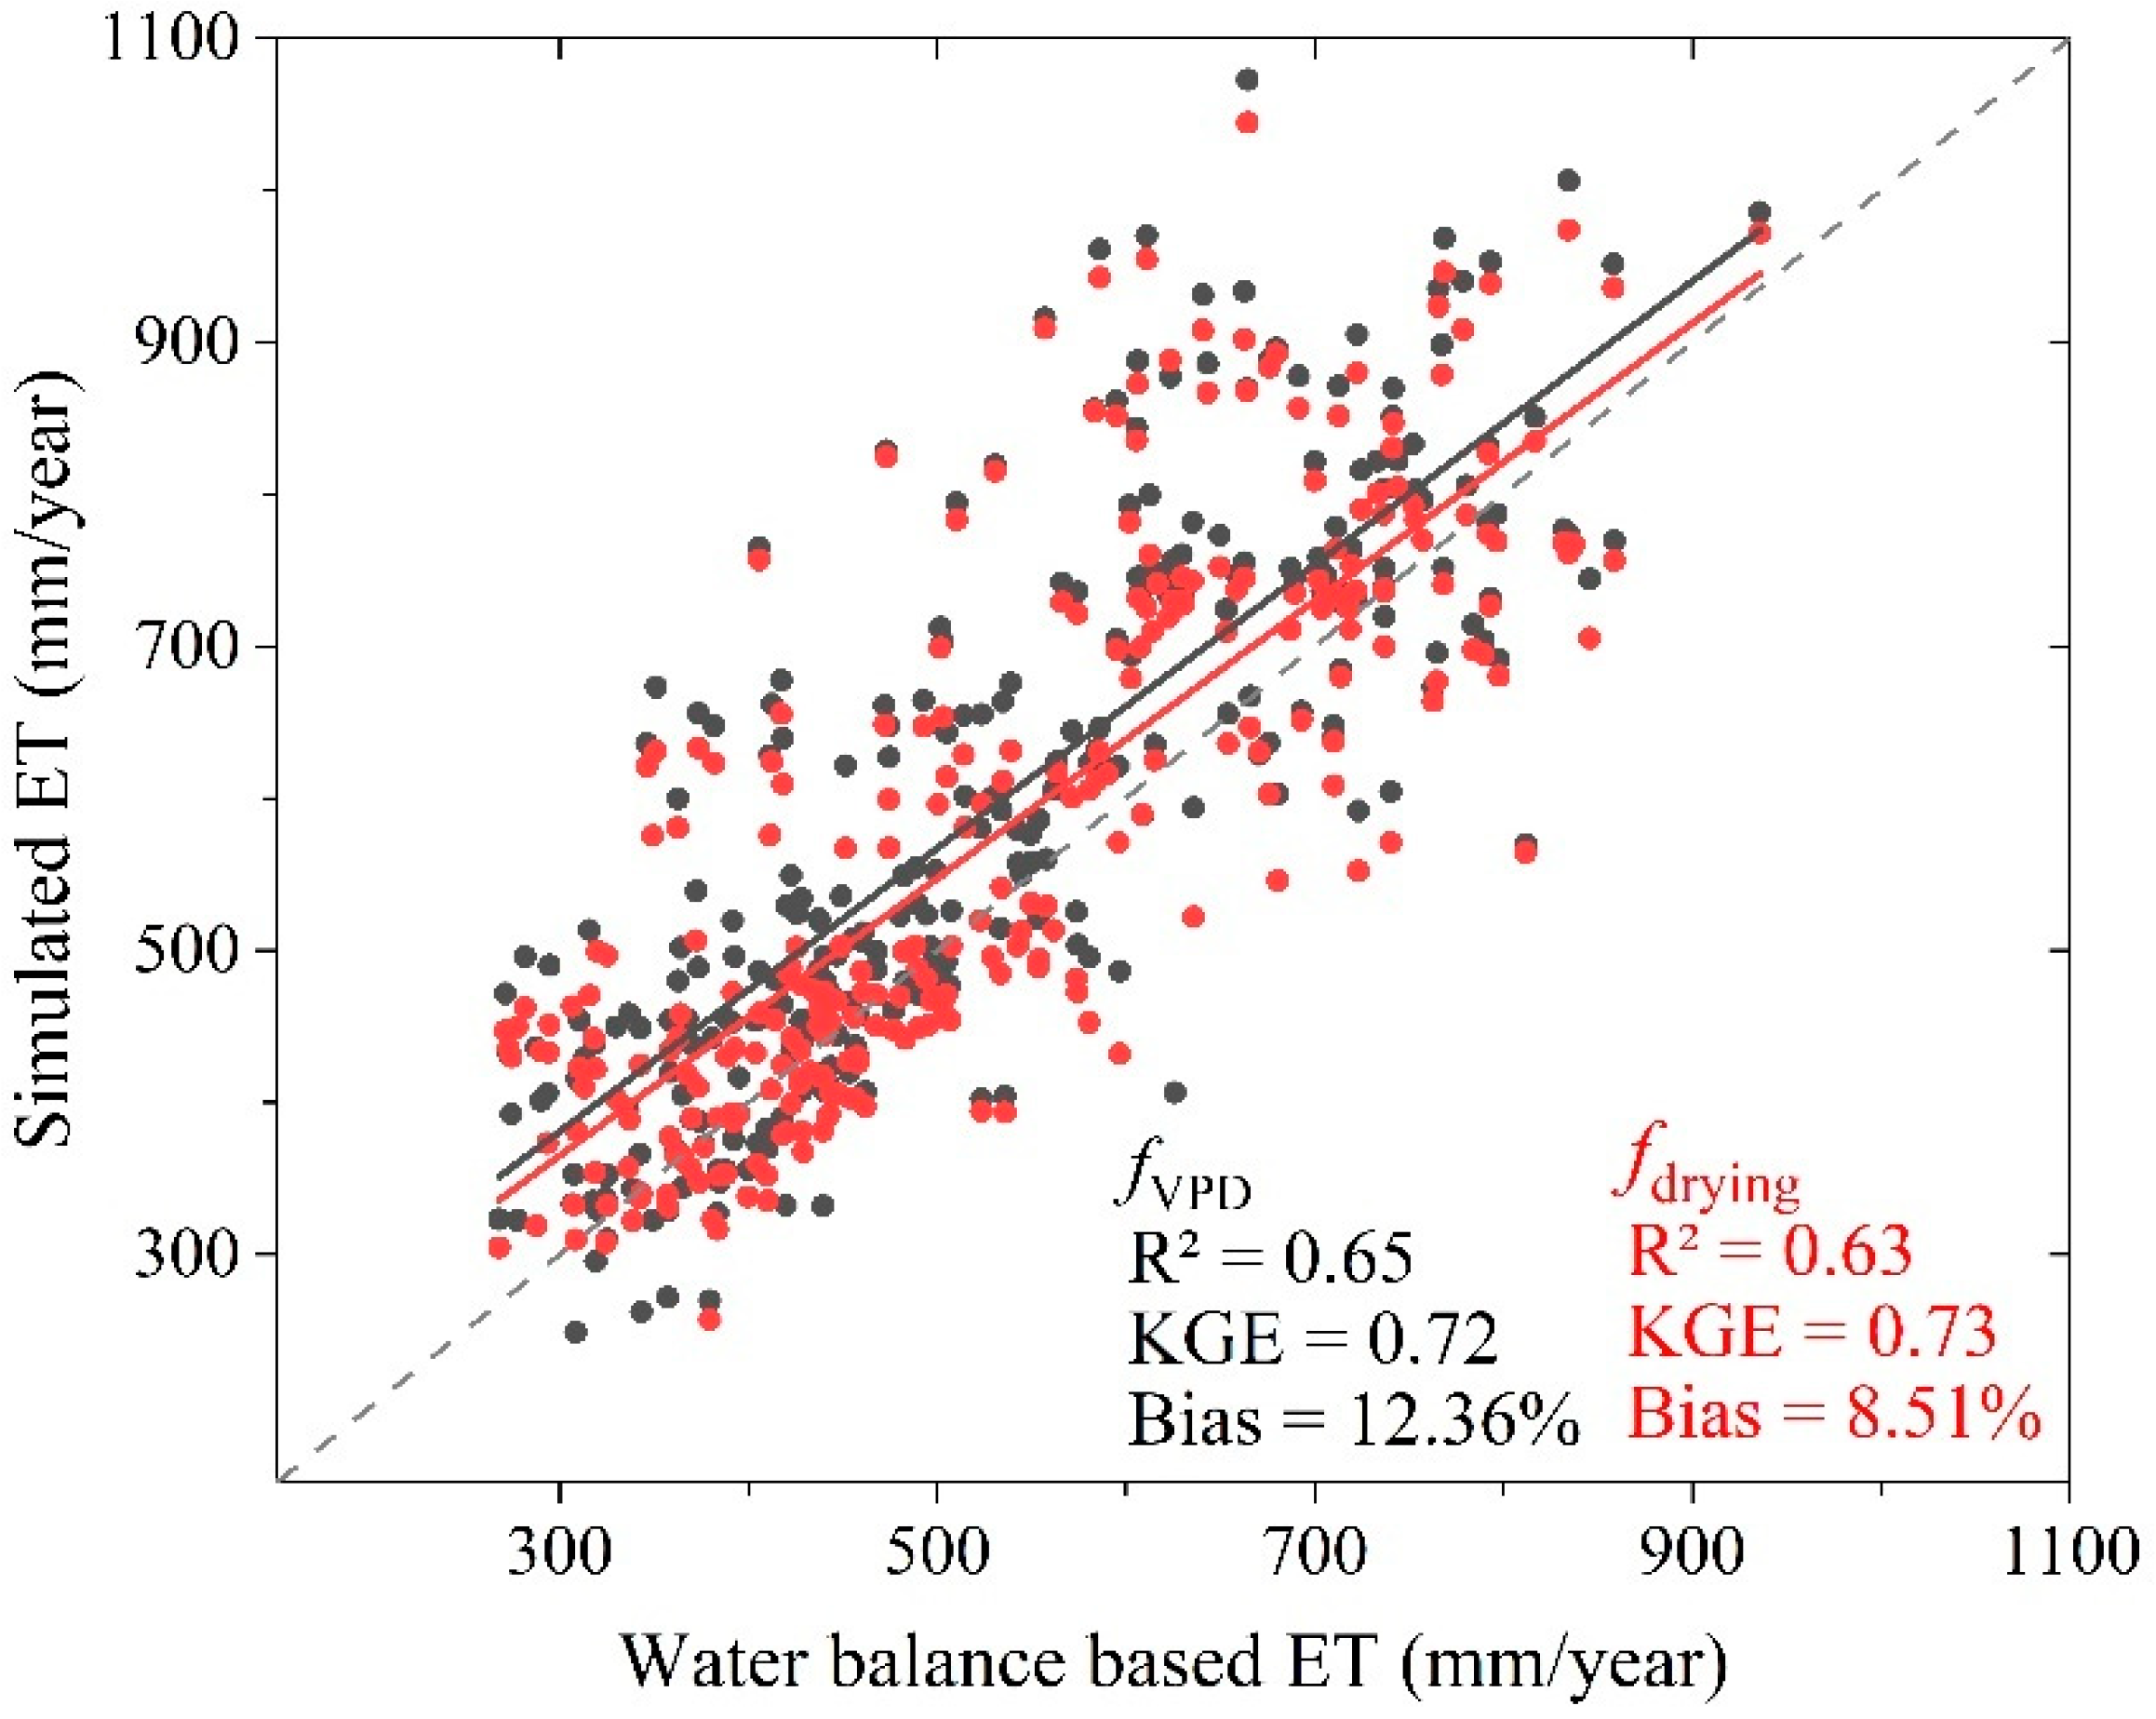
3.2. ET Assessments on the Site and Basin Scales

Table 3 shows the performance of the two methods at the 14 flux sites. At all flux sites, the modified method produced higher R2 and KGE values than the original method. Relative to the original method, the average R2 of the modified method increased from 0.52 to 0.68 and the average KGE increased from 0.54 to 0.71. These results demonstrate that the modified method provides more accurate ET estimates than the original algorithm. Regarding different land cover types at the 14 flux sites, the modified method performs particularly well for ET estimates at grassland and cropland sites. For the five grasslands sites, the improvement in R2 and KGE values between the two methods is larger than 0.20 and 0.10, respectively. At the DX site, the modified method resulted in the greatest increase in R2 and KGE, from 0.28 to 0.67 and 0.22 to 0.58, respectively. For the six cropland areas, the improvements in the average R2 and KGE between the two methods are 0.09 and 0.12, respectively. At the HL and DaXing site, the improvement in R2 and KGE between the two methods was larger than 0.20 for both, indicating that the modified method had a more significant impact at these sites than at other cropland sites. For forest areas, however, there is no significant difference in R2 and KGE between the two methods compared to other land cover type sites. For instance, the improvement in R2 and KGE values between the two methods is 0.02 and 0.01, respectively, at the CBS site. At the QYZ site, the improvements of R2 and KGE are 0.05 and 0.03, respectively.
We also evaluated the mean annual ET estimates of the two methods using the water balance approach (Figure 4). The modified method is generally superior to the original method, although the advantages of the modified model over the original model are not as pronounced as on the site scale. Compared to the original method, the KGE value of the modified method increased from 0.72 to 0.73 and the bias value decreased from 12.36% to 8.51%. The red line is clearly nearer to the 1:1 dashed line than the black line. The results further confirm the advantages of the modified method over the original model in ET estimation.

3.3. Comparison of Different Soil Moisture Constraint Schemes

We compared the spatial pattern of the soil moisture constraint between the two methods and the CLDAS product, as shown in Figure 5. Both the original and modified methods simulated similar spatial patterns of soil moisture consistent with the CLDAS product, with a higher soil moisture in vegetated regions and a lower soil moisture in semiarid and arid regions. However, the two methods exhibited different average soil moisture constraints compared to the CLDAS product. Compared to the CLDAS product, the modified method had a smaller difference in the average soil moisture constraint value at 0.04, while the original method had a larger difference at 0.13. These results suggest that the modified method simulates a more accurate soil moisture constraint compared to the original method.

4. Discussion

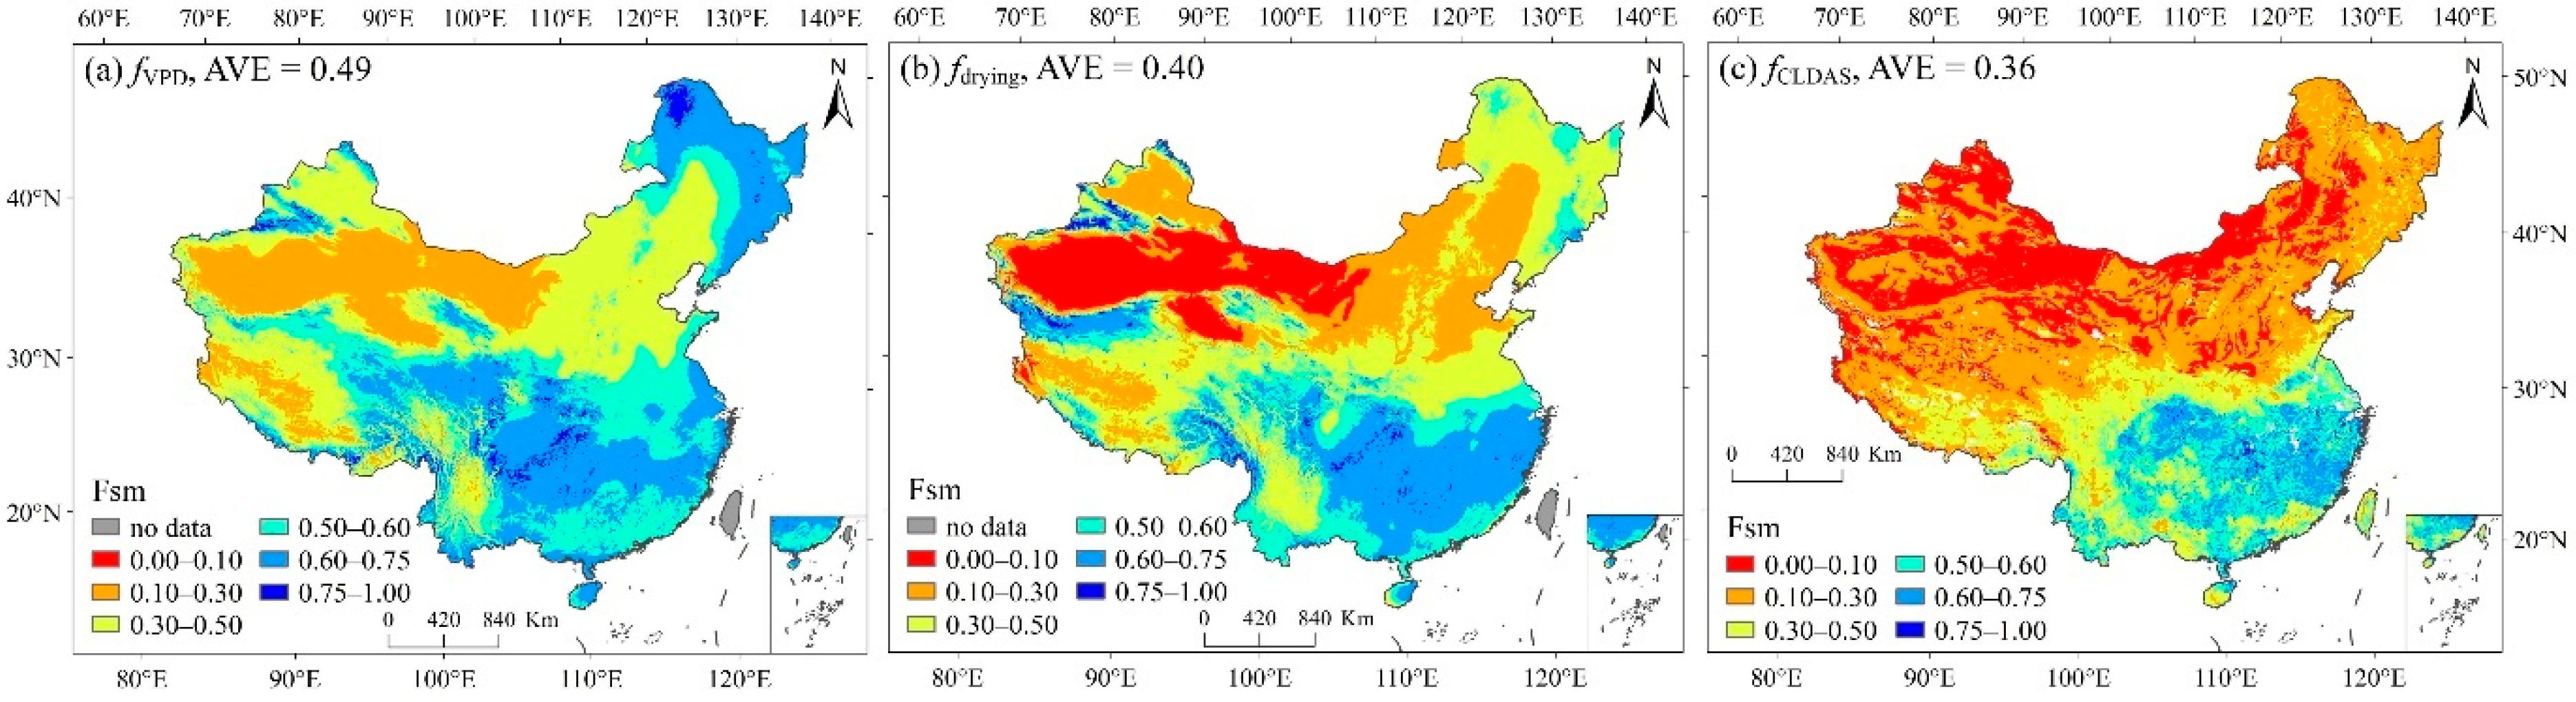
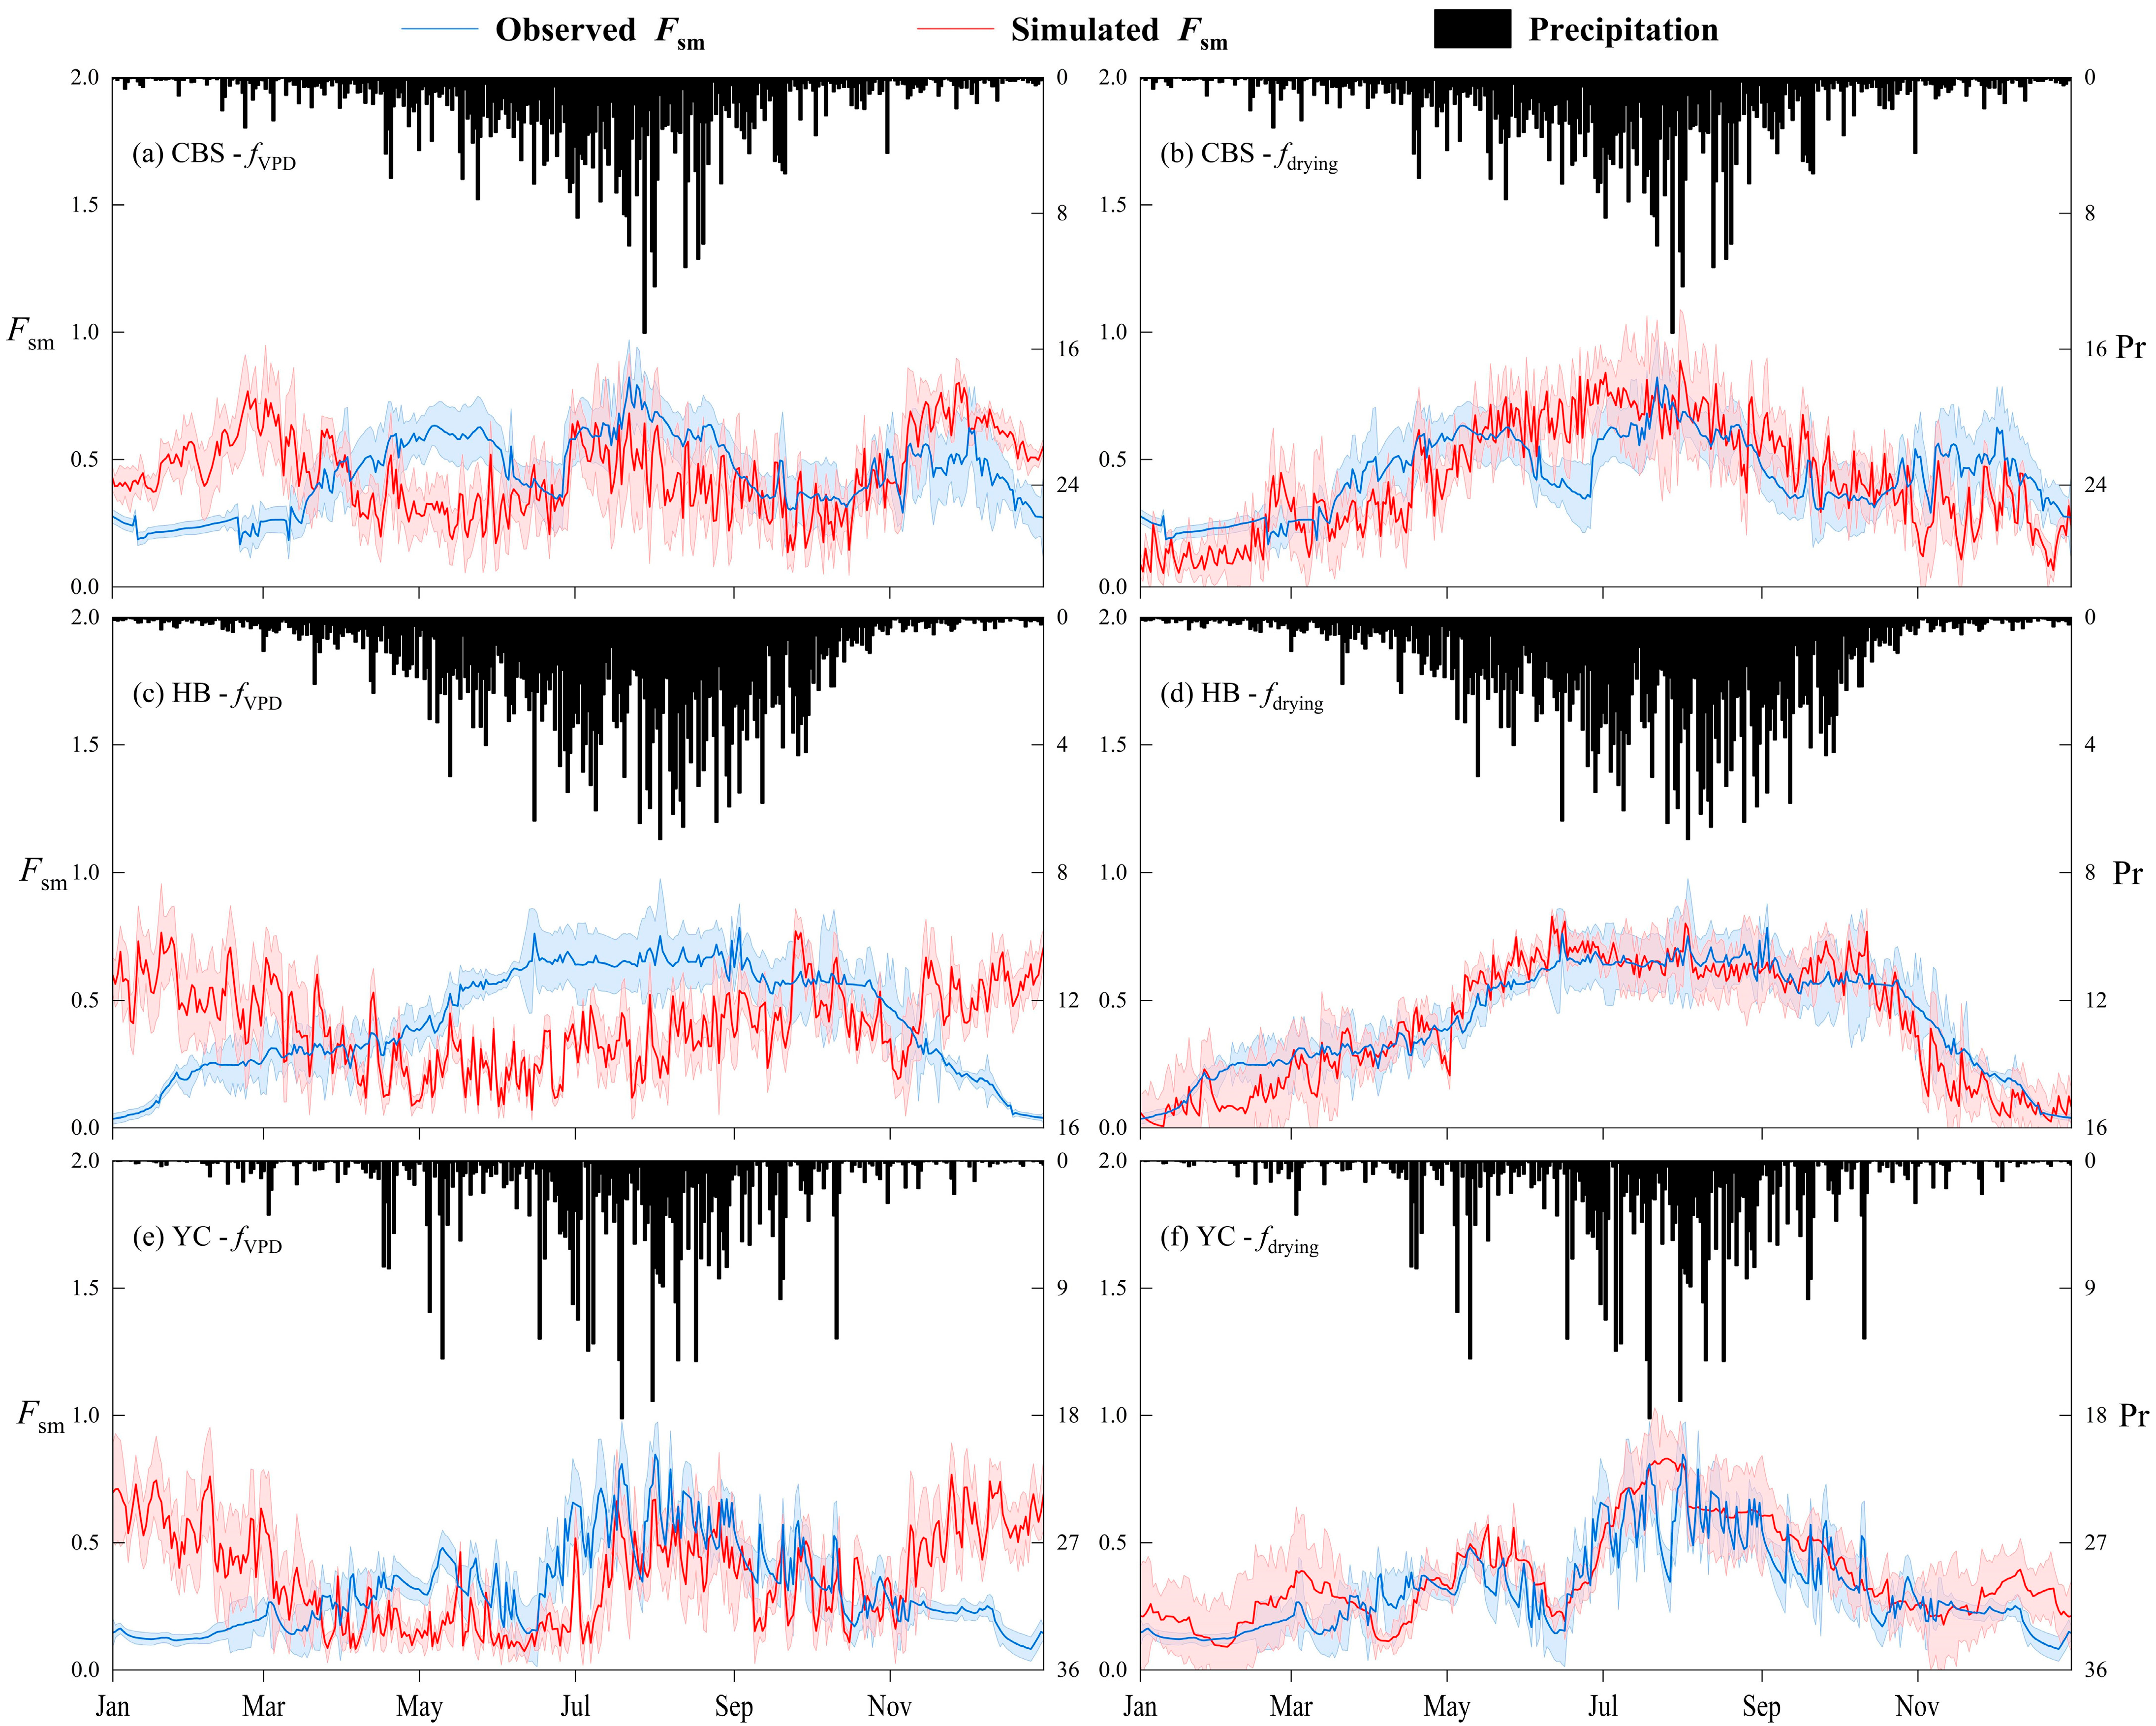
4.1. Capacities of the Two Methods in Simulating the Soil Moisture Constraint (Fsm)

Figure 6 shows the correlation between the soil moisture constraint derived from in situ measurements and the soil moisture constraint estimated by the two model methods. The observations are better correlated with the modified method than the original method. The correlation coefficient between the observations and the modified method ranges from 0.22 to 0.71, with an average value of 0.52. In contrast, the correlation coefficient between the observations and the original method ranges from −0.47 to 0.39, with a smaller average of 0.02.

4.2. The Reason for the Improved Performance of the Modified Method over the MOD16 Model

The results above indicate that the modified method provides more accurate ET estimates and is better correlated with the observations of soil moisture than the original method. To investigate the reasons for different ET estimates from the two methods, we compared the interannual variability of the soil moisture constraint between the two methods and observations at three different land cover sites (Figure 7). The interannual variability of the soil moisture constraint at three different land cover sites reveals that precipitation consistently varies with the observed soil moisture constraint, indicating a high correlation between precipitation and soil moisture. The interannual variability of the modified soil moisture constraint is consistent with that of observations (Figure 7b). However, there are large deviations in the interannual variability of the soil moisture constraint between the original method and observations (Figure 7a). These findings suggest that the modified method is superior to the original method because it accounts for the effects in the variability on precipitation to the soil moisture.

4.3. Uncertainties

This study introduced a modified soil moisture constraint algorithm to the MOD16 model and then evaluated the performance of the modified MOD16 method on ET estimations. The results show that the modified MOD16 method outperforms the original MOD16 method in ET estimations, as evidenced by higher R2 and KGE values. However, many uncertainties still exist in the original and the modified MOD16 methods. The biases in the two soil moisture constraint methods arise from several major causes.
First, the MOD16 model forcing data are a major source of uncertainty. Meteorological forcing data collected from 824 national meteorological stations are used in this study. However, the distribution of meteorological stations across China is uneven, with fewer stations located in the western and border regions compared to other regions (Figure 1). The uneven distribution of stations may potentially affect the accuracy of the interpolation of meteorological variables.
Uncertainty may arise from the inaccuracy of ET observations via eddy covariance (EC) measurements. There are two main sources of deficiencies in the EC-based ET measurements: the energy balance closure problem and the spatial mismatch between the situ EC observations and ET estimates of the model. The non-closure energy balance problem is a long-standing issue in EC-based ET estimates. Many studies have indicated that EC measurements tend to underestimate turbulent heat fluxes, and thus the energy balance is not closed [46,47]. Errors in EC-based ET measurements might affect the performance assessment of the modified MOD16 model. In addition, the spatial mismatch between in situ EC observations and ET estimates of the MOD16 model is another issue. Usually, the pix footprint of EC-based ET sites is constrained to several kilometers around the flux station, depending on the measurement height above the canopy layer and the wind speed [48]. Therefore, EC measurements over heterogeneous land surfaces may not accurately represent the grid scale average ET, causing errors in the validation results [49]. Considering the feature of spatial heterogeneity in ET estimates, the issue of scale mismatch has the potential to skew evaluation results.

5. Conclusions

To develop the accuracy of ET estimates, we introduced a modified soil moisture constraint algorithm to the MOD16 model. Then, we evaluated the performance of the original and modified method at the site and basin scales. We further compared the accuracy of the two methods in capturing soil moisture variability. The main conclusions are as follows:
(1)
Introducing the modified soil moisture method to the MOD16 model increases the accuracy of ET estimations over the original MOD16 model on both the site and basin scale. Compared to the original model, the modified model increases the R2 value by an average of 0.16 and the KGE value by an average of 0.17 on the flux site scale. On the basin scale, the modified model increases the KGE value by an average of 0.01 and decreases the bias value by an average of 3.85% compared to the original model.
(2)
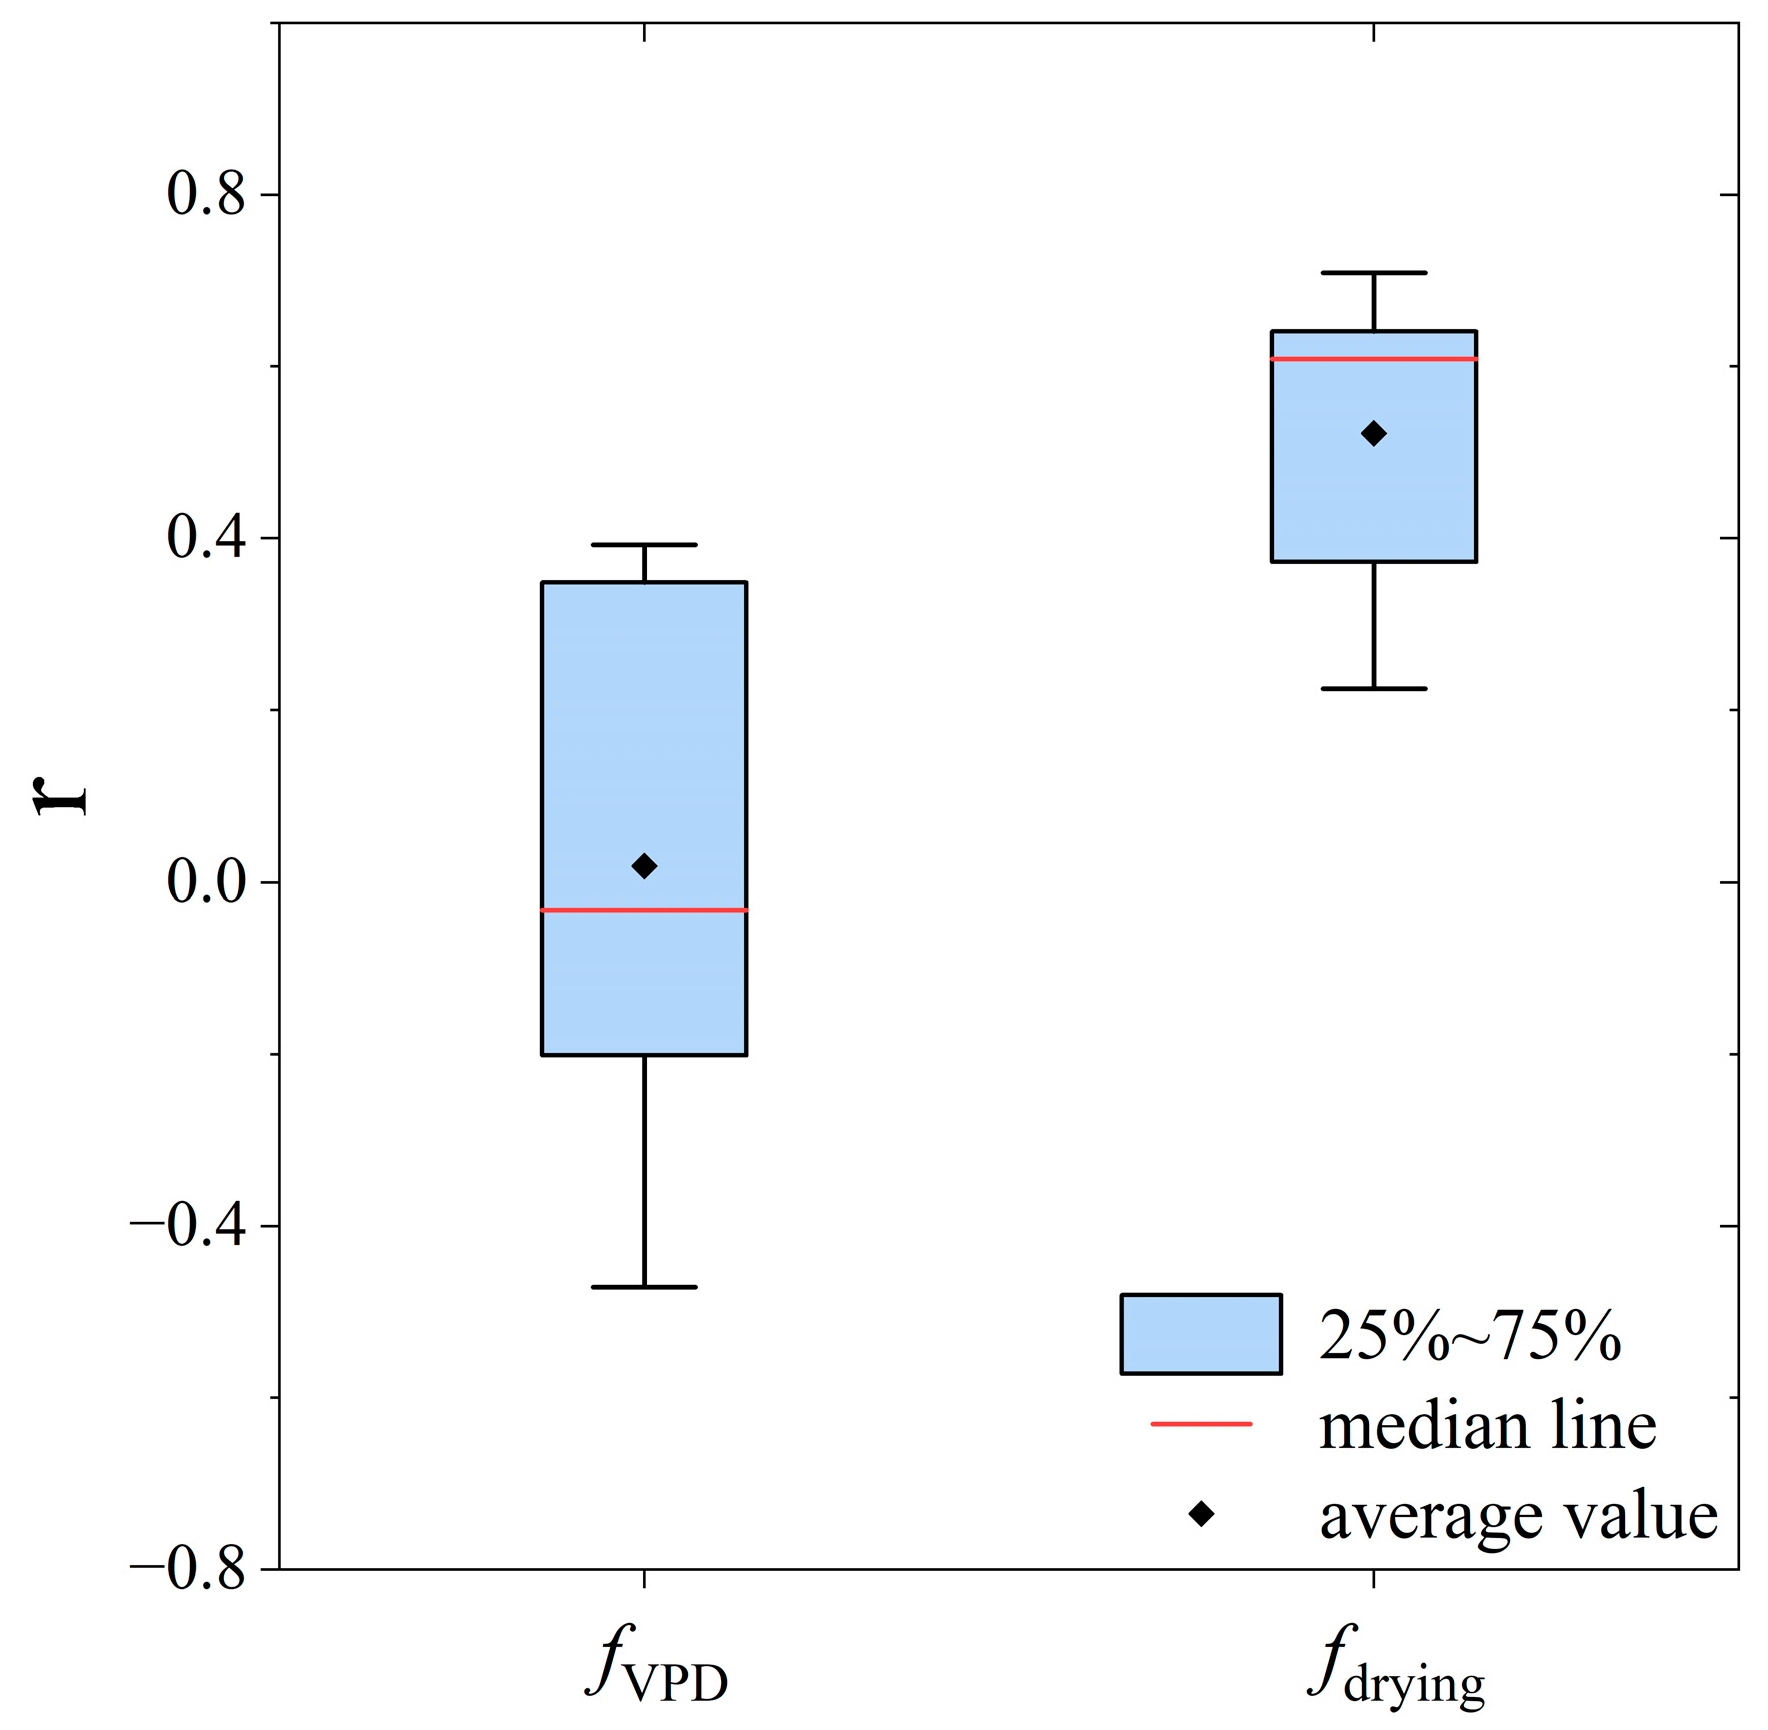
The modified method which considers the impact of precipitation has a better capacity to capture soil moisture variability than the original method. Compared to the original model, the modified model increases the correlation with observations by an average of 0.50 at all flux sites.
(3)
It is necessary to consider the impact in the variability of precipitation on soil moisture in the MOD16 model.

Author Contributions

Conceptualization, M.G.; Methodology, Z.L. and Y.H.; Data Curation, Z.L. and Y.H.; Supervision, M.G. and J.L.; Validation, Z.L. and Y.H.; Visualization, J.L.; Writing—Original Draft, Z.L.; Writing—Review and Editing, Y.H.; Funding Acquisition, M.G. and J.L. All authors have read and agreed to the published version of the manuscript.

Funding

This research was funded by the National Natural Science Foundation of China (No. 42277191 and 42107087).

Institutional Review Board Statement

Not applicable.

Informed Consent Statement

Not applicable.

Data Availability Statement

Not applicable.

Conflicts of Interest

The authors declare no conflict of interest.

References

  1. Cheng, L.; Yang, M.; Wang, X.; Wan, G. Spatial and temporal variations of terrestrial evapotranspiration in the upper Taohe River Basin from 2001 to 2018 based on MOD16 ET data. Adv. Meteorol. 2020, 2020, 3721414. [Google Scholar] [CrossRef]
  2. Zhang, K.; Zhu, G.; Ma, J.; Yang, Y.; Shang, S.; Gu, C. Parameter analysis and estimates for the MODIS evapotranspiration algorithm and multiscale verification. Water Resour. Res. 2019, 55, 2211–2231. [Google Scholar] [CrossRef]
  3. Glenn, E.P.; Huete, A.R.; Nagler, P.L.; Hirschboeck, K.K.; Brown, P. Integrating remote sensing and ground methods to estimate evapotranspiration. Crit. Rev. Plant Sci. 2007, 26, 139–168. [Google Scholar] [CrossRef]
  4. Jung, M.; Reichstein, M.; Ciais, P.; Seneviratne, S.I.; Sheffield, J.; Goulden, M.L.; Bonan, G.; Cescatti, A.; Chen, J.; de Jeu, R.; et al. Recent decline in the global land evapotranspiration trend due to limited moisture supply. Nature 2010, 467, 951–954. [Google Scholar] [CrossRef]
  5. Hu, G.; Jia, L.; Menenti, M. Comparison of MOD16 and LSA-SAF MSG evapotranspiration products over Europe for 2011. Remote Sens. Environ. 2015, 156, 510–526. [Google Scholar] [CrossRef]
  6. Mu, Q.; Zhao, M.; Running, S.W. Improvements to a MODIS global terrestrial evapotranspiration algorithm. Remote Sens. Environ. 2011, 115, 1781–1800. [Google Scholar] [CrossRef]
  7. Chang, Y.; Qin, D.; Ding, Y.; Zhao, Q.; Zhang, S. A modified MOD16 algorithm to estimate evapotranspiration over alpine meadow on the Tibetan Plateau, China. J. Hydrol. 2018, 561, 16–30. [Google Scholar] [CrossRef]
  8. Luo, Z.; Guo, M.; Bai, P.; Li, J. Different Vegetation Information Inputs Significantly Affect the Evapotranspiration Simulations of the PT-JPL Model. Remote Sens. 2022, 14, 2573. [Google Scholar] [CrossRef]
  9. Gowda, P.H.; Howell, T.A.; Evett, S.R.; Chavez, J.L.; New, L. Remote sensing of contrasting tillage practices in the Texas Panhandle. Int. J. Remote Sens. 2008, 29, 3477–3487. [Google Scholar] [CrossRef]
  10. Liu, S.; Han, Y.; Su, H. Regional Evapotranspiration Estimation by the Improved MOD16-sm Model and Its Application in Central China. Water 2022, 14, 1491. [Google Scholar] [CrossRef]
  11. Sun, L.; Liang, S.; Yuan, W.; Chen, Z. Improving a Penman–Monteith evapotranspiration model by incorporating soil moisture control on soil evaporation in semiarid areas. Int. J. Digit. Earth 2013, 6, 134–156. [Google Scholar] [CrossRef]
  12. Di Bella, C.M.; Rebella, C.M.; Paruelo, J.M. Evapotranspiration estimates using NOAA AVHRR imagery in the Pampa region of Argentina. Int. J. Remote Sens. 2000, 21, 791–797. [Google Scholar] [CrossRef]
  13. Wang, K.; Liang, S. An improved method for estimating global evapotranspiration based on satellite determination of surface net radiation, vegetation index, temperature, and soil moisture. J. Hydrometeorol. 2008, 9, 712–727. [Google Scholar] [CrossRef]
  14. Su, Z. The Surface Energy Balance System (SEBS) for estimation of turbulent heat fluxes. Hydrol. Earth Syst. Sci. 2002, 6, 85–100. [Google Scholar] [CrossRef]
  15. Allen, R.G.; Tasumi, M.; Trezza, R. Satellite-based energy balance for mapping evapotranspiration with internalized calibration (METRIC)—Model. J. Irrig. Drain. Eng. 2007, 133, 380–394. [Google Scholar] [CrossRef]
  16. Priestley, C.H.B.; Taylor, R.J. On the assessment of surface heat flux and evaporation using large-scale parameters. Mon. Weather Rev. 1972, 100, 81–92. [Google Scholar] [CrossRef]
  17. Penman, H.L. Natural evaporation from open water, bare soil and grass. Proc. R. Soc. Lond. Ser. A Math. Phys. Sci. 1948, 193, 120–145. [Google Scholar]
  18. Monteith, J.L. Evaporation and environment. Symp. Soc. Exp. Biol. 1965, 19, 205–234. [Google Scholar]
  19. Tellen, V.A. A comparative analysis of reference evapotranspiration from the surface of rainfed grass in Yaounde, calculated by six empirical methods against the penman-monteith formula. Earth Perspect. 2017, 4, 4. [Google Scholar] [CrossRef]
  20. Mu, Q.; Heinsch, F.A.; Zhao, M.; Running, S.W. Development of a global evapotranspiration algorithm based on MODIS and global meteorology data. Remote Sens. Environ. 2007, 111, 519–536. [Google Scholar] [CrossRef]
  21. Zhang, T.; Chen, Y. Analysis of dynamic spatiotemporal changes in actual evapotranspiration and its associated factors in the Pearl River Basin based on MOD16. Water 2017, 9, 832. [Google Scholar] [CrossRef]
  22. Kim, H.W.; Hwang, K.; Mu, Q.; Lee, S.O.; Choi, M. Validation of MODIS 16 global terrestrial evapotranspiration products in various climates and land cover types in Asia. KSCE J. Civ. Eng. 2012, 16, 229–238. [Google Scholar] [CrossRef]
  23. Tang, R.; Shao, K.; Li, Z.-L.; Wu, H.; Tang, B.-H.; Zhou, G.; Zhang, L. Multiscale validation of the 8-day MOD16 evapotranspiration product using flux data collected in China. IEEE J. Sel. Top. Appl. Earth Obs. Remote Sens. 2015, 8, 1478–1486. [Google Scholar] [CrossRef]
  24. Di, S.-C.; Li, Z.-L.; Tang, R.; Wu, H.; Tang, B.-H.; Lu, J. Integrating two layers of soil moisture parameters into the MOD16 algorithm to improve evapotranspiration estimations. Int. J. Remote Sens. 2015, 36, 4953–4971. [Google Scholar] [CrossRef]
  25. Duan, H.; Zhao, H.; Li, Q.; Xu, H.; Han, C. Estimation of Evapotranspiration Based on a Modified Penman–Monteith–Leuning Model Using Surface and Root Zone Soil Moisture. Water 2023, 15, 1418. [Google Scholar] [CrossRef]
  26. Brust, C.; Kimball, J.S.; Maneta, M.P.; Jencso, K.; He, M.; Reichle, R.H. Using SMAP Level-4 soil moisture to constrain MOD16 evapotranspiration over the contiguous USA. Remote Sens. Environ. 2021, 255, 112277. [Google Scholar] [CrossRef]
  27. Noguera, I.; Vicente-Serrano, S.M.; Peña-Angulo, D.; Domínguez-Castro, F.; Juez, C.; Tomás-Burguera, M.; Lorenzo-Lacruz, J.; Azorin-Molina, C.; Halifa-Marín, A.; Fernández-Duque, B. Assessment of vapor pressure deficit variability and trends in Spain and possible connections with soil moisture. Atmos. Res. 2023, 285, 106666. [Google Scholar] [CrossRef]
  28. Novick, K.A.; Ficklin, D.L.; Stoy, P.C.; Williams, C.A.; Bohrer, G.; Oishi, A.C.; Papuga, S.A.; Blanken, P.D.; Noormets, A.; Sulman, B.N. The increasing importance of atmospheric demand for ecosystem water and carbon fluxes. Nat. Clim. Chang. 2016, 6, 1023–1027. [Google Scholar] [CrossRef]
  29. Fisher, J.B.; Tu, K.P.; Baldocchi, D.D. Global estimates of the land–atmosphere water flux based on monthly AVHRR and ISLSCP-II data, validated at 16 FLUXNET sites. Remote Sens. Environ. 2008, 112, 901–919. [Google Scholar] [CrossRef]
  30. Bouchet, R. Evapotranspiration reelle at potentielle, signification climatique. Int. Assoc. Sci. Hydrol. Pub. 1963, 62, 134–142. [Google Scholar]
  31. Running, S.W.; Mu, Q.; Zhao, M.; Moreno, A. MODIS Global Terrestrial Evapotranspiration (ET) Product (MOD16A2/A3 and Year-end Gap-Filled MOD16A2GF/A3GF) NASA Earth Observing System MODIS Land Algorithm (for Collection 6); National Aeronautics and Space Administration: Washington, DC, USA, 2019; Volume 6. [Google Scholar]
  32. Morillas, L.; Leuning, R.; Villagarcía, L.; García, M.; Serrano-Ortiz, P.; Domingo, F. Improving evapotranspiration estimates in Mediterranean drylands: The role of soil evaporation. Water Resour. Res. 2013, 49, 6572–6586. [Google Scholar] [CrossRef]
  33. Hutchinson, M.F.; Xu, T. Anusplin Version 4.2 User Guide. Centre for Resource Environmental Studies; The Australian National University: Canberra, Australia, 2004; Volume 5. [Google Scholar]
  34. Milewska, E.J.; Hopkinson, R.; Niitsoo, A. Evaluation of geo-referenced grids of 1961–1990 Canadian temperature and precipitation normals. Atmos.-Ocean 2005, 43, 49–75. [Google Scholar] [CrossRef]
  35. Qian, Y.L.; Lv, H.; Zhang, Y.H. Application and assessment of spatial interpolation method on daily meteorological elements based on ANUSPLIN software. J. Meteorol. Environ. 2010, 26, 7–15. [Google Scholar]
  36. Cai, F.; Yu, H.B.; Jiao, L.L.; Tang, K.; Ming, H.Q.; Liu, B. Comparison of precision of spatial interpolation of precipitation factors: A case study in northeastern China. Resour. Sci. 2006, 28, 73–79. [Google Scholar]
  37. Allen, R.; Pereira, L.; Raes, D.; Smith, M. FAO Irrigation and Drainage Paper No. 56; Food and Agriculture Organization of the United Nations: Rome, Italy, 1998. [Google Scholar]
  38. Bai, P.; Guo, X. Development of a 60-year high-resolution water body evaporation dataset in China. Agric. For. Meteorol. 2023, 334, 109428. [Google Scholar] [CrossRef]
  39. Senay, G.; Leake, S.; Nagler, P.; Artan, G.; Dickinson, J.; Cordova, J.; Glenn, E. Estimating basin scale evapotranspiration (ET) by water balance and remote sensing methods. Hydrol. Process. 2011, 25, 4037–4049. [Google Scholar] [CrossRef]
  40. Shi, C.; Jiang, L.; Zhang, T.; Xu, B.; Han, S. Status and plans of CMA land data assimilation system (CLDAS) project. Sci. China Earth Sci. 2014, 54, 1430–1440. [Google Scholar] [CrossRef]
  41. Qin, Y.; Wu, T.; Wu, X.; Li, R.; Xie, C.; Qiao, Y.; Hu, G.; Zhu, X.; Wang, W.; Shang, W. Assessment of reanalysis soil moisture products in the permafrost regions of the central of the Qinghai–Tibet Plateau. Hydrol. Process. 2017, 31, 4647–4659. [Google Scholar] [CrossRef]
  42. Krause, P.; Boyle, D.P.; Bäse, F. Comparison of different efficiency criteria for hydrological model assessment. Adv. Geosci. 2005, 5, 89–97. [Google Scholar] [CrossRef]
  43. Du, J.; Song, K. Validation of global evapotranspiration product (MOD16) using flux tower data from Panjin coastal wetland, Northeast China. Chin. Geogr. Sci. 2018, 28, 420–429. [Google Scholar] [CrossRef]
  44. Gupta, H.V.; Kling, H.; Yilmaz, K.K.; Martinez, G.F. Decomposition of the mean squared error and NSE performance criteria: Implications for improving hydrological modelling. J. Hydrol. 2009, 377, 80–91. [Google Scholar] [CrossRef]
  45. Knoben, W.J.M.; Freer, J.E.; Woods, R.A. Inherent benchmark or not? Comparing Nash–Sutcliffe and Kling–Gupta efficiency scores. Hydrol. Earth Syst. Sci. 2019, 23, 4323–4331. [Google Scholar] [CrossRef]
  46. Mauder, M.; Foken, T.; Cuxart, J. Surface-energy-balance closure over land: A review. Bound.-Layer Meteorol. 2020, 177, 395–426. [Google Scholar] [CrossRef]
  47. Foken, T.; Wimmer, F.; Mauder, M.; Thomas, C.; Liebethal, C. Some aspects of the energy balance closure problem. Atmos. Chem. Phys. 2006, 6, 4395–4402. [Google Scholar] [CrossRef]
  48. Bai, P.; Liu, X. Intercomparison and evaluation of three global high-resolution evapotranspiration products across China. J. Hydrol. 2018, 566, 743–755. [Google Scholar] [CrossRef]
  49. Liu, S.; Xu, Z.; Song, L.; Zhao, Q.; Ge, Y.; Xu, T.; Ma, Y.; Zhu, Z.; Jia, Z.; Zhang, F. Upscaling evapotranspiration measurements from multi-site to the satellite pixel scale over heterogeneous land surfaces. Agric. For. Meteorol. 2016, 230, 97–113. [Google Scholar] [CrossRef]
Figure 1. Locations of meteorological stations (grey dots), flux stations (red stars), and 286 test basins. The letters F, G, and C assigned to flux stations represent forest, grassland, and cropland, respectively. The upper map depicts the spatial distribution of the mean annual aridity index (AI).
Sustainability 15 12460 g001
Figure 2. The spatial patterns of ET estimated by the original (a) and modified method (b), and their differences (∆ET) (c) from 1982 to 2018. AVE: national average.
Sustainability 15 12460 g002
Figure 3. The variability in interannual (a) and seasonal (b) average ET estimates by the original (black line) and the modified method (red line) from 1982 to 2018.
Sustainability 15 12460 g003
Figure 4. Scatterplots of the mean annual ET estimates at test basins. The black and red dots indicate the mean annual ET estimates from the original and modified method, respectively; the black and red solid lines represent the regression line from the original and the modified method; the dashed line represents the 1:1 line.
Sustainability 15 12460 g004
Figure 5. The spatial pattern of the soil moisture constraint (Fsm) based on the original (a) and modified methods (b) and the CLDAS soil moisture product (c).
Sustainability 15 12460 g005
Figure 6. Correlation of the soil moisture constraint (Fsm) derived from measurements and the original (fVPD) and modified methods (fdrying).
Sustainability 15 12460 g006
Figure 7. Comparison of the interannual variability of the soil moisture constraint (Fsm) between the two methods and observations at three different land cover sites. Red and blue shadows represent the standard deviation from the original method (a,c,e) and the modified method (b,d,f), respectively. Pr: precipitation (mm/day).
Sustainability 15 12460 g007
Table 1. Forcing data of the model and evaluation data.
Data TypeData NameSources
Meteorological
forcing data
Precipitationhttps://data.cma.cn/ (accessed on 10 March 2023)
Temperature
Relative humidity
Sunshine duration
Wind speed
Land surface dataAlbedo (0.05 degree)http://www.glass.umd.edu/index.html (accessed on 20 May 2023)
LAI (0.05 degree)http://www.glass.umd.edu/index.html (accessed on 20 May 2023)
Land coverhttps://lpdaac.usgs.gov/products/mcd12c1v006/ (accessed on 20 May 2023)
Evaluation dataET Flux and
Soil moisture
http://www.chinaflux.org/ (accessed on 20 March 2023), https://fluxnet.org/data/fluxnet2015-dataset/ (accessed on 2 June 2023) http://data.tpdc.ac.cn/zh-hans/special/haihe/ (accessed on 2 June 2023)
River dischargehttp://www.chinaflux.org/ (accessed on 25 May 2023)
CLDAShttps://data.cma.cn/data/detail/dataCode/NAFP_CLDAS2.0_NRT.html (accessed on 12 April 2023)
Table 2. Information on the 14 flux sites. The ecosystem type is classified based on IGBP (International Geosphere-Biosphere Programme). MF: mixed forest; ENF: evergreen needleleaf forests; GRA: grasslands; CRO: croplands; MAP: mean annual precipitation; MAT: mean annual temperature. * represents stations with soil moisture observations.
NumberStationEcosystem TypeElevation (m)MAP
(mm/year)
MAT
(°C)
Time Range
F1 *CBSMF7387133.62003–2010
F2 *CYZENF110154217.92003–2010
G1 *NMGGRA12003380.92007–2010
G2 *DXGRA43334501.32004–2010
G3DLGRA13503192.02006–2008
G4CLGRA1713157.52007–2010
G5 *HBGRA3190535−1.22003–2010
C1LCCRO5049012.92007–2013
C2 *YCCRO2858213.12003–2010
C3MYCRO3505899.32008–2010
C4HLCRO48036810.02013–2015
C5DaXingCRO2044612.62008–2010
C6GTCRO3049013.82008–2010
C7 *WSCRO3046913.72005–2006
Table 3. Validation of ET estimates from two methods at 14 flux sites. MF: mixed forest; ENF: evergreen needleleaf forests; GRA: grasslands; CRO: croplands; MAP: mean annual precipitation; MAT: mean annual temperature. fVPD represents the performance of the original method and fdrying represents the performance of the modified method. Bold columns indicate better results regarding the three assessment indictors.
NumberStationEcosystem
Type
R2KGEBias (%)
fVPDfdryingfVPDfdryingfVPDfdrying
F1CBSMF0.850.870.830.8413.875.83
F2QYZENF0.720.770.720.85−5.05−6.13
G1NMGGRA0.230.500.230.65−36.74−17.57
G2DXGRA0.280.670.220.58−15.03−34.49
G3DLGRA0.450.670.520.77−3.78−4.75
G4CLGRA0.460.720.500.72−27.09−21.98
G5HBGRA0.440.750.310.45−17.74−42.74
C1LCCRO0.630.660.690.76−13.65−14.32
C2YCCRO0.570.620.650.71−13.19−18.71
C3MYCRO0.770.780.750.864.211.24
C4HLCRO0.550.760.540.78−18.62−16.44
C5DaXingCRO0.290.500.250.48−45.87−38.88
C6GTCRO0.680.760.780.853.67−4.96
C7WSCRO0.430.520.550.64−18.34−20.28
Average0.520.680.540.71−13.81−16.73
Disclaimer/Publisher’s Note: The statements, opinions and data contained in all publications are solely those of the individual author(s) and contributor(s) and not of MDPI and/or the editor(s). MDPI and/or the editor(s) disclaim responsibility for any injury to people or property resulting from any ideas, methods, instructions or products referred to in the content.

