Article

Mechanical Properties and Strength Characteristics of Rock–Coal–Rock Assemblages under Different Peripheral Pressures

School of Mining Engineering, Anhui University of Science and Technology, Huainan 232001, China
*
Authors to whom correspondence should be addressed.
Sustainability 2023, 15(16), 12463; https://doi.org/10.3390/su151612463
Submission received: 25 July 2023 / Revised: 10 August 2023 / Accepted: 14 August 2023 / Published: 16 August 2023
(This article belongs to the Special Issue Green and Scientific Design of Deep Underground Engineering)

Abstract

:
To investigate the deformation and damage characteristics of internal coal bodies of small pillars under different pressures, rock–coal–rock assemblage samples were subjected to the conventional triaxial compression test to analyze the mechanical behavior characteristics under different pressures. The results showed that, with the increase in peripheral pressure, the peak strength and modulus of elasticity of the assemblage specimens increased, the range of fracture compaction stage gradually decreased, and the specimen was gradually transformed from brittle to ductile. With an increase in peripheral pressure, the residual strength gradually increased, and the strength decay coefficient gradually decreased. The strength decay coefficient decreased the most at 0–10 MPa, and this decrease slowed down after exceeding 15 MPa. When the peripheral pressure was 0 MPa, the damage degree of the coal pillar was larger. With the increase in peripheral pressure, the number of cracks in the coal column increased, the damage degree increased more, and mixed damage characteristics of tension–shear were found. Based on the Hoek–Brown criterion, the strength criterion applicable to the specimen of rock–coal–rock combination was obtained through numerical fitting iteration, which provides an experimental and theoretical basis for realizing the stability control of small coal columns.

1. Introduction

With the gradual depletion of shallow mineral resources, resource development is constantly moving towards deeper parts of the earth, and the exploitation of kilometer-deep wells has gradually become the new normal of resource development [1,2]. In recent years, a large number of engineering practices have proven that the destruction of coal–rock is not only affected by the respective mechanical parameters of coal rock but also related to the structure of the coal–rock assemblage. The top plate, coal pillar, and bottom plate together form a rock–coal–rock assemblage, a ternary body mechanics equilibrium system. With the optimization of mining methods, its stress state is constantly changing [3]. The damage to the rock–coal–rock assemblage is not only affected by the damage to coal–rock monomers but also by the structure of the rock–coal–rock assemblage. In the high-stress environment in deep parts of mines, many disasters are essentially the result of the overall destructive destabilization of the rock–coal–rock assemblage system [4]. The deformation and damage characteristics of small coal pillars in deep parts of mines are a scientific problem that urgently needs to be solved.
At present, many scholars at home and abroad have carried out uniaxial and conventional triaxial compression tests on single rock bodies, coal bodies, and coal–rock binary and ternary combinations, and have conducted in-depth studies on the deformation and damage of coal–rock binary and ternary combinations. Liu et al. [5] conducted uniaxial and triaxial compression tests at 8, 16, and 25 MPa on coal–rock monoliths using MTS815 to investigate the strength and deformation characteristics of coal–rock under different peripheral pressures. Zheng et al. [6] analyzed the effect of the number of layers on the compressive properties of coal–rock binary assemblage through uniaxial compression experiments. They used a stress monitoring system, DIC, and acoustic emission system to collect and analyze the stress–strain characteristics, the evolution of the surface strain field, and the acoustic emission characteristics during the experimental process. Weijian Yu et al. [7] analyzed the loading damage law of rock–coal–rock assemblage with different height ratios using a uniaxial loading test. Zhu et al. [8,9] used computerized tomography and X-ray scanning to analyze microscopic defects in concrete specimens, thereby predicting and identifying changes in the strength properties of concrete and reinforced concrete structures. Chen Guangbo et al. [10] carried out axial compression tests on 19 binary and ternary composites with different coal–rock ratios and combinations to investigate their effects on the mechanical properties and damage mechanisms. Zuo Jianping [11] and Song Hongqiang [12] investigated the post-peak progressive damage characteristics of rock–coal–rock assemblages using a nonlinear model and a stress–strain relationship model and examined the brittleness characteristics of rock–coal–rock assemblages through uniaxial and triaxial tests. Guo Dongming et al. [13], Dou Linming et al. [14], Liu Bo et al. [15], Fa et al. [16], and Liu et al. [17] conducted uniaxial compression tests on coal–rock monoliths and their binary assemblages to analyze the mechanical properties of the assemblages and the positive correlation between the strength of the intermediate coal body and the overall strength. Yang YJ et al. [18] and Liu QS et al. [19] investigated the deformation and damage characteristics of coal–rock binary assemblies under conventional triaxial action. Zuo et al. [20] analyzed the deformation and damage characteristics of rock–coal–rock assemblies with a weak coal inclusion by means of uniaxial and triaxial tests, and Guo et al. [21] analyzed the effect of different coal thicknesses on the mechanical behavior and damage characteristics of rock–coal–rock assemblages with a PFC2D numerical simulation. Recently, many scholars have proposed a variety of strength criteria to characterize the stability of rock strength by means of conventional triaxial compression experimental data. Raflai [22] characterized the stability of rock structures by means of a representative strength damage criterion. For example, the Mohr–Coulomb strength criterion proposed by Labuz et al. [23] can be used to describe the shear damage pattern of the material under positive stress. The H–B criterion and GH–B strength criterion proposed by Hoek et al. [24,25] can further accurately respond to the intrinsic properties of the rock body and the effect of structural surfaces on the strength of the rock body.
Most of the abovementioned scholars’ research is based on coal–rock monomers and coal–rock binary combinations and has achieved much in terms of deformation and failure characteristics under uniaxial or conventional triaxial compression tests. With the increase in mining depth, due to the existence of high stress at greater depths, many coal–rock structures under different confining pressure conditions are damaged based on the rock–coal–rock ternary structure of the roof, coal pillar, and floor. However, there is a lack of research on rock–coal–rock ternary combinations under different confining pressure conditions, and on the mi and s empirical parameters of the Hoek–Brown strength criterion suitable for rock–coal–rock combinations.
This paper presents a structural model of a rock–coal–rock ternary assemblage on the basis of previous research, as shown in Figure 1. Conventional triaxial compression tests were conducted on the rock–coal–rock assemblage to study its mechanical properties and damage characteristics under different peripheral pressure conditions to reveal its strength characteristics and damage trends, obtain the strength criterion of the ternary assemblage based on the modification of H–B, predict the damage trend, and provide a further theoretical basis for understanding the destructive behavior of the small coal pillars and the fissure evolution of small coal pillars in deep coal mines.

2. Triaxial Compression Test of Rock–Coal–Rock Combination

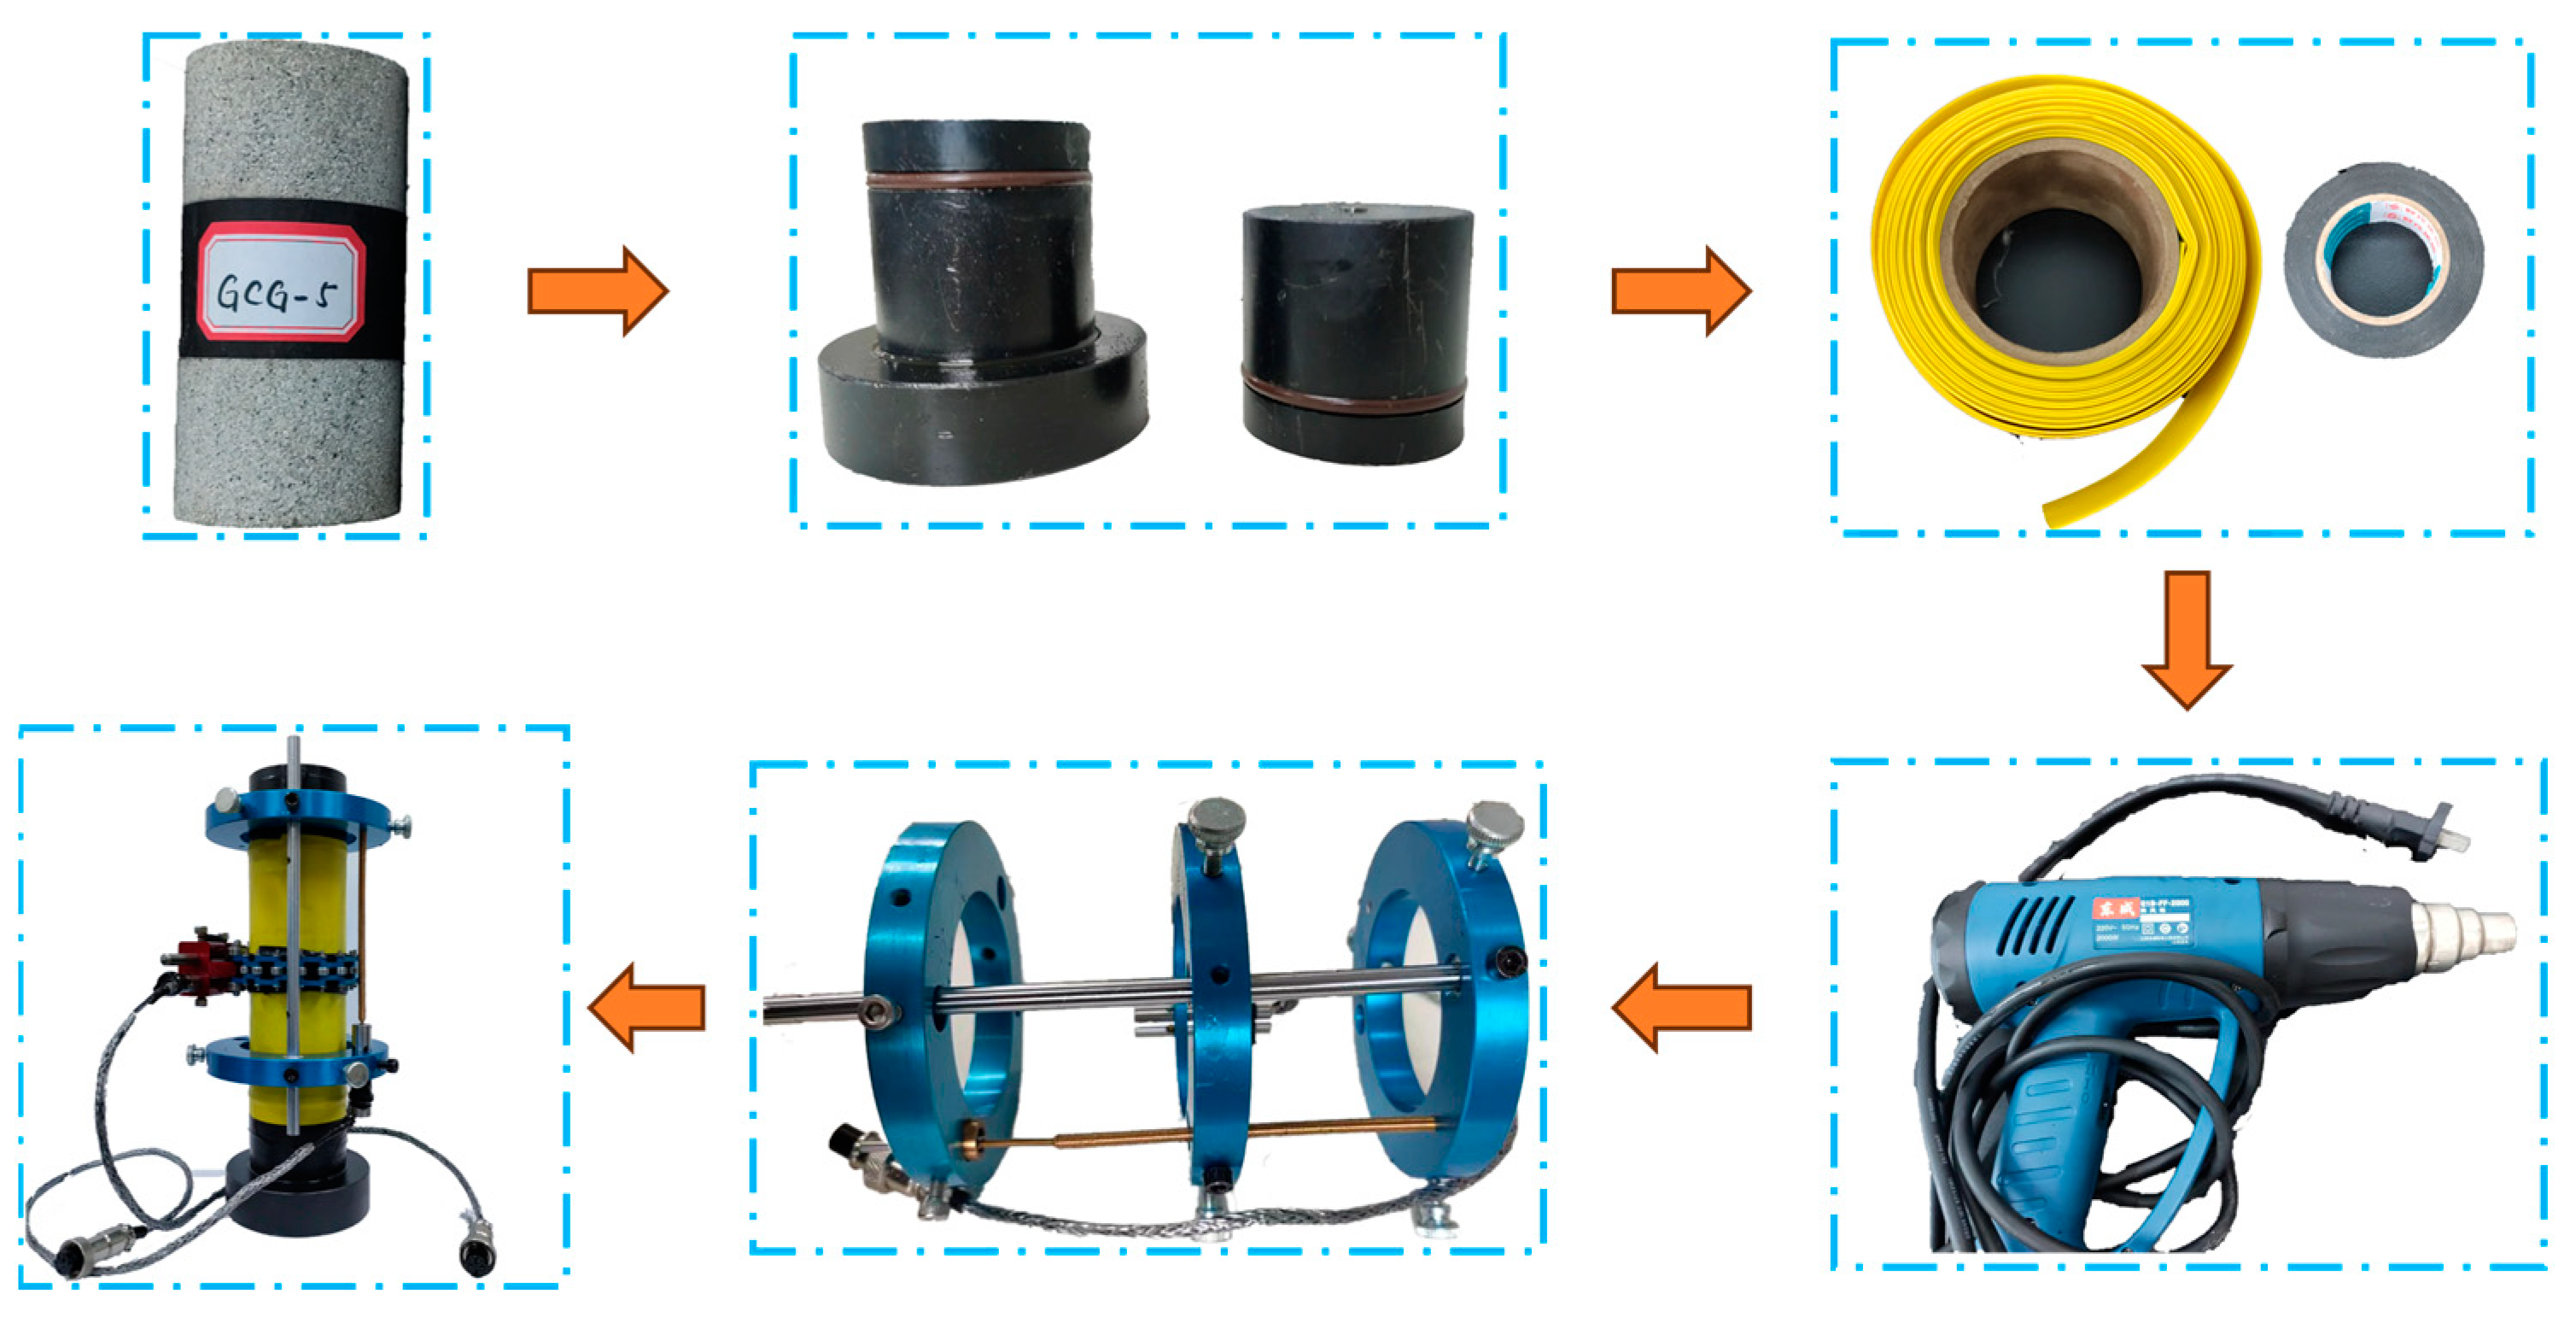
2.1. Preparation of Rock–Coal–Rock Composite Specimen

The coal and rock used in the test were taken from the 21,216 working face of the Xieqiao mining area in Huainan, Anhui Province. The mining level is −810 m, the average coal thickness is 3.0 m, and the direct roof and direct bottom are coarse sandstone. The coarse sandstone stones and coal pillars were processed into cylinders with a diameter of 50 mm and different heights by scoring machines, cutting machines, and grinding machines. During processing, the non-parallelism and non-perpendicularity of the end faces of coal–rock single specimens and coal–rock composite specimens are required to meet the requirements of GB/T23561.7-2009. According to the theoretical model of rock–coal–rock combination in Figure 1, the coarse sandstone and coal pillar were bonded to the standard specimen of Φ50 mm × 100 mm using high-strength mica glue in the following order: coarse sandstone, coal pillar, coarse sandstone. Among them, the height ratio of coarse sandstone and coal pillar is strictly guaranteed to be 1:1:1, as shown in Figure 2. At the same time, the uniaxial compression samples of rock and coal were prepared, and the basic physical and mechanical parameters of coal–rock mass were measured, as shown in Table 1. The combination specimen was labeled GCG-B-A; G represents coarse sandstone, C represents coal pillar, B represents confining pressure, and A represents the specimen number. For example, GCG-0-1 is the uniaxial compression test of sample No. 1 of rock–coal–rock under 0 MPa confining pressure.

2.2. Test System and Test Scheme

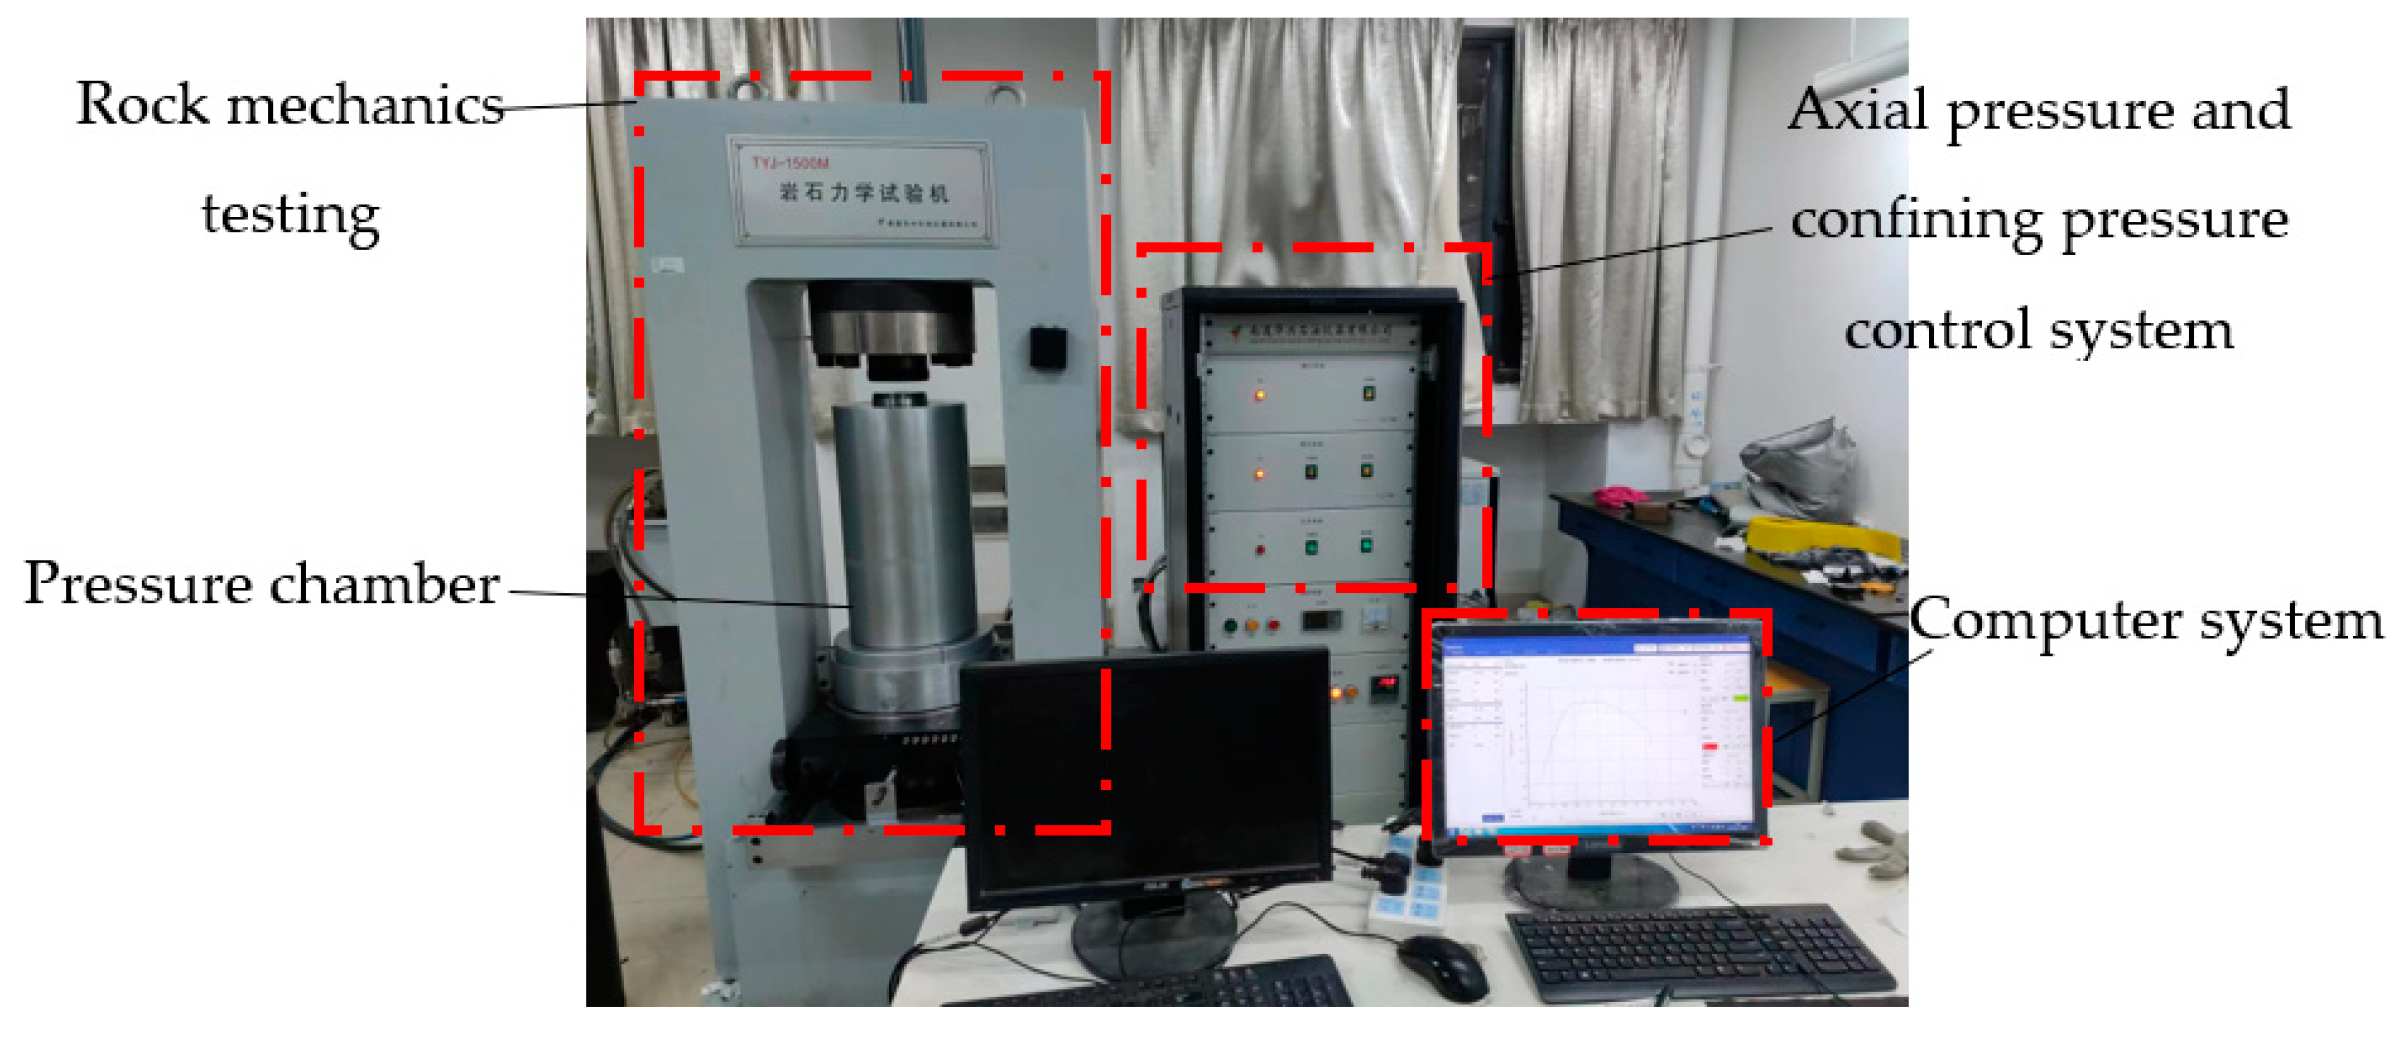
2.2.1. Testing System

The test instruments were a Hai Chuang high-tech HC-U81 multi-functional concrete ultrasonic detector and a TYJ-1500 M rock mechanics testing machine, as shown in Figure 3 and Figure 4. The sampling interval of the HC-U81 wave velocity meter is 0.025~2000 μs, the sampling length is 512 points~2048 points, the receiving sensitivity is no higher than 10 μV, the acoustic time measurement range is 0~99,999 μs, the amplitude measurement range is 0~170 dB, the emission pulse width is 0.1~100 μs, and the depth measurement range is 5~500 mm. In the test, the longitudinal vibration transducer of the composite structure was used to clamp the two ends of the specimen. The sound wave is emitted from one end of the transducer and received from the other end so as to record the average sound velocity of the wave through the specimen, measuring its homogeneity and the amount of defects. The maximum axial force of the TYJ-1500 M rock mechanics test machine is 2000 kN, the accuracy of the test force was controlled to within ±1%, the resolution of the test force, deformation, and confining pressure is 1/180,000, the maximum displacement of the axial piston is 150 mm, the displacement accuracy is controlled to within ±5% FS, the displacement resolution is 5μm, the axial deformation measurement range is 0~10 mm, the deformation measurement accuracy is controlled to within ±5% FS, the maximum confining pressure is 100 MP, and the confining pressure accuracy is controlled to within ±2%.

2.2.2. Test Scheme

Before the triaxial compression experiment, the homogeneity of the rock–coal–rock standard sample was detected by the wave velocity instrument to prevent the experimental error caused by the sample-making process. The test results of the wave velocity instrument are shown in Table 2 below. The five samples GCG-0-1, GCG-5-3, GCG-10-3, GCG-15-3, GCG-20-3 were found to have higher sound velocity and smaller average sound velocity error, and better homogeneity.
The TYJ-1500 M rock mechanics testing machine was used to apply axial pressure to the specimen, and the computer system was used to detect the data changes in real-time. Firstly, the specimen was installed, the heat-shrinkable pipe sleeve was used at the junction of the specimen and the pressure pad, and the hot air gun was used to shrink the fixed effect to prevent the penetration of the confining pressure oil body from affecting the strength of the specimen. At the interface between the specimen and the lower pressure pad and the upper pressure block, black insulating tape was used to further increase the compactness. Secondly, the specimen was fixed using the eight-jaw extensometer, and the axial extensometer was installed. The axial deformation data of the specimen was collected by the axial extensometer. The specimen was installed as shown in Figure 5. The loading process was controlled by load, and the loading rate was kept at 0.02 kN/s until the specimen was loaded. The loading rate of confining pressure in the triaxial compression test was 0.5 MPa/s.

3. Experiment Results and Analysis

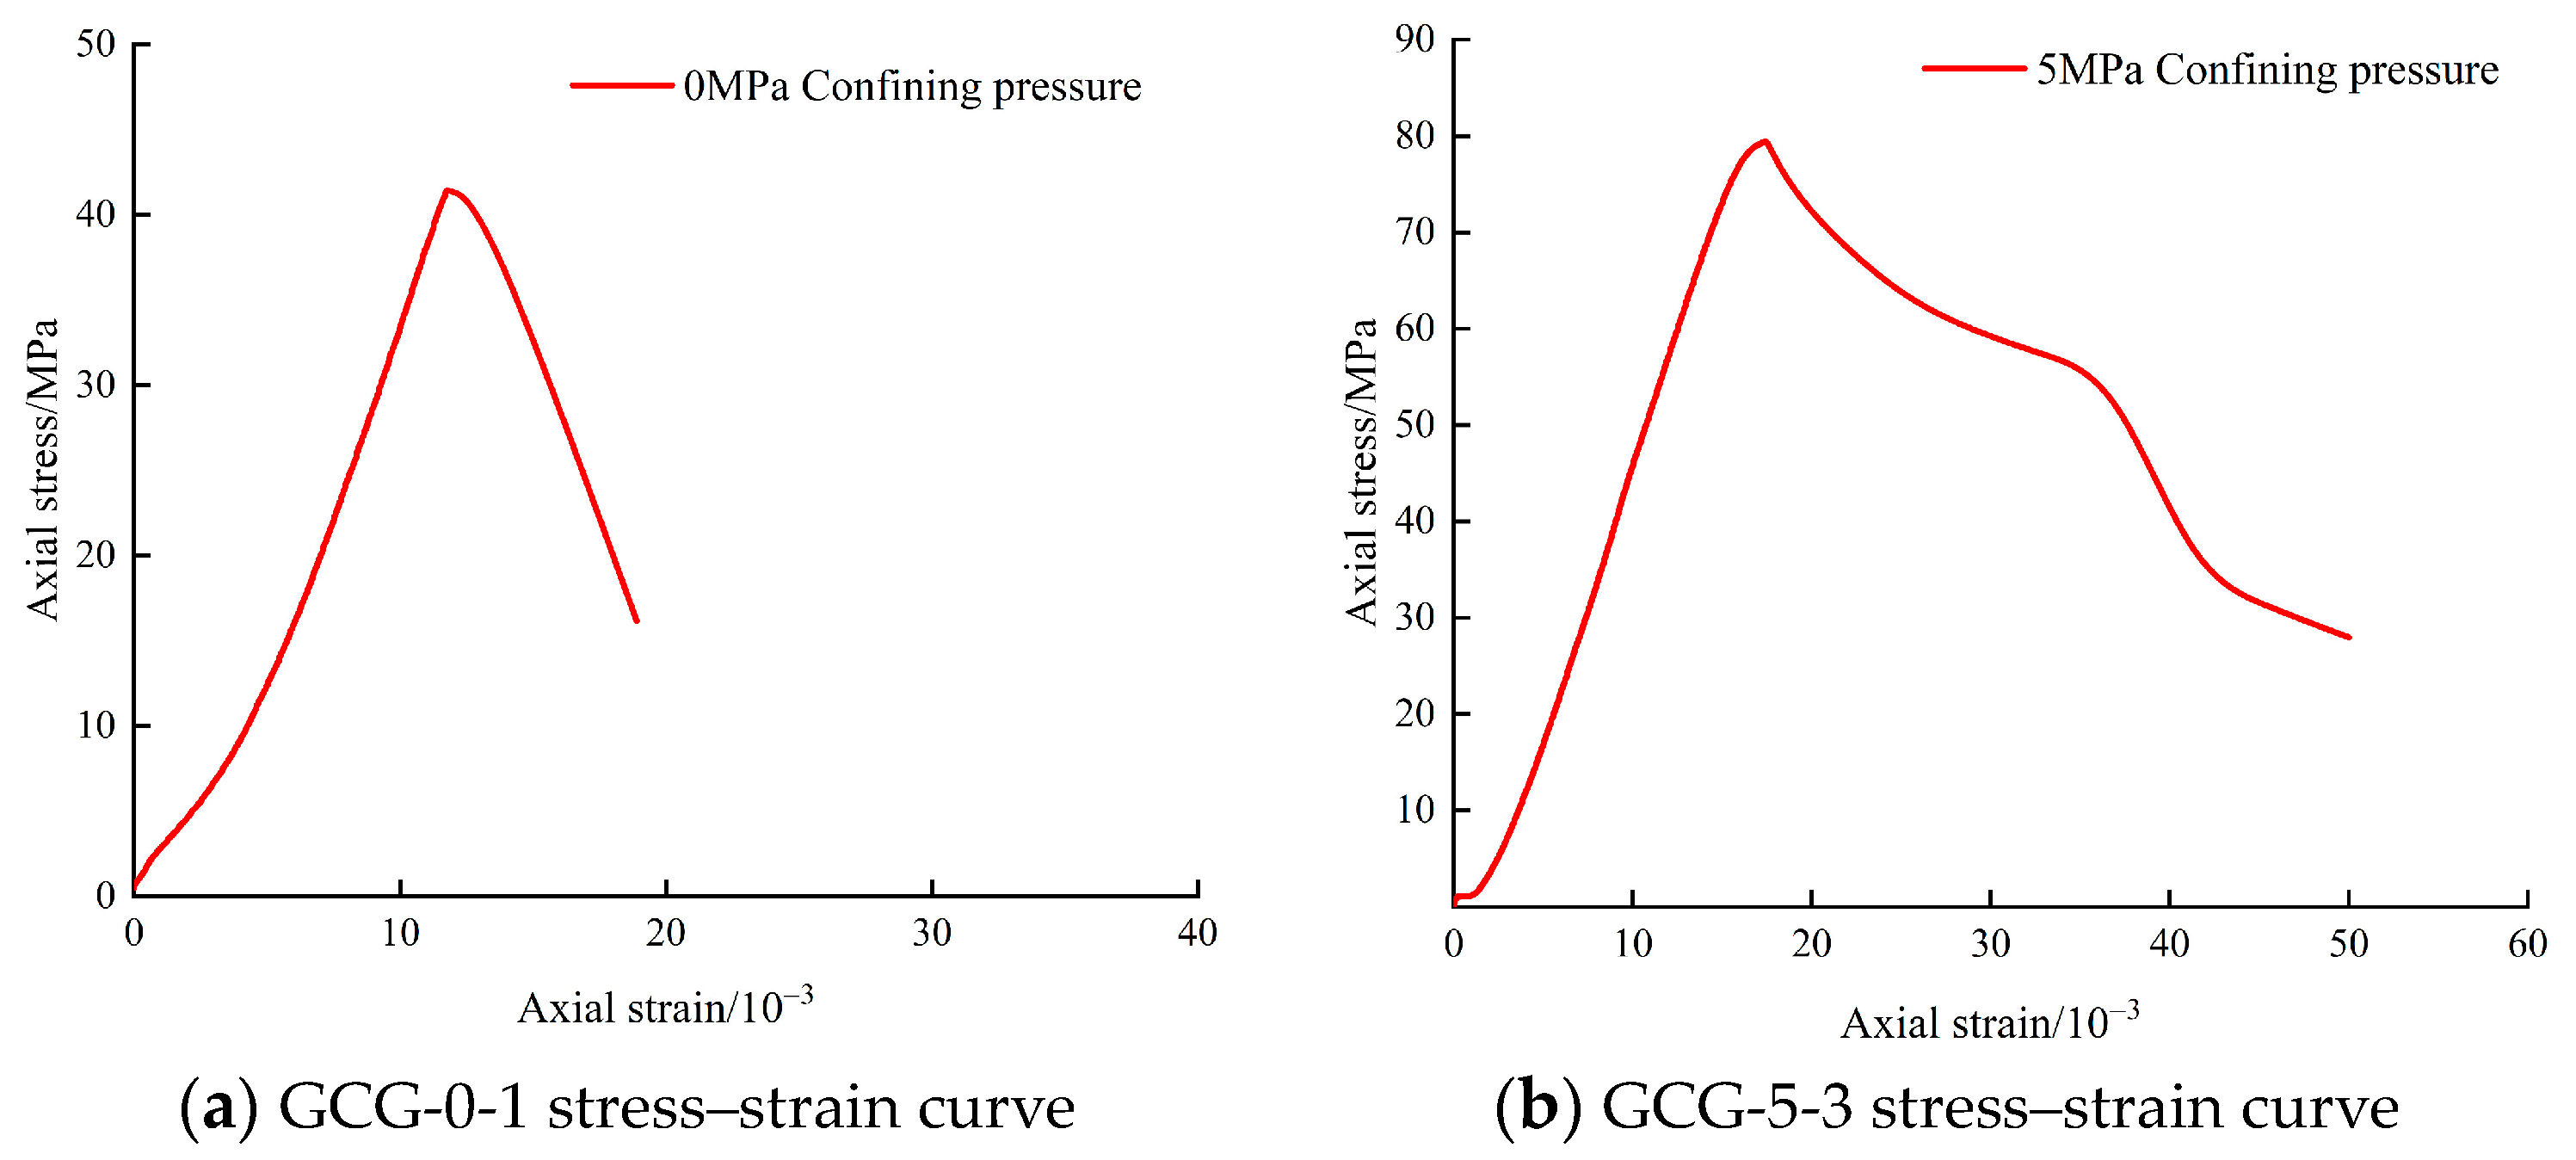
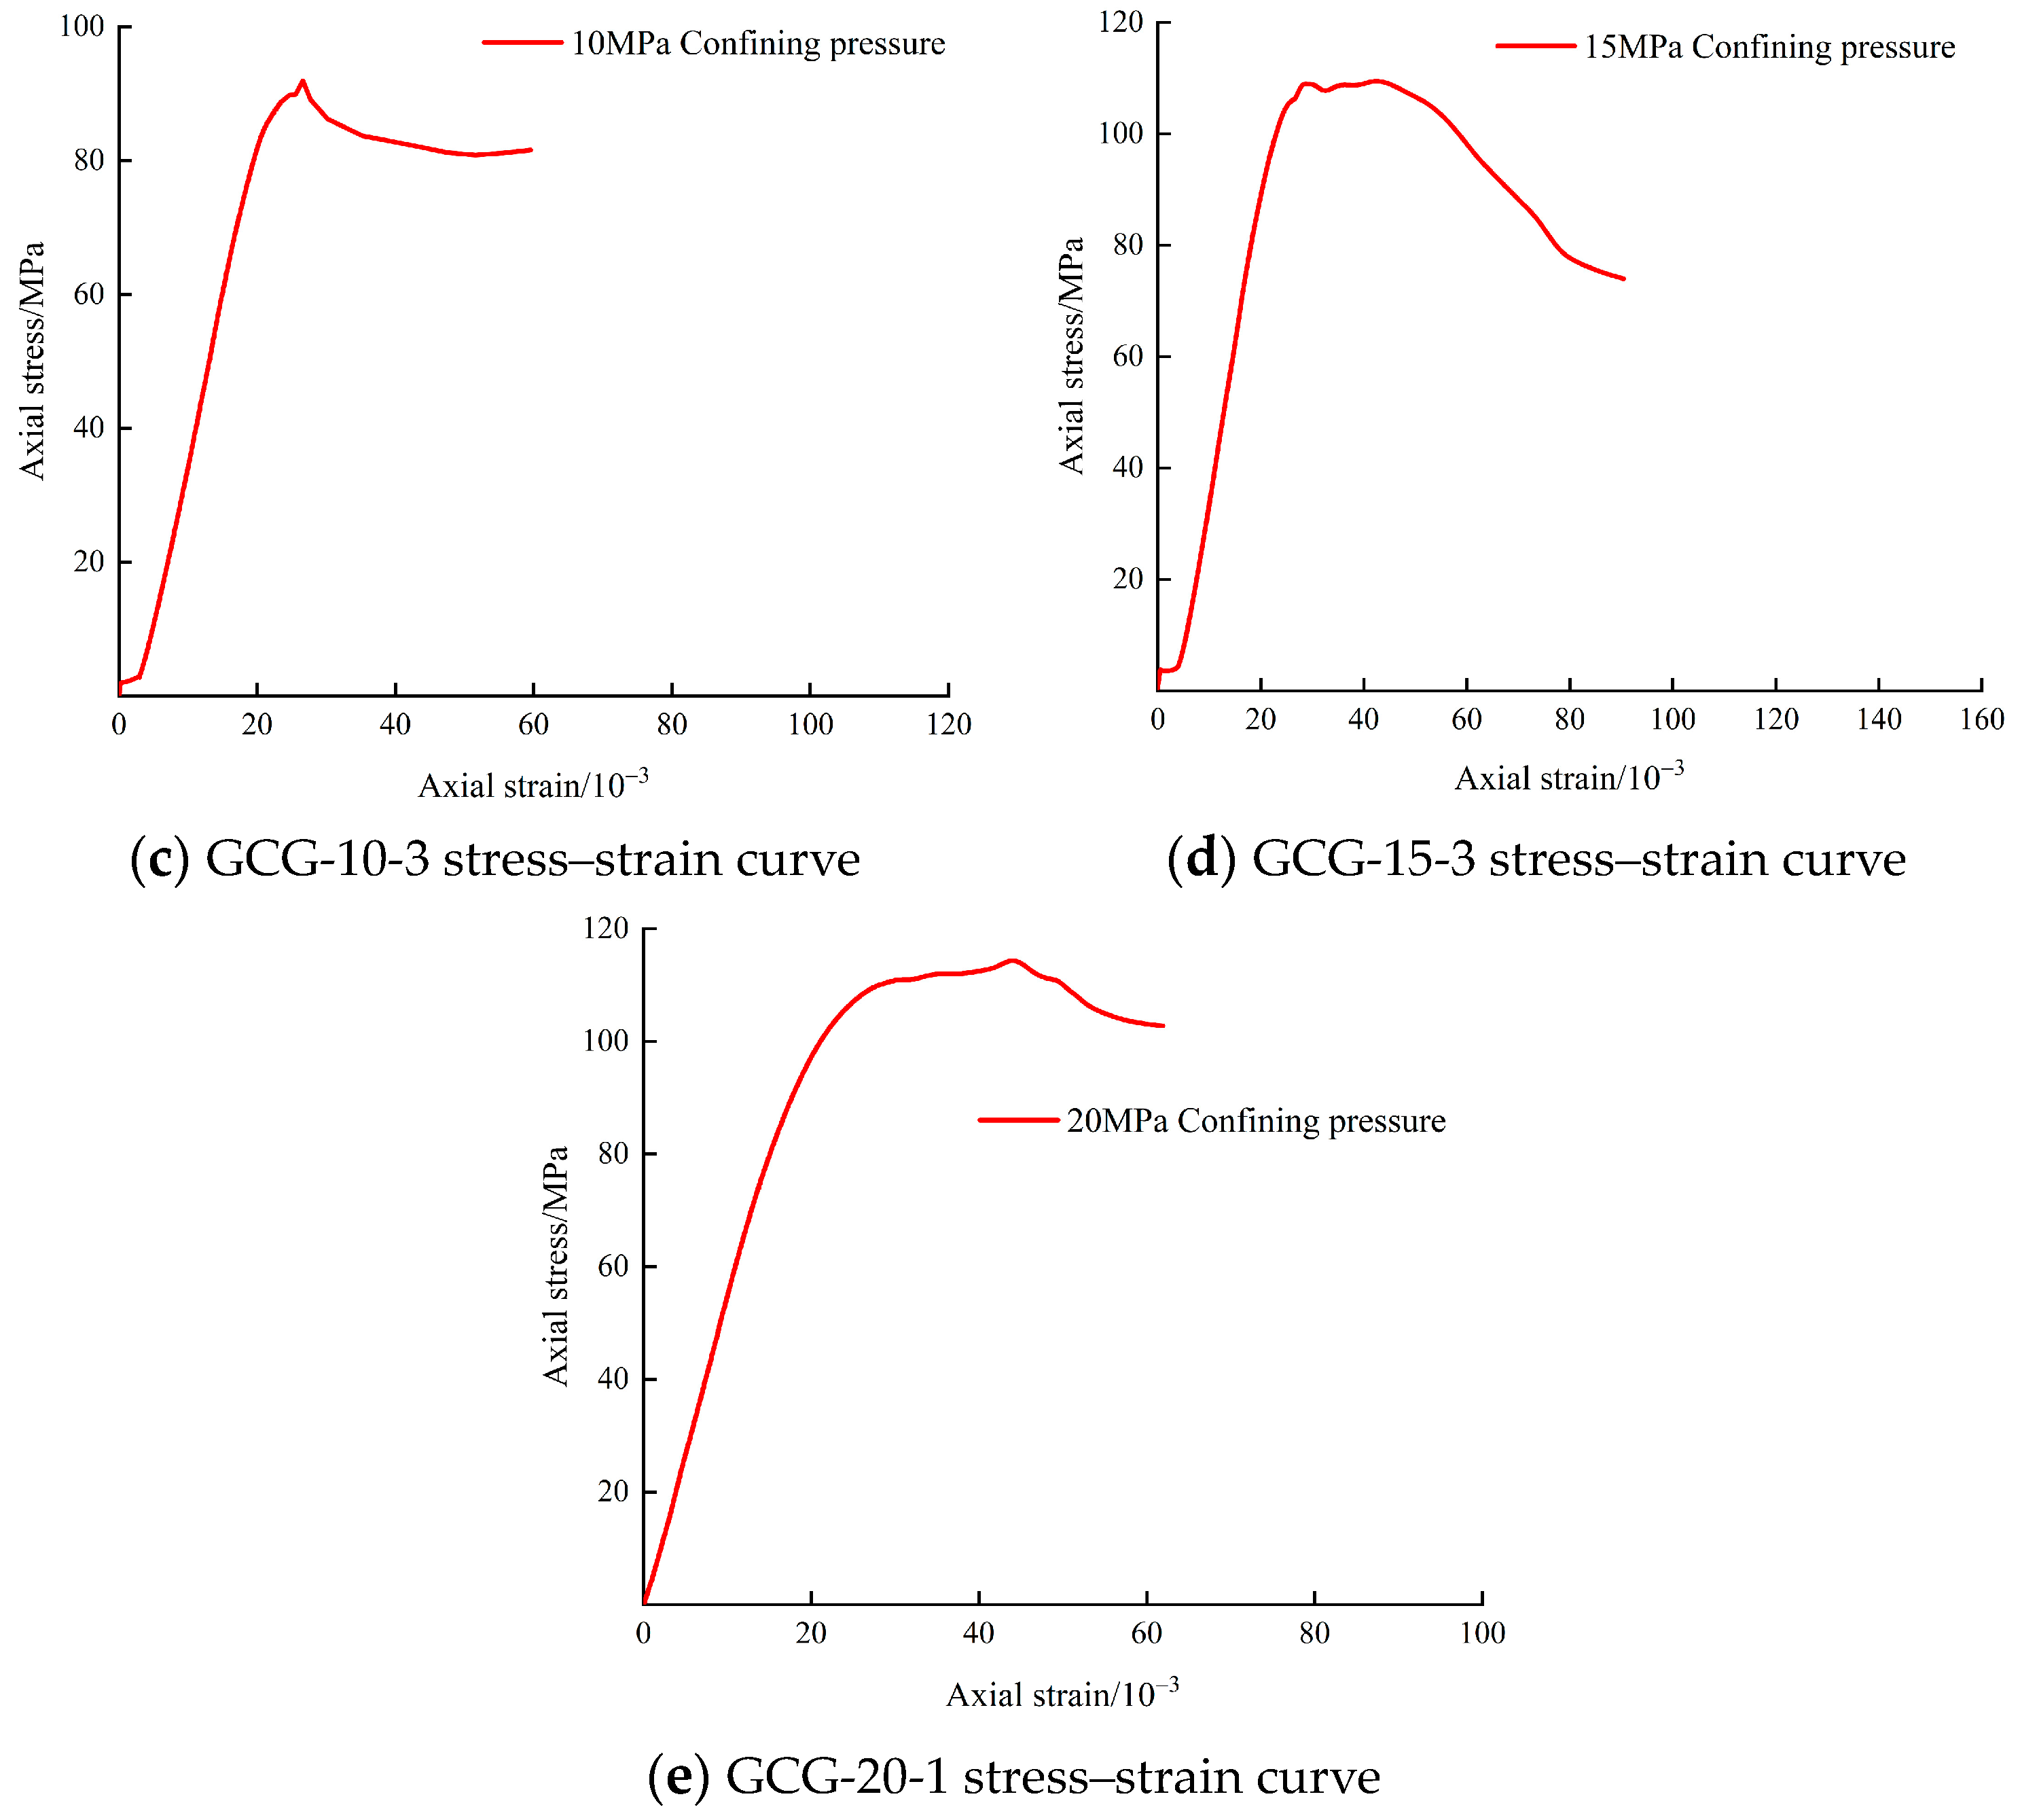
3.1. Analysis of Mechanical Properties of Coal–Rock–Coal Combination

The results of the triaxial compression test are shown in Table 3 below. E is the elastic modulus, and the linear slope is obtained by calculating the elastic stage of the stress–strain curve of the corresponding sample. The σ1, σ3, and σr express the axial peak strength, confining pressure, and residual strength of the composite specimen, respectively, and ε is the axial peak strain of the composite specimen.
According to the experimental results shown in Table 1 and Table 3, the relationship between the elastic modulus and confining pressure of different coal–rock combinations can be obtained, as shown in Figure 6. It can be seen from this figure that, under the confining pressure of 0 MPa, the elastic modulus of the single rock is higher than that of the coal–rock combination, and the elastic modulus of the single coal is the smallest. When the confining pressure is less than 15 MPa, the elastic modulus of the coal–rock combination is linear with the confining pressure. The size of the elastic modulus of the combination increases with the increase in the confining pressure, and the increase is more intense in the 5–10 MPa stage. In the 10–15 MPa stage, the increasing trend becomes smaller. At more than 15 MPa, the elastic modulus changes little and remains almost unchanged.
The stress–strain curves under different confining pressure conditions obtained through the triaxial compression test are shown in Figure 7. The samples shown in Figure 7 are GCG-0-1, GCG-5-3, GCG-10-3, GCG-15-3, and GCG-20-1. The elastic modulus of GCG-10-3, GCG-15-3, and GCG-20-1 is 11.02, 12.23, and 12.52 GPa, respectively. It can be seen from Figure 7 that the change in coal–rock combinations can be presented as a crack compaction stage, elastic stage, yield stage, and post-peak softening stage. With the application of confining pressure, the change in the crack compaction stage is not obvious. The initial stage of 10 MPa and 15 MPa is caused by the slow loading rate. The actual compaction stage has been greatly shortened compared with 0 MPa and 5 MPa. In the uniaxial compression test on the single coal and single rock samples, the post-peak stage of the stress–strain curve is almost at 0, and the sudden stress drop causes the residual strength to almost reach 0. Under a confining pressure of 5 MPa~20 MPa, the yield stage of the coal–rock combination is more obvious than that under the confining pressure of 0 MPa, and there is an obvious ductile failure phenomenon in the post-peak softening stage. According to Paterson et al. [26], the rock needs a larger confining pressure if it is to realize the transition from brittleness to ductile rupture. The size of the confining pressure is no less than 70 MPa. However, in this experiment, under the confining pressure of 5 MPa, there is a change in characteristics from brittleness to ductility. The reason for this may be that the strength of the middle coal body is low, and with the application of confining pressure, the strength of the coal body is greatly affected. The destruction of the coal–rock combination is mainly affected by the change in the strength of the middle coal body [7], which leads to the ductile transformation of the coal body being reflected in the coal–rock combination as a whole.
According to the test results in Table 3, the relationship between confining pressure and axial peak strength, and axial peak strain can be obtained, as shown in Figure 8 and Figure 9. Figure 8 shows that, with the increase in confining pressure, the axial peak strength of the coal–rock combination gradually increases. In the stage of 0~10 MPa, the peak strength changes greatly, and the peak strength changes slowly in the stage of 10~15 MPa. After 15 MPa, the peak strength changes are not obvious. It can be concluded that 10~15 MPa is a critical area where the peak strength is affected under the confining pressure of the coal–rock combination. Beyond this area, the peak strength change will slow down.
From Figure 9, it can be concluded that when the confining pressure is less than 15 MPa, the axial peak strain of the combination increases linearly with the increase in confining pressure. Under the condition of 0~10 MPa confining pressure, the peak strain growth trend is relatively slow. When the confining pressure reaches 10~15 MPa, the peak strain increases sharply. When the confining pressure is higher than 15 MPa, although the peak strain decreases abruptly, the change is relatively slow. It can be seen that the confining pressure of 15 MPa is a critical value for the change in peak strength and peak strain of the coal–rock combination, and 10~15 MPa is the critical range of change.

3.2. Analysis of Coal–Rock Failure Characteristics and Residual Strength

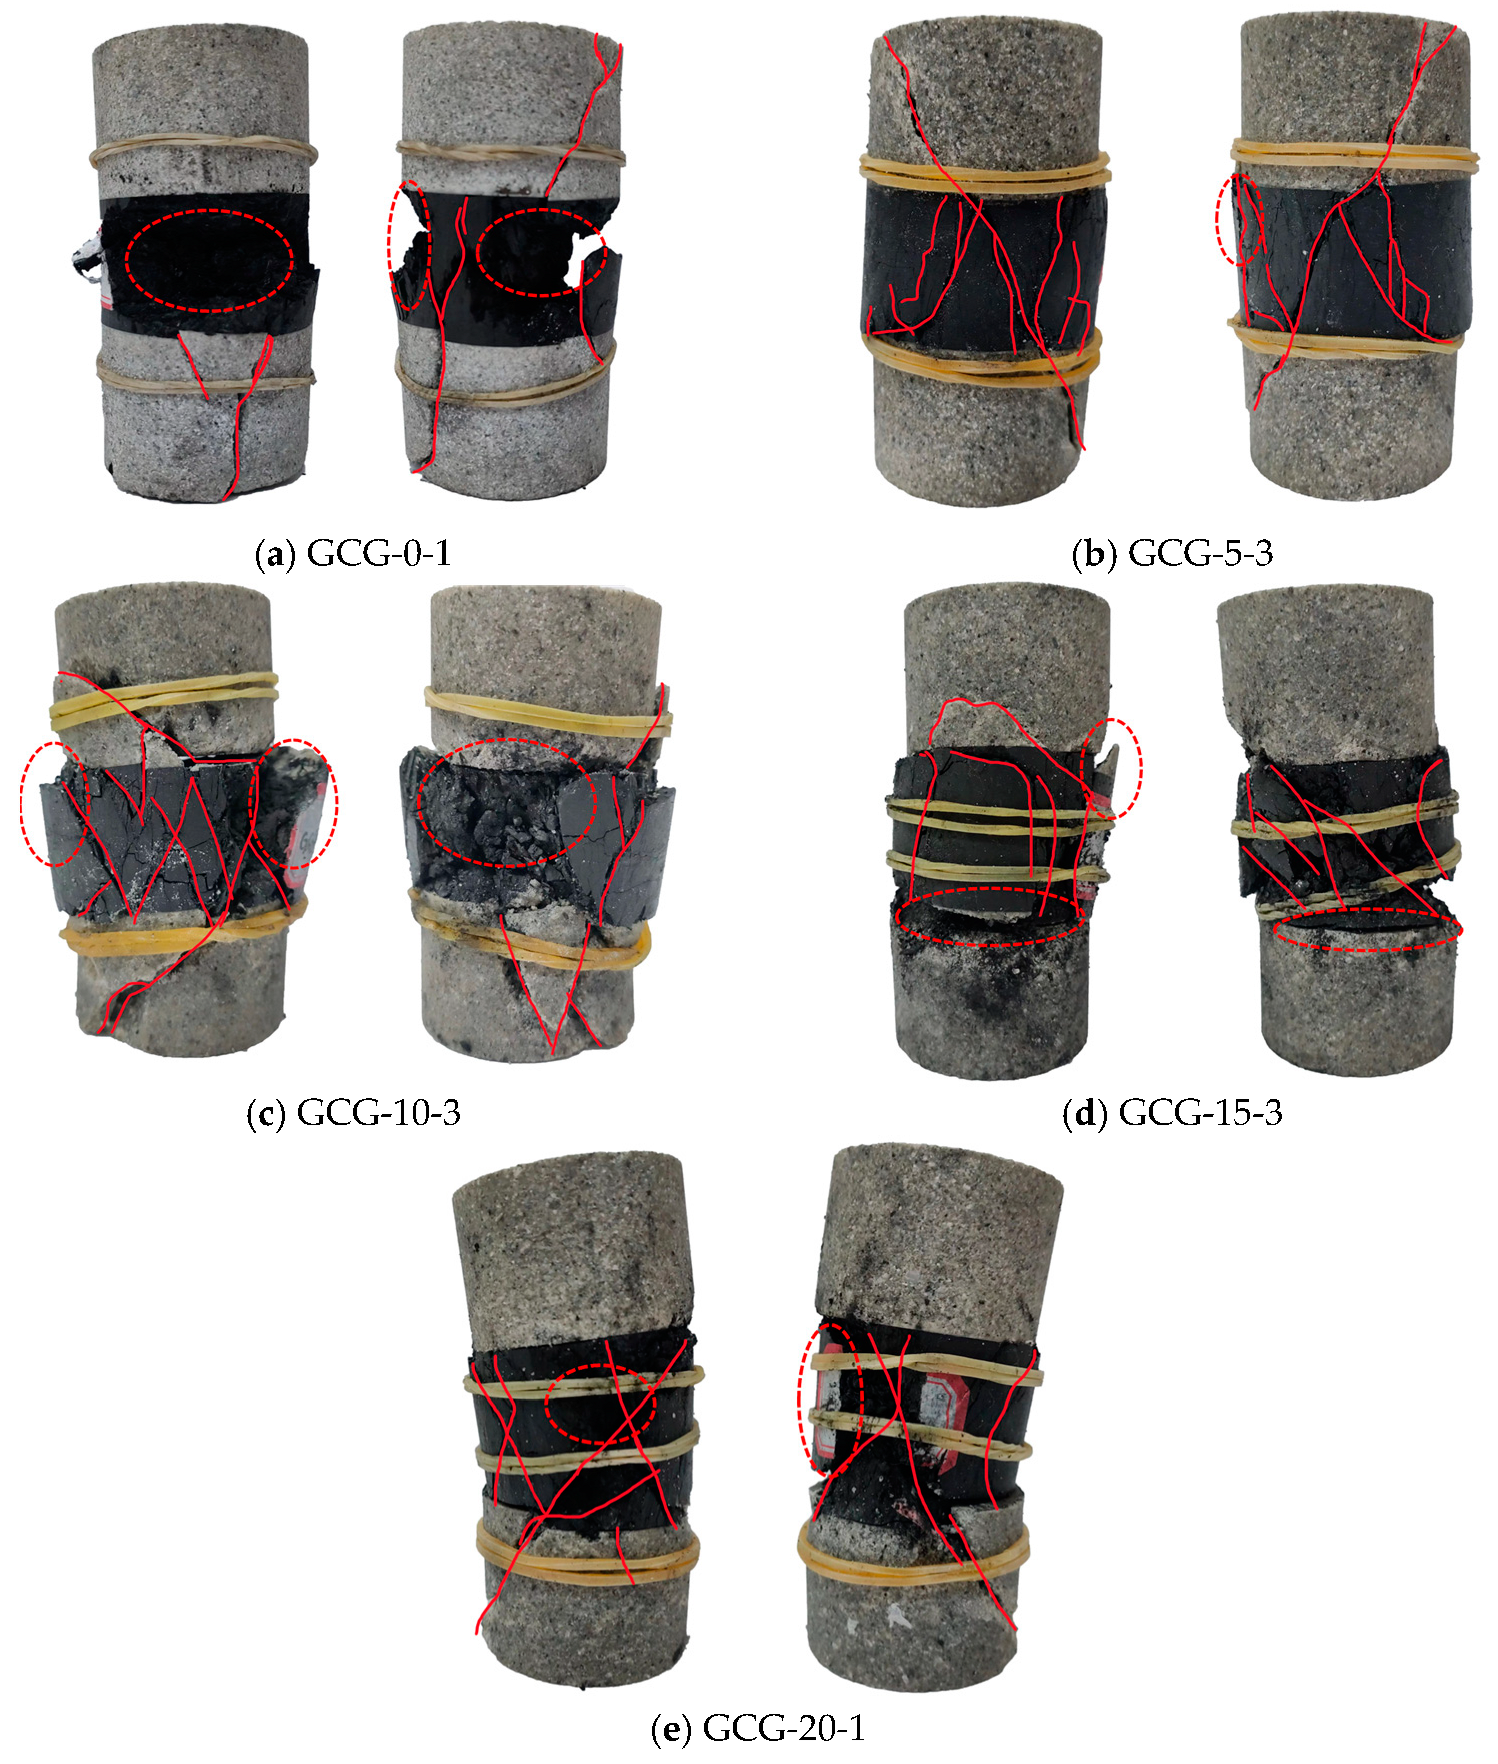
3.2.1. Failure Characteristics of Composite Body

Figure 10 shows the failure mode of the composite specimens under different confining pressures. The integrity of the composite specimen is different under different confining pressure conditions. Five typical failure samples were selected, namely, GCG-0-1, GCG-5-3, GCG-10-3, GCG-15-3, and GCG-20-1, and their macroscopic failure modes were analyzed. It can be seen that the failure mode of middle coal pillars was mostly tensile–shear mixed failure and that of the upper and lower strata was mostly shearing failure. Under the condition of uniaxial compression, the middle coal body of the GCG-0-1 sample was seriously damaged. The red dotted line marks a large caving area, showing obvious brittle splitting failure characteristics, and the crack propagation is randomly distributed. Under the triaxial compression test, with the increase in confining pressure, the failure mode of the middle coal body began to alleviate, and the crack propagation angle began to become relatively small, no longer showing complex failure characteristics under the uniaxial compression test. When the confining pressure was 5 MPa, the integrity of the GCG-5-3 sample was the best, the crack propagation angle was small, the upper and lower strata had less crack development, and the failure range was mainly concentrated in the middle part of the coal. When the confining pressure was 10 MPa, the integrity of the GCG-10-3 sample was reduced, and the middle coal body had many cracks, but there was no large area of collapse, although the upper and lower rock masses were seriously damaged. When the confining pressure was 15 MPa, the integrity of the GCG-15-3 sample was improved, the damage to the upper and lower rock mass was reduced, and the middle coal pillar showed a small area of caving. When the confining pressure was 20 MPa, the integrity of the GCG-20-1 sample was improved and showed essentially the same failure form as GCG-15. It can be seen that, when the confining pressure is 10–15 MPa, the failure mode of the composite changes greatly. When the confining pressure exceeds 15 MPa, the change mode slows down.

3.2.2. Residual Strength Analysis

Residual strength is an important aspect affecting the elastic–brittle–plasticity of rock. The higher the residual strength, the easier it is for the rock to show a higher peak load in the plastic rock sample [27]. With the increase in confining pressure, the brittleness of the overall failure of the composite specimen decreases, and the plasticity increases. At this time, the bearing capacity of the composite is basically composed of the internal friction force (i.e., residual strength) generated by the positive pressure and the strength adhesion of the specimen itself [28]. According to the experimental results in Table 3, the relationship between the confining pressure and the combined sample as shown in Figure 11 can be made. It can be seen from the diagram that the residual strength of the coal–rock combination is almost positively correlated with the confining pressure. When the confining pressure exceeds 15 MPa, the change trend decreases.
The strength attenuation coefficient is an important index that reflects the brittleness of rock. It is a mechanical index that characterizes the post-peak strength attenuation behavior of rock based on the triaxial mechanical properties test proposed by Peng Jun [29]. The formula of the rock strength attenuation coefficient is as follows:
D s = σ 1 σ r σ 1 = Δ σ σ 1
In the formula, Ds is the strength attenuation coefficient, and its value range is 0~1; σ1 is the peak strength, σr is the residual strength, and Δσ is defined as the difference between the peak strength and the residual strength. The calculation results are shown in Table 4 below.
From Figure 12, it can be observed that the curve depicts a general downward trend. This trend indicates that as the confining pressure increases, the strength attenuation coefficient of the combination gradually decreases while maintaining a high residual strength. Notably, when the confining pressure ranges from 0–10 MPa, the strength attenuation coefficient of the combination sample experiences the most significant reduction. This observation highlights the heightened sensitivity of the strength attenuation coefficient to variations in confining pressure. Additionally, the findings reveal the combination’s pronounced brittleness characteristics under conditions of uniaxial compression. Furthermore, the plasticity of the combination exhibits a gradual increase with escalating confining pressure.

4. Analysis of Strength Characteristics of Rock–Coal–Rock Combination

4.1. H–B Strength Criterion

The Hoek–Brown strength criterion is an empirical formula for predicting rock fracture. It can reflect the inherent characteristics of rock mass and the influence of the structural plane and stress state on rock mass strength. The Hoek–Brown strength criterion can predict trends in scatter data and explain the influence of the lower stress zone, tensile stress zone, and minimum principal stress on rock mass strength. Its expression is
σ 1 = σ 3 + σ c m i σ 3 σ c + s
In the formula, σc is the uniaxial compressive strength of the sample, and the value is the average value of the peak stress of the sample under 0 MPa confining pressure. σ3 represents different confining pressure strengths, mi and s are Hoek–Brown empirical constants, which can be obtained by a uniaxial experiment. If there is a lack of laboratory data, empirical values can be taken. The value range of mi is 0~25 according to the look-up table, and the value range of s is 0~1. Combined with the triaxial compression test data of the coal–rock combination, the least square method can be used to calculate the fitting parameters in MATLAB software. The fitting formula is as follows:
σ 1 = σ 3 + 43.92 0.226 σ 3 + 0.788
R 2 = 0.9433
After calculation, the fitting parameters can be obtained: mi = 9.923, s = 0.786.

4.2. GH–B Strength Criterion

The Hoek–Brown strength criterion is suitable for intact rocks, but actual rocks generally comprise disturbed loose and broken bodies. In order to make the original criterion more suitable for evaluating the strength of rock masses, Hoek et al. [25] introduced the integrity coefficient related to rock mass on the basis of the Hoek–Brown strength criterion in the 1990s, and proposed an improved generalized Hoek–Brown strength criterion. Its expression is
σ 1 = σ 3 + σ c m b σ 3 σ c + s a
In the formula, σc is the uniaxial compressive strength of the sample, σ3 is the strength of different confining pressures, and mb, s, and a are empirical parameters.
The triaxial compression data are fitted by the GH–B strength criterion, and the fitting formula is as follows:
σ 1 = σ 3 + 43.92 0.096 σ 3 + 0.867 0.842
R 2 = 0.9209
After calculation, the fitting parameters were mb = 4.234, s = 0.867, a = 0.842.
The fitting curves of the two strength criteria are shown in Figure 13. The results of the above fitting calculations show that the H–B criterion fitting parameter mi is 9.923, and the GH–B criterion fitting parameter mb is 4.234. The difference between the two is 5.698, which is very large. The value of s is less than 1 in both criteria; the difference between them is 0.099, so the fitting value of s is reasonable. According to [30], the complete sandstone parameter mi value range should be between 13 and 21, the mi value of coal should be between 3 and 7 [3], and the mi value of the fitted combination should be between the two, which further proves the correctness of the experimental results. It can be seen from Figure 13 that the curve fitted by the H–B strength criterion is better than the curve fitted by the GH–B strength criterion. The fitting degree of the H–B criterion is R2 = 0.9433, while the fitting degree of the GH–B criterion is R2 = 0.9209. Therefore, we can conclude that the H–B strength criterion is more suitable for describing the strength characteristics of the rock–coal–rock combination in a triaxial compression test.
However, because rock–coal–rock is a ternary combination, the parameters m and s in the H–B strength criterion are different from the values for individual rock samples. Therefore, the least square method and numerical iteration were carried out in MATLAB to obtain the most suitable m and s values, as shown in Table 5. The m and s values were solved after iteration, and the fitting degree reached 0.9500. The smaller the m value is, the closer it is to the test value, and the larger the s value is, the higher the fitting degree is. The fitting curve after iterative solutions based on the H–B criterion can be used to describe the strength characteristics of the rock–coal–rock ternary combination more accurately.

5. Conclusions

Based on the conventional triaxial test of the rock–coal–rock ternary combination under the mapping of deep small coal pillars, the relationship between the confining pressure and the related parameters, such as peak strength, peak strain, strength attenuation coefficient, and residual strength, was analyzed in depth. The following conclusions were obtained:
(1)
The uniaxial compression test on rock–coal–rock specimens showed that, under uniaxial loading conditions, the middle coal body was seriously broken and the degree of discreteness was large, which led to the overall failure and instability of the combination; this is the main reason for the serious deformation of small coal pillars. With the further expansion of cracks, it is possible to cause roof and floor damage;
(2)
Under the condition of triaxial loading, the failure strength of the composite increased with an increase in confining pressure. The combined coal samples were dominated by shear failure, and some of the rock samples produced shear surfaces consistent with the coal samples. With an increase in confining pressure, the combination showed obvious characteristics of ductility;
(3)
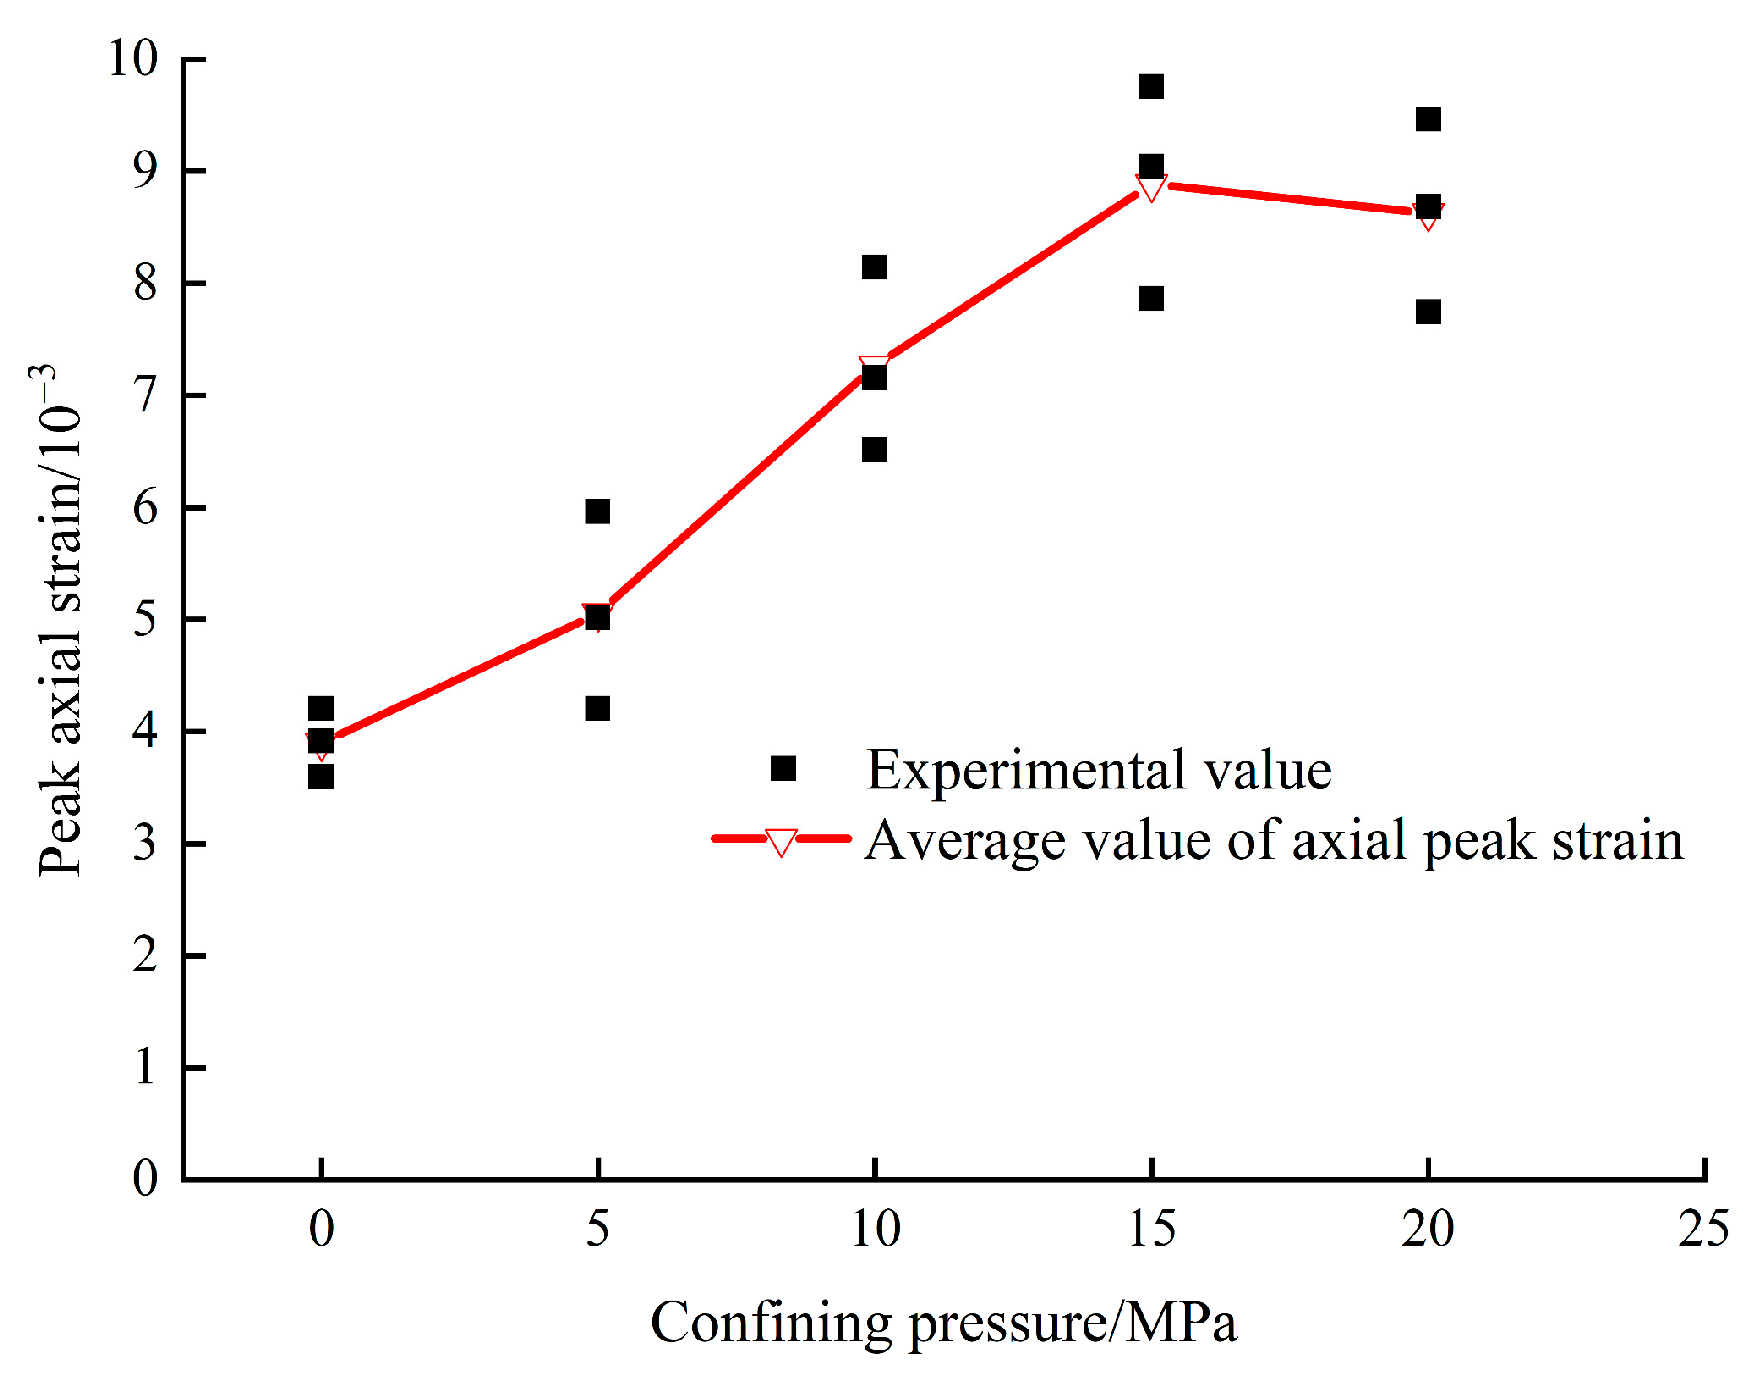
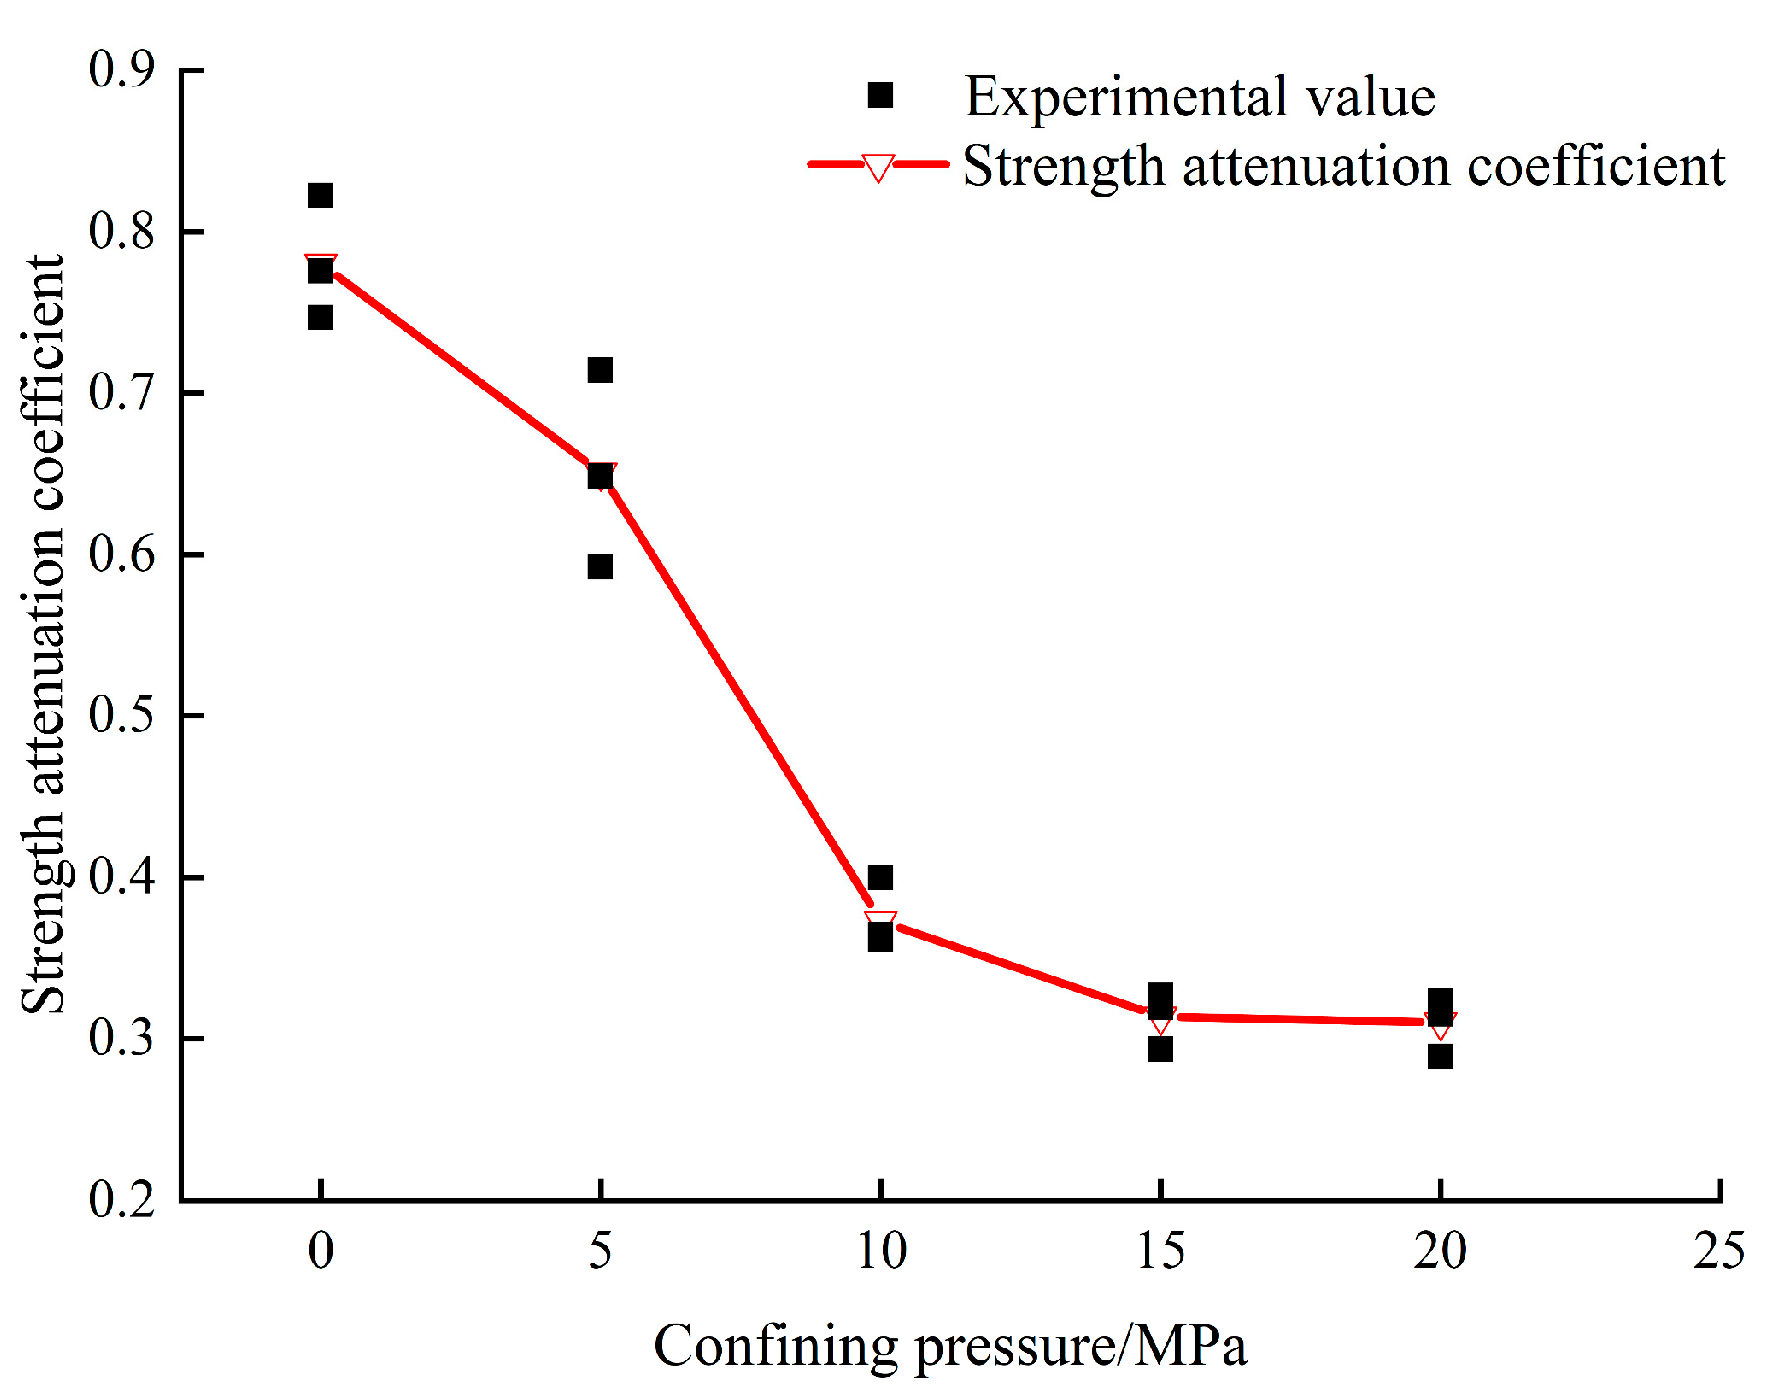
By comparing the relationship between different confining pressure conditions and elastic modulus, peak strengths, peak strains, and residual strengths, it can be seen that the confining pressure of 10–15 MPa is a critical area for the strength change in the combination. After exceeding 15 MPa, the deformation trend of the combination became relatively slow. With an increase in confining pressure, the attenuation coefficient of rock strength gradually decreased, and in the range of 0~10 MPa, the attenuation coefficient of rock strength decreased rapidly, showing that the combination is more sensitive to confining pressure;
(4)
Based on the Hoek–Brown strength criterion, the empirical parameter values mi and s suitable for rock–coal–rock combination were solved using a numerical fitting iteration, which can more accurately predict the change in strength characteristics of the combination, and provide a theoretical basis for the width, stability control, and support design of small coal pillars.

Author Contributions

Conceptualization: H.W. and J.C.; Data curation: H.W., T.W., H.Z. and Y.G.; Formal analysis: H.W., J.C., T.W., H.Z. and Y.G.; Funding acquisition: T.W.; Investigation: H.W. and Y.G.; Methodology: H.W. and J.C.; Software: H.W.; Writing—Original draft: H.W., J.C. and T.W.; Writing—review and editing: J.C. All authors have read and agreed to the published version of the manuscript.

Funding

This research was funded by Scientific Research Foundation for High-level Talents of Anhui University of Science and Technology (grant number 13210673), Natural Science Research Project of Anhui Educational Committee (grant number KJ2021A0453), National Natural Science Foundation of China (grant number 52204081, 52174105).

Institutional Review Board Statement

Not applicable.

Informed Consent Statement

Not applicable.

Data Availability Statement

Not applicable.

Acknowledgments

The authors acknowledge the funding by the Scientific Research Foundation for High-level Talents of Anhui University of Science and Technology, Natural Science Research Project of Anhui Educational Committee, National Natural Science Foundation of China.

Conflicts of Interest

The authors declare no conflict of interest.

References

  1. Xie, H.P. Research Framework and Anticipated Results of Deep Rock Mechanics and Mining Theory. Adv. Eng. Sci. 2017, 49, 1–16. [Google Scholar] [CrossRef]
  2. Xie, H.P. Research review of the state key research development program of China: Deep rock mechanics and mining theory. J. China Coal Soc. 2019, 44, 1283–1305. [Google Scholar] [CrossRef]
  3. Zuo, J.P.; Chen, Y.; Zhang, J.W.; Wang, J.T.; Sun, Y.J.; Jiang, G.H. Failure behavior and strength characteristics of coal-rock combined body under different confining pressures. J. China Coal Soc. 2016, 41, 2706–2713. [Google Scholar] [CrossRef]
  4. Zuo, J.P.; Chen, Y.; Song, H.Q. Study progress of failure behaviors and nonlinear model of deep coal-rock combined body. J. Cent. South Univ. (Sci. Technol.) 2021, 52, 2510–2521. [Google Scholar]
  5. Liu, X.H.; Yu, J.; Kang, J.H.; Hao, Q.J. Study on Strength and Deformation Characteristics of Coal-rock under Different Confining Pressures. Chin. J. Undergr. Space Eng. 2019, 15, 1341–1352. [Google Scholar]
  6. Zheng, J.W.; Wang, S.W.; Li, H.T.; Yang, G.Q.; Lyu, D.Z.; Liu, B.; Fu, Y.K.; Li, X.P.; Lei, G.R. Experimental study on compressive strength characteristics of coal-rock combinations influenced by number of bedding surfaces. Coal Geol. Exploration. 2023, 51, 11–22. [Google Scholar] [CrossRef]
  7. Yu, W.J.; Pan, B.; Li, K.; Shen, W.B. Mechanical properties and fracture evolution law of rock-coal-rock combination. J. China Coal Soc. 2022, 47, 1155–1167. [Google Scholar] [CrossRef]
  8. Zhu, W.J.; Zhong, X.Y.; Cheng, Y.Y.; Fei, D.; Zeng, L.R.; Kai, Z. Spatial Distribution of Corrosion Products Influenced by the Initial Defects and Corrosion-Induced Cracking of the Concrete. J. Test. Eval. 2023, 51, 2582–2597. [Google Scholar] [CrossRef]
  9. Zhu, W.J.; Yang, C.Y.; Yu, Z.X.; Xiao, J.H.; Xu, Y.D. Impact of Defects in Steel-Concrete Interface on the Corrosion-Induced Cracking Propagation of the Reinforced Concrete. KSCE J. Civ. Eng. 2023, 27, 2621–2628. [Google Scholar] [CrossRef]
  10. Chen, G.B.; Li, T.; Yang, L.; Zhang, G.H.; Li, J.W.; Dong, H.J. Mechanical properties and failure mechanism of combined bodies with different coal-rock ratios and combinations. J. Min. Strat. Control. Eng. 2021, 3, 84–94. [Google Scholar] [CrossRef]
  11. Zuo, J.P.; Song, H.Q.; Chen, Y.; Li, Y.H. Post-peak progressive failure characteristics and nonlinear model of coal-rock combined body. J. China Coal Soc. 2018, 43, 3265–3272. [Google Scholar] [CrossRef]
  12. Song, H.Q.; Zuo, J.P.; Chen, Y.; Li, L.Y. Post-peak stress-strain relationship model and brittle characteristics of coal-rock combined body. J. Min. Saf. Eng. 2018, 35, 1063–1070. [Google Scholar] [CrossRef]
  13. Guo, D.M.; Zuo, J.P.; Zhang, Y.; Yang, R.S. Research on strength and failure mechanism of deep coal-rock combination bodies of different inclined angles. Rock Soil Mech. 2011, 32, 1333–1339. [Google Scholar] [CrossRef]
  14. Dou, L.M.; Tian, J.C.; Lu, C.P.; Wu, X.R.; Mou, Z.L.; Zhang, X.T.; Li, Z.H. Research on electromagnetic radiation rules of composed coal-rock burst failure. Chin. J. Rock Mech. Eng. 2005, 24, 143–146. [Google Scholar]
  15. Liu, B.; Yang, R.S.; Guo, D.M.; Zhang, D.Z. Burst-prone experiments of coal-rock combination at −1100 m level in suncun coal mine. Chin. J. Rock Mech. Eng. 2004, 23, 2402–2408. [Google Scholar]
  16. Li, F.X.; Yin, D.W.; Wang, F.; Jiang, N.; Li, X.L. Effects of combination mode on mechanical properties of bi-material samples consisting of rock and coal. J. Mater. Res. Technol. 2022, 19, 2156–2170. [Google Scholar] [CrossRef]
  17. Liu, J.; Wang, E.Y.; Song, D.Z.; Wang, S.H.; Niu, Y. Effect of rock strength on failure mode and mechanical behavior of composite samples. Arab. J. Geosci. 2015, 8, 4527–4539. [Google Scholar] [CrossRef]
  18. Yang, Y.J.; Song, Y.; Chen, S.J. Test study of coal’s strength and deformation characteristics under triaxial compression. J. China Coal Soc. 2006, 31, 150–153. [Google Scholar]
  19. Liu, Q.S.; Liu, K.D.; Zhu, J.B.; Lu, X.L. Study of mechanical properties of raw coal under high stress with triaxial compression. Chin. J. Rock Mech. Eng. 2014, 33, 24–34. [Google Scholar] [CrossRef]
  20. Zuo, J.P.; Wang, Z.F.; Zhou, H.W.; Pei, J.L.; Liu, J.F. Failure behavior of a rock-coal-rock combined body with a weak coal interlayer. Int. J. Min. Sci. Technol. 2013, 23, 907–912. [Google Scholar] [CrossRef]
  21. Guo, W.Y.; Tan, Y.L.; Yu, F.H.; Zhao, T.B.; Hu, S.C.; Huang, D.M.; Qin, Z. Mechanical behavior of rock-coal-rock specimens with different coal thicknesses. Geomech. Eng. 2018, 15, 1017–1027. [Google Scholar] [CrossRef]
  22. Rafiai, H. New Empirical Polyaxial Criterion for Rock Strength. Int. J. Rock Mech. Min. Sci. 2011, 48, 922–931. [Google Scholar] [CrossRef]
  23. Labuz, J.F.; Zang, A. Mohr-Coulomb Failure Criterion. Rock Mech. Rock Eng. 2012, 45, 975–979. [Google Scholar] [CrossRef]
  24. Hoek, E.; Brown, E.T. Empirical strength criterion for rock masses. J. Geotech. Geoenviron. Eng. 1980, 106, 1013–1035. [Google Scholar] [CrossRef]
  25. Hoek, E.; Wood, D.; Shah, S. A modified Hoek-Brown failure criterion for jointed rock masses. In Proceedings of the Rock Characterization: ISRM Symposium, Eurock ‘92, Chester, UK, 14–17 September 1992; pp. 209–214. [Google Scholar]
  26. Paterson, M.S.; Wong, T.F. Experimental rock deformation-the brittle field. In Principles and Practice of Constraint Programming—CP 2003, Proceedings of the 9th International Conference, CP 2003, Kinsale, Ireland, 29 September–3 October 2003; Springer: Berlin/Heidelberg, Germany, 2005; p. 348. [Google Scholar] [CrossRef]
  27. Liu, W.B.; Tang, C.A.; Tang, L.X. Numerical Simulation on influence of Residual Strength on Macroscopic Behavior of Rock Failure. Geotech. Eng. Tech. 2004, 18, 59–63. [Google Scholar]
  28. You, M.Q.; Hua, A.Z. Strength criterion and internal friction coefficient of rock samples. J. Geomech. 2001, 7, 53–60. [Google Scholar]
  29. Peng, J.; Rong, G.; Cai, M.; Peng, K. Determination of residual strength of rocks by a brittle index. Rock Soil Mech. 2015, 36, 403–408. [Google Scholar] [CrossRef]
  30. Hoek, E.; Brown, E.T. Practical Estimates of Rock Mass Strength. Int. J. Rock Mech. Min. Sci. 1997, 34, 1165–1186. [Google Scholar] [CrossRef]
Figure 1. Structural modeling of rock–coal–rock assemblages.
Sustainability 15 12463 g001
Figure 2. Standard combination specimen.
Sustainability 15 12463 g002
Figure 3. HC-U81 multi-function concrete ultrasonic detector.
Sustainability 15 12463 g003
Figure 4. TYJ-1500 M rock mechanics testing machine.
Sustainability 15 12463 g004
Figure 5. Sample installation flow chart.
Sustainability 15 12463 g005
Figure 6. Relationship between elastic modulus and confining pressure of single coal–rock and combination bodies.
Sustainability 15 12463 g006
Figure 7. Stress–strain curves under different confining pressure conditions.
Sustainability 15 12463 g007aSustainability 15 12463 g007b
Figure 8. Relationship between axial peak strength and confining pressure.
Sustainability 15 12463 g008
Figure 9. Relationship between axial peak strain and confining pressure.
Sustainability 15 12463 g009
Figure 10. Failure modes of coal–rock combination under different confining pressures.
Sustainability 15 12463 g010
Figure 11. Relationship between residual strength and different confining pressures.
Sustainability 15 12463 g011
Figure 12. Relationship between strength attenuation coefficient and confining pressure of the composite body.
Sustainability 15 12463 g012
Figure 13. Fitting curves of test values with different strength criteria.
Sustainability 15 12463 g013
Table 1. Basic mechanical parameters of the rock–coal–rock samples.
Rock FormationDiameter/mmHeight/mmCompressive Strength/MPaElastic Modulus/GPaModulus of Deformation/GPa
Gritstone5010037.716.973.67
Coal Samples5010021.172.172.05
Table 2. Velocity value of the wave velocity meter.
Specimen NumberRange Finding/mmVoice Time/μsAverage Velocity/(km · s)Sound Velocity Correction Value/(km · s)
GCG-0-110037.52.672.76
GCG-0-210038.52.592.69
GCG-0-310038.52.592.69
GCG-5-110039.52.532.62
GCG-5-210038.52.62.69
GCG-5-310040.52.472.55
GCG-10-110039.52.532.62
GCG-10-210037.52.672.76
GCG-10-310041.52.412.49
GCG-15-1100402.52.58
GCG-15-2100412.442.52
GCG-15-3100382.632.72
GCG-20-110039.52.532.62
GCG-20-210039.52.532.62
GCG-20-3100372.72.79
Table 3. Triaxial compression test results of rock–coal–rock combination.
Specimen NumberE/GPaσ1/MPaσ3/MPaσr/MPaε/10−3
GCG-0-14.1241.41010.53.91
GCG-0-25.1538.9606.934.2
GCG-0-36.4351.38011.543.59
GCG-5-15.9465.13542.75.96
GCG-5-25.7657.95532.314.2
GCG-5-35.8179.48527.975.01
GCG-10-19.1880.621047.227.15
GCG-10-212.6994.391066.768.14
GCG-10-311.0290.931057.836.51
GCG-15-116.5198.911560.697.86
GCG-15-214.55105.391568.939.75
GCG-15-312.23109.791573.989.04
GCG-20-112.52114.72078.598.68
GCG-20-215.83119.222069.897.74
GCG-20-313.65123.542085.669.46
Table 4. The calculated value of the strength attenuation coefficient.
Confining pressure/MPa05101520
Strength attenuation coefficient of rock0.7800.5900.3540.3520.345
Table 5. Fitting parameters.
Strength CriterionmsR2
H–B9.9230.7860.9433
GH–B4.2340.8670.9209
Based on H–B iteration9.5960.8980.9500
Disclaimer/Publisher’s Note: The statements, opinions and data contained in all publications are solely those of the individual author(s) and contributor(s) and not of MDPI and/or the editor(s). MDPI and/or the editor(s) disclaim responsibility for any injury to people or property resulting from any ideas, methods, instructions or products referred to in the content.

