Article

Building Thermal and Energy Performance of Subtropical Terraced Houses under Future Climate Uncertainty

School of Architecture and Urban Planning, Guangzhou University, Guangzhou 511442, China
*
Author to whom correspondence should be addressed.
Sustainability 2023, 15(16), 12464; https://doi.org/10.3390/su151612464
Submission received: 4 July 2023 / Revised: 10 August 2023 / Accepted: 15 August 2023 / Published: 16 August 2023

Abstract

:
Due to global temperature increases, terraced house (TH) residents face a threat to their health due to poor indoor thermal environments. As buildings are constructed by low-income residents without professional guidance, this study aims to investigate the indoor thermal comfort and energy resilience of THs under the future climate and determine the optimal passive design strategies for construction and retrofitting. By exploring the effects of building envelope structures, adjusting the window-to-wall ratio (WWR) and designing shading devices, EnergyPlus version 22.0 was used to optimize the thermal environment and cooling load of THs throughout their life cycle under future climate uncertainties. Unimproved THs will experience overheating for nearly 90% of the hours in a year and the cooling load will exceed 60,000 kWh by 2100 under the Representative Concentration Pathways (RCP) 8.5 scenario. In contrast, optimization and improvements resulted in a 17.3% reduction in indoor cooling load by increasing shading devices and the WWR, and using building envelope structures with moderate thermal insulation. This study can guide TH design and renovation, significantly reducing indoor cooling load and enabling residents to better use active cooling to combat future overheating environments.

1. Introduction

1.1. Background

The first part of the Intergovernmental Panel on Climate Change’s (IPCC) Sixth Assessment Report (AR6) mentions that global temperature will rise by from 1.5 °C to 2 °C in the coming decades [1]. Global warming is projected to bring about more severe heatwave events and urban heat island effects, along with their synergistic effects [2]. Furthermore, the probability of cardiovascular, respiratory, and cerebrovascular patient mortality will increase in high-temperature environments [3,4]. Therefore, thermal conditions and energy demand play crucial roles in the survival of residential buildings in climate change, especially under future scenarios with more intense climate changes, which necessitates greater attention to assessments of building performance.
Improving the thermal comfort and building energy demands of residential buildings is particularly important as they serve as crucial living spaces for humans. Residential buildings lacking sufficient resilience will pose higher heat risks, more extreme indoor temperatures, and longer durations of overheating in higher-outdoor-temperature environments [5,6]. Furthermore, humidity can significantly impact indoor thermal comfort and energy demand [7]. These factors can result in further health issues and even fatalities for occupants [8]. Excessive indoor temperatures can lead to heatstroke and heat exhaustion [9], as well as cardiovascular, kidney, and respiratory diseases [10,11,12], and may even have psychological impacts that contribute to incidents of suicide [13]. The energy demands of residential buildings also increases with rising temperatures, and reports indicate that the surge in building energy demands during high-temperature extreme-weather periods poses significant challenges and risks to the electricity sector [14]. The additional energy consumed during heatwaves also contributes to increased carbon emissions [15]. Therefore, improving the resilience of residential buildings to future climate change is of great significance in reducing the probability of heat risks, mitigating indoor overheating, safeguarding the physical and mental well-being of occupants, alleviating stress on urban power systems, and reducing carbon emissions.
In China, the rural population are allowed to build their own houses on homestead. Terraced houses (THs) are designed and built by the building owners without technical guidance, and are common outside urban areas. Improving the energy performance and thermal comfort of naturally ventilated THs is important to enhance the living quality and ensure better health for residents, especially in hot–humid areas under climate change. Due to a lack of relevant architectural expertise among TH owners and their tight budget, the energy performance of poor insulated THs is low. On the other hand, despite prolonged exposure to overheating conditions, rural residents with a high tolerance on high temperatures often choose to reduce their energy expenses by refraining from or minimizing the use of air conditioning [16]. However, the two objectives of energy performance and thermal comfort under natural ventilation are somehow conflicting [17,18,19]. It is necessary to offer a quantitative assessment of the building performance of THs in the context of global warming to help residents to make wise choices regarding building retrofitting.

1.2. Literature Review

Climate change trends are expected to raise atmospheric temperatures, leading to various challenges for residential buildings in overheated environments. Researchers use Global Climate Models (GCMs) to obtain monthly data of various meteorological parameters and morph these data using statistical methods to generate hourly data. Sailor et al. [20] simulated that indoor temperatures without air conditioning would exceed 40 °C in two warm US cities (Chicago, Illinois, and Houston, Texas) in 2050. Baba et al. [21] simulated a school in Montreal, Canada, discovering that, without mitigation measures, classroom overheating hours would increase to 333 and 437 h by 2044 and 2090, respectively. Baglivo et al. [22] found that, from 2020 to 2080, the hours worked in temperatures higher than 26 °C in apartments in Lecce, Italy, had increased by around 16% while the external temperature increased by 11%. Andric et al. [23] further found that the hours with temperature exceeding 38 °C in Qatar would increase by 17% and 21% for 2050 and 2080, respectively. Muñoz González et al. [24] simulated a scenario in southern Europe, with discomfort indoor projected to increase by 20–30% in warm months in 2050. Ciancio et al. [25] simulated several European cities, such as Clermont-Ferrand, Plovdiv, Granada, and Salamanca, finding that temperature would increase between 1 °C and 5 °C in July and August in 2050 and between 2 °C and 9 °C in 2080. Pérez-Andreu et al. [26] found that the indoor temperatures of residential buildings in Valencia, Spain, along the Mediterranean coast are projected to increase by 3.60 °C and 5.33 °C under the CNRM-CM, and MPI-ESM-LR circulation scenarios, respectively, from 2096 to 2100. Flores-Larsen et al. [27] found that, from 2020 to 2080, temperatures in Santa Rosa, Mendoza, Córdoba, and Orlán would rise by 2.2 °C, 2.7 °C, 2.8 °C, and 3.8 °C, respectively (annual average). Overall, under future climate change, levels of overheating, maximum temperatures, and overheating risks in residential buildings will all increase, and the challenges faced by residents deserve attention.
As indoor thermal comfort is expected to decrease under future climate change, researchers have studied energy demands to mitigate this discomfort. Velashjerdi Farahani et al. [28] studied Helsinki in southern Finland and found that cooling load was projected to increase by 47% under the future average climate in 2050, and up to 128% under extreme climate conditions. Zou et al. [29] found that, under the SSP3-7.0 scenario, residential energy use in humid regions of China would increase by 44.5% to 59.1% from 2075 to 2099. Hosseini et al. [30] simulated the southeastern environment of Sweden, finding that the peak cooling load load of typical years from 2040 to 2069 increased by 210% compared to 2010–2039, and by 290% from 2070 to 2099. Bell et al. [31] studied Köppen–Geiger climate zones and found that, under extreme weather conditions in 2050, the peak cooling demand increased by 24–35%, and unsatisfied cooling hours increased by 41–189%. Jafarpur et al. [32] predicted that, in 2056–2075, Quebec City, Toronto, and Vancouver in Canada are expected to increase their cooling load by 34.6% (7.9 kW/m2), 32.2% (8.6 kW/m2), and 27.8% (6.5 kW/m2), respectively, using EnergyPlus version 22.0. Moazami et al. [33] studied a district in Geneva, finding that peak electricity demand increased by 4.0%, 7.6%, and 16.8% for 2011–2040, 2041–2070, and 2071–2100, respectively, under future extreme climate conditions. In the simulation of Seville, southwestern Spain, Sánchez-García et al. [34] found that the cooling load demand increased from 14.6% in 2020 to 57.5% in 2080. Xiang Li et al. [35] found that Switzerland’s service industry’s spatial cooling load demand would increase by 400%, 500%, and 600% by 2050 under Representative Concentration Pathway (RCP) 2.6, RCP 4.5, and RCP 8.5, respectively. Ramon et al. [36] found that, in Belgium, the number of cooling days increased from 167 days to 401 days, an increase of 2.4 times between 1976–2004 and 2070–2098. Spinoni et al. [37] simulated the last 10 years of the 21st century in Europe and found that the annual number of cooling days under RCP 4.5 increased by approximately 45% on average, while, under RCP 8.5, the number increased by 170%. In conclusion, under gradually increasing temperatures in the future, residents will consume more energy to cool down overheating indoor environments, which will result in higher energy costs, indicating that low-income groups will face various health risks they cannot afford, and there will be a significant challenge for cities’ energy load.
Facing the dual challenge of the increasing risk of building overheating and energy demand in the context of future temperature rises, some researchers are attempting to save energy by improving the thermal performance of building envelopes; however, this may lead to disadvantages in the thermal environment under natural ventilation. Zhang et al. [38] simulated the environment in Shanghai and concluded that adding an insulation board could increase the indoor winter temperature by 7.8% and decrease the summer temperature by 7.5%, resulting in a certain insulation and heat-preservation effect. Moreles et al. [39] improved the thermal performance of building envelopes using PCM walls with thicknesses of 6 mm and 18 mm, and found that the maximum energy-saving effect in air-conditioning environments increased by 4% and 29%, respectively. Alshuraiaan et al. [40] discovered that using phase change materials (PCMs) to improve building thermal performance can reduce heat flow into the building by more than 50%. Wu et al. [41] found that using multi-layer assemblies of phase change materials and bio-based concrete to improve building thermal performance in summer scenarios could reduce the maximum heat load by 8.2%, temperature fluctuations by 46.3%, and local vapor pressure fluctuations by 43.7%, which could enhance indoor thermal comfort. Aslani et al. [42] found that buildings with DSW R-50 walls in the building envelope consume 75% less energy than conventional buildings. Tarek et al. [43] found that replacing traditional bricks with FS geo-polymeric bricks in the city of New Aswan, Egypt, reduced the indoor cooling demand from 32.41103 kWh to 30.64103 kWh, a reduction of about 5.7% compared to the use of traditional bricks in summer peak periods. Additionally, other geo-polymeric bricks can reduce building energy demand by from 5.7% to 14.9%. Dora et al. [44] improved the thermal performance of buildings by using large encapsulated PCM materials, which reduced the total peak heat flux by 27.32%, lowered the cooling load by 38.76%, and saved 28.31 rupees/day (about 0.40 USD/day) in electricity costs. Improving the thermal performance of the building envelope has a certain energy-saving effect, but also has some impact on the thermal environment. Mourid et al. [45] found that the use of PCM to improve building thermal performance can lead to a temperature increase of about 6 °C indoors at night and significantly increase the surface thermal quality of the room. Al-Yasiri et al. [46] found, in their experiment in Iraq, that the average indoor air temperature in PCM rooms increased slightly compared to another identical non-PCM room, regardless of natural ventilation. Yang et al. [47] optimized energy demand by using genetic algorithms to develop improvement strategies. Yu et al. [48] found that improving the building envelope’s insulation could reduce heat transfer from the outdoor environment to the indoor environment, which is advantageous for energy conservation during the day but disadvantageous for heat dissipation at night. Al-Yasiri et al. [49] found that using PCM to improve building thermal performance in hot climates results in a higher operating temperature in PCM rooms than in non-PCM rooms due to the PCM absorbing heat during the day and releasing heat uncontrollably to the indoor environment in the evening. Zou et al. [50] effectively improved indoor thermal comfort by improving the passive survivability of four indigenous buildings in humid and hot areas under future climate scenarios.
Therefore, when considering upgrading building resilience, researchers need to conduct more comprehensive studies to balance the impact of these improvement measures on energy efficiency and the thermal environment, and find the best solution that can meet the needs of different users after a comprehensive assessment of both factors. However, for low-income populations, there is no definitive conclusion regarding the priorities of improving the thermal environment under natural ventilation and optimizing energy demand. Therefore, this study aims to explore the best passive design strategies for improving indoor thermal comfort under natural ventilation and reducing energy demand under air-conditioning, finding a balance between the two factors under future climates using sensitivity analyses, and providing references for the construction and renovation of thermal habitats.

1.3. Aim of This Study
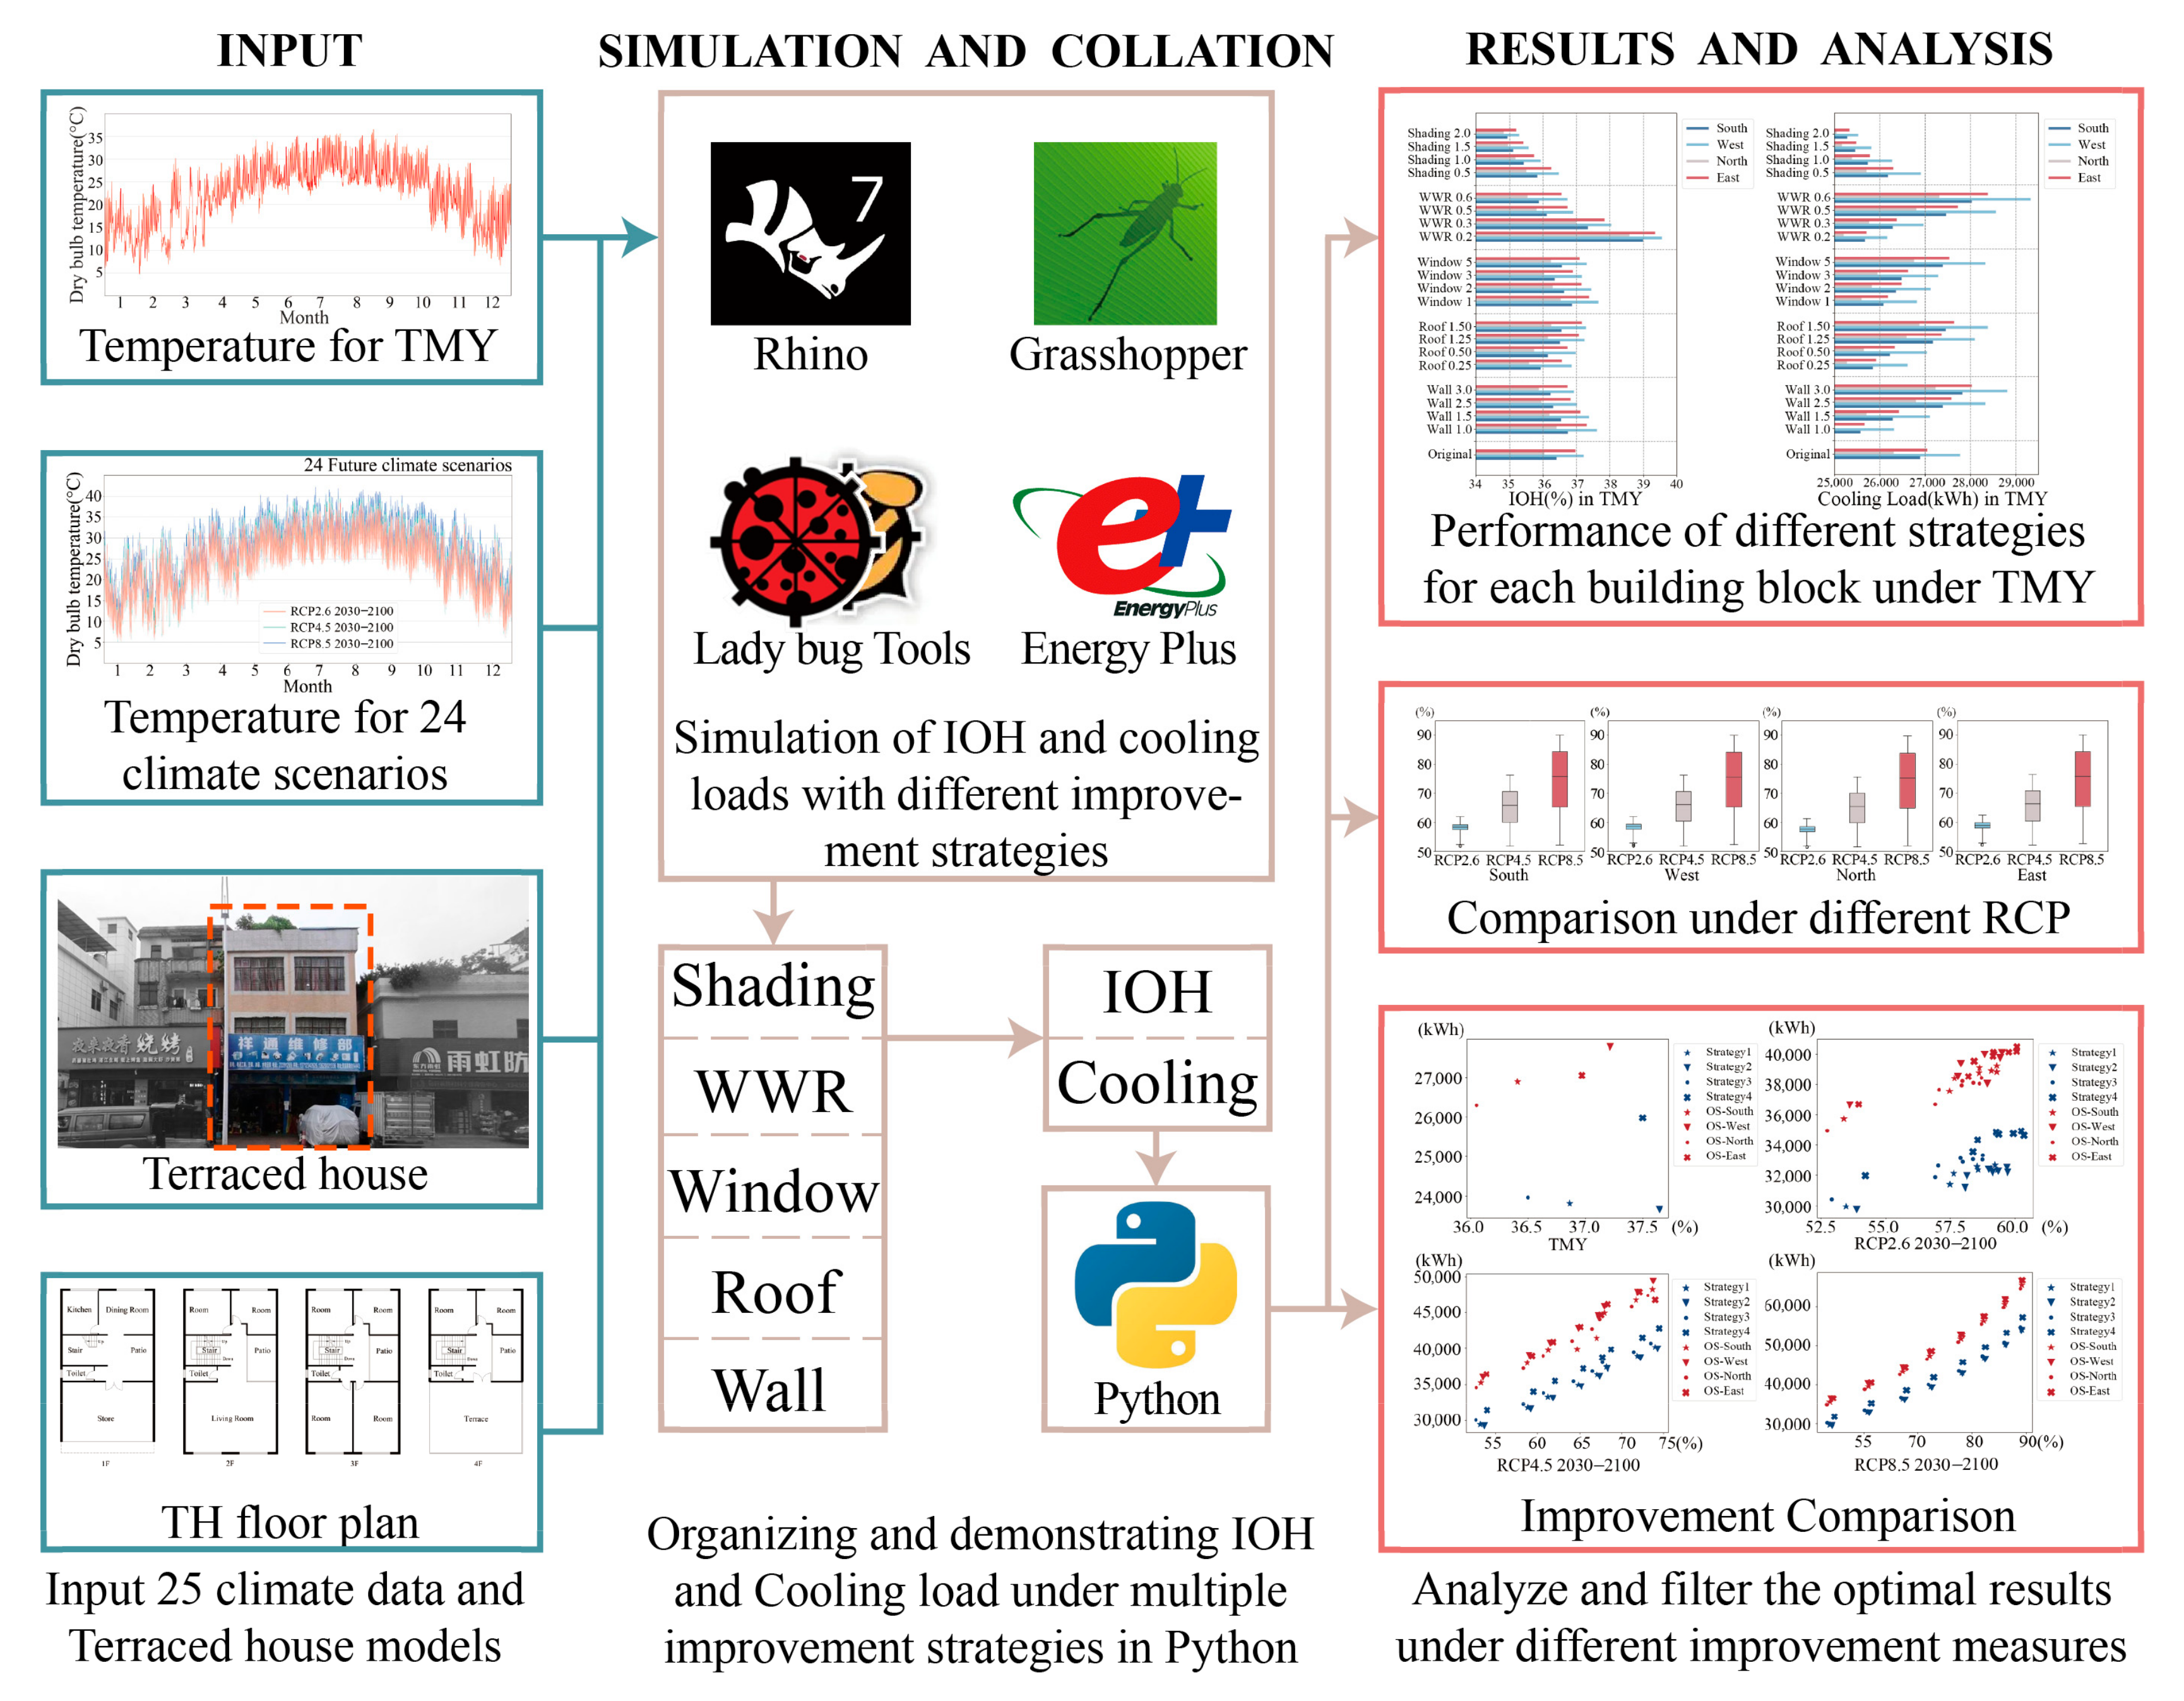
To our knowledge, it is expected that indoor temperatures around the world will increase under future climate change trends, leading to a reduction in indoor thermal comfort [30]. This increase in temperatures will also cause a rise in building energy demand, particularly due to the increased use of cooling equipment [51]. Additionally, there are limitations to the use of enclosure structures to improve the indoor thermal environment under natural ventilation [52]. Previous research on optimizing indoor thermal environment and energy demand in Guangzhou under future climates is scarce. This article aims to study the following: (1) changes in outdoor temperature in the Guangzhou region under future climate conditions; (2) evaluation of indoor thermal comfort and energy demand of THs in Guangzhou under 24 different future weather conditions; (3) improvement potential of energy performance and thermal comfort for THs under future climate by retrofitting.

2. Methodology

This article presents a research process illustrated in Figure 1. The building performance simulation engine EnergyPlus [53], a popular choice for building performance calculations, was used for the building performance calculations. The Ladybug tools [54], a visualization programming interface, were utilized for modeling. Regarding climate data, TMY data and meteorological data for the years 2030–2100 under three different RCP scenarios were employed as inputs. The TMY dataset was jointly developed by the China Meteorological Administration Meteorological Information Center and Tsinghua University, spanning from 1994 to 2003 [55].
To assess the degree of overheating both outdoors and indoors, the Apparent Warmth Degree (AWD) and Indoor Overheating Hours (IOH) metrics were referenced. Considering that the research targets contained a region with hot summers and mild winters, the primary energy demand of local buildings was focused on cooling load, while heating load was not considered.
As this study aims to optimize and retrofit TH buildings as a whole, exploring the most suitable retrofitting strategies applicable to the entire TH building cluster, it does not consider phased retrofitting. The final results are displayed through Python, presenting the average IOH and average cooling load for each room. The schedule of occupancy, lighting, and equipment is illustrated in Figure 2. The Simulation settings are shown in Table 1.

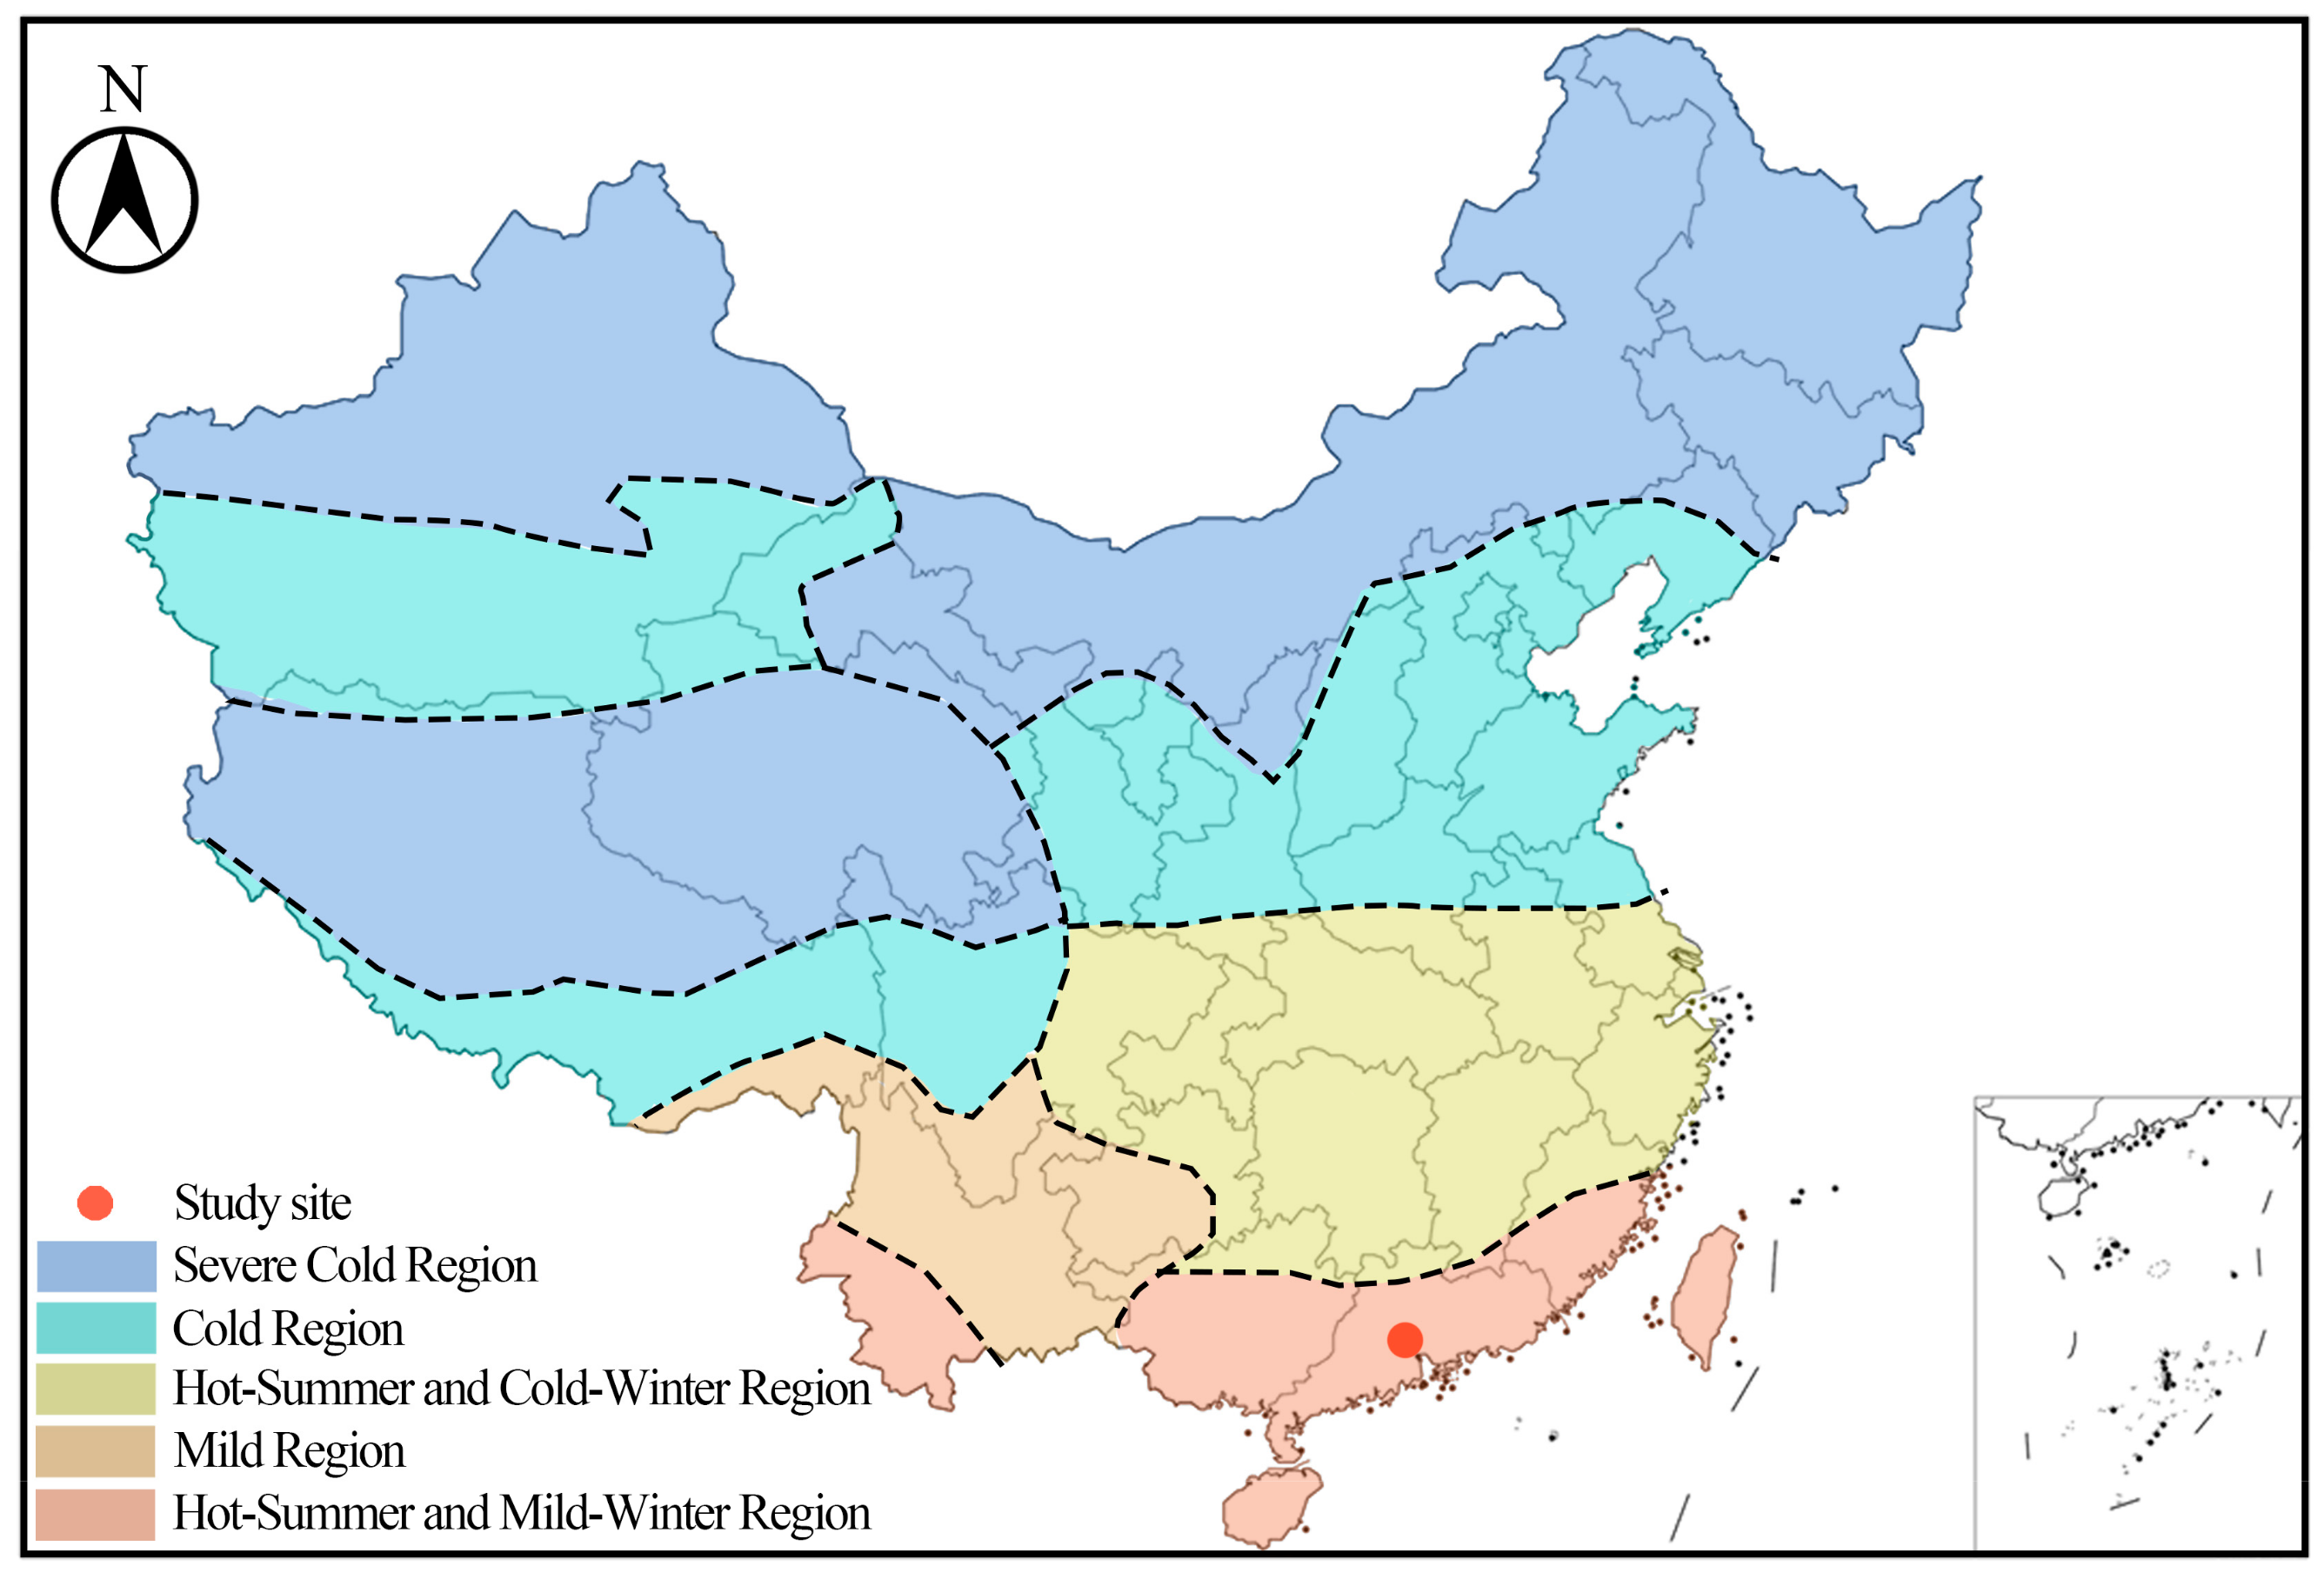
2.1. Climate Condition of the Site

As shown in Figure 3, the study site is located in the hot-summer and warm-winter region of southern China [56], with dense distribution in the urban–rural transition zone. The region is located in the subtropics and is influenced by warm and humid air currents, resulting in hot and humid summers with abundant rainfall. On the other hand, winters are relatively mild, with rare occurrences of severe cold weather and widespread freezing and snow.
As this article aims to investigate the risk of overheating, the study period is limited to the summer season from April to October in Guangzhou. As shown in Figure 4, the outdoor dry-bulb temperatures are generally higher than 26 °C, with an average temperature of 27.22 °C and maximum temperatures exceeding this.
Representative Concentration Pathways (RCP) are jointly formulated by the international climate science community to assess and simulate future climate change scenarios. They provide predicted concentrations of greenhouse gases in the atmosphere under different emission scenarios and serve as input parameters for climate models. RCP2.6 represents a relatively low greenhouse gas emission scenario, requiring significant global greenhouse gas reduction measures in the mid-term to keep greenhouse gas concentrations at lower levels. RCP4.5 represents a relatively moderate greenhouse gas emission reduction scenario, predicting a moderate increase in greenhouse gas concentrations, with weaker emission reduction targets. RCP8.5 represents a relatively high greenhouse gas emission scenario, predicting a rapid increase in greenhouse gas concentrations, with very limited emission reduction measures [57]. This study explores the climate change scenarios for the three RCP environments from 2030 to 2100, considering a total of 24 potential future climates. The relevant meteorological data were obtained from the Meteonorm database.
In the 24 future climates from 2030 to 2100, the outdoor dry-bulb temperatures generally increase. In scenarios with a stronger greenhouse effect, the outdoor dry-bulb temperatures are higher, and the duration with temperatures exceeding 26 °C will be longer, indicating a greater risk of overheating and less comfortable indoor thermal environment, as shown in Figure 3. From 2030 to 2100, the average temperature from April to October is projected to increase by 2.05% in the RCP4.5 scenario and by 5.79% in the RCP8.5 scenario compared to the RCP2.6 scenario. The temperature in the period from April to October is predicted to increase at a rate of approximately 0.2% per decade in the RCP2.6 scenario, 0.86% per decade in the RCP4.5 scenario, and 1.94% per decade in the RCP8.5 scenario. The maximum temperature is projected to reach 38.4 °C in the RCP2.6 scenario, 39.8 °C in the RCP4.5 scenario, and 42.1 °C in the RCP8.5 scenario, as shown in Figure 5.
THs were located in the southern part of China, characterized by hot summers and cold winters. The cooling load dominates in the summer, while heating load is generally not considered in the winter. Local residents mainly use two cooling modes indoors: natural ventilation to mitigate indoor overheating and air-conditioned with air conditioning to alleviate indoor overheating. Buildings with good insulation can save cooling energy, but this may also reduce the heat dissipation from the indoors to outdoors through natural ventilation, leading to higher overheating risks. Therefore, this study discusses IOH under natural ventilation and cooling load under an air-conditioned layout separately. For natural ventilation, we considered an all-day window opening schedule, with 50% of the window glass area being openable and 100% of window glass height being openable. For the air-conditioned area, the windows are closed.

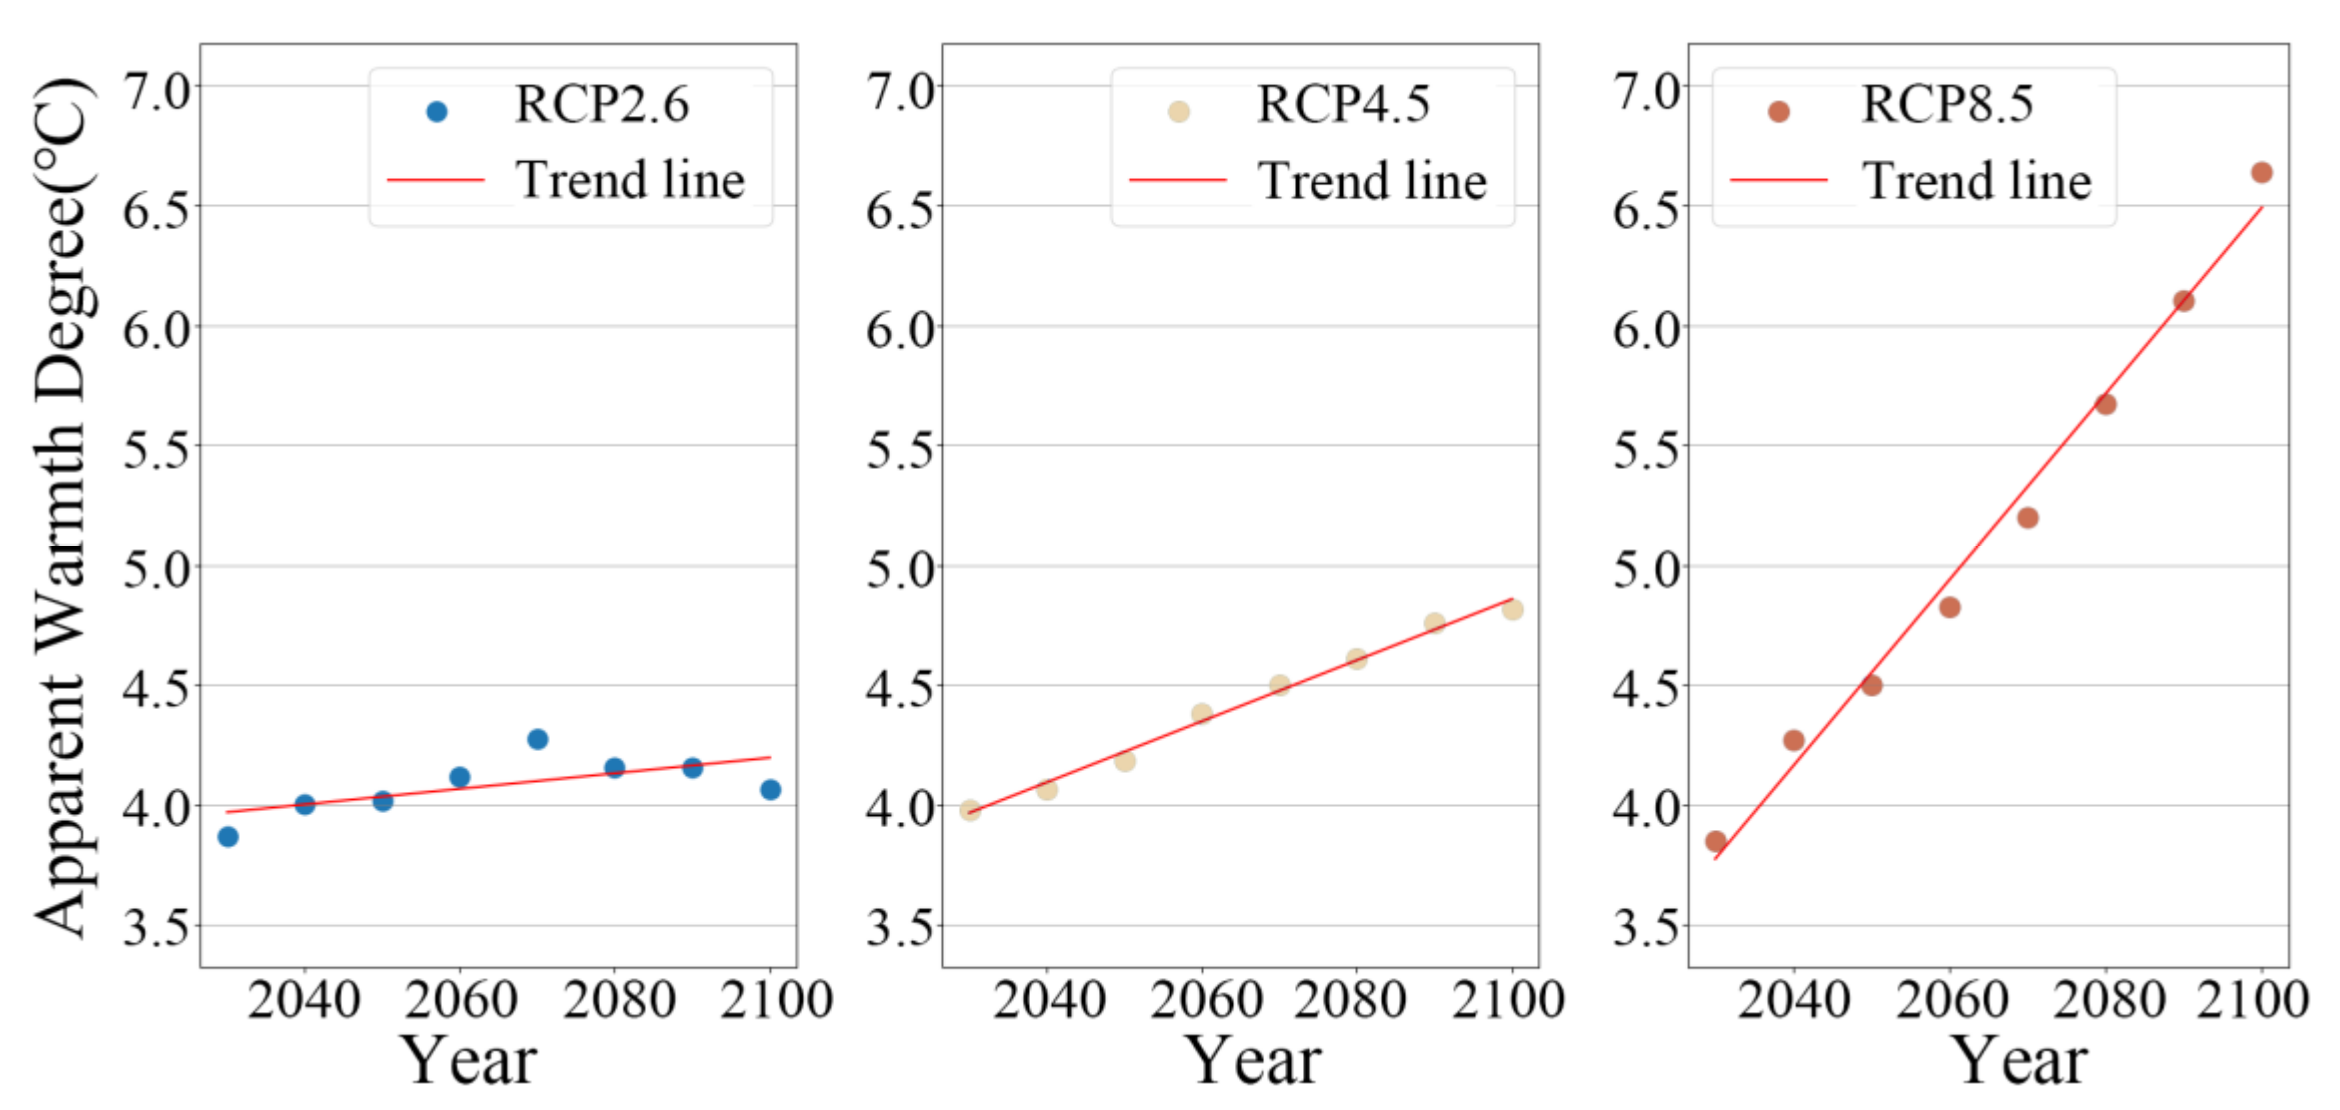
2.2. Ambient Warmness Degree

Apparent Warmth Degree (AWD), proposed by Hamdy et al. [58], is a metric used to evaluate the severity of the outdoor temperature. It calculates the mean cooling degree hours based on a baseline temperature of 26 °C during the period when the outdoor temperature is not lower than 26 °C [59].
A W D 26   ° C = i = 1 N T a , i T b + · t i i = 1 N t i
where T a , i is the outdoor dry bulb temperature, T b is the average temperature during the summer in Guangzhou (26 °C), N is the number of hours that T a , i is greater than 26 °C, and t i is set as 1 h for evaluation, as shown in Equation (1).

2.3. Indoor Overheating Hours (IOH)

Indoor Overheating Hours (IOH) is a metric used to evaluate non-comfortable indoor environment caused by heat. Operative temperature is a comprehensive parameter that measures the combined effect of indoor air temperature and surface temperature on human comfort. It takes into account the heat radiation experienced by the human body and its perception of the air temperature [60]. Therefore, IOH calculates the annual hours when the indoor operative temperature exceeds the comfort temperature of the region, as shown in Equations (2) and (3).
I O H = i = 1 N o c c z o h × t i , z i = 1 N o c c z t i , z
o h = 1 , 0 , max O T i , z T L c o m f , i , z , 0 > 0 e l s e
where z is the occupied zone counter, i represents the occupied working time, N o c c z is the total working time of occupied zone z during the statistical period, t denotes time step (1 h), O T i , z represents the operative temperature of zone z at time step i , and T L c o m f , i , z denotes the maximum comfortable temperature limit of zone z at time step i . According to the research conducted by Zhang et al. [61], the acceptable range of indoor temperatures for people in hot summer and warm winter regions of China is 18.0–28.5 °C. Therefore, T L c o m f , i , z is set at a maximum value of 28.5 °C.

2.4. Sensitivity Analysis

Sensitivity analyses have been utilized to assess building energy demand and peak demand [61]. The aim of this study is to investigate the impact of various component parameters on building performance indicators, with IOH under natural ventilation and cooling load under air-conditioning being the primary building performance indicators. Researchers conducted a sensitivity analysis of the influence of sunshade length and window–wall ratios (WWR) for four building orientations, as well as the thermal insulation capabilities (U-values) of windows, roofs, and walls, on the building performance indicators. The sensitivity coefficient formula for the sensitivity analysis is as follows:
S C = Δ O P Δ I P ÷ O P ¯ I P ¯
where SC represents sensitivity coefficient, Δ O P represents the difference in energy demand or overheating hours before and after the strategy change, and Δ I P represents the difference in building performance before and after the strategy change. O P ¯ represents the average energy demand difference or overheating hours before and after the strategy change, and I P ¯ represents the average building performance before and after the strategy change. This study selected the strategy change that resulted in the greatest difference in energy demand or overheating hours to investigate the factors that have the greatest impact on indoor overheating hours and cooling load, as shown in Equation (4).

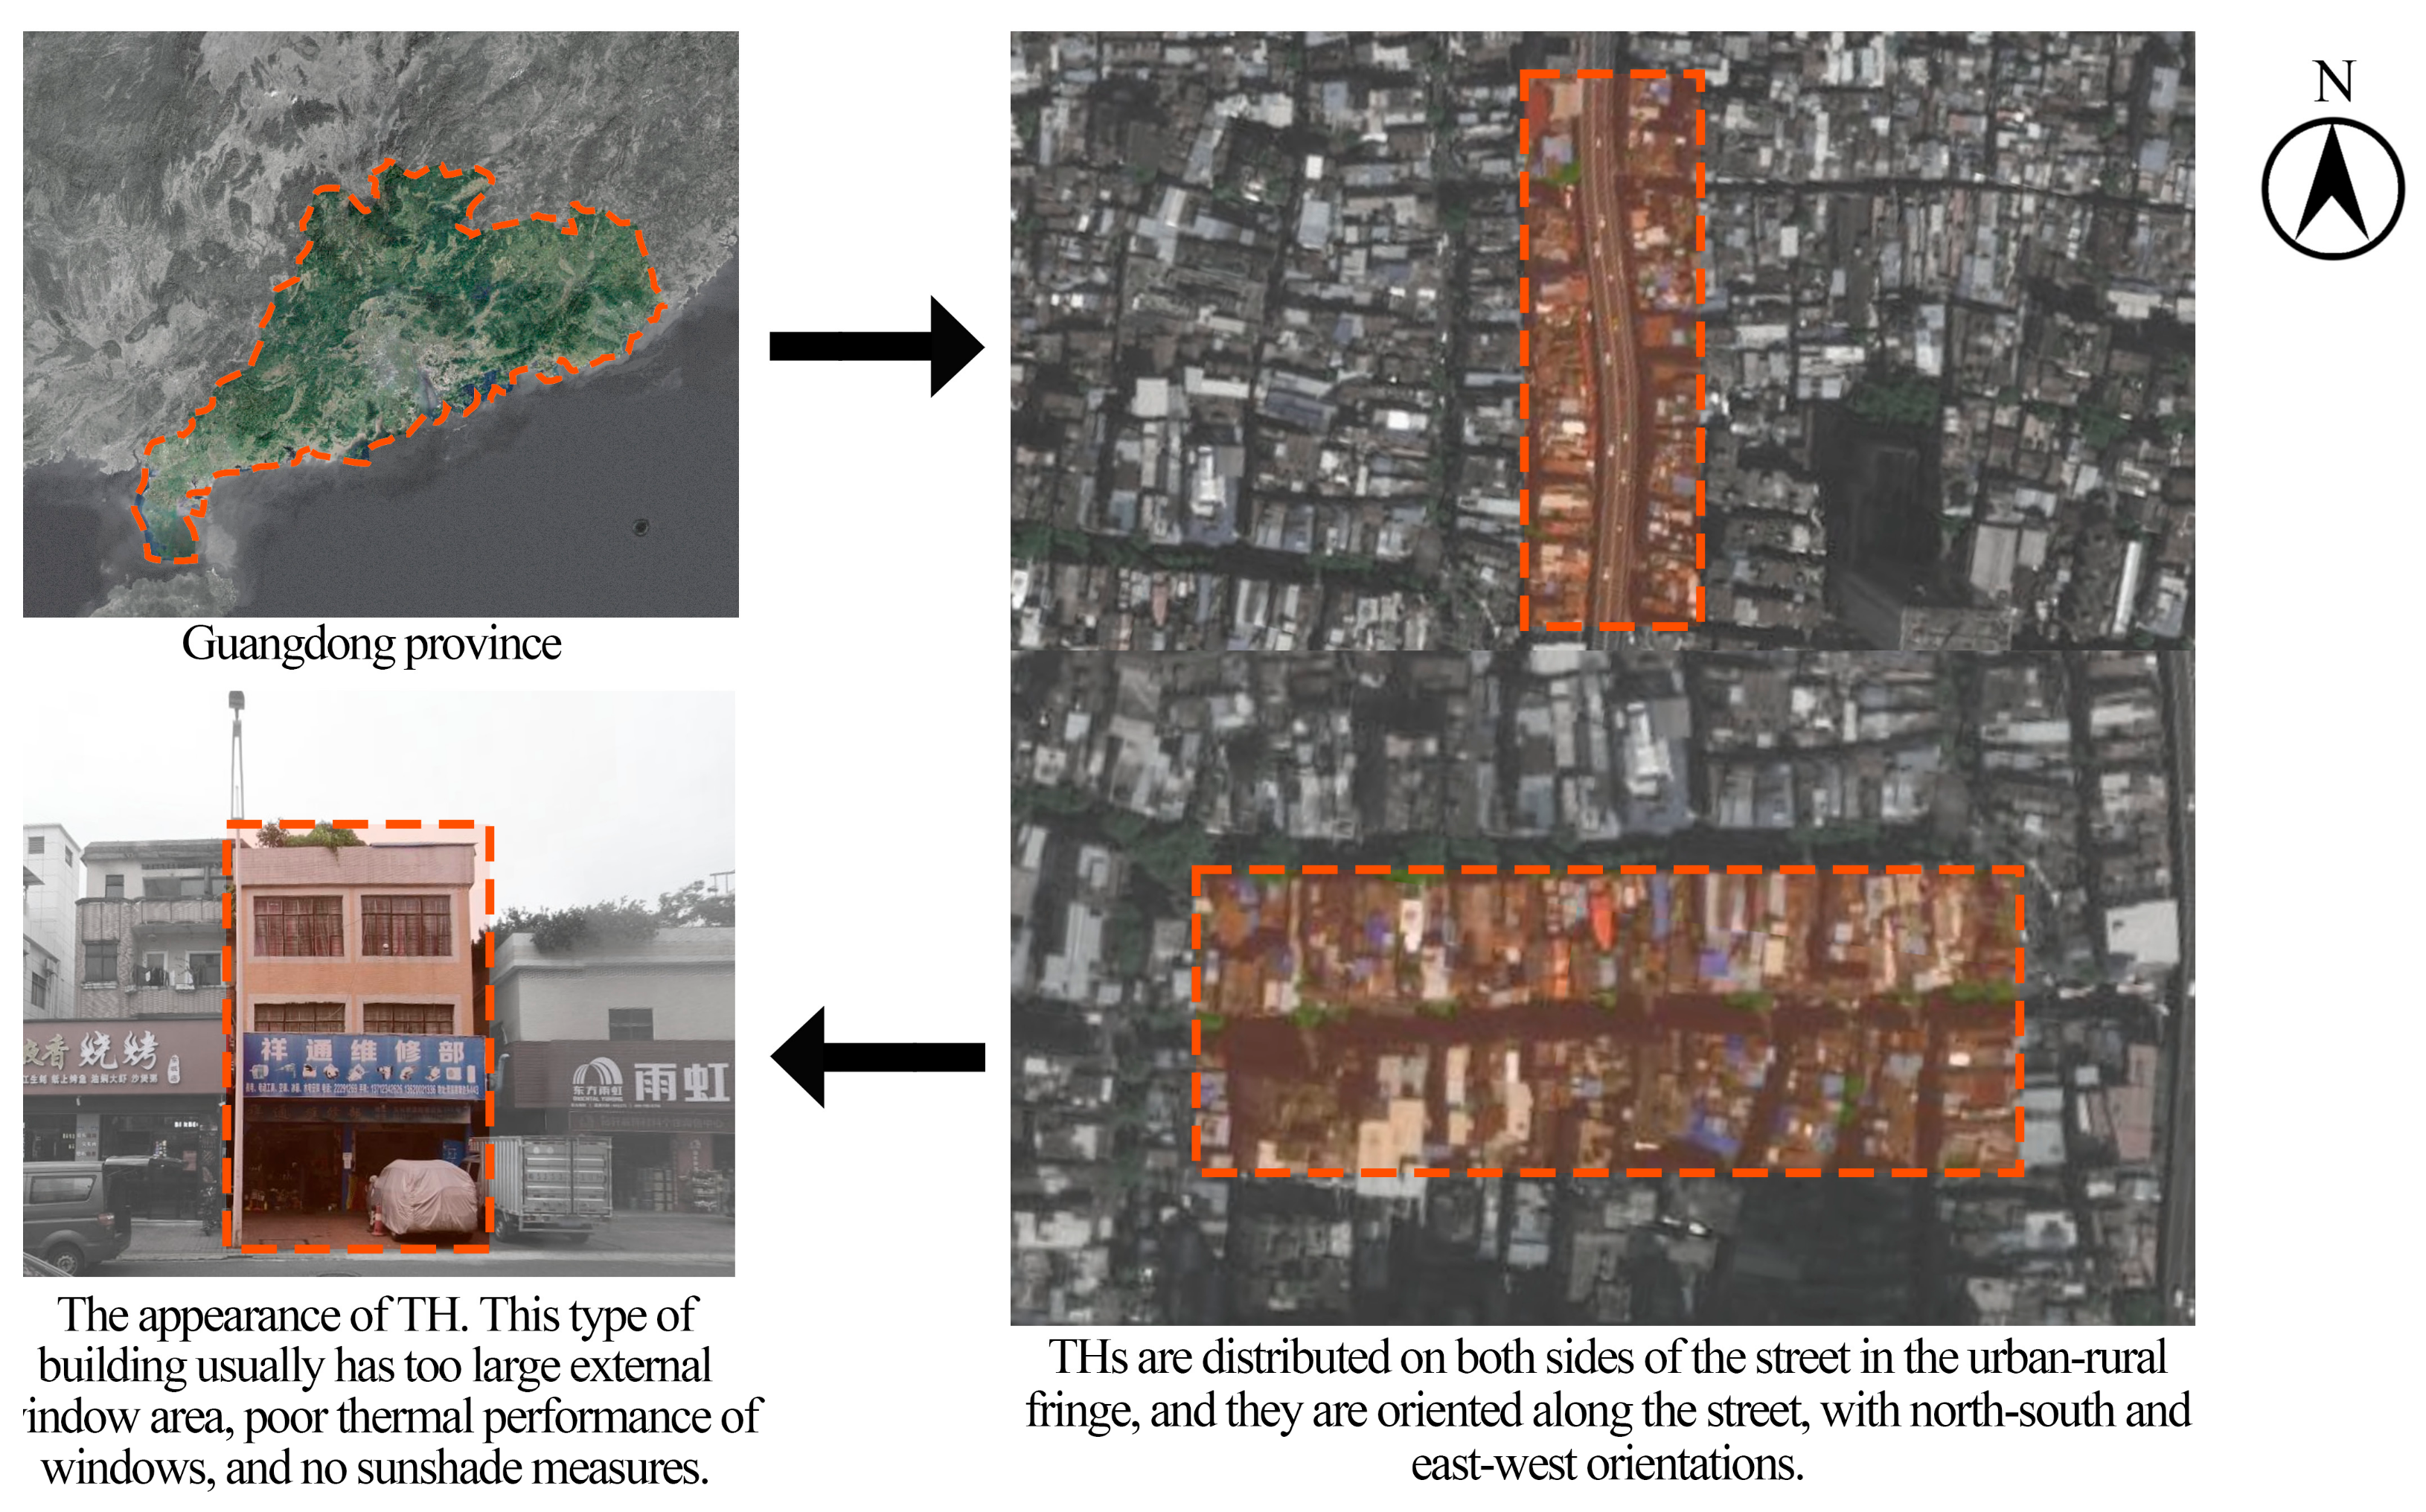
2.5. Building Geometry

As shown in Figure 6, THs distributed along the streets have four different orientation types. TH is a type of housing built by low-income individuals to meet their own housing needs without professional guidance. THs are 17.5 m long and 10 m wide, consisting of a ground floor with a shop, kitchen, dining room and bathroom, a second floor with a living room, bathroom and two bedrooms, a third floor with a bathroom and four bedrooms, and a fourth floor with a bathroom, a terrace, and two bedrooms. They also feature a central courtyard and a double staircase that runs through all four floors, as shown in Figure 7. The original TH design strategies are as shown in Table 2.

3. Result

3.1. Severity of Outdoor Climate

As can be seen from Figure 8, in accordance with the assessment criterion for ambient temperature, the degree of outdoor overheating is expected to gradually climb from 2030 to 2100. For the RCP2.6 condition, it will rise at a rate of 1.23% per decade and peak at 5.09% by 2100. Under RCP4.5, the corresponding increase will be 3.02% per decade and a staggering 20.94% by 2100. If placed under the RCP8.5 condition, the degree of outdoor overheating will mount at a rate of 8.01% every decade, reaching an astounding 72.47% by the end of the century.

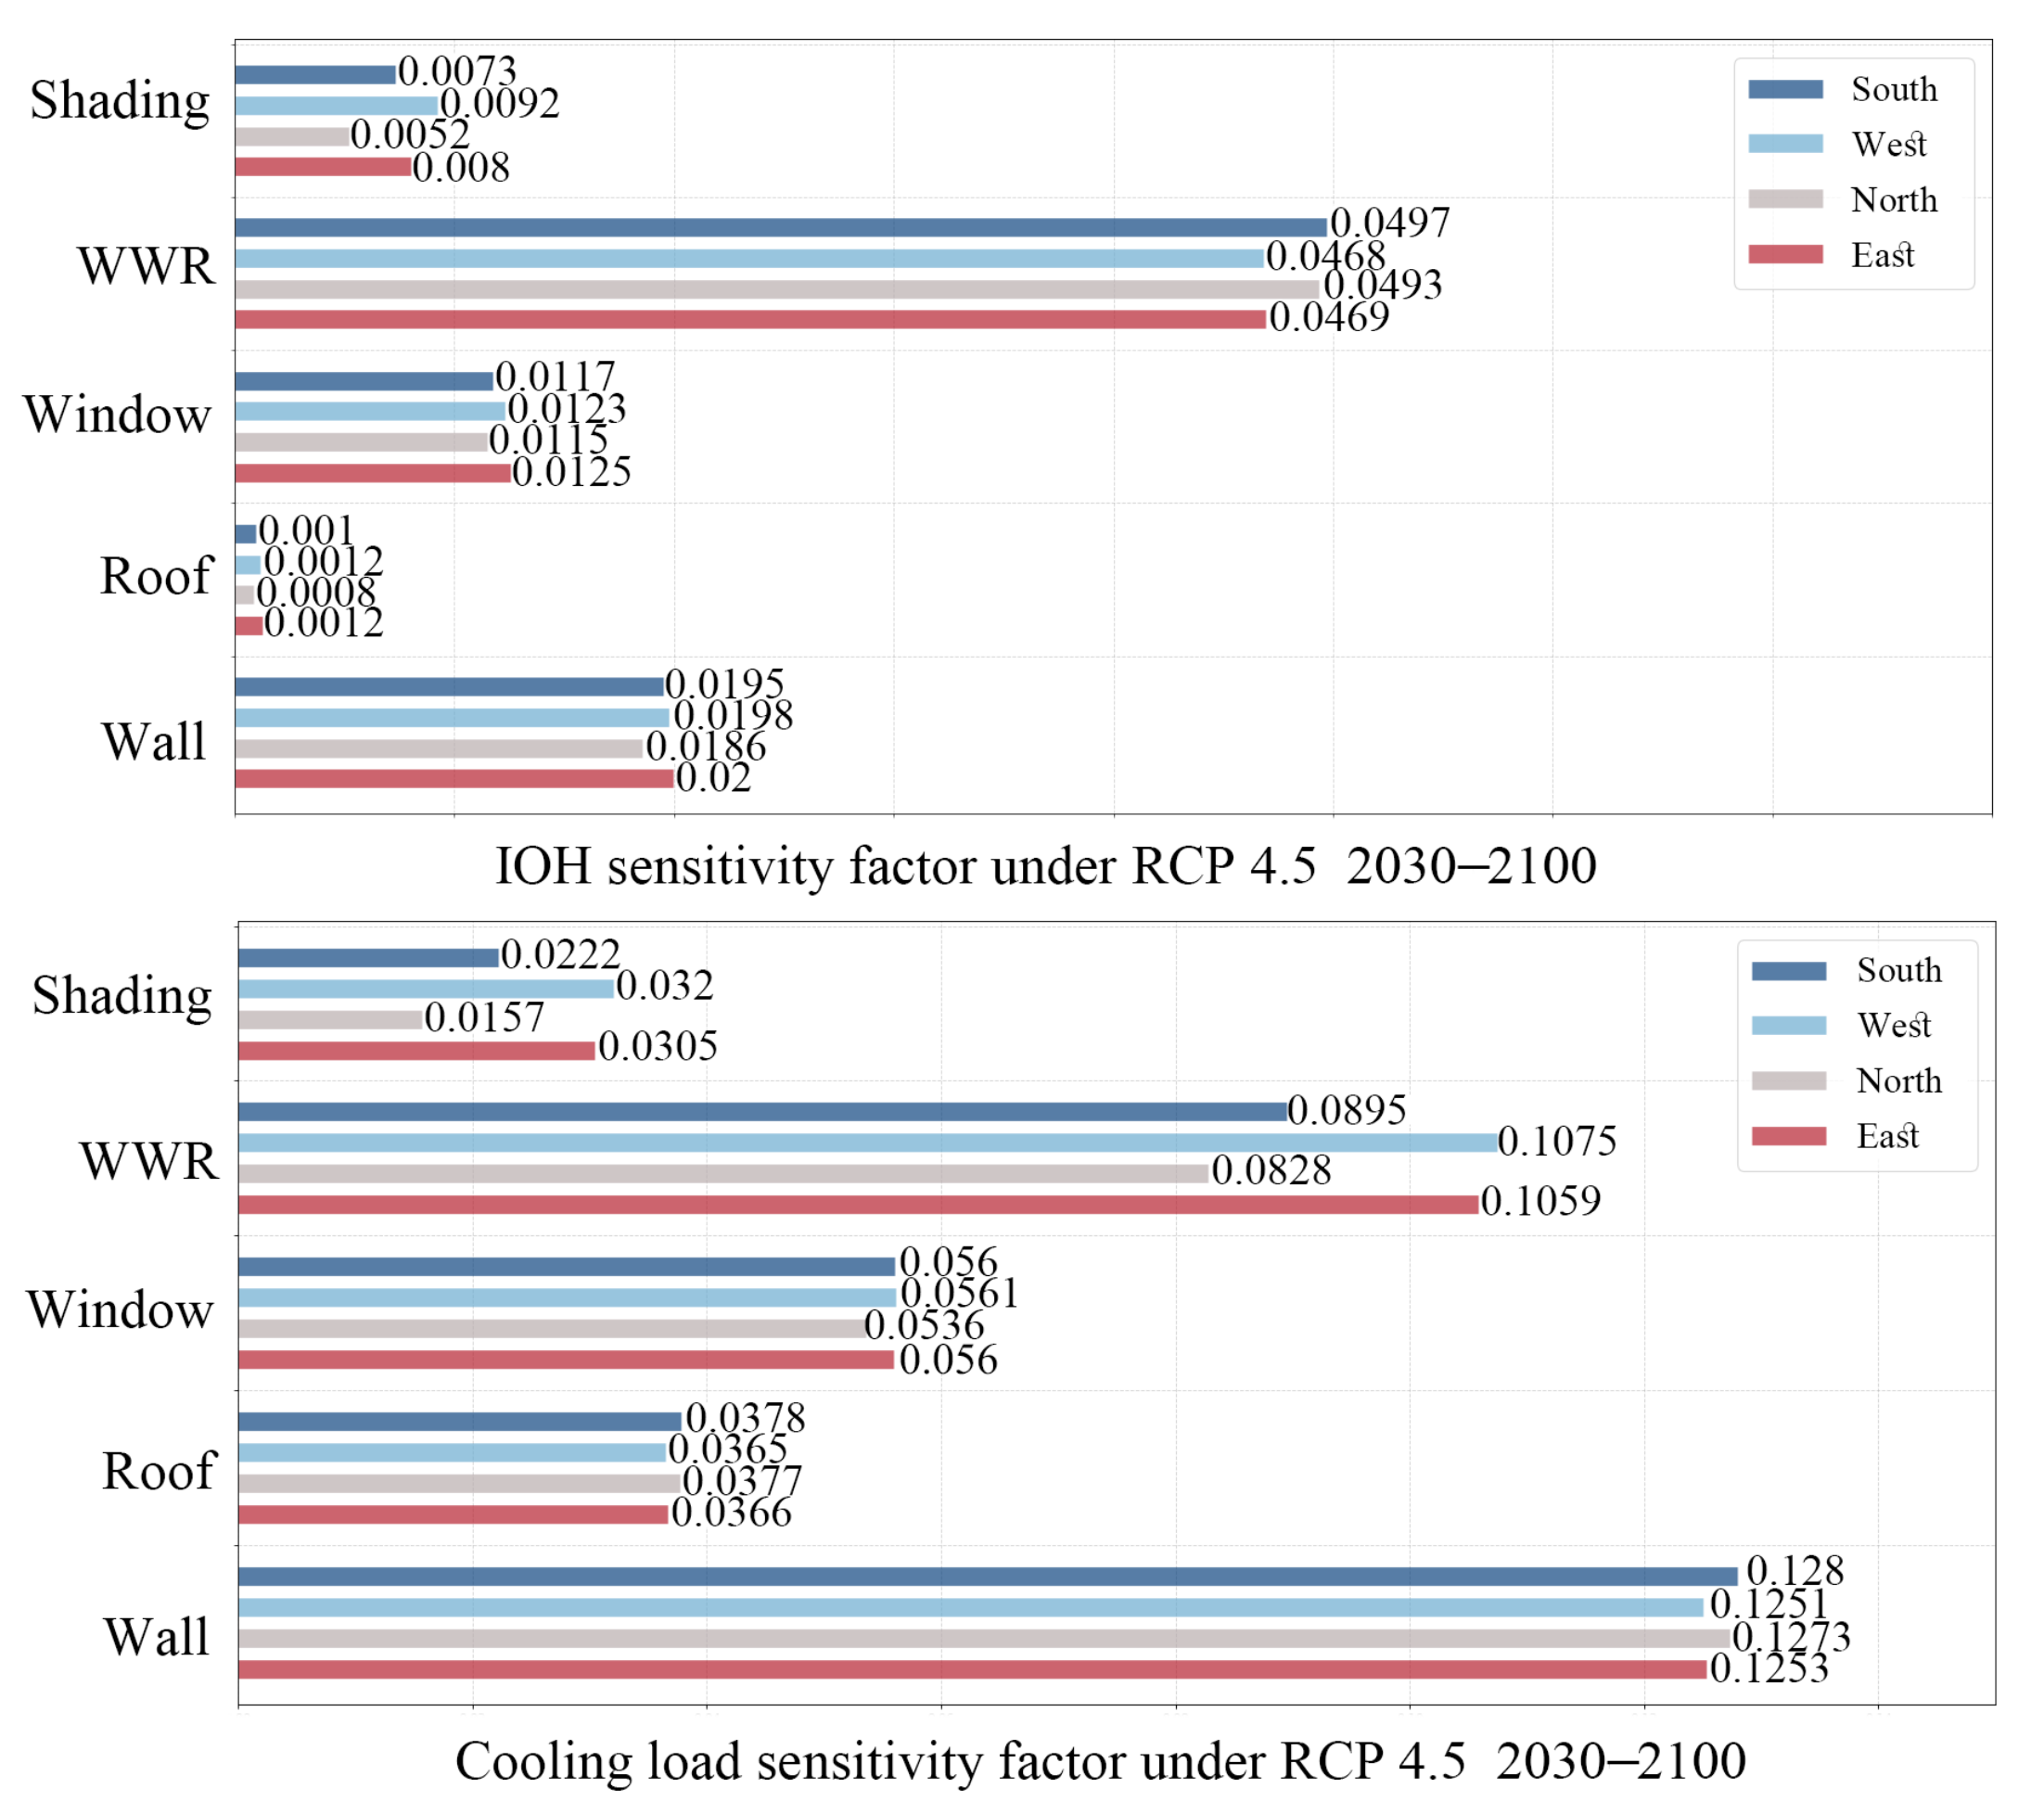
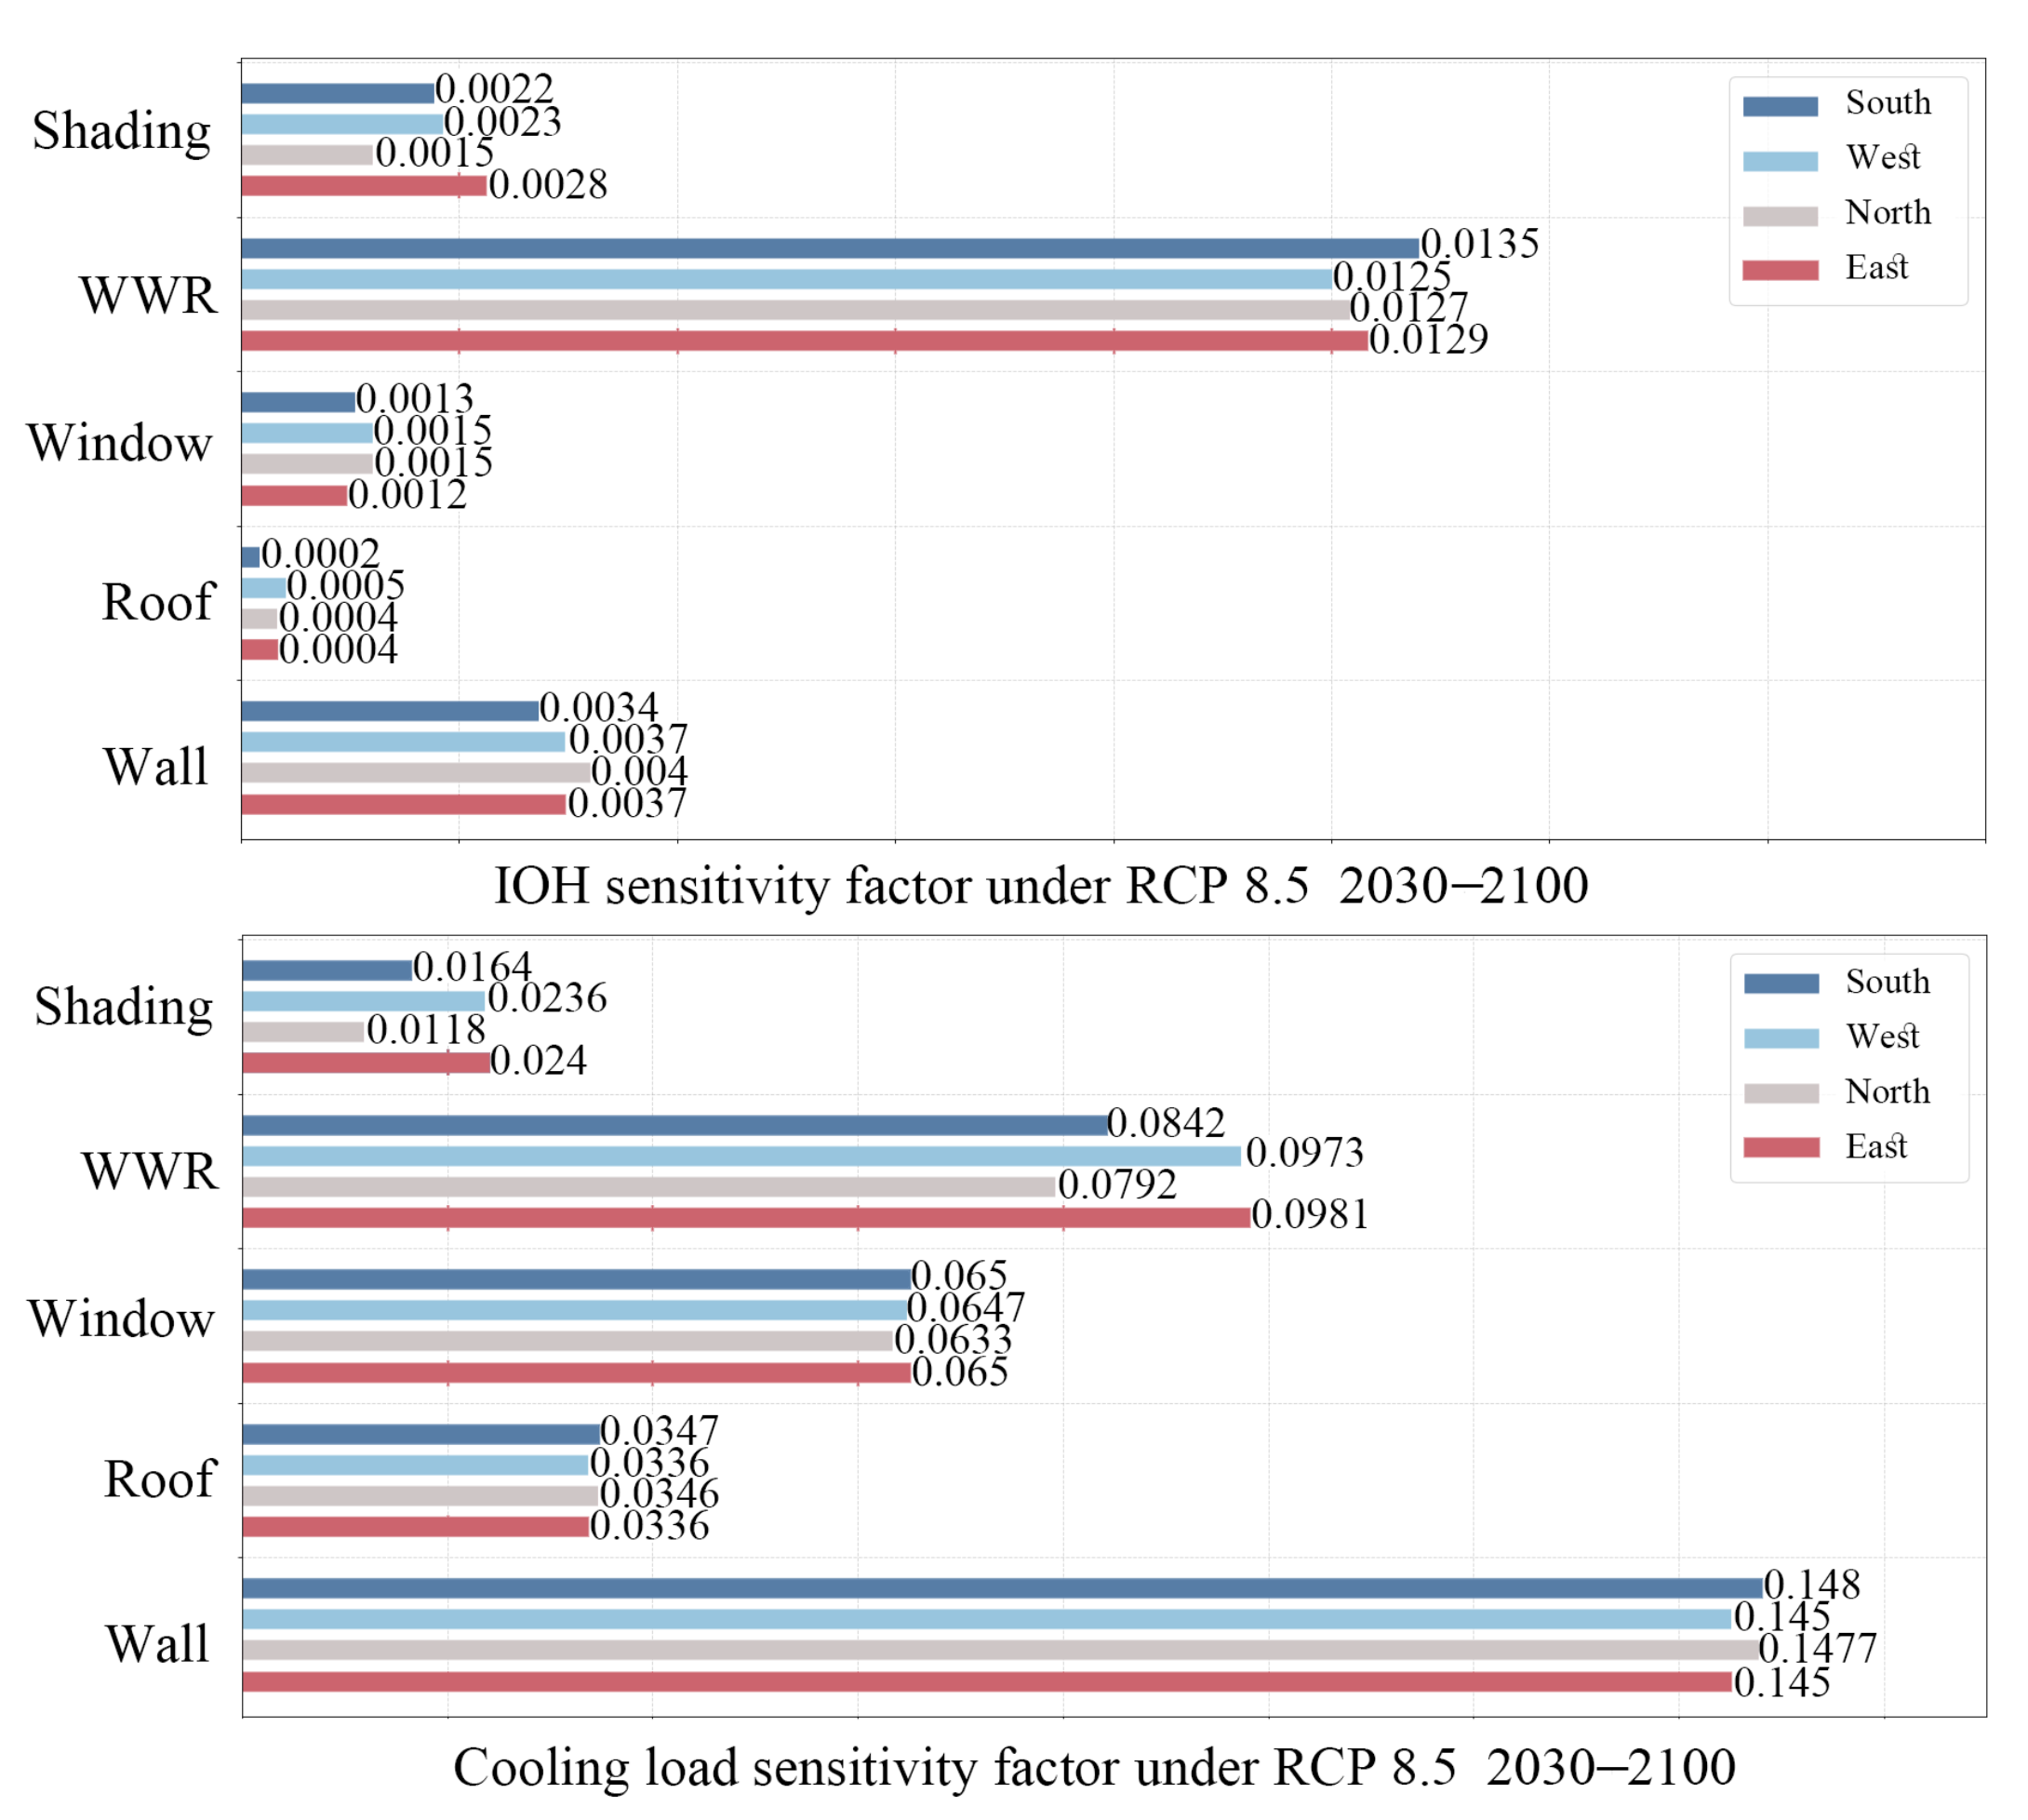
3.2. Sensitivity Coefficients of Various Components under Four Climates

From Figure 9, it can be seen that, under TMY conditions, the WWR has the greatest impact on the indoor overheating risk, with an average sensitivity coefficient of 0.078, while the overheating sensitivity coefficients of other design parameters are less than 0.03. In the cooling load sensitivity analysis, the sensitivity coefficients of WWR and wall U-value are significantly greater than those of other design parameters, being 0.095 and 0.087, respectively.
As can be seen from Figure 10, under the RCP2.6 scenario from 2030 to 2100, the WWR remains the factor with the greatest impact on indoor overheating risk at an average sensitivity coefficient of 0.056, while the roof U-value has the lowest sensitivity. In the cooling load sensitivity analysis, wall U-value and WWR showed a greater sensitivity, with coefficients of 0.112 and 0.086, respectively.
From Figure 11, it can be seen that under the RCP4.5 scenario from 2030 to 2100, the WWR is still the factor with the greatest impact on indoor overheating risk, at an average sensitivity coefficient of 0.048. In the cooling load sensitivity analysis, wall U-value has the greatest sensitivity coefficient at an average of 0.126, followed by the WWR at 0.096.
Under the RCP8.5 scenario from 2030 to 2100, the WWR remains the factor with the greatest impact on indoor overheating risk at an average sensitivity coefficient of 0.012. In the cooling load sensitivity analysis, wall U-value has the greatest sensitivity coefficient, at an average of 0.146, followed by the WWR at 0.089, as shown in Figure 12.
The study found that, in the TMY, RCP2.6, RCP4.5, and RCP8.5 scenarios in 2100, the WWR has the greatest impact on indoor overheating risk with a sensitivity coefficient ranging from 147.86% to more than 253.00% greater than other components in the same scenario. Meanwhile, the roof has the smallest impact on overheating risk. Additionally, the WWR and wall U-value have a much greater impact on indoor cooling load compared to other factors. In the TMY scenario, the impact of the WWR and wall U-value is almost the same, but as the RCP increases, the impact of wall U-value on cooling load becomes more significant than that of the WWR. In the RCP8.5 scenario, wall U-value has the greatest impact on cooling load, 163.2% greater than the WWR. Therefore, the WWR affects ventilation efficiency and the amount of solar radiation entering the room, while the wall U-value controls the external heat radiation entering and internal heat radiation exiting the room.

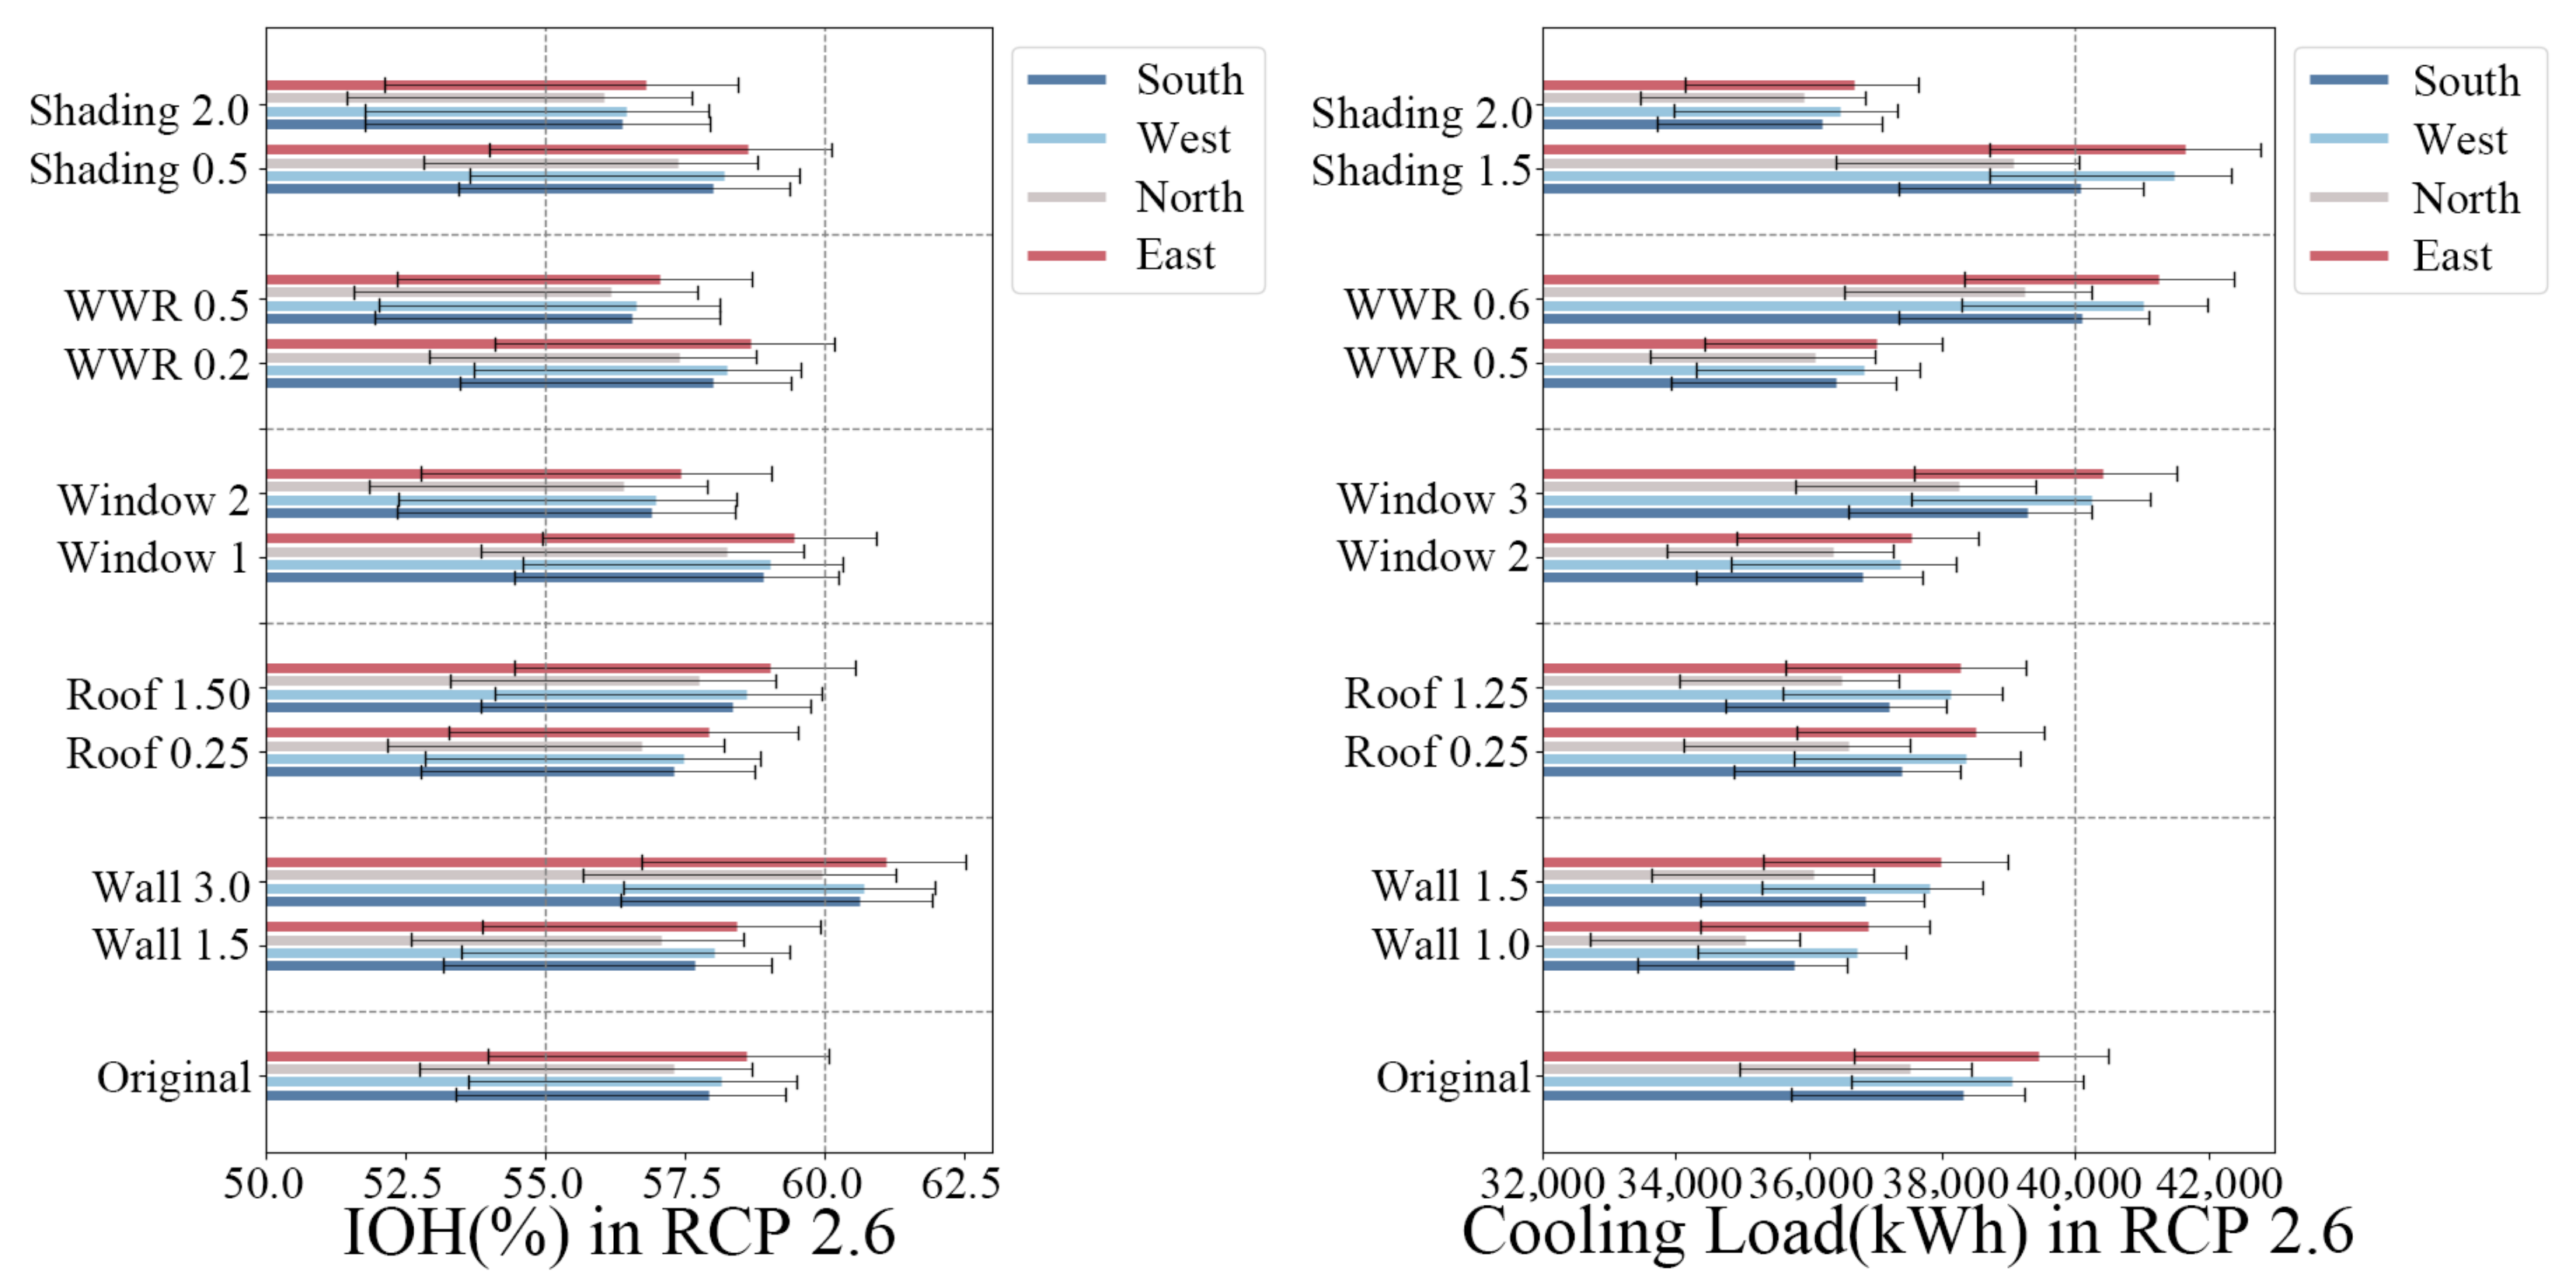
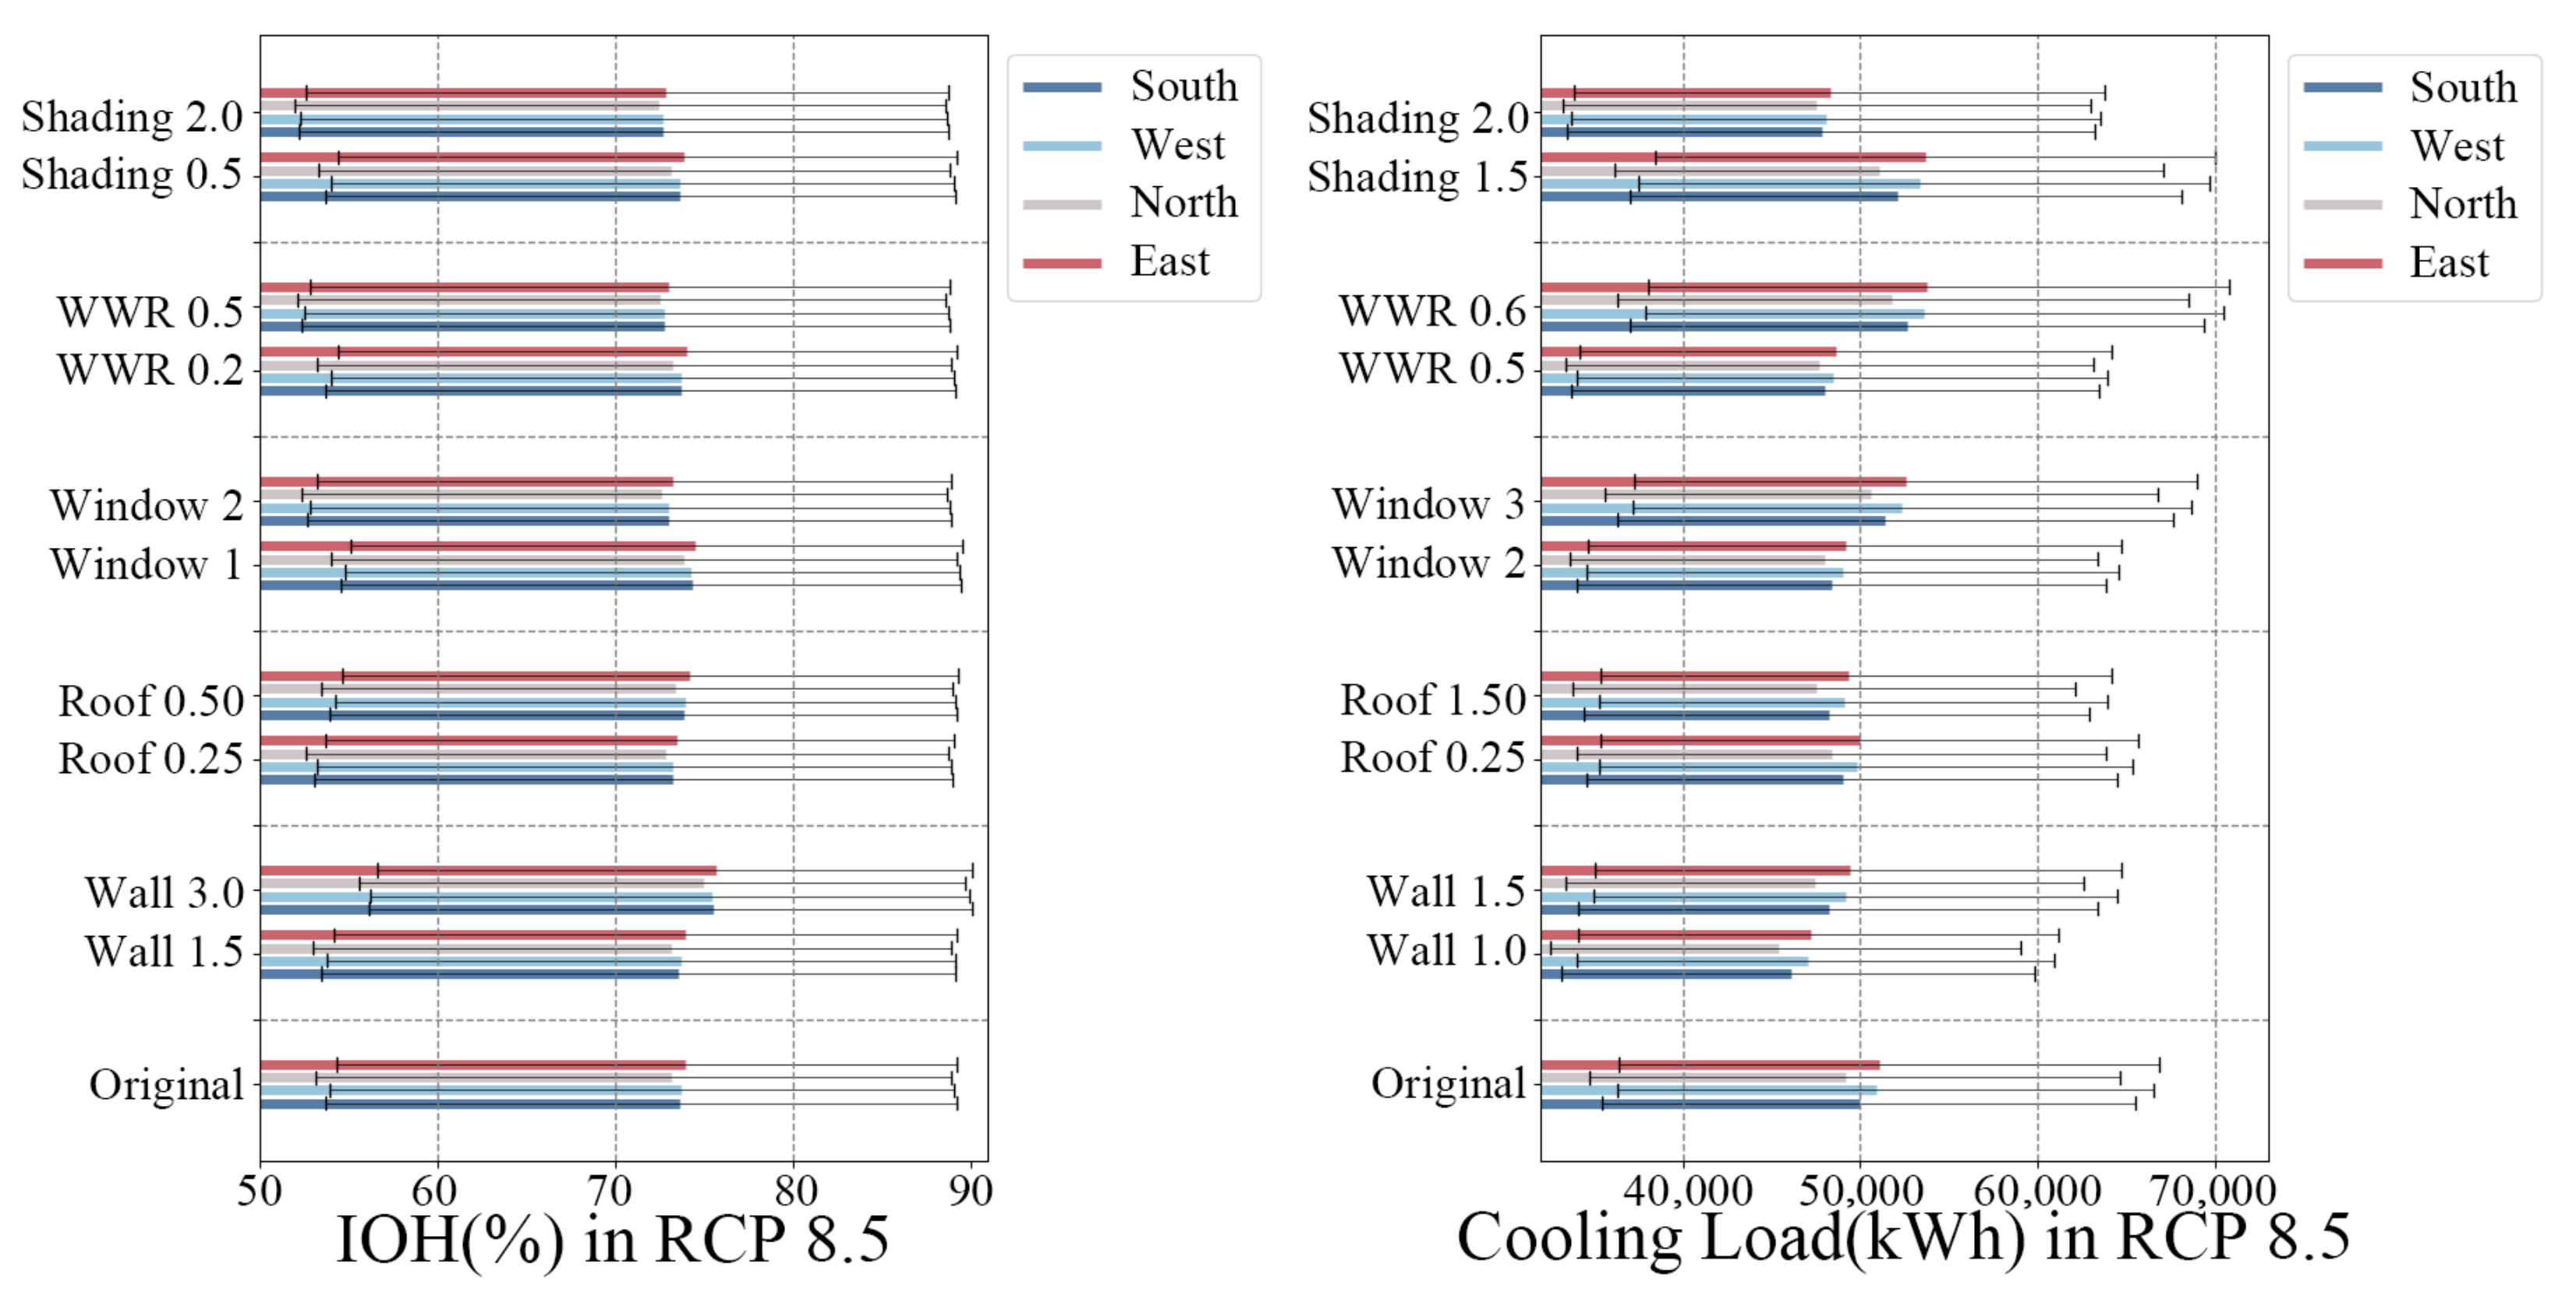
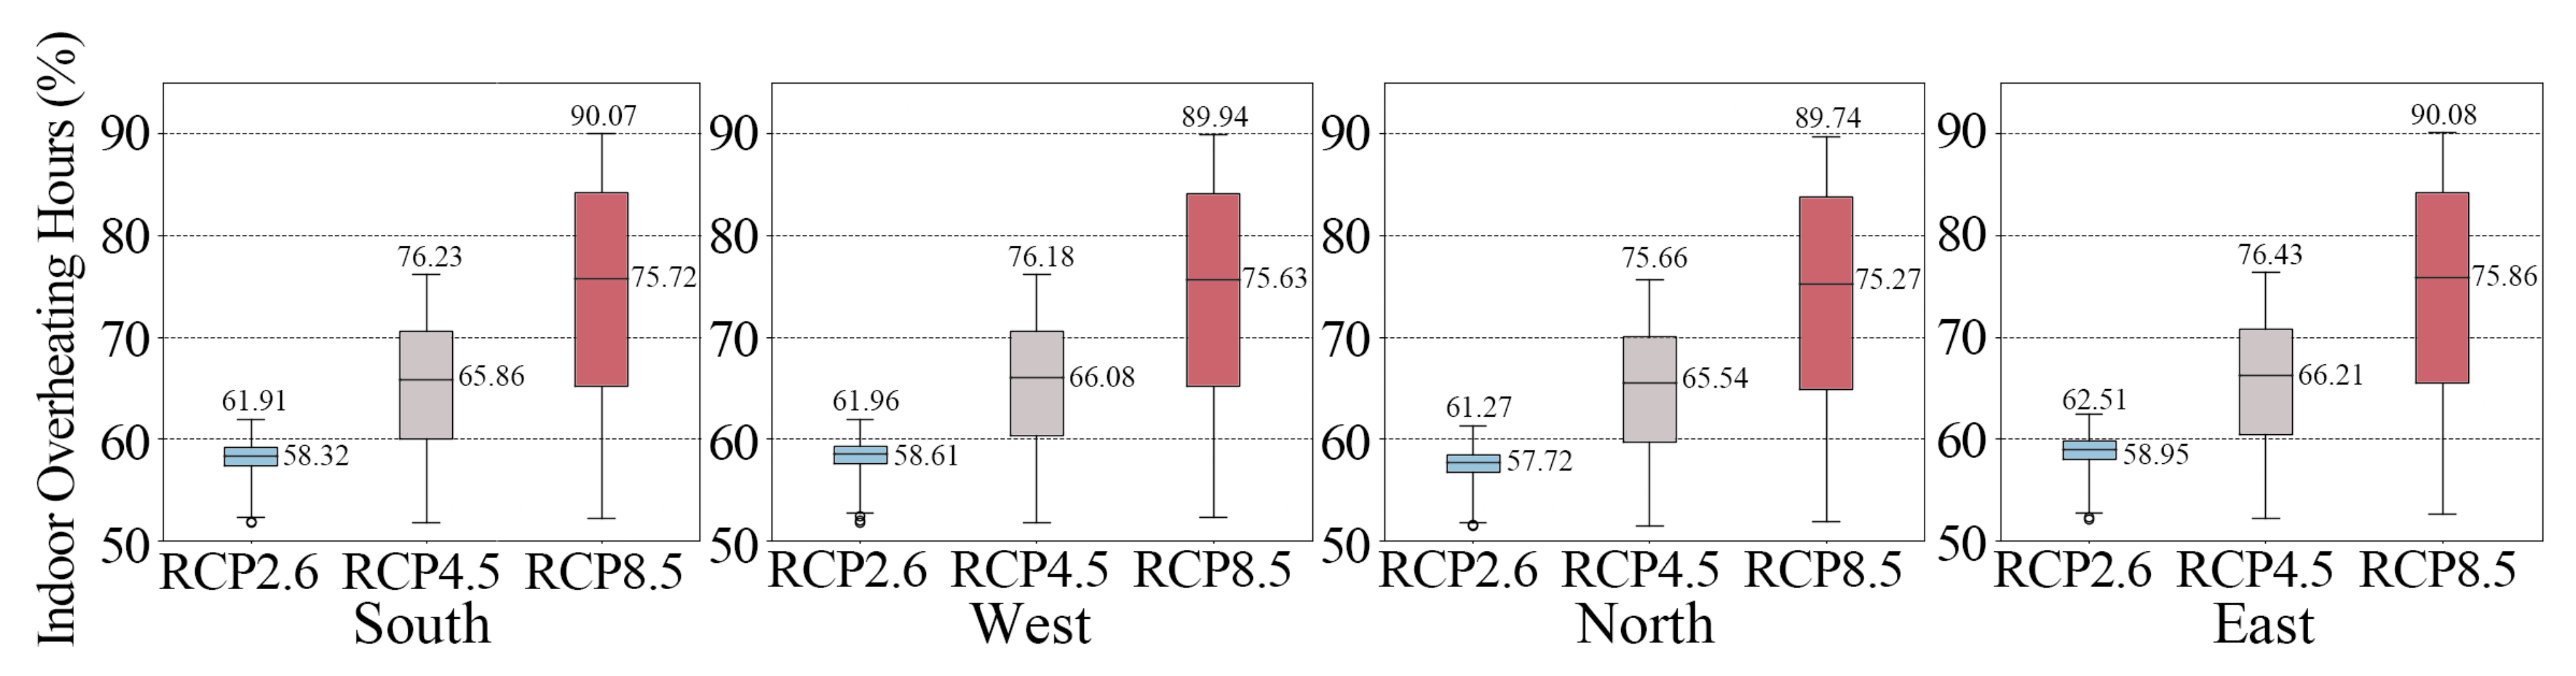
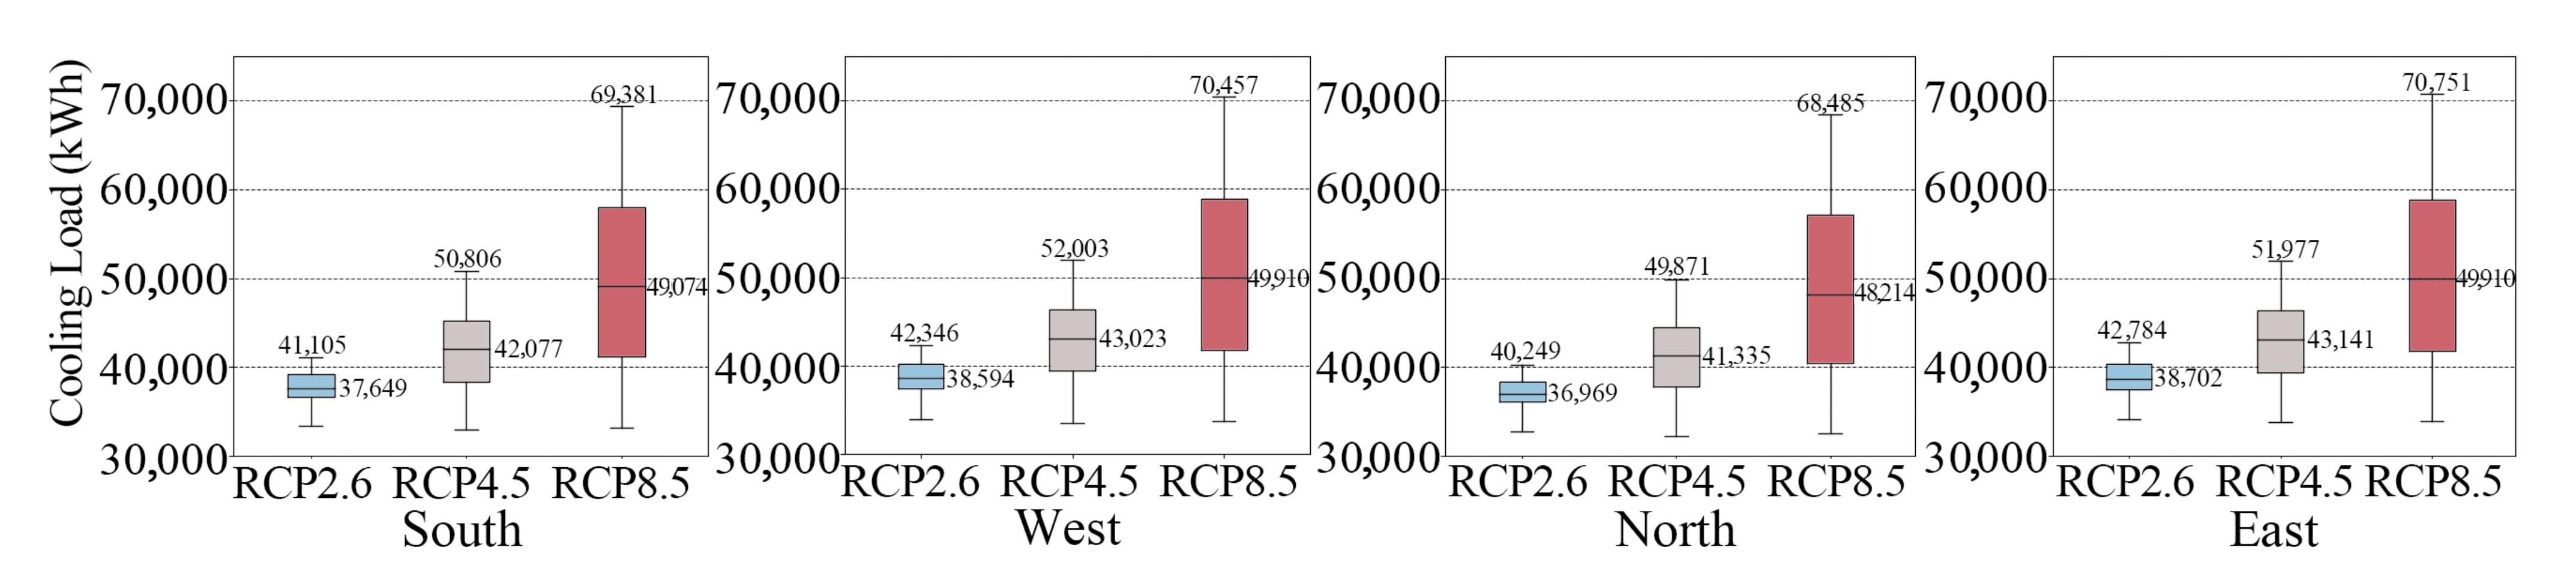
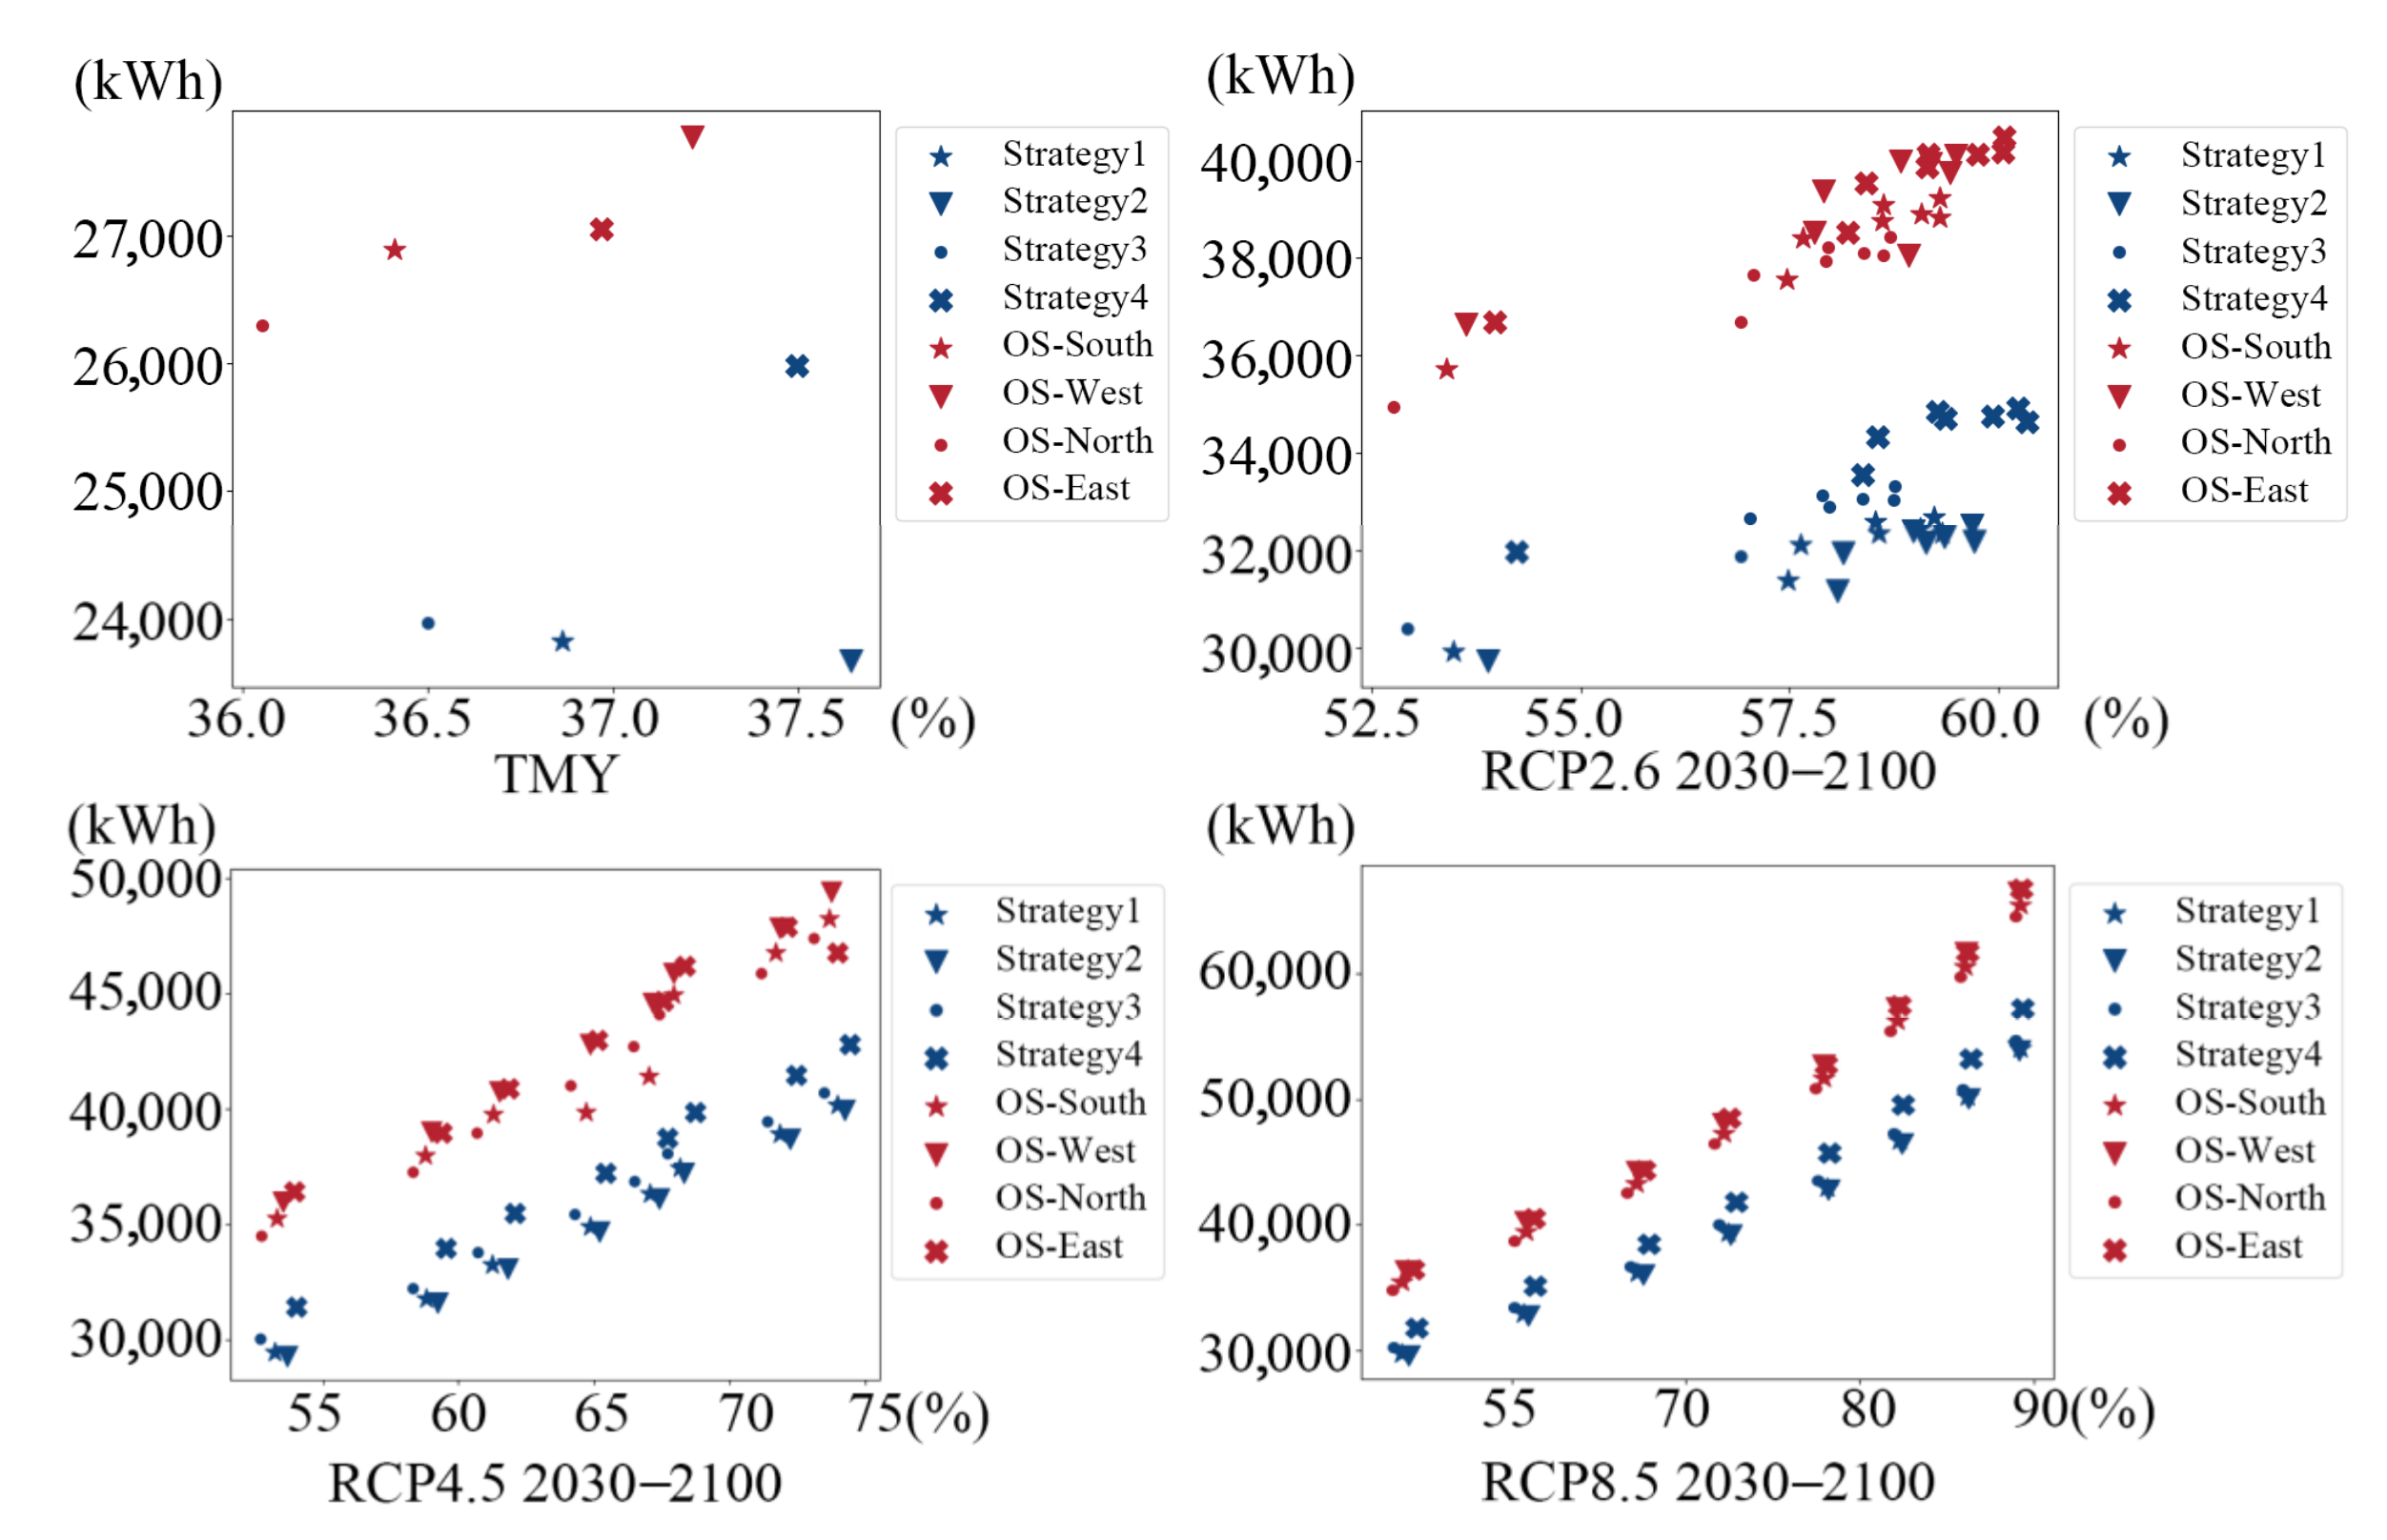
3.3. Thermal Discomfort and Energy Demand

To investigate the impact of enclosure structure performance on indoor thermal environment and cooling load, four different performance parameters were set for each component, including walls, roofs, windows, WWR, and shading, for four different orientations. The overheating and cooling load in the indoor environment from 2030 to 2100 were studied under TMY, RCP2.6, RCP4.5, and RCP8.5 scenarios.
Under the TMY scenario, the best improvement in cooling load was observed when the shading length was 0.2 m (Shading 2.0), WWR was 20% (WWR 0.2), the window U-value was 1, the roof U-value was 0.25, and the wall U-value was 1. Moreover, a longer shading length and smaller WWR, as well as lower changes in U-values for windows, roof, and wall, led to lower cooling loads in the indoor environment. As for the risk of overheating indoors, only the increase in shading length and gradual decrease in changing trend of roof U-value led to fewer overheating hours, while the opposite was observed for changes in WWR, window, and wall improvement strategies, as shown in Figure 13.
Under the RCP2.6 scenario, the lowest probability of indoor overheating risk was observed when the modification strategies for wall, roof, window, WWR, and shading were 1.5, 0.25, 2, 0.5, and 2, respectively. On the other hand, the lowest cooling load in the building was achieved when the modification strategies were 1, 1.25, 2, 0.5, and 2, respectively, as shown in Figure 14.
Under the RCP4.5 scenario, the lowest probability of indoor overheating risk was observed when the modification strategies for wall, roof, window, WWR, and shading were 1.5, 0.25, 2, 0.5, and 2, respectively. On the other hand, the lowest cooling load in the building was achieved when the modification strategies were 1, 0.25, 2, 0.5, and 2, respectively, as shown in Figure 15.
Under the RCP8.5 scenario, the lowest probability of indoor overheating risk was observed when the modification strategies for wall, roof, window, WWR, and shading were 1.5, 0.25, 2, 0.2, and 2, respectively. On the other hand, the lowest cooling load in the building was achieved when the modification strategies were 1, 1.5, 2, 0.5, and 2, respectively, as shown in Figure 16.
As shown in Figure 17, under the RCP2.6 scenario, the median of improved indoor overheating hours ranges from 57.7% to 58.6%, with a maximum of 62.51%. Under the RCP4.5 scenario, the median of overheating hours ranges from 65.5% to 66.2%, with a maximum of 76.43%. Meanwhile, under the RCP8.5 scenario, the median of overheating hours ranges from 75.2% to 75.8%, with a maximum of 90.08%.
As observed in Figure 18, under the RCP2.6 scenario, the median improved indoor cooling load ranges from 36,969 kWh to 38,594 kWh, with a maximum of 42,784 kWh. Under the RCP4.5 scenario, the median cooling load ranges from 41,335 kWh to 43,141 kWh, with a maximum of 52,003 kWh. Meanwhile, under the RCP8.5 scenario, the median cooling load ranges from 48,214 kWh to 49,910 kWh, with a maximum of 70,751 kWh. Additionally, the cooling load is lower for buildings facing north or south, but higher for those facing east or west.
The study found that under the RCP2.6, RCP4.5, RCP8.5, and TMY scenarios, buildings with a north–south orientation had a lower probability of indoor overheating and lower cooling loads compared to those with an east–west orientation. In scenarios with a north orientation, buildings had the lowest probability of indoor overheating and cooling loads, while those with a west orientation had the highest. To improve the situation, reducing solar radiation into the building and lowering the U-value of the building envelope to enhance the building’s heat dissipation were effective in reducing the cooling load. Strategies such as increasing shading length, WWR and wall U-value were effective in reducing the probability of indoor overheating risk by reducing solar radiation and increasing natural ventilation while reducing the inflow of outdoor heat radiation.
Through simulating various improvement strategies, we selected the optimal renovation strategies for residents with different orientations and needs. Residents primarily concerned with improving the thermal environment under natural ventilation can refer to the design strategies in the IOH section, while those primarily concerned with reducing cooling load with air-conditioning can refer to the design strategies in the cooling section, as shown in Table 3.
Incorporating the TMY, RCP2.6, RCP4.5, and RCP8.5 scenarios, the integration of Strategy 1, which corresponds to the south orientation, resulted in a cooling load reduction of from 12.81% to 21.11% when compared to the original strategy. Similarly, Strategy 2, aligned with the west orientation, led to cooling load reductions of from 17.3% to 23.56%. Strategy 3, representing the north orientation, yielded cooling load reductions ranging from 9.71% to 18.17%, while Strategy 4, embracing the east orientation, exhibited cooling load reductions of from 4.1% to 16.7%. This information is illustrated in Figure 19.

4. Discussions

The trend of rising temperatures in future is inevitable. For buildings located in humid and hot regions, the challenges of future energy efficiency and maintaining indoor comfort will be more pronounced. Terraced houses, as a predominant residential building typology in the study area, have a closely intertwined relationship between their architectural performance, local energy-saving initiatives, and residents’ quality of life and well-being. In comparison to historical typical climates, Guangzhou’s future temperatures are projected to experience a significant increase. The extent of the rise in cooling load for THs is contingent upon the deterioration of thermal conditions under natural ventilation, in relation to various climates. Thus, it becomes essential to explore the potential for enhancing TH building performance through retrofitting under future climates, thereby offering insights to building owners to allow for informed decisions to be made regarding architectural renovations.
In general, the various design parameters of TH, the WWR and wall U-value have the most significant impact on indoor IOH and cooling load. By adjusting these design parameters, the optimization of indoor thermal environment and cooling load can be achieved. It is worth noting that window opening size directly affects the ventilation rate and solar radiation entering the interior. Under natural ventilation, although a larger WWR value results in more solar heat gain, it removes indoor heat more efficiently by promoting air movement. As a result, this could mitigate indoor overheating to some extent [62]. On the other side, in the air-conditioned case, increased solar radiation results in a higher cooling load [63], as seen in the results presented in Section 3.3, where a larger WWR leads to higher IOH but lower cooling load, and vice versa with reduced WWR.
The uncertainty of future climate can impact the effectiveness of architectural renovations. Under natural ventilation, with future temperature increases, the impact of TH components on indoor thermal environment diminishes, and improving building envelope insulation performance alone is insufficient to enhance indoor thermal comfort. In the RCP2.6 scenario, it is possible to mitigate indoor overheating by adjusting the WWR, wall U-value, shading device length, roof U-value, and window U-value. In air-conditioned environments, measures such as reducing WWR, decreasing the envelope’s U-value, and increasing the length of shading devices significantly reduce cooling loads. However, with worsening climatic conditions under the RCP4.5 and RCP8.5 scenarios, it becomes challenging to alleviate indoor overheating through design parameter modifications of building components under natural ventilation. The results indicate that any optimized design strategies maintain the IOH at around 75%. Due to the rising outdoor temperatures, even higher ventilation rates fail to effectively cool the indoors. For TH residents with high heat tolerance, the implementation of building performance upgrade and retrofit may not necessarily be beneficial, both ecologically and economically, if the frequency of air conditioning usage does not significantly increase with rising temperatures.
Conversely, significant reductions in cooling load can be achieved through retrofitting, aligning with findings from some previous studies. In an air-conditioned environment, reducing the WWR, decreasing the envelope’s U-value, and increasing the length of shading devices all contribute to reducing external heat radiation. Therefore, in an environment where outdoor temperatures are gradually increasing, employing optimized design strategies can still significantly decrease indoor cooling loads. This finding aligns with relevant research conducted in other regions. Albayyaa et al. [64] achieved a 35% energy saving in buildings through retrofitting walls and floors. El-Darwish et al. [65] found that simple retrofitting strategies such as shading, window glazing, airtightness, and insulation could lead to an average energy consumption reduction of 33%. Yılmaz’s research on Turkish buildings revealed that altering design strategies had a significant positive impact on energy efficiency [66]. Considering the stock of TH buildings, the overall improvement in energy efficiency for this building type is of great significance in achieving carbon emission targets, especially in scenarios with substantial temperature increases.
Given the private nature of residential properties, whether to conduct renovations and how to do so largely depend on the users’ economic conditions and the expected benefits. The high initial investment in renovation is one of the main obstacles preventing residents from implementing building renovations [47]. In fact, adopting a reasonable retrofit scheme has long-term economic benefits (often with a 20- or 30-year cycle), characterized by an acceptable payback period and positive net present value [55,67,68,69]. Additionally, initial investments in renovations can be covered through bank loans. However, most homeowners are not aware of the economic benefits of building energy-saving retrofits due to a lack of knowledge in the field. As long as a thorough calculation ensures the economic benefits of the building energy-saving retrofit plan and s explained to homeowners, their enthusiasm for renovating their homes can be motivated. Clearly, the government and professionals need to coduct a lot of work in this regard.

5. Conclusions

The present study examines the impact of design strategies on the natural ventilation, indoor thermal environment and energy demand of THs under scenarios of increasingly severe climate change in the coming decades. Sensitivity analysis was used to investigate the impact of individual components on the overheating hours and cooling load. Multiple improvement strategies were simulated using EnergyPlus software, v. 23.1.0, to analyze indoor thermal environment and energy performance. The optimal set of strategies was selected for each of the four building orientations.
Multiple studies indicate that climate conditions will worsen from 2030 to 2100, with outdoor temperatures increasing at a rate of 0.2% to 1.94% per decade. This will lead to severe urban heat island effects and heatwaves, with the synergistic effects between the two becoming stronger. The rising outdoor temperatures result in more adverse indoor environments and increasing risks to the psychological and physiological health of residents. The burden of indoor cooling also significantly increases, posing enormous challenges to urban power systems. Some low-income populations reside in poorly constructed houses without professional guidance, leading to an inadequate thermal performance and low energy efficiency, which results in a higher risk of overheating and an increased cooling energy demand. Therefore, improving the thermal comfort environment in THs is of great significance for the health and energy burden of residents.
Environmental warmth is used to evaluate outdoor temperature under future climate conditions. The temperature change varies significantly across different climate scenarios. Between 2030 and 2100, outdoor temperature is expected to rise dramatically. Under the RCP2.6 scenario, the temperature is projected to increase by 5.09% by 2100 relative to 2030. Under the RCP4.5 scenario, the increase will be 20.94%, and under RCP8.5, the phenomenon will be even more pronounced, with a growth of 72.47% by 2100 compared to 2030. However, the trend of rising outdoor temperature is evident in all climate scenarios.
This study simulates the impact of various building components of THs on indoor thermal environment and energy demand under future climate conditions. It investigated the sensitivity of the U-values of walls, roofs, windows, as well as the length of shading devices and WWR. The results indicate that the WWR has the greatest impact on the overheating hours, while the WWR and wall U-value have the greatest impact on the cooling load. Moreover, a larger WWR can provide better natural ventilation to cool the indoor environment, while longer shading devices have a better shading effect, reducing the solar radiation entering the room and effectively reducing the overheating hours. However, larger U-values of walls, roofs, and windows are not conducive to the dissipation of indoor heat, leading to an increase in overheating hours. Changes in the length of shading devices in the east–west direction and control of WWR in the north–south direction have some impact on the overheating hours. The optimization effect of mitigation measures on overheating hours decreases as the climate becomes more severe. Under the worst-case RCP8.5 scenario, the best optimization effect on overheating hours is only 1.29%, while it is still effective in reducing indoor cooling load, with the best optimization effect of up to 7.62%. To find the optimal combination of mitigation strategies, this study selects one set of improvement combinations for each of the four building orientations. The result indicates that the combination of THs facing south can reduce cooling load by from 12.81% to 21.11% compared with the original strategy under the TMY, RCP2.6, RCP4.5, and RCP8.5 scenarios, while the combination for the west-facing THs reduced cooling load by 17.3% to 23.56%, the combination for the north-facing THs reduced the cooling load by 9.71% to 18.17%, and the combination for the east-facing THs reduced the cooling load by 4.1% to 16.7%.
Mitigating the indoor thermal environment under natural ventilation requires a larger WWR, but also introduces more solar radiation, thereby increasing the cooling load. In contrast, mitigating the indoor thermal environment in air-conditioned THs requires active cooling measures to reduce solar radiation and lower the cooling load. It is noteworthy that THs face challenges in alleviating the IOH under future climate changes through natural ventilation alone and must rely on active cooling measures. This study provides guiding suggestions for residents with cooling load demands by exploring improvement strategies for TH building performance. The aim is to help residents better cope with future IOH, reduce energy expenses, and alleviate the burden on urban electricity consumption.
The limitations of this study are that, although future climate changes are considered, the calculations only account for limited possibilities, treating each possibility’s probability as equal. The actual uncertainty of climate change is much more complex than the settings used in this study. One approach to address this limitation is to use data from multiple Global Climate Models (GCMs) to more comprehensively consider climate change factors and obtain probability distributions regarding building performance in the future, providing more accurate assessment results. Additionally, the study calculates building performance using fixed building operation schedules without considering residents’ complex indoor behaviors. The results cannot offer guidance to families with significantly different indoor behavioral patterns. Residents’ behavior patterns are highly diverse, and developing a stochastic indoor behavior model requires extensive research. Addressing the mentioned limitations will be the focus of the research team’s future work.

Author Contributions

Conceptualization, writing—review and editing, D.X.; formal analysis, writing—original draft preparation, W.X.; software, writing—review and editing, J.G.; resources, supervision, conceptualization, methodology, funding acquisition, Y.Z.; formal analysis, Z.W.; software, Y.F. All authors have read and agreed to the published version of the manuscript.

Funding

This research was funded by Guangdong Basic and Applied Basic Research Foundation (grant No. 2023A1515011364), Guangdong Philosophy and Social Science Planning Project (grant No. GD23YGL26), State Key Laboratory of Subtropical Building Science (grant No. 2022ZB06), and Technology Program of Guangzhou University (grant No. PT252022006).

Data Availability Statement

Publicly available meteorological datasets were used in this study. This data can be found here: https://meteonorm.com/en/.

Acknowledgments

We express our gratitude to the anonymous reviewers for their valuable comments and suggestions, as well as the editors for their guidance and support regarding the manuscript.

Conflicts of Interest

The authors declare no conflict of interest.

References

  1. Ogunbode, C.A.; Doran, R.; Böhm, G. Exposure to the IPCC Special Report on 1.5 °C Global Warming Is Linked to Perceived Threat and Increased Concern about Climate Change. Clim. Change 2020, 158, 361–375. [Google Scholar] [CrossRef]
  2. He, B.-J.; Wang, J.; Liu, H.; Ulpiani, G. Localized Synergies between Heat Waves and Urban Heat Islands: Implications on Human Thermal Comfort and Urban Heat Management. Environ. Res. 2021, 193, 110584. [Google Scholar] [CrossRef]
  3. Can, G.; Şahin, Ü.; Sayılı, U.; Dubé, M.; Kara, B.; Acar, H.C.; İnan, B.; Aksu Sayman, Ö.; Lebel, G.; Bustinza, R.; et al. Excess Mortality in Istanbul during Extreme Heat Waves between 2013 and 2017. Int. J. Environ. Res. Public Health 2019, 16, 4348. [Google Scholar] [CrossRef]
  4. Caldeira, D.; Dores, H.; Franco, F.; Bravo Baptista, S.; Cabral, S.; Cachulo, M.d.C.; Peixeiro, A.; Rodrigues, R.; Santos, M.; Timóteo, A.T.; et al. Global Warming and Heat Wave Risks for Cardiovascular Diseases: A Position Paper from the Portuguese Society of Cardiology. Rev. Port. Cardiol. 2023, in press. [Google Scholar] [CrossRef]
  5. Perkins, S.E. A Review on the Scientific Understanding of Heatwaves—Their Measurement, Driving Mechanisms, and Changes at the Global Scale. Atmos. Res. 2015, 164–165, 242–267. [Google Scholar] [CrossRef]
  6. Santamouris, M. Recent Progress on Urban Overheating and Heat Island Research. Integrated Assessment of the Energy, Environmental, Vulnerability and Health Impact. Synergies with the Global Climate Change. Energy Build. 2020, 207, 109482. [Google Scholar] [CrossRef]
  7. Xia, D.; Zhong, Z.; Huang, Y.; Zou, Y.; Lou, S.; Zhan, Q.; Guo, J.; Yang, J.; Guo, T. Impact of Coupled Heat and Moisture Transfer on Indoor Comfort and Energy Demand for Residential Buildings in Hot-Humid Regions. Energy Build. 2023, 288, 113029. [Google Scholar] [CrossRef]
  8. Anderson, G.B.; Bell, M.L. Heat Waves in the United States: Mortality Risk during Heat Waves and Effect Modification by Heat Wave Characteristics in 43 U.S. Communities. Environ. Health Perspect. 2011, 119, 210–218. [Google Scholar] [CrossRef]
  9. Kumar, A.; Singh, D.P. Heat Stroke-Related Deaths in India: An Analysis of Natural Causes of Deaths, Associated with the Regional Heatwave. J. Therm. Biol. 2021, 95, 102792. [Google Scholar] [CrossRef]
  10. Jung, C.-C.; Hsia, Y.-F.; Hsu, N.-Y.; Wang, Y.-C.; Su, H.-J. Cumulative Effect of Indoor Temperature on Cardiovascular Disease–Related Emergency Department Visits among Older Adults in Taiwan. Sci. Total Environ. 2020, 731, 138958. [Google Scholar] [CrossRef]
  11. Cleland, S.E.; Steinhardt, W.; Neas, L.M.; Jason West, J.; Rappold, A.G. Urban Heat Island Impacts on Heat-Related Cardiovascular Morbidity: A Time Series Analysis of Older Adults in US Metropolitan Areas. Environ. Int. 2023, 178, 108005. [Google Scholar] [CrossRef]
  12. Vandentorren, S.; Bretin, P.; Zeghnoun, A.; Mandereau-Bruno, L.; Croisier, A.; Cochet, C.; Ribéron, J.; Siberan, I.; Declercq, B.; Ledrans, M. August 2003 Heat Wave in France: Risk Factors for Death of Elderly People Living at Home. Eur. J. Public Health 2006, 16, 583–591. [Google Scholar] [CrossRef]
  13. Ke, X.; Wu, D.; Rice, J.; Kintner-Meyer, M.; Lu, N. Quantifying Impacts of Heat Waves on Power Grid Operation. Appl. Energy 2016, 183, 504–512. [Google Scholar] [CrossRef]
  14. Santamouris, M.; Cartalis, C.; Synnefa, A.; Kolokotsa, D. On the Impact of Urban Heat Island and Global Warming on the Power Demand and Electricity Consumption of Buildings—A Review. Energy Build. 2015, 98, 119–124. [Google Scholar] [CrossRef]
  15. Roxon, J.; Ulm, F.-J.; Pellenq, R.J.-M. Urban Heat Island Impact on State Residential Energy Cost and CO2 Emissions in the United States. Urban Clim. 2020, 31, 100546. [Google Scholar] [CrossRef]
  16. Valois, P.; Talbot, D.; Caron, M.; Carrier, M.-P.; Morin, A.J.S.; Renaud, J.-S.; Jacob, J.; Gosselin, P. Development and Validation of a Behavioural Index for Adaptation to High Summer Temperatures among Urban Dwellers. Int. J. Environ. Res. Public Health 2017, 14, 820. [Google Scholar] [CrossRef]
  17. Lau, A.K.K.; Salleh, E.; Lim, C.H.; Sulaiman, M.Y. Potential of Shading Devices and Glazing Configurations on Cooling Energy Savings for High-Rise Office Buildings in Hot-Humid Climates: The Case of Malaysia. Int. J. Sustain. Built Environ. 2016, 5, 387–399. [Google Scholar] [CrossRef]
  18. Gou, Z.; Gamage, W.; Lau, S.S.-Y.; Lau, S.S.-Y. An Investigation of Thermal Comfort and Adaptive Behaviors in Naturally Ventilated Residential Buildings in Tropical Climates: A Pilot Study. Buildings 2018, 8, 5. [Google Scholar] [CrossRef]
  19. Zhai, Y.; Wang, Y.; Huang, Y.; Meng, X. A Multi-Objective Optimization Methodology for Window Design Considering Energy Consumption, Thermal Environment and Visual Performance. Renew. Energy 2019, 134, 1190–1199. [Google Scholar] [CrossRef]
  20. Sailor, D.J. Risks of Summertime Extreme Thermal Conditions in Buildings as a Result of Climate Change and Exacerbation of Urban Heat Islands. Build. Environ. 2014, 78, 81–88. [Google Scholar] [CrossRef]
  21. Baba, F.M.; Ge, H.; Wang, L.; Zmeureanu, R. Assessing and Mitigating Overheating Risk in Existing Canadian School Buildings under Extreme Current and Future Climates. Energy Build. 2023, 279, 112710. [Google Scholar] [CrossRef]
  22. Baglivo, C.; Congedo, P.M.; Murrone, G.; Lezzi, D. Long-Term Predictive Energy Analysis of a High-Performance Building in a Mediterranean Climate under Climate Change. Energy 2022, 238, 121641. [Google Scholar] [CrossRef]
  23. Andric, I.; Al-Ghamdi, S.G. Climate Change Implications for Environmental Performance of Residential Building Energy Use: The Case of Qatar. Energy Rep. 2020, 6, 587–592. [Google Scholar] [CrossRef]
  24. Muñoz González, C.M.; León Rodríguez, A.L.; Suárez Medina, R.; Ruiz Jaramillo, J. Effects of Future Climate Change on the Preservation of Artworks, Thermal Comfort and Energy Consumption in Historic Buildings. Appl. Energy 2020, 276, 115483. [Google Scholar] [CrossRef]
  25. Ciancio, V.; Salata, F.; Falasca, S.; Curci, G.; Golasi, I.; de Wilde, P. Energy Demands of Buildings in the Framework of Climate Change: An Investigation across Europe. Sustain. Cities Soc. 2020, 60, 102213. [Google Scholar] [CrossRef]
  26. Pérez-Andreu, V.; Aparicio-Fernández, C.; Martínez-Ibernón, A.; Vivancos, J.-L. Impact of Climate Change on Heating and Cooling Energy Demand in a Residential Building in a Mediterranean Climate. Energy 2018, 165, 63–74. [Google Scholar] [CrossRef]
  27. Flores-Larsen, S.; Filippín, C.; Barea, G. Impact of Climate Change on Energy Use and Bioclimatic Design of Residential Buildings in the 21st Century in Argentina. Energy Build. 2019, 184, 216–229. [Google Scholar] [CrossRef]
  28. Velashjerdi Farahani, A.; Jokisalo, J.; Korhonen, N.; Jylhä, K.; Kosonen, R.; Lestinen, S. Performance Assessment of Ventilative and Radiant Cooling Systems in Office Buildings during Extreme Weather Conditions under a Changing Climate. J. Build. Eng. 2022, 57, 104951. [Google Scholar] [CrossRef]
  29. Zou, Y.; Deng, Y.; Xia, D.; Lou, S.; Yang, X.; Huang, Y.; Guo, J.; Zhong, Z. Comprehensive Analysis on the Energy Resilience Performance of Urban Residential Sector in Hot-Humid Area of China under Climate Change. Sustain. Cities Soc. 2023, 88, 104233. [Google Scholar] [CrossRef]
  30. Hosseini, M.; Javanroodi, K.; Nik, V.M. High-Resolution Impact Assessment of Climate Change on Building Energy Performance Considering Extreme Weather Events and Microclimate—Investigating Variations in Indoor Thermal Comfort and Degree-Days. Sustain. Cities Soc. 2022, 78, 103634. [Google Scholar] [CrossRef]
  31. Bell, N.O.; Bilbao, J.I.; Kay, M.; Sproul, A.B. Future Climate Scenarios and Their Impact on Heating, Ventilation and Air-Conditioning System Design and Performance for Commercial Buildings for 2050. Renew. Sustain. Energy Rev. 2022, 162, 112363. [Google Scholar] [CrossRef]
  32. Jafarpur, P.; Berardi, U. Effects of Climate Changes on Building Energy Demand and Thermal Comfort in Canadian Office Buildings Adopting Different Temperature Setpoints. J. Build. Eng. 2021, 42, 102725. [Google Scholar] [CrossRef]
  33. Moazami, A.; Nik, V.M.; Carlucci, S.; Geving, S. Impacts of Future Weather Data Typology on Building Energy Performance—Investigating Long-Term Patterns of Climate Change and Extreme Weather Conditions. Appl. Energy 2019, 238, 696–720. [Google Scholar] [CrossRef]
  34. Sánchez-García, D.; Rubio-Bellido, C.; del Río, J.J.M.; Pérez-Fargallo, A. Towards the Quantification of Energy Demand and Consumption through the Adaptive Comfort Approach in Mixed Mode Office Buildings Considering Climate Change. Energy Build. 2019, 187, 173–185. [Google Scholar] [CrossRef]
  35. Li, X.; Chambers, J.; Yilmaz, S.; Patel, M.K. A Monte Carlo Building Stock Model of Space Cooling Demand in the Swiss Service Sector under Climate Change. Energy Build. 2021, 233, 110662. [Google Scholar] [CrossRef]
  36. Ramon, D.; Allacker, K.; De Troyer, F.; Wouters, H.; van Lipzig, N.P.M. Future Heating and Cooling Degree Days for Belgium under a High-End Climate Change Scenario. Energy Build. 2020, 216, 109935. [Google Scholar] [CrossRef]
  37. Spinoni, J.; Vogt, J.V.; Barbosa, P.; Dosio, A.; McCormick, N.; Bigano, A.; Füssel, H.-M. Changes of Heating and Cooling Degree-Days in Europe from 1981 to 2100. Int. J. Climatol. 2018, 38, e191–e208. [Google Scholar] [CrossRef]
  38. Zhang, S.; Sun, P.; Sun, E.P. Research on Energy Saving of Small Public Building Envelope System. Energy Rep. 2022, 8, 559–565. [Google Scholar] [CrossRef]
  39. Moreles, E.; Huelsz, G.; Barrios, G. Hysteresis Effects on the Thermal Performance of Building Envelope PCM-Walls. Build. Simul. 2018, 11, 519–531. [Google Scholar] [CrossRef]
  40. Alshuraiaan, B. Efficient Utilization of PCM in Building Envelope in a Hot Environment Condition. Int. J. Thermofluids 2022, 16, 100205. [Google Scholar] [CrossRef]
  41. Wu, D.; Rahim, M.; El Ganaoui, M.; Bennacer, R.; Liu, B. Multilayer Assembly of Phase Change Material and Bio-Based Concrete: A Passive Envelope to Improve the Energy and Hygrothermal Performance of Buildings. Energy Convers. Manag. 2022, 257, 115454. [Google Scholar] [CrossRef]
  42. Aslani, A.; Hachem-Vermette, C. Energy and Environmental Assessment of High-Performance Building Envelope in Cold Climate. Energy Build. 2022, 260, 111924. [Google Scholar] [CrossRef]
  43. Tarek, D.; Ahmed, M.M.; Hussein, H.S.; Zeyad, A.M.; Al-Enizi, A.M.; Yousef, A.; Ragab, A. Building Envelope Optimization Using Geopolymer Bricks to Improve the Energy Efficiency of Residential Buildings in Hot Arid Regions. Case Stud. Constr. Mater. 2022, 17, e01657. [Google Scholar] [CrossRef]
  44. Dora, S.; Barta, R.B.; Mini, K.M. Study on Foam Concrete Incorporated with Expanded Vermiculite/Capric Acid PCM—A Novel Thermal Storage High-Performance Building Material. Constr. Build. Mater. 2023, 392, 131903. [Google Scholar] [CrossRef]
  45. Mourid, A.; El Alami, M.; Kuznik, F. Experimental Investigation on Thermal Behavior and Reduction of Energy Consumption in a Real Scale Building by Using Phase Change Materials on Its Envelope. Sustain. Cities Soc. 2018, 41, 35–43. [Google Scholar] [CrossRef]
  46. Al-Yasiri, Q.; Szabó, M. Phase Change Material Coupled Building Envelope for Thermal Comfort and Energy-Saving: Effect of Natural Night Ventilation under Hot Climate. J. Clean. Prod. 2022, 365, 132839. [Google Scholar] [CrossRef]
  47. Yang, X.; Chen, Z.; Zou, Y.; Wan, F. Improving the Energy Performance and Economic Benefits of Aged Residential Buildings by Retrofitting in Hot–Humid Regions of China. Energies 2023, 16, 4981. [Google Scholar] [CrossRef]
  48. Yu, H.; Li, C.; Zhang, K.; Tang, Y.; Song, Y.; Wang, M. Preparation and Thermophysical Performance of Diatomite-Based Composite PCM Wallboard for Thermal Energy Storage in Buildings. J. Build. Eng. 2020, 32, 101753. [Google Scholar] [CrossRef]
  49. Al-Yasiri, Q.; Szabó, M. Energetic and Thermal Comfort Assessment of Phase Change Material Passively Incorporated Building Envelope in Severe Hot Climate: An Experimental Study. Appl. Energy 2022, 314, 118957. [Google Scholar] [CrossRef]
  50. Zou, Y.; Guo, J.; Xia, D.; Lou, S.; Huang, Y.; Yang, X.; Zhong, Z. Quantitative Analysis and Enhancement on Passive Survivability of Vernacular Houses in the Hot and Humid Region of China. J. Build. Eng. 2023, 71, 106431. [Google Scholar] [CrossRef]
  51. Mutschler, R.; Rüdisüli, M.; Heer, P.; Eggimann, S. Benchmarking Cooling and Heating Energy Demands Considering Climate Change, Population Growth and Cooling Device Uptake. Appl. Energy 2021, 288, 116636. [Google Scholar] [CrossRef]
  52. Zheng, W.; Wei, F.; Su, S.; Cai, J.; Wei, J.; Hu, R. Effect of the Envelope Structure on the Indoor Thermal Environment of Low-Energy Residential Building in Humid Subtropical Climate: In Case of Brick–Timber Vernacular Dwelling in China. Environ. Technol. Innov. 2022, 28, 102884. [Google Scholar] [CrossRef]
  53. Rodriguez-Ubinas, E.; Montero, C.; Porteros, M.; Vega, S.; Navarro, I.; Castillo-Cagigal, M.; Matallanas, E.; Gutiérrez, A. Passive Design Strategies and Performance of Net Energy Plus Houses. Energy Build. 2014, 83, 10–22. [Google Scholar] [CrossRef]
  54. Sadeghipour Roudsari, M.; Pak, M.; Viola, A. Ladybug: A Parametric Environmental Plugin for Grasshopper to Help Designers Create an Environmentally-Conscious Design. In Proceedings of the BS2013: 13th Conference of International Building Performance Simulation Association, Chambéry, France, 26–28 August 2013. [Google Scholar]
  55. Sarihi, S.; Mehdizadeh Saradj, F.; Faizi, M. A Critical Review of Façade Retrofit Measures for Minimizing Heating and Cooling Demand in Existing Buildings. Sustain. Cities Soc. 2021, 64, 102525. [Google Scholar] [CrossRef]
  56. GB 50176-2016; Code for Thermal Design of Civil Building. China Architecture & Building Press: Beijing, China, 2016.
  57. Meinshausen, M.; Smith, S.J.; Calvin, K.; Daniel, J.S.; Kainuma, M.L.T.; Lamarque, J.-F.; Matsumoto, K.; Montzka, S.A.; Raper, S.C.B.; Riahi, K.; et al. The RCP Greenhouse Gas Concentrations and Their Extensions from 1765 to 2300. Clim. Chang. 2011, 109, 213. [Google Scholar] [CrossRef]
  58. Hamdy, M.; Carlucci, S.; Hoes, P.-J.; Hensen, J.L.M. The Impact of Climate Change on the Overheating Risk in Dwellings—A Dutch Case Study. Build. Environ. 2017, 122, 307–323. [Google Scholar] [CrossRef]
  59. Bai, L.; Wang, S. Definition of New Thermal Climate Zones for Building Energy Efficiency Response to the Climate Change during the Past Decades in China. Energy 2019, 170, 709–719. [Google Scholar] [CrossRef]
  60. Bakken, G.S. Measurement and Application of Operative and Standard Operative Temperatures in Ecology. Am. Zool. 1992, 32, 194–216. [Google Scholar] [CrossRef]
  61. Zhang, Y. Design Criteria of Built Thermal Environment for Hot Summer & Warm Winter Zone of China. Build. Environ. 2015, 88, 97–105. [Google Scholar] [CrossRef]
  62. Raja, I.A.; Nicol, J.F.; McCartney, K.J.; Humphreys, M.A. Thermal Comfort: Use of Controls in Naturally Ventilated Buildings. Energy Build. 2001, 33, 235–244. [Google Scholar] [CrossRef]
  63. Ma, P.; Wang, L.-S.; Guo, N. Maximum Window-to-Wall Ratio of a Thermally Autonomous Building as a Function of Envelope U-Value and Ambient Temperature Amplitude. Appl. Energy 2015, 146, 84–91. [Google Scholar] [CrossRef]
  64. Albayyaa, H.; Hagare, D.; Saha, S. Energy Conservation in Residential Buildings by Incorporating Passive Solar and Energy Efficiency Design Strategies and Higher Thermal Mass. Energy Build. 2019, 182, 205–213. [Google Scholar] [CrossRef]
  65. El-Darwish, I.; Gomaa, M. Retrofitting Strategy for Building Envelopes to Achieve Energy Efficiency. Alex. Eng. J. 2017, 56, 579–589. [Google Scholar] [CrossRef]
  66. Yılmaz, Z. Evaluation of Energy Efficient Design Strategies for Different Climatic Zones: Comparison of Thermal Performance of Buildings in Temperate-Humid and Hot-Dry Climate. Energy Build. 2007, 39, 306–316. [Google Scholar] [CrossRef]
  67. Cho, H.M.; Yang, S.; Wi, S.; Chang, S.J.; Kim, S. Hygrothermal and Energy Retrofit Planning of Masonry Façade Historic Building Used as Museum and Office: A Cultural Properties Case Study. Energy 2020, 201, 117607. [Google Scholar] [CrossRef]
  68. Hajare, A.; Elwakil, E. Integration of Life Cycle Cost Analysis and Energy Simulation for Building Energy-Efficient Strategies Assessment. Sustain. Cities Soc. 2020, 61, 102293. [Google Scholar] [CrossRef]
  69. Sağlam, N.G.; Yılmaz, A.Z.; Becchio, C.; Corgnati, S.P. A Comprehensive Cost-Optimal Approach for Energy Retrofit of Existing Multi-Family Buildings: Application to Apartment Blocks in Turkey. Energy Build. 2017, 150, 224–238. [Google Scholar] [CrossRef]
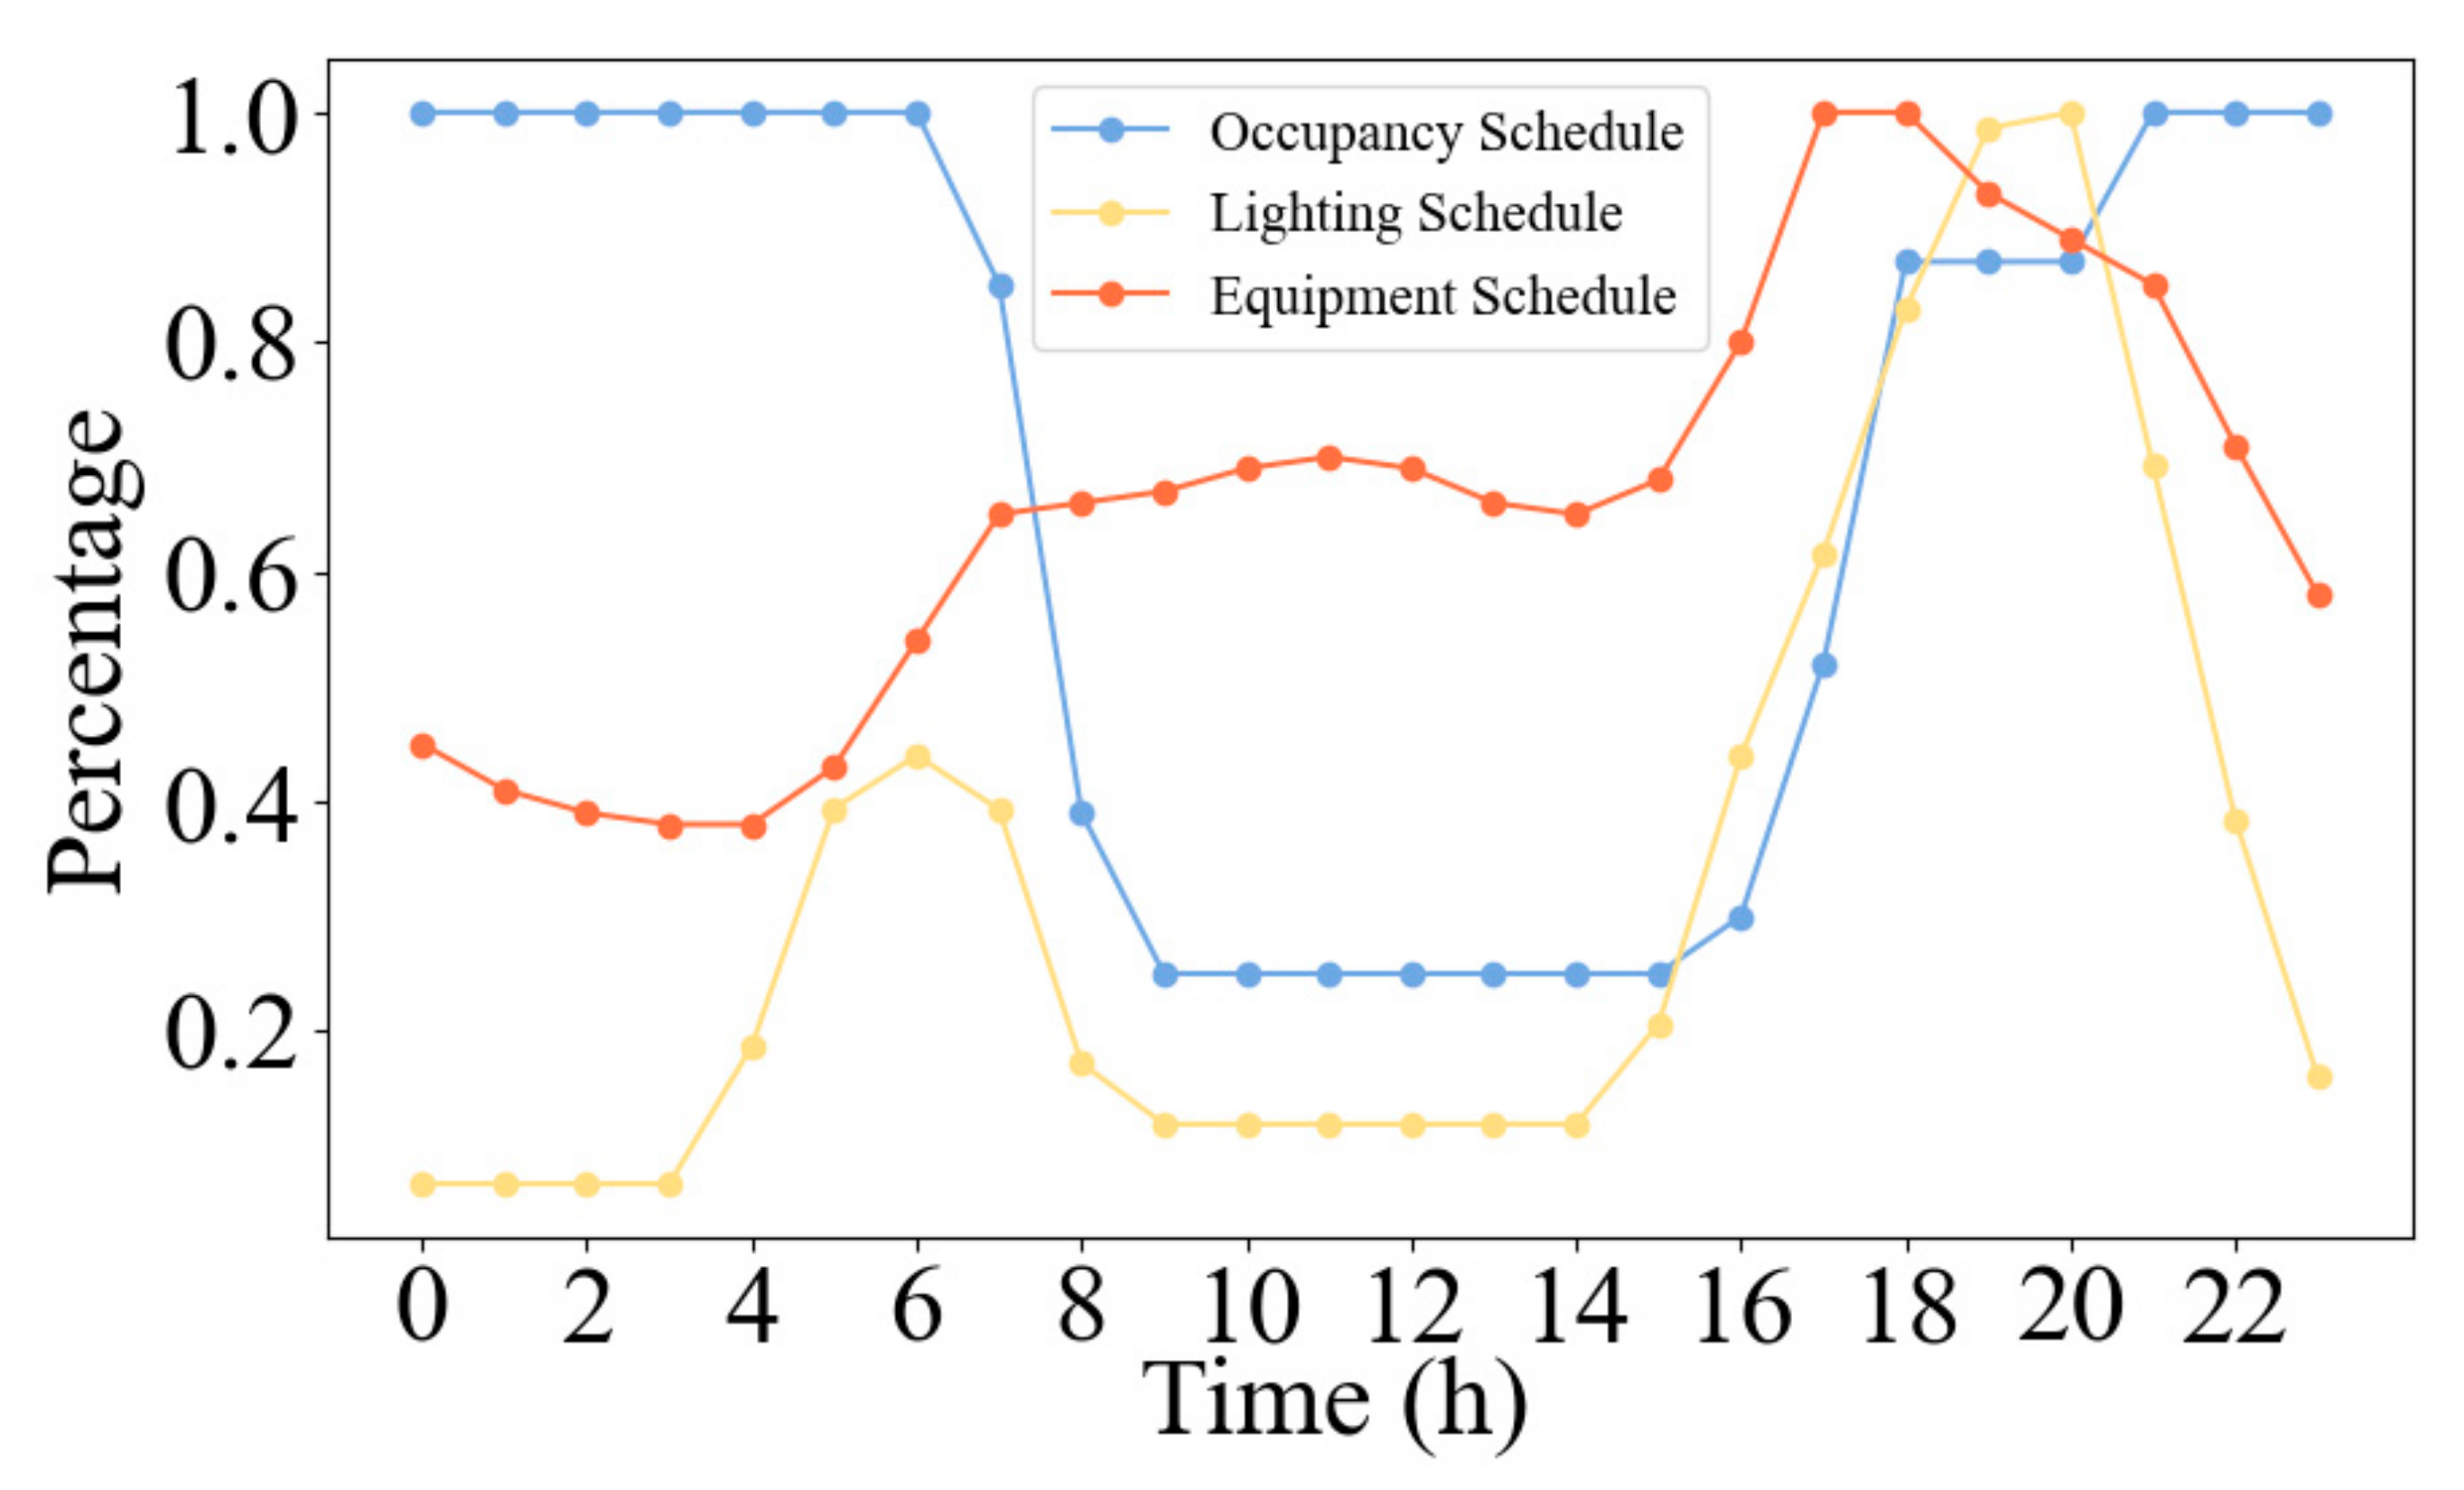
Figure 1. Workflow of this study.
Sustainability 15 12464 g001
Figure 2. Schedule of occupancy, lighting and equipment.
Sustainability 15 12464 g002
Figure 3. Climate zone of China.
Sustainability 15 12464 g003
Figure 4. Annual hourly outdoor dry-bulb temperature for TMY.
Sustainability 15 12464 g004
Figure 5. Annual hourly outdoor dry-bulb temperature for 24 future climates.
Sustainability 15 12464 g005
Figure 6. Geographic location and facade of the THs under study.
Sustainability 15 12464 g006
Figure 7. Plan of a typical TH under study.
Sustainability 15 12464 g007
Figure 8. The AWD between 2030 and 2100 under RCP2.6, RCP4.5, and RCP8.5.
Sustainability 15 12464 g008
Figure 9. Sensitivity coefficients of IOH and cooling load under the TMY.
Sustainability 15 12464 g009
Figure 10. Sensitivity coefficients of IOH and cooling load under the RCP2.6 2030–2100.
Sustainability 15 12464 g010
Figure 11. Sensitivity coefficients of IOH and cooling load under the RCP4.5 2030–2100.
Sustainability 15 12464 g011
Figure 12. Sensitivity coefficients of IOH and cooling load under the RCP8.5 2030–2100.
Sustainability 15 12464 g012
Figure 13. IOH and cooling load under the TMY.
Sustainability 15 12464 g013
Figure 14. IOH and cooling load under the RCP2.6 2100.
Sustainability 15 12464 g014
Figure 15. IOH and cooling load under the RCP4.5 2100.
Sustainability 15 12464 g015
Figure 16. IOH and cooling load under the RCP8.5 2100.
Sustainability 15 12464 g016
Figure 17. Presentation of all improved outcomes (IOH) in different orientations and different RCP scenarios.
Sustainability 15 12464 g017
Figure 18. Presentation of all improved outcomes (Cooling Load) in different orientations and different RCP scenarios.
Sustainability 15 12464 g018
Figure 19. IOH and cooling load under four different modification strategies.
Sustainability 15 12464 g019
Table 1. Simulation settings.
Simulation SettingsValue
Cooling setpoint26 °C
Equipment Load Per Area3.875 W/m2
Infiltration Rate Per Area Facade0.0003 m3/s-m2
Lighting Density Per Area11.8404 W/m2
Num. Of People Per Area0.0283 ppl/m2
Table 2. Original design strategies.
Design StrategiesDescriptionU-Value (W/m2·K)
Wall1—Cement mortar 20 mm
2—Porous brick
3—Exterior cladding
2.0
Roof1—Finish layer
2—Fine stone concrete protective layer
3—Waterproof layer
4—Slope-finding layer
5—Insulation layer
6—1:3.0 Cement mortar 20 mm
7—Reinforced concrete roof panel
1.0
Window1—Glass4.0
WWR40%-
Shading--
Table 3. The optimal strategies under each of the four orientations.
SouthWestNorthEastOriginal
IOHCoolingIOHCoolingIOHCoolingIOHCooling-
Shading (m)0.20.20.20.20.20.20.20.2-
WWR (%)505050505050505040
Window
(W/m2·K)
222222224
Roof
(W/m2·K)
0.250.50.251.50.250.50.250.51
Wall
(W/m2·K)
1.511.511.511.512
Disclaimer/Publisher’s Note: The statements, opinions and data contained in all publications are solely those of the individual author(s) and contributor(s) and not of MDPI and/or the editor(s). MDPI and/or the editor(s) disclaim responsibility for any injury to people or property resulting from any ideas, methods, instructions or products referred to in the content.

