Article

Regional Disparity in the Educational Impact of COVID-19: A Spatial Difference-in-Difference Approach

1
School of Economic, Political and Policy Sciences, University of Texas at Dallas, Richardson, TX 75080, USA
2
College of Education & P-16 Integration, The University of Texas Rio Grande Valley, Edinburg, TX 78539, USA
3
Graduate School of Education, Incheon National University, Incheon 22012, Republic of Korea
*
Author to whom correspondence should be addressed.
Sustainability 2023, 15(16), 12514; https://doi.org/10.3390/su151612514
Submission received: 24 July 2023 / Revised: 15 August 2023 / Accepted: 16 August 2023 / Published: 17 August 2023

Abstract

:
The transmission of COVID-19 suddenly shifted most school classes to online lectures, and these unexpected changes often exacerbated existing imbalances by region and school. Our study used land price data as a proxy for regional wealth and empirically examined the inflation of education inequality between the areas with high and low land prices during the COVID-19 pandemic in South Korea. The gaps in the average high school Math and English scores between 2019 and 2020 (Y1 effect) and 2019 and 2021 (Y2 effect) are used as the main educational outcomes. We utilized the spatial difference-in-difference (DID) method to reflect the spatial autocorrelation on the school-level distribution of the score changes. The impact of the online class conversion on student performances was found to be significantly different between the regions with low and high land price and was more noticeable for the Math score during the first year of the pandemic. During the second year of the pandemic (2021), the scores increased in both regions, but the regional gap remained persistent. Evidence-based policies should be implemented to enhance regional educational conditions and resources, which, in turn, should prevent educational inequality across the regions stemming from the conversion to online classes.

1. Introduction

A major change brought on by the transmission of the COVID-19 pandemic was the unforeseen shift from face-to-face interactions to online interactions, particularly in the online educational environment. Although multiple studies have reported a positive effect of online instruction [1,2,3,4], there is a strong consensus on the disproportionate impact of online education across different classes [5,6,7,8]. Moreover, online education is ineffective for some subjects, such as Mathematics [9,10]. There are various factors involved in determining online education’s effectiveness, such as parental support, school resources, and community environment [11,12]. Parents play a major role in providing financial support based on their income [12,13,14,15], continuous guidance and monitoring of their children [15,16], and the provision of equipment necessary for online classes [17,18]. At the school level, curriculum flexibility in online courses [19] and the teacher’s competency in adapting materials for online settings [5,6] have a significant impact. Additionally, disparities in community-level online learning infrastructure and resources exacerbate inequality in student outcomes [20,21]. The transition to online learning during the COVID-19 pandemic generated disparities in student achievement due to the combined effect of parental involvement, family interaction, school resources, and community environment. However, empirical evidence is lacking.
As in other Asian countries, education is highly valued in South Korea, which consumes a great amount of social resources [22]. However, the educational gap remains substantial across different groups and regions [23]. Prior to COVID-19, schools provided various specialized and after-school classes for low-performing students to reduce the educational gap [24]. These were forced to stop since the pandemic hit in January 2020. On 9 April 2020, the initial phase of online education began for middle and high schools in South Korea, followed by elementary schools [25]. From 20 April 2020, all students in primary and secondary schools were required to take online classes. A month later, some schools were allowed to provide a limited number of in-person classes with reduced student density based on the regional infection level [26]. Although the local education office and school decided on a class format at their discretion based on the level of local infection, the majority were forced to continue online classes until the spring of 2022. Only the limited face-to-face classes were conducted to minimize the density within the school, such as time lag by grade and morning/afternoon classes. Due to the sudden transition, most schools could not sufficiently prepare for online class content and curriculum at the beginning [27], and the frequent changes caused confusion [28]. Considering that guidelines for online classes were part of the central government’s national plan, the details and implementation differed based on the school and local circumstances [29]. When the online class system was not established, educational disparity sensitively changed by region [30]. However, research on regional disparities in online classes is limited, and studies that measure the immediate or longer-term effects of each subject at the national level are lacking.
Therefore, this study aims to empirically estimate whether or not the impact of COVID-19 on academic achievement is significantly different between wealthy and resource-poor communities determined by local land prices, while controlling for various school and community characteristics. The immediate change (Year 1 effect; gap between 2019 and 2020) and the longer-term change (Year 2 effect; gap between 2019 and 2021) since the online class conversion during the COVID-19 pandemic need to be measured separately and compared to each other in order to understand how the educational impact changes over time. The findings of this research can be used as a reference for future policy formation.

2. Materials and Methods

For the study aim, the effects of COVID-19 were divided into Y1 (Year 1) effect and Y2 (Year 2) effect. The Y1 effect measured changes in Math and English scores from early 2020 compared to 2019. Similarly, the Y2 effect measured score changes from early 2021 compared to 2019. We focused on the second year of high school as the third year presented a comparison limitation due to curriculum differentiation in preparing for the SAT exam. Additionally, there were fewer missing values of the data from the second year of high school compared to the first year.
Since educational facilities and environments could be spatially heterogeneous across communities [31], we were also interested in how students’ performances were affected by the quality and accessibility of the educational resources available in their residential community. For example, students from major cities could use abundant educational facilities, whereas suburban students could use relatively fewer educational facilities. This inequity could be represented by the difference in land prices by region [32]. Consequently, students from high-land-price areas were more likely to achieve stable academic achievement despite the pandemic obstacles as they could use relatively more diverse educational facilities. Thus, the present study used spatial statistical modeling to estimate whether the impact of COVID-19 on academic achievement varied based on local land prices.

2.1. Variables and Measurements

The dependent variable was the average exam score for Mathematics and English of the second-year high schoolers in South Korea. Within these subjects, there were several similar yet varying standard core courses in a semester. Within Mathematics, there were multiple sub-courses such as core mathematics, calculus, and statistics. Similarly, English was divided into common core English and English conversation. There were also differences in the organized curriculum based on the school, except for common subjects. Therefore, this study used the standard core Math and English course scores for the number of Math and English credits, respectively. Data were collected via web scraping of the official database provided by the Korean Ministry of Education.
The primary independent variable was created based on the median land price of the region (“si-gun-gu”) as a binary variable; it was measured as 1 or 0 if it was above or below the median value, respectively. Korea Real Estate Agency data were used for land prices. In addition, this study used the time variable from 2019 to 2021 to evaluate the immediate or short-term (Y1) and longer-term (Y2) impact of the COVID-19 pandemic. The interaction variables were used for both Y1 and Y2 effects using the land price variable and time factor. Reflecting on the spatial characteristics, this estimated the net effect of the land price of the region that occurred during the pandemic by comparing the score changes in 2020 and 2021 based on 2019.
The control variables were divided into regional and school characteristics. Regional characteristics included the implementation of social distancing policies, Internet use rate, and degree of financial independence of local governments. Internet use rate is the percentage of households that can access the Internet through wired Internet, wireless LAN, mobile Internet, etc., regardless of actual use among all households. Most public facilities, such as libraries, private academies, and cafes, stopped operating when social distancing was enforced. Therefore, educational facilities accessible to students were limited during this time. Moreover, lack of Internet use also served as a barrier, with academic achievement possibly affected by the Internet usage rate during online classes. Simultaneously, school characteristics, which included the type of school, academic atmosphere, and student’s fitness index, were used as control variables based on previous research. Regarding the school budget, the unit was Korean Won (KRW), which was converted to a natural logarithm and used for analysis. Table 1 shows the description and measurement methods of the variables used in this study.

2.2. Methodology

We utilized DID (difference-in-difference), a representative analytical method that compared the effects on different groups at a specific point in time. This derived the impact of a specific event by comparing experimental and comparison groups before and after an intervention [33]. The basic design of DID estimates the dependent variable through ordinary least squares (OLS) regression analysis for each individual based on the experimental group, control group, and two time points before and after the experiment. The DID model was used to estimate the change in academic achievement based on two groups—two regions with a high and low local land price each—in conjunction with the Y1 and Y2 effects since the pandemic began. The formula for this was as follows:
Y = α + β 1 Year + β 2 LandP + β 3 Year × LandP + β 4 SchoolFac + β 5 LocalFac + ϵ .
Y was the average score for Math or English. Year represented the school year from 2019 to 2021. LandP represented the price of land by region and had a value of 1 or 0 if it was above or below the median value, respectively. (Year × LandP) was an interaction term between land prices by year, representing both Y1 and Y2 effects of the pandemic according to local land prices. β 3 represented the size of the Y1 and Y2 effects. SchoolFac and LocalFac referred to the local and school characteristics which served as control variables. The coefficients of these variables appeared through beta values.
The region’s land prices could have different educational resources and environment accessible to students residing in the area, and these differences could have spatial heterogeneity [31,32]. These spatial characteristics indicated that the values of the variables were related to each other among the spatial units [34]. Therefore, to control for the spatial characteristics of local land prices and educational facilities, spatial regression analysis was applied to the existing DID model and utilized. Spatial weights were controlled using the spatial lag model (SLM) and spatial error model (SEM) to reflect the actual spatial dependence by the interaction between spatial units. SLM was used to control the autocorrelation of the dependent variable itself [34]. The formula for the SLM applied to the DID model was as follows:
Y = ρ Wy + α + β 1 Year + β 2 LandP + β 3 Year × LandP + β 4 SchoolFac + β 5 LocalFac + ϵ .
The ρ (rho) value indicated how much the values of the dependent variable were spatially correlated among neighboring areas. A positive rho value indicated that schools with high scores were surrounded by those with high scores, and the same applies for schools with low scores. β3 represented the spatial DID value when the SLM concept was applied, where W was the spatial weight. Most remaining symbols were similar to the DIDs discussed above. Correspondingly, the SEM was a spatial error model which was used to control the autocorrelation of the error term. The formula for the DID model applied to the SEM was as follows:
Y = α + β 1 Year + β 2 LandP + β 3 Year × LandP + β 4 SchoolFac + β 5 LocalFac + u u = λ Wu + ϵ .
Since the SEM model controlled the spatial autocorrelation of the error term, there was only a difference in the error term from the existing DID model. Here, the error term controlled the λ (lambda) for the spatial weight (W). Therefore, if the lambda value was statistically significant, spatial autocorrelation was not controlled by the existing DID, and the bias that may occur in the existing DID can be adjusted using the SEM model. Therefore, β 3 represented the value of spatial DID when the SEM concept was applied.
The spatial DID models formulated as SLM and SEM were analyzed using the GeoDa 1.14 program. First, we verified whether there was spatial autocorrelation through Moran’s I, the Lagrange multiplier (LM) lag, and LM error. An ordinary least squares (OLS) model was selected if the spatial autocorrelation test was not statistically significant. If there was spatial autocorrelation, the more significant model between the SLM and SEM models was selected through robust LM lag and robust LM error tests.

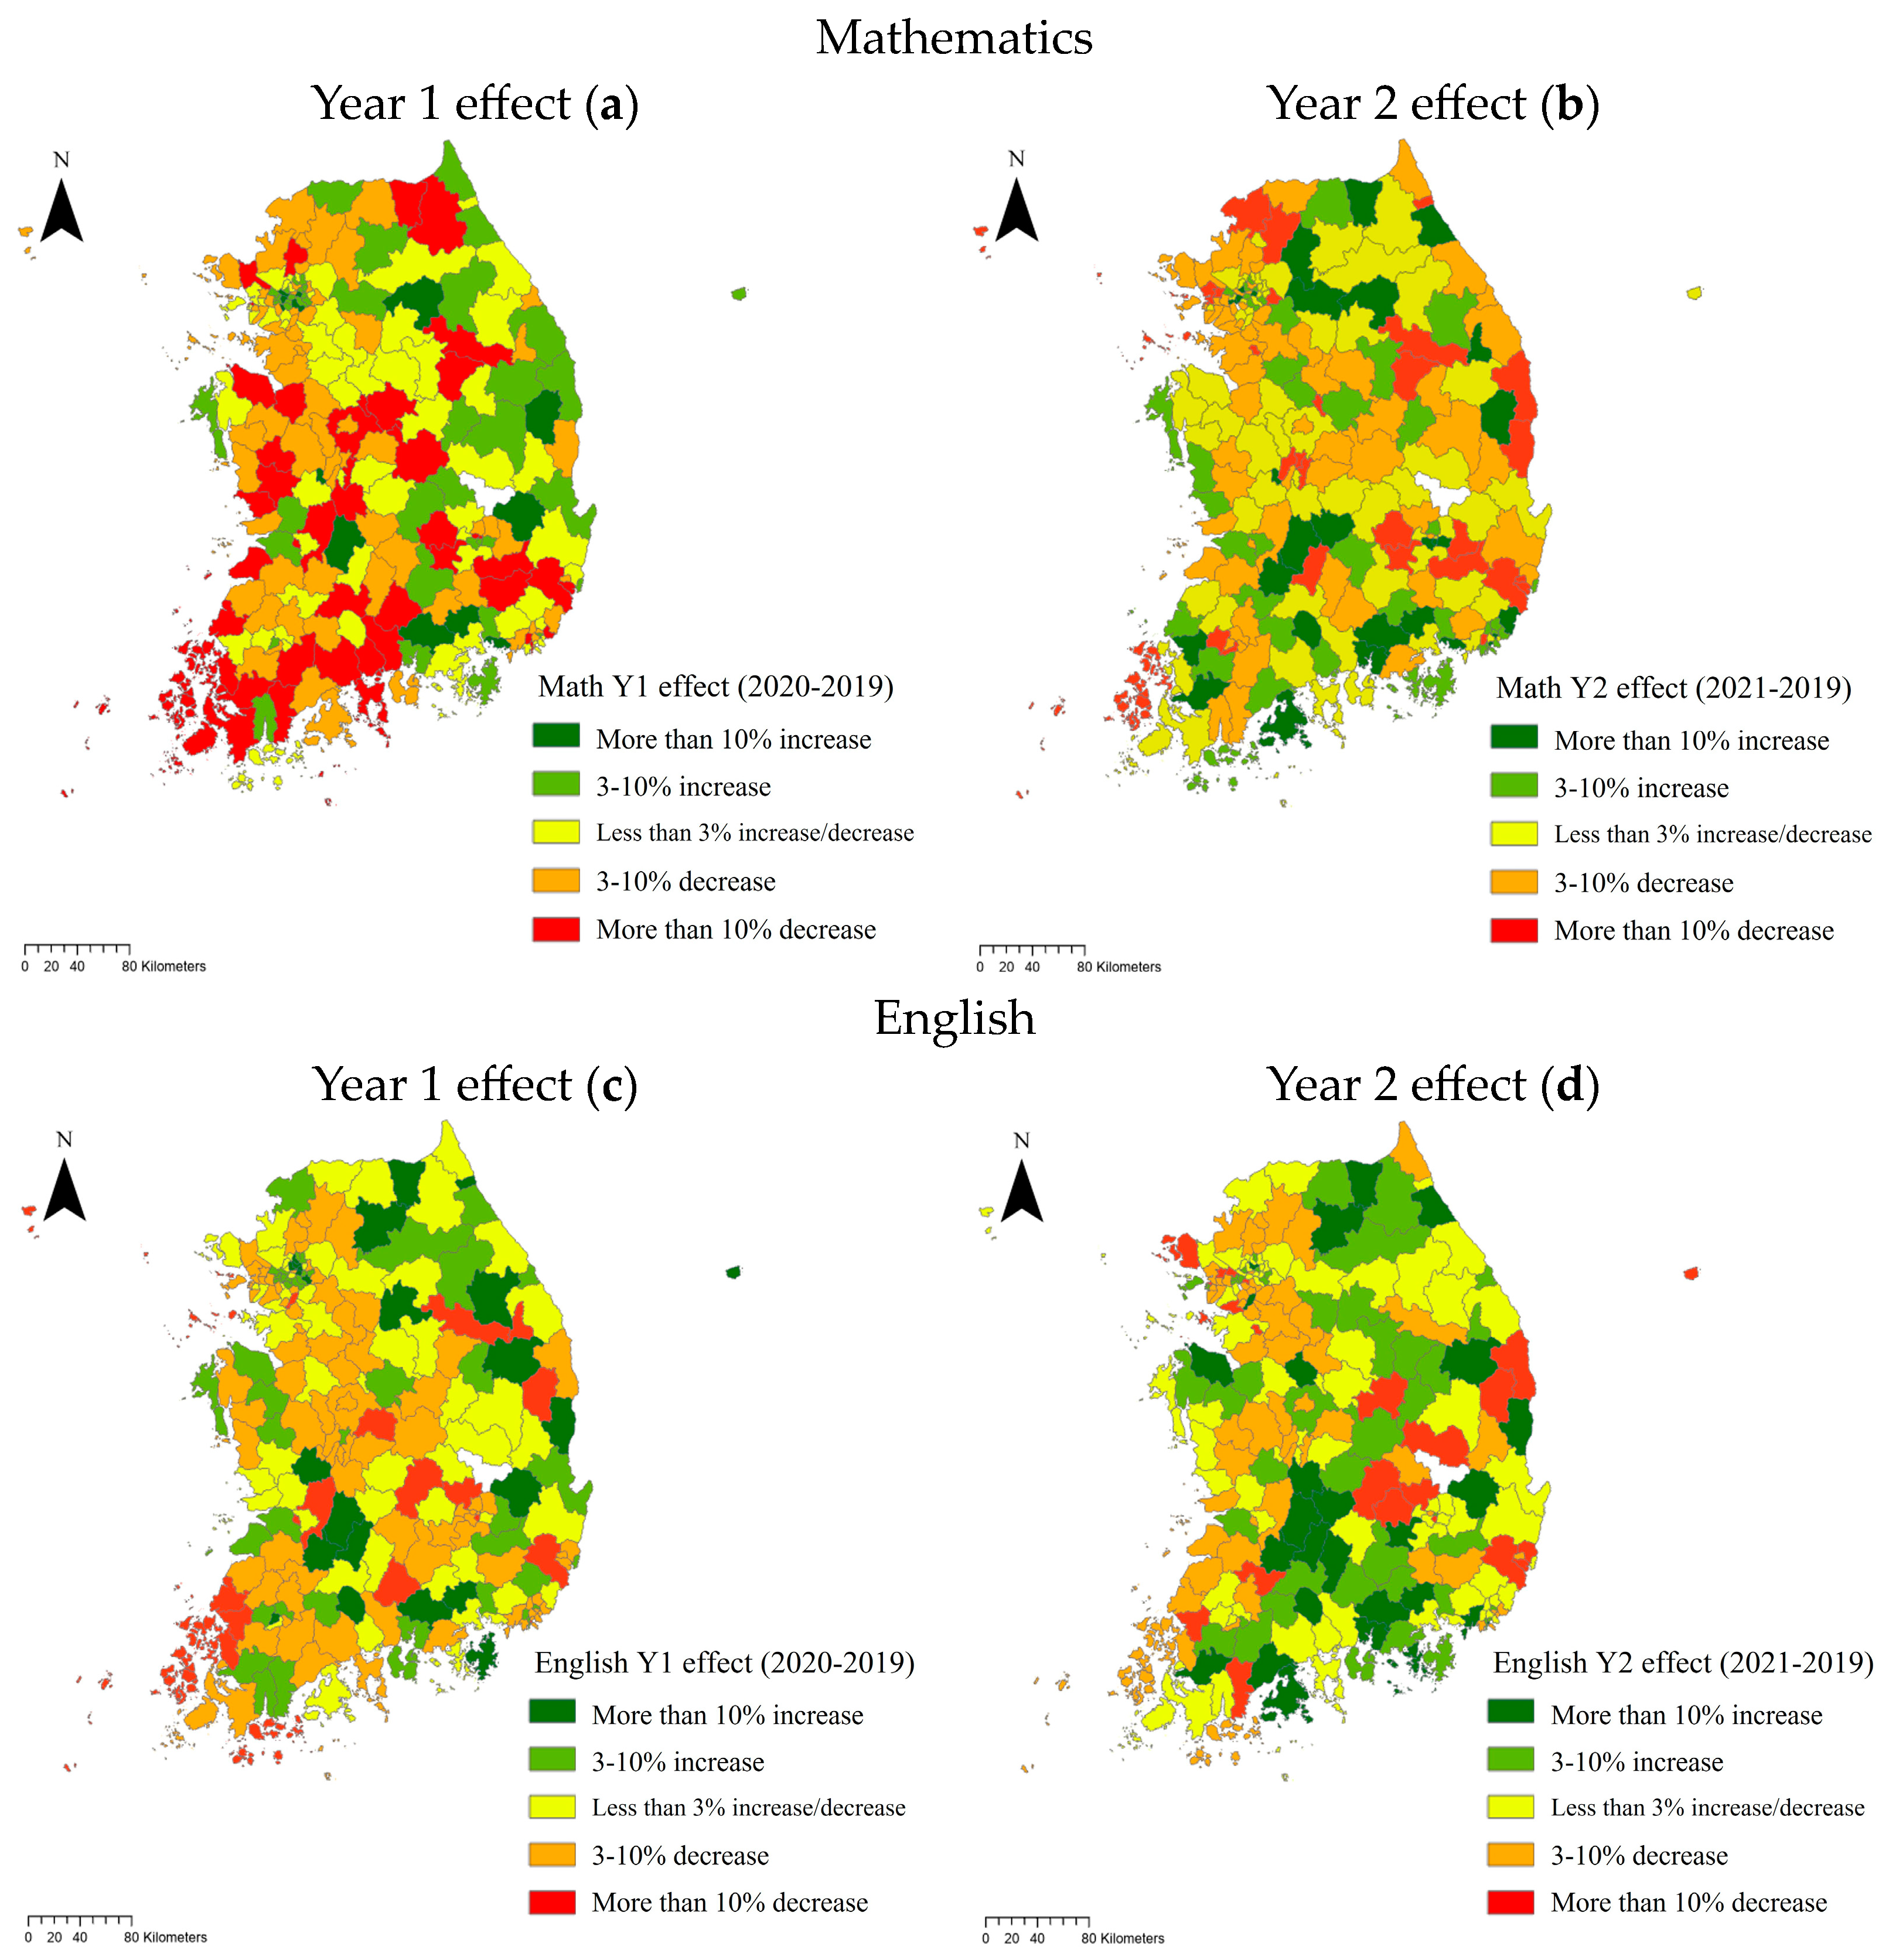
3. Results and Discussion

3.1. Descriptive Analysis

Some high schools did not report the average scores of Math and English subjects that are comparable to others and thus were excluded from the sample. A total of 4546 high schools were included in the analysis, and the descriptive summary statistics of some variables are presented in Table 2.
A dummy variable was created to indicate whether the local median land price was above or below the national median land price. It is found that only 22.7% of the regions had a median land price than the national median land price (325,268 KRW per m2). In South Korea, social distancing was implemented following the progressive spread of COVID-19. There were restrictions on the educational infrastructure that students could use based on the social distancing level. The highest social distancing level lasted an average of 8.7 weeks nationwide, and some regions implemented the highest level for up to 36 weeks. During this period, all classes were moved online. However, the Internet availability rate ranged between 80.6% and 99.1%, which indicated a significant difference in Internet use by region and limited access to Internet infrastructure in some regions.
During the pandemic, the average Mathematics score was 22.9, with a minimum and high score of 22.9 and 86, respectively. The minimum average English score was 32.9, and the highest score was 95. The pandemic also restricted students’ outdoor activities, which may have affected their health condition. The average student’s body mass index (BMI) was 22.7, and the minimum and maximum values were 20 and 31.3, respectively. There were also significant regional differences in the dropout rate from school, with an average of 1.908%. The maximum dropout rate was 50%, which represented huge disparities across the regions. Similarly, the degree of financial independence that each local government responded to in the aftermath of the pandemic were the lowest and highest at 4% and 68.9%, respectively.
Figure 1 shows the spatial distribution of Year 1 and Year 2 effects on averages of Math and English scores aggregated at the regional level across the country, and whether there is a spatial clustering pattern for those effects.
On the map, dark green indicates that scores in 2020 or 2021 have increased by more than 10% compared to 2019, and red indicates the opposite. Light green indicates a 3–10% increase in scores in 2020 or 2021 compared to 2019, while orange indicates a 3–10% decrease. Yellow indicates a positive or negative effect of less than 3%. The map shows that schools with significant declines in performance during the pandemic are concentrated in South Korea’s southwestern region, with a more substantial impact in Mathematics. For both Math and English scores, the Y2 effect appears bluer than the Y1 effect. This means that many communities that initially experienced score declines have been able to adapt to changes in online learning as the pandemic enters its second year. More importantly, due to regional characteristics such as land price differences, the maps clearly showed a significant degree of spatial clustering for the Y1 and Y2 effects for the two targets. This suggests using the spatial DID method to statistically estimate the score change according to the difference in land price during the pandemic while considering the spatial autocorrelation.

3.2. Spatial DID

Spatial autocorrelation was mainly confirmed using Moran’s I spatial autocorrelation coefficient. When there was no spatial autocorrelation on the dependent variable, an ordinary least squares (OLS) model was appropriate to be used. However, when a significant level of spatial autocorrelation was observed, either the spatial lag model (SLM) or the spatial error model (SEM) could outperform OLS since SLM could control the autocorrelation of the dependent variable and SEM could control the autocorrelation of the error term. Table 3 presents the diagnostic results for the spatial autocorrelation. Moran’s I coefficients were found to be statistically significant for both Y1 and Y2 effects for both subjects and all other model diagnostics, including Lagrange multiplier (LM) tests, and robust LM tests suggested SLM or SLM that incorporated spatial autocorrelation in the data. Therefore, spatial DID regression models were performed to control for spatial autocorrelation.

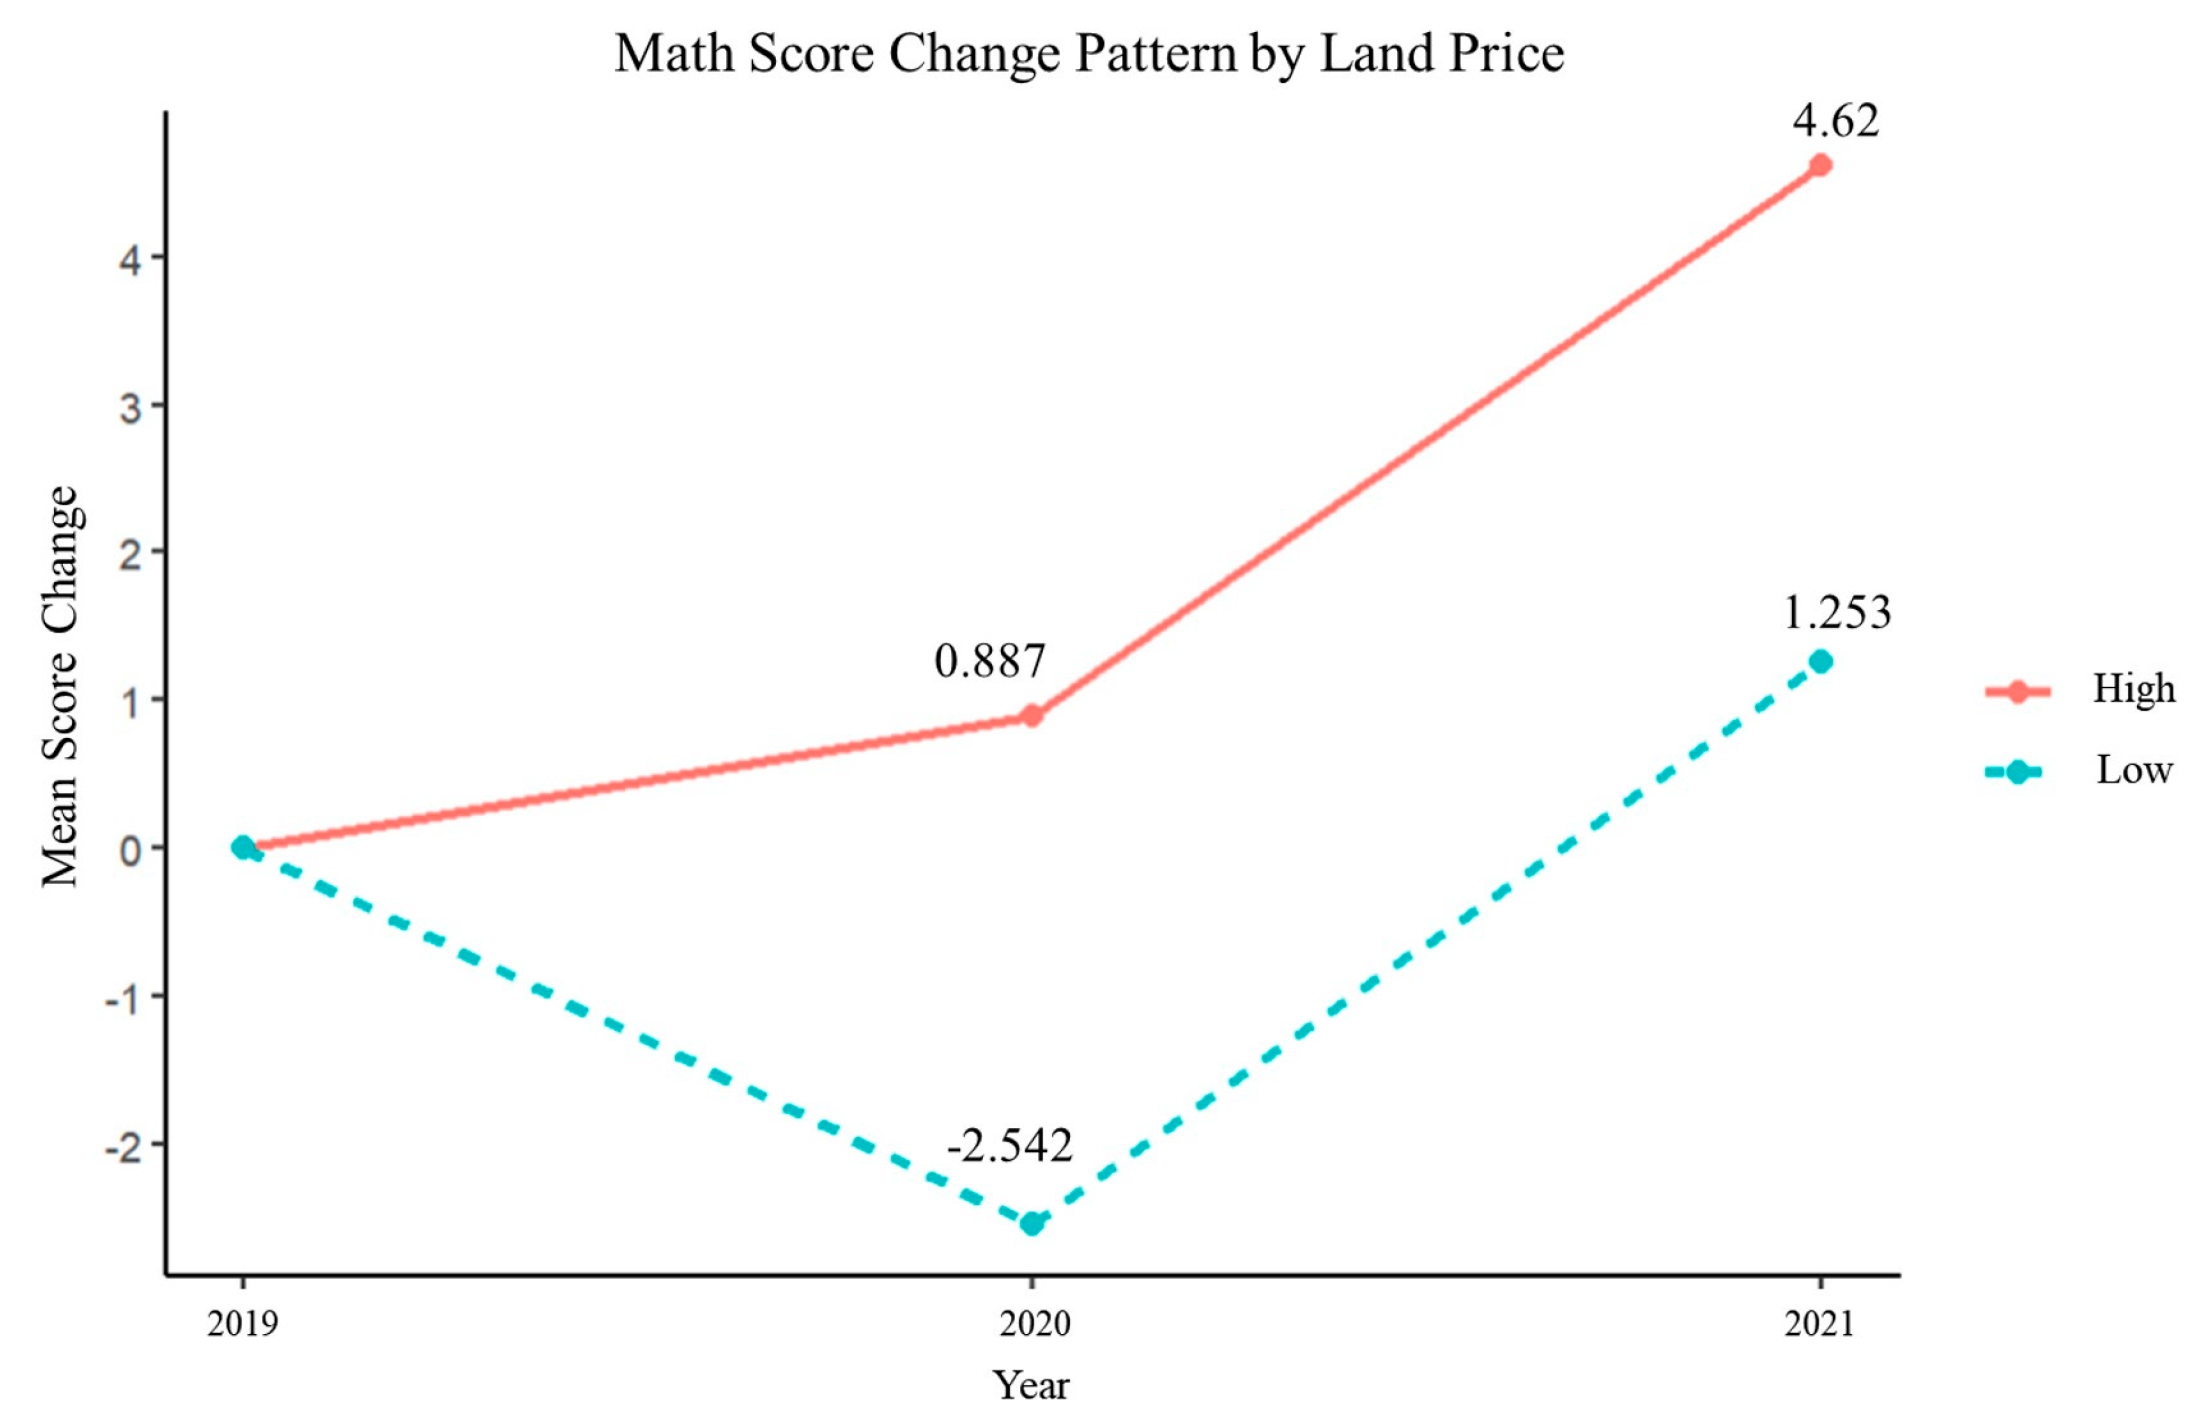
3.3. Impact on Math Score by Land Price during the Pandemic

Table 4 shows the results of spatial DID models applied to both Y1 and Y2 effects for both Mathematics and English scores including OLS, SLM, and SEM. The three models performed similarly according to AIC, but both the spatial lag coefficient (rho) and the spatial error coefficient (lambda) were statistically significant for both Y1 and Y2 effects, indicating that SLM and SEM were theoretically more appropriate to be used. In particular, the coefficient values increased in 2021 compared to those in 2020, which means that the level of spatial autocorrelation found in both Math and English scores across the schools became stronger as the pandemic continued. Following the suggestions of the Robust LM tests in Table 3, we sought to interpret values by focusing on SEM.
First, the average Math score decreased in a statistically significant manner in 2020 compared to 2019. However, 2021 did not show significant results. There were also different mean Math scores according to the land price. Areas with high land prices had lower average scores compared to those with low land prices. This may be due to Korea’s different evaluation standards for each school. The higher the land price, the more likely it was that the school district would maintain a better reputation. This reputation heightened the level of test difficulty and competition. Accordingly, areas with high land prices could have lower average scores compared to those with low land prices. Spatial DID coefficients revealed interesting results when we considered the spatial characteristics and examined the pandemic’s interaction effect on land price differences. As illustrated in Figure 2, in the Y1 effect of the pandemic in 2020, the average Math score dropped by 2.542 points in regions with low land prices but actually increased by 0.887 points in regions with high land prices. During the second year of the pandemic (2021), the average Math score increased in both regions, but the size of the gap remained the same (3.429 for Y1 effect vs. 3.367 for Y2 effect). The higher the land price, the better the extracurricular educational infrastructure offered, which may have caused differences in the academic shock experienced by students during emergencies, such as a pandemic, in the overall educational environment.
Social distancing policy and Internet use rate also affected Math grades according to regional characteristics. The average Mathematics score decreased as the highest stage of social distancing continued, which indicates that calculation and theory-oriented subjects, such as Math, were more easily affected by the shutdown due to social distancing, which could hinder class progress and exacerbate difficulty for those who were not adequately supported [9,10]. In contrast, the higher the Internet use rate, the higher the average score in Mathematics. As online classes were conducted and various academic materials were provided on the Internet, we assumed that students were more appropriately able to access learning materials, an essential factor during the pandemic. Hence, the lockdown did not hinder their academic achievement.
Regarding school characteristics, male-only and female-only high schools scored higher in 2020 compared to coeducational schools. However, only male-only high schools scored higher in 2021. Specifically, private schools scored higher on average compared to public schools. BMI, a reflection of students’ fitness or health condition, also had a relationship with Mathematics scores; an increased BMI correlated with a decreased average Math score. Similarly, the school’s academic atmosphere and the students’ level of management affected their average scores. The higher the number of students per teacher, the lower the average Mathematics score. In addition, the higher the dropout rate, the lower the average score.

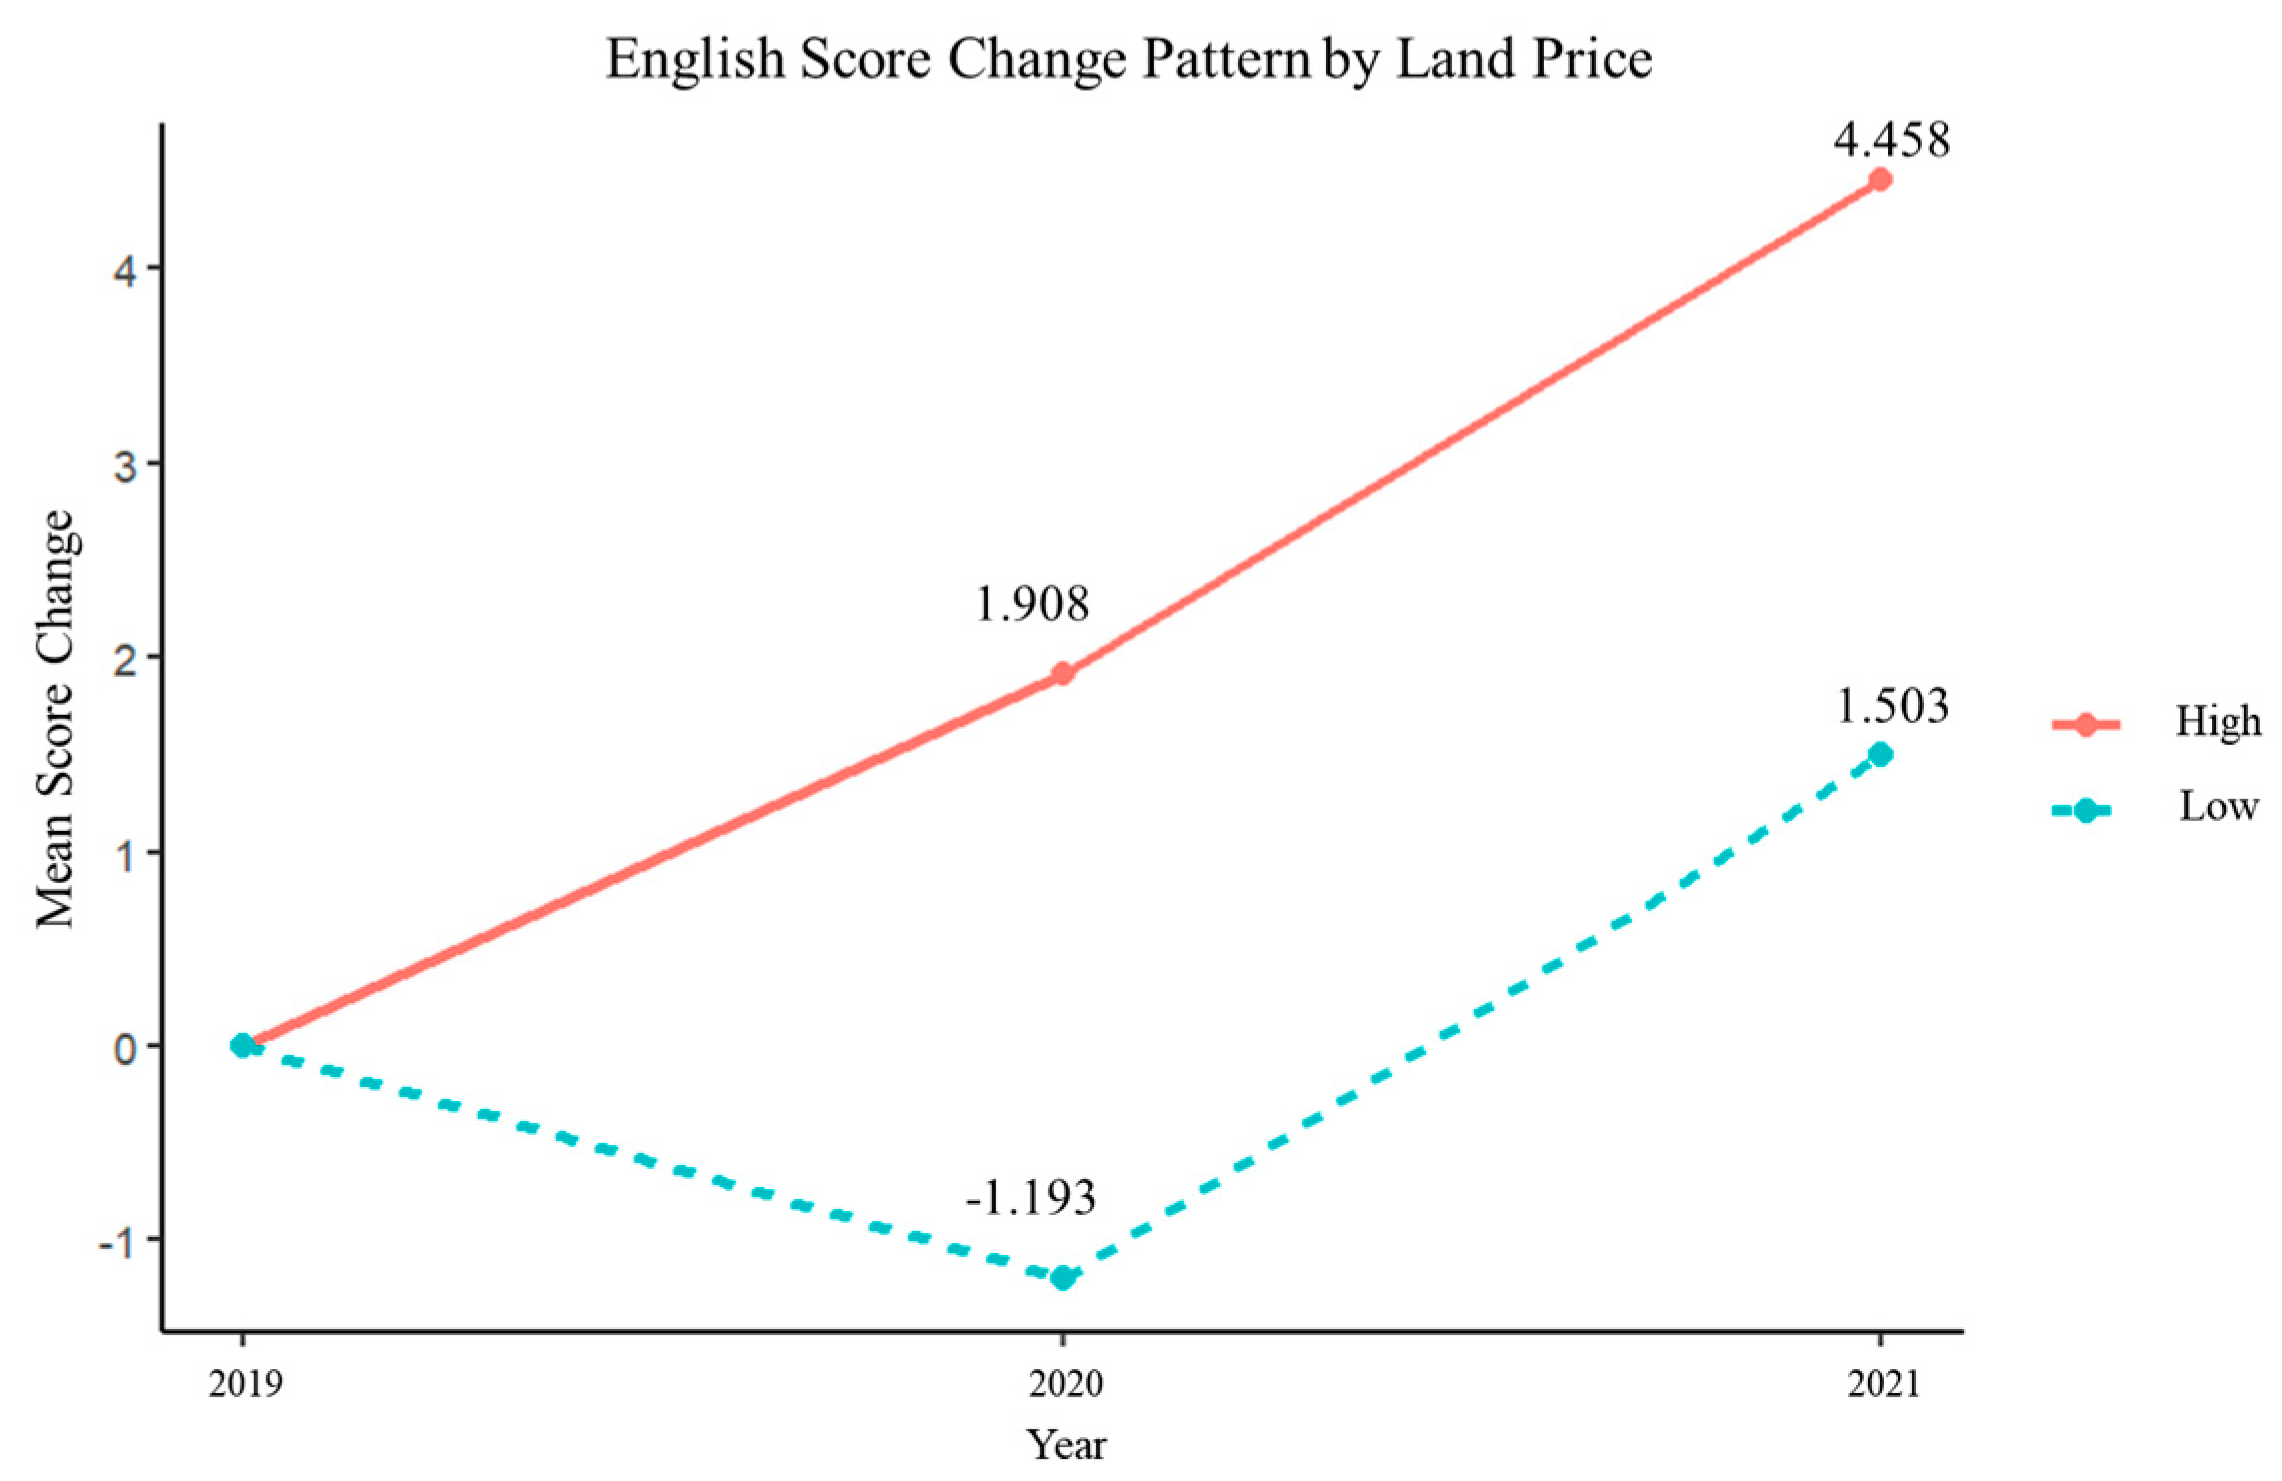
3.4. Impact on English Score by Land Price during the Pandemic

Table 5 shows the spatial DID estimation results for the average English score during the pandemic.
The average English mean score significantly decreased during the first year of the pandemic (2020) but returned back to the original score level during the second year (2021). The average English score was lower in regions with high land prices compared to in those with low land prices, owing to the different student evaluation criteria of schools. Similar to Math scores, as illustrated in Figure 3, during the first year of the pandemic (2020), the average English score dropped by 1.193 points in regions with low land prices but actually increased by 1.908 points in regions with high land prices. During the second year of the pandemic (2021), the average English score increased in both regions, but the size of the gap remained persistent.
Regarding regional characteristics, only the Internet use rate affected English scores in 2020. The average English score increased in regions with higher Internet usage rates. In 2021, social distancing policies and Internet usage rates affected English scores. As social distancing continued for a long time, students’ learning spaces were limited. Therefore, as the highest level of social distancing continued, the average English score decreased. In addition, regarding Internet use rate, the score range increased as Internet use rate increased in 2021 compared to 2020. As online classes were conducted and various academic materials were provided on the Internet, the number of learning materials that students used increased significantly during the pandemic.
Regarding school characteristics, the average English scores in 2020 and 2021 were higher in girls’ high schools compared to in coeducational schools. In addition, the average score for English in private schools was higher compared to that in public schools. As the BMI index—which reflected students’ health—increased, the average English score decreased. However, the school’s academic atmosphere and students’ management levels affected the average English score. Similar to the Math score, the average score in English decreased as the number of students per teacher increased. In addition, the higher the dropout rate, the lower the average score. Finally, the rho and lambda values, which represented the degree of spatial autocorrelation of the English scores and their error terms, were statistically significant in 2020 and 2021 and became larger in 2021. Although their impacts on the changes on the main DID coefficients were not so substantial, they clearly indicate the need for considering the spatial distribution of student performances within the country in this type of modeling and analysis.

4. Discussion and Conclusions

This study assessed if the impact of COVID-19 on high school education varied by local land price using a spatial DID analysis method that incorporated spatial autocorrelation of school-level average score data. The analysis revealed that the average score of Math and English classes fell in regions with low land prices during the first year of the pandemic (2020); whereas it increased in regions with high land prices compared to the level prior to the pandemic. During the second year of the pandemic (2021), both scores increased in all regions, but the gap between the regions with high and low prices created during the first year of the pandemic remained persistent. In the second year of the pandemic, despite both regions’ scores rising, the persistence of regional disparities may reflect existing urban–rural differences [35,36]. The gap was much wider in Math scores, indicating the importance of a stable learning environment for the subject.
The infrastructure gap across society, including that of the educational infrastructure between urban and rural areas, was one of the challenges pointed out even before the COVID-19 pandemic [36,37]. These disparities have had various impacts when dealing with social challenges during pandemics such as COVID-19 [35]. In particular, the findings of this study support the ongoing argument that the effects of online classes due to COVID-19 may work disproportionately [5,6,7,8,13] by providing empirical evidence highlighting the role of regional resources as indicated by local land price. The regional educational gap was pointed out before the transition to online classes [13], but we found that the impact of the unexpected online class conversion due to COVID-19 exacerbated the disparity.
The academic gap across the regions occurring early in the pandemic was mostly due to insufficient preparation of the content and method tailored to the online instruction of each subject [14] and confusion due to frequent changes in the curriculum [13]. The disproportionate effect of online class conversion across regions was mainly caused by the differences in the educational infrastructure available to students [38]. Because the guidelines from the central government did not reflect regional characteristics, successful transition to online learning depends on the circumstances surrounding each family, school and region [29]; for example, parents with a relatively unstable job and income found it difficult to monitor their children’s online classes continuously and provide them with supportive equipment [14,39]. At the school level, the conditions for online classes differed for each school’s situation, incorporating factors such as limited communication between students and teachers, as well as teachers’ digital skills and online class competency and experiences [40]. At the community level, students from resource-poor areas had relatively less accessibility to alternative learning opportunities due to the lack of available materials and environments. On the other hand, students in wealthy communities could continue their learning even in non-face-to-face situations because many alternative learning resources, including private tutoring, were readily available [14,38]. In summary, students in low-income areas had limited opportunities to receive adequate education due to the vulnerabilities of the school’s online education system, supportive home environment, and community’s education support system. Therefore, the findings from this study suggest the provision of additional resources to under-resourced communities to minimize educational inequality during public health crises.
Although this study is meaningfully reveals the spatial and temporal pattern of educational disparity due to unexpected online transitions during the pandemic, this study has several limitations. First, the scope of the research was confined to the scores of second-year high school students in Mathematics and English, aiming for a nationwide regional comparison. The rationale for this choice stems from the fact that third-year high school curricula for Mathematics and English in Korea vary autonomously among schools, making direct score comparisons challenging. As a result, future research endeavors could consider expanding to other subjects and grade levels. Second, the impact of private education was omitted from this study due to data unavailability. Private education plays a pivotal role in creating or exacerbating educational inequality in Korea, but the quantitative data necessary for analysis, especially during the pandemic period, were not accessible. Third, the disparity in educational infrastructure between urban and rural areas that existed before COVID-19 persists. This raises the possibility of subtle effects during the transition to online classes between urban and rural regions due to the pre-existing disparities in educational infrastructure between these areas; therefore, future research might explore comparative studies between urban and rural settings. Fourth, a notable number of schools were excluded due to missing data. While all educational institutions in Korea are required to periodically register school data in the Ministry of Education’s database, the abrupt transition to online learning amid the pandemic resulted in the absence of critical variables for many schools. Future research could investigate the potential impacts of non-school variables and missing values in assessing the disproportionate impacts of online learning across communities.

Author Contributions

Conceptualization, D.J., D.K. and S.K. (Sungyeun Kim); methodology, D.J.; software, D.J.; validation, D.J., D.K., S.K. (Seokmin Kang) and S.K. (Sungyeun Kim); formal analysis, D.J.; investigation, D.J. and D.K.; resources, D.J.; data curation, D.J. and S.K. (Sungyeun Kim); writing—original draft preparation, D.J. and H.M.; writing—review and editing, H.M., D.K., S.K. (Seokmin Kang) and S.K. (Sungyeun Kim); visualization, D.J.; supervision, D.K. and S.K. (Sungyeun Kim); project administration, D.K. and S.K. (Sungyeun Kim); funding acquisition, S.K. (Seokmin Kang) and S.K. (Sungyeun Kim). All authors have read and agreed to the published version of the manuscript.

Funding

This research was supported by the Incheon National University Research Concentration Professors Grant in 2020.

Institutional Review Board Statement

Not applicable.

Informed Consent Statement

Not applicable.

Data Availability Statement

The data in this study are based on the national high school database https://www.schoolinfo.go.kr/Main.do (accessed on 4 January 2022) provided by the Korean Ministry of Education.

Conflicts of Interest

The authors declare no conflict of interest. The funder had no role in the design of the study; in the collection, analyses, or interpretation of data; in the writing of the manuscript; or in the decision to publish the results.

References

  1. Yusuf, N. The Effect of Online Tutoring Applications on Student Learning Outcomes during the COVID-19 Pandemic. Italienisch 2021, 11, 81–88. [Google Scholar]
  2. Jena, P.K. Online learning during lockdown period for COVID-19 in India. Int. J. Multidiscip. Educ. Res. 2020, 9, 82–92. [Google Scholar]
  3. Fatonia, N.A.; Nurkhayatic, E.; Nurdiawatid, E.; Fidziahe, G.P.; Adhag, S.; Irawanh, A.P.; Julyantoj, O.; Azizik, E. University students online learning system during COVID-19 pandemic: Advantages, constraints and solutions. Syst. Rev. Pharm. 2020, 11, 570–576. [Google Scholar]
  4. Sadeghi, M. A shift from classroom to distance learning: Advantages and limitations. Int. J. Res. Engl. Educ. 2019, 4, 80–88. [Google Scholar] [CrossRef]
  5. Dumford, A.D.; Miller, A.L. Online learning in higher education: Exploring advantages and disadvantages for engagement. J. Comput. High. Educ. 2018, 30, 452–465. [Google Scholar] [CrossRef]
  6. Alawamleh, M.; Al-Twait, L.M.; Al-Saht, G.R. The effect of online learning on communication between instructors and students during COVID-19 pandemic. Asian Educ. Dev. Stud. 2020, 11, 380–400. [Google Scholar] [CrossRef]
  7. Jeong, H.C.; So, W.Y. Difficulties of online physical education classes in middle and high school and an efficient operation plan to address them. Int. J. Environ. Res. Public Health 2020, 17, 7279. [Google Scholar] [CrossRef]
  8. Ferri, F.; Grifoni, P.; Guzzo, T. Online learning and emergency remote teaching: Opportunities and challenges in emergency situations. Societies 2020, 10, 86. [Google Scholar] [CrossRef]
  9. Miller, S.P.; Mercer, C.D. Educational aspects of mathematics disabilities. J. Learn. Disabil. 1997, 30, 47–56. [Google Scholar] [CrossRef]
  10. Dominguez, P.S.; Ridley, D.R. Assessing distance education courses and discipline differences in their effectiveness. J. Instr. Psychol. 2001, 28, 15. [Google Scholar]
  11. Aliyyah, R.R.; Rachmadtullah, R.; Samsudin, A.; Syaodih, E.; Nurtanto, M.; Tambunan, A.R.S. The perceptions of primary school teachers of online learning during the COVID-19 pandemic period: A case study in Indonesia. Online Submiss. 2020, 7, 90–109. [Google Scholar]
  12. Bacher-Hicks, A.; Goodman, J.; Mulhern, C. Inequality in household adaptation to schooling shocks: COVID-induced online learning engagement in real time. J. Public Econ. 2021, 193, 104345. [Google Scholar] [CrossRef]
  13. Jung, S.; An, Y. A study on the current situation of the achievement gap in schools before and after COVID-19: Focusing on the distribution of academic achievement grades of middle schools in Seoul. Korean J. Sociol. Educ. 2021, 31, 53–74. [Google Scholar]
  14. Park, M. A study on the current situation and challenges of the educational gap in the Context of COVID-19: A Case Study of Gyeonggi Province. Korean J. Sociol. Educ. 2020, 30, 113–145. [Google Scholar]
  15. Byun, S.; Slavin, R.E. Educational responses to the COVID-19 outbreak in South Korea. Best Evid. Chin. Educ. 2020, 5, 665–680. [Google Scholar] [CrossRef]
  16. Dwiyono, Y.; Harnowo, R.; Ridani, A. The role of parents in helping online learning during COVID-19 in class iii students of sdn 014 samarinda ulu study year 2020/2021. Pendas Mahakam J. Pendidik. Dan Pembelajaran Sekol. Dasar 2021, 6, 34–41. [Google Scholar] [CrossRef]
  17. Doyumgaç, I.; Tanhan, A.; Kiymaz, M.S. Understanding the most important facilitators and barriers for online education during COVID-19 through online photovoice methodology. Int. J. High. Educ. 2021, 10, 166–190. [Google Scholar] [CrossRef]
  18. Chetty, R.; Friedman, J.N.; Hendren, N.; Stepner, M. Real-time economics: A new platform to track the impacts of COVID-19 on people, businesses, and communities using private sector data. NBER Work. Pap. 2020, 27431, 36–46. [Google Scholar]
  19. Nieuwoudt, J.E. Investigating synchronous and asynchronous class attendance as predictors of academic success in online education. Australas. J. Educ. Technol. 2020, 36, 15–25. [Google Scholar] [CrossRef]
  20. Al-Baadani, A.A.; Abbas, M. The impact of coronavirus (COVID19) pandemic on higher education institutions (HEIs) in Yemen: Challenges and recommendations for the future. Eur. J. Educ. Stud. 2020, 7, 68–82. [Google Scholar] [CrossRef]
  21. Belay, D.G. COVID-19, Distance Learning and Educational Inequality in Rural Ethiopia. Pedagog. Res. 2020, 5, em0082. [Google Scholar] [CrossRef]
  22. Shin, K.; Jahng, K.E.; Kim, D. Stories of South Korean mothers’ education fever for their children’s education. Asia Pac. J. Educ. 2019, 39, 338–356. [Google Scholar] [CrossRef]
  23. Lee, J.; Shim, J. Analysis of Polarization in Software Private Education. J. Korean Assoc. Inf. Educ. 2021, 25, 871–878. [Google Scholar]
  24. Ha, Y.; Park, H.-J. Can after-school programs and private tutoring help improve students’ achievement? Revisiting the effects in Korean secondary schools. Asia Pac. Educ. Rev. 2017, 18, 65–79. [Google Scholar] [CrossRef]
  25. Namgung, Y. Online School Starts for Elementary, Middle, and High School for New Semesters; Korea Ministry of Education: Sejong-si, Republic of Korea, 2020.
  26. Oh, M.H. Preparing Measures to Minimize School Density and Reduce Teacher Workload before the Commencement of Classes; Korea Ministry of Education: Sejong-si, Republic of Korea, 2020.
  27. Park, B.G. Smartphone class due to Poor Connection to laptop… Finally Gave Up after 17 Minutes. Herald Economy, 9 April 2020. [Google Scholar]
  28. Park, J.C. Going to School and Distance Learning in the Metropolitan Area Again from Tomorrow… Confusion before Vacation. YONHAP News, 19 December 2021. [Google Scholar]
  29. Gong, J.Y. One-Sided Notice from the Ministry of Education Disrupts the Preparations for the Opening of Elementary and Lower Grades… Only Aggravates the On-Site Chaos. Kyeongin News, 20 April 2020. [Google Scholar]
  30. Choi, W. Widening gap in distance learning conditions, deepening educational inequality. HANKYOREH, 31 March 2020. [Google Scholar]
  31. Wen, H.; Xiao, Y.; Hui, E.C.; Zhang, L. Education quality, accessibility, and housing price: Does spatial heterogeneity exist in education capitalization? Habitat Int. 2018, 78, 68–82. [Google Scholar] [CrossRef]
  32. Lee, Y.S. School districting and the origins of residential land price inequality. J. Hous. Econ. 2015, 28, 1–17. [Google Scholar] [CrossRef]
  33. Wing, C.; Simon, K.; Bello-Gomez, R.A. Designing difference in difference studies: Best practices for public health policy research. Annu. Rev. Public Health 2018, 39, 453–469. [Google Scholar] [CrossRef] [PubMed]
  34. Dubé, J.; Legros, D.; Thériault, M.; Des Rosiers, F. A spatial difference-in-differences estimator to evaluate the effect of change in public mass transit systems on house prices. Transp. Res. Part B Methodol. 2014, 64, 24–40. [Google Scholar] [CrossRef]
  35. Cho, K.W.; Park, D. Emergency Management Policy Issues during and after COVID-19: Focusing on South Korea. J. Contemp. East. Asia 2023, 22, 49–81. [Google Scholar]
  36. Tahira, I. Digital Technology Practices and Vaccine Campaign in Korea: International Perceptions on Health Diplomacy amid COVID-19 Crisis. J. Contemp. East. Asia 2022, 21, 27–46. [Google Scholar]
  37. Nguyen, H.T.D.; Van Nguyen, C.; Pham, C.; Nguyen, P.T.; Le, C.C.H.; Pham, N.T.; Tran, N.T.A. Rural Communication in the COVID-19 Pandemic: An Empirical Analysis from Thua Thien Hue Province, Central Vietnam. J. Contemp. East. Asia 2022, 21, 33–42. [Google Scholar]
  38. Lee, S.; Park, Y.J. The impact of COVID-19 on elementary education at three schools in Bucheon city, Korea. Korean Assoc. Space Environ. Res. 2020, 30, 172–207. [Google Scholar] [CrossRef]
  39. Jung, W. Online lectures to replace the delayed start of school, what about children from low-income families. Yeongnam Ilbo, 18 March 2020. [Google Scholar]
  40. Shin, S. A Survey on Perceptions of Online Classes in the Era of COVID-19. Hankook Ilbo, 11 March 2021. [Google Scholar]
Figure 1. Changes in academic performance by region: (a) Year 1 effect by region on Mathematics scores (2020); (b) Year 2 effect by region on Mathematics scores (2021); (c) Year 1 effect by region on English scores (2020); (d) Year 2 effect by region on English scores (2021).
Sustainability 15 12514 g001
Figure 2. Changes in the mean Math score by land price.
Sustainability 15 12514 g002
Figure 3. Changes in the mean English score by land price.
Sustainability 15 12514 g003
Table 1. Variables and operationalizations.
VariablesDescriptionOperationalization
Dependent variablesStudent achievementMean score for each subjectMath and English mean score
Independent variablesLand pricesProxy for resource-wealthy vs resource-poor community based on median local land price A b o v e   m e d i a n = 1
B e l o w m   e d i a n = 0
Control
variables
Local
characteristics
Social distanceNumber of weeks for the highest level
Internet accessibilityInternet usage rate
Financial
independence
s e l f   f u n d e d ( b o n d ) a c c o u n t i n g   i n c o m e × 100
School
characteristics
Number of classesNumber of second-year classes offered
Dropout rateRatio of dropout
Number of studentsNumber of second-year students
Student healthBMI index
Student-teacher ratioNumber of students per teacher
School type P u b l i c = 0 , P r i v a t e = 1
School settingCoed = 0, Boys High School = 1,
Girls High School = 2
School incomeNatural log of income (KRW)
Table 2. Descriptive statistical summary (N = 4546).
VariablesMeanStd. Dev.MinMax
Land price (per m2; KRW)3,022,976269,69962,7501,700,000
Social distance8.812.5036
Internet accessibility (%)91.23.580.699.1
Math mean score55.77.922.986
English mean score59.48.132.995
Student BMI22.70.72031.3
School income (million KRW)3710290017719,600
Number of classes8.13.2115
Number of students203.995.81463
Dropout rate (%)1.62.1050
Student-teacher ratio11.82.80.120.5
Financial independence (%)25.113.4468.9
School typePublic school: 60.4%
Private school: 39.6%
School settingCoed: 59.6%
Boys High School: 20.8%
Girls High School: 19.6%
Table 3. Diagnostics for spatial dependence.
Moran’s ILM (lag)Robust LM (lag)LM (Error)Robust LM (Error)
Math scoreY1 effect14.290 ***153.701 ***18.131 ***193.549 ***57.919 ***
Y2 effect22.401 ***439.621 ***5.162 **481.653 ***47.195 ***
English scoreY1 effect17.660 ***271.950 ***1.465297.441 ***26.956 ***
Y2 effect22.203 ***448.600 ***0.021473.138 ***24.559 ***
Note: p < 0.05 **, p < 0.01 ***; LM: Lagrange multiplier.
Table 4. Spatial DID on Math mean score.
Math ScoreYear 1 (2020–2019)Year 2 (2021–2019)
OLSSLMSEMOLSSLMSEM
Year2020−2.667 ***
(0.355)
−2.703 ***
(0.346)
−2.542 ***
(0.346)
2021 0.901
(0.739)
0.428
(0.699)
1.253
(0.778)
Land price−3.710 ***
(0.480)
−3.259 ***
(0.470)
−3.568 ***
(0.586)
−3.596 ***
(0.501)
−2.750 ***
(0.475)
−3.256 ***
(0.673)
Spatial DIDYI effect3.256 ***
(0.728)
3.349 ***
(0.709)
3.429 ***
(0.709)
Y2 effect 3.887 ***
(0.767)
3.417 ***
(0.724)
3.367 ***
(0.719)
Local
characteristics
Social distance−0.141
(0.140)
−0.127
(0.136)
−0.203
(0.152)
−0.110 ***
(0.028)
−0.088 ***
(0.026)
−0.118 ***
(0.030)
Internet use0.204 ***
(0.004)
0.135 ***
(0.041)
0.170 ***
(0.058)
0.193 ***
(0.043)
0.116 ***
(0.041)
0.197 ***
(0.068)
Finance
independence
0.032 ***
(0.012)
0.022
(0.012)
0.023
(0.015)
0.030 **
(0.013)
0.020
(0.012)
0.024
(0.018)
School
characteristics
Boys high school0.849 **
(0.392)
0.961 **
(0.382)
1.440 ***
(0.402)
0.250
(0.403)
0.423
(0.381)
0.892 **
(0.408)
Girls high school0.971 **
(0.385)
0.930 **
(0.376)
1.176 ***
(0.392)
0.256
(0.405)
0.291
(0.382)
0.583
(0.403)
Private school2.381 ***
(0.333)
2.475 ***
(0.325)
2.751 ***
(0.336)
2.255 ***
(0.350)
2.287 ***
(0.330)
2.579 ***
(0.343)
Student BMI−0.957 ***
(0.209)
−0.956 ***
(0.203)
−1.062 ***
(0.208)
−1.078 ***
(0.258)
−1.109 ***
(0.244)
−1.233 ***
(0.243)
Number of classes−0.848 ***
(0.158)
−0.831 ***
(0.154)
−0.854 ***
(0.166)
−0.676 ***
(0.170)
−0.660 ***
(0.160)
−0.764 ***
(0.177)
Number of students0.048 ***
(0.006)
0.045 ***
(0.006)
0.049 ***
(0.006)
0.039 ***
(0.006)
0.036 ***
(0.006)
0.041 ***
(0.006)
Student-teacher ratio−0.603 ***
(0.097)
−0.564 ***
(0.095)
−0.593 ***
(0.101)
−0.562 ***
(0.105)
−0.467 ***
(0.099)
−0.441 ***
(0.106)
Dropout of school−0.203 ***
(0.068)
−0.213 ***
(0.067)
−0.215 ***
(0.067)
−0.211 ***
(0.072)
−0.195 ***
(0.068)
−0.195 ***
(0.067)
School income (ln)−0.492 ***
0.159)
−0.514 ***
(0.154)
−0.483 ***
(0.155)
−0.371 **
(0.167)
−0336 **
(0.157)
−0.274
(0.156)
Lag coef. (Rho) 0.342 ***
(0.033)
0.476 ***
(0.029)
Spatial error (Lambda) 0.393 ***
(0.032)
0.508 ***
(0.029)
Constant66.956 ***
(6.289)
54.363 ***
(6.289)
71.822 ***
(7.289)
69.995 ***
(7.283)
50.109 ***
(6.985)
70.906 ***
(8.324)
Observation299029902990297329732973
F18.273 *** 11.192 ***
AIC20,497.320,392.720,362.120,676.520,421.720,391.3
Note: p < 0.05 **, p < 0.01 ***.
Table 5. Spatial DID on English mean score.
English ScoreYear 1 (2020–2019)Year 2 (2021–2019)
OLSSLMSEMOLSSLMSEM
Year2020−1.411 ***
(0.370)
−1.392 ***
(0.355)
−1.193 ***
(0.357)
2021 0.722
(0.750)
0.471
(0.708)
1.503
(0.791)
Land price−2.188 ***
(0.500)
−2.119 ***
(0.481)
−2.200 ***
(0.627)
−2.185 ***
(0.511)
−1.787 ***
(0.481)
−1.829 ***
(0.685)
Spatial DIDYI effect2.745 ***
(0.758)
2.899 ***
(0.729)
3.101 ***
(0.731)
Y2 effect 3.172 ***
(0.779)
2.820 ***
(0.733)
2.955 ***
(0.730)
Local
characteristics
Social distance−0.068
(0.146)
−0.069
(0.140)
−0.197
(0.159)
−0.088 ***
(0.028)
−0.074 ***
(0.027)
−0.114 ***
(0.031)
Internet use0.301 ***
(0.043)
0.177 ***
(0.042)
0.242 ***
(0.063)
0.314 ***
(0.044)
0.167 ***
(0.042)
0.253 ***
(0.069)
Finance
independence
0.018
(0.012)
0.012
(0.012)
0.008
(0.017)
0.018
(0.013)
0.014
(0.012)
0.012
(0.018)
School
characteristics
Boys high school−0.127
(0.409)
−0.075
(0.393)
0.355
(0.417)
−0.715
(0.410)
−0.579
(0.386)
−0.114
(0.415)
Girls high school2.243 ***
(0.402)
2.252 ***
(0.386)
2.495 ***
(0.406)
1.662 ***
(0.412)
1.880 ***
(0.388)
2.247 ***
(0.411)
Private school2.011 ***
(0.347)
2.030 ***
(0.334)
2.245 ***
(0.347)
2.032 ***
(0.358)
1.997 ***
(0.337)
2.196 ***
(0.351)
Student BMI−0.831 ***
(0.217)
−0.872 ***
(0.209)
−1.016 ***
(0.214)
−1.136 ***
(0.264)
−1.163 ***
(0.248)
−1.284 ***
(0.248)
Number of classes−0.918 ***
(0.164)
−0.850 ***
(0.158)
−0.822 ***
(0.172)
−0.841 ***
(0.173)
−0.813 ***
(0.162)
−0.901 ***
(0.179)
Number of students0.047 ***
(0.006)
0.043 ***
(0.006)
0.045 ***
(0.006)
0.044 ***
(0.006)
0.041 ***
(0.006)
0.046 ***
(0.006)
Student-teacher ratio−0.690 ***
(0.101)
−0.596 ***
(0.098)
−0.598 ***
(0.105)
−0.747 ***
(0.107)
−0.599 ***
(0.101)
−0.559 ***
(0.108)
Dropout of school−0.244 ***
(0.071)
−0.233 ***
(0.069)
−0.216 ***
(0.069)
−0.242 ***
(0.075)
−0.205 ***
(0.070)
−0.186 ***
(0.070)
School income (ln)−0.305
(0.165)
−0.292
(0.159)
−0.229
(0.160)
−0.293
(0.170)
−0.299
(0.160)
−0.273
(0.160)
Lag coef. (Rho) 0.405 ***
(0.031)
0.479 ***
(0.029)
Spatial error (Lambda) 0.437 ***
(0.031)
0.509 ***
(0.028)
Constant58.852 ***
(6.554)
46.201 ***
(6.432)
66.341 ***
(7.720)
65.472 ***
(7.431)
49.527 ***
(7.096)
71.805 ***
(8.487)
Observation299029902990291129112911
F15.214 *** 12.929 ***
AIC20,744.220,576.820,556.120,291.520,031.320,007.6
Note: p < 0.01 ***.
Disclaimer/Publisher’s Note: The statements, opinions and data contained in all publications are solely those of the individual author(s) and contributor(s) and not of MDPI and/or the editor(s). MDPI and/or the editor(s) disclaim responsibility for any injury to people or property resulting from any ideas, methods, instructions or products referred to in the content.

