
Driving Force Exploration for Flash Flood Based on Mann–Kendall Test and Geographical Detector: A Case Study of Hainan Island, China


Abstract
:1. Introduction
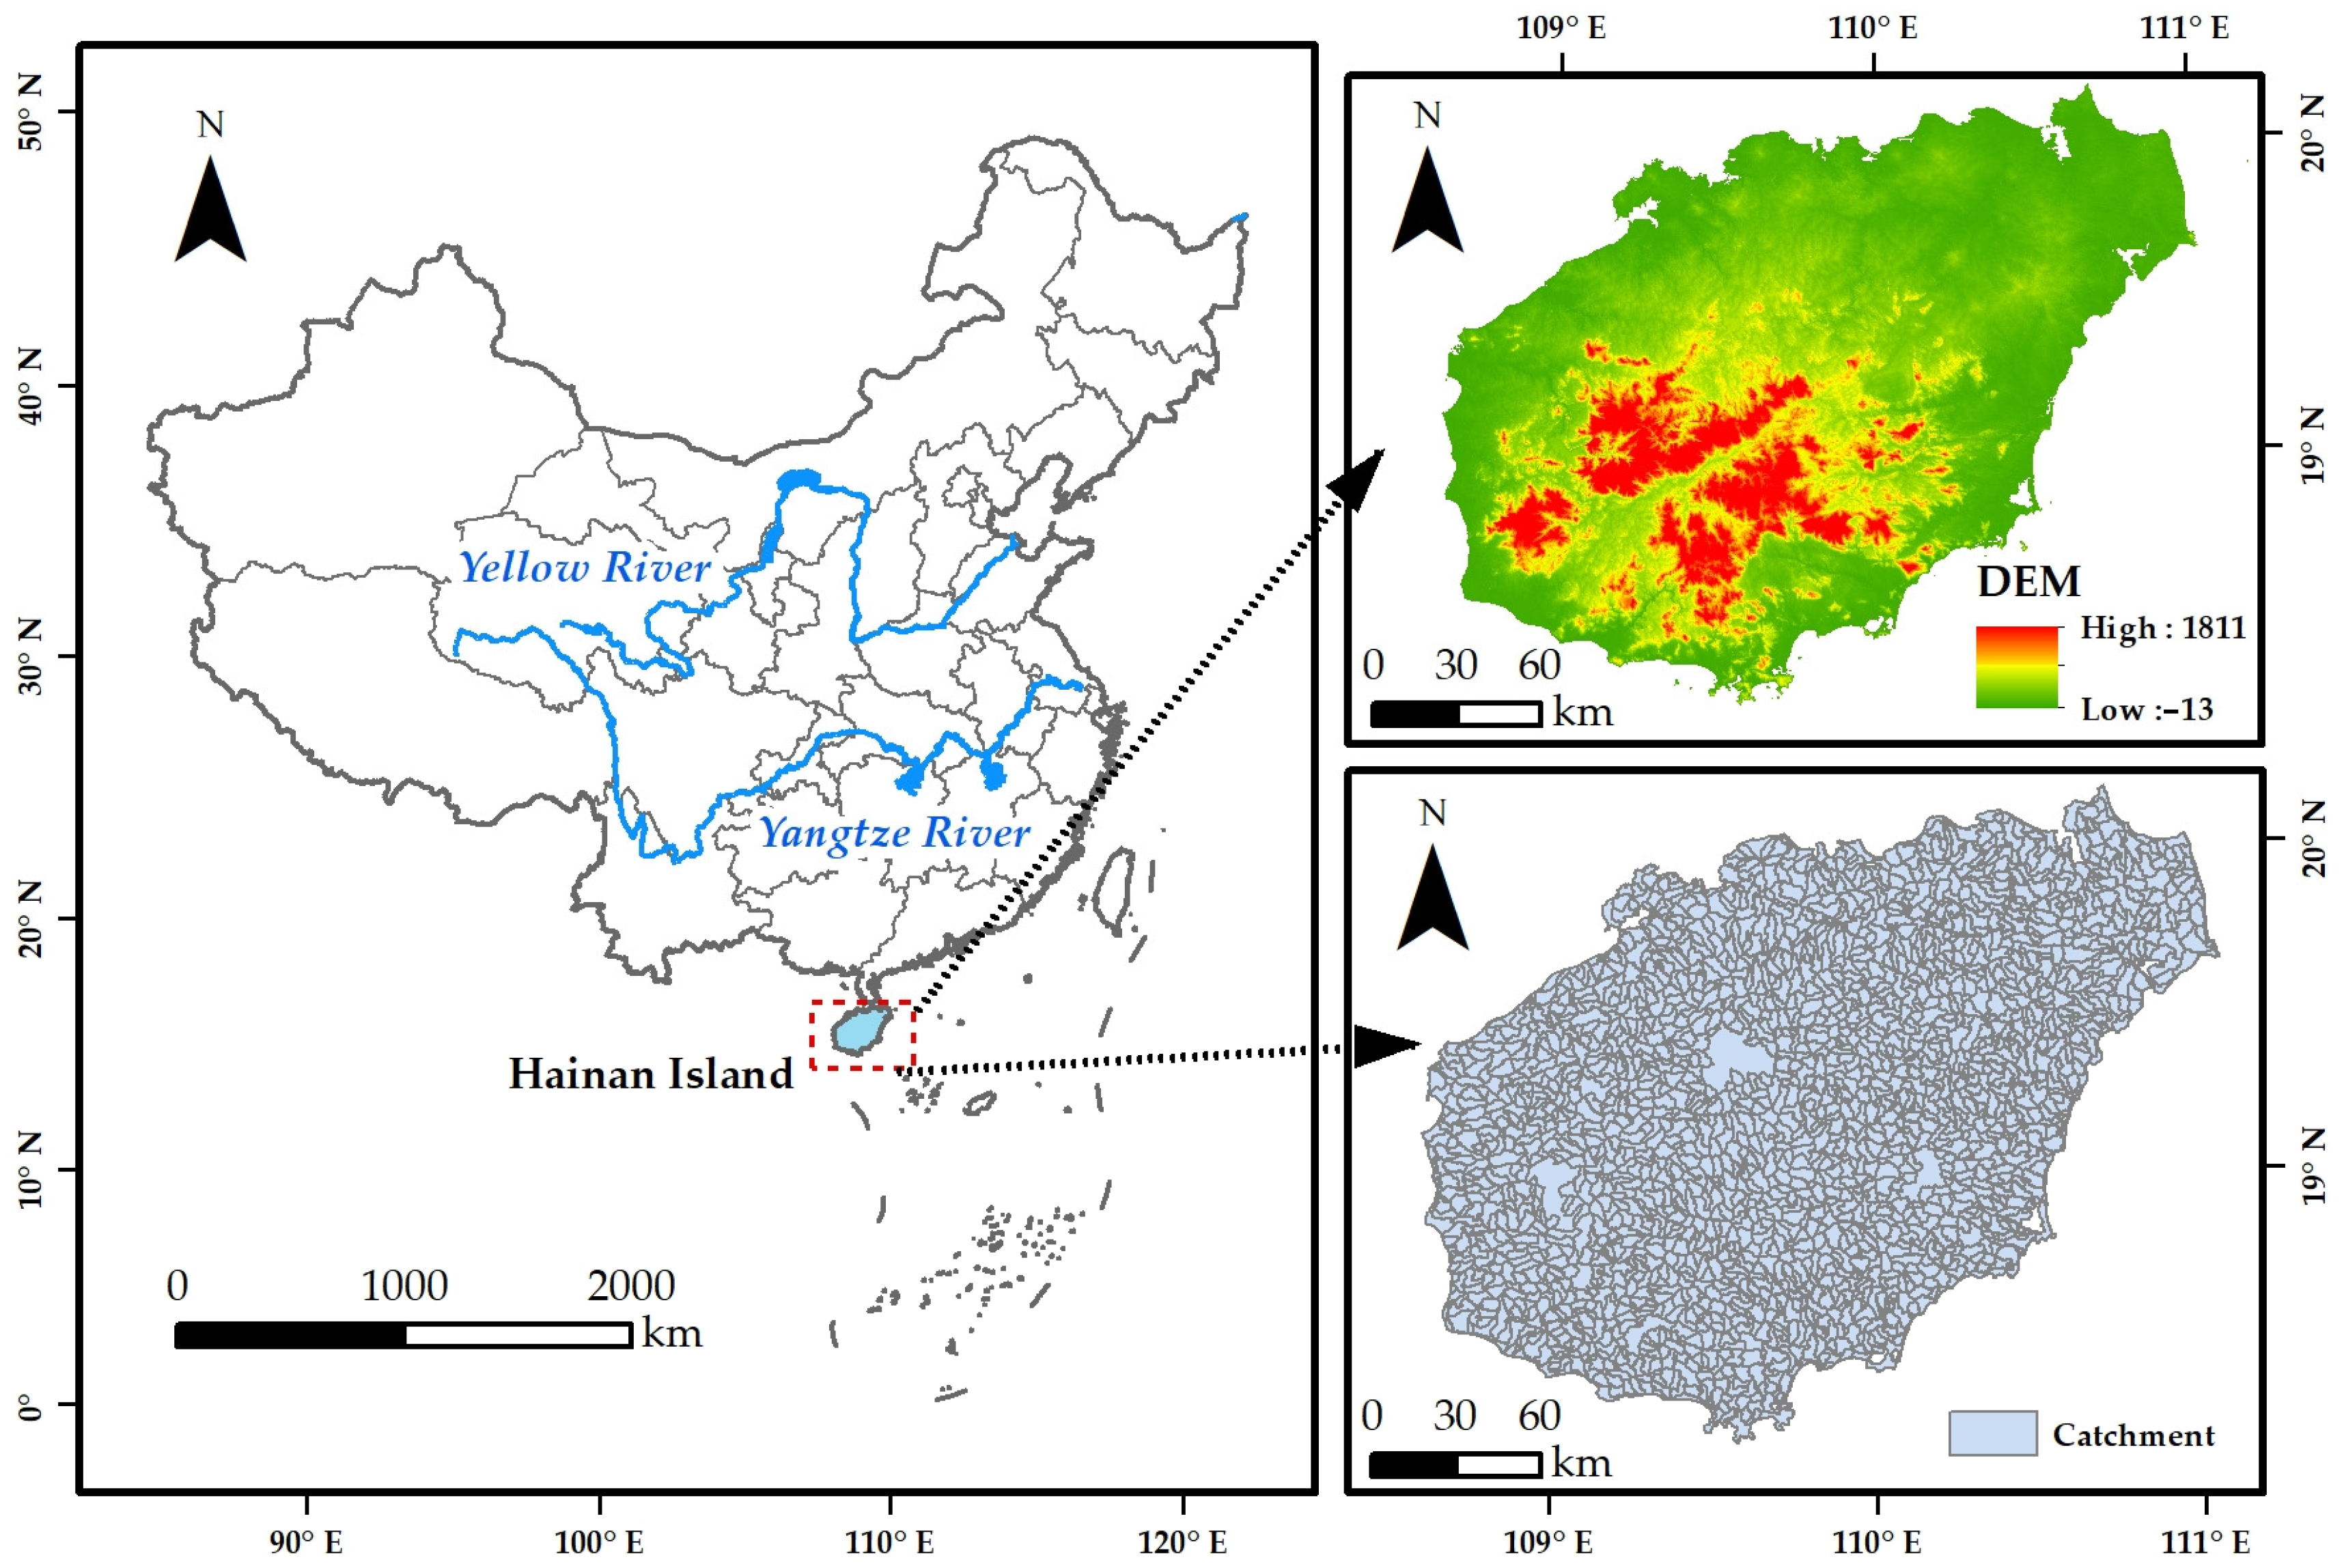
2. Study Area
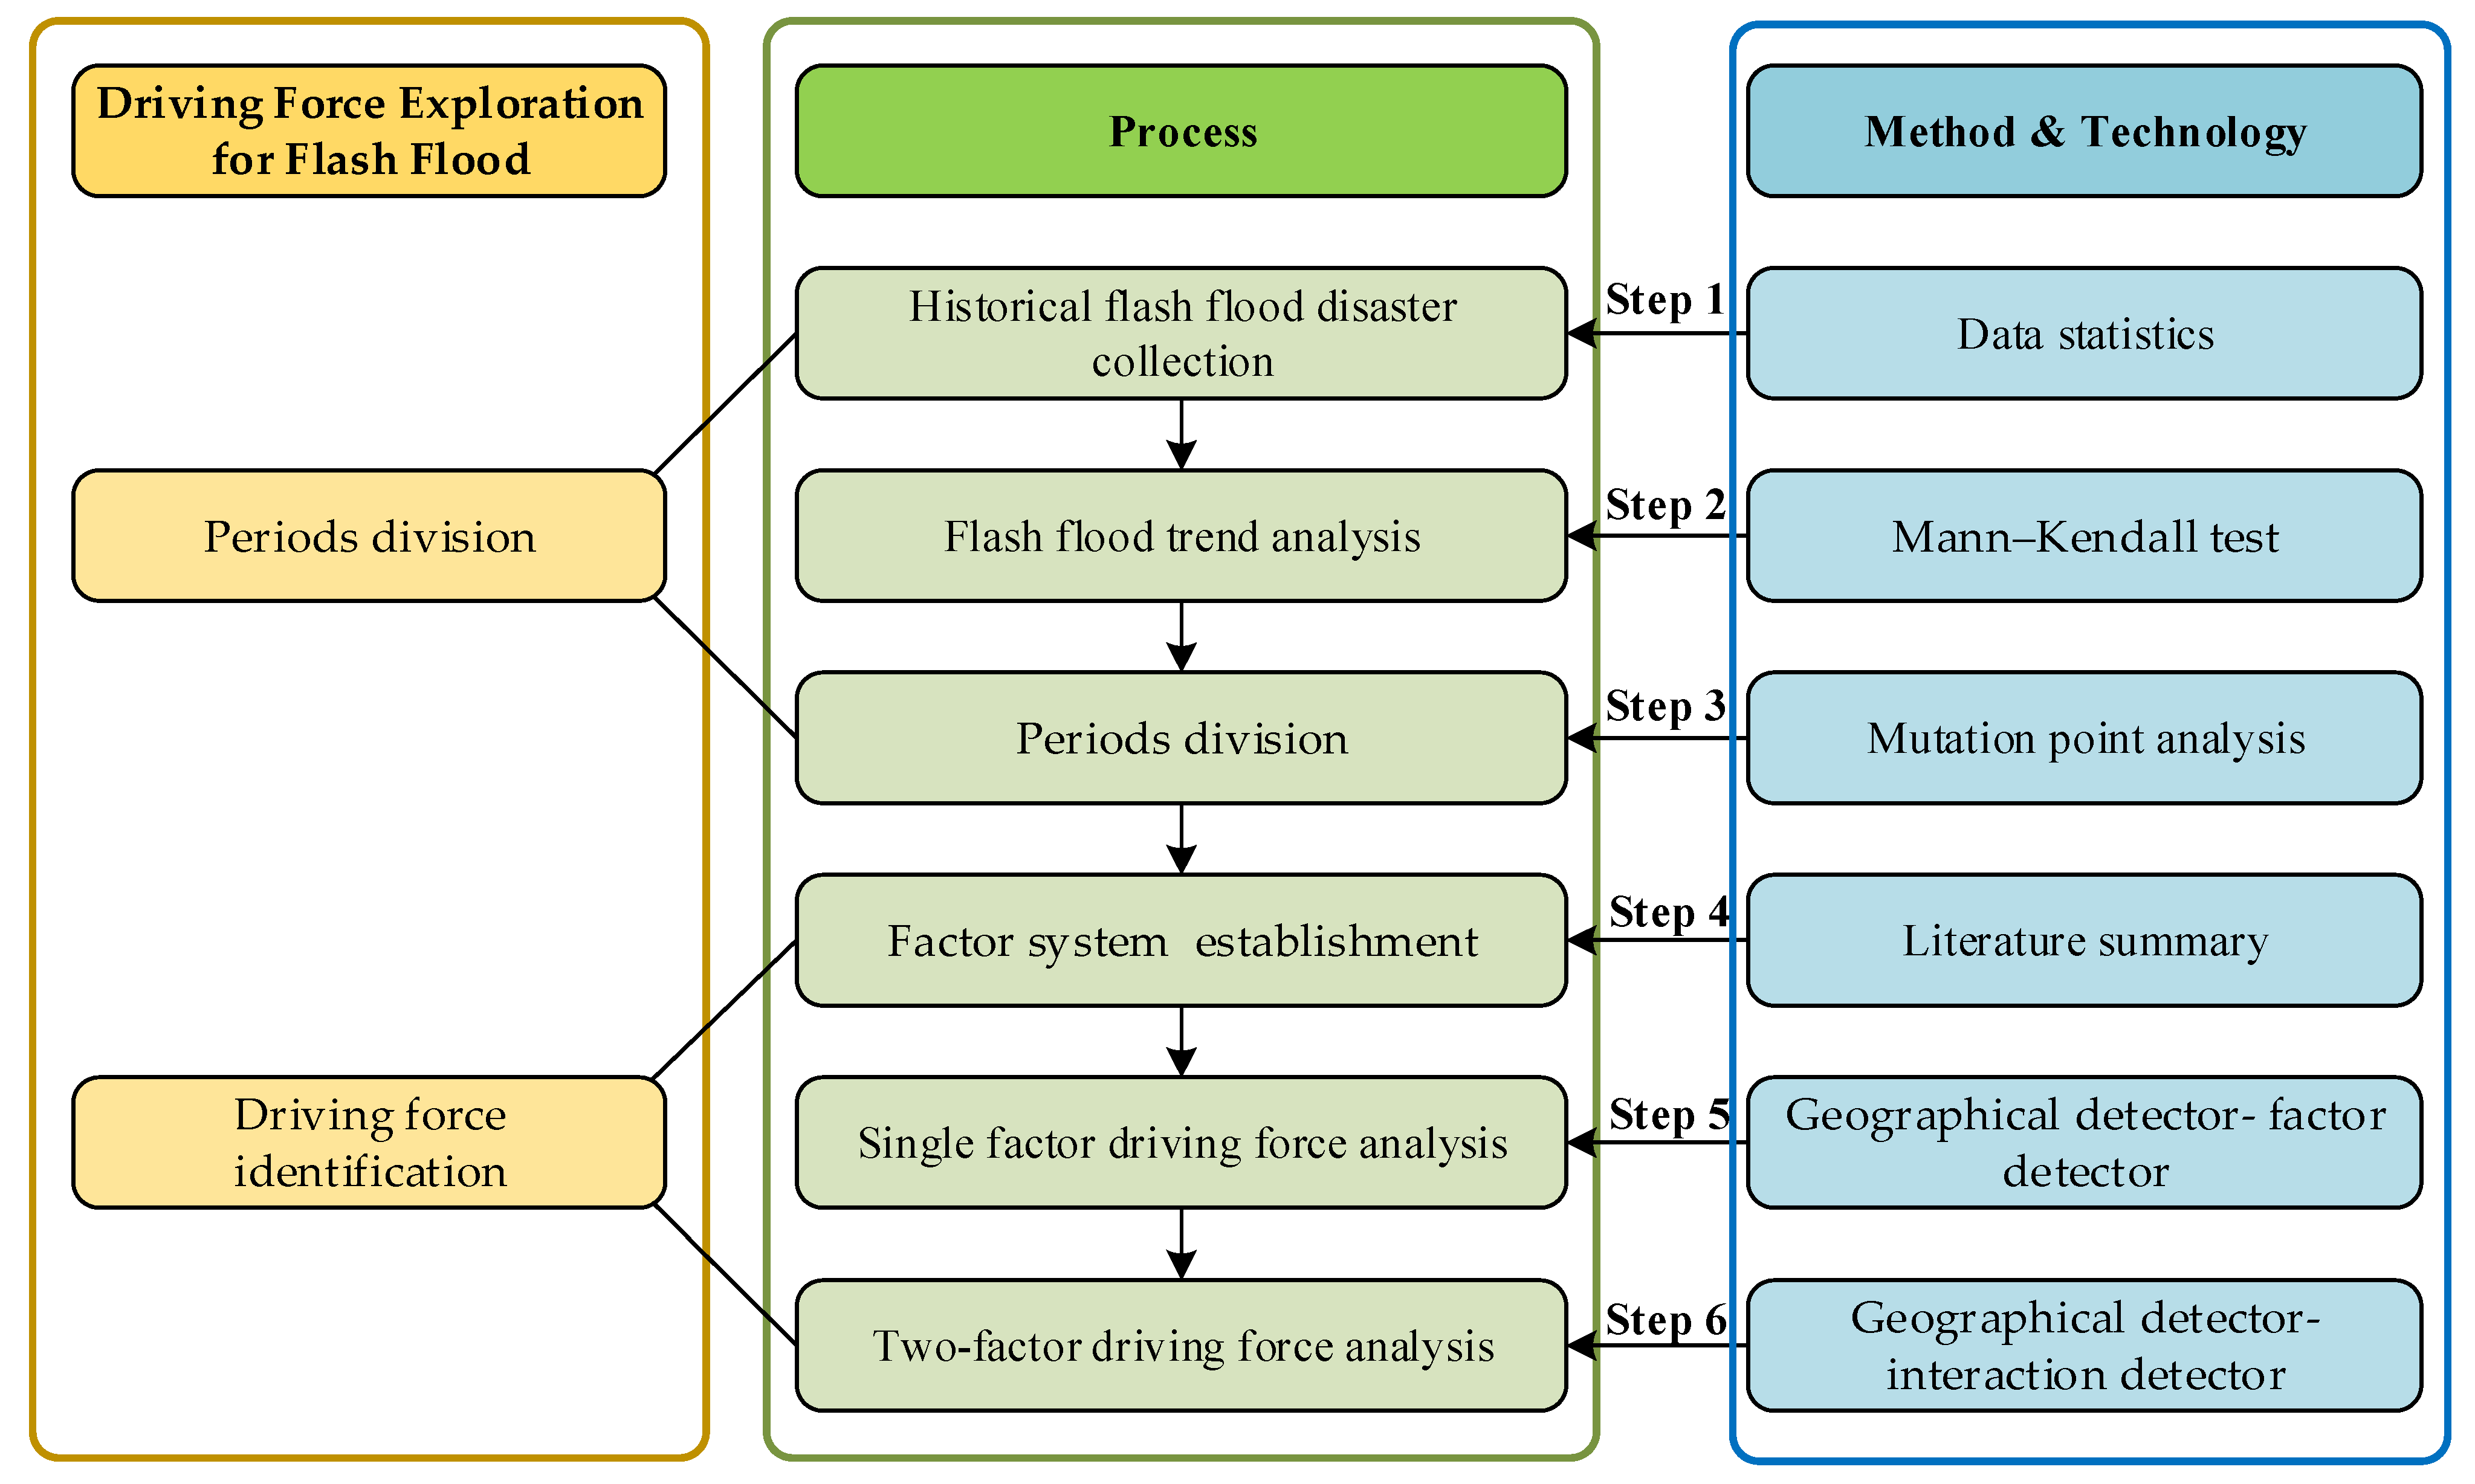
3. Materials and Methods
3.1. Mann–Kendall Test
3.2. Geographical Detector
3.3. Input Data and Classification
- (1)
- Soil, Veg, and LU
- (2)
- Ele and Slp
- (3)
- RD
- (4)
- GDP, POP, P, P10, P1, P6, and P24
- (5)
- FFI and SRD
4. Results
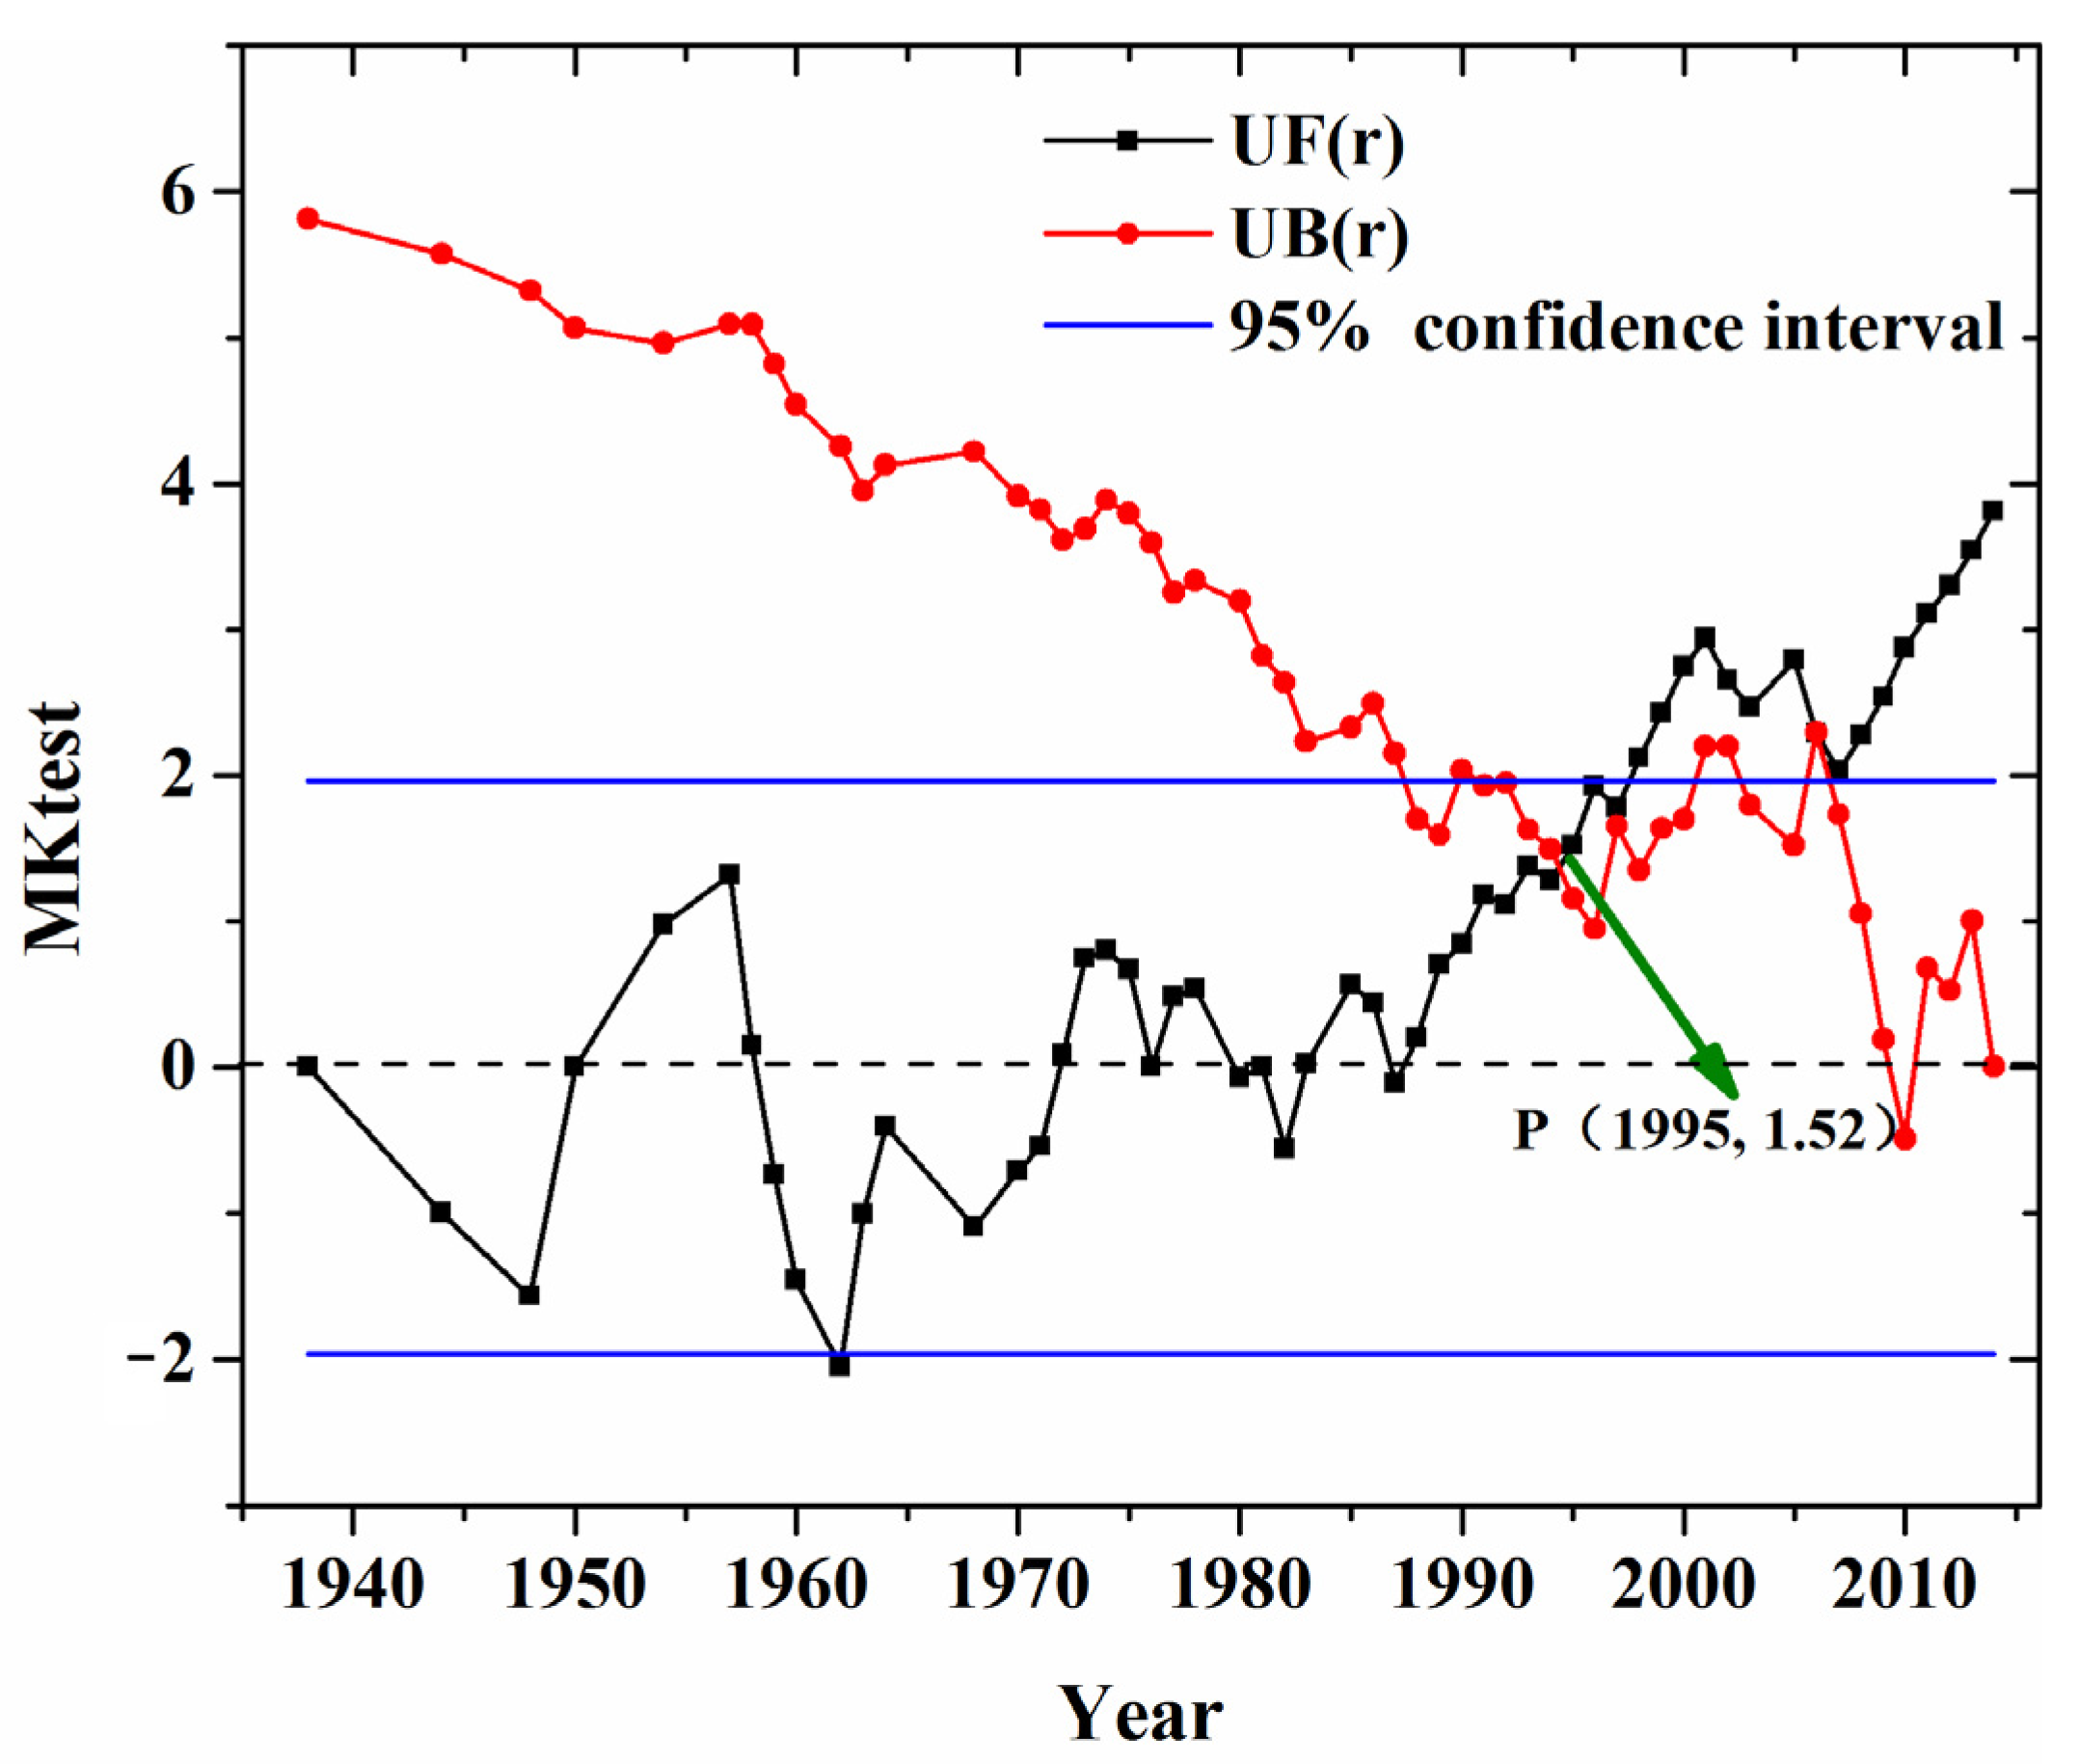
4.1. Periods Division Results for Flash Floods
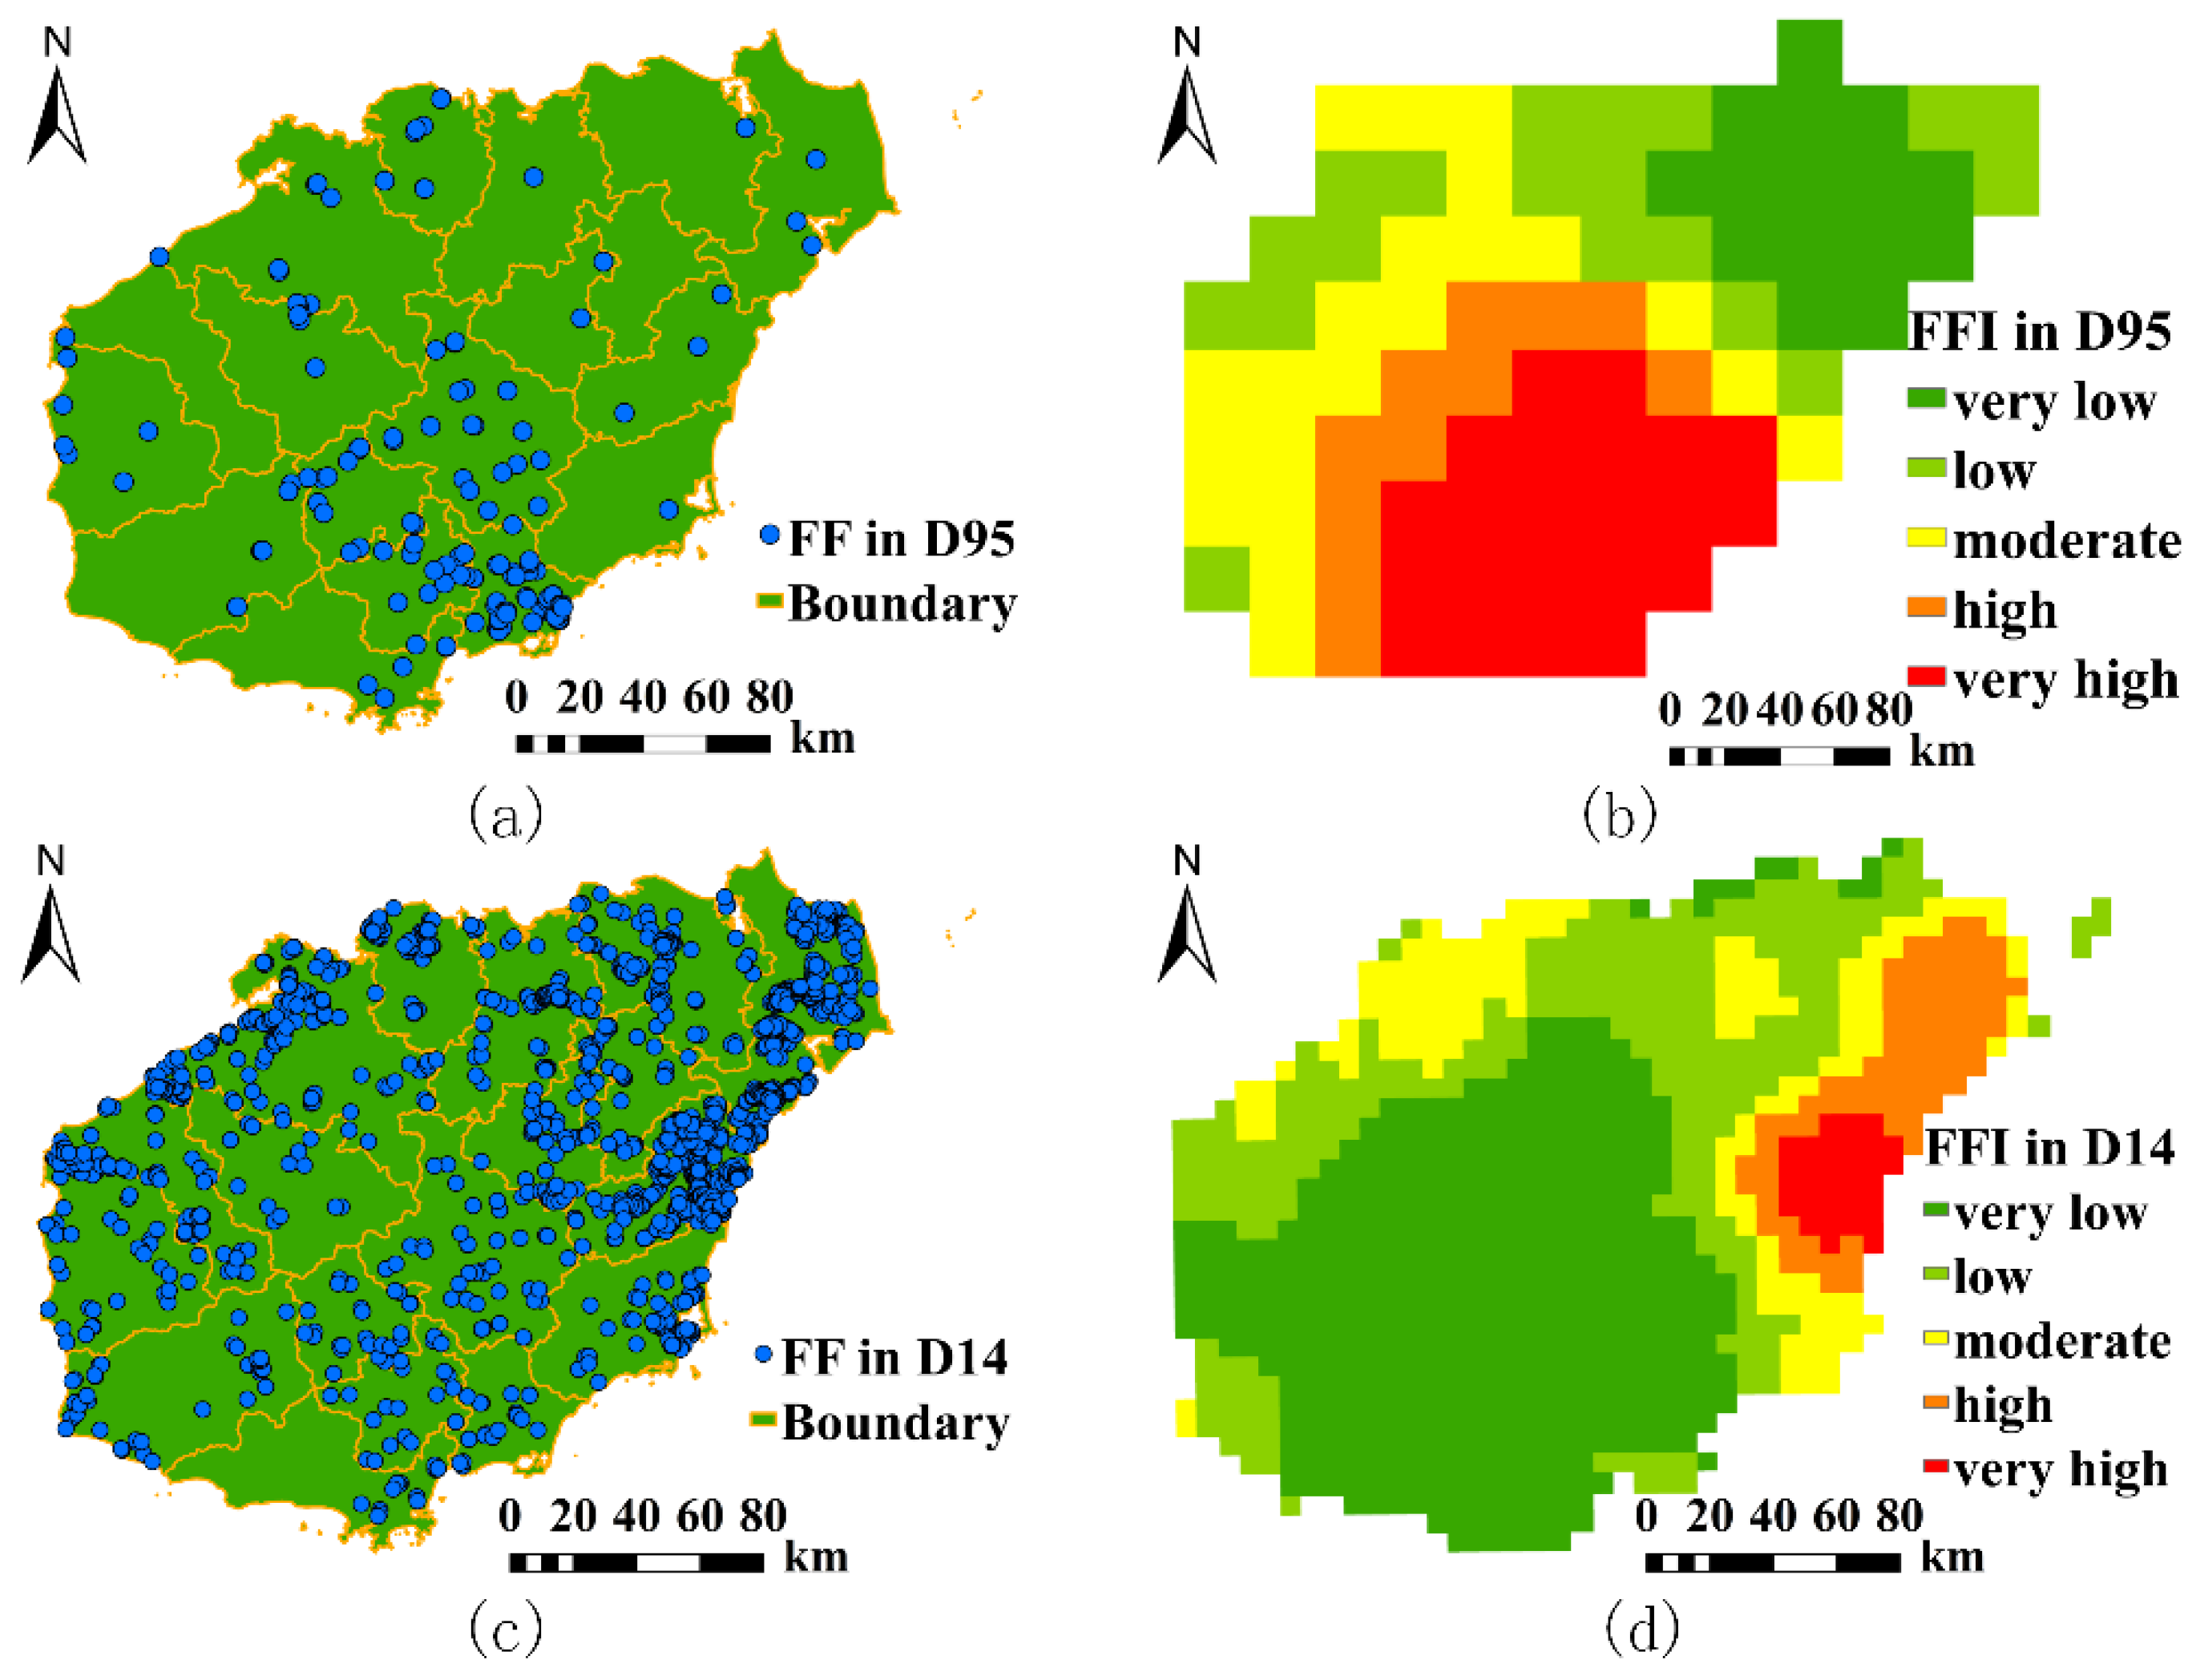
4.2. Results of Flash Flood Intensity and Factors in D95 and D14
4.2.1. Flash Flood Intensity
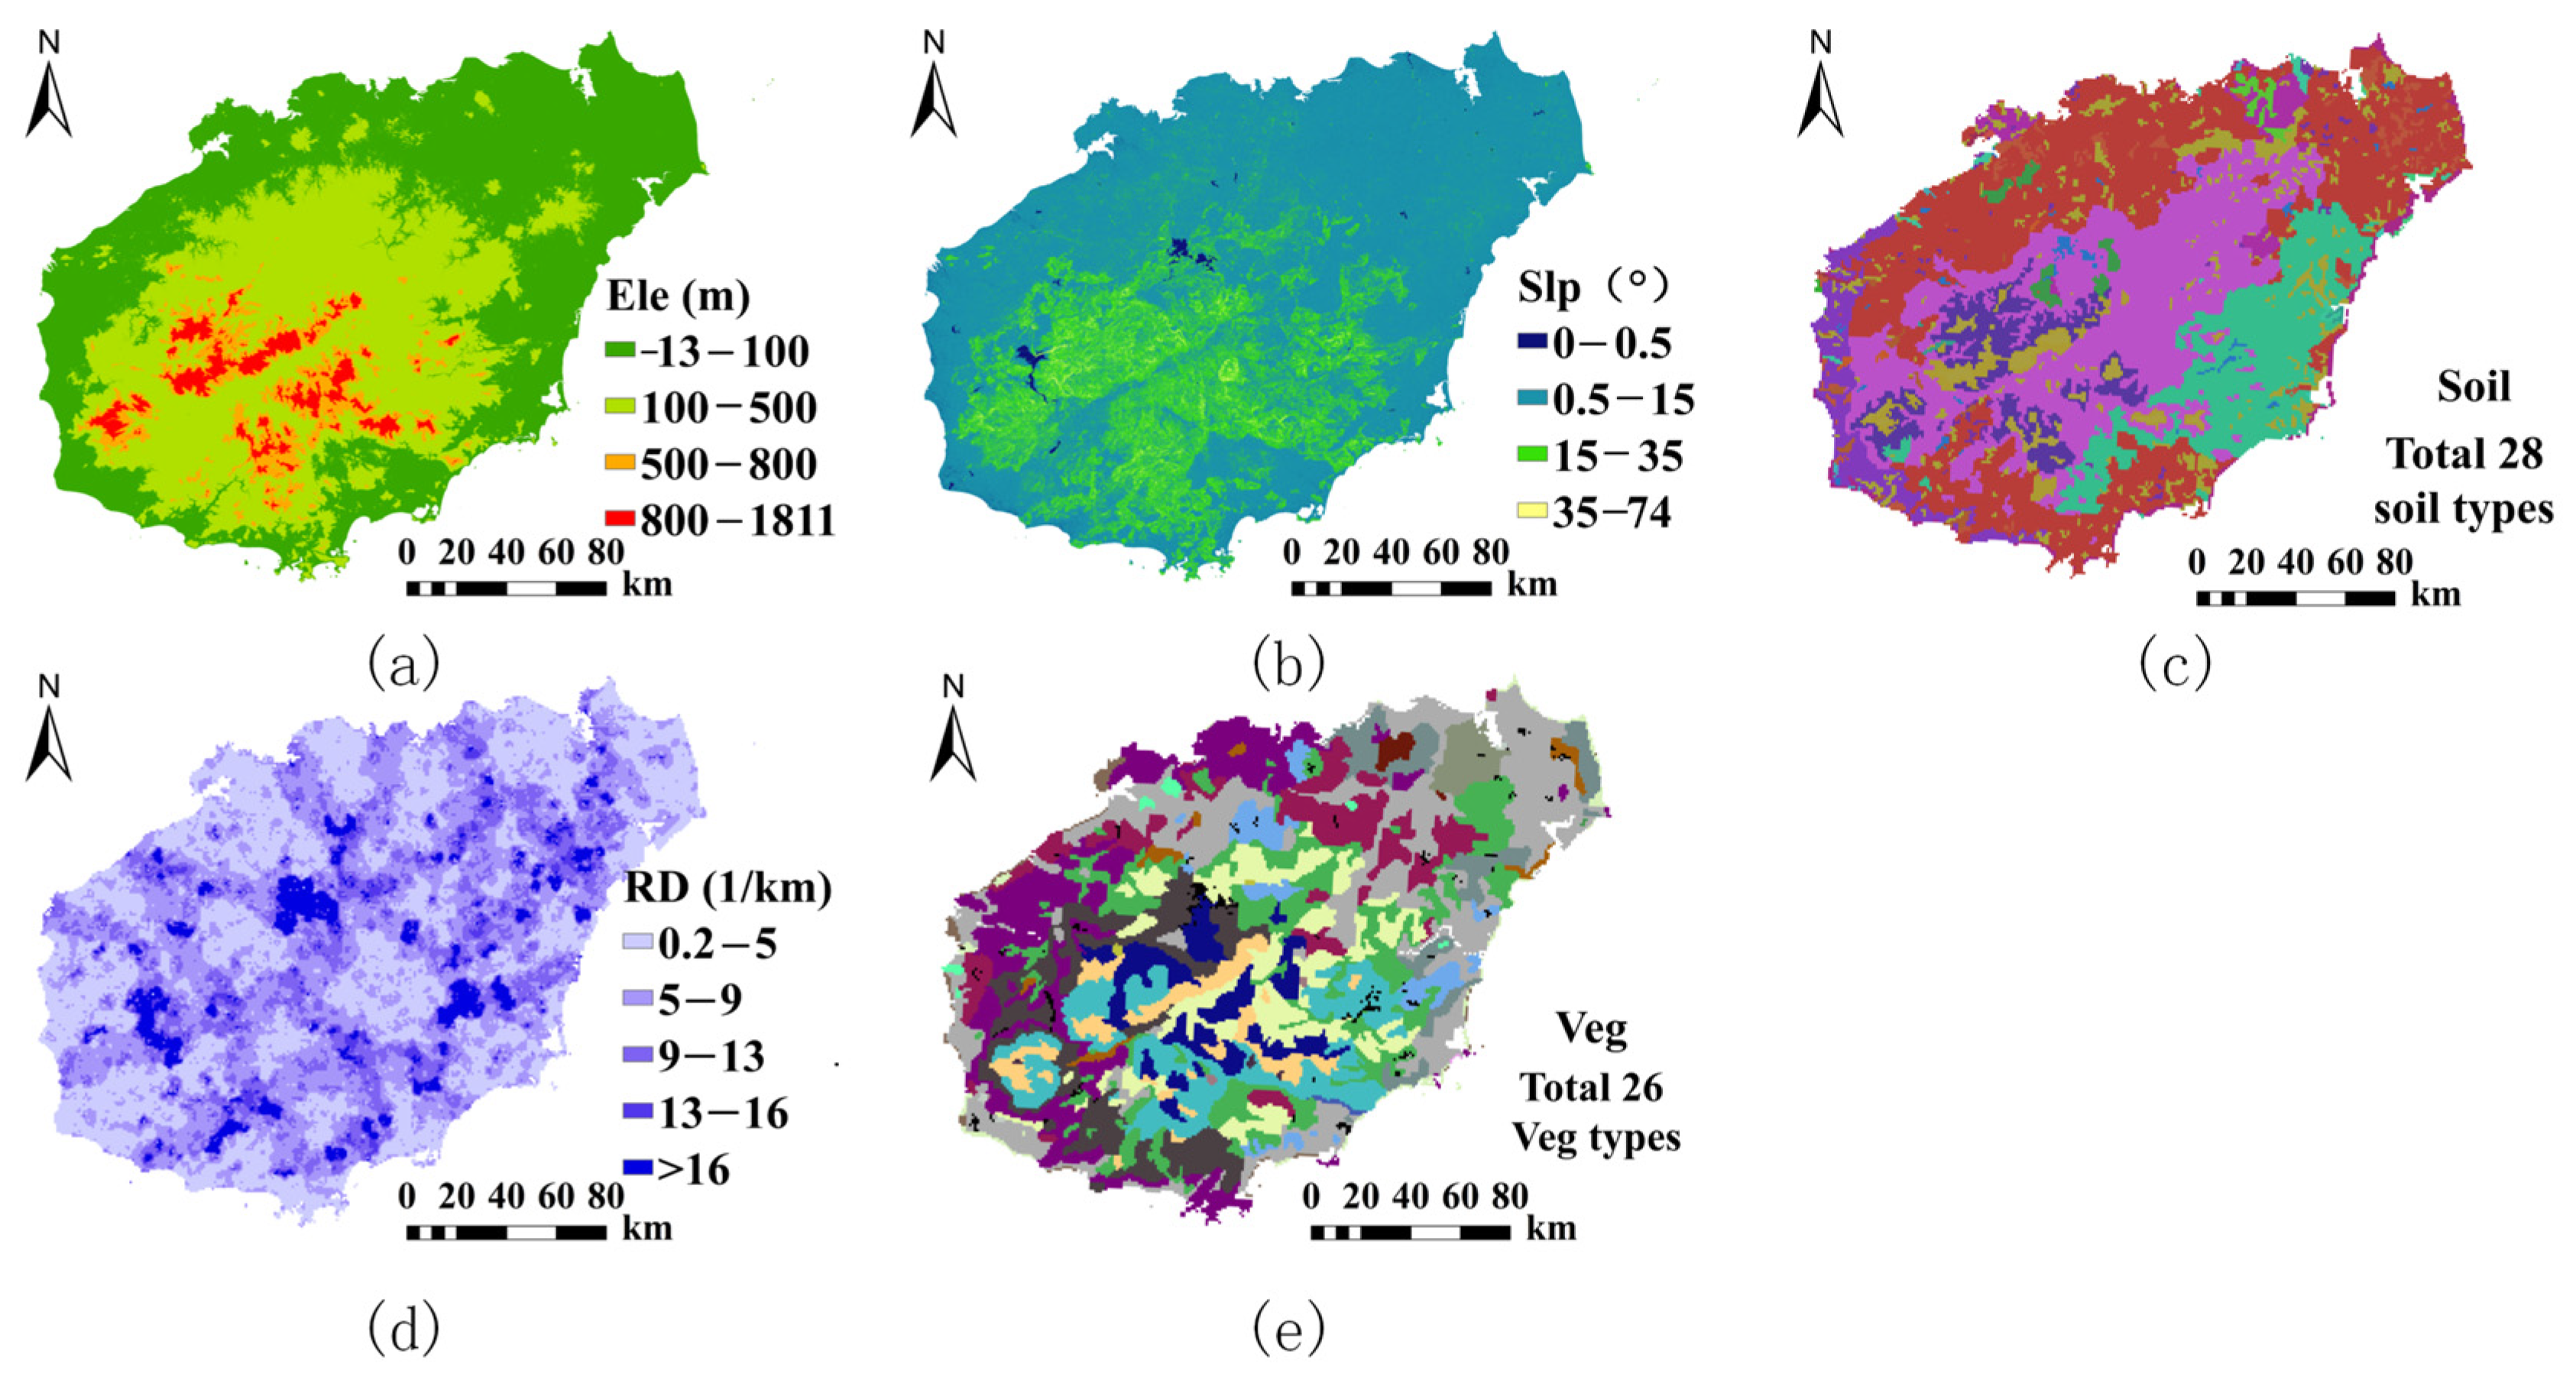
4.2.2. Natural Factors
4.2.3. Social Factors
4.2.4. Rainfall Factors
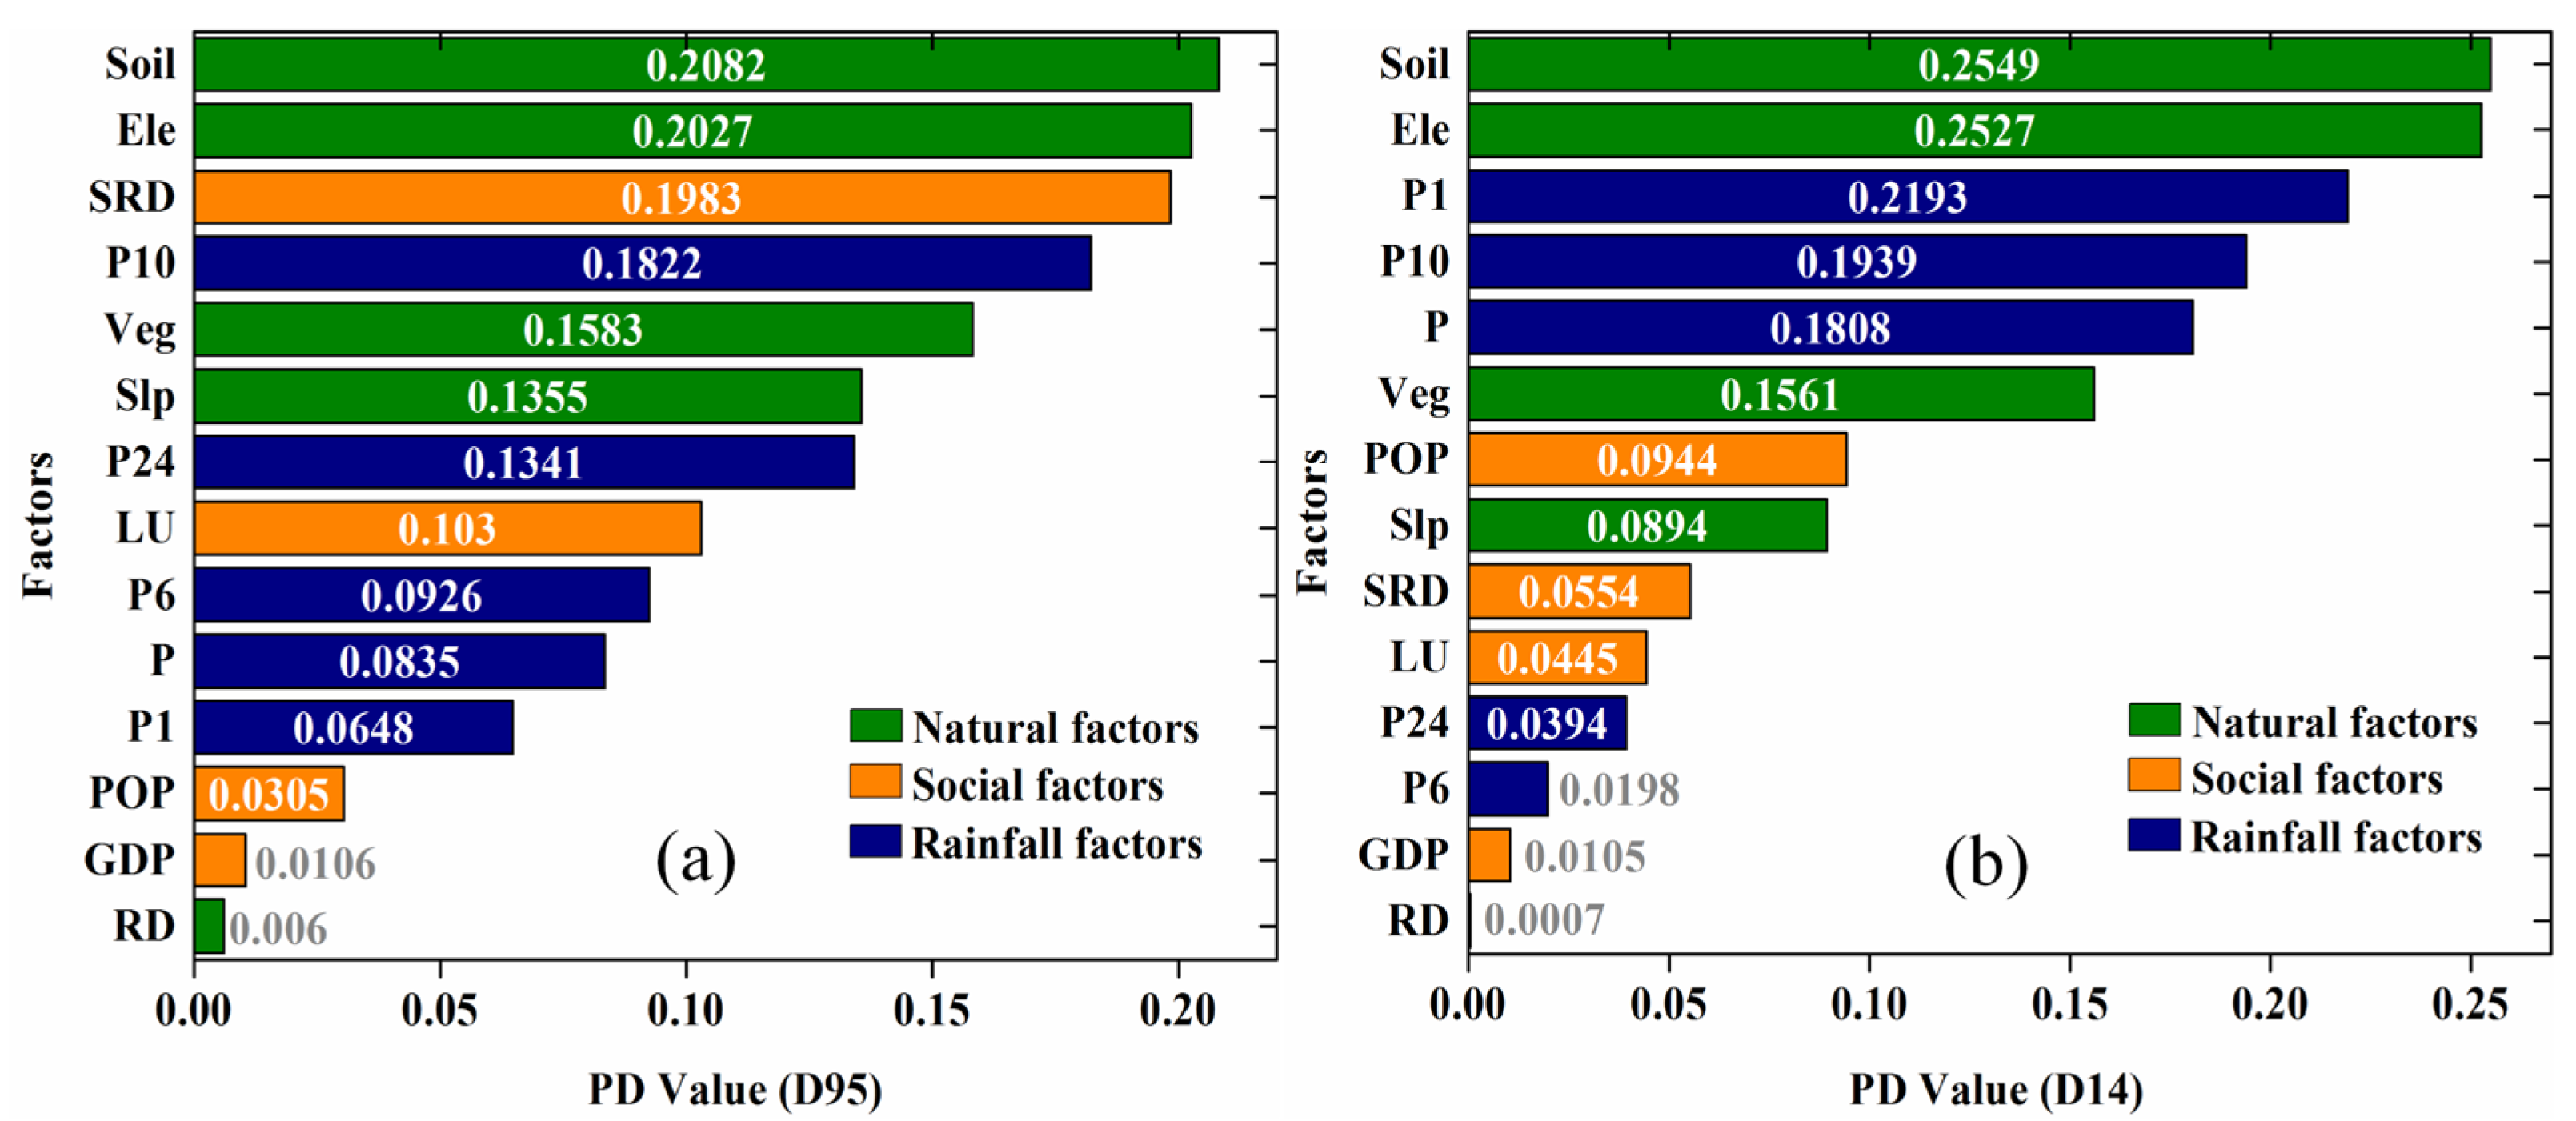
4.3. Main Driving Force Identification Results in D95 and D14
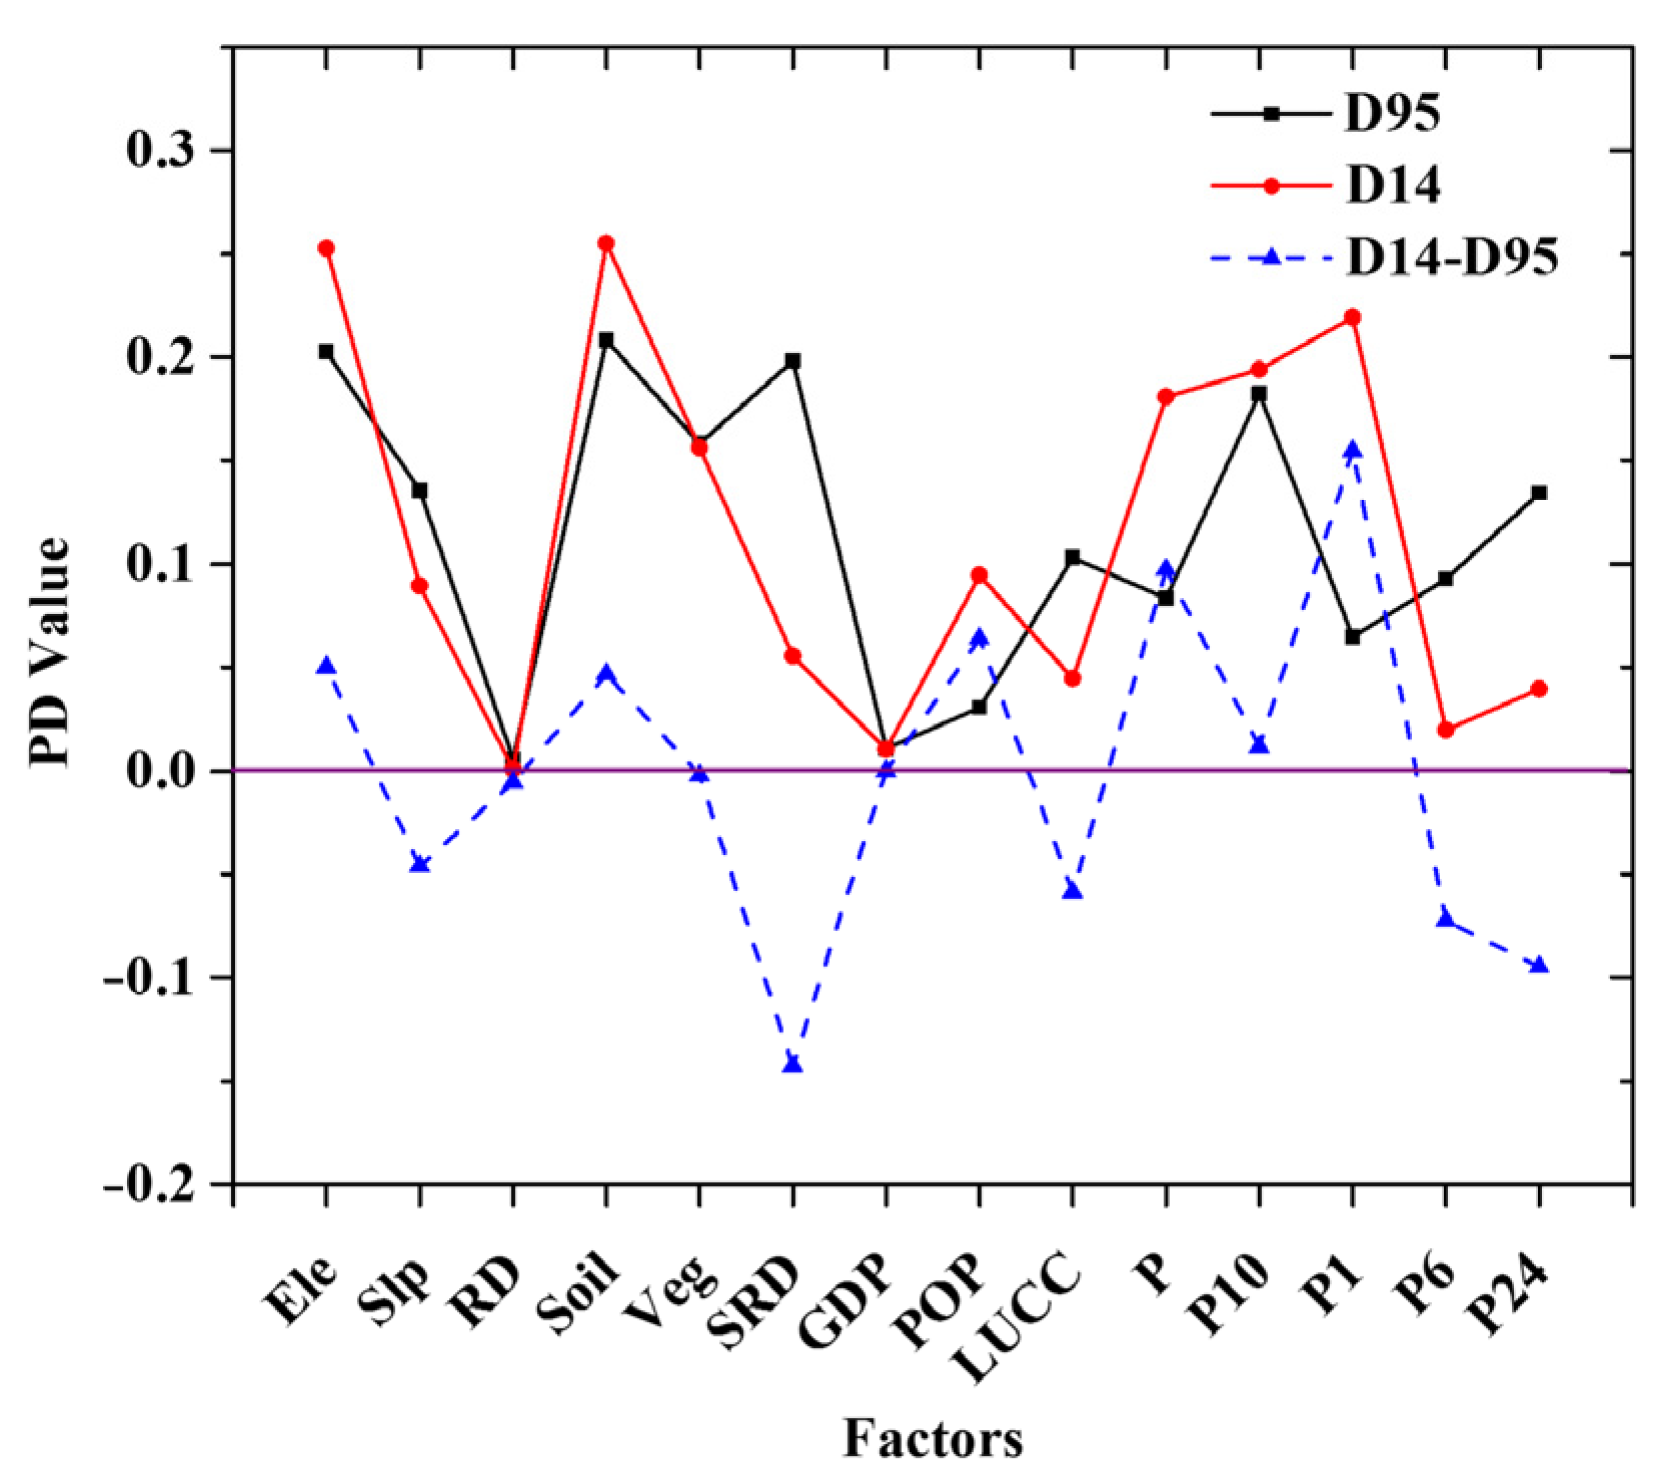
4.4. Changes in Different Factors’ Driving Forces for Flash Floods from D95 to D14
5. Discussion
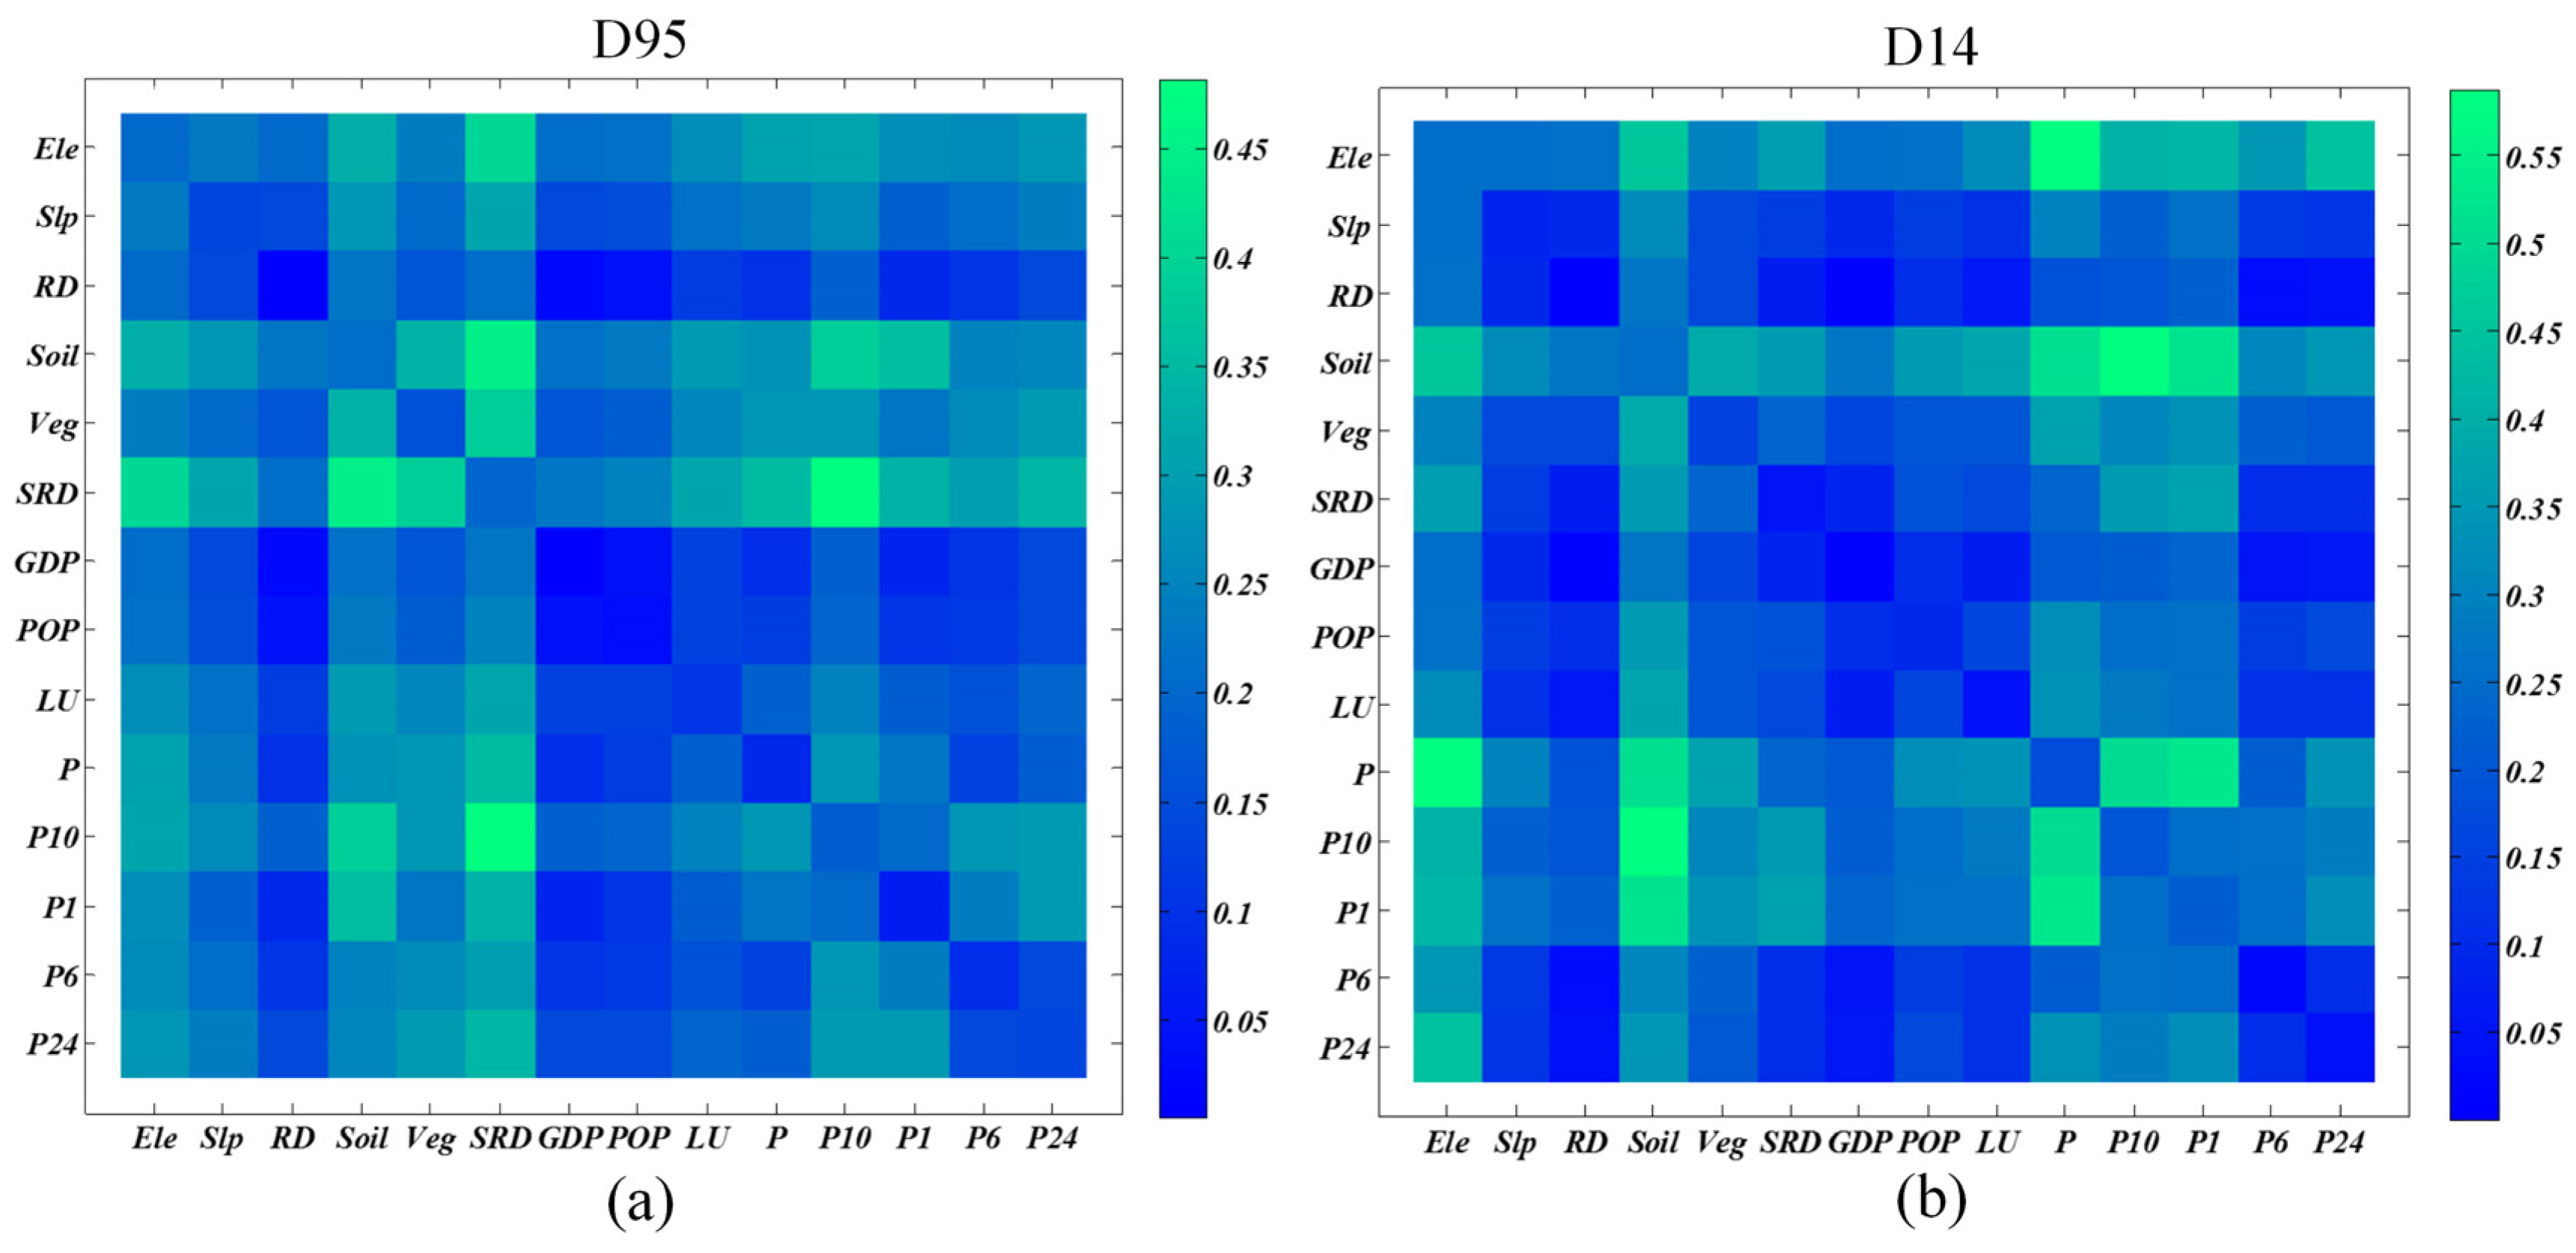
5.1. Driving Force Analysis of the Interaction between Rainfall Factors and Other Factors
5.2. The Application of Driving Force Results for Flash Flood Prevention and Management
6. Conclusions
Author Contributions
Funding
Data Availability Statement
Conflicts of Interest
Abbreviations
| Item | Abbreviation |
| Annual rainfall | P |
| Average flash flood intensity | AFFI |
| Elevation | Ele |
| Flash Flood Investigation and Evaluation Dataset of China | FFIEDC |
| Gross domestic product | GDP |
| Geographic information system | GIS |
| Hainan Province Hydrology and Water Resources Investigation Bureau | HNHWB |
| Land use | LU |
| Mann–Kendall | MK |
| Maximum 1 h rainfall | P1 |
| Maximum 10 min rainfall | P10 |
| Maximum 6 h rainfall | P6 |
| Maximum 24 h rainfall | P24 |
| Population density | POP |
| Potential driving force | PD |
| Recorded flash flood intensity | FFI |
| Resources and Environmental Sciences Data Center | RESDC |
| River density | RD |
| Slope | Slp |
| Small reservoir density | SRD |
| Soil | Soil |
| Vegetation type | Veg |
| Years from 1980 to 1995 | D95 |
| Years from 1996 to 2014 | D14 |
References
- Arlikatti, S.; Maghelal, P.; Agnimitra, N.; Chatterjee, V. Should I stay or should I go? Mitigation strategies for flash flooding in India. Int. J. Disaster Risk Reduct. 2018, 27, 48–56. [Google Scholar] [CrossRef]
- Morss, R.E.; Mulder, K.J.; Lazo, J.K.; Demuth, J.L. How do people perceive, understand, and anticipate responding to flash flood risks and warnings? Results from a public survey in Boulder, Colorado, USA. J. Hydrol. 2016, 541, 649–664. [Google Scholar] [CrossRef]
- Azmeri; Hadihardaja, I.K.; Vadiya, R. Identification of flash flood hazard zones in mountainous small watershed of Aceh Besar Regency, Aceh Province, Indonesia. Egypt. J. Remote Sens. Space Sci. 2016, 19, 143–160. [Google Scholar] [CrossRef]
- Yang, W. Research on Multiple Scales Pattern Evolution of Flash Floods and Vulnerability Assessment & Regulation; Tianjin University: Tianjin, China, 2018. [Google Scholar]
- Kastridis, A.; Kirkenidis, C.; Sapountzis, M. An integrated approach of flash flood analysis in ungauged Mediterranean watersheds using post-flood surveys and unmanned aerial vehicles. Hydrol. Process. 2020, 34, 4920–4939. [Google Scholar] [CrossRef]
- Shi, P.; Ye, T.; Wang, Y.; Zhou, T.; Xu, W.; Du, J.; Wang, J.A.; Li, N.; Huang, C.; Liu, L.; et al. Disaster Risk Science: A Geographical Perspective and a Research Framework. Int. J. Disaster Risk Sci. 2020, 11, 426–440. [Google Scholar] [CrossRef]
- Abdo, H.G. Evolving a total-evaluation map of flash flood hazard for hydro-prioritization based on geohydromorphometric parameters and GIS-RS manner in Al-Hussain river basin, Tartous, Syria. Nat. Hazards 2020, 104, 681–703. [Google Scholar] [CrossRef]
- Arabameri, A.; Saha, S.; Chen, W.; Roy, J.; Pradhan, B.; Bui, D.T. Flash flood susceptibility modelling using functional tree and hybrid ensemble techniques. J. Hydrol. 2020, 587, 125007. [Google Scholar] [CrossRef]
- Bajabaa, S.; Masoud, M.; Al-Amri, N. Flash flood hazard mapping based on quantitative hydrology, geomorphology and GIS techniques (case study of Wadi Al Lith, Saudi Arabia). Arab. J. Geosci. 2014, 7, 2469–2481. [Google Scholar] [CrossRef]
- Wang, G.; Zhao, B.; Lan, R.; Liu, D.; Wu, B.; Li, Y.; Li, Q.; Zhou, H.; Liu, M.; Liu, W.; et al. Experimental Study on Failure Model of Tailing Dam Overtopping under Heavy Rainfall. Lithosphere 2022, 2022, 5922501. [Google Scholar] [CrossRef]
- Zhou, J.; Wang, L.; Zhong, X.; Yao, T.; Qi, J.; Wang, Y.; Xue, Y. Quantifying the major drivers for the expanding lakes in the interior Tibetan Plateau. Sci. Bull. 2022, 67, 474–478. [Google Scholar] [CrossRef]
- Xie, X.; Tian, Y.; Wei, G. Deduction of sudden rainstorm scenarios: Integrating decision makers’ emotions, dynamic Bayesian network and DS evidence theory. Nat. Hazards 2022, 116, 2935–2955. [Google Scholar] [CrossRef]
- Al-Fugara, A.K.; Mabdeh, A.N.; Alayyash, S.; Khasawneh, A. Hydrological and Hydrodynamic Modeling for Flash Flood and Embankment Dam Break Scenario: Hazard Mapping of Extreme Storm Events. Sustainability 2023, 15, 1758. [Google Scholar] [CrossRef]
- Pakam, S.; Ahmed, A.; Ebraheem, A.A.; Sherif, M.; Mirza, S.B.; Ridouane, F.L.; Sefelnasr, A. Risk Assessment and Mapping of Flash Flood Vulnerable Zones in Arid Region, Fujairah City, UAE-Using Remote Sensing and GIS-Based Analysis. Water 2023, 15, 2802. [Google Scholar]
- Mahmood, S.; Khan, A.; Mayo, S.M. Exploring underlying causes and assessing damages of 2010 flash flood in the upper zone of Panjkora River. Nat. Hazards 2016, 83, 1213–1227. [Google Scholar] [CrossRef]
- Diakakis, M.; Deligiannakis, G.; Pallikarakis, A.; Skordoulis, M. Factors controlling the spatial distribution of flash flooding in the complex environment of a metropolitan urban area. The case of Athens 2013 flash flood event. Int. J. Disaster Risk Reduct. 2016, 18, 171–180. [Google Scholar] [CrossRef]
- Mahmood, M.I.; Elagib, N.A.; Horn, F.; Saad, S.A.G. Lessons learned from Khartoum flash flood impacts: An integrated assessment. Sci. Total Environ. 2017, 601–602, 1031–1045. [Google Scholar] [CrossRef] [PubMed]
- Liu, Y.; Yuan, X.; Guo, L.; Huang, Y.; Zhang, X. Driving Force Analysis of the Temporal and Spatial Distribution of Flash Floods in Sichuan Province. Sustainability 2017, 9, 1527. [Google Scholar] [CrossRef]
- Billi, P.; Alemu, Y.T.; Ciampalini, R. Increased frequency of flash floods in Dire Dawa, Ethiopia: Change in rainfall intensity or human impact? Nat. Hazards 2015, 76, 1373–1394. [Google Scholar] [CrossRef]
- Špitalar, M.; Gourley, J.J.; Lutoff, C.; Kirstetter, P.; Brilly, M.; Carr, N. Analysis of flash flood parameters and human impacts in the US from 2006 to 2012. J. Hydrol. 2014, 519, 863–870. [Google Scholar] [CrossRef]
- Llasat, M.C.; Marcos, R.; Llasat-Botija, M.; Gilabert, J.; Turco, M.; Quintana-Seguí, P. Flash flood evolution in North-Western Mediterranean. Atmos. Res. 2014, 149, 230–243. [Google Scholar] [CrossRef]
- Hamed, K.H. Exact distribution of the Mann–Kendall trend test statistic for persistent data. J. Hydrol. 2009, 365, 86–94. [Google Scholar] [CrossRef]
- Gocic, M.; Trajkovic, S. Analysis of changes in meteorological variables using Mann-Kendall and Sen’s slope estimator statistical tests in Serbia. Global Planet. Chang. 2013, 100, 172–182. [Google Scholar] [CrossRef]
- Yue, S.; Pilon, P.; Cavadias, G. Power of the Mann–Kendall and Spearman’s rho tests for detecting monotonic trends in hydrological series. J. Hydrol. 2002, 259, 254–271. [Google Scholar] [CrossRef]
- Bracken, L.J.; Wainwright, J.; Ali, G.A.; Tetzlaff, D.; Smith, M.W.; Reaney, S.M.; Roy, A.G. Concepts of hydrological connectivity: Research approaches, pathways and future agendas. Earth-Sci. Rev. 2013, 119, 17–34. [Google Scholar] [CrossRef]
- Wang, J.F.; Li, X.H.; Christakos, G.; Liao, Y.L.; Zhang, T.; Gu, X.; Zheng, X.Y. Geographical Detectors-Based Health Risk Assessment and its Application in the Neural Tube Defects Study of the Heshun Region, China. Int. J. Geogr. Inf. Sci. 2010, 24, 107–127. [Google Scholar] [CrossRef]
- Hu, Y.; Wang, J.; Li, X.; Ren, D.; Zhu, J. Geographical Detector-Based Risk Assessment of the Under-Five Mortality in the 2008 Wenchuan Earthquake, China. PLoS ONE 2011, 6, e21427. [Google Scholar] [CrossRef]
- Kendall, M.G. Rank Correlation Methods, 4th ed.; Griffin: London, UK, 1970. [Google Scholar]
- Mann, H.B. Nonparametric test against trend. Econometrica 1945, 13, 245–259. [Google Scholar] [CrossRef]
- Zhou, Z.; Wang, L.; Lin, A.; Zhang, M.; Niu, Z. Innovative trend analysis of solar radiation in China during 1962–2015. Renew. Energy 2018, 119, 675–689. [Google Scholar] [CrossRef]
- Goossens, C.; Berger, A. Annual and seasonal climatic variations over the northern hemisphere and Europe during the last century. Ann. Geophys. 1986, 4, 385–399. [Google Scholar]
- Cao, F.; Ge, Y.; Wang, J. Optimal discretization for geographical detectors-based risk assessment. GIScience Remote Sens. 2013, 50, 78–92. [Google Scholar] [CrossRef]
- Snyers, R.; Sur, L. Sur la Determination de la stabilite des series climatologiques. In Proceedings of the UNESCO-WMO Symposium of Changes of Elimate, Uneseo Arid Zone Researeh Series; UNESCO: Paris, France, 1963. [Google Scholar]
- Ahmad, S.S.; Aziz, N.; Butt, A.; Shabbir, R.; Erum, S. Spatio-temporal surveillance of water based infectious disease (malaria) in Rawalpindi, Pakistan using geostatistical modeling techniques. Environ. Monit. Assess. 2015, 187, 555. [Google Scholar] [CrossRef] [PubMed]
- Cheng, K.; Hsu, S.; Li, W.; Ma, H. Quantifying potential anthropogenic resources of buildings through hot spot analysis. Resour. Conserv. Recycl. 2018, 133, 10–20. [Google Scholar] [CrossRef]
- Kao, J.; Chan, T.; Lai, F.; Lin, B.; Sun, W.; Chang, K.; Leu, F.; Lin, J. Spatial analysis and data mining techniques for identifying risk factors of Out-of-Hospital Cardiac Arrest. Int. J. Inform. Manage. 2017, 37, 1528–1538. [Google Scholar] [CrossRef]


| Category | Factors | Factor Code | Time | Resolution | Data Sources |
|---|---|---|---|---|---|
| Natural factors | Elevation (m) | Ele | 2014 | 30 m × 30 m | FFIEDC 1 |
| Slope (°) | Slp | 2014 | 30 m × 30 m | FFIEDC 1 | |
| Soil | Soil | 2014 | 30 m × 30 m | FFIEDC 1 | |
| River density (1/km) | RD | 2014 | 30 m × 30 m | FFIEDC 1 | |
| Vegetation type | Veg | 1995, 2010 | 1 km × 1 km | RESDC 2 | |
| Social factors | Gross domestic product (yuan/km) | GDP | 1995, 2010 | 1 km × 1 km | RESDC 2 |
| Land use | LU | 1995, 2010 | 1 km × 1 km | RESDC 2 | |
| Population density (person/km2) | POP | 1995, 2010 | 1 km × 1 km | RESDC 2 | |
| Small reservoir density | SRD | 2014 | 30 m × 30 m | FFIEDC 1 | |
| Rainfall factors | Annual rainfall (mm) | P | 1980–2014 | 30 m × 30 m | HNHWB 3 |
| Maximum 10 min rainfall (mm) | P10 | 1980–2012 | 30 m × 30 m | HNHWB 3 | |
| Maximum 1 h rainfall (mm) | P1 | 1980–2012 | 30 m × 30 m | HNHWB 3 | |
| Maximum 6 h rainfall (mm) | P6 | 1980–2012 | 30 m × 30 m | HNHWB 3 | |
| Maximum 24 h rainfall (mm) | P24 | 1980–2012 | 30 m × 30 m | HNHWB 3 | |
| Flash flood intensity | Recorded flash flood intensity | FFI | 1938–2014 | FFIEDC 1 |
Disclaimer/Publisher’s Note: The statements, opinions and data contained in all publications are solely those of the individual author(s) and contributor(s) and not of MDPI and/or the editor(s). MDPI and/or the editor(s) disclaim responsibility for any injury to people or property resulting from any ideas, methods, instructions or products referred to in the content. |
© 2023 by the authors. Licensee MDPI, Basel, Switzerland. This article is an open access article distributed under the terms and conditions of the Creative Commons Attribution (CC BY) license (https://creativecommons.org/licenses/by/4.0/).
Share and Cite
Bin, L.; Yang, W.; Xu, K. Driving Force Exploration for Flash Flood Based on Mann–Kendall Test and Geographical Detector: A Case Study of Hainan Island, China. Sustainability 2023, 15, 12517. https://doi.org/10.3390/su151612517
Bin L, Yang W, Xu K. Driving Force Exploration for Flash Flood Based on Mann–Kendall Test and Geographical Detector: A Case Study of Hainan Island, China. Sustainability. 2023; 15(16):12517. https://doi.org/10.3390/su151612517
Chicago/Turabian StyleBin, Lingling, Weichao Yang, and Kui Xu. 2023. "Driving Force Exploration for Flash Flood Based on Mann–Kendall Test and Geographical Detector: A Case Study of Hainan Island, China" Sustainability 15, no. 16: 12517. https://doi.org/10.3390/su151612517
APA StyleBin, L., Yang, W., & Xu, K. (2023). Driving Force Exploration for Flash Flood Based on Mann–Kendall Test and Geographical Detector: A Case Study of Hainan Island, China. Sustainability, 15(16), 12517. https://doi.org/10.3390/su151612517