Optimization of Underground Cavern Sign Group Layout Using Eye-Tracking Technology
Abstract
:1. Introduction
2. Literature Review
2.1. Design and Layout of the Sign System
2.2. Human Visual Perception of a Sign
2.3. Eye-Tracking Technology Application for Sign Layout Optimization
3. Materials and Methods
3.1. Experimental Design
3.1.1. Experimental Scenarios
3.1.2. Experimental Apparatus
3.1.3. Participants
3.1.4. Experiment Procedure
3.2. Quantification of Information Conveyed by Sign Groups
3.2.1. Calculation of Information Volume for Basic Elements of Signs
3.2.2. Levels of Information Volume for Sign Groups
3.3. Evaluation of Visual Cognition
3.3.1. Cognitive Model
3.3.2. Selection of Evaluation Indicators
3.3.3. Evaluation Method for the Comprehensive Effect of Visual Cognition
4. Results and Discussion
4.1. Data Analysis
4.1.1. Data Collection and Preprocessing
4.1.2. Delineation of AOIs
4.1.3. Production of Mapping Materials
4.1.4. Data Processing and Statistical Analysis
4.2. Analysis of Evaluation Indicators of Visual Cognition
4.2.1. Spatial Preference for the Driver’s Visual Attention
4.2.2. Concern for Road Conditions
4.2.3. Recognition Rate of the Sign Group
4.2.4. Processing and Cognitive Ability of Information
4.2.5. Mental Load
4.3. Comprehensive Evaluation of Visual Cognitive Effects
4.3.1. Principal Component Analysis of Evaluation Indicators
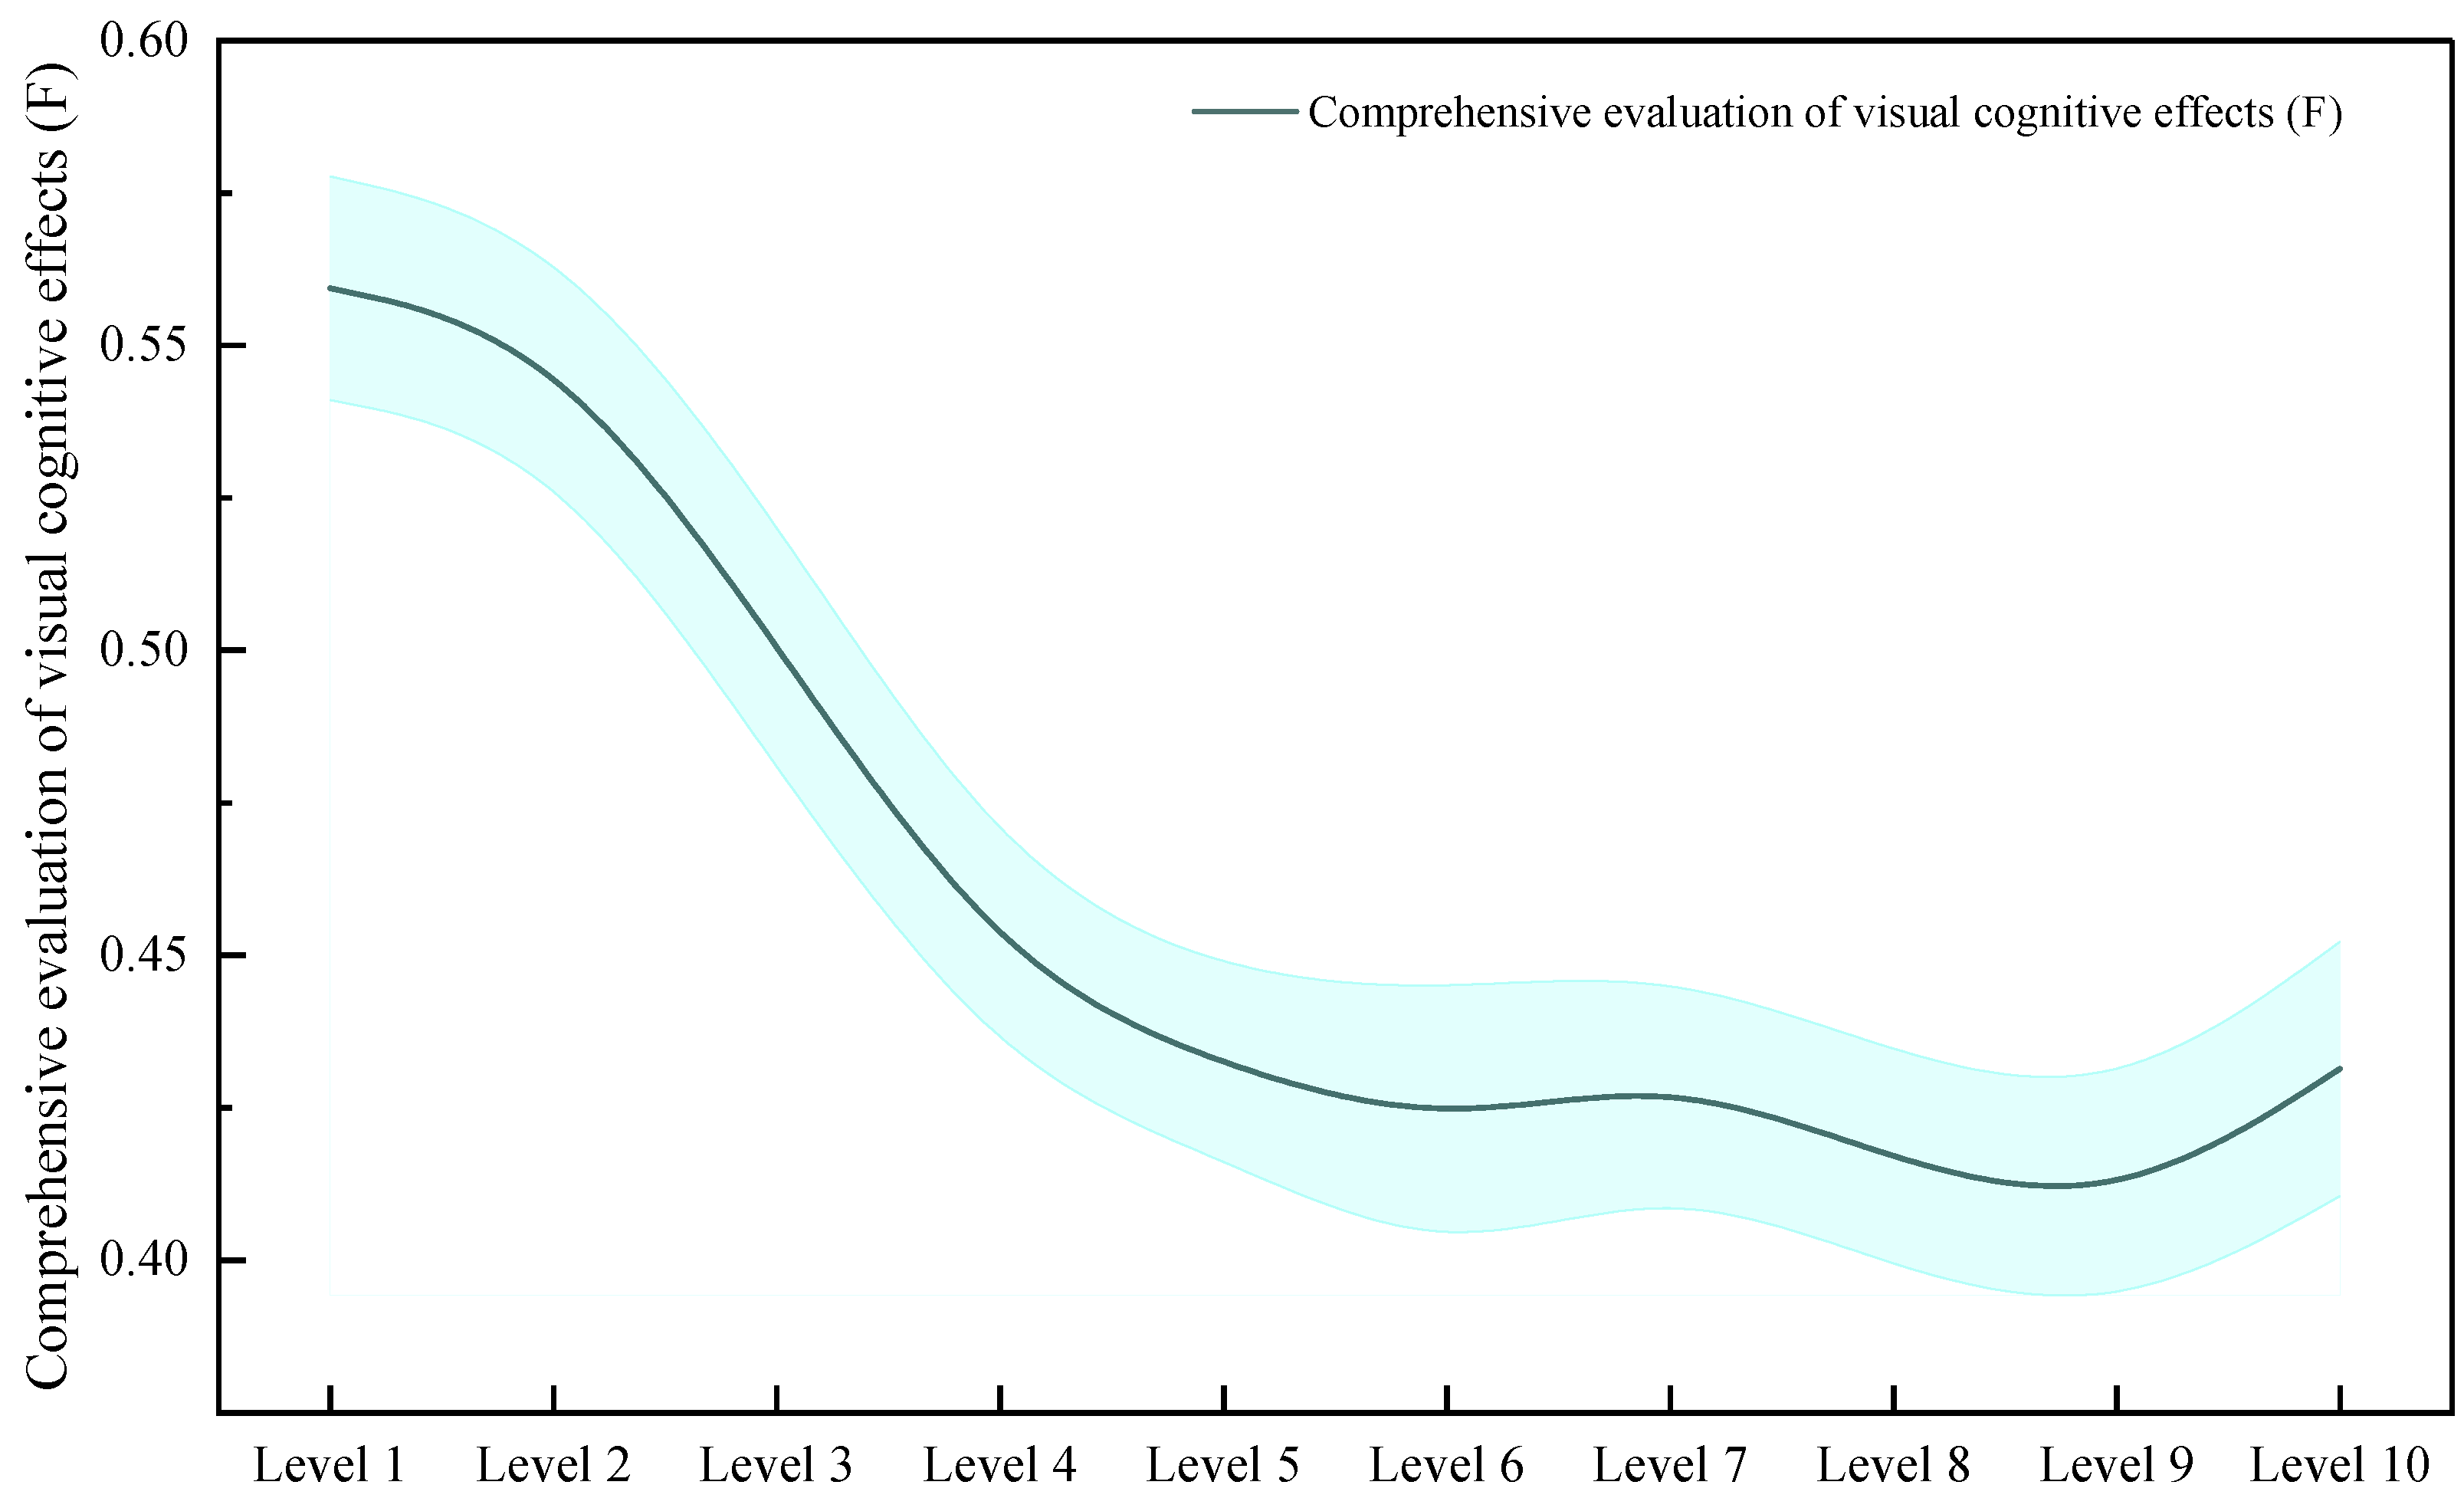
4.3.2. Drivers’ Visual Cognitive Intensity
4.4. Implications
5. Conclusions
Author Contributions
Funding
Institutional Review Board Statement
Informed Consent Statement
Data Availability Statement
Conflicts of Interest
References
- Xie, Z.W.; Huang, C.; Zhao, Z.T.; Xiao, Y.M.; Zhao, Q.; Lin, J.Q. Review and prospect the development of dust suppression technology and influencing factors for blasting construction. Tunn. Undergr. Space Technol. 2022, 125, 104532. [Google Scholar] [CrossRef]
- Jia, J.S. A Technical Review of Hydro-Project Development in China. Engineering 2016, 2, 302–312. [Google Scholar] [CrossRef]
- Jiang, T.Y.; Jing, Z.H.; Wang, J.H. Sensitivity Analysis of Transport Machinery Configuration in Underground Cavern Group Construction. Intell. Autom. Soft Comput. 2014, 20, 525–534. [Google Scholar] [CrossRef]
- Aneziris, O.N.; Papazoglou, I.A.; Kallianiotis, D. Occupational risk of tunneling construction. Saf. Sci. 2010, 48, 964–972. [Google Scholar] [CrossRef]
- Chen, Y.; Zeng, Q.; Zheng, X.; Shao, B.; Jin, L. Safety supervision of tower crane operation on construction sites: An evolutionary game analysis. Saf. Sci. 2022, 152, 105578. [Google Scholar] [CrossRef]
- Chen, Y.; Zhu, L.; Hu, Z.; Chen, S.; Zheng, X. Risk Propagation in Multilayer Heterogeneous Network of Coupled System of Large Engineering Project. J. Manag. Eng. 2022, 38, 04022003. [Google Scholar] [CrossRef]
- Viano, D.C.; Culver, C.C.; Evans, L.; Frick, M.; Scott, R. Involvement of older drivers in multivehicle side-impact crashes. Accid. Anal. Prev. 1990, 22, 177–188. [Google Scholar] [CrossRef]
- Gotardi, G.C.; Polastri, P.F.; Schor, P.; Oudejans, R.R.D.; van der Kamp, J.; Savelsbergh, G.J.P.; Navarro, M.; Rodrigues, S.T. Adverse effects of anxiety on attentional control differ as a function of experience: A simulated driving study. Appl. Ergon. 2018, 74, 41–47. [Google Scholar] [CrossRef]
- Liu, K.; Deng, H. The Relationship of the Information Quantity of Urban Roadside Traffic Signs and Drivers’ Visibility Based on Information Transmission. Int. J. Environ. Res. Public Health 2021, 18, 10976. [Google Scholar] [CrossRef]
- Manual on Uniform Traffic Control Devices; Federal Register: Washington, DC, USA, 2020.
- Sivak, M. The information that drivers use: Is it indeed 90% visual? Perception 1996, 25, 1081–1089. [Google Scholar] [CrossRef]
- Shang, T.; Lu, H.; Wu, P.; Wei, Y. Eye-Tracking Evaluation of Exit Advance Guide Signs in Highway Tunnels in Familiar and Unfamiliar Drivers. Int. J. Environ. Res. Public. Health 2021, 18, 6820. [Google Scholar] [CrossRef]
- Alluisi, E.A.; Morgan, B.B. Engineering Psychology and Human Performance. Annu. Rev. Psychol. 1976, 27, 305–330. [Google Scholar] [CrossRef]
- Foy, H.J.; Chapman, P. Mental workload is reflected in driver behaviour, physiology, eye movements and prefrontal cortex activation. Appl. Ergon. 2018, 73, 90–99. [Google Scholar] [CrossRef] [PubMed]
- Underwood, G.; Chapman, P.; Brocklehurst, N.; Underwood, J.; Crundall, D. Visual attention while driving: Sequences of eye fixations made by experienced and novice drivers. Ergonomics 2003, 46, 629–646. [Google Scholar] [CrossRef] [PubMed]
- Dingus, T.A.; Hulse, M.C.; Antin, J.F.; Wierwille, W.W. Attentional demand requirements of an automobile moving-map navigation system. Transp. Res. Part A Gen. 1989, 23, 301–315. [Google Scholar] [CrossRef]
- Shannon, C.E. A Mathematical Theory of Communication. Bell Syst. Tech. J. 1948, 27, 379–423. [Google Scholar] [CrossRef]
- David, M. A Brief Introduction to Information Theory. In Quantum Computing Explained; IEEE: Piscataway, NJ, USA, 2007; pp. 1–9. [Google Scholar]
- Liu, Y.-C. A simulated study on the effects of information volume on traffic signs, viewing strategies and sign familiarity upon driver’s visual search performance. Int. J. Ind. Ergon. 2005, 35, 1147–1158. [Google Scholar] [CrossRef]
- Babic, D.; Dijanic, H.; Jakob, L.; Babic, D.; Garcia-Garzon, E. Driver eye movements in relation to unfamiliar traffic signs: An eye tracking study. Appl. Ergon. 2020, 89, 103191. [Google Scholar] [CrossRef]
- Amundsen, F.H. Studies of driver behaviour in Norwegian road tunnels. Tunn. Undergr. Space Technol. 1994, 9, 9–15. [Google Scholar] [CrossRef]
- Zeng, Q.; Chen, Y.; Zheng, X.; Zhang, M.; Li, D.; Hu, Q. Exploring the Visual Attention Mechanism of Long-Distance Driving in an Underground Construction Cavern: Eye-Tracking and Simulated Driving. Sustainability 2023, 15, 9140. [Google Scholar] [CrossRef]
- Bellini, D.; Iaconis, M.C.; Traettino, E. Speed limits and road warning signs as aid for driving behavior. Transp. Res. Procedia 2020, 45, 135–142. [Google Scholar] [CrossRef]
- Bond, A.R.; Jones, D.N. Wildlife Warning Signs: Public Assessment of Components, Placement and Designs to Optimise Driver Response. Animals 2013, 3, 1142–1161. [Google Scholar] [CrossRef] [PubMed]
- Huang, L.; Zhao, X.; Li, Y.; Ma, J.; Yang, L.; Rong, J.; Wang, Y. Optimal design alternatives of advance guide signs of closely spaced exit ramps on urban expressways. Accid. Anal. Prev. 2020, 138, 105465. [Google Scholar] [CrossRef]
- Xie, L.; Wu, C.Z.; Duan, M.; Lyu, N.C. Analysis of Freeway Safety Influencing Factors on Driving Workload and Performance Based on the Gray Correlation Method. J. Adv. Transp. 2021, 2021, 6566207. [Google Scholar] [CrossRef]
- Shang, T.; Wu, Y.; Wu, P.; He, H.; You, B. Setting method of exit advance guide signs in mountainous expressway tunnel based on information quantization theory. PLoS ONE 2023, 18, e0281842. [Google Scholar] [CrossRef] [PubMed]
- Guo, Z.; Wei, Z.; Wang, H. The Expressway Traffic Sign Information Volume Threshold and AGS Position Based on Driving Behaviour. Transp. Res. Procedia 2016, 14, 3801–3810. [Google Scholar] [CrossRef]
- Ji, H.-W.; Zhou, H.-J. Layout Optimization of Guidance Signs in Subway Station Based on Passenger Flow Line. J. Phys. Conf. Ser. 2021, 1972, 012079. [Google Scholar] [CrossRef]
- Wang, L.Z.; Zhang, H.; Shi, L.Y.; He, Q.L.; Xu, H.Z. Optimization Model of Regional Traffic Signs for Inducement at Road Works. Sustainability 2021, 13, 6996. [Google Scholar] [CrossRef]
- Jiao, F.; Du, Z.; Wong, Y.D.; He, S.; Jiang, Z. Influence of different visual guiding facilities in urban road tunnel on driver’s spatial right-of-way perception. Accid. Anal. Prev. 2022, 172, 106688. [Google Scholar] [CrossRef]
- Zahabi, M.; Machado, P.; Pankok, C., Jr.; Lau, M.Y.; Liao, Y.F.; Hummer, J.; Rasdorf, W.; Kaber, D.B. The role of driver age in performance and attention allocation effects of roadway sign count, format and familiarity. Appl. Ergon. 2017, 63, 17–30. [Google Scholar] [CrossRef] [PubMed]
- Huang, H.; Lin, N.C.; Barrett, L.; Springer, D.; Wang, H.C.; Pomplun, M.; Yu, L.F. Automatic Optimization of Wayfinding Design. IEEE Trans. Vis. Comput. Graph. 2018, 24, 2516–2530. [Google Scholar] [CrossRef]
- Fogt, J.S.; Kerwin, T.; Wrabel, C.; Schomer, C.; Fogt, N. Driving performance and road sign identification by multifocal contact lens wearers in a driving simulator. Contact Lens Anterior Eye 2021, 45, 101493. [Google Scholar] [CrossRef] [PubMed]
- Fang, Y.; Zhou, J.Y.; Hu, H.; Hao, Y.X.; Xiao, D.A.L.; Li, S.J. Combination Layout of Traffic Signs and Markings of Expressway Tunnel Entrance Sections: A Driving Simulator Study. Sustainability 2022, 14, 3377. [Google Scholar] [CrossRef]
- Li, Y.K.; Zhang, Y.; Pan, X.Y.; Taylor, J.E. BIM-based determination of indoor navigation sign layout using hybrid simulation and optimization. Autom. Constr. 2022, 139, 104243. [Google Scholar] [CrossRef]
- Rasmussen, J. Risk management in a dynamic society: A modelling problem. Saf. Sci. 1997, 27, 183–213. [Google Scholar] [CrossRef]
- Drury, C.G.; Hong, S.-K. Generalizing from single target search to multiple target search. Theor. Issues Ergon. Sci. 2000, 1, 303–314. [Google Scholar] [CrossRef]
- Debue, N.; van de Leemput, C. What does germane load mean? An empirical contribution to the cognitive load theory. Front. Psychol. 2014, 5, 1099. [Google Scholar] [CrossRef] [PubMed]
- Lyu, Z.; Qi, C.H.; Zhu, S.L. Driver’s Attention Allocation and Mental Workload at Different Random Hazard Points on Prairie Highway. J. Adv. Transp. 2022, 2022, 3837509. [Google Scholar] [CrossRef]
- Mackenzie, A.K.; Harris, J.M. A link between attentional function, effective eye movements, and driving ability. J. Exp. Psychol. Hum. Percept. Perform. 2017, 43, 381–394. [Google Scholar] [CrossRef] [PubMed]
- Fridman, L.; Toyoda, H.; Seaman, S.; Seppelt, B.; Angell, L.; Lee, J.; Mehler, B.; Reimer, B. What Can Be Predicted from Six Seconds of Driver Glances? arXiv 2016, arXiv:1611.08754. [Google Scholar] [CrossRef]
- Li, N.X.; Busso, C. Predicting Perceived Visual and Cognitive Distractions of Drivers With Multimodal Features. IEEE Trans. Intell. Transp. Syst. 2015, 16, 51–65. [Google Scholar] [CrossRef]
- Poder, E. CNN-based search model fails to account for human attention guidance by simple visual features. Atten. Percept. Psychophys 2023. [Google Scholar] [CrossRef]
- Muñoz, M.; Reimer, B.; Lee, J.; Mehler, B.; Fridman, L. Distinguishing patterns in drivers’ visual attention allocation using Hidden Markov Models. Transp. Res. Part F Traffic Psychol. Behav. 2016, 43, 90–103. [Google Scholar] [CrossRef]
- Liechty, J.; Pieters, R.; Wedel, M. Global and local covert visual attention: Evidence from a bayesian hidden markov model. Psychometrika 2003, 68, 519–541. [Google Scholar] [CrossRef]
- Pekkanen, J.; Lappi, O.; Rinkkala, P.; Tuhkanen, S.; Frantsi, R.; Summala, H. A computational model for driver’s cognitive state, visual perception and intermittent attention in a distracted car following task. R. Soc. Open Sci. 2018, 5, 180194. [Google Scholar] [CrossRef]
- Reimer, B.; Mehler, B.; Wang, Y.; Coughlin, J.F. A field study on the impact of variations in shortterm memory demands on drivers’ visual attention and driving performance across three age groups. Hum. Factors 2012, 54, 454–468. [Google Scholar] [CrossRef]
- Young, A.H.; Crundall, D.; Chapman, P. Commentary driver training: Effects of commentary exposure, practice and production on hazard perception and eye movements. Accid. Anal. Prev. 2017, 101, 1–10. [Google Scholar] [CrossRef]
- Brookhuis, K.A.; de Waard, D. Monitoring drivers’ mental workload in driving simulators using physiological measures. Accid. Anal. Prev. 2010, 42, 898–903. [Google Scholar] [CrossRef]
- Charles, R.L.; Nixon, J. Measuring mental workload using physiological measures: A systematic review. Appl. Ergon. 2019, 74, 221–232. [Google Scholar] [CrossRef] [PubMed]
- Qi, W.W.; Shen, B.; Wang, L.H. Model of Driver’s Eye Movement and ECG Index under Tunnel Environment Based on Spatiotemporal Data. J. Adv. Transp. 2020, 2020, 5215479. [Google Scholar] [CrossRef]
- Rahman, H.; Ahmed, M.U.; Barua, S.; Funk, P.; Begum, S. Vision-Based Driver’s Cognitive Load Classification Considering Eye Movement Using Machine Learning and Deep Learning. Sensors 2021, 21, 8019. [Google Scholar] [CrossRef]
- Liu, K.; Deng, H.X. The Analysis of Driver’s Recognition Time of Different Traffic Sign Combinations on Urban Roads via Driving Simulation. J. Adv. Transp. 2021, 2021, 8157293. [Google Scholar] [CrossRef]
- Alfredson, J.; Nählinder, S.; Castor, M. Measuring Eye Movements in Applied Psychological Research—Five Different techniques—Five Different Approaches; Swedish Defence Research Agency: Stockholm, Sweden, 2004. [Google Scholar]
- Rantanen, E.M.; Goldberg, J.H. The effect of mental workload on the visual field size and shape. Ergonomics 1999, 42, 816–834. [Google Scholar] [CrossRef] [PubMed]
- Zhang, M.; Shu, L.; Luo, X.; Yuan, M.; Zheng, X. Virtual reality technology in construction safety training: Extended technology acceptance model. Autom. Constr. 2022, 135, 104113. [Google Scholar] [CrossRef]
- Ullman, G.L.; Higgins, L.L.; Chrysler, S.T.; Geiselbrecht, T.S.; Simek, C.L.; Stoeltje, G.; Wolfe, D.; Benson, G. Driver Understanding and Secondary Task Performance While Viewing Traffic Safety Messages on Dynamic Message Signs. Transp. Res. Rec. J. Transp. Res. Board 2023. [Google Scholar] [CrossRef]
- Yang, Y.; Easa, S.M.; Zheng, X.; Hu, A.; Liu, F.; Chen, M. Evaluation effects of two types of freeway deceleration markings in China. PLoS ONE 2019, 14, e0220811. [Google Scholar] [CrossRef]
- Lu, H.; Shang, T.; Wei, Y.; Wu, P. Safety Assessment of Exit Advance Guide Signs in Mountainous Highway Tunnel Based on Eye-Tracking Technology. IEEE Access 2021, 9, 111315–111325. [Google Scholar] [CrossRef]
- Fancello, G.; Serra, P.; Pinna, C. Visual Perception and Understanding of Variable Message Signs: The Influence of the Drivers’ Age and Message Layout. Safety 2021, 7, 60. [Google Scholar] [CrossRef]
- Wei, T.Z.; Zhu, T.; Li, C.X.; Liu, H.X. A Driving Simulation to Analysis and Quantitative Comparison of Driving Behavior of Guide Signs at Intersections. J. Adv. Transp. 2021, 2021, 7093096. [Google Scholar] [CrossRef]
- Lee, Y.M.; Sheppard, E. Effects of position of speed limit signs and the presence of speed camera on Malaysian drivers’ speed choice: An eye-tracking study. Transp. Res. Part F Traffic Psychol. Behav. 2020, 74, 386–395. [Google Scholar] [CrossRef]
- Filtness, A.J.; Larue, G.; Schramm, A.; Fuller, J.; Rakotonirainy, A.; Han, C.; Cairney, P. Safety implications of co-locating road signs: A driving simulator investigation. Transp. Res. Part F Traffic Psychol. Behav. 2017, 47, 187–198. [Google Scholar] [CrossRef]
- Jiao, F.; Du, Z.; Wong, Y.D.; Mei, J.; Sun, F. Design and evaluation of visual guiding facilities along urban road tunnel horizontal curves based on vision and speed perception. Tunn. Undergr. Space Technol. 2023, 133, 104937. [Google Scholar] [CrossRef]
- Underwood, G.; Chapman, P.; Bowden, K.; Crundall, D. Visual search while driving: Skill and awareness during inspection of the scene. Transp. Res. Part F Traffic Psychol. Behav. 2002, 5, 87–97. [Google Scholar] [CrossRef]
- Azimian, A.; Ortega, C.A.C.; Espinosa, J.M.; Mariscal, M.A.; Garcia-Herrero, S. Analysis of Drivers’ Eye Movements on Roundabouts: A Driving Simulator Study. Sustainability 2021, 13, 7463. [Google Scholar] [CrossRef]
- Hochman, M.; Parmet, Y.; Oron-Gilad, T. Pedestrians’ Understanding of a Fully Autonomous Vehicle’s Intent to Stop: A Learning Effect Over Time. Front. Psychol. 2020, 11, 585280. [Google Scholar] [CrossRef] [PubMed]
- GB2312-80; Table of General Standard Chinese Characters: Level-1 Chinese Character. State Council: Beijing, China, 2013; pp. 10–25.
- GB 5768.1-2009; Road Traffic Signs and Markings: Part 1: General. Standards Press of China: Beijing, China, 2009; pp. 1–11.
- GB 5768.2-2022; Road Traffic Signs and Markings: Part 2: Road Traffic Signs. Standards Press of China: Beijing, China, 2022; pp. 1–359.
- GB 5768.4-2017; Road Traffic Signs and Markings: Part 4: Work Zone. Standards Press of China: Beijing, China, 2017; pp. 1–79.
- GB 2894-2008; Safety Signs and Guidelines for the Use. Standards Press of China: Beijing, China, 2008; pp. 1–44.
- Li, H.; Xie, S.; Yang, F.; Lu, Y.; Zhu, S. Utilization of Drivers’ Dynamic Visual Characteristics to Find the Appropriate Information Quantity of Traffic Engineering Facilities on Straight Roads of Grassland Highways. Front. Neurosci. 2022, 16, 872863. [Google Scholar] [CrossRef]
- Han, L.; Du, Z.; Wang, S.; Chen, Y. Analysis of Traffic Signs Information Volume Affecting Driver’s Visual Characteristics and Driving Safety. Int. J. Environ. Res. Public Health 2022, 19, 10349. [Google Scholar] [CrossRef]
- Jeelani, I.; Albert, A.; Han, K.; Azevedo, R. Are Visual Search Patterns Predictive of Hazard Recognition Performance? Empirical Investigation Using Eye-Tracking Technology. J. Constr. Eng. Manag. 2019, 145, 04018115. [Google Scholar] [CrossRef]
- Tipper, S.P.; Driver, J. Negative priming between pictures and words in a selective attention task: Evidence for semantic processing of ignored stimuli. Mem. Cogn. 1988, 16, 64–70. [Google Scholar] [CrossRef]
- Zhang, W.; Dai, J.; Pei, Y.; Li, P.; Yan, Y.; Chen, X. Drivers’ Visual Search Patterns during Overtaking Maneuvers on Freeway. Int. J. Environ. Res. Public. Health 2016, 13, 1159. [Google Scholar] [CrossRef]
- Wu, Y.; Zhao, Z.; Wu, F.; Rong, J.; Basbas, S. Information Volume Threshold for Graphical Variable Message Signs Based on Drivers’ Visual Cognition Behavior. J. Adv. Transp. 2022, 2022, 7693492. [Google Scholar] [CrossRef]
- Holmqvist, K.; Nyström, M.; Andersson, R.; Dewhurst, R.; Jarodzka, H.; Van de Weijer, J. Eye Tracking: A Comprehensive Guide to Methods and Measures; OUP Oxford: Oxford, UK, 2011. [Google Scholar]
- Shi, Y.M.; Du, J.; Zhu, Q. The impact of engineering information format on task performance: Gaze scanning pattern analysis. Adv. Eng. Inform. 2020, 46, 101167. [Google Scholar] [CrossRef]
- Cheng, H.; Liu, Y.Q.; Fu, W.H.; Ji, Y.L.; Yang, L.; Zhao, Y.; Yang, J. Gazing point dependent eye gaze estimation. Pattern Recognit. 2017, 71, 36–44. [Google Scholar] [CrossRef]
- Wong, J.T.; Huang, S.H. Attention allocation patterns in naturalistic driving. Accid. Anal. Prev. 2013, 58, 140–147. [Google Scholar] [CrossRef] [PubMed]
- Beserra Gomes, R.; Ferreira da Silva, B.M.; Rocha, L.K.d.M.; Aroca, R.V.; Velho, L.C.P.R.; Gonçalves, L.M.G. Efficient 3D object recognition using foveated point clouds. Comput. Graph. 2013, 37, 496–508. [Google Scholar] [CrossRef]
- Zheng, Z.; Gao, S.; Su, Y.; Chen, Y.; Wang, X. Cognitive load-induced pupil dilation reflects potential flight ability. Curr. Psychol. 2022. [Google Scholar] [CrossRef]
- Pel, J.J.; van Beijsterveld, M.C.; Thepass, G.; van der Steen, J. Validity and Repeatability of Saccadic Response Times Across the Visual Field in Eye Movement Perimetry. Transl. Vis. Sci. Technol. 2013, 2, 3. [Google Scholar] [CrossRef] [PubMed]
- Lawson, R.P.; Mathys, C.; Rees, G. Adults with autism overestimate the volatility of the sensory environment. Nat. Neurosci. 2017, 20, 1293–1299. [Google Scholar] [CrossRef]
- Yan, Y.; Yuan, H.; Wang, X.; Xu, T.; Liu, H. Study on Driver’s Fixation Variation at Entrance and Inside Sections of Tunnel on Highway. Adv. Mech. Eng. 2014, 7, 273427. [Google Scholar] [CrossRef]
- Jiao, F.T.; Du, Z.G.; Wang, S.S.; Yang, L.B.; Ni, Y.D. Research on drivers’ visual characteristics in different curvatures and turning conditions of the extra-long urban underwater tunnels. Tunn. Undergr. Space Technol. 2020, 99, 103360. [Google Scholar] [CrossRef]
- Klauer, S.G.; Olsen, E.C.; Simons-Morton, B.G.; Dingus, T.A.; Ramsey, D.J.; Ouimet, M.C. Detection of Road Hazards by Novice Teen and Experienced Adult Drivers. Transp. Res. Rec. J. Transp. Res. Board 2008, 2078, 26–32. [Google Scholar] [CrossRef]
- Jianwei, D.; Gang, R.; Wei, L.; Haojie, L. How is the visual working memory load of driver influenced by information density of traffic signs? Transp. Res. Part F: Traffic Psychol. Behav. 2022, 86, 65–83. [Google Scholar] [CrossRef]
- Occhialini, M.; Bernardini, G.; Ferracuti, F.; Iarlori, S.; D’Orazio, M.; Longhi, S. Fire exit signs: The use of neurological activity analysis for quantitative evaluations on their perceptiveness in a virtual environment. Fire Saf. J. 2016, 82, 63–75. [Google Scholar] [CrossRef]
- Shi, J.; Ding, N.; Jiang, F. The influence of color and direction on the perceptual processing of standard evacuation signs and the effect of attention bias. Fire Saf. J. 2022, 132, 103638. [Google Scholar] [CrossRef]






| Subject | Age | Sex | Driving Experience in Underground Caverns | Driving Experience in This Test Scene | Driving Mileage/km | Types of Vehicles Frequently Driven | Percentage of Null Data |
|---|---|---|---|---|---|---|---|
| 1 | 52 | M | Yes | No | ≥50,000 | Medium trucks | 11.02% |
| 2 | 41 | M | Yes | No | ≥50,000 | Dump trucks | 8.11% |
| 3 | 38 | F | Yes | No | <5000 | Dump trucks | 7.92% |
| 4 | 22 | M | Yes | No | 5000–50,000 | Light trucks | 32.11% |
| 5 | 36 | F | Yes | No | 5000–50,000 | Light trucks | 17.21% |
| 6 | 53 | M | Yes | No | ≥50,000 | Dump trucks | 6.49% |
| 7 | 27 | F | Yes | No | 5000–50,000 | Light trucks | 8.44% |
| 8 | 23 | F | Yes | No | <5000 | Light trucks | 12.79% |
| 9 | 51 | M | Yes | No | <5000 | Medium trucks | 16.25% |
| 10 | 26 | M | Yes | No | <5000 | Light trucks | 11.65% |
| 11 | 58 | F | Yes | No | ≥50,000 | Dump trucks | 5.33% |
| 12 | 46 | F | Yes | No | 5000–50,000 | Light trucks | 2.18% |
| 13 | 29 | M | Yes | No | ≥50,000 | Dump trucks | 14.21% |
| 14 | 21 | F | Yes | No | 5000–50,000 | Dump trucks | 27.28% |
| Mean | 37.36 | ||||||
| SD | 12.47 | ||||||
| No. | Type | Total Number in the Standard/Total Number in the Cavern | Total (without Repeats) | Basic Information Volume/Bits | ||||
|---|---|---|---|---|---|---|---|---|
| Document 1 a | Document 2 b | Document 3 c | Document 4 d | Document 5 e | ||||
| 1 | Chinese character | 3500/3500 | -/- | -/- | -/- | -/- | 3500 | 11.773 |
| 2 | Arabic numeral | -/- | 10/10 | 10/10 | 10/10 | 10/10 | 10 | 3.322 |
| 3 | Geometry of the border | -/- | -/- | 6/6 | 8/8 | 3/3 | 6 | 2.585 |
| 4 | Color | -/- | -/- | 10/10 | 10/10 | 6/6 | 10 | 3.322 |
| 5 | Pointing symbol | -/- | 7/7 | -/- | -/- | -/- | 7 | 2.807 |
| 6 | Graphic or symbol | -/- | 75/55 | 289/134 | 11/10 | 103/103 | 247 | 7.948 |
| Chinese Character | Arabic Numeral | Geometry of the Border | Color | Pointing Symbol | Graphic or Symbol | ωi | |
|---|---|---|---|---|---|---|---|
| Chinese character | 1 | 3 | 2 | 1 | 1 | 1 | 0.215 |
| Arabic numeral | 1/3 | 1 | 1 | 1 | 1/2 | 1 | 0.118 |
| Geometry of the border | 1/2 | 1 | 1 | 1/2 | 1/2 | 3 | 0.152 |
| Color | 1 | 1 | 2 | 1 | 1 | 1 | 0.179 |
| Pointing symbol | 1 | 2 | 2 | 1 | 1 | 1 | 0.197 |
| Graphic or symbol | 1 | 1 | 1/3 | 1 | 1 | 1 | 0.139 |
| CR | 0.095 |
| Type | Chinese Character | Arabic Numeral | Geometry of the Border | Color | Pointing Symbol | Graphic or Symbol |
|---|---|---|---|---|---|---|
| N | 3500 | 10 | 6 | 10 | 7 | 247 |
| Basic information volume /bits | 11.773 | 3.322 | 2.585 | 3.322 | 2.807 | 7.948 |
| Wi | 0.215 | 0.118 | 0.152 | 0.179 | 0.197 | 0.139 |
| Effective information volume /bits | 2.532 | 0.390 | 0.394 | 0.594 | 0.553 | 1.107 |
| Evaluation Indicators | Eye Movement Indicators | Description | Interpretation of Indicators |
|---|---|---|---|
| Spatial preference for visual attention (SPVA) [82] | - | The fixation heatmap provides a more visual representation of the spatial allocation of subjects’ attention to the sample content. | The red area indicates the highest level of attention of the subjects, the yellow area is the second highest, and the green area is the lowest. |
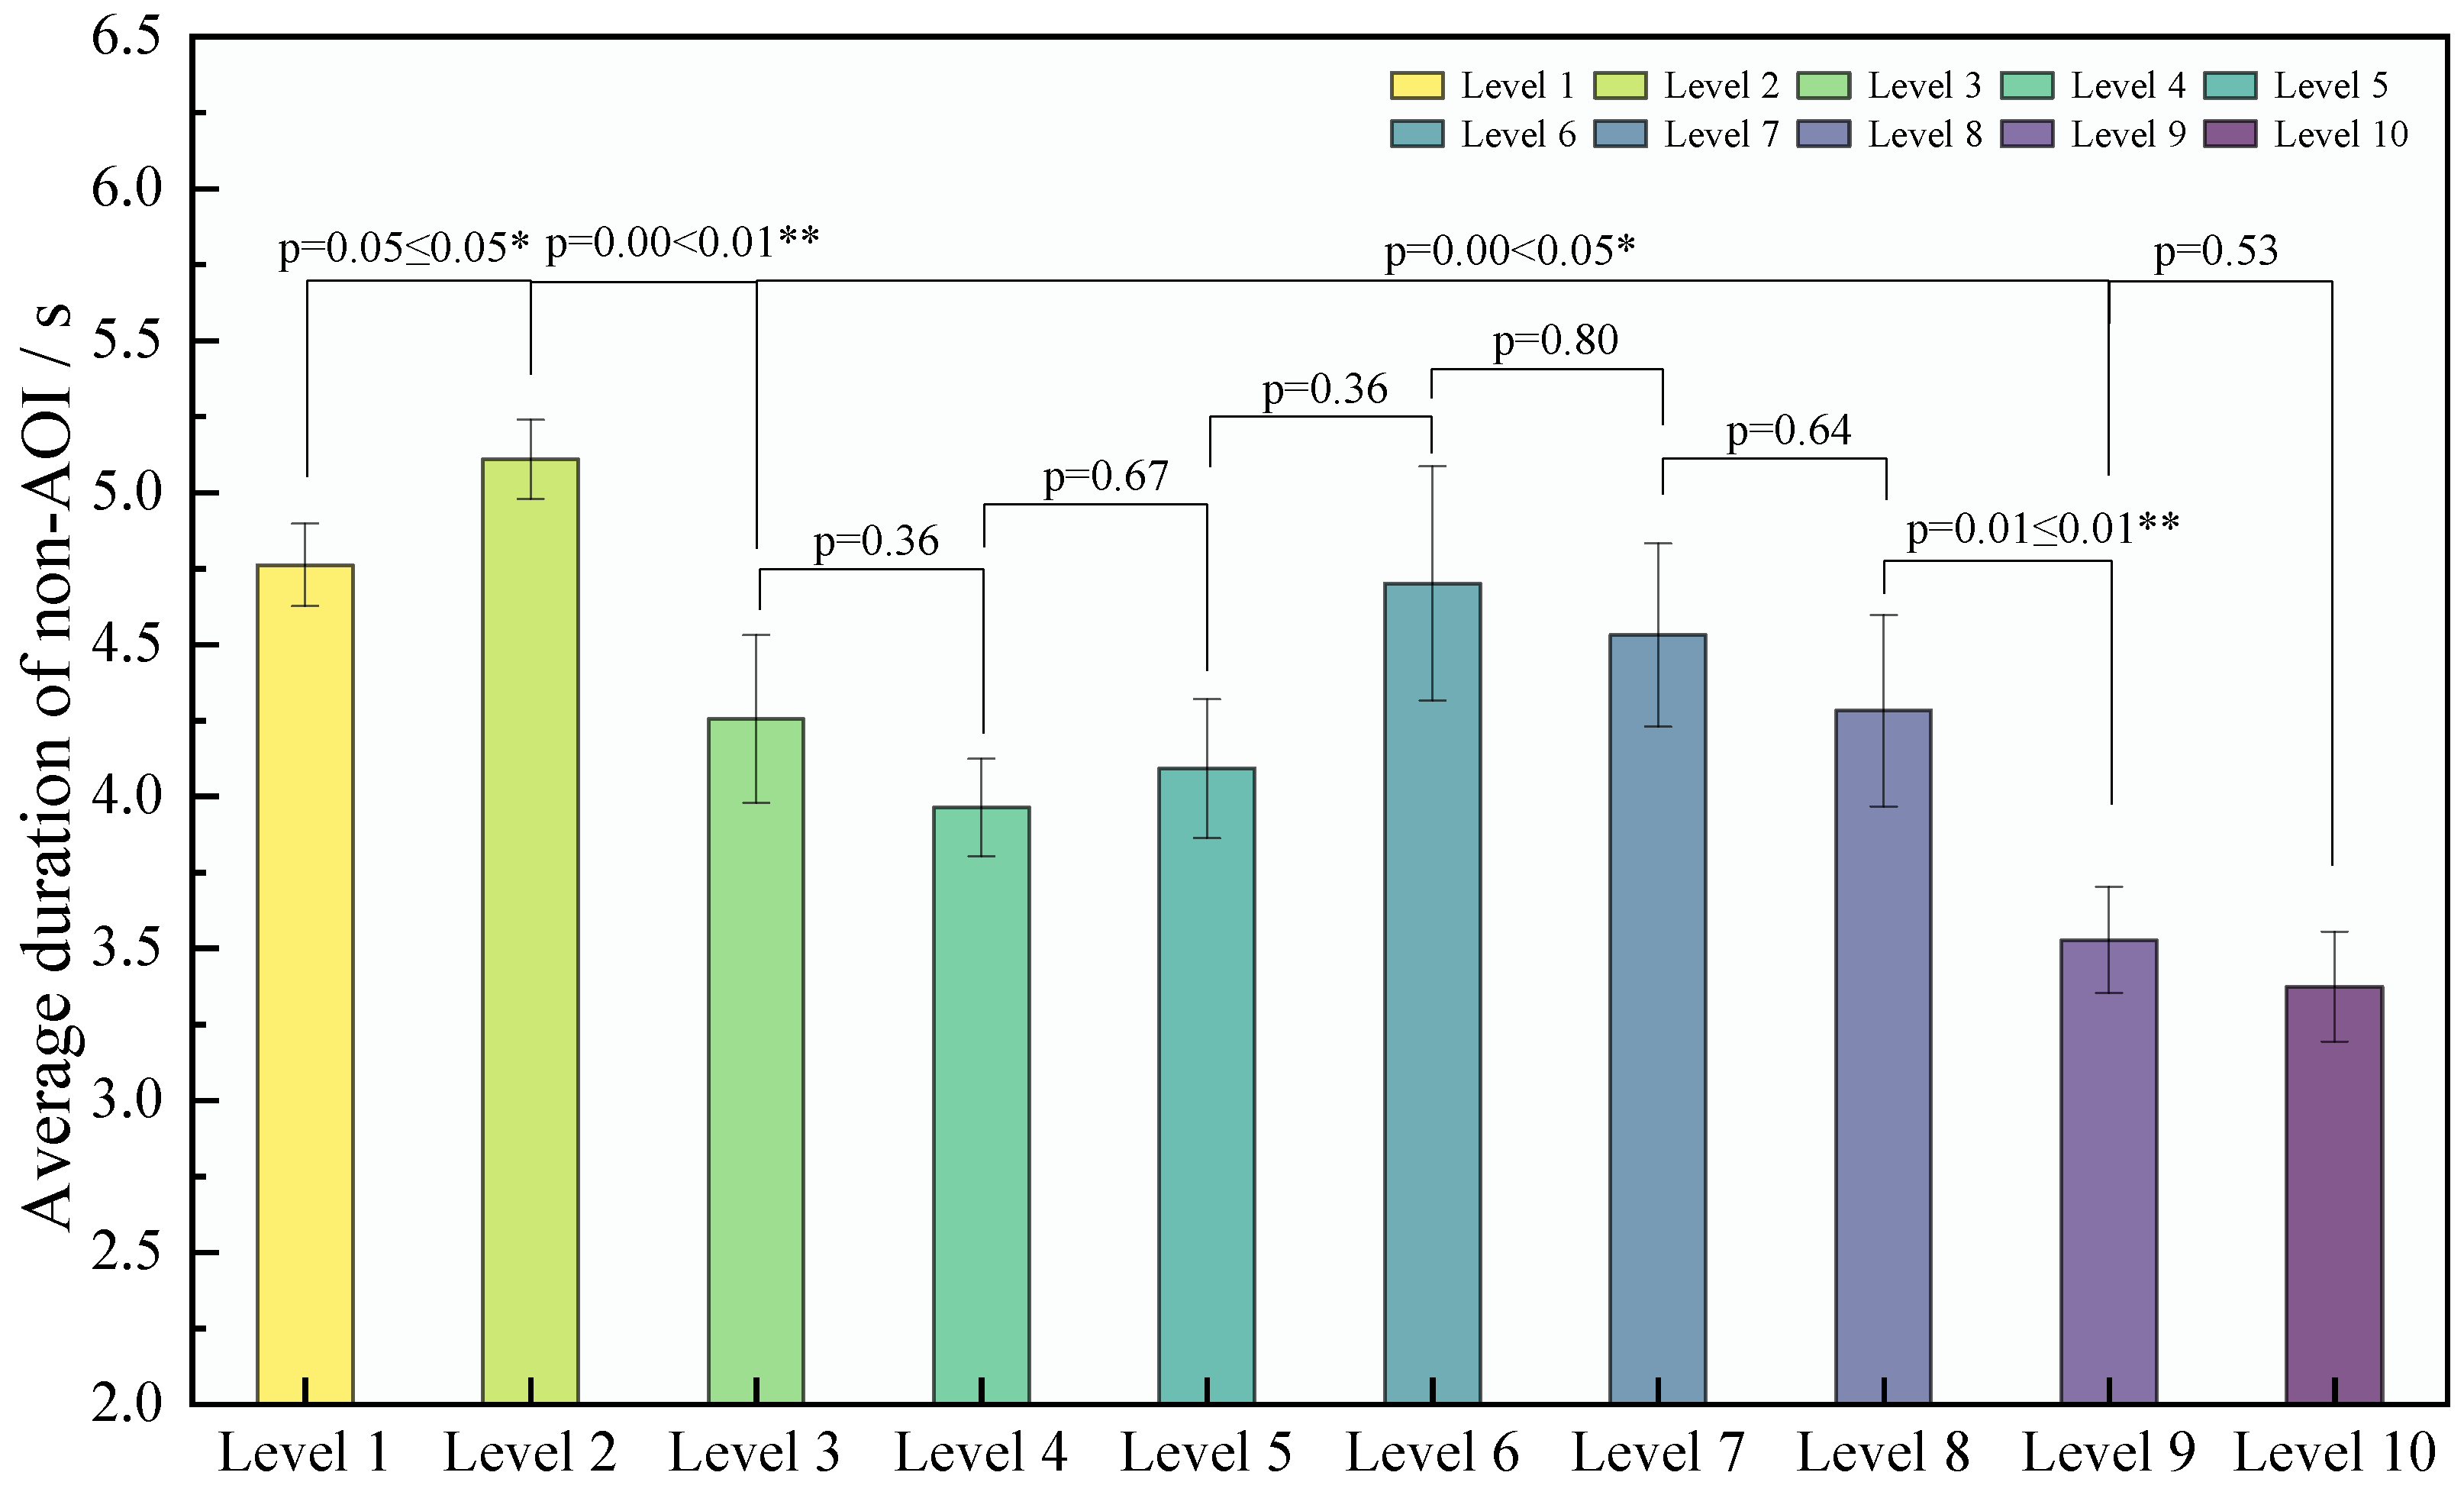
| Concern for road conditions (CRC) [83] | Average duration of non-AOI (ADN) | The CRC can be described using the ADN, which reflects a driver’s attention to the surrounding road conditions and environment. | The lower the ADN, the lower the CRC and the greater the driving risk. |
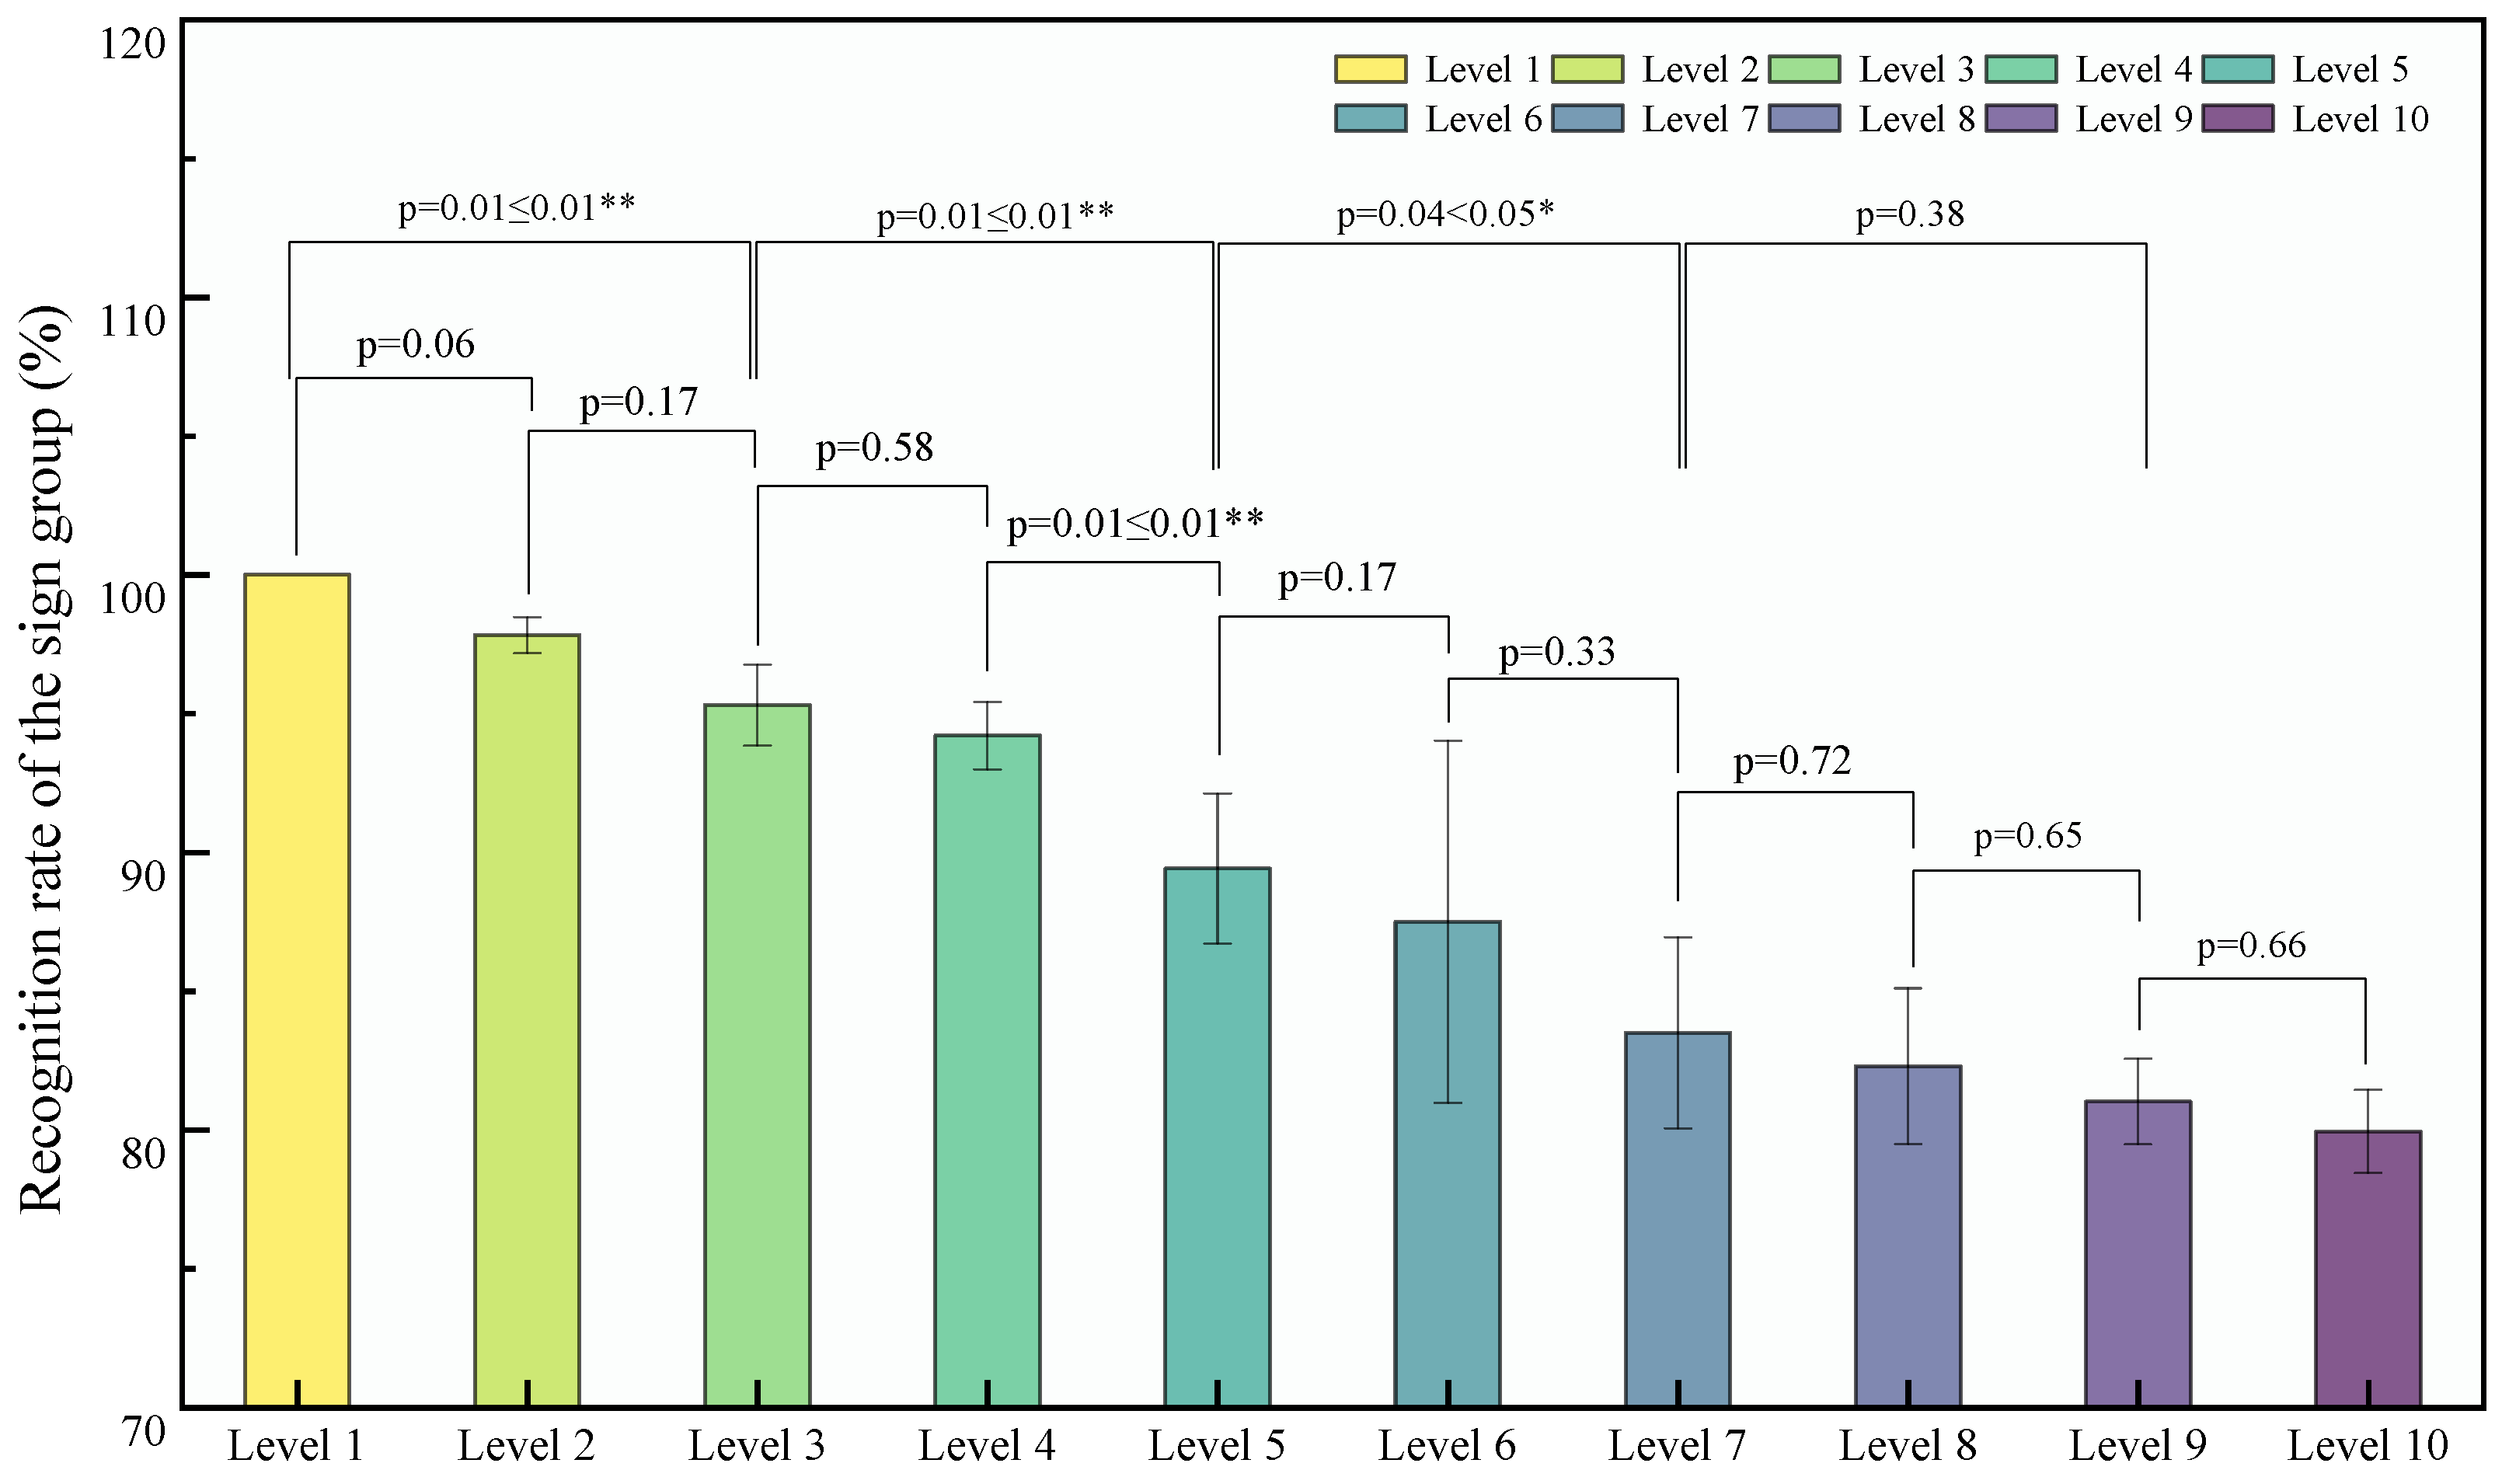
| Recognition rate of the sign group (RRSG) [84] | Number of AOIs (NA); Number of captured AOIs (NCA) | , where RRSG represents the drivers’ ability to capture information. | The higher the NCA, the higher the RRSG and the stronger the information captured ability of drivers. |
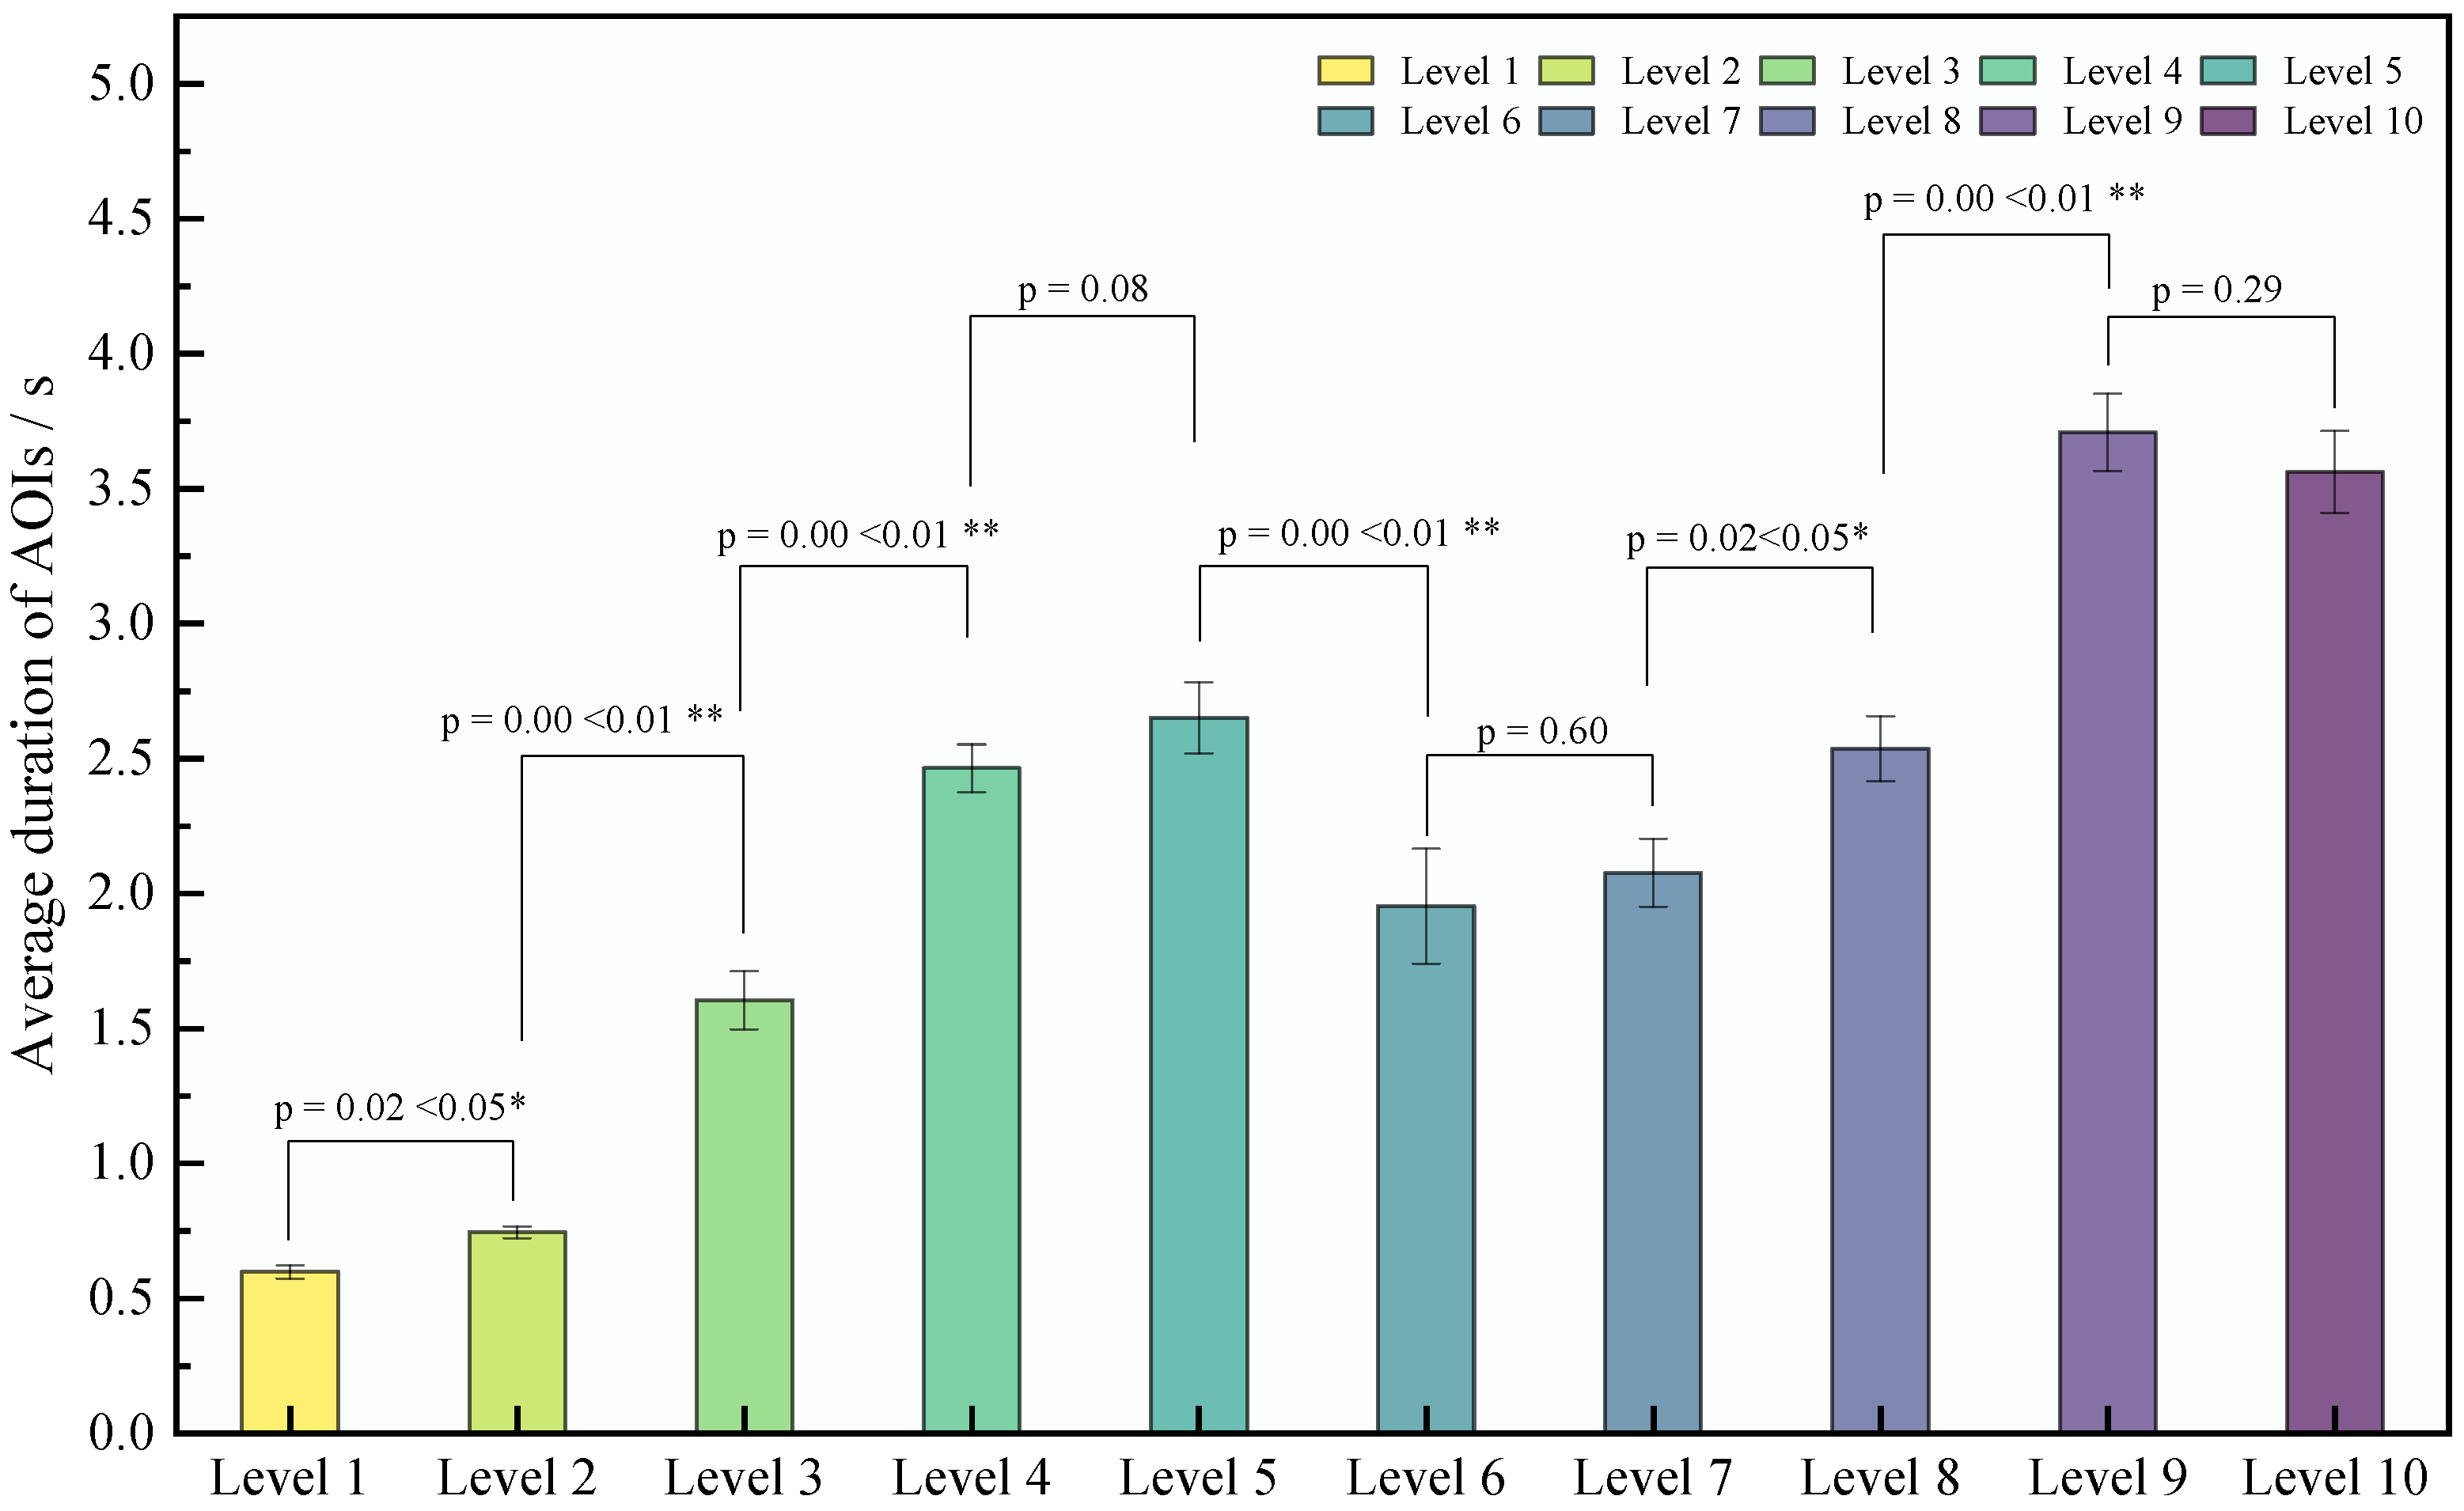
| Processing and cognitive ability of information (PCAI) [79] | Average duration of AOIs (ADA) | , where PCAI can be described using the ADA, which reflects the time drivers spend processes the information. | The higher the ADA, the lower the PCAI. |
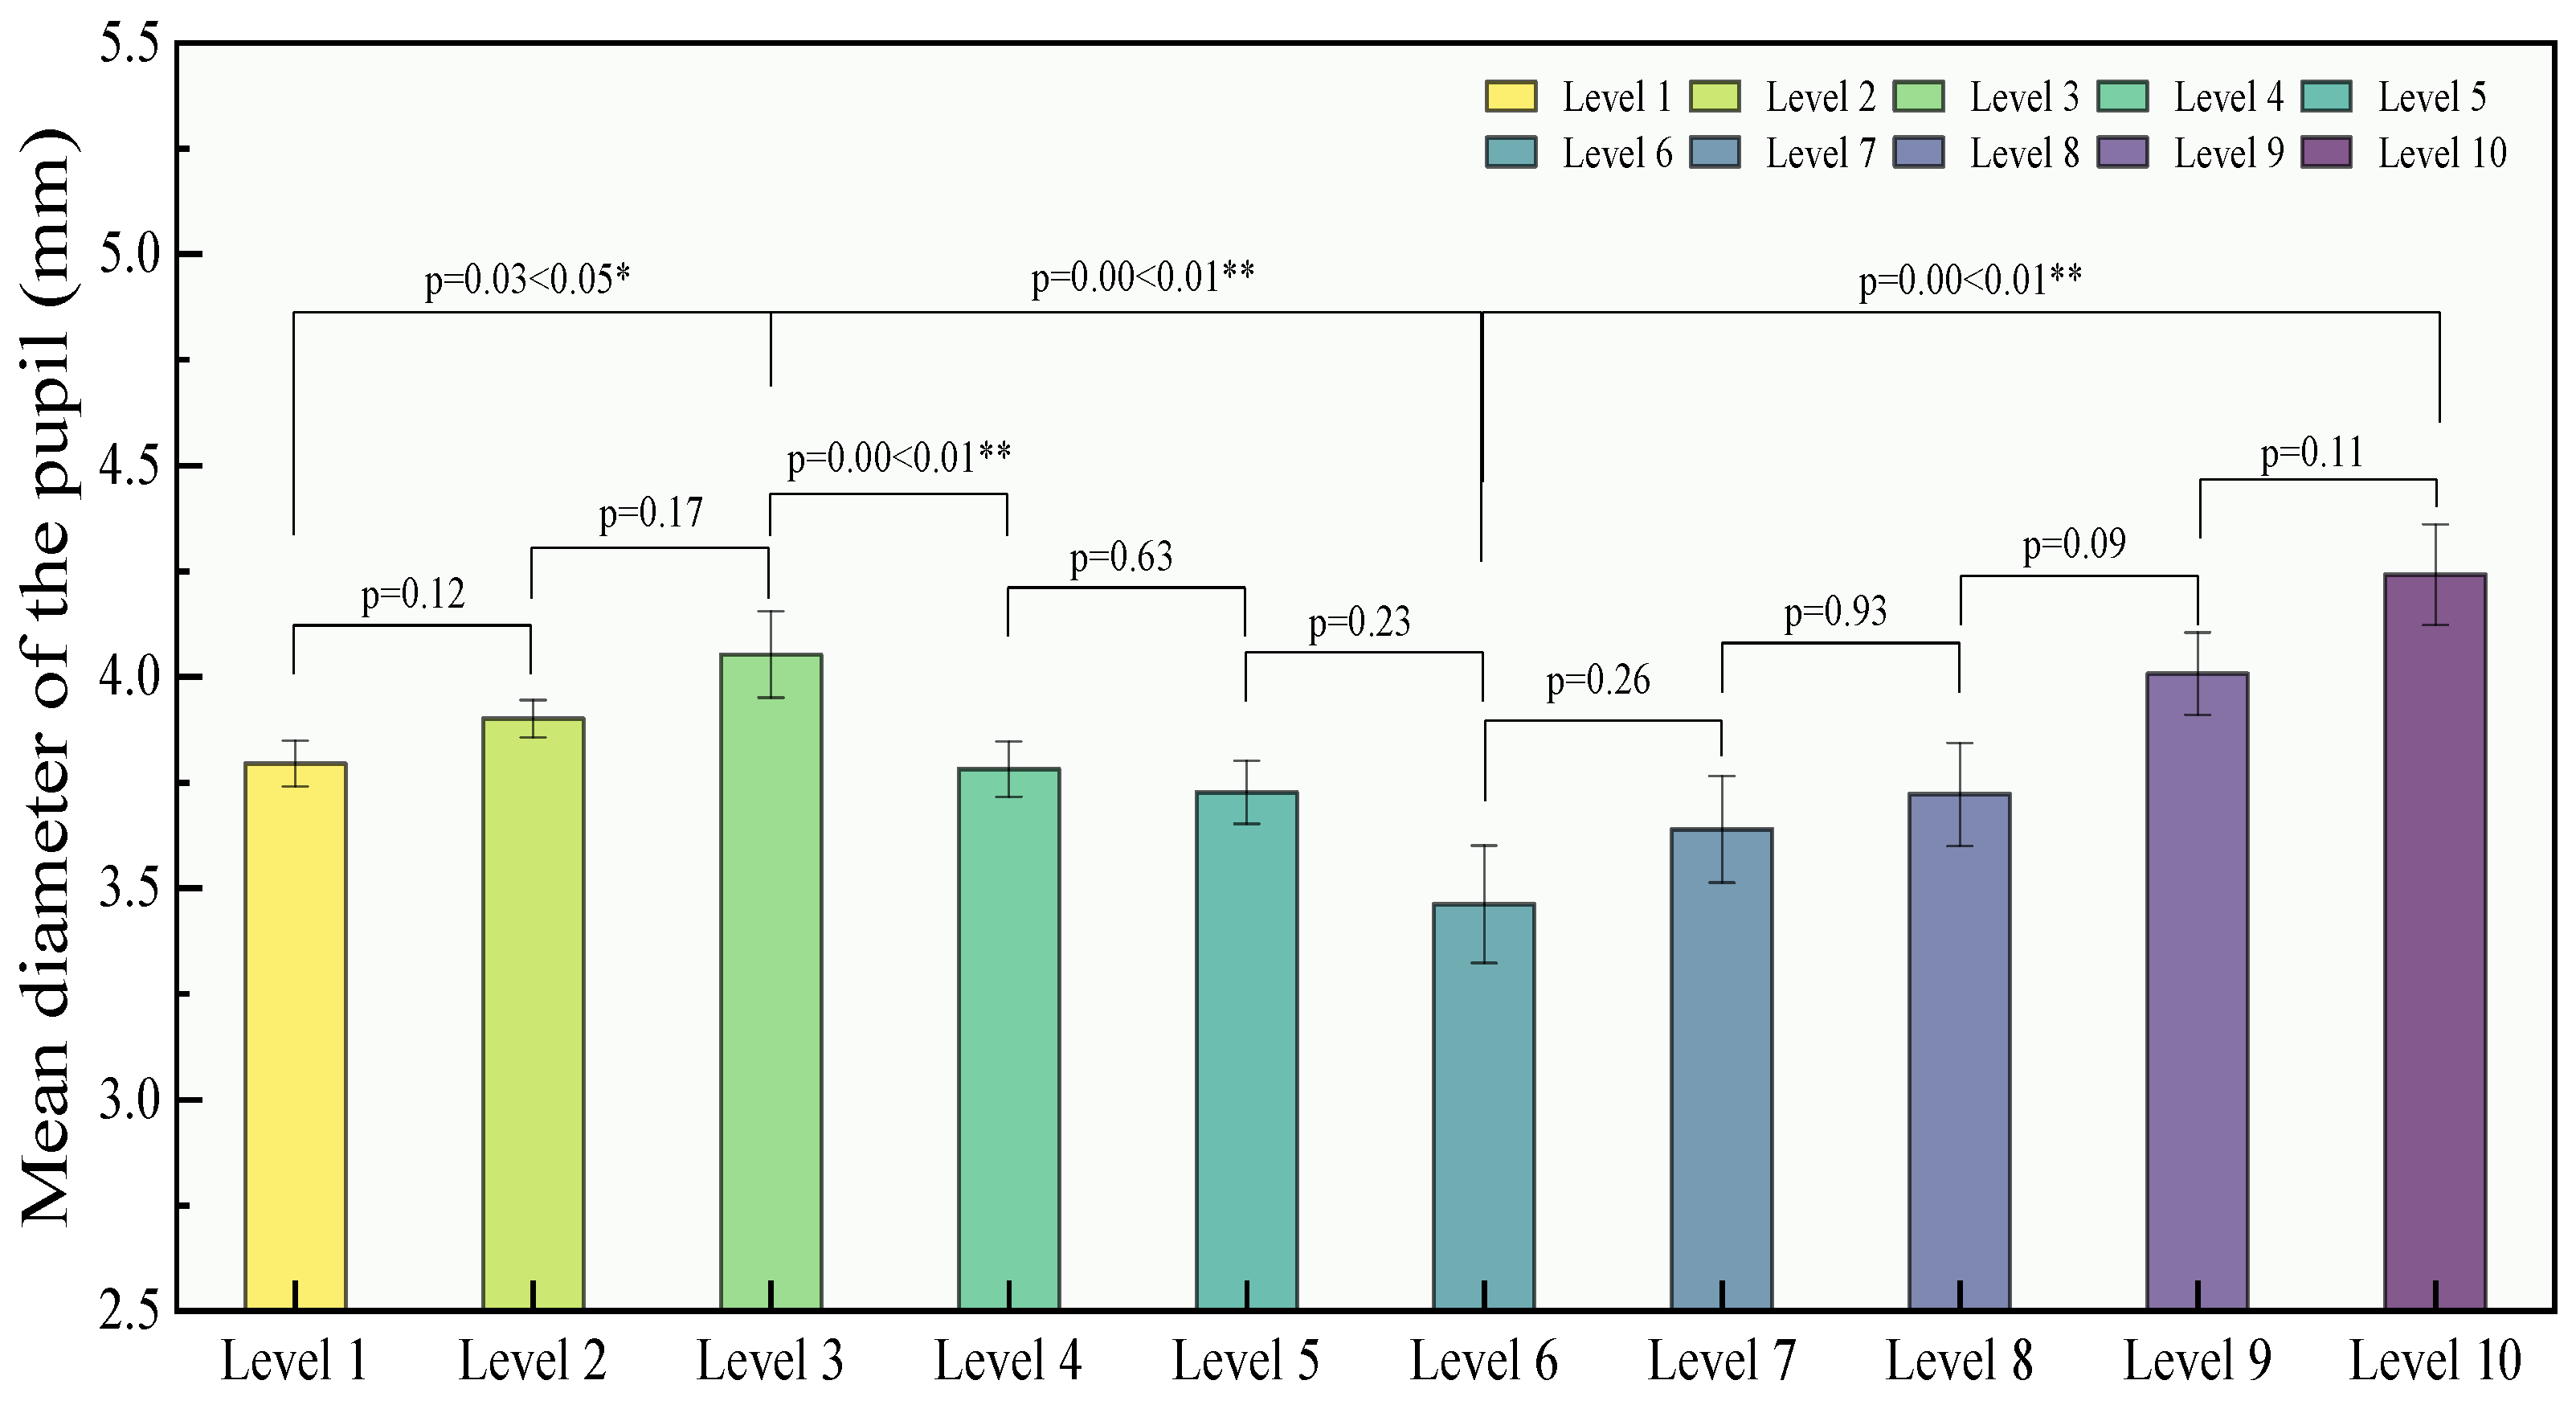
| Mental load (ML) [85] | Mean diameter of the pupil (MDP) | The ML can be described using the MDP, which is a sensitive indicator of mental load. | The larger MDP, the greater the ML. |
| Index | Mean | SD | N | Homogeneity Based on the Mean | One-Way ANOVA | ||||
|---|---|---|---|---|---|---|---|---|---|
| LS a | df1 | df2 | Sig. | F | p | ||||
| NCA | 4.69 | 4.15 | 816.00 | 2.72 | 9.00 | 806.00 | 0.05 | 17.18 | 0.00 ** |
| ADN | 0.41 | 0.24 | 816.00 | 8.93 | 9.00 | 806.00 | 0.06 | 15.80 | 0.00 ** |
| ADA | 0.51 | 0.40 | 816.00 | 7.68 | 9.00 | 806.00 | 0.07 | 5.15 | 0.00 ** |
| RRSG | 0.94 | 0.13 | 816.00 | 25.99 | 9.00 | 806.00 | 0.26 | 29.13 | 0.00 ** |
| MDP | 3.93 | 0.71 | 816.00 | 0.94 | 9.00 | 806.00 | 0.09 | 3.91 | 0.00 ** |
| Communalities Test | KMO and Bartlett’s Test | ||||
|---|---|---|---|---|---|
| Evaluation Indicators after Standardized Conversion | Initial | Extraction | KMO | df | Sig. |
| ZCRC | 1.000 | 0.775 | 0.618 | 6 | 0.000 |
| ZRRSG | 1.000 | 0.752 | |||
| ZPCAI | 1.000 | 0.842 | |||
| ZMDP | 1.000 | 0.968 | |||
| Component | Initial Eigenvalues | Component Score Coefficient Matrix | |||||
|---|---|---|---|---|---|---|---|
| Total | % of Variance | Cumulative % | ZCRC | ZRRSG | ZPCAI | ZML | |
| 1 | 2.250 | 56.247 | 56.247 | 0.37 | 0.385 | 0.400 | 0.012 |
| 2 | 1.087 | 27.179 | 83.425 | −0.224 | −0.003 | 0.227 | 0.904 |
| 3 | 0.399 | 9.968 | 93.393 | ||||
| 4 | 0.264 | 6.607 | 100.000 | ||||
Disclaimer/Publisher’s Note: The statements, opinions and data contained in all publications are solely those of the individual author(s) and contributor(s) and not of MDPI and/or the editor(s). MDPI and/or the editor(s) disclaim responsibility for any injury to people or property resulting from any ideas, methods, instructions or products referred to in the content. |
© 2023 by the authors. Licensee MDPI, Basel, Switzerland. This article is an open access article distributed under the terms and conditions of the Creative Commons Attribution (CC BY) license (https://creativecommons.org/licenses/by/4.0/).
Share and Cite
Zeng, Q.; Chen, Y.; Zheng, X.; He, S.; Li, D.; Nie, B. Optimization of Underground Cavern Sign Group Layout Using Eye-Tracking Technology. Sustainability 2023, 15, 12604. https://doi.org/10.3390/su151612604
Zeng Q, Chen Y, Zheng X, He S, Li D, Nie B. Optimization of Underground Cavern Sign Group Layout Using Eye-Tracking Technology. Sustainability. 2023; 15(16):12604. https://doi.org/10.3390/su151612604
Chicago/Turabian StyleZeng, Qin, Yun Chen, Xiazhong Zheng, Shiyu He, Donghui Li, and Benwu Nie. 2023. "Optimization of Underground Cavern Sign Group Layout Using Eye-Tracking Technology" Sustainability 15, no. 16: 12604. https://doi.org/10.3390/su151612604
APA StyleZeng, Q., Chen, Y., Zheng, X., He, S., Li, D., & Nie, B. (2023). Optimization of Underground Cavern Sign Group Layout Using Eye-Tracking Technology. Sustainability, 15(16), 12604. https://doi.org/10.3390/su151612604


