Article

Analysis of the Pore Structure and Fractal Characteristics of Coal and Gas Outburst Coal Seams Based on Matrix Compression Correction

School of Safety and Emergency Management Engineering, Taiyuan University of Technology, Taiyuan 030024, China
*
Author to whom correspondence should be addressed.
Sustainability 2023, 15(17), 12670; https://doi.org/10.3390/su151712670
Submission received: 27 July 2023 / Revised: 14 August 2023 / Accepted: 17 August 2023 / Published: 22 August 2023
(This article belongs to the Section Hazards and Sustainability)

Abstract

:
The comparative analysis of coal samples under different gas occurrence conditions systematically reveals the pore structure characteristics of coal and gas outburst coal seams. The functional relationship between R0,max and Kc was clarified using mathematical statistical methods, and the pore structure and fractal characteristics of coal and gas outburst coal seams were analyzed on the basis of modified mercury pressure data and fractal analysis. The results show that the functional relationship between R0,max and Kc is consistent with y = 1.59x−0.48, and when the mercury inlet pressure is 10~120 MPa, the coal sample is the most affected by the matrix compression effect. The average pore volume and average specific surface area of the outburst coal samples were 41.71% and 23.09%, which is greater than those of the non-outburst coal samples, respectively, and the specific surface area and pore volume provided by the outburst mining micropores were 46.24% and 81.67%, respectively. The fractal dimension, D, of the coal seam increased with the increase in metamorphism, and compared with low gas mines, the fractal dimension of coal samples in the coal and gas outburst mines was higher, the influence of the matrix compression effect was more obvious, and the heterogeneity was stronger.

1. Introduction

At present, there are 105 mining areas in China, half of which are high-gas mines, which supply 70% of coal, and store more than 60% of coalbed methane resources [1]. In recent years, with the increase in mining depth, the number of high-gas mines and coal and gas outburst mines has increased, and the number of coal and gas outburst accidents has increased significantly. The essence of the coal and gas outburst process concerns the large amount of stress energy and gas that are accumulated in the long-term construction of the coal seam, which is instantly released in a very short period of time [2,3]. Under long-term tectonic action, the pore structure of the coal seam will change to varying degrees, and the pore structure becomes more closely related to the occurrence and transport of gas in the coal seam [4]. The study of the pore structure of coal and gas outburst mines is the basic premise of this paper to prevent coal and gas outburst [5,6].
In recent years, many scholars have studied the pore structure of coal seams. Meng [7] used the isothermal adsorption test and liquid nitrogen adsorption experiment to show that with the increase in coal damage, the pore volume and specific surface area increased, and under the same geological conditions, the gas content of the coal seam was higher in areas with more serious coal structure damage. Ren et al. [8] studied the evolutionary characteristics and mechanisms of coal pore structures with different degrees of metamorphism using low-temperature liquid nitrogen adsorption, SAXS, and SEM. The results showed that the pore size decreased with the increase in deformation degree. Chen et al. [9] explored the pore differences of different degrees of raw coal, and they found that the pore volume of coal increased with the increase in metamorphism. Yu et al. [10,11] found that when combined with low-temperature N2 and CO2 adsorption, fractal theory revealed the structural and fractal characteristics of the micropores and mesopores of coal, and the results showed that the fractal dimension increased with the increase in structural deformation. Li et al. [12] analyzed the microporous structure of a prominent coal seam in Guizhou, and its influence on gas flow characteristics, via a high-pressure mercury pressure experiment combined with fractal theory; they pointed out that the widely developed micropores of the prominent coal seam were an important cause of the coal seam outburst. Zhang et al. [13] found that when porosity is tested using a high-pressure mercury experiment, the high pressure leads to matrix compression, and pore system redistribution increases the heterogeneity of pore structure. Yue et al. [14] studied the pore structure of different types of coal using liquid nitrogen adsorption and mercury pressure. Chen et al. [15] tested the pore structure of nine groups of coal samples with different degrees of metamorphism using mercury pressure, and they used the sponge model to study the fractal characteristics of different degrees of metamorphism. Zhu et al. [16] analyzed the pore structure characteristics of coal samples via the mercury pressure method and liquid nitrogen adsorption, and they discussed the correlation between the pore structure of coal and the dynamic instability characteristics of coal rock. In order to reveal the relationship between structural coal and outburst, Cheng [4] compared and analyzed the pore structure and mechanical properties of tectonic coal and primary coal, and the results showed that the change in porosity during the process of stress energy release in the protrusion excitation stage is a necessary condition for the development of protrusion. Zhang et al. [17] analyzed the pore structure of coal via nitrogen adsorption and mercury pressure, and the results showed that small pores had a significant effect on the fractal dimension of coal, and the fractal dimension was related to the size and volume of micropores.
Based on the above analysis, there are few comparative studies on the pore structures of low gas, high gas, and coal and gas outburst mines; moreover, the difference between outburst and non-outburst pore structures is less obvious. The method for matrix compression correction mainly relies on nitrogen adsorption experiments, and the experimental and time costs are large. Therefore, the relationship between the compression coefficient and the R0,max function is clarified using mathematical statistical methods. Based on the correction of mercury pressure data, combined with fractal analysis, the pore structure, pore size distribution, and fractal characteristics of mines under different gas occurrence conditions were comprehensively analyzed, so as to improve the understanding of coal pore structure characteristics. The influence of pore structure on the disaster mechanism of the coal and gas outburst seam was discussed, and a theoretical basis was provided for the disaster management of the coal and gas outburst seam and the development and utilization of coalbed methane.

2. Experiments and Methods

2.1. Samples

The coal gathering area in North China accounts for about 53% of the country’s total coal resources, and 64% of the state-owned key coal mines are concentrated there [18]. Therefore, the selection of coal samples in this paper was mainly concentrated in the coal poly area of North China, represented by Shanxi Province and its surrounding areas.
In order to better highlight the pore structure characteristics of the mine, 10 coal samples were selected to include different coal grades, from lignite to anthracite. In accordance with GB40880-2021 [19], depending on the amount of gas gushing, the form of gushing, the actual gas dynamic phenomenon, and outstanding danger indicators, the coal mine gas grade is divided into the following: low gas mine, high gas mine, and coal and gas outburst mine. The 10 coal samples selected included 3 low-gas mines, 4 high-gas mines, and 3 coal and gas outburst mines. A basic overview of the selected coal samples is shown in Table 1. As can be seen from the table, the coal accumulation period of the outburst mines is mostly Carboniferous Permian, and the coal grade of the coal sample is higher.

2.2. Experiments Procedure

In order to meet the test conditions, the selected coal samples were subject to crushing, grinding and screening. The industrial analysis of the 10 groups of coal samples used in the test was completed in accordance with the standards of the International Chemical Union (ASTM, 2007) [20]. The vitrinite reflectance of coal samples was determined in accordance with the international standard, ISO7404-5-1994 “Petrographic analysis of coal” [21]. The maximum vitrinite reflectance (R0,max) of the 10 groups of coal samples was determined in accordance with the Chinese national standard, GB/T 8899-2013 [22]. In accordance with the Chinese national standard, GB/T 21650.1-2008 [23], the mercury injection experiment was conducted using the Auto Pore IV 9500 MIC automatic mercury injection instrument. After the water interference was eliminated, the test was conducted, and the mercury injection amounts under different pressures were recorded. In order to reduce accidental errors, 3 experiments were carried out for each group of coal samples to ensure the accuracy of the experiment.
The pore structure inside the coal body is very complex. It is difficult to accurately characterize it using traditional methods, and the pore structure of the coal body can be effectively described using fractal theory [24,25]. Based on the solid mass fractal model (Menger cavernous body), combined with the relationship between capillary pressure and pore size, the fractal dimension of reservoir pore structure can be calculated, as per Equation (1):
D 4 = lg d V p d P / l g P
where P is the pressure applied during the experiment, MPa; dV is the pore volume increment, mL/g; D is the fractal dimension, dimensionless.

3. Analysis of Experimental Results

The experimental results of the coal samples are shown in Table 2. The R0,max of 10 groups of coal samples was 0.34%~2.64%, and it is usually considered that low-rank coal is coal with a R0,max < 0.65%. Moreover, 0.65~2.5% was the result for medium-rank coal and R0,max > 2.5% was the result for high-rank coal [26,27]. In accordance with the classification method in Reference [14], the selected 10 groups of comparison coal samples included low-rank, medium-rank, and high-rank coal, of which, 1#~2# belong to low-rank coal, 3#~8# belong to medium-rank coal, and 9#~10# are high-rank coal. The coal samples of coal and gas outburst coal seams are mostly high-rank coal, whereas the coal samples of low gas coal seams are mostly low metamorphic coal.
The industrial component analysis of coal samples mainly includes four parts, as follows: moisture, ash, volatile content, and fixed carbon. This analysis method is the main method used to understand the characteristics of coal samples. Previous studies have shown that moisture content affects the robustness coefficient of coal, resulting in changes in the mechanical properties of coal. Ash and volatile content have a significant relationship with the adsorption gas performance of coal, which will affect the gas content in the coal seam. As is evident in Table 2, the variation range regarding moisture content in coal samples is 0.36%~8.96%, and the change range regarding volatile content is 6.03%~33.02%, which is inversely proportional to the degree of spoilage. As the gas level increases, the content of fixed carbon gradually increases.
The results of the mercury pressure test are shown in Figure 1, from which, it is evident that there are obvious differences between the pore structures of high-gas mines, low-gas mines, and coal and gas outburst mines. The mercury advance and retreat curve of low-gas mines have obvious “lag loops”, indicating that the content of macropores and mesopores in low-gas mines is large, and the fluidity is better, which is not conducive to gas storage. The difference between the advance and retreat mercury curves of some coal samples in high-gas mines was small, indicating that the pore openness was small, and the connectivity was poor. However, the mercury advance and retreat curves of the high-pressure section overlapped, indicating that the coal and gas outburst coal seams were rich in micropores and pinholes, whereas the content of the macropores and mesopores was less, and the communication between pores was poor, which was not conducive to gas flow.
As is evident from Figure 1, matrix compression has no significant effect on the experimental results when the pressure is less than 10 MPa. When the mercury intrusion pressure is 10 MPa, the mercury advance and retreat curve have a mercury breakthrough point. The matrix compression effect gradually became obvious, the compression error gradually dominated, and the experimental data obviously overestimated the pore volume in the coal sample. Therefore, the data obtained from the experiment need to be corrected before the mercury pressure data can be analyzed.

4. Discussion

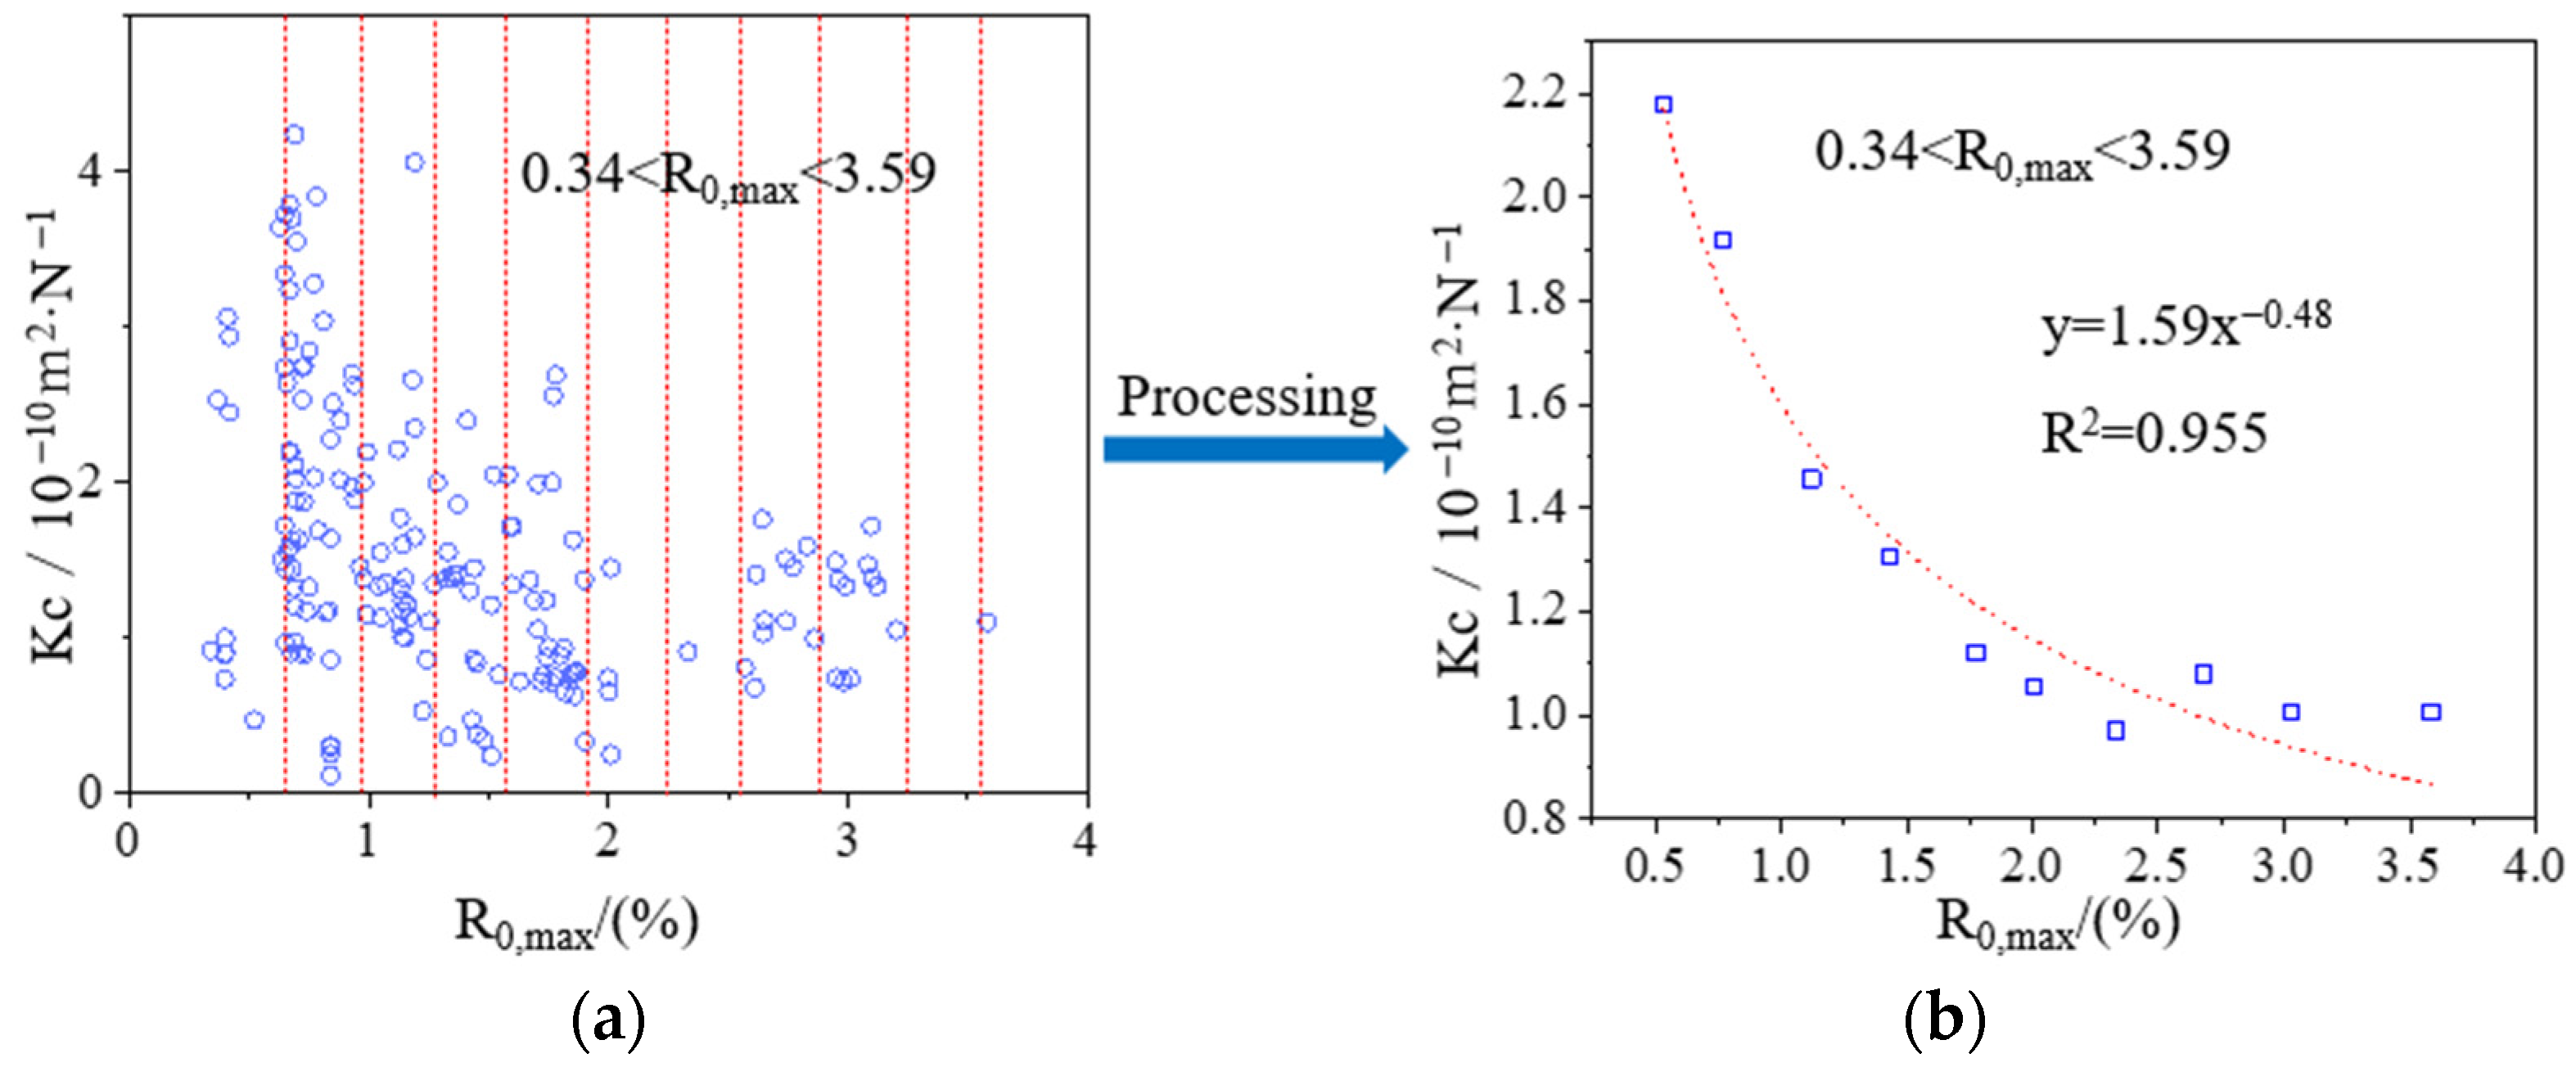
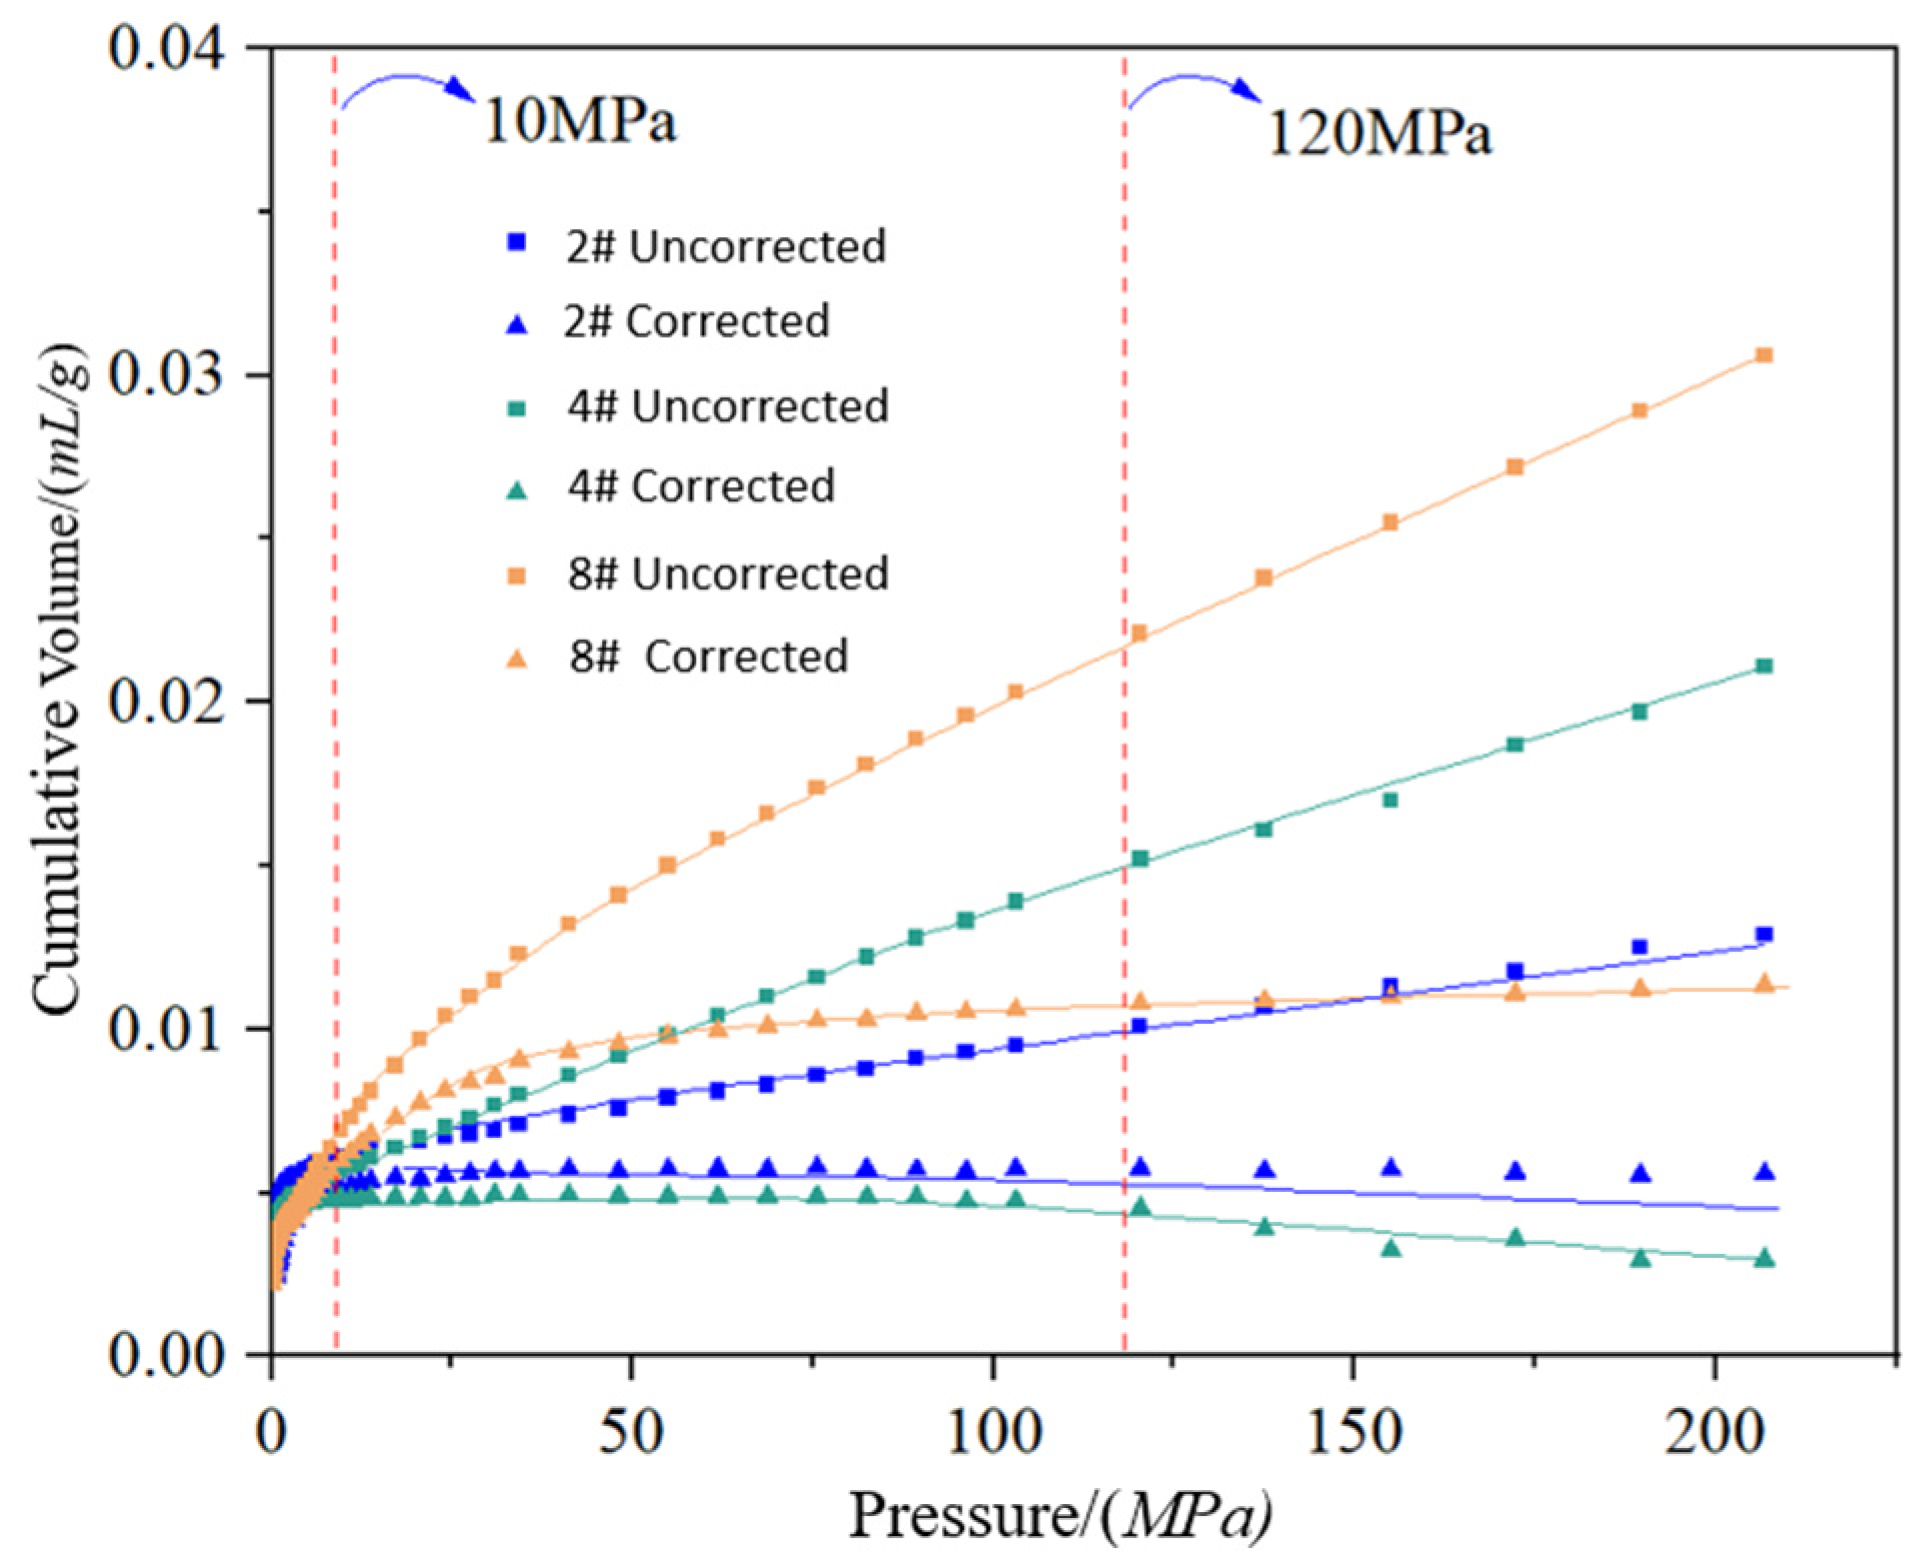
4.1. Matrix Compressibility and Volume Correction

Due to the compression effect of the coal matrix, it is necessary to eliminate the error caused by matrix compression when using mercury pressure to analyze the pores of the coal body. In mercury pressure experiments, the compressibility of mercury during mercury feeding, and the compressibility of the experimental instrument itself, is ignored. Assuming that the coal matrix compression coefficient, Kc, is a constant during mercury pressing, the coal matrix compression coefficient, Kc, may be calculated using Equation (2):
K C = dV C V c d p
where, Vc is the volume of coal matrix, cm3/g; dVc is the volume increment of the coal matrix under the corresponding pressure increment, dp, cm3/g.
When the mercury intake pressure is greater than 10 MPa, the change in mercury intake in the coal sample is caused by the combined effect of the pore filling effect and coal matrix compression effect. This relationship is shown in Equation (3), as follows:
Δ V o b s = Δ V p + Δ V c
where ΔVobs, ΔVp, and ΔVc measured the changes in mercury volume, pore filling volume, and matrix compression volume, respectively, cm3/g.
The matrix volume of the coal sample can be corrected using Equation (4), at a pressure of 0.124~206 MPa (pore size from 6 nm~10 μm), as follows:
Δ V c P i = V c V c ( P i ) = V c Δ V p P i P 0 / Δ P
where Vc (Pi) is the coal matrix volume under pressure, Pi, cm3/g.
Under pressure, Pi, the pore volume increment of the coal sample can be calculated using Equation (5), as follows:
V P i = Δ V obs P i K c Δ V c P i P i P 0
where Vpi is the pore volume increment under pressure, Pi, cm3/g; ΔVobs(Pi) is the measured mercury volume under pressure, Pi, cm3/g.
Since the compressibility coefficient, Kc, of the coal sample could not be determined directly during the correction process used in this paper by analyzing the statistics of previous studies [28,29,30,31,32,33,34], the average grouping was divided in accordance with the R0,max, and the average value was taken. The fitting diagram of the coal sample compression coefficient, Kc, with the R0,max is shown in Figure 2. There is a certain functional relationship between coal sample compressibility and vitrinite reflectance, and the fitting formula of the two is y = 1.59x−0.48, and the fitting degree is 0.955, which represents a good fit.
In accordance with the fitting relationship, the compression coefficient of the coal sample can be derived, as shown in Table 3. From the table, it is evident that the compression coefficient of coal samples ranges from 0.99 × 10⁻¹⁰ m2·N−1 to 2.41 × 10⁻¹⁰ m2·N−1 for an inlet pressure of 10~206 MPa, which is consistent with the previously measured results of 0.67 × 10⁻¹⁰ m2·N−1~3.06 × 10⁻¹⁰ m2·N−1 [31,32,34].
In accordance with Equations (3) and (4), the pore volume correction of the coal samples was conducted, and the cumulative mercury volume before and after the correction is shown in Figure 3. The result trend of the 10 groups of coal samples was roughly the same, of which, the 2# (low gas), 4# (high gas), and 8# (coal and gas outburst) coal samples were selected. The results showed that when the mercury pressure was within 10 MPa, the data before and after correction were very small, and the compression effect of the coal matrix could be ignored. When the pressure was less than 10 MPa, there was no significant difference in the volume of mercury before and after calibration, indicating that the matrix compression effect at this time was negligible. When the pressure is 10~120 MPa, the difference between the pore volume before and after correction increases significantly, indicating that the coal matrix compression effect has a significant effect on the pore volume structure of the coal sample in the stage involving higher pressure. When the pressure exceeds 120 MPa, the corrected accumulated mercury volume no longer increases or even decreases, which indicates that the pore structure changes inside the coal body in the high-pressure section are very complex, and the conditions for pore correction are not met.

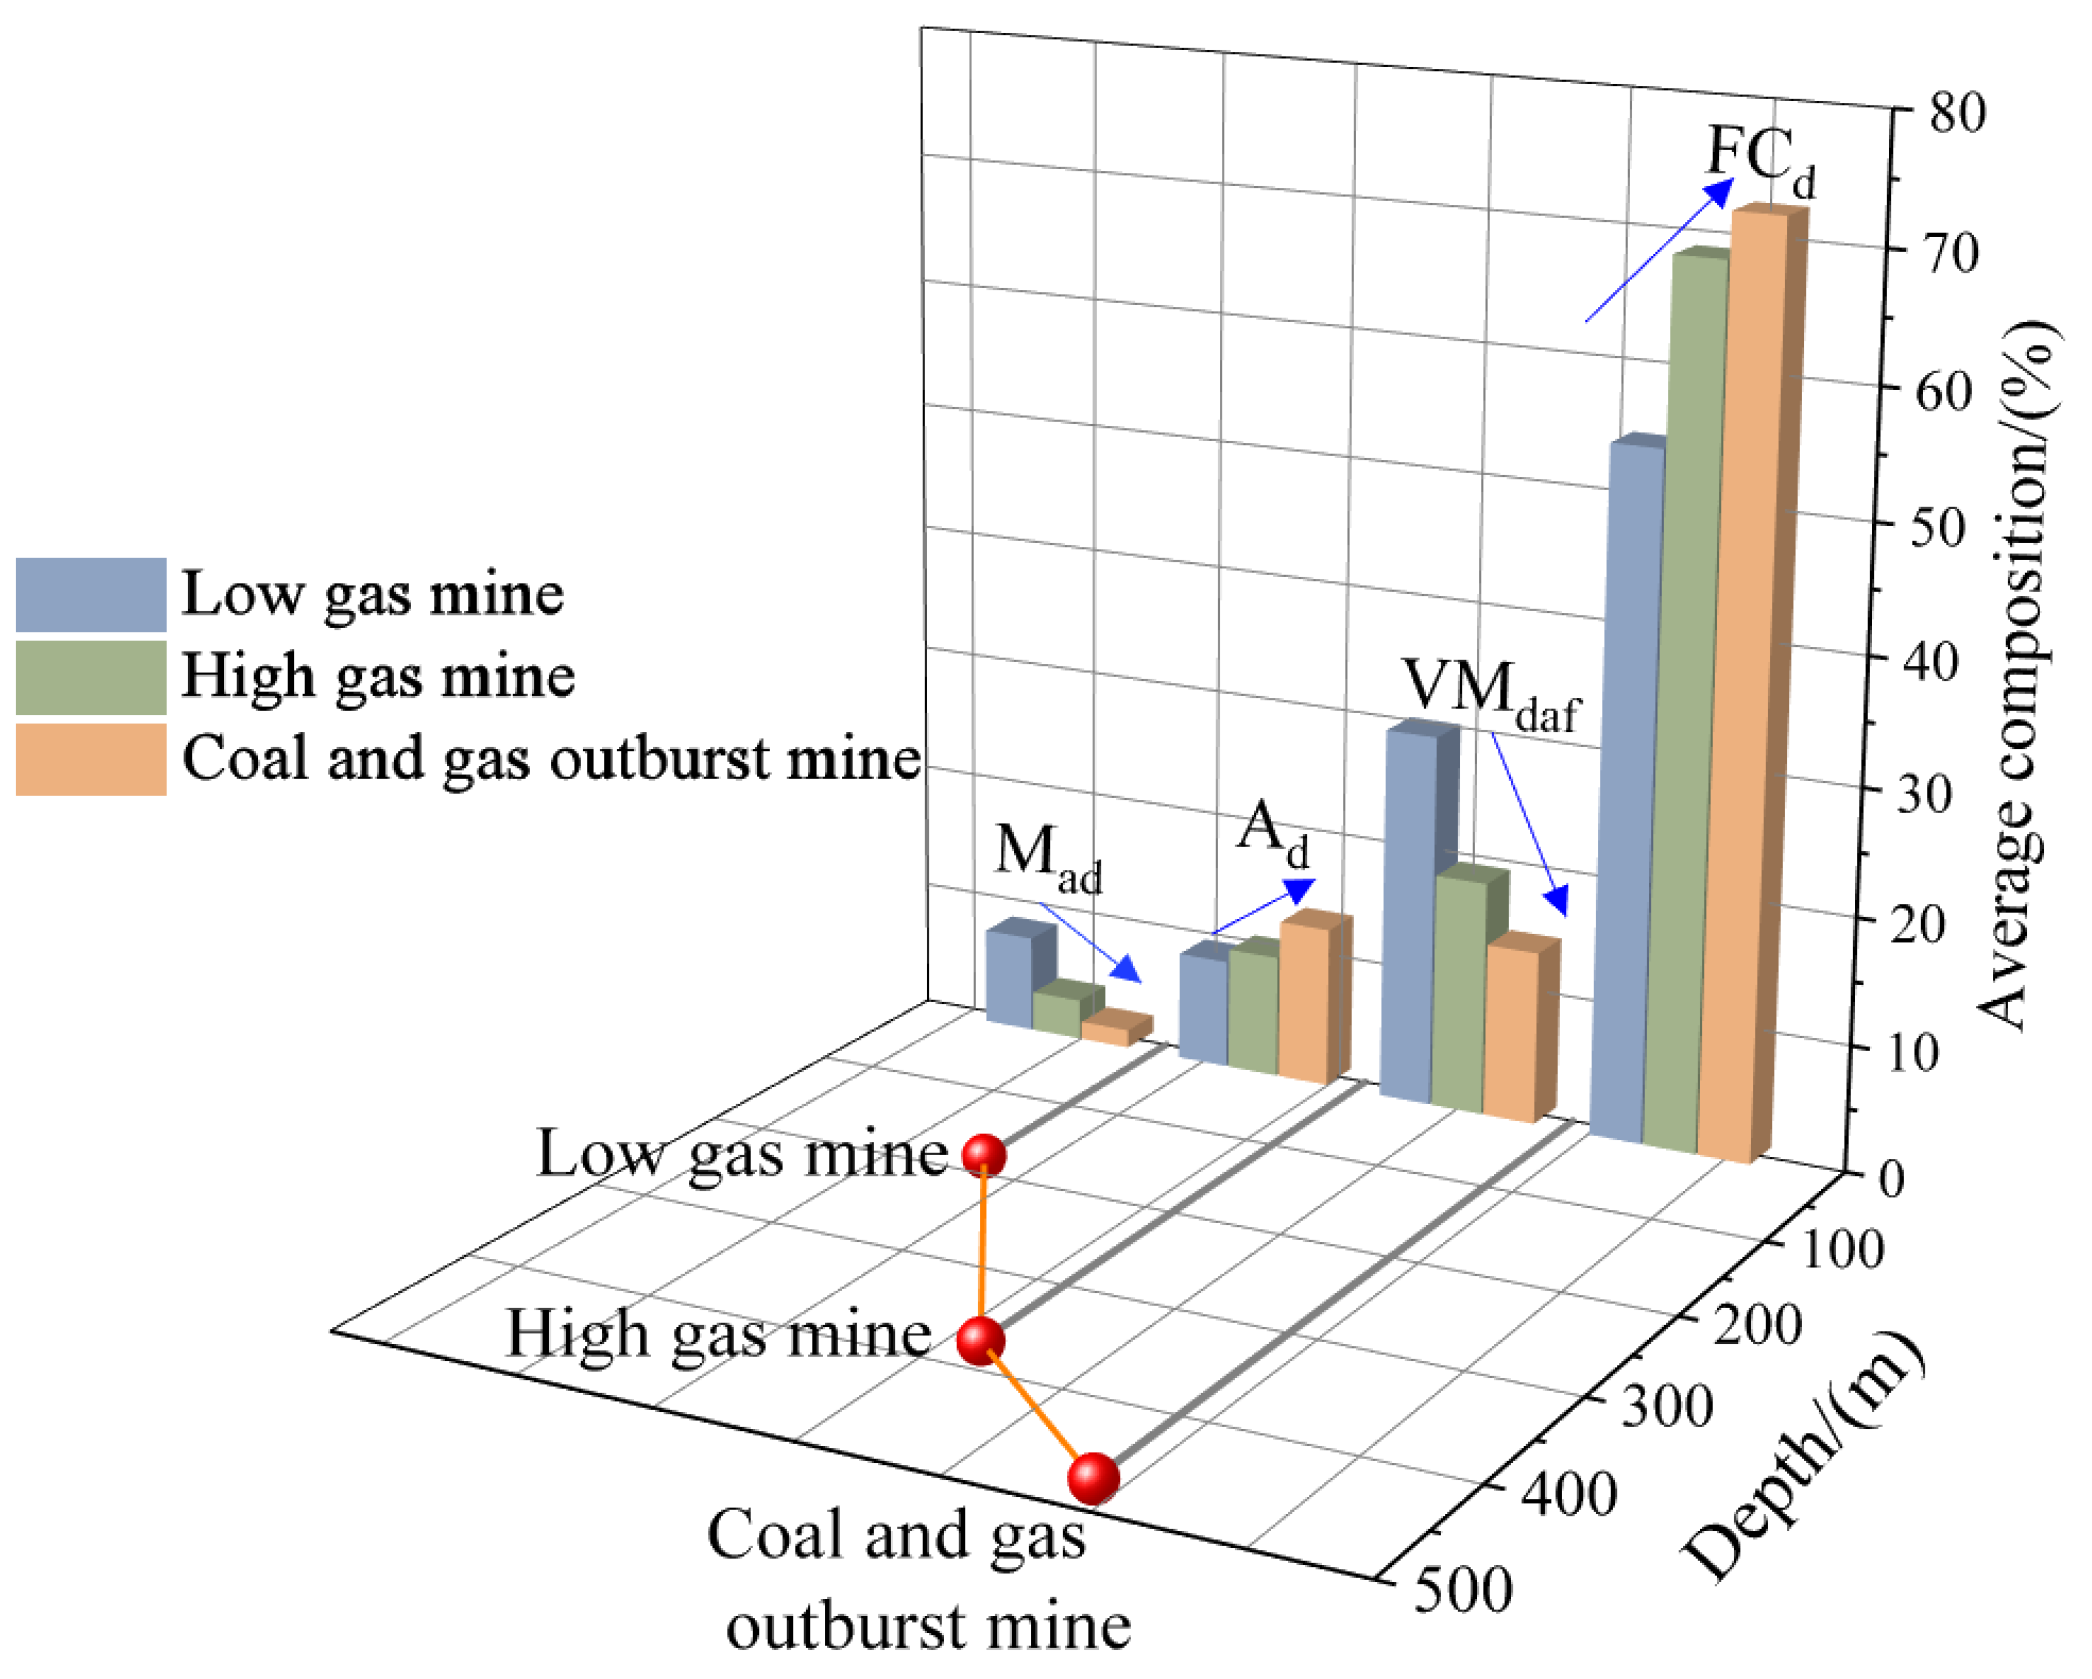
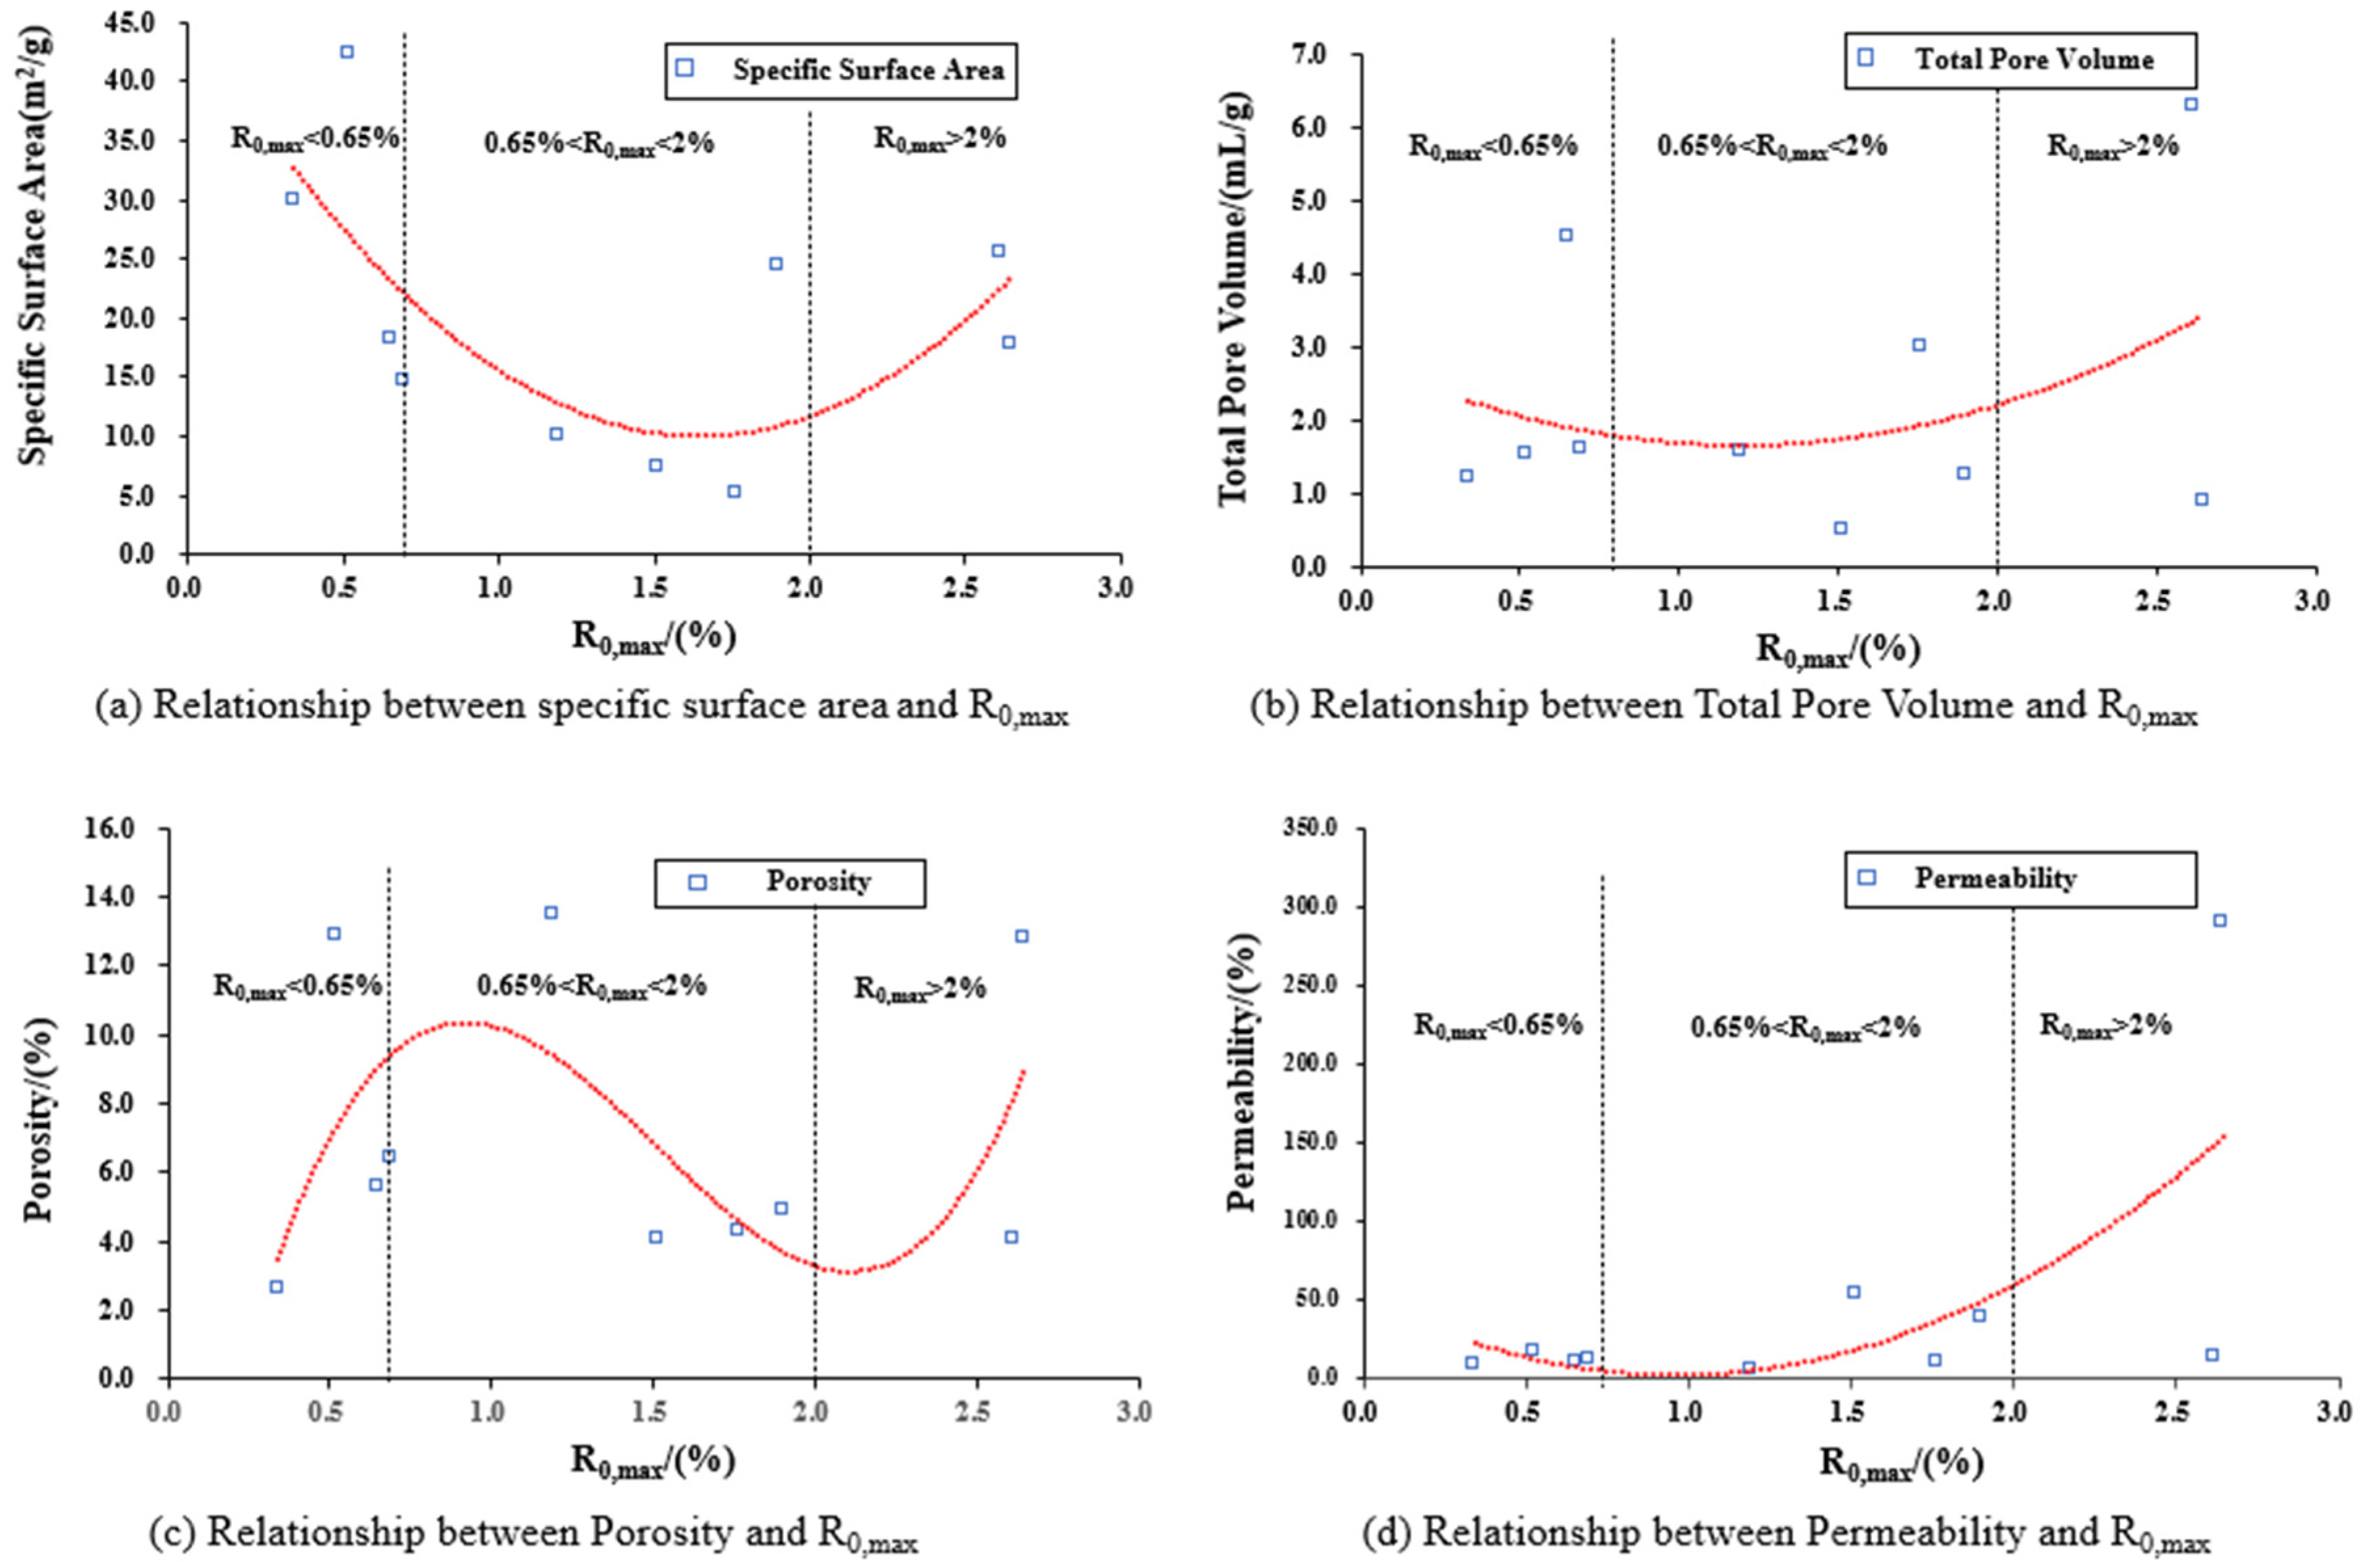
4.2. Characteristics of the Physical Parameters of Outburst Coal Seams

Studying the characteristic parameters of coal samples plays an important role in revealing the mechanism of the coal and gas outburst [35]. As is evident from Figure 4, as the gas level increases, the moisture and volatiles gradually decrease, and the ash and fixed carbon levels gradually increase. Compared with low gas mines, the decrease in moisture in the coal and gas outburst mines is due to the gradual reduction of the specific surface area of the pores in the mine, which reduces the adsorption site of water molecules. The ash content is higher because the rich pore structure formed by the coal seam as it undergoes geological formations increases the content level in the other minerals. From previous analyses, it is evident that during the process of coal deterioration, with the increase in temperature and pressure, a gradual decrease in volatile content and a gradual increase in fixed carbon occurs.
The depth of the coal seam burial affects the pore structure of the coal seam, the emission conditions of coal seam gas, and the air permeability of the coal seam itself. The increase in the depth of coal seams reduces the permeability of gas, making it easier to store gas. In addition, the in-situ stress of the coal seam increases with the increase in the buried depth. Under the action of in-situ stress, the pore structure of the deep coal seam gradually closes in the area. As a result, the pores of the coal seam are poorly developed, and the gas deposited in the coal seam is difficult to release. It is more likely to cause local gas accumulation and increase the possibility of coal and gas protrusion.

4.3. Pore Characteristics of Outburst Coal Seam

The pores of the coal body are the main channels for gas adsorption and transport in the coal seam [36]. Scholars at home and abroad have carried out a lot of classification research on the pore structure of coal. In order to facilitate the analysis of experimental data, the pores in coal are divided into four categories, as follows: micropores (pore size < 0.01 μm), pinhole (0.01 μm < pore size < 0.1 μm), mesopores (0.1 μm < pore size < 1 μm), and macropores (1 μm < pore size < 100 μm).

4.3.1. Pore Structure Analysis

The key pore structure characteristics of coal samples can be obtained via the mercury injection test, including total pore volume, specific surface area, average pore diameter, and so on. The corrected data of the measured pore structure characteristic parameters of coal samples are shown in Table 4. The pore structure characteristic parameters of the coal samples are statistically displayed, and the results are shown in Figure 5.
The pore structure characteristic parameters of the coal samples are statistically displayed, and the results are shown in Figure 6. It is evident that the average total pore volume and average specific surface area of the outburst coal seam are 41.71% and 23.09% larger than those of the non-outburst coal seam, respectively, indicating that the pore development degree of the coal and gas outburst seam is higher than that of the non-outburst coal seam. The average skeleton density of the outburst coal seam was 5.94% higher than that of the non-outburst coal seam, indicating that the communication between the pore structures of the outburst coal seam was poor, which had an adverse effect on the gas flow. In terms of macro parameters, the outburst coal seam has lower porosity, which is due to its pore structure characteristics.
The relationship between the pore structure characteristic parameters and the degree of coal sample metamorphism is shown in Figure 6. It is evident from the Figure that the total specific surface area, total pore volume, and permeability of coal samples show a trend wherein they increase, then decrease, before increasing again, as the metamorphic degree increases. Regarding porosity, the trend shows that it increases, then decreases, before increasing again, as the metamorphic degree increases. The low degree of metamorphism is subject to less intense compression, the coal seam structure is relatively loose, and the porosity is significant. With the increase in the degree of metamorphism, the porosity of the coal seam gradually decreases. When the degree of metamorphism develops to anthracite, new secondary fractures are created, resulting in another increase in porosity. The statistical analysis of the test data shows that highlighting the pore structure characteristics of the coal seam makes it appear as having low porosity, which is not conducive to gas extraction.

4.3.2. Pore Size Distribution Analysis

The hole volume and specific surface area distributions of the coal and gas outburst mines in the coal samples were counted, and the results are shown in Figure 7. It is evident that the pore size distribution of coal and gas outburst mines mainly concerns micropores and pinholes, and the content of the mesopores and macropores is lower. The specific surface area and volume of the micropores are 46.24% and 81.67%, respectively, which is very beneficial to the adsorption of gas by the coal body, whereas the proportion of mesopores and macropores is only 29.26%, which is not conducive to the penetration of gas. The increase in the content of micropores and pinholes in coal and gas outburst mines in North China provides opportunities for a high concentration of coalbed methane accumulation, thus increasing the risk of a coal and gas outburst.
From the above analysis, it is evident that the gap development degree of coal and gas outburst mines is relatively low, and there is poor connectivity between the pores. The distribution of pores, mainly mesopores and macropores, provides good storage conditions for coal seam gas. A small number of micropores and pinholes reduces the gas seepage channel, making the gas content in the mine high and difficult to extract.

4.3.3. Fractal Characteristics of Pore Structures

Based on the modified mercury injection experimental data, for the scatter plot of Lg(dVp/dp) and LgP, with the slope of the curve noted as k, it can be concluded that the fractal dimension of the coal pore structure is D = 4 + K.
Through a statistical analysis of pore volume changes that occurred before and after matrix compression, it was found that the pore size distribution curves of each coal sample are roughly similar. The results of the data analysis within 0.124~413 MPa, for the mercury injection data derived from Equation (5), are shown in Figure 8. It is evident from Figure 8 that there are two obvious segments (D < 3 and D > 3) in the fractal curve before correction. The fractal curve before correction obviously shows a two-stage formula. The first half (micropore, pinhole), D < 3, indicates that the pore structure of this interval had fractal characteristics. The second half (mesopore, macropore), D > 3, of the pore structure of this interval did not have fractal characteristics. The overall performance of the corrected fractal curve is a line segment with good continuity. D is 2~3, and the overall pore structure had better fractal characteristics, and thus, it is possible to be more realistic about the authenticity of the pore structure of the coal samples. From Figure 8, it is evident that the degree of coal metamorphism has a significant effect on fractal dimension D. D increases with the increase in R0,max, indicating that compared with low metamorphic coal, high metamorphic coal has a more complex pore structure.
The fractal dimension can quantitatively reflect the pore structure and overall roughness of the coal. In accordance with the fractal theory, the fractal dimension of the coal sample needs to be 2~3. The closer the value is to two, the smoother the surface, the closer the value is to three, the rougher the surface and the more irregular the pore structure. The fractal dimension of coal has a certain relationship with the material content. The relationship between the average composition of the coal sample and the fractal dimension is shown in Figure 9. As is evident from Figure 9, fractal dimension D decreases as the moisture and volatile content increases. Water fills the pores on the surface of the coal, making the surface of the coal body smooth, resulting in a decrease in fractal dimension. It also increases the fixed carbon increases, and there is no obvious relationship with ash. With the increase in the degree of metamorphism, the internal pores of the coal body further change under the action of structural stress, forming more abundant micropores, increasing the surface area, and increasing the gas adsorption capacity. Compared with low gas mines, the coal and gas outburst mines have a more complex pore structure, a rougher surface, and they are more likely to accumulate free gas, which increases the coal and gas outburst risk of the mine.

5. Conclusions

Through the comparative analysis of the pore structure and fractal characteristics of coal samples with different occurrence conditions, this paper has obtained the following findings.
(1) Via a method involving mathematical statistics, the functional relationship between R0,max and Kc conforms to y = 1.59x−0.48. The matrix compression effect has an important influence on the results of the mercury compression experiment, the calibration error is 20%~85.09%, and the corrected mercury compression data should better represent the real pore structure of coal samples.
(2) The pore development degree of protruding mines is higher than that of non-outburst mines, and they are mainly microporous. The average pore volume and average specific surface area of the protruding coal sample were 41.71% and 23.09% compared with the non-outburst coal sample, respectively. The specific surface area and pore volume provided by the micropores for the outburst mine were 46.24% and 81.67%, respectively, which provided good conditions for gas agglomeration and it increased the risk of gas outburst.
(3) Compared with non-outburst mines, the metamorphic degree of coal and gas outburst mines is generally higher, the content of water and volatile matter in coal seams is reduced, and the content of ash and fixed carbon is increased. With the increase in buried depth, the in-situ stress of the coal seam increases, the pores in the coal seam gradually close, and the gas content in the coal seam increases.
(4) Fractal dimension effectively reveals the overall characteristics of the coal body. Compared with low gas mines, the fractal dimension of coal and gas outburst coal mines is higher, the tectonic effect is more obvious, the degree of destruction of coal bodies is higher, the pore structure is more complex, the surface is rougher, it is easier to accumulate free gas, and the coal and gas outburst risk of the coal seam is increased.

Research and Prospects

As this paper determines the relationship between the matrix compression coefficient and reflectivity based on mathematical statistics, due to the limited sample used, the empirical formula obtained inevitably has certain errors concerning the actual experimental data. Therefore, further improving the empirical formula, increasing the correction coefficient, and reducing the number of errors should be the main direction of future research. In practice, regarding engineering, by determining the pore structure of different scales in coal, combined with the CH4 adsorption capacity, the mechanism of action between pores of different sizes and CH4 adsorption is understood, so as to guide mine gas extraction and reduce gas outburst disasters.

Author Contributions

Conceptualization, Y.G.; Methodology, Y.G. and J.C.; Software, Y.G. and J.C.; Validation, S.Z.; Formal analysis, J.C. and S.Z.; Investigation, J.C.; Resources, Y.G.; Data curation, Y.G. and Z.L.; Writing—original draft, J.C.; Writing—review & editing, Y.G., S.Z. and Z.L.; Supervision, Y.G. All authors have read and agreed to the published version of the manuscript.

Funding

This study was Supported by Fundamental Research Program of Shanxi Province (202203021211160); Supported by Postgraduate Teaching Reform Project of Shanxi Province (2022YJJG039); supported by the National Natural Science Foundation of China (Grant No. 51804212/52004176).

Institutional Review Board Statement

Not applicable.

Informed Consent Statement

Not applicable.

Data Availability Statement

Not applicable.

Acknowledgments

We are grateful that this work is supported by the National Natural Science Foundation of China (Grant No. 51804212/52004176). We thank all the reviewers for their valuable comments.

Conflicts of Interest

We confirm that this manuscript is original and has not been submitted for publication elsewhere, and it is not under consideration for publication elsewhere. The authors declare no conflict of interest. We hope that this research paper can be accepted in Sustainability.

References

  1. Zhang, X.B.; Yan, J.W. Physical conditions and process of gas outburst coal formation. China Work. Saf. Sci. Technol. 2014, 10, 48–53. [Google Scholar]
  2. Li, C.; Wu, S.; Zheng, C.; Sun, X.; Jiang, X. Study on temporal and spatial evolution characteristics of overburden deformation and gas emission during the longwall working face initial mining phase. J. Geophys. Eng. 2022, 19, 534–549. [Google Scholar] [CrossRef]
  3. Zou, Q.; Liu, H.; Jiang, Z.; Wu, X. Gas flow laws in coal subjected to hydraulic slotting and a prediction model for its permeability-enhancing effect. Energy Sources Part A Recovery Util. Environ. Eff. 2021, 43, 1–15. [Google Scholar] [CrossRef]
  4. Cheng, Y.; Yang, L. Study on structural coal and the relationship between coal and gas outburst. J. Coal 2021, 46, 180–198. [Google Scholar]
  5. Xie, H. Research framework and anticipated results of deep rock mechanics and mining theory. Adv. Eng. Sci. 2017, 49, 1–16. [Google Scholar]
  6. Li, X.; Li, Z.; Zhang, L.; Gao, J.; Nie, B.; Meng, Y. Pore structure characterization of various rank coals and its effect on gas desorption and diffusion. J. China Coal Soc. 2019, 44, 142–156. [Google Scholar]
  7. Meng, Z.; Zhang, K.; Shen, Z. Analysis on the difference of methane diffusion performance between structural coal and primary structural coal. Coal Field Geol. Explor. 2022, 50, 102–109. [Google Scholar]
  8. Ren, J.; Song, Z.; Li, B.; Liu, J.; Lv, R.; Liu, G. Structure feature and evolution mechanism of pores in different metamorphism and deformation coals. Fuel 2020, 283, 119292. [Google Scholar] [CrossRef]
  9. Chen, Y.; Liu, R.; Wang, G.; Ma, J.; Wu, J.; Wang, P.; Wu, K.; Guo, X. Pore and gas desorption characteristics of primary coal with different degrees of metamorphism. Energy Sci. Eng. 2023. Early View. [Google Scholar] [CrossRef]
  10. Yu, S.; Bo, J.; Fengli, L.; Jiegang, L. Structure and fractal characteristic of micro- and meso-pores in low middle-rank tectonic deformed coals by CO2 and N2 adsorption. Microporous Mesoporous Mater. 2017, 253, 191–202. [Google Scholar] [CrossRef]
  11. Shao, P.; Wang, X.; Song, Y.; Li, Y. Study on the characteristics of matrix compressibility and its influence factors for different rank coals. J. Nat. Gas Sci. Eng. 2018, 56, 93–106. [Google Scholar] [CrossRef]
  12. Li, X.; Xue, H.; Chen, L.; Shen, Z.H.; Xu, M.; Xu, S.H. Microporous structure of outburst coal seams in Guizhou area and its influence on gas flow characteristics. Coal Sci. Technol. 2020, 48, 67–74. [Google Scholar]
  13. Zhang, J.; Hou, X.; Zhou, G.; Wang, Y.; Chen, L.; Fang, H.; Zheng, C. Quantifying and Controller Determination of Shale Matrix Compressibility: Implications for Pore Structure and Gas Flow Behavior Analyses. Nat. Resour. Res. 2023. [Google Scholar] [CrossRef]
  14. Yue, J.; Wang, Z.; Chen, J.; Zheng, M.; Wang, Q.; Lou, X. Investigation of pore structure characteristics and adsorption characteristics of coals with different destruction types. Adsorpt. Sci. Technol. 2019, 37, 623–648. [Google Scholar] [CrossRef]
  15. Chen, X.J.; Zhao, S.; Si, Z.X.; Qi, L.; Kang, N. Fractal characteristics of pore structure of coal with different metamorphic degrees and its effect on gas adsorption characteristics. Coal Sci. Technol. 2020, 48, 118–124. [Google Scholar]
  16. Zhu, J.; He, F.; Zhang, Y.; Zhang, R.; Zhang, B. Fractal Analysis in Pore Size Distributions of Different Bituminous Coals. Sci. Rep. 2019, 9, 18162. [Google Scholar] [CrossRef]
  17. Zhang, B.; Zhu, J.; He, F.; Jiang, Y. Compressibility and fractal dimension analysis in the bituminous coal specimens. AIP Adv. 2018, 8, 075118. [Google Scholar] [CrossRef]
  18. Jiancheng, J.; Miaofeng, Z.; Yaping, L. Geological background and structural deformation characteristics of coal bearing areas in China. J. Anhui Univ. Sci. Technol. 2009, 29, 1–8. [Google Scholar]
  19. GB40880-2021; Specification for Coal Mine Gas Classification Identification. National Mine Safety Administration: Beijing, China, 2021.
  20. ASTM. Standard Practice for Preparing Coal Samples for Analysis; American Society for Testing and Materials: West Conshohocken, PA, USA, 2007. [Google Scholar]
  21. ISO7404-5-1994; Methods for the Petrographic Analysis of Bituminous Coal and Anthracite. International Organization for Standardization: Geneva, Switzerland, 1994.
  22. GB/T 8899-2013; Determination of Maceral Group Composition and Minerals in Coal. CHINA NATIONAL COAL ASSOCIATION: Beijing, China, 2013.
  23. GB/T 21650.1-2008; Pore Size Distribution and Porosity of Solid Materials by Mercury Porosimetry and Gas Adsorption—Part 1:Mercury Porosimetry. Particle Characterization including Sieving other Sizing Methods and Sieves. The Standardization Administration of China: Beijing, China, 2008.
  24. Liu, L.L.; Cui, Z.H.; Wang, J.J.; Xia, Z.H.; Duan, L.J.; Yang, Y.; Li, T. Pore Size Distribution Characteristics of High Rank Coal with Various Grain Sizes. ACS Omega 2020, 31, 19785–19795. [Google Scholar] [CrossRef]
  25. Sun, B.; Yang, Q.; Zhu, J.; Shao, T.; Yang, Y.; Hou, C.; Li, G. Pore size distributions and pore multifractal characteristics of medium and low-rank coals. Sci. Rep. 2020, 10, 22353. [Google Scholar] [CrossRef]
  26. Wang, H.; Wang, Y.; Gao, S.; Cheng, J. Classification of low rank coal rank types by geophysical logging. Neijiang Sci. Technol. 2013, 34, 70–71. [Google Scholar]
  27. Li, W.; Bai, X.; Yang, J.; Chen, W.; Ma, W. Correspondence between mean maximum reflectance of vitrinite and classification of bituminous coals. J. China Coal Soc. 2006, 31, 342–345. [Google Scholar]
  28. Fu, H.; Tang, D.; Xu, T.; Xu, H.; Tao, S.; Li, S.; Wang, L. Characteristics of pore structure and fractal dimension of low-rank coal: A case study of Lower Jurassic Xishanyao coal in the southern Junggar Basin, NW China. Fuel 2017, 193, 254–264. [Google Scholar] [CrossRef]
  29. Guo, X.; Yao, Y.; Liu, D. Characteristics of Coal Matrix Compressibility: An Investigation by Mercury Intrusion Porosimetry. Energy Fuels 2014, 28, 3673–3678. [Google Scholar] [CrossRef]
  30. Han, B.; Qin, Y.; Zhang, Z.; Wang, G.; Yu, P. Study on compressibility of coal based on mercury intrusion test and correction of compressibility. Coal Sci. Technol. 2015, 43, 68–72. [Google Scholar]
  31. Jin, Y.; Zhao, M.; Liu, S.; Liu, X. Influence of coal matrix compression on pore fractal characteristics based on mercury intrusion method. China Coal 2018, 44, 103–109. [Google Scholar]
  32. Cai, Y.; Li, Q.; Liu, D.; Zhou, Y.; Lv, D. Insights into matrix compressibility of coals by mercury intrusion porosimetry and N 2 adsorption. Int. J. Coal Geol. 2018, 200, 199–212. [Google Scholar] [CrossRef]
  33. Li, W.; Liu, H.; Song, X. Multifractal analysis of Hg pore size distributions of tectonically deformed coals. Int. J. Coal Geol. 2015, 144, 138–152. [Google Scholar] [CrossRef]
  34. Zheng, S.; Yao, Y.; Zhang, S.; Liu, Y.; Yang, J. Insights into Multifractal Characterization of Coals by Mercury Intrusion Porosimetry. Energies 2019, 12, 4743. [Google Scholar] [CrossRef]
  35. Han, J.; Zhang, H.W.; Li, S.; Song, W.H. The characteristic of in situ stress in outburst area of China. Saf. Sci. 2012, 50, 878–884. [Google Scholar] [CrossRef]
  36. Chen, P.; Tang, X. Study on low temperature nitrogen adsorption method and micropore characteristics in coal. J. Coal 2001, 29, 28–30. [Google Scholar]
Figure 1. Advance and retreat mercury curve of coal samples with different gas grades. (a) Low gas mine, (b) high gas mine, and (c) coal and gas outburst mine.
Sustainability 15 12670 g001
Figure 2. Fitting curve of matrix compressibility with vitrinite reflectance. (a) Statistical data (The data point is Kc); (b) statistics after processing (The data point is Kc).
Sustainability 15 12670 g002
Figure 3. Comparison of cumulative mercury injections before and after the compressibility correction of typical coal samples.
Sustainability 15 12670 g003
Figure 4. Average burial depth and composition of coal samples with different gas grades (The histogram shows the average components and the ball shows the burial depth).
Sustainability 15 12670 g004
Figure 5. Average pore structure characteristic parameters of coal and gas outburst coal seams.
Sustainability 15 12670 g005
Figure 6. Relationship between the characteristic parameters of the pore structure and R0,max.
Sustainability 15 12670 g006
Figure 7. Distribution of pore volume and specific surface area of coal and gas outburst coal seams.
Sustainability 15 12670 g007
Figure 8. Double logarithm curve of a typical coal sample, dVm/dVp~P (The midpoint of the figure is dVm/dVp).
Sustainability 15 12670 g008
Figure 9. Relationship between the components and the fractal dimension. (a) Relationship between Mad and D; (b) Relationship between Ad and D; (c) Relationship between VMdaf and D; and (d) Relationship between FCd and D (The data point in the graph is D).
Sustainability 15 12670 g009
Table 1. Overview of coal sample collection sites.
Coal SamplesMineDepth
/(m)
Coal Accumulation PeriodGas GradeRank
1#Huolinhe Coal Mine, Inner Mongolia120Late Jurassic Early CretaceousLow gasLignite
2#Boertai Coal Mine, Inner Mongolia160Early Middle JurassicLow gasLong flame coal
3#luzigou Coal Mine, Shanxi Zhongneng260Carboniferous PermianLow gasGas coal
4#Guandi Coal Mine, Shanxi350Early Middle JurassicHigh gasLean coal
5#Fenxi Hexi Coal Mine, Shanxi360Carboniferous PermianHigh gasLean coal
6#Xinyu Coal, Shanxi380Carboniferous PermianHigh gasGas coal
7#Tashan Coal Mine, Shanxi400Carboniferous PermianHigh gasGas coal
8#Xinfeng Coal Mine, Henan436Carboniferous PermianCoal and gas outburstAnthracite
9#Baoan Coal Mine, Shanxi480Late Carboniferous PermianCoal and gas outburstAnthracite
10#Jiulishan Coal Mine, Henan500Carboniferous PermianCoal and gas outburstAnthracite
Table 2. Composition analysis and determination results of coal.
Coal SamplesMad/
(%)
Ad/
(%)
Vdaf/(%)FCd/(%)R0,max/
(%)
Skeleton Density/(g/mL)Porosity/
(%)
Permeability/(md)
1#8.964.8229.1157.110.421.472.648.87
2#8.964.8229.1157.110.521.4412.8716.97
3#5.2416.3430.5047.921.191.3013.455.71
4#3.889.9233.3252.880.651.245.6010.89
5#0.3617.7917.1964.660.691.376.3912.27
6#3.502.136.0388.341.511.234.0253.88
7#5.049.1017.8867.981.761.284.2410.40
8#0.9217.8615.3065.921.901.394.9238.22
9#2.0111.7817.9368.282.621.354.0814.08
10#1.418.588.0681.952.641.3712.8330.33
Mad: moisture content; Ad: ash content; Vdaf: volatile content; FCd: fixed carbon content.
Table 3. Compressibility and pore parameters of coal samples.
Coal SamplesKc/
(10−10 m2·N−1)
ΔV/
(6 nm~10 μm Uncorrected)
ΔV/
(6 nm~10 μm Corrected)
Error/
(%)
1#2.410.04910.007385.09
2#2.060.01290.006350.93
3#1.460.03940.015660.41
4#1.960.02110.005872.51
5#1.900.01190.002579.00
6#1.300.03550.017949.58
7#1.210.13500.108020.00
8#1.170.03060.009768.30
9#1.000.03280.010966.77
10#0.990.02160.004778.24
Table 4. Characteristic parameters of pore structure.
Coal SamplesTotal Pore Volume/
(10−2 mL/g)
Specific Surface Area/
(m2/g)
Average Aperture/
(nm)
1#1.2129.909.60
2#1.5442.3229.20
3#1.5810.125.50
4#4.5118.176.90
5#1.6314.5713.50
6#0.497.314.60
7#3.005.194.50
8#1.2724.3520.42
9#6.2825.4217.95
10#0.9017.6523.19
Disclaimer/Publisher’s Note: The statements, opinions and data contained in all publications are solely those of the individual author(s) and contributor(s) and not of MDPI and/or the editor(s). MDPI and/or the editor(s) disclaim responsibility for any injury to people or property resulting from any ideas, methods, instructions or products referred to in the content.

