Abstract
Climate change mitigation in energy systems has experienced a remarkable evolution over the past decades. In recent years, renewable energy and energy efficiency have made significant technological and deployment advancements, spurred by policy support, technology development, and cost reduction. Despite advancements in the concepts of innovation and sustainability transition, policy mix studies face challenges in policy regarding the process of energy transition. In fact, there is a need to deepen knowledge of many relevant transition policy design dimensions in order to address unresolved questions about why policymakers choose some instruments over others in the context of an existing or desired mix, how specific policy instruments operate in a mix that has a direct impact on policy performance, and how the transition policy can be evaluated in terms of achieving the desired outcome of CO2 reduction. In an attempt to conceptualize a policy design for energy transition, this research develops a conceptual framework consisting of a policy chain in energy transition from economic and innovation perspectives. This chain has five links, corresponding to policies supporting decarbonization, transformation, renewable energy deployment, energy saving, and CO2 emissions. A consistency analysis of the sub-indicators using data from ten leading European countries was performed, and the reliability of four links, excluding energy saving, was confirmed. The economic and innovation perspectives of the developed framework, which are aligned with the reliability analysis of each index of the framework, answer the question posed in this paper regarding actual features in energy transition. A complete energy transition requires economic signals and a fiscal system (Link1: supportive policies of decarbonization) that are aligned with all of the policy contributions in terms of strategic investments for technology development (Link2: transformation and technological development). Energy policy schemes, including taxation, subsidization and RD&D in technology related to climate change mitigation, increase motivations for alternative energy exploitation (Link3: RE deployment), which adds to the advance actions by individuals and firms in terms of energy saving (Link4), all of which combine to result in a change in greenhouse gas emissions (Link5: CO2 emission).
1. Introduction
Mitigating climate change in accordance with the Paris Agreement protocols necessitates an energy transition in the electricity, transportation, heating, and cooling sectors. This energy transition must substantially reduce the intensity of CO2 emissions by at least 85% between 2015 and 2050. According to the data, an average annual decrease in CO2 emissions of 2.6% is required to reach this goal [1].
These changes necessitate the implementation of national and governmental policies that are consistent with the market participants who invest in low-carbon carbon sectors [2,3].
In this regard, a comprehensive policy chain for the energy transition should be designed to span a wide variety of sectors, including the energy systems sector, the supply sector, and the demand sector [4].
Given that governance policies with such a broad scope are inherently complicated, uncertain, and challenging to manage, scholars and practitioners are moving beyond the narrow scope of single-policy instruments and achieve building consensus on the necessity of combinations of policy instruments [5].
Recent policy mix studies have indicated that the indirect linkage between policy instruments and their outcomes, as well some external limiting factors, place a greater emphasis on the essence of policy design and an efficient and successful energy transition [6].
By definition, policy design consists of the adoption of policy instruments to achieve a set of objectives, and tries to answer the main question as to which actual policy design characteristics must be adopted to achieve the desired results and the ways in which governments steer their policy systems by adopting specific sets of policy tools [7,8].
Existing studies on policy mixes lack consistent terminology and fail to define the policy design that interlinks policy instruments and policy outcomes [5,7,9,10]. Indeed, this research attempts to answer the following questions:
What are the main links of the conceptual framework in the energy transition policy chain from innovative and economic perspectives? What are the main sub-indicators of each link? How do the supportive policies influence the progress of energy transition? What are the results of reliability testing of each of the links in the conceptual framework?
Therefore, this research fills these gaps. It focuses on the gaps identified in the development of a comprehensive, uniformly defined policy design concept. The innovation of this research lies in the newly proposed conceptual framework for the policy chain of energy transition for examining the link between a mix of policy instruments and policy outcomes. Then, we imply a reliability test using the observable variables of selected EU countries, which makes it easier to conceptualize the consistency of the defined indexes within the conceptual framework provided (Figure 1).
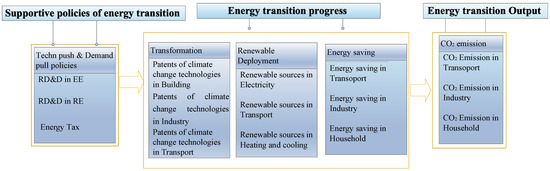
Figure 1.
Conceptual framework of energy transition policy chain (proposed by the authors).
The remainder of this paper is structured as follows: Section 2 reviews the policy instruments and policy mix typologies. Section 3 describes the conceptual framework. Section 4 discusses the research design and methodology. Section 5 provides the results of the statistical analysis. In Section 6, the results and the prospective solutions are discussed, and Section 7 concludes the paper.
2. Literature Review
2.1. A classification of Policy Mix Instruments
Experience has shown that an energy transition takes a long time, typically half a century, from the initial adoption of niche innovations to renewable energy sources having a majority market share [1]. Based on the experiences of different industrialized countries’ energy transitions, national strategies in the early stages were limited to restricted innovation programs such as R&D and technological improvements. At the second step, economic policy in broader transition processes represented policies to support broad innovation systems, such as SMEs, start-ups, and user-driven innovation, whereas societal policies in a broad innovation scope led policies in such a way that a wide range of actors, activities, and modes of innovation were involved [11,12]. After reviewing recent research on policy mixes for sustainable energy transitions and identifying some key themes, it is concluded that energy transition modelling includes frameworks that characterize the interaction between policies, energy infrastructure, market behavior, supply stability, and environmental factors [13,14].
In the Netherlands, for instance, the energy transition manager was a ministry of economic affairs responsible for preparing the conditions for bringing private, individual, and public sectors together to create a new energy transition system [15].
While, in the evaluation of policy mixes, the key questions are how to compare policy instruments across time and policy fields and how specific instruments directly impact policy performance, the characteristics and effects of policy mixes are also pending matters that require a deeper level of knowledge [7,15].
There are two main considerations in defining the policy mixes of the energy transition. The first is the essence of transition. Transition concerns climate change or resource scarcity, which are characterized by technological, economic, socio-cultural, and institutional changes [16,17]. The second challenge relates to the researchers studying policy mixes and confronted by a trade-off in interpreting an inventory of policy mix elements. Incorporating too many potentially irrelevant elements leads to complicated, inefficient, and hard-to-interpret results. Conversely, analyzing too few or inappropriate elements leads to an omitted variable bias or an over-simplistic image of real-world policy mix instruments [18,19,20].
In a study by Susana Borrás (2013), instruments were divided into three different categories, including regulatory, economic, and soft instruments. For the interactive relations in the market and social entities, regulatory instruments are adopted, while fiscal and price-based policies in the economic category incentivize policies to move forward with social and economic measures. The last category of soft instruments is voluntary and non-coercive activities such as campaigns, codes of conduct, recommendations, and public–private partnerships [21,22].
In another study by Schulz (2021), using the IEA’s canonization of policies, hard and soft policies have different categorizations compared to Susana Borrás’s definition. Hard policies include codes and standards, carbon-trading mechanisms, and taxes and monitoring schemes, while soft policies include subsidization, grants, R&D, information, and education tools [23].
The complex characteristics of socio-technical transition require balanced thinking. This means that, instead of thinking based on the best type of instrument, one should think about balancing the strengths of different instruments across a complex mix [24,25].
With regard to analyzing the relationship between the design of policy mixes in economic regulation and innovation strategies for the energy transition, we have reviewed the literature on regulation design to determine which policy instrument has the strongest effect. A growing number of studies in various fields of transition studies use the concept of mixes of policies or innovation policies to analyze the impact of different packages of policies on renewable energy diffusion [26,27].
More recently, Erik Hille (2020) focused on regulation design and intensity for a large sample of 194 countries to determine which policy instrument had the greatest impact on renewable energy diffusion. Their results initially suggest that more comprehensive support policies of renewable energy lead to more patent-related activities in solar and wind power plants. Their analysis also approved the strongest inducement effect of RD&D programs, targets, and fiscal incentives in renewable energy diffusion [28].
A recent study by Johnson (2010) used panel data from 25 countries and examined the effect of innovation policies on the diffusion of renewable energy. The evidence from this research showed that market-based regulations, including green certificates, made renewable energy diffusion more attractive [29].
The results indicated that public spending on R&D is the primary factor in renewable energy innovation. In addition to public R&D expenditures on specific renewable technologies, Peters (2012) and Dechezlepretre and Glachant (2013) demonstrated that domestic and international demand-pull policies, such as production tax credits, will initiate the transition to renewable energy [30,31].
In the studies of Bohringer (2014), which examined the effect of remuneration policies on Germany’s renewable energy, and Palage et al. (2019), which examined the empirical content of solar PV in 13 countries since the late 1970s, tech-push policies, such as public R&D, and demand-pull policies, such as FiT, are regarded as some of the most important policy variables in public policy to RE deployment [32,33].
According to the cross-country studies conducted by Walz (2011), the stability and legitimacy of a green policy environment will encourage more wind power patenting. Peñasco, 2021 determined that direct government investments, subsidization of renewable energies, and carbon pricing are the most supportive policies that can help to mitigate the negative effects of various types of regulatory and economic decarbonization policies [34,35].
In a series of studies on the comparative nature of policy tools, various instruments’ effects on policy outcomes were assessed.
The research of Nicolli, 2017 analyzed the exact amount of monetary policy in the five largest European countries and the impact of granted tariffs on the installed capacity. The precise result was that every 1 percent increase in tariff leads to a 0.4–1% increase in renewable generation [36]. In some studies, the influence of some policy tools has been highlighted as a result of the comparative approach among policy packages. For example, Palagi et al., 2019 found that public RD support has more influence than FIT and REC schemes in promoting solar PV innovation [20,32].
Yet, in the context of sustainable energy, a transition policy mix is needed which goes beyond this narrow scope of measuring policy output, mostly as measuring the number of policy instruments. The transition policy should address specific problems or compare policy impacts in different mixes of instruments in the energy efficiency of renewable energy diffusion [24,37].
2.2. Policy Mix Typologies
The research on the energy transition draws on a variety of sources, ranging from public policy studies to environmental economics, innovation, and transition studies. Each scholar has their own interpretation of what constitutes a policy mix and how key terms should be defined [38,39] (Figure 2).
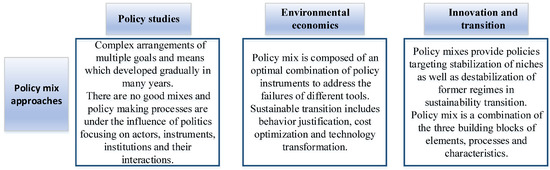
Figure 2.
Different scholars’ approaches to policy mix studies.
Economists are increasingly focusing on R&D and patents as indicators of the energy transition. They identify market barriers, with a focus on profitability and return on investment, and make policy recommendations to address such issues. However, the roles of the invisible agenda, such as informal institutions, norms, and cognitive routines, are undervalued [40]. In environmental economics, policy mix analyses are comprised of the optimal combination of policy instruments that address the failures of adopting different tools and the complementary or supplementary nature of such instruments [41].
This calls attention to one field of policy mix research, mostly within economics, which has focused more on the interaction between multiple policy instruments that are primarily supportive of one another rather than antagonistic.
As specified by Grubb (2017), the portfolio of policy tools for sustainable development comprises three domains. The first domain is concerned with the influence of behavioral economics and social characteristics on the deployment of cost-effective technology. This domain characterizes the “satisfying” behavior of any technology deployment, beyond cost–market components. For instance, consumers should be able to satisfy energy efficiency measures on their own or through organizational arrangements [40].
The second domain characterizes neoclassical economic principles in terms of optimizing behaviors. In this domain, consumers and agents evaluate decisions based on cost minimization and benefit maximization. Innovation occurs through the “innovation possibilities frontier” and is limited to the existing infrastructures and institutions. Policy instruments have a tendency to relate justifiable market prices to direct market externalities and failures [40,42].
The third domain utilizes innovation systems to define evolutionary and institutional change. This domain encompasses the roles of formal and informal institutions, infrastructures, and technological innovation. This part embodies longer time scales (decades or more) and broader contributions from national-level decision makers and governments [40,43].
The interdisciplinary field of innovation studies is interested in the role of policy combinations in fostering technological innovation. Some of the literature in this field concerns the design features of individual instruments in the mix [44], the building blocks of the policy mix [5], and the overall characteristics of mixes [45] and policy processes [46].
While environmental economics pay more attention to traditional market failures, such as underinvestment on R&D or the negative environmental externalities of greenhouse gas emissions for policy interventions, innovation studies place great emphasis on structural and transformational system failures, such as institutional failures or failures regarding the direction of transformation.
Public policy studies examine the relation of both goals and instruments. An important question in this field is the evolution of policy mixes and the processes by which such changes happen.
In the public policy literature, policy mix interactions are defined as complex arrangements of multiple goals and means which developed gradually over many years. According to this view, policies developed in a haphazard way rather than being consciously designed by policy makers [45]. From this point of view, there are no good mixes of instruments and policy design under the influence of politics focusing on actors, instruments, institutions, and interactions [47,48].
3. Policy Chain of Energy Transition: Problem Definition and Conceptual Framework
Overall, these three academic fields (economics, innovation, and public policy studies) have determined that a single instrument is insufficient for the energy transition and that a combination of innovation and economic stimulus could respond to a comprehensive market and policy design [2,49].
These instruments are commonly deployed in bundles, mixes, and portfolios, which may have counterproductive, complementary, and interactive effects [7].
According to the core of this research on policy design, it is necessary to comprehend the portfolio of policy tools and their interactions.
In an attempt to define the policy of energy transition, this paper complements the existing literature by proposing an analytical framework, adopted from Grubb’s economic conceptualization to supplement the existing literature [40]. Grubb’s framework was combined with the innovation and policy studies in energy transition to develop a five-link conceptual framework for the policy chain of energy transition.
The links are as follows: supportive policies of decarbonization, transformation of technologies (patents), renewable energy deployment, justification of reduced energy consumption (energy saving), and CO2 emissions.
The essence of this framework is described as economic decision makers utilising “market-pull” policies, including energy taxes, carbon pricing, and regulations, to optimize the costs and benefits of market and industry investors. Moreover, “technology-push” policies, such as R&D grants and tax breaks, create methods of motivating new technology and innovation investments and incentives for private R&D and technology transformation. Optimization increases awareness of energy waste and justifies energy saving alongside carbon-free renewable sources [40]. Figure 1 presents an illustration of the framework.
3.1. Link1: Supportive Policies of Energy Transition
The policy chain of the energy transition applies a wide scope effect of short-term policies in the market and grid stability together with long-term policies on the climate change and decarbonization strategies in accordance with non-energy market changes [50].
Such a problem-oriented nature of energy transition substantially calls for mixes of policy instruments. For instance, R&D support policies, internalization of negative externalities, and information-related policies could be combined to strengthen niche actors and destabilize regime actors [25,51]. A network of technology-push and market-pull policies supports the major energy consumer sectors, including industries, transportation, building, and households. Energy consumers develop from curiosity and niche innovations to diffusion and consumption as the market matures [52]. Technology-push policies, such as RD&D grants, loans, and tax incentives, are strongly deduced from strategic investments and are typically founded by the public sector [53].
In the same way, the degree of certainty of future development, combined with positive government incentives, encourages private sectors or large corporations to make strategic investments [54,55].
The earliest phase of energy transition is essential for new inventions from R&D-based organizations to contribute to new marketable productions. Hence, managerial skills, interaction with the private sectors, and linkage to other supply chains will be required to transform technology into a product and a business [54,56,57].
At this stage, demand-pull policies such as standards and regulations can be linked to the organisation of new structures and the development of the initial customer base. Regulations are designed to encourage the adoption of consumption behaviours in various sectors, particularly for incumbent products with new technologies [58,59]. As technologies approach the market, however, barriers such as incumbent interests and regulatory complexity prevent the rapid expansion of new technologies, and more time is required to reform market design and energy consumption adaptation regulations [40,60]. In this regard, energy subsidies resulting from taxation measures and affecting the effective tax rate support the entrants of the energy transition. Therefore, we refer to all of these policies as Governmental Level of Support: market-pull and technology-push policy mix instruments for the energy transition.
3.2. Link2: Transformation or Technology Development
Increasing the share of R&D spending accelerates technological advancement and subsequently reduces the costs of new technology combined with novel applications and deployment [61].
The implementation of market-based policy instruments, such as taxes and tradable permits, is more likely to result in technological innovation in comparison to direct environmental policy tools such as technology-based standards. The main reason for this principle is that market-based instruments enable firms to employ the most efficient methods to attain environmental targets. Costantini et al. (2015) found that a balance between market-pull and technology-push policies creates strong incentives for the patenting of technologies rather than imbalanced policy instruments [62,63].
The research of Bettencourt (2013) shows that patents continue to increase despite the relatively modest R&D expenditures of companies, thereby validating the significance of public R&D funding in driving innovation activities in various stages of technological maturity and market development [64], in spite of the fact that, from 1990 to 2010, increasing energy prices were a major incentive for the explosion of patents in low-carbon technology in fossil fuels, alongside PV, wind, and biofuel patents; batteries; and electric vehicles [65,66].
Patents are an indicator of innovation and technological changes. So, in this framework, we represent this second link with patents in climate change technologies.
3.3. Link3: Renewable Energy Deployment
In comparison to other technology sectors such as IT or medicine, the production process in the energy and electricity sectors takes a long time to implement. Some wind and solar power plant demonstration phases can last up to ten years or more.
As a result, variations in the energy sector are typically difficult, and aside from incremental improvements for traditional generation, radical innovations necessitate government intervention [67].
In this regard, tax expenditures in various forms of energy subsidization of the power market, including FiTs, along with strong R&D programs focusing on leading beneficial technologies in the power industries, significantly advanced the supply chain and power industries [40]. The economic incentives provided by FiTs, which usually fix the price for 10–20 years, especially when it comes to pricing and emission targets, captures the level of certainty of investors and encourages more patenting and innovation in renewable energy [5,54]. For instance, the German EEG increased the installation of wind and solar power plants by guaranteeing investors payment for twenty years [2,68].
3.4. Link4: Justification of Less Energy Consumption
Reaching the energy transition goals requires the acceleration of energy efficiency enhancement and replacing the fossil fuel energy sources [69,70].
Whilst tech-push policies drive technological transformation in the energy sector, the challenge of consumer product differentiation remains. This means that new technology produces the same product as incumbent technology (electronic). Therefore, the strategic market-push and demand-pull policies for rising demand in current markets are necessary [54,71].
Big private investors and other entities in industry and electricity generation evaluate the costs and benefits of incumbent equipment and new efficient technology substitution, resulting in cost reduction and energy saving; for example, different fuels for power generation and low-grade heating forms in buildings [40,57].
So, the justification of reduced energy consumption referred to energy saving is a proxy for to what extent the supportive policies result in energy savings and satisfied energy consumers in industry, households, and transportation for adopting their behavior in the consumption of new efficient technology.
3.5. Link5: CO2 Emission
There are many ways of generating energy. Coal is the primary source of energy for heavy industries and power generation, which accounts for around 40% of total GHG emission [72]. Natural gas is an additional energy source for power generation in electricity production and heating buildings. However, natural-gas-generated electricity emits half as much carbon dioxide per unit of electricity produced as coal-fired resources [73].
Due to the fact that natural gas consumption accounts for a fifth of total CO2 emissions, the proportion of natural gas in electricity generation has increased, and this period has been called the “Golden Age of Gas” [74]. By increasing policy support in a growing number of nations, technologies have advanced and the cost of technology has consequently decreased. Thus, renewable energy and energy efficiency have advanced, resulting in a decrease in CO2 emissions.
4. Materials and Methods
4.1. The Energy System
In this research, energy systems were broken down into three main categories based on energy consumption in the three sectors of building, industry, and transport. Energy generation is entirely based on three main resources, ranging from the high-CO2-emission-based resources of burning fuels such as coal and oil to moderate and zero-carbon emission resources, including gas, renewable, and nuclear energy [40,46]. To reach overall GHG emission reductions, key policy strategies focused on energy technology on both the supply and demand sides. The supply-side technologies mainly focus on energy transformation technologies, including power, heat, biofuels, and hydrogen, while the demand-side technologies are categorized into three major energy consumer sectors, including transportation, industry, and buildings or households [38,72].
The building sector represents 30% of total energy demand, ranging from heating for space and warming water, which is supplied by natural gas, together with the ever-growing electricity consumption of home appliances, lighting, and other electronic gadgets [40]. In the industry sector, total energy consumption accounts for 30% of total energy demand, while 40% of global CO2 emissions are produced by this sector. In addition to global consumption of gas and electricity across industry, coal is the predominant fuel used in heavy industries and is categorized as the most carbon-intensive fuel. Approximately 40% of global energy consumption is attributed to the transportation sector, making it the most energy-intensive sector. Commercial transportation is primarily fueled by oil refined into gasoline or diesel, along with extensive petroleum consumption in the agricultural sector [75,76].
4.2. The Process of Data Selection
In this study, the process of country selection was determined by the aggregation of two characteristics. The first feature was according to the IRENA survey of the leading European countries in terms of renewable energy development. Those countries that adopted energy transition policies, whether through technology-push or demand-pull instruments, achieved the top rankings in renewable energy development [27].
The second feature is related to the scores of European countries in the environmental sustainability indicator at the trilemma index that is introduced by World Energy Council [77]. Environmental sustainability index assesses the success of nations in decarbonization policies in terms of renewable energy development as well as energy efficiency measurements.
Overall, the European countries with common specifications in these two main features were chosen. The selected countries were: Austria, Denmark, France, Germany, Italy, the Netherlands, Portugal, Spain, Sweden, and the UK. The time period of the data analyzed was within 2006 and 2019.
4.3. Data and Content for the Framework Test
Some international organizations and national energy agencies provide access to data and information regarding government policies and climate change mitigation measurements for energy transition. This research utilizes the most recent versions of international energy databases, including the IEA, IRENA, Eurostat, Enerdata, and the OECD.
In accordance with this paper’s conceptual framework (Figure 1), sub-indicators for each link in the framework are presented in this section.
4.3.1. Supportive Policies for Energy Transition Link: Energy Tax and RD&D
An energy tax is regarded as a physical unit of something that has an external effect on the environment and is restricted to specific items in the energy sector [39].
One of the four environmental taxes is measured by the energy tax indicator. The other parts of environmental taxes are pollution taxes, resource taxes (excluding taxes on oil and gas extraction), and transport taxes [78]. The energy tax is raised from seven paying sectors: households, industry (except construction), construction, wholesale and retail trade and repair of motor vehicles and motorcycles, transportation and storage, services (except wholesale and retail trade, and transportation and storage), and agriculture, forestry and fishing (Energy taxes by paying sector, 2022 [39]).
Carbon dioxide taxes are also included in energy taxes. CO2 tax under the EU ETS scheme is a cap and trade plan and incentivizes companies to reduce carbon emissions. It applies a carbon price mainly on emissions coming from 11,000 power generation sectors and energy-intensive plants, as well as airlines. Emissions from these sectors cover around 45% of the EU’s greenhouse emissions [79,80].
RD&D budgets are calculated by identifying all the budget items involving RD&D and measuring or estimating their RD&D funding content [81]. These budgets are allocated for innovation in technology development and cost reduction in renewable energy deployment. These data also emphasize the importance of energy-efficient appliances and equipment for reaching net-zero emissions in buildings, industry, and transportation [79,80,82].
4.3.2. Transformation: Patents of Climate Change Technologies
Technological innovation can occur at all stages of the technology lifecycle, ranging from basic technology inventions and improved development and demonstration (RD&D) systems to a mix of various demand factors, technology supply factors, and enhanced market development [83].
Since 2012, the International Renewable Energy Agency (IRENA) has viewed Intellectual Property Rights (IPRs), especially patents, as a means for the support of technological innovation. This research uses patent data extracted from the IRENA database related to the three sectors of industry, building, and transportation. Patents of transportation are represented by electromobility technologies, hydrogen, smart grids, biofuels, and energy efficiency. In parallel, patents in industry include biofuels, CCUs, energy efficiency, fuel from waste, energy storage, cross-cutting, energy efficiency, and technologies. Patents in the building sector include energy efficiency, fuel cells, heat pumps, hydropower, PV, PV–thermal hybrids, smart grids, and solar thermal and wind energy [84].
4.3.3. Renewable Energy Deployment
One of the most prominent solutions for decarbonization in the energy sector is the growth of renewable energy share in total energy consumption in heating and cooling, transportation, and electricity generation.
Synthetic fuels of renewable origin in all modes of transportation, hydrogen of renewable origin, renewable electricity, and compliant biofuels (liquid and gaseous) in all modes of transportation comprise the share of RE in transportation.
Gross electricity production from hydropower, wind power, pure bioliquids, blended bioliquids, biogases, biogases blended in the natural gas grid, geothermal, solar (photovoltaic and thermal), tide, wave and ocean, renewable municipal waste, and solid biofuels (solid biomass) comprise the total share of electricity generation from renewable sources in electricity.
The aggregated forms of renewable energy in heating and cooling are the final energy consumption of renewable energies other than electricity; heat and bioliquids in sectors other than transport; the share of biogas blended in the natural gas network applied to derived heat produced from natural gas; renewable energy from heat pumps; derived heat produced from geothermal, solar thermal, renewable municipal waste, solid biofuels, and biogas; and derived heat produced from compliant bioliquids [85].
4.3.4. Justification of Reduced Energy Consumption: Energy Saving
Energy-saving factors are derived from ODEX, which is the ratio between the actual energy consumption (E) of the sector in year t and the actual energy consumption (E) without energy efficiency improvement. (i.e., without energy savings (ES)):
ODEX = (E/(E + ES)) ∗ 100
Energy saving in industry includes reductions in the energy consumption of chemicals, food production (beverage and tobacco), textile (and leather), wood, machinery (and metal products), transport vehicles and other manufacturing equipment, etc. Meanwhile, energy saving in households refers to the amount of energy saved for heating, cooking, water heating, and large electrical appliances, including cooling and lighting. Transportation energy consumption, which includes automobiles, trucks, light vehicles, motorcycles, buses, domestic air transport, rail, and water transport, has a positive correlation with industry savings [86].
4.3.5. CO2 Emissions
For recognizing related environmental issues, the data of CO2 emission stemming from burning fossil fuels in the forms of solid, liquid, and gas fuels, in addition to gas flaring, have become an essential tool for policy analysis.
CO2 emissions in this study were sourced from the three main energy-consuming sectors of transport, industry, and household. Industry is the sector with the greatest emissions, responsible for more than 40% of global emissions in 2019, while transport-related emissions represent 27%. Emissions in the building sector represented 25% of global emissions [87].
4.4. Method
Reliability and correlation analysis are the most accurate methods for determining the acceptability of a new conceptual model. These tests are more important when it comes to strategic planning for long-term, global, and comprehensive policy decision making, such as in terms of energy policies [77].
Specifically, variance analysis deals with deviations and is a process of identifying the causes of variation. The variance analysis of selected variables determines the fluctuations and consequently what is related to the deviations. So, it is important to check the interconnection of variables at the beginning of the analysis. Pearson’s correlation coefficient is a measure of the strength and direction of a linear association between two variables without any causality assumption. It is based on the covariance method and obtains amounts in the range of −1 and 1, where −1 shows a completely negative relation while +1 stands for a completely positive relation [88].
The reliability test measures the internal consistency of multiple items which construct the same concept [89]. The alpha coefficient reports the extent to which items of a structure correlate each other. Indeed, the statistics estimate the systematic variance among a set of item variables and how a close set of items are related in a group [90].
In this research, the reliability and correlation tests of the policy chain of energy transition were applied using the Pearson correlation test and reliability test of Cronbach’s alpha. These allowed us to determine how the set of sub-indicators in any index (each link of the framework) assess a single unidimensional object of the framework [77].
Statisticians in human dimension research identified an acceptable range of Cronbach’s alpha from 0.65 to 0.7 or above. Studies show that the alpha coefficient increases as the number of items or indicators in the index increase [77,90].
To easily compare results within a data set and for precise interpretation, data reorganizing in database is needed. Normalization formula is a useful statistical method to create a common scale for a large amount of different data with different values. While in this study, the data have different ranges with various dimensions, to easily compare the results of the reliability test, all data were normalized according to this formula. The normalization formula in this research is:
Standardized value = X − μ/σ
5. Results of Statistical Analysis
The correlation analysis shows an association between individual indicators. First, it is necessary to determine whether all three indicators are an essential part of one index.
- 1.
- The results of supportive policies show that three indicators of support policies have a positive and relatively strong linear relationship (Table 1, Figure 3).
 Table 1. Supportive policy index: correlation and Cronbach test (Primary data extracted from [91]).
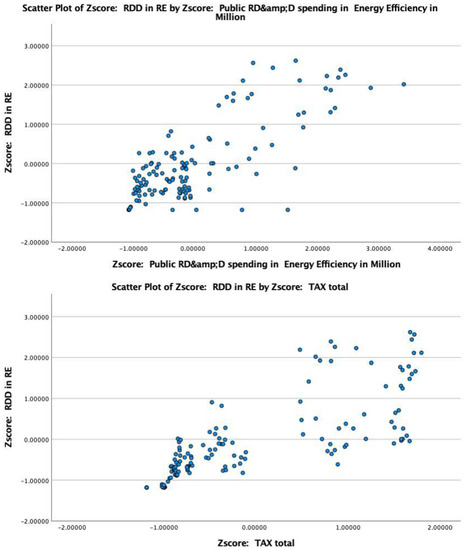
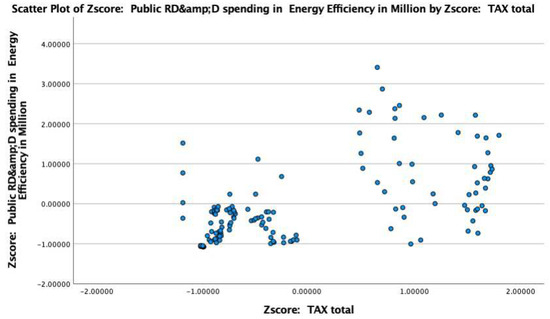 Figure 3. Supportive policy index: correlation scatter plot.
The Cronbach’s alpha (0.872) for the supportive policies index represents the fact that the identified variables of RD&D in RE and energy efficiency alongside energy tax behave in the same way and are closely related as a set of indicators of supportive policies of decarbonization.
- 2.
- The results of transformation index analysis show significant and positive correlations between all three indicators of this index, meaning that all the sectors have similar patterns in technology development (Figure 4 and Table 2).
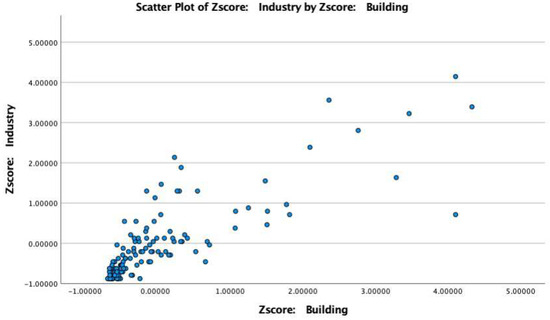
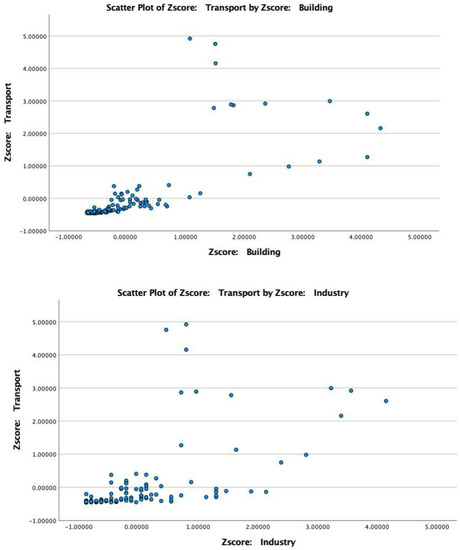 Figure 4. Transformation index: correlation scatter plot.
Table 2. Transformation index: correlation and Cronbach test (Primary data extracted from [92]).
Figure 4. Transformation index: correlation scatter plot.
Table 2. Transformation index: correlation and Cronbach test (Primary data extracted from [92]).
For the transformation index, the Cronbach’s alpha of 0.884 shows the strong consistency, to some extent, that patents in technology climate change mitigation construct the transformation index.
- 3.
- The correlation analysis of RE deployment shows an altogether positive relationship. The share of renewables in all three sectors shows a high degree of dependency among the indicators (Figure 5 and Table 3).
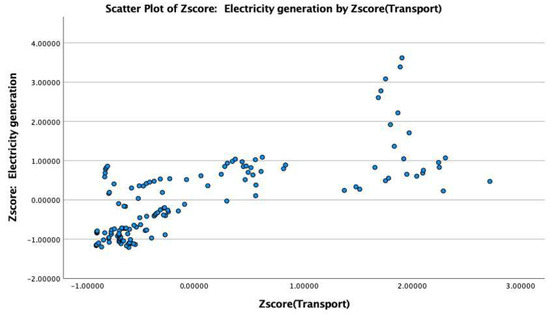
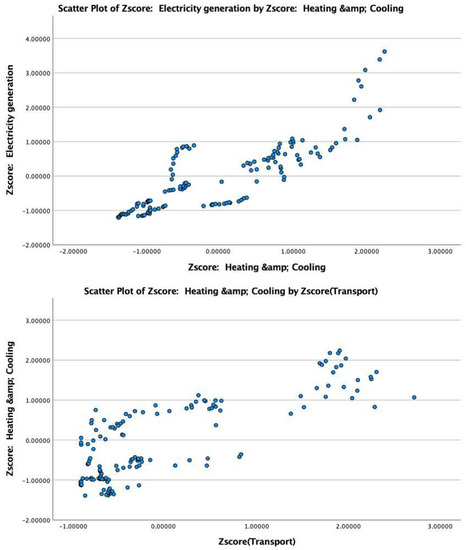 Figure 5. RE deployment index: correlation scatter plot.
Table 3. RE deployment index: correlation and Cronbach test (Primary data extracted from [93]).
Figure 5. RE deployment index: correlation scatter plot.
Table 3. RE deployment index: correlation and Cronbach test (Primary data extracted from [93]).
For the RE deployment index, the Cronbach’s alpha of 0.92 demonstrates the fact that the applied indicators of heating and cooling and electricity are consistent and relatively sufficient for the construction of RE deployment.
- 4.
- The results of justification for reduced energy consumption (energy saving) has found that energy saving in industry and household, as well as in industry and transport, shows positive and significant correlations. In contrast, energy saving in transport and household shows a very weak and even negative correlation: −0.153 (Figure 6 and Table 4).
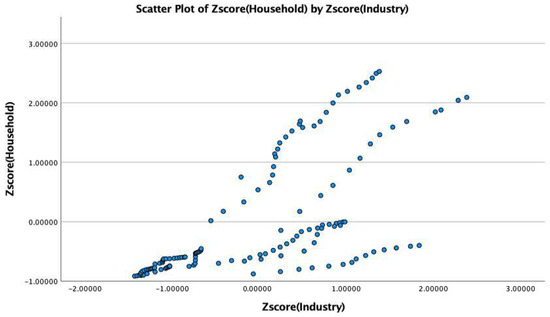
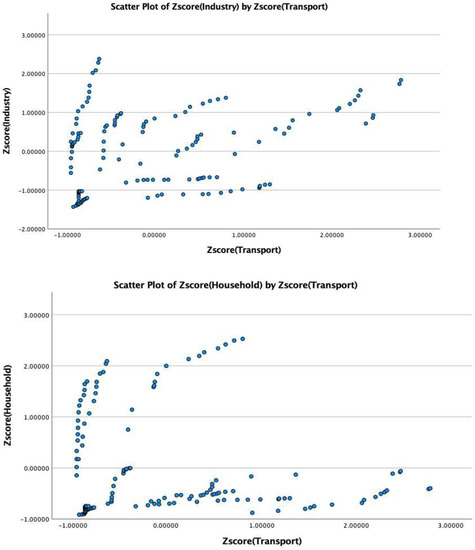 Figure 6. Energy saving index: correlation scatter plot.
Table 4. Energy saving index: correlation and Cronbach test (Primary data extracted from [94]).
Figure 6. Energy saving index: correlation scatter plot.
Table 4. Energy saving index: correlation and Cronbach test (Primary data extracted from [94]).
For this index, the reliability test was not accepted and it seems that these factors are not consistent for representing the energy saving index, since the Cronbach’s alpha result is below 0.6.
- 5.
- The results of CO2 emission show positive relationships in all sub-indicators. The Cronbach’s alpha based on standardized items of 0.96 demonstrates that the applied sub-indicators are consistent with the construction of this index (Figure 7 and Table 5).
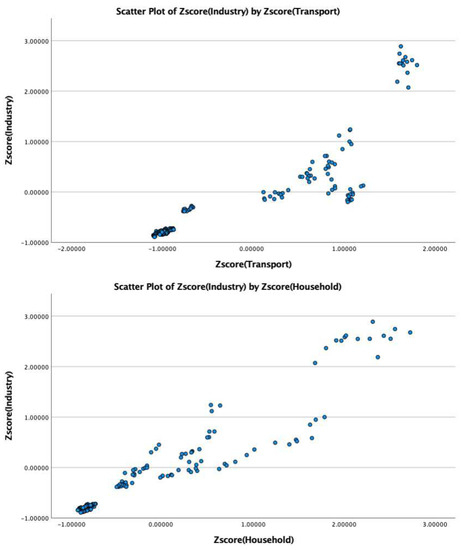
 Figure 7. CO2 emission index: correlation scatter plot.
Table 5. CO2 emission index: correlation and Cronbach test (Primary data extracted from [95]).
Figure 7. CO2 emission index: correlation scatter plot.
Table 5. CO2 emission index: correlation and Cronbach test (Primary data extracted from [95]).
6. Discussion
6.1. Link1: Supportive Policies of Energy Transition
Simple economic principles point to energy prices and energy taxes as important instruments for tackling climate change and the external cost of energy consumption [40,94].
Tax rates, mainly on oil products and energy consumption, showed an increasing rate of 29% from 2008 to 2018 and accounted for 77.2% of EU environmental tax revenue in 2020, or EUR 231.6 billion of EU GDP [95].
As a main source of a nation’s income, energy taxes provide additional incentives for changing consumption behaviors. In the meantime, energy taxes have a greater impact on electricity prices and consequently motivate the search for substitutes of energy resources as well saving in energy consumption [96].
As a solution for the substitution of energy sources, expenditures on the research development and deployment of renewables and efficiency schemes should be included in public budgets which are financed by overall taxes. Energy taxes and R&D subsidies restrain carbon-intensive industries through the fuel mixes in the energy consumption and energy efficiency measures [97]. Consequently, it can be argued that the index of supportive policy of decarbonization has meaningful consistency, whereas energy taxes and expenditures motivate the RDD in RE and energy efficiency.
6.2. Link2: Transformation or Technology Development
Around 5% of the total budget of R&D in the EU is dedicated to the energy sector. Incentives such as tax reduction, carbon pricing, and feed-in tariff payments increase the propensity to invest in the technological development of the energy sector.
In comparison to other sectors, oil and gas companies invest more in R&D for clean energy technologies; for example, wind, PV, and digitalization [98,99].
The high correlation between building technology, transport, and households is remarkable, and it can be justified by a greater spillover of technologies between these sectors. Spillover refers to the beneficial impact of new innovations in one industry or sector that flow into another. Examples include the spillover of semiconductors to PV and from aviation to wind turbines.
Evidence from the sub-technologies of transportation, household, and industry makes it clear that energy efficiency technologies, smart grids, hydrogen, and energy storage are common innovations that are experiencing remarkable growth in all of these sectors.
In addition, it seems that the high consistency of these indicators is a result of cooperative platforms and specialized technologies across industries.
For instance, the integration of PV technologies in both buildings and transportation would increase the competitiveness of cell manufacturing and serve as a material supplement. This competency is noted to have spillover potential among batteries, fuel cells, and electrolysis, which can be applied in all three sectors of transport, industry, and households [98].
6.3. Link3: RE Deployment (Electricity, Heating and Cooling, Transportation)
The EU principles point to the importance of increasing the proportion of renewable energy, particularly for electricity generation, as electricity generation from renewable sources showed an impressive growth of 32% in EU countries in 2018 [26].
Expenditures of taxes on the renewable energy subsidies (including FiTs) contributed to the increase of renewable shares from 12.6% in 2008 to 19.7% in 2019 [79]. From the 1990s to 2010, the introduction of FiTs in European countries such as Germany, Spain, and Sweden increased solar and wind energy patenting. Consequently, by the early 2000s, the FiTs levels had decreased, insofar as the costs of underlying technology had decreased [26,54].
During the 1990s, significant advancements in wind and solar technologies led to a more than 50 percent cost reduction for wind turbines and a 70 percent cost reduction for solar panels. While the market share of wind turbines remained stable, solar panels experienced enormous growth as a “solar surprise” around the year 2000, bringing them on par with conventional power sources [40,100].
Studies conducted in Germany, Austria, and Switzerland indicate that energy taxes, rather than renewable and energy-efficient services and products, have a direct impact on the innovation process related to the development of renewable or energy efficiency technologies. Indeed, because of limited financial resources, it is mostly large and leading technological firms that have more propensity to invest in both innovative products and innovation processes [101].
Nonetheless, as the viability of implementing these technologies in the power industry became more apparent, the institutional obstacles also became more obvious. The power generated from such variable resources faces obstacles such as permission planning and grid connection, as well as power storage and capacities of back-ups. There has been a revolution on both the technology and industry sides as a result of the power electronics and control technologies, as well as the dramatic shift in battery technologies. In the early stages, grids were unable to adapt to the unreliable power sources of wind and solar and only 5% or 10% of power generation from wind and solar energy could be fed into the electricity grid [40].
In comparison to the electricity sectors, the development of renewable energy in the heating and cooling sector is fragmented and less well known. On the industry and supply side, there are various space and water heating models, while on the thermal energy in building and demand side, there are various options based on the climate, efficiency and consumption behavior [102].
Renewable heat faces barriers in the form of subsidized incumbent fossil fuels that are currently in use, in addition to more specific challenges such as suitability in instances such as “lack of space for a biomass boiler or industrial temperature requirements”. Despite the fact that a significant portion of energy demand is related to heating and cooling, policymakers pay more attention to the policies regarding renewable sources in electricity rather than heating [103,104].
The Nordic countries have a number of policy instruments in place to drive renewable sources in heating and cooling sectors.
Feed-in tariffs benefit heat and power systems by making fossil fuels uncompetitive with biomasses through energy taxes and financial incentives. Energy efficiency is the first and most important requirement for shifting heating and cooling to renewables. Heat pumps, for example, work more efficiently when the buildings are better insulated and biomass boilers require less fuel if heat demands decrease as energy efficiency improves [103,105].
The demand for heating and cooling is impacted by the energy efficiency of various building components, including heating and cooling appliances and industrial processes. Improving energy efficiency is a fundamental and cost-effective step towards shifting heating and cooling to renewables. For instance, buildings need to be well insulated for heat pumps to operate efficiently, whereas biomass boilers will require less fuel and become more cost-effective if energy efficiency measures reduce heat demand [102].
In contrast, transition policy in the transportation sector should enhance efficiency and energy mix. With the exception of biofuels, policies that aim to improve other forms of renewable energy in transportation receive less attention than they should. As a result, the proportion of RE in transportation sector is lower than other sectors in terms of heating, cooling, and electricity. In general, transport transitions require integrated policy planning for new alternative energy careers, vehicles designed for the consumption of such new fuels, and infrastructure for fuel distribution [106].
6.4. Link4: Energy Saving
Some researchers point out that carbon pricing policies have a greater impact on energy efficiency measures than renewables or new radical technologies [55,107].
As a consequence of the EU’s higher climate-related costs, including carbon taxes, compared to non-EU G20 members with industry subsidies, energy consumption has decreased since 2003, while industrial activity has increased (except for in the years 2007 to 2013) [38,98]. According to the European Commission report (2020), energy efficiency improvements in the sectors with lower and moderate energy intensity, such as transportation and household, as well as the efforts of highly energy-intensive industries, contributed to a decline in energy costs despite slight energy price increases [98].
The energy efficiency index in the household sector over the period of 2000–2019 showed a growth of around 1.8%/year, while in the same period of time, in the industry sector this indicator indicated an increase of 1.1% per year.
In the transportation sector, the efficiency index had a medium improvement rate of 0.6% per year, which is primarily relevant to the complex needs of the transportation sector due to the various vehicle transport modes, energy careers, and fuels regarding distribution and transport structure [38,83]. The development of transportation technology necessitates the implementation of particularly extensive, long-lasting, and complicated structural and technological changes [40,103].
On the other hand, the transportation sector is developing from different aspects of technology including digitalization, new modes of transport and electrification. As a consequence of this, the role of renewables as a method of decarbonization seems ambiguous, and as a result, it can be considered why the energy-efficiency treatment in this sector has not shown significant consistency with the other two sectors.
Regarding the above-mentioned results, the transportation sector is behind the other sectors in terms of efficiency measures. As a result, this group was unable to demonstrate consistency among the indicators contained in this index.
6.5. Link5: CO2 Emission
The consistency of all sub-indicators for CO2 emissions demonstrated the identical behavior of energy consumption across all sectors.
Carbon pricing raises awareness about the energy efficiency and innovation, and enables beneficiaries to overcome barriers and manage the rising cost of energy by reducing consumption [92].
7. Conclusions
Despite advancements in the concept of innovation and sustainability transition, policy mix studies face challenges in the policy process of energy transition. In fact, there is a need to deepen knowledge of many relevant transition policy design dimensions in order to address unresolved questions about why policymakers choose some instruments over others in the context of an existing or desired mix, how specific policy instruments operate in a mix that has a direct impact on policy performance, and how the transition policy can be evaluated in terms of achieving the desired outcome of CO2 reduction.
- This research developed a policy chain for the energy transition framework to determine the actual features of energy transition design. This chain includes five links of supportive policies of decarbonization that lead to technology transformation, renewable energy deployment, and justifications for less energy consumption. The amount of CO2 emitted would be used to determine the desired output.
- As a consistency test of this framework, the correlation and reliability tests of the sub-indicators in each link (index) of this framework were applied. Except for the energy saving index, the results of this test confirmed the consistency of all links with their sub-indicators.
- The economics and innovation perspective of the developed framework, which is aligned with the reliability analysis of each index of the framework, answers the question posed in this paper regarding actual features in energy transition. A complete energy transition requires economic signals and a fiscal system (Link1: supportive policies of decarbonization) that are aligned with all of the policy contributions in strategic investments for technology development (Link2: transformation and technological development). Energy policy schemes including taxation, subsidization, and RD&D in climate change mitigation technology increase motivation for alternative energy exploitation (Link3: RE deployment), which adds to the advance actions by individuals and firms in terms of energy saving (Link4), all of which combine to change greenhouse gas emissions (Link5: CO2 emission).
8. Future Research
The innovation chain in the energy sector has special characteristics that make it less attractive for investment. High capital intensity, long-term investments, and a low rate of return on investment can all reduce the market’s appeal to private investors [96]. Generally, in rare cases, the energy transition process moves forward at the expected pace.
The presence of some impediments in energy systems clarifies the low rate of energy innovation as due to the stakeholders of existing energy systems and raises barriers preventing transformation to low-carbon technologies. The large amount of capital investment is competing against technology-push policies, while the lack of “consumer product differentiation” is the main prohibition of market-pull policies.
Market-pull policies such as energy taxes are politically controversial due to the expenses imposed on vulnerable consumers, and energy efficiency regulations should be adequately strong and stringent to the extent that they can impede the “rebound effects” of more direct and indirect consumption of energy sources. In addition, the concept of “technology spillovers” means that the benefits of patents and innovation are not restricted to only innovator firms or institutions, and hence investors are not normally interested in private RD&D foundations [108]. Taking into account the above-mentioned obstacles to energy transition, it is suggested that future studies could examine the challenges of energy transition considering the hindrance of technology development, supportive policies, and renewable energy deployment. Furthermore, additional methodological work is required for a quantitative regression analysis in order to clarify the causal relations of the policy chain of transition.
Author Contributions
N.M.: Conceptualization, Methodology, Validation, Formal analysis, Investigation, Resources, Writing—Original Draft, Visualization, Writing—Review and Editing; H.M.: Methodology, Formal analysis, Validation; H.-L.D.: Supervision. All authors have read and agreed to the published version of the manuscript.
Funding
This research was funded by the German Research Foundation and the Open Access Publication Fund of TU Berlin.
Institutional Review Board Statement
Not applicable.
Informed Consent Statement
Not applicable.
Data Availability Statement
The datasets used and/or analyzed during the current study are available from the corresponding author on reasonable request.
Conflicts of Interest
The authors declare that they have no competing interests.
Abbreviations
| EE | Energy Efficiency |
| RE | Renewable Energy |
| RD&D | Research Development and Deployment |
| FiT | Feed-in Tariffs |
| REC | Renewable Energy Certificate |
| IEA | International Energy Agency |
| SME | Small Medium Enterprises |
| PV | Photovoltaics |
| EEG | Erneuerbare energien gesetz |
| GHG | Greenhouse Gas Emissions |
| IRENA | International renewable energy agency |
| OECD | Organization for Economic Co-operation and Development |
| EU ETS | European Union Emissions Trading System |
| IPR | Intellectual Property Rights |
| CCUs | Carbon Capture and Utilization |
| GDP | Gross Domestic Products |
| non-EU G20 | Non-European Union group of 20 |
References
- Gielen, D.; Boshell, F.; Saygin, D.; Bazilian, M.D.; Wagner, N.; Gorini, R. The Role of Renewable Energy in the Global Energy Transformation. Energy Strategy Rev. 2019, 24, 38–50. [Google Scholar] [CrossRef]
- Mohammadi, N.; Khabbazan, M.M. The Influential Mechanisms of Power Actor Groups on Policy Mix Adoption: Lessons Learned from Feed-In Tariffs in the Renewable Energy Transition in Iran and Germany. Sustainability 2022, 14, 3973. [Google Scholar] [CrossRef]
- Löhr, M.; Chlebna, C.; Mattes, J. From Institutional Work to Transition Work: Actors Creating, Maintaining and Disrupting Transition Processes. Environ. Innov. Soc. Transit. 2022, 42, 251–267. [Google Scholar] [CrossRef]
- Gielen, D. Energy Planning. Energies 2022, 15, 2621. [Google Scholar] [CrossRef]
- Rogge, K.S.; Reichardt, K. Policy Mixes for Sustainability Transitions: An Extended Concept and Framework for Analysis. Res. Policy 2016, 45, 1620–1635. [Google Scholar] [CrossRef]
- Del Río González, P. The Empirical Analysis of the Determinants for Environmental Technological Change: A Research Agenda. Ecol. Econ. 2009, 68, 861–878. [Google Scholar] [CrossRef]
- Capano, G.; Howlett, M. The Knowns and Unknowns of Policy Instrument Analysis: Policy Tools and the Current Research Agenda on Policy Mixes. SAGE Open 2020, 10, 2158244019900568. [Google Scholar] [CrossRef]
- Heiberg, J.; Truffer, B.; Binz, C. Assessing Transitions through Socio-Technical Configuration Analysis—A Methodological Framework and a Case Study in the Water Sector. Res. Policy 2022, 51, 104363. [Google Scholar] [CrossRef]
- Lantz, T.L.; Ioppolo, G.; Yigitcanlar, T.; Arbolino, R. Understanding the Correlation between Energy Transition and Urbanization. Environ. Innov. Soc. Transit. 2021, 40, 73–86. [Google Scholar] [CrossRef]
- Reichardt, K.; Rogge, K. How the Policy Mix Impacts Innovation: Findings from Company Case Studies on Offshore Wind in Germany. Environ. Innov. Soc. Transit. 2016, 18, 62–81. [Google Scholar] [CrossRef]
- Diercks, G.; Larsen, H.; Steward, F. Transformative Innovation Policy: Addressing Variety in an Emerging Policy Paradigm. Res. Policy 2019, 48, 880–894. [Google Scholar] [CrossRef]
- Bögel, P.M.; Augenstein, K.; Levin-Keitel, M.; Upham, P. An Interdisciplinary Perspective on Scaling in Transitions: Connecting Actors and Space. Environ. Innov. Soc. Transit. 2022, 42, 170–183. [Google Scholar] [CrossRef]
- Feola, G.; Nunes, R. Success and Failure of Grassroots Innovations for Addressing Climate Change: The Case of the Transition Movement. Glob. Environ. Change 2014, 24, 232–250. [Google Scholar] [CrossRef]
- Raj, G.; Feola, G.; Hajer, M.; Runhaar, H. Power and Empowerment of Grassroots Innovations for Sustainability Transitions: A Review. Environ. Innov. Soc. Transit. 2022, 43, 375–392. [Google Scholar] [CrossRef]
- Kern, F.; Smith, A. Restructuring Energy Systems for Sustainability? Energy Transition Policy in the Netherlands. Energy Policy 2008, 36, 4093–4103. [Google Scholar] [CrossRef]
- Keller, M.; Sahakian, M.; Hirt, L.F. Connecting the Multi-Level-Perspective and Social Practice Approach for Sustainable Transitions. Environ. Innov. Soc. Transit. 2022, 44, 14–28. [Google Scholar] [CrossRef]
- Geels, F.W. Socio-Technical Transitions to Sustainability: A Review of Criticisms and Elaborations of the Multi-Level Perspective. Curr. Opin. Environ. Sustain. 2019, 39, 187–201. [Google Scholar] [CrossRef]
- Moallemi, E.A.; Ahamdi, A.; Afrazeh, A.; Bagheri Moghaddam, N. Understanding Systemic Analysis in the Governance of Sustainability Transition in Renewable Energies: The Case of Fuel Cell Technology in Iran. Renew. Sustain. Energy Rev. 2014, 33, 305–315. [Google Scholar] [CrossRef]
- Sharma, G.D.; Tiwari, A.K.; Erkut, B.; Mundi, H.S. Exploring the Nexus between Non-Renewable and Renewable Energy Consumptions and Economic Development: Evidence from Panel Estimations. Renew. Sustain. Energy Rev. 2021, 146, 111152. [Google Scholar] [CrossRef]
- Ossenbrink, J.; Finnsson, S.; Bening, C.R.; Hoffmann, V.H. Delineating Policy Mixes: Contrasting Top-down and Bottom-up Approaches to the Case of Energy-Storage Policy in California. Res. Policy 2019, 48, 103582. [Google Scholar] [CrossRef]
- Borrás, S.; Edquist, C. The Choice of Innovation Policy Instruments. Technol. Forecast. Soc. Change 2013, 80, 1513–1522. [Google Scholar] [CrossRef]
- Kitzing, L.; Fitch-Roy, O.; Islam, M.; Mitchell, C. An Evolving Risk Perspective for Policy Instrument Choice in Sustainability Transitions. Environ. Innov. Soc. Transit. 2020, 35, 369–382. [Google Scholar] [CrossRef]
- Schulze, K. Policy Characteristics, Electoral Cycles, and the Partisan Politics of Climate Change. Glob. Environ. Politics 2021, 21, 44–72. [Google Scholar] [CrossRef]
- Pearson, R.; Bardsley, D.K. Applying Complex Adaptive Systems and Risk Society Theory to Understand Energy Transitions. Environ. Innov. Soc. Transit. 2022, 42, 74–87. [Google Scholar] [CrossRef]
- Schmidt, T.S.; Sewerin, S. Measuring the Temporal Dynamics of Policy Mixes–An Empirical Analysis of Renewable Energy Policy Mixes’ Balance and Design Features in Nine Countries. Res. Policy 2019, 48, 103557. [Google Scholar] [CrossRef]
- Eicke, L.; Weko, S. Does Green Growth Foster Green Policies? Value Chain Upgrading and Feedback Mechanisms on Renewable Energy Policies. Energy Policy 2022, 165, 112948. [Google Scholar] [CrossRef]
- Boasson, E.L.; Wettestad, J.; Leiren, M.D. Comparative Renewables Policy: Political, Organizational and European Fields, 1st ed.; Routledge: London, UK, 2021. [Google Scholar]
- Hille, E.; Althammer, W.; Diederich, H. Environmental Regulation and Innovation in Renewable Energy Technologies: Does the Policy Instrument Matter? Technol. Forecast. Soc. Change 2020, 153, 119921. [Google Scholar] [CrossRef]
- Johnstone, N.; Haščič, I.; Popp, D. Renewable Energy Policies and Technological Innovation: Evidence Based on Patent Counts. Env. Resour. Econ. 2010, 45, 133–155. [Google Scholar] [CrossRef]
- Peters, M.; Schneider, M.; Griesshaber, T.; Hoffmann, V.H. The Impact of Technology-Push and Demand-Pull Policies on Technical Change–Does the Locus of Policies Matter? Res. Policy 2012, 41, 1296–1308. [Google Scholar] [CrossRef]
- Dechezleprêtre, A.; Glachant, M. Does Foreign Environmental Policy Influence Domestic Innovation? Evidence from the Wind Industry. Environ. Resour. Econ. 2014, 58, 391–413. [Google Scholar] [CrossRef]
- Palage, K.; Lundmark, R.; Söderholm, P. The Innovation Effects of Renewable Energy Policies and Their Interaction: The Case of Solar Photovoltaics. Environ. Econ. Policy Stud. 2019, 21, 217–254. [Google Scholar] [CrossRef]
- Böhringer, C.; Cuntz, A.; Harhoff, D.; Asane-Otoo, E. The Impact of the German Feed-in Tariff Scheme on Innovation: Evidence Based on Patent Filings in Renewable Energy Technologies. Energy Econ. 2017, 67, 545–553. [Google Scholar] [CrossRef]
- Peñasco, C.; Anadón, L.D.; Verdolini, E. Systematic Review of the Outcomes and Trade-Offs of Ten Types of Decarbonization Policy Instruments. Nat. Clim. Change 2021, 11, 257–265. [Google Scholar] [CrossRef]
- Walz, R.; Schleich, J.; Ragwitz, M. Regulation, Innovation and Wind Power Technologies—An Empirical Analysis for OECD Countries. In Proceedings of the DIME Final Conference, Maastricht, The Netherlands, 6–8 April 2011; Volume 6, p. 8. [Google Scholar]
- Nicolli, F.; Vona, F. Energy Market Liberalization and Renewable Energy Policies in OECD Countries. Energy Policy 2019, 128, 853–867. [Google Scholar] [CrossRef]
- Schaffrin, A.; Sewerin, S.; Seubert, S. Toward a Comparative Measure of Climate Policy Output. Policy Stud. J. 2015, 43, 257–282. [Google Scholar] [CrossRef]
- Energy Efficiency Trends for Households in the EU. Available online: https://www.odyssee-mure.eu/publications/efficiency-by-sector/households/ (accessed on 23 April 2022).
- Energy Taxes by Paying Sector. Available online: https://data.europa.eu/data/datasets/scmhhxn6goaxwvaaxnxbsq/?locale=en (accessed on 12 June 2022).
- Grubb, M.; McDowall, W.; Drummond, P. On Order and Complexity in Innovations Systems: Conceptual Frameworks for Policy Mixes in Sustainability Transitions. Energy Res. Soc. Sci. 2017, 33, 21–34. [Google Scholar] [CrossRef]
- Kern, F.; Rogge, K.S.; Howlett, M. Policy Mixes for Sustainability Transitions: New Approaches and Insights through Bridging Innovation and Policy Studies. Res. Policy 2019, 48, 103832. [Google Scholar] [CrossRef]
- Grubb, M. Planetary Economics: Energy, Climate Change and the Three Domains of Sustainable Development; Routledge: Abingdon, UK, 2014. [Google Scholar]
- Johansson, T.B.; Turkenburg, W. Policies for Renewable Energy in the European Union and Its Member States: An Overview. Energy Sustain. Dev. 2004, 8, 5–24. [Google Scholar] [CrossRef]
- Kemp, R.; Pontoglio, S. The Innovation Effects of Environmental Policy Instruments—A Typical Case of the Blind Men and the Elephant? Ecol. Econ. 2011, 72, 28–36. [Google Scholar] [CrossRef]
- Howlett, M.; Lejano, R.P. Tales from the Crypt: The Rise and Fall (and Rebirth?) of Policy Design. Adm. Soc. 2013, 45, 357–381. [Google Scholar] [CrossRef]
- Flanagan, K.; Uyarra, E.; Laranja, M. Reconceptualising the ‘Policy Mix’ for Innovation. Res. Policy 2011, 40, 702–713. [Google Scholar] [CrossRef]
- Rosenow, J.; Kern, F.; Rogge, K. The Need for Comprehensive and Well Targeted Instrument Mixes to Stimulate Energy Transitions: The Case of Energy Efficiency Policy. Energy Res. Soc. Sci. 2017, 33, 95–104. [Google Scholar] [CrossRef]
- Howlett, M. Governance Modes, Policy Regimes and Operational Plans: A Multi-Level Nested Model of Policy Instrument Choice and Policy Design. Policy Sci. 2009, 42, 73–89. [Google Scholar] [CrossRef]
- Hirt, L.F.; Schell, G.; Sahakian, M.; Trutnevyte, E. A Review of Linking Models and Socio-Technical Transitions Theories for Energy and Climate Solutions. Environ. Innov. Soc. Transit. 2020, 35, 162–179. [Google Scholar] [CrossRef]
- Crespo del Granado, P.; van Nieuwkoop, R.H.; Kardakos, E.G.; Schaffner, C. Modelling the Energy Transition: A Nexus of Energy System and Economic Models. Energy Strategy Rev. 2018, 20, 229–235. [Google Scholar] [CrossRef]
- Markard, J.; Raven, R.; Truffer, B. Sustainability Transitions: An Emerging Field of Research and Its Prospects. Res. Policy 2012, 41, 955–967. [Google Scholar] [CrossRef]
- Bradshaw, A.; de Martino Jannuzzi, G. Governing Energy Transitions and Regional Economic Development: Evidence from Three Brazilian States. Energy Policy 2019, 126, 1–11. [Google Scholar] [CrossRef]
- Cambini, C.; Congiu, R.; Jamasb, T.; Llorca, M.; Soroush, G. Energy Systems Integration: Implications for Public Policy. Energy Policy 2020, 143, 111609. [Google Scholar] [CrossRef]
- Grubb, M.; Wieners, C.; Yang, P. Modeling Myths: On DICE and Dynamic Realism in Integrated Assessment Models of Climate Change Mitigation. WIREs Clim. Change 2021, 12, e698. [Google Scholar] [CrossRef]
- Rogge, K.S.; Schneider, M.; Hoffmann, V.H. The Innovation Impact of the EU Emission Trading System—Findings of Company Case Studies in the German Power Sector. Ecol. Econ. 2011, 70, 513–523. [Google Scholar] [CrossRef]
- Markard, J.; Truffer, B. Technological Innovation Systems and the Multi-Level Perspective: Towards an Integrated Framework. Res. Policy 2008, 37, 596–615. [Google Scholar] [CrossRef]
- Mlecnik, E.; Parker, J.; Ma, Z.; Corchero, C.; Knotzer, A.; Pernetti, R. Policy Challenges for the Development of Energy Flexibility Services. Energy Policy 2020, 137, 111147. [Google Scholar] [CrossRef]
- Edling, L.; Danks, C. Supporting Actors: The Role of State Policy and Private Programs in Advancing Local and Renewable Heating Technology. Energy Policy 2021, 153, 112266. [Google Scholar] [CrossRef]
- Kanda, W.; Kuisma, M.; Kivimaa, P.; Hjelm, O. Conceptualising the Systemic Activities of Intermediaries in Sustainability Transitions. Environ. Innov. Soc. Transit. 2020, 36, 449–465. [Google Scholar] [CrossRef]
- Sovacool, B.K.; Turnheim, B.; Martiskainen, M.; Brown, D.; Kivimaa, P. Guides or Gatekeepers? Incumbent-Oriented Transition Intermediaries in a Low-Carbon Era. Energy Res. Soc. Sci. 2020, 66, 101490. [Google Scholar] [CrossRef]
- IEA. Renewable Energy: RD&D Priorities—Analysis; International Energy Agency: Paris, France, 2006. [Google Scholar]
- Hötte, K. The Economics of Transition Pathways: A Proposed Taxonomy and a Policy Experiment. Environ. Innov. Soc. Transit. 2020, 36, 94–113. [Google Scholar] [CrossRef]
- Costantini, V.; Crespi, F.; Martini, C.; Pennacchio, L. Demand-Pull and Technology-Push Public Support for Eco-Innovation: The Case of the Biofuels Sector. Res. Policy 2015, 44, 577–595. [Google Scholar] [CrossRef]
- Bettencourt, L.M.A.; Trancik, J.E.; Kaur, J. Determinants of the Pace of Global Innovation in Energy Technologies. PLoS ONE 2013, 8, e67864. [Google Scholar] [CrossRef]
- André, T.; Appavou, F. Renewables 2020 Global Status Report; REN21: Paris, France, 2020. [Google Scholar]
- Gao, X. International Patent Inflows and Innovative Capacity in Recipient Countries: Evidence from the Solar Photovoltaics (PV) Industry. Energy Sustain. Dev. 2022, 68, 449–456. [Google Scholar] [CrossRef]
- Kerr, P.; Noble, D.R.; Hodges, J.; Jeffrey, H. Implementing Radical Innovation in Renewable Energy Experience Curves. Energies 2021, 14, 2364. [Google Scholar] [CrossRef]
- Böhringer, C.; Cantner, U.; Costard, J.; Kramkowski, L.-V.; Gatzen, C.; Pietsch, S. Innovation for the German Energy Transition—Insights from an Expert Survey. Energy Policy 2020, 144, 111611. [Google Scholar] [CrossRef]
- Zhang, Y.; Shi, X.; Qian, X.; Chen, S.; Nie, R. Macroeconomic Effect of Energy Transition to Carbon Neutrality: Evidence from China’s Coal Capacity Cut Policy. Energy Policy 2021, 155, 112374. [Google Scholar] [CrossRef]
- Dell’Anna, F. Green Jobs and Energy Efficiency as Strategies for Economic Growth and the Reduction of Environmental Impacts. Energy Policy 2021, 149, 112031. [Google Scholar] [CrossRef]
- Kowalska-Pyzalska, A. What Makes Consumers Adopt to Innovative Energy Services in the Energy Market? A Review of Incentives and Barriers. Renew. Sustain. Energy Rev. 2018, 82, 3570–3581. [Google Scholar] [CrossRef]
- IEA. Global Energy Review: CO2 Emissions in 2021, Global Emissions Rebound Sharply to Highest Ever Level; Interntional Energy Agency: Paris, France, 2021. [Google Scholar]
- Hidayatno, A.; Jafino, B.A.; Setiawan, A.D.; Purwanto, W.W. When and Why Does Transition Fail? A Model-Based Identification of Adoption Barriers and Policy Vulnerabilities for Transition to Natural Gas Vehicles. Energy Policy 2020, 138, 111239. [Google Scholar] [CrossRef]
- IEA. Golden Rules for a Golden Age of Gas; Interntional Energy Agency: Paris, France, 2012. [Google Scholar]
- Gu, G.; Zheng, H.; Tong, L.; Dai, Y. Does Carbon Financial Market as an Environmental Regulation Policy Tool Promote Regional Energy Conservation and Emission Reduction? Empirical Evidence from China. Energy Policy 2022, 163, 112826. [Google Scholar] [CrossRef]
- Transport: Increasing Oil Consumption and Greenhouse Gas Emissions Hamper EU Progress towards Environment and Climate Objectives. Available online: https://www.eea.europa.eu/publications/transport-increasing-oil-consumption-and (accessed on 22 June 2022).
- Šprajc, P.; Bjegović, M.; Vasić, B. Energy Security in Decision Making and Governance-Methodological Analysis of Energy Trilemma Index. Renew. Sustain. Energy Rev. 2019, 114, 109341. [Google Scholar] [CrossRef]
- Pollitt, M.G. The Role of Policy in Energy Transitions: Lessons from the Energy Liberalisation Era. Energy Policy 2012, 50, 128–137. [Google Scholar] [CrossRef]
- European Court of Auditors. Review 01/2022: Energy Taxation, Carbon Pricing and Energy Subsidies; European Unio: Luxembourg, 2022. [Google Scholar]
- Bel, G.; Joseph, S. Policy Stringency under the European Union Emission Trading System and Its Impact on Technological Change in the Energy Sector. Energy Policy 2018, 117, 434–444. [Google Scholar] [CrossRef]
- IEA. IEA Guide to Reporting Energy RD&D Budget/ Expenditure Statistics—Analysis; International Energy Agency: Paris, France, 2011. [Google Scholar]
- Sadamori, K.; Motherway, B. Energy Efficiency 2021; IEA: Paris, France, 2021; p. 103. [Google Scholar]
- Mirei Isaka. Why Patents Are Important, The Role of Patents in Renewable Energy Technology Innovation; IRENA: Abu Dhabi, United Arab Emirates, 2013. [Google Scholar]
- Irena Inspire Enabling Technologies Patents. Available online: https://www.irena.org/Statistics/View-Data-by-Topic/Innovation-and-Technology/Enabling-Technologies-Patents (accessed on 23 April 2022).
- European Commission. EUROSTAT Shares Tool Manual 2020. Available online: https://ec.europa.eu/eurostat/documents/38154/4956088/SHARES+Manual+2020.pdf/c66baa28-2d61-c8ae-0628-098cb240fc3f?t=1631717798495 (accessed on 20 August 2023).
- Energy Consumption Trends in EU. Available online: https://www.odyssee-mure.eu/publications/efficiency-by-sector/industry/ (accessed on 23 April 2022).
- Greenhouse Gas Emissions from Energy. Available online: https://www.iea.org/data-and-statistics/data-product/greenhouse-gas-emissions-from-energy (accessed on 12 June 2022).
- Mukaka, M. A Guide to Appropriate Use of Correlation Coefficient in Medical Research. Malawi Med J 2012, 24, 69–71. [Google Scholar]
- Tavakol, M.; Dennick, R. Making Sense of Cronbach’s Alpha. Int. J. Med. Educ. 2011, 2, 53–55. [Google Scholar] [CrossRef]
- Shelby, L.B. Beyond Cronbach’s Alpha: Considering Confirmatory Factor Analysis and Segmentation. Hum. Dimens. Wildl. 2011, 16, 142–148. [Google Scholar] [CrossRef]
- Energy Technology RD&D Budgets–Data Product. IEA n.d. Available online: https://www.iea.org/data-and-statistics/data-product/energy-technology-rd-and-d-budget-database-2 (accessed on 2 October 2022).
- Platform on International Standards and Patents in RE (INSPIRE). Available online: https://www.irena.org/inspire (accessed on 2 October 2022).
- Energy Efficiency Indicators|Odyssee|Energy Efficiency in Europe. Available online: https://www.indicators.odyssee-mure.eu/ (accessed on 2 October 2022).
- Gacitua, L.; Gallegos, P.; Henriquez-Auba, R.; Lorca, Á.; Negrete-Pincetic, M.; Olivares, D.; Valenzuela, A.; Wenzel, G. A Comprehensive Review on Expansion Planning: Models and Tools for Energy Policy Analysis. Renew. Sustain. Energy Rev. 2018, 98, 346–360. [Google Scholar] [CrossRef]
- Environmental Tax Statistics—Detailed Analysis. Available online: https://ec.europa.eu/eurostat/statistics-explained/index.php?title=Environmental_tax_statistics_-_detailed_analysis#Energy_taxes_stand_out_as_the_major_source_of_EU_environmental_tax_revenue (accessed on 23 April 2022).
- Report from the Commission to the European Parliment and the Council: On Progress of Clean Energy Competitiveness; European Commission: Brussels, Belgium, 2020.
- Lim, J.-S.; Kim, Y.-G. Combining Carbon Tax and R&D Subsidy for Climate Change Mitigation. Energy Econ. 2012, 34, S496–S502. [Google Scholar]
- Report from the Commission to the European Parliament and the Council, the European Economic and Social Committee of the Regions. Energy Prices and Costs in Europe; European Commission: Brussels, Belgium, 2020.
- Asmelash, E.; Gorini, R. International Oil Companies and the Energy Transition; IRENA, International Renewable Energy Agency: Abu Dhabi, United Arab Emirates, 2021. [Google Scholar]
- Del Río, P.; Mir-Artigues, P. Designing Auctions for Concentrating Solar Power. Energy Sustain. Dev. 2019, 48, 67–81. [Google Scholar] [CrossRef]
- Stucki, T.; Woerter, M.; Arvanitis, S.; Peneder, M.; Rammer, C. How Different Policy Instruments Affect Green Product Innovation: A Differentiated Perspective. Energy Policy 2018, 114, 245–261. [Google Scholar] [CrossRef]
- Renewable Energy in District Heating and Cooling: A Sector Roadmap for REmap; International Renewable Energy Agency: Abu Dhabi, United Arab Emirates, 2017.
- Hannah, E.; Murdock, H.E.; Collier, U.; Adib, R.; Hawila, D.; Bianco, E.; Muller, S.; Ferroukhi, R.; Renner, M.; Nagpal, D.; et al. Renewable Energy Policies in a Time of Transition; International Renewable Energy Agency: Abu Dhabi, United Arab Emirates, 2018. [Google Scholar]
- Kyriakopoulos, G.L.; Arabatzis, G. Electrical Energy Storage Systems in Electricity Generation: Energy Policies, Innovative Technologies, and Regulatory Regimes. Renew. Sustain. Energy Rev. 2016, 56, 1044–1067. [Google Scholar] [CrossRef]
- Sergent, A. Sector-Based Political Analysis of Energy Transition: Green Shift in the Forest Policy Regime in France. Energy Policy 2014, 73, 491–500. [Google Scholar] [CrossRef]
- Kerstine Appunn CO2 Reduction and Biofuels in Germany’s Transport Sector—Implementing the RED II Directive. Available online: https://www.cleanenergywire.org/factsheets/co2-reduction-and-biofuels-germanys-transport-sector-implementing-red-ii-directive (accessed on 17 July 2022).
- Borghesi, S.; Cainelli, G.; Mazzanti, M. Linking Emission Trading to Environmental Innovation: Evidence from the Italian Manufacturing Industry. Res. Policy 2015, 44, 669–683. [Google Scholar] [CrossRef]
- Mohammadi, N. Investigation of Community Energy Business Models from an Institutional Perspective: Intermediaries and Policy Instruments in Selected Cases of Developing and Developed Countries. Sustainability 2023, 15, 8423. [Google Scholar] [CrossRef]
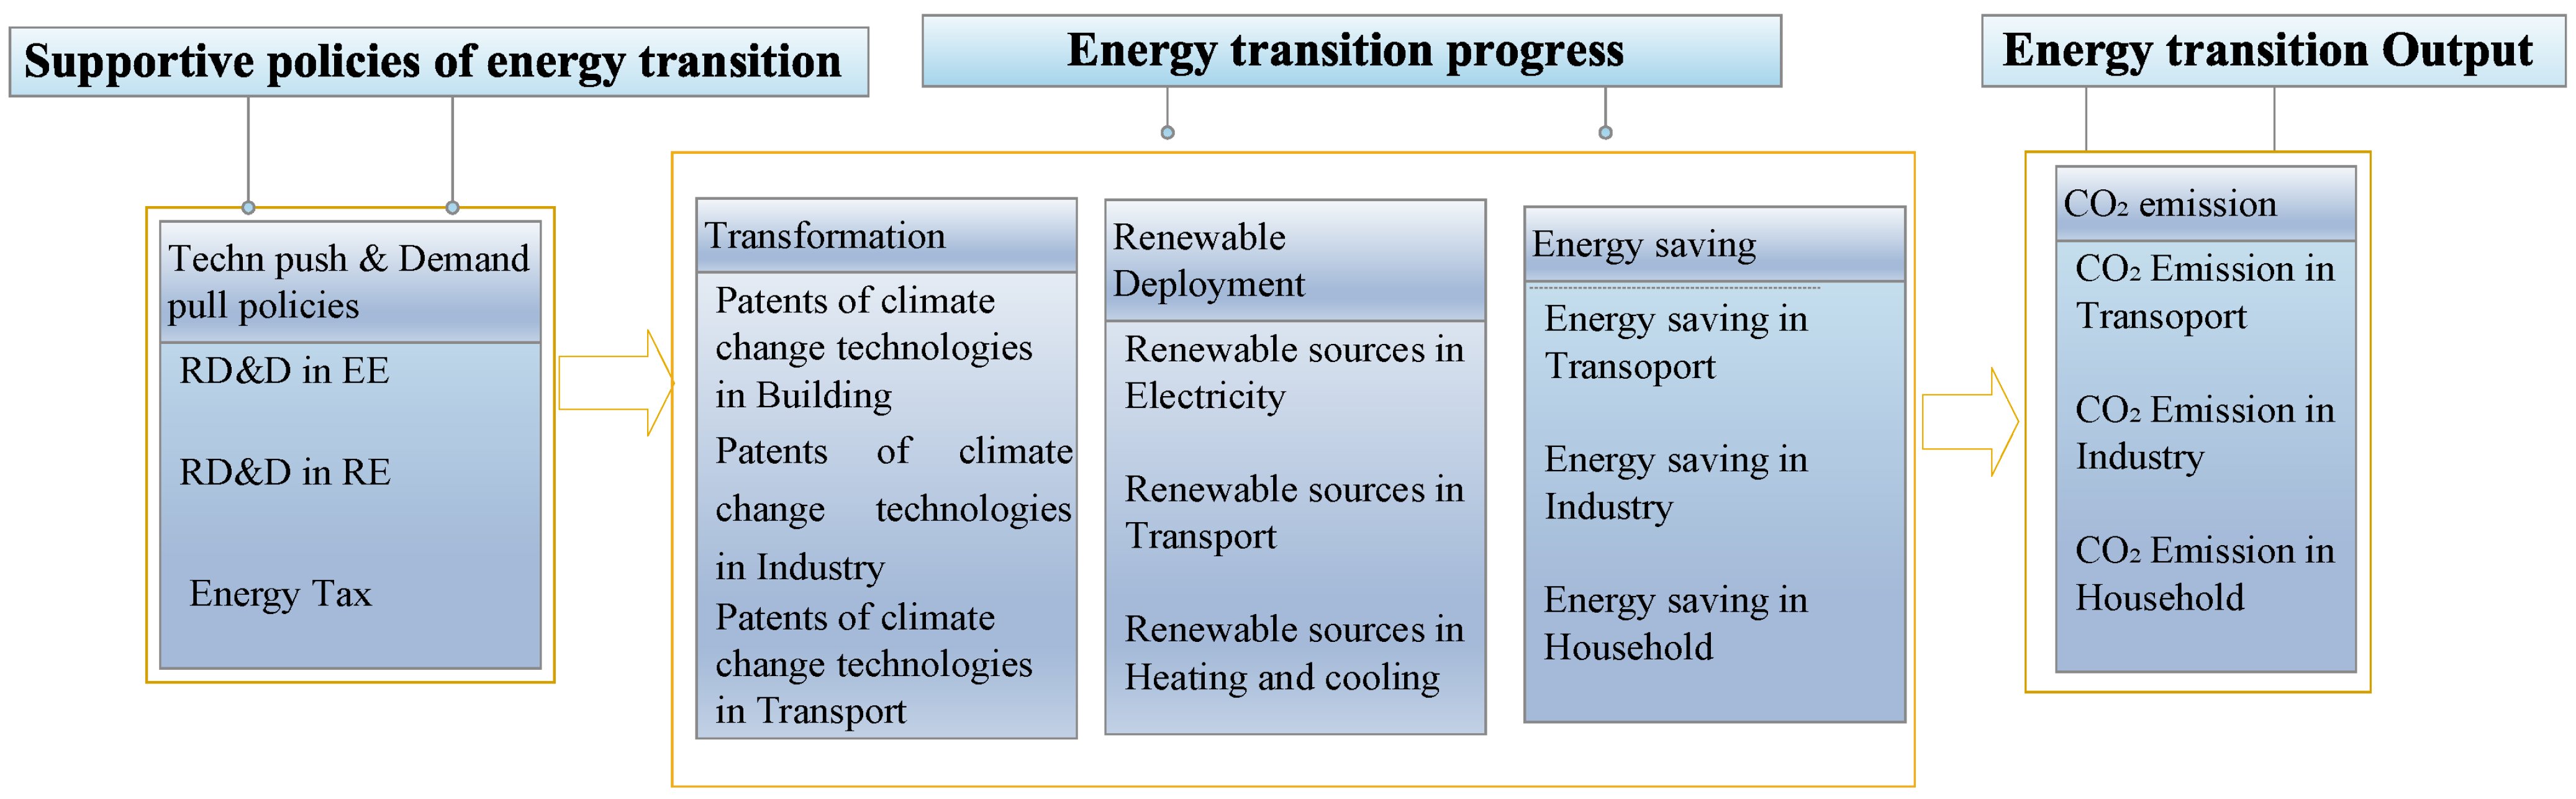
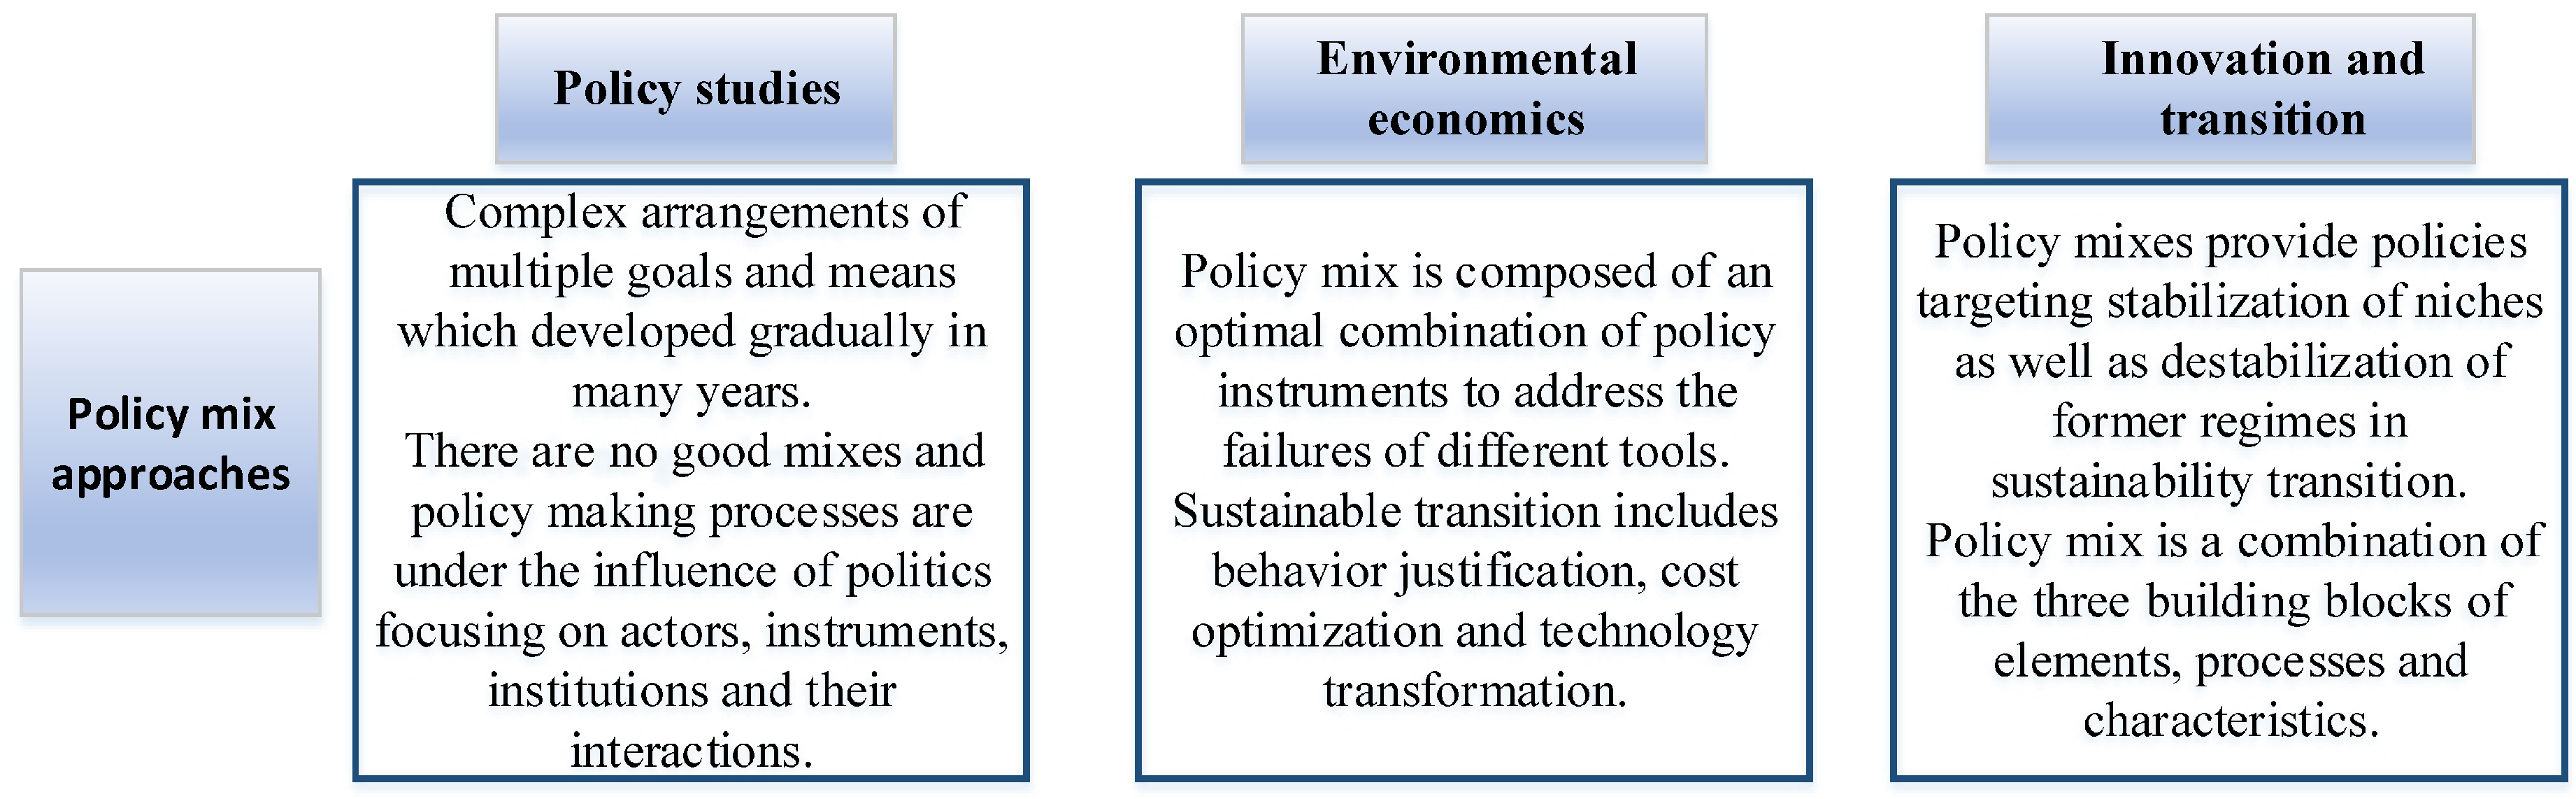
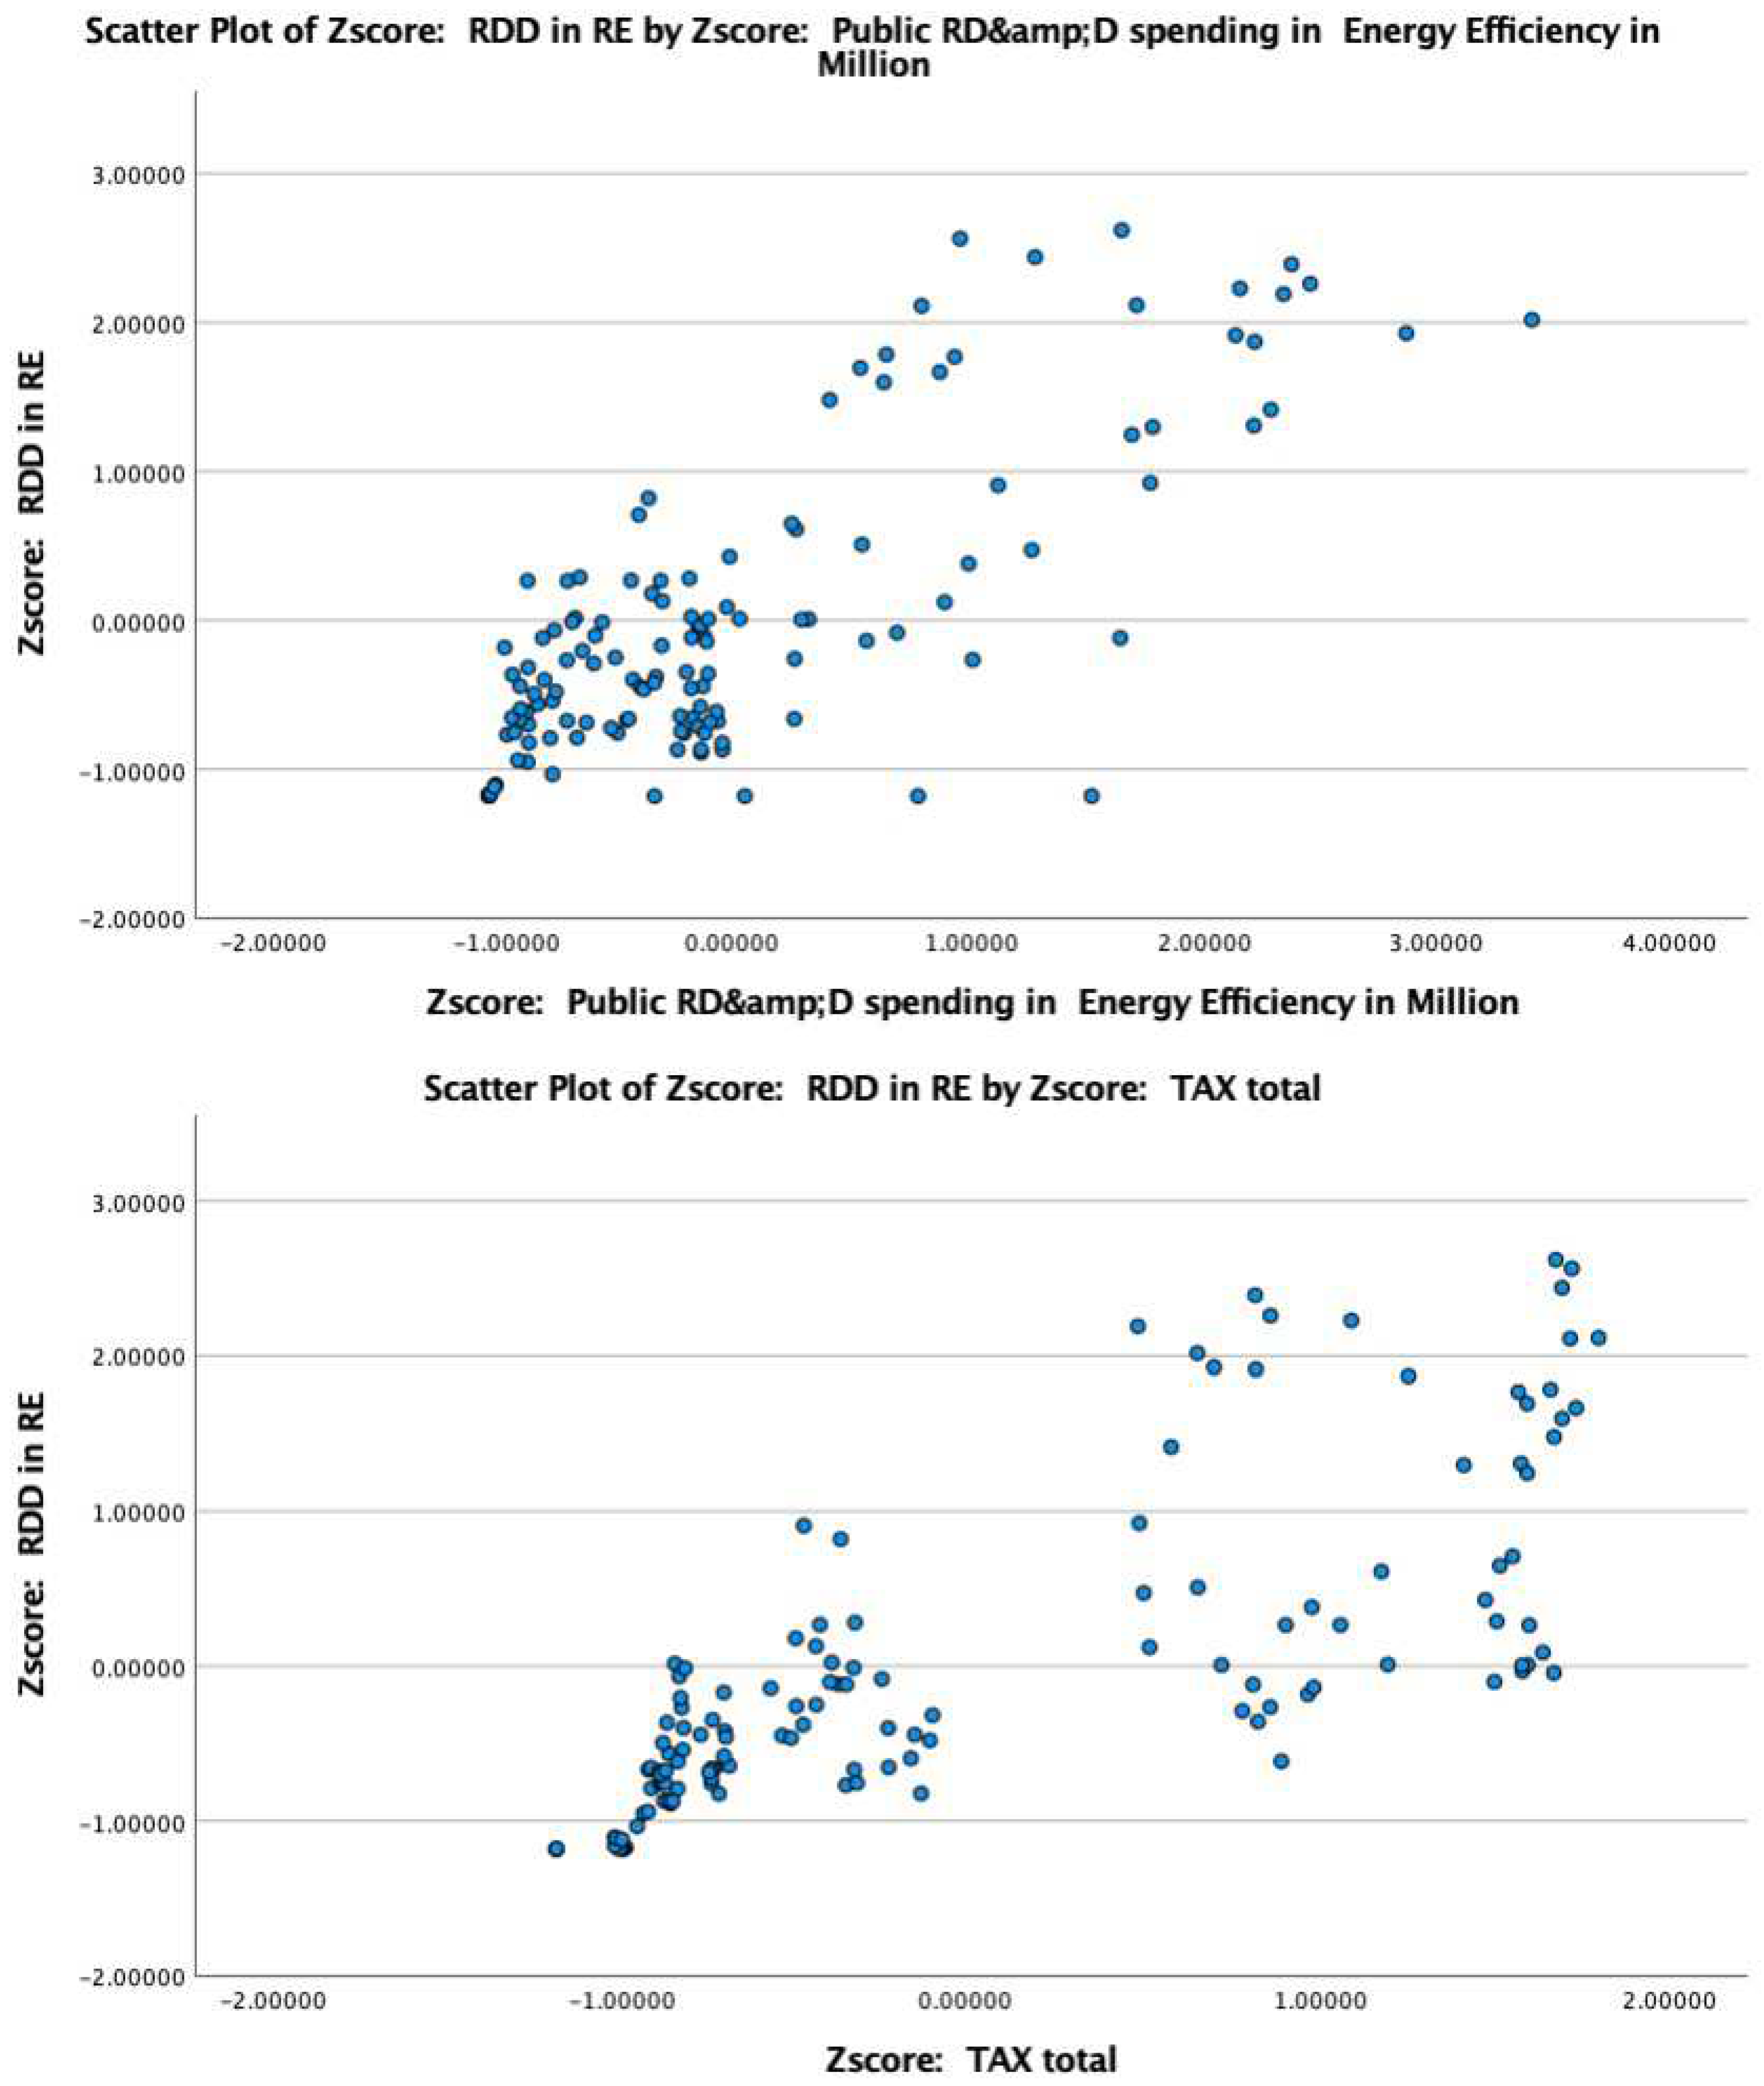


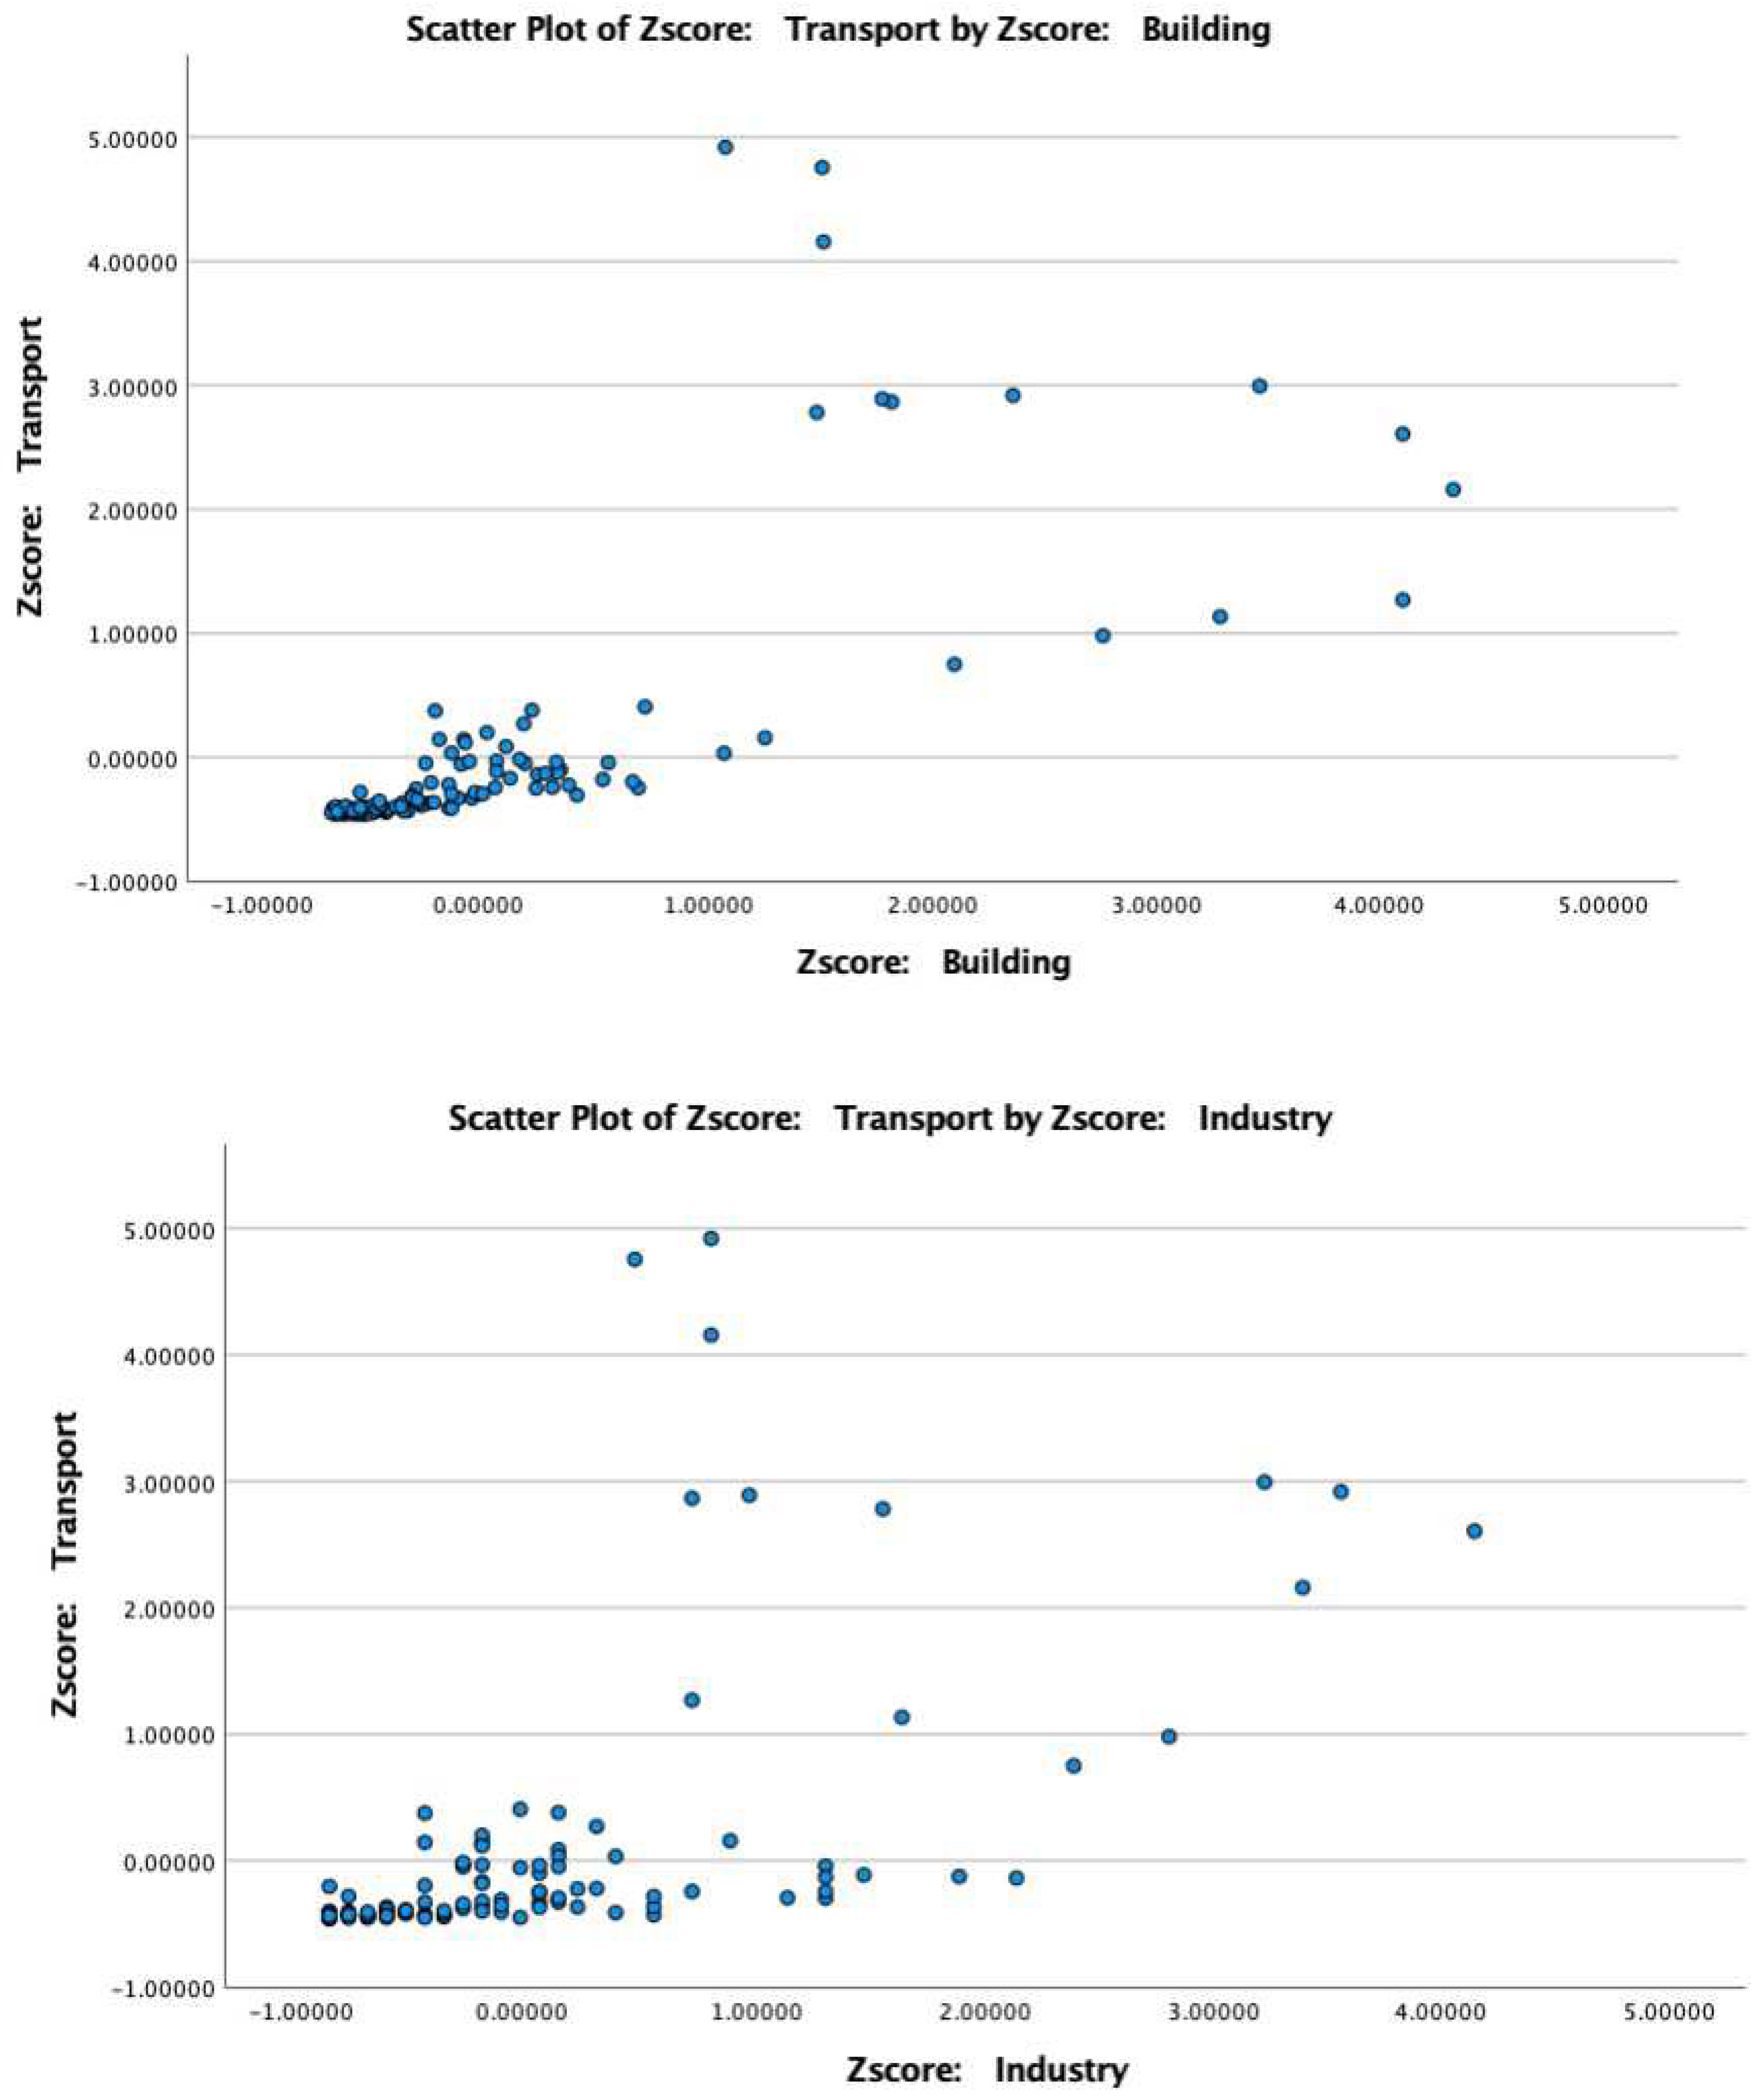

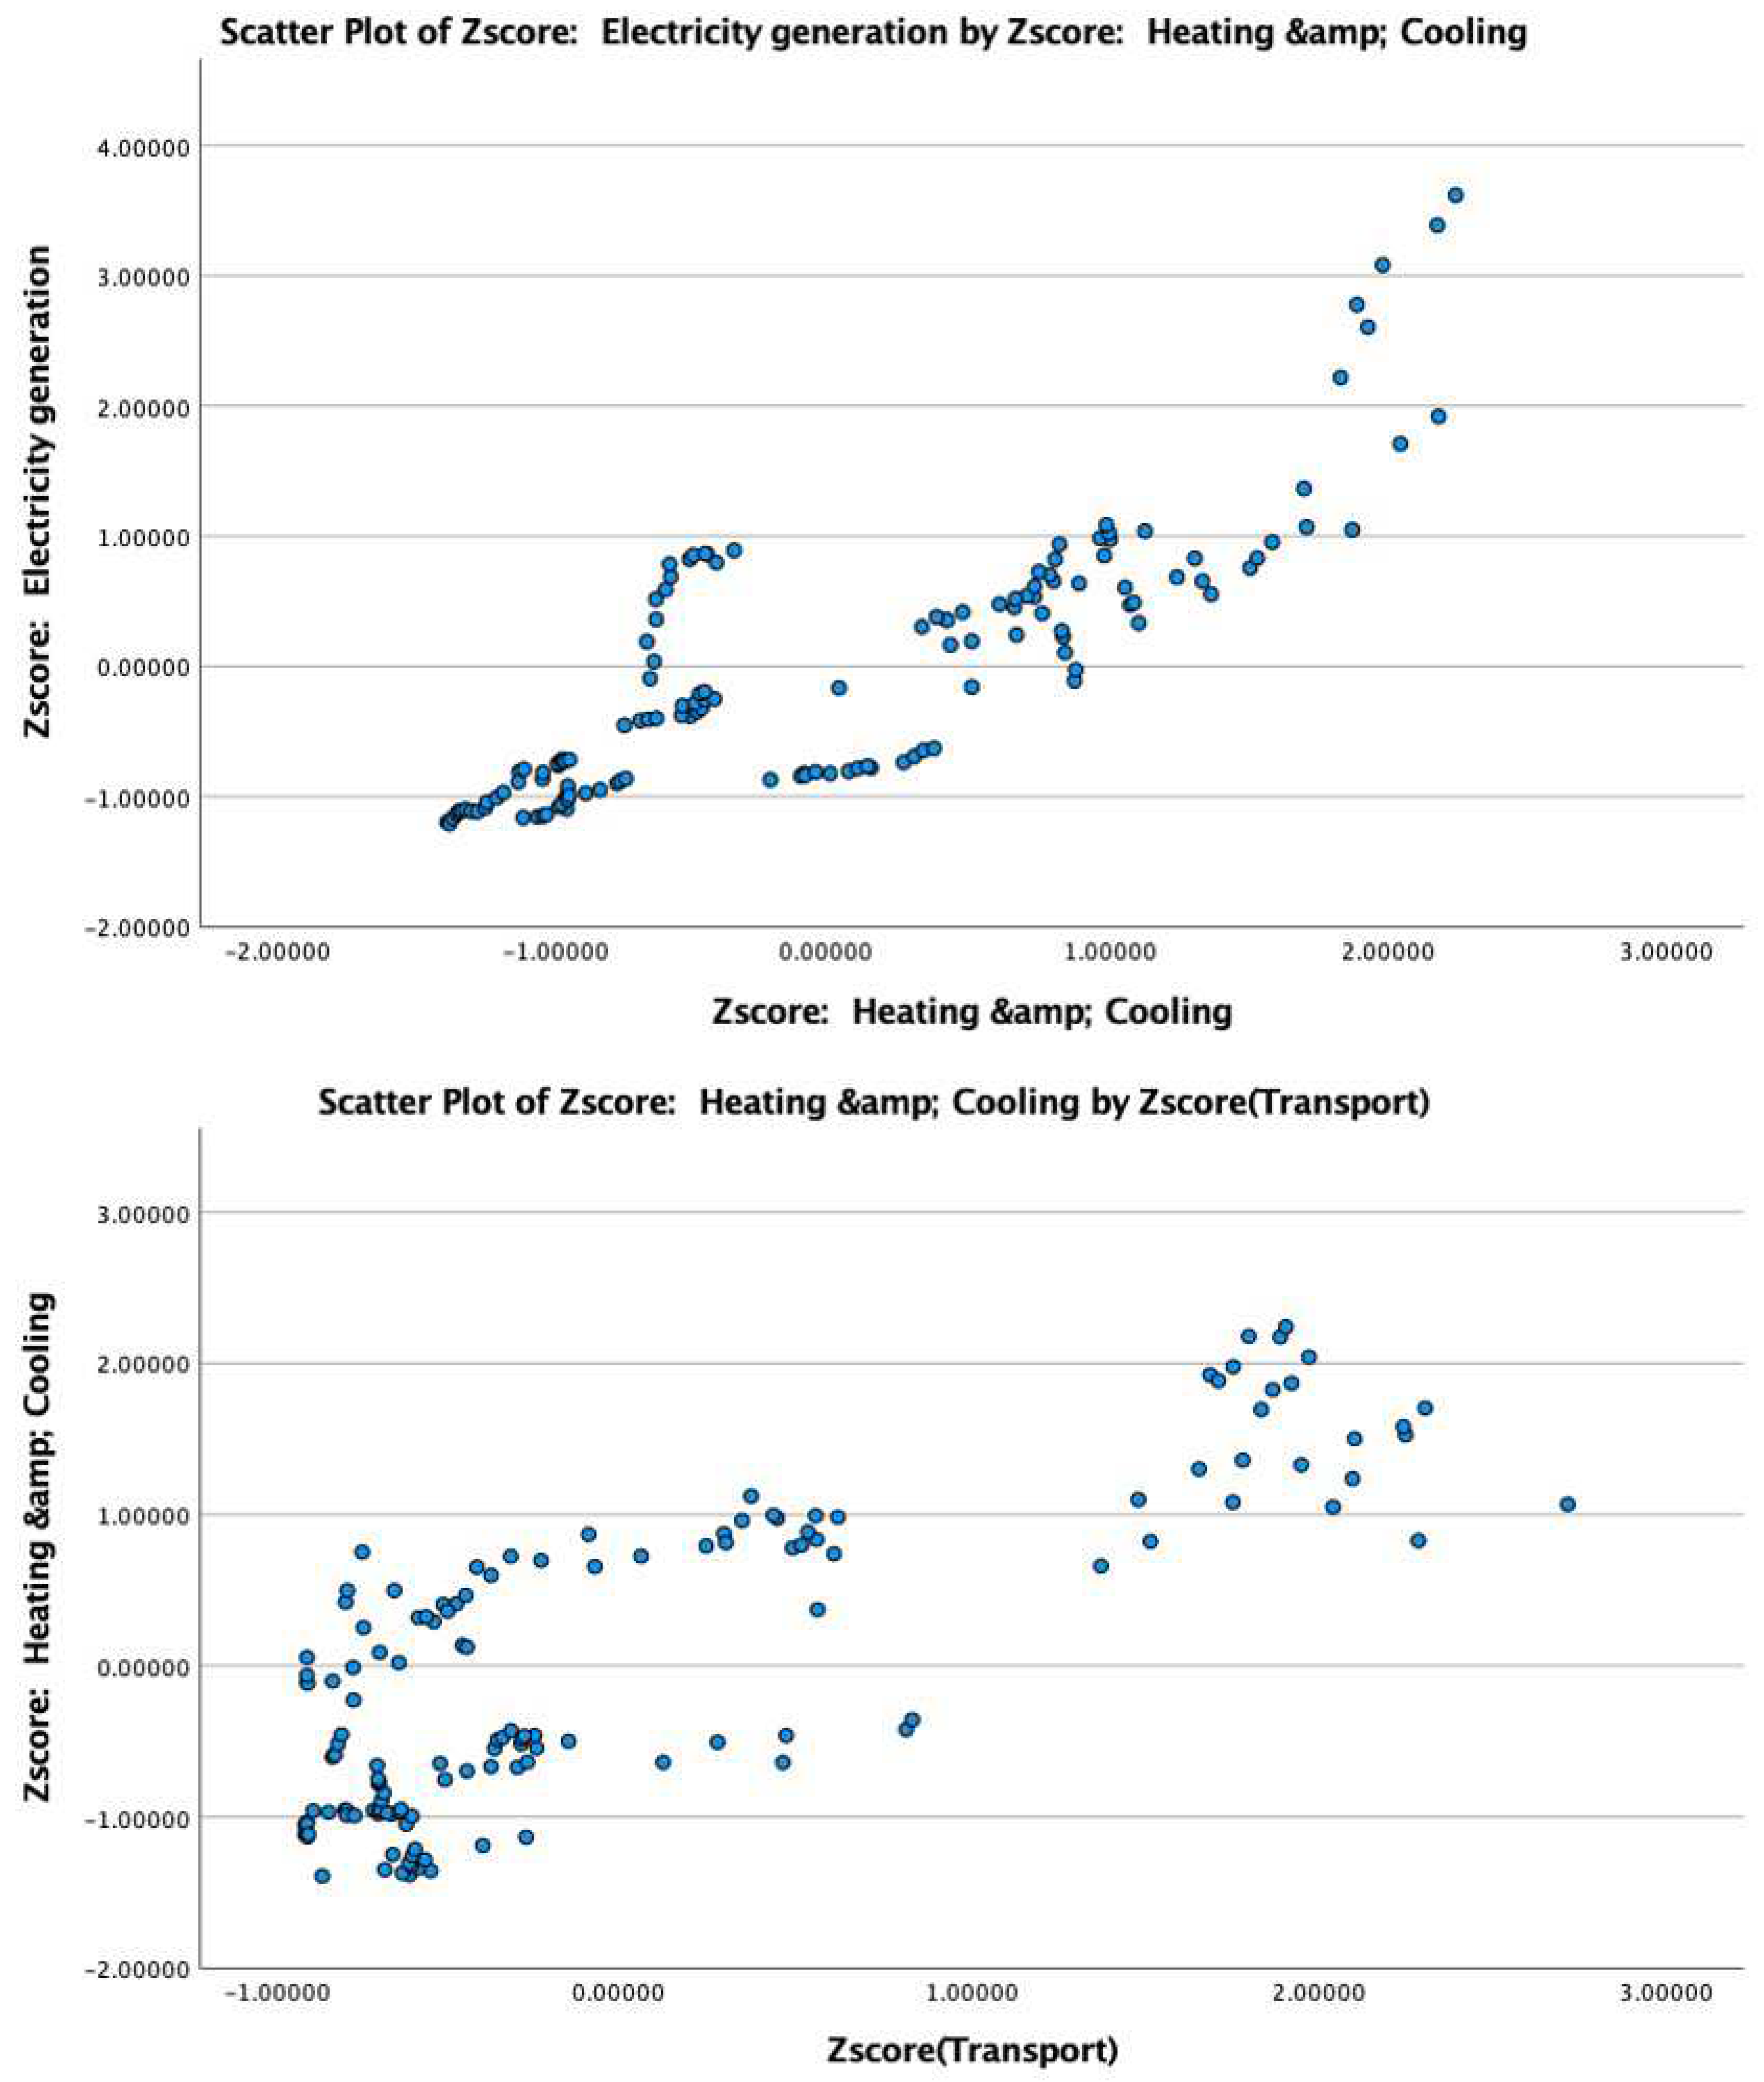
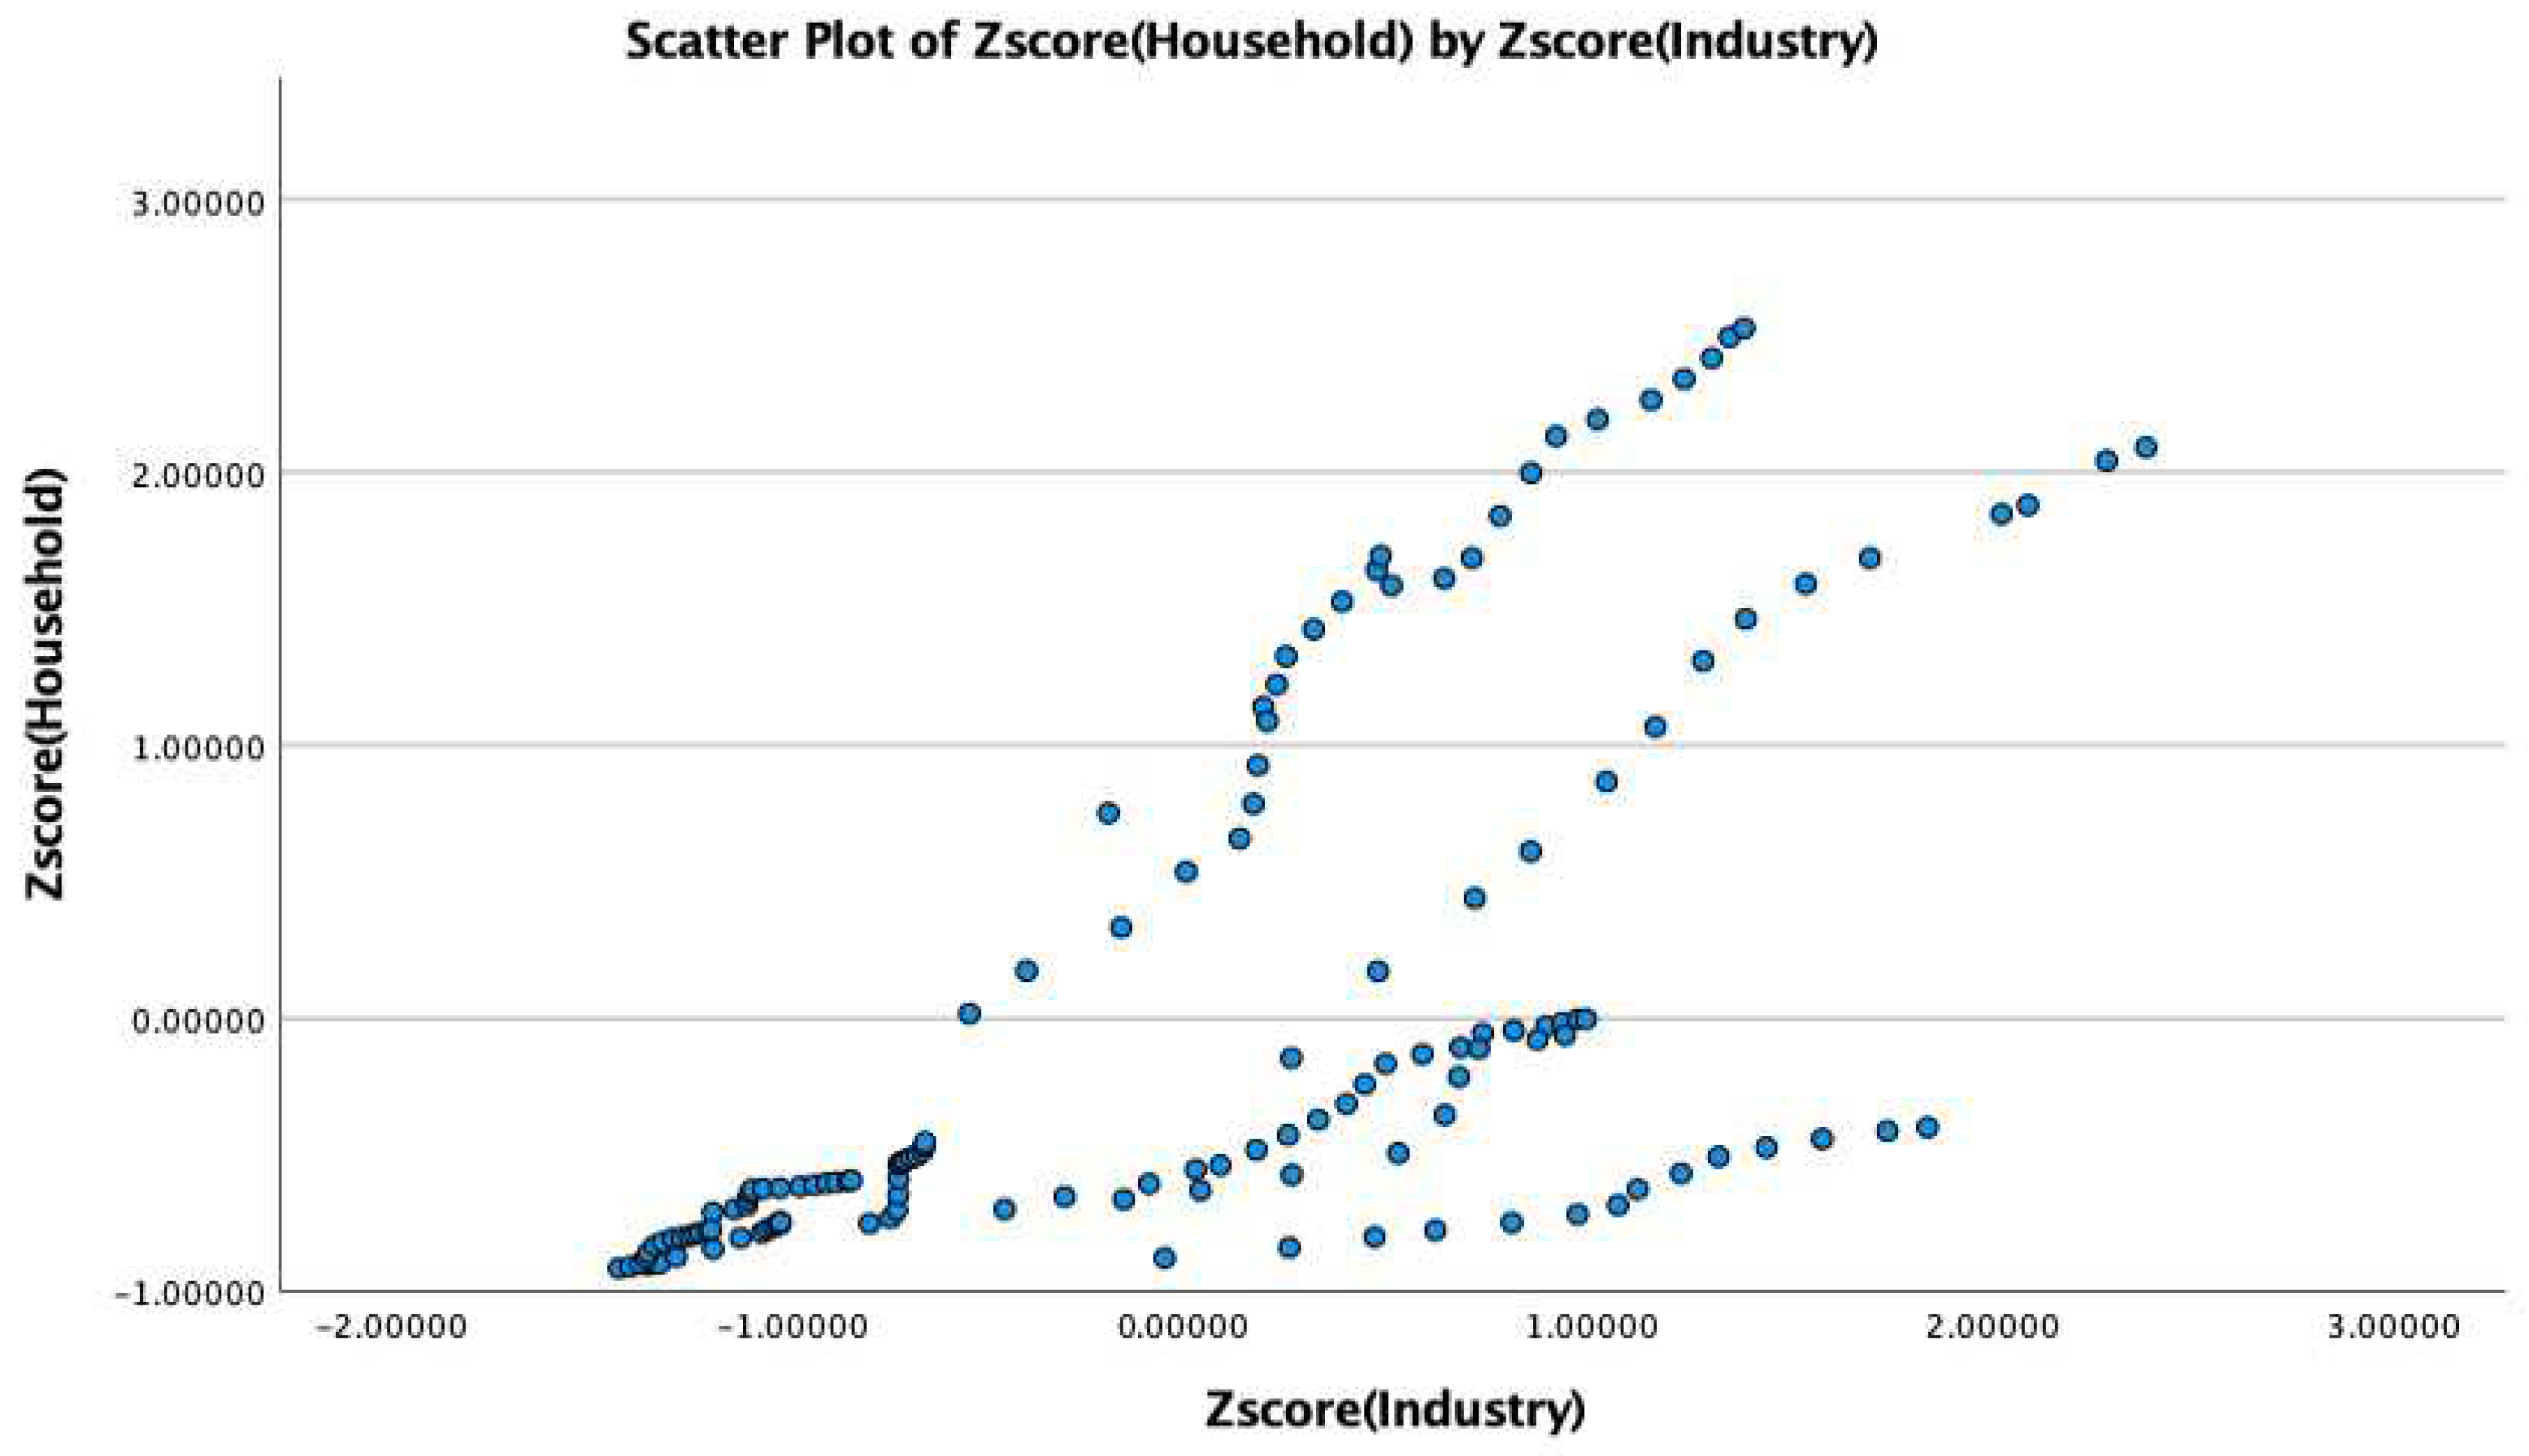
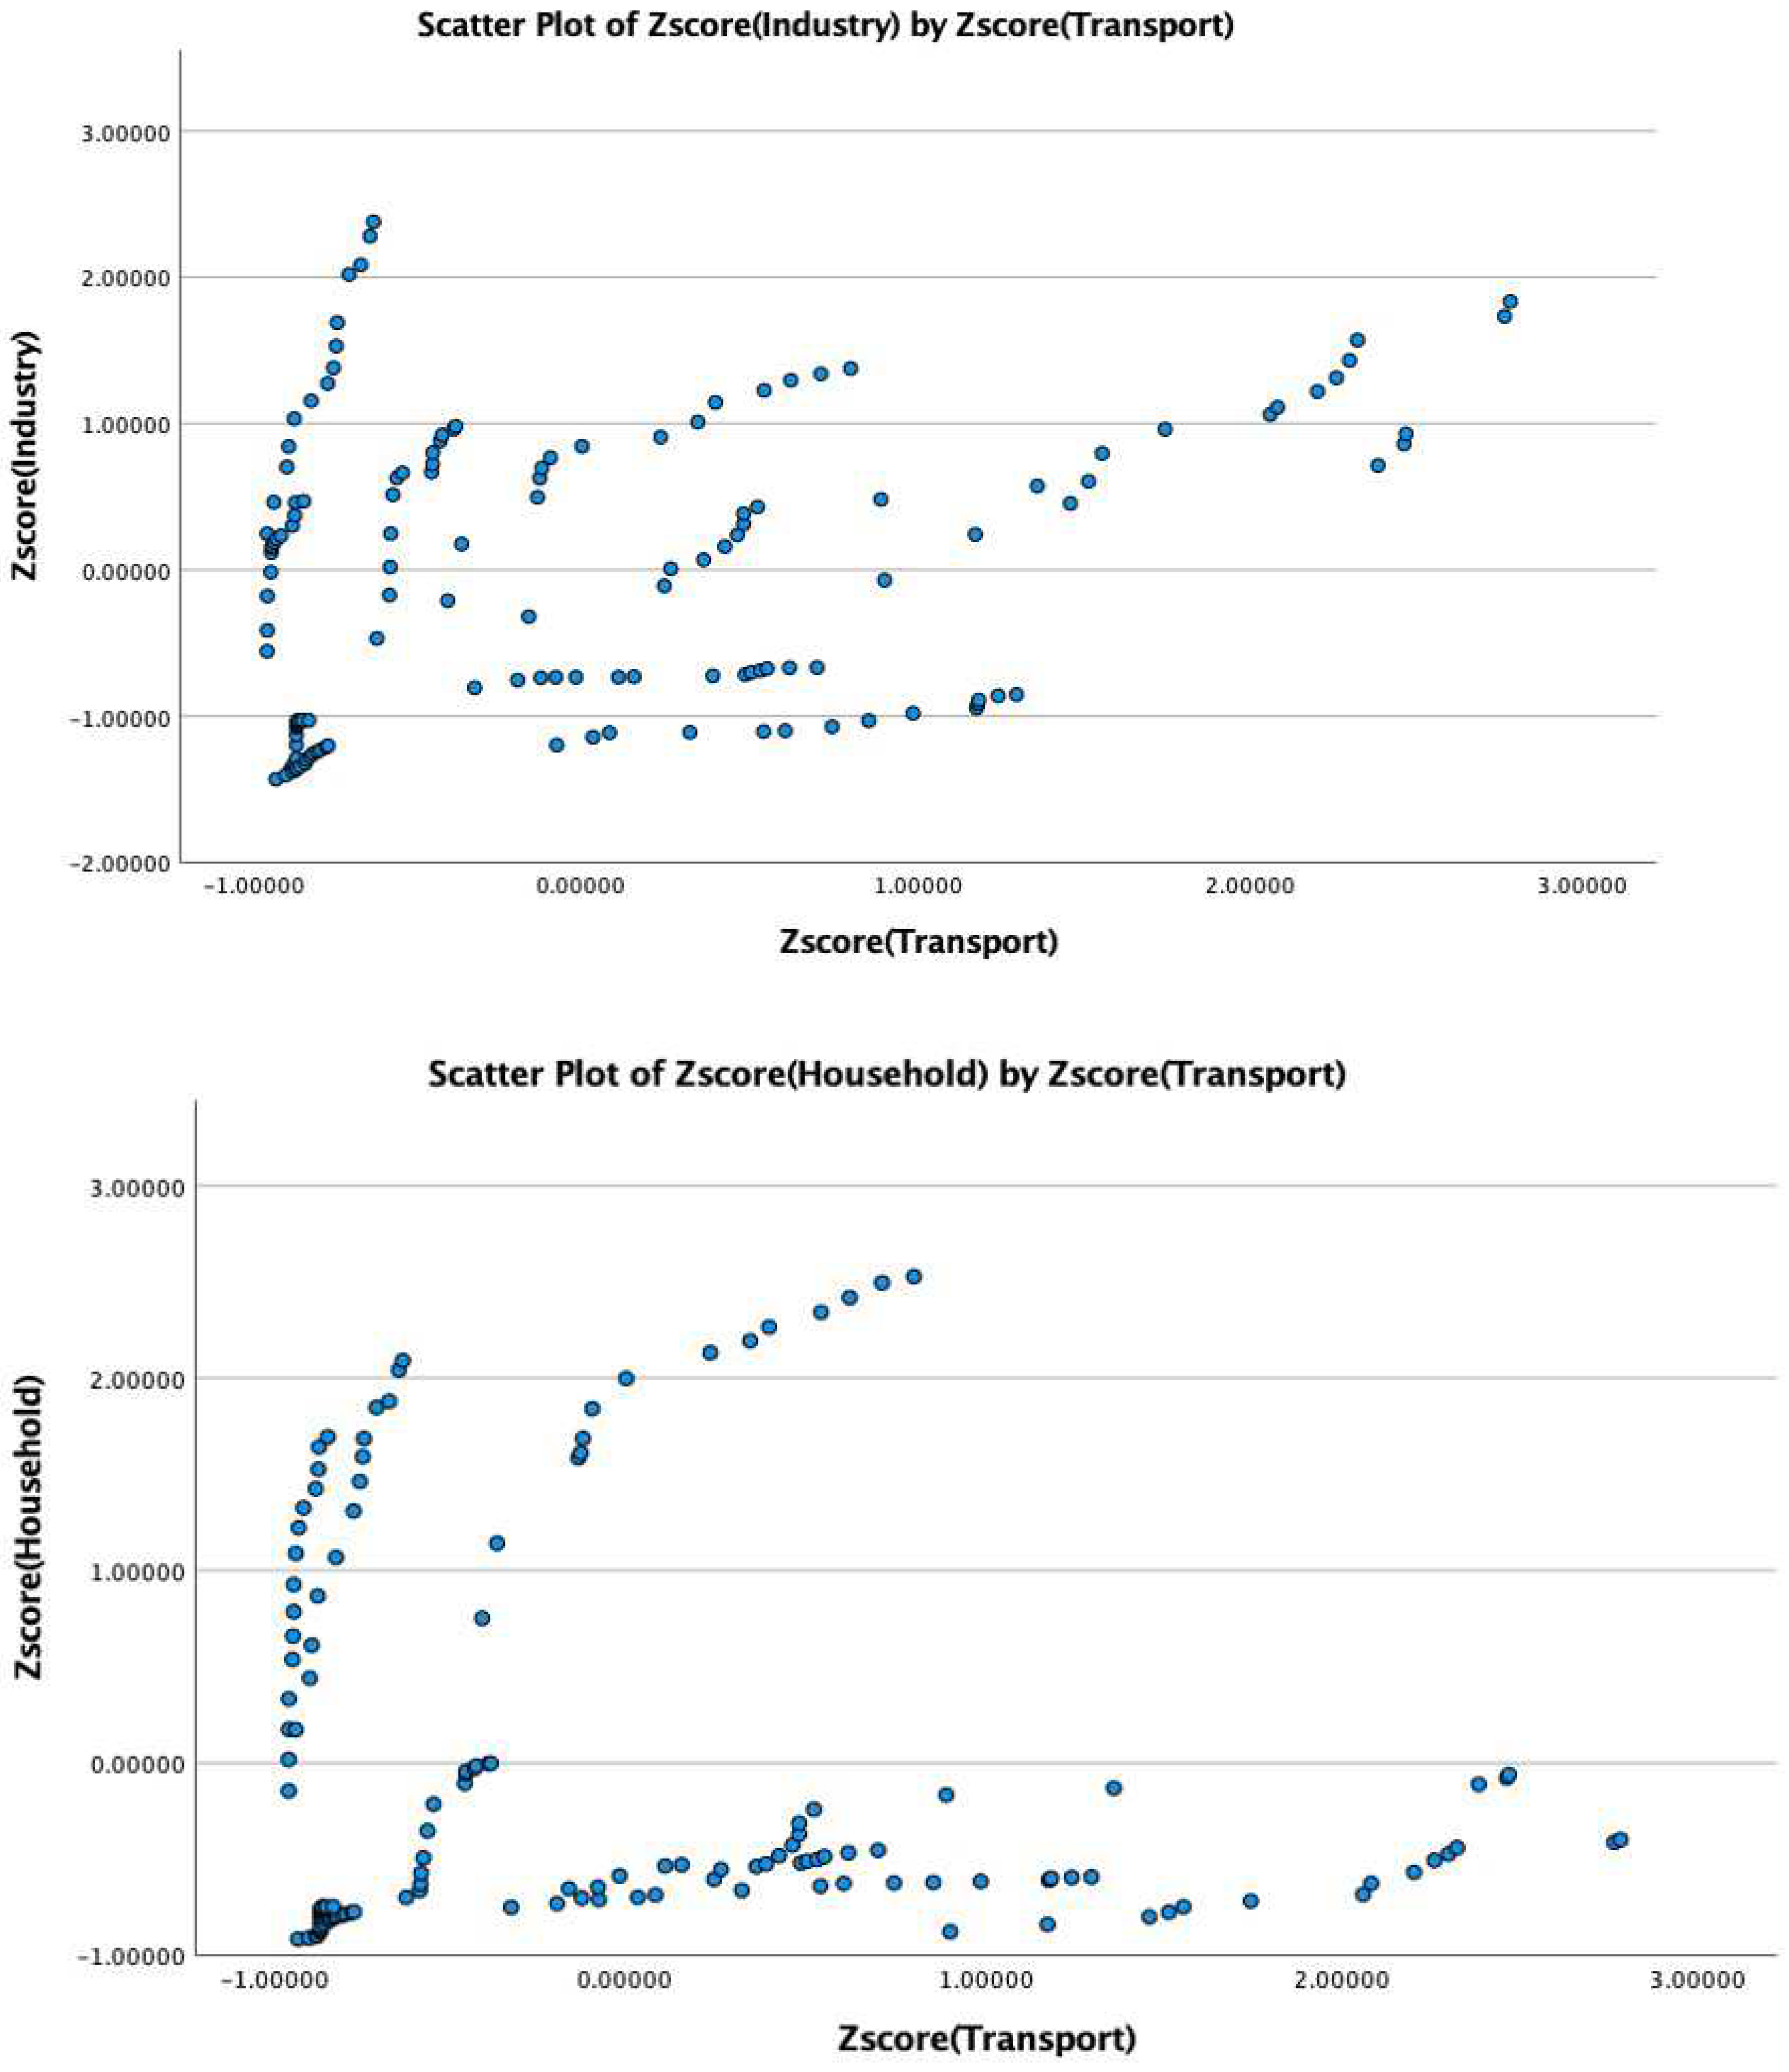
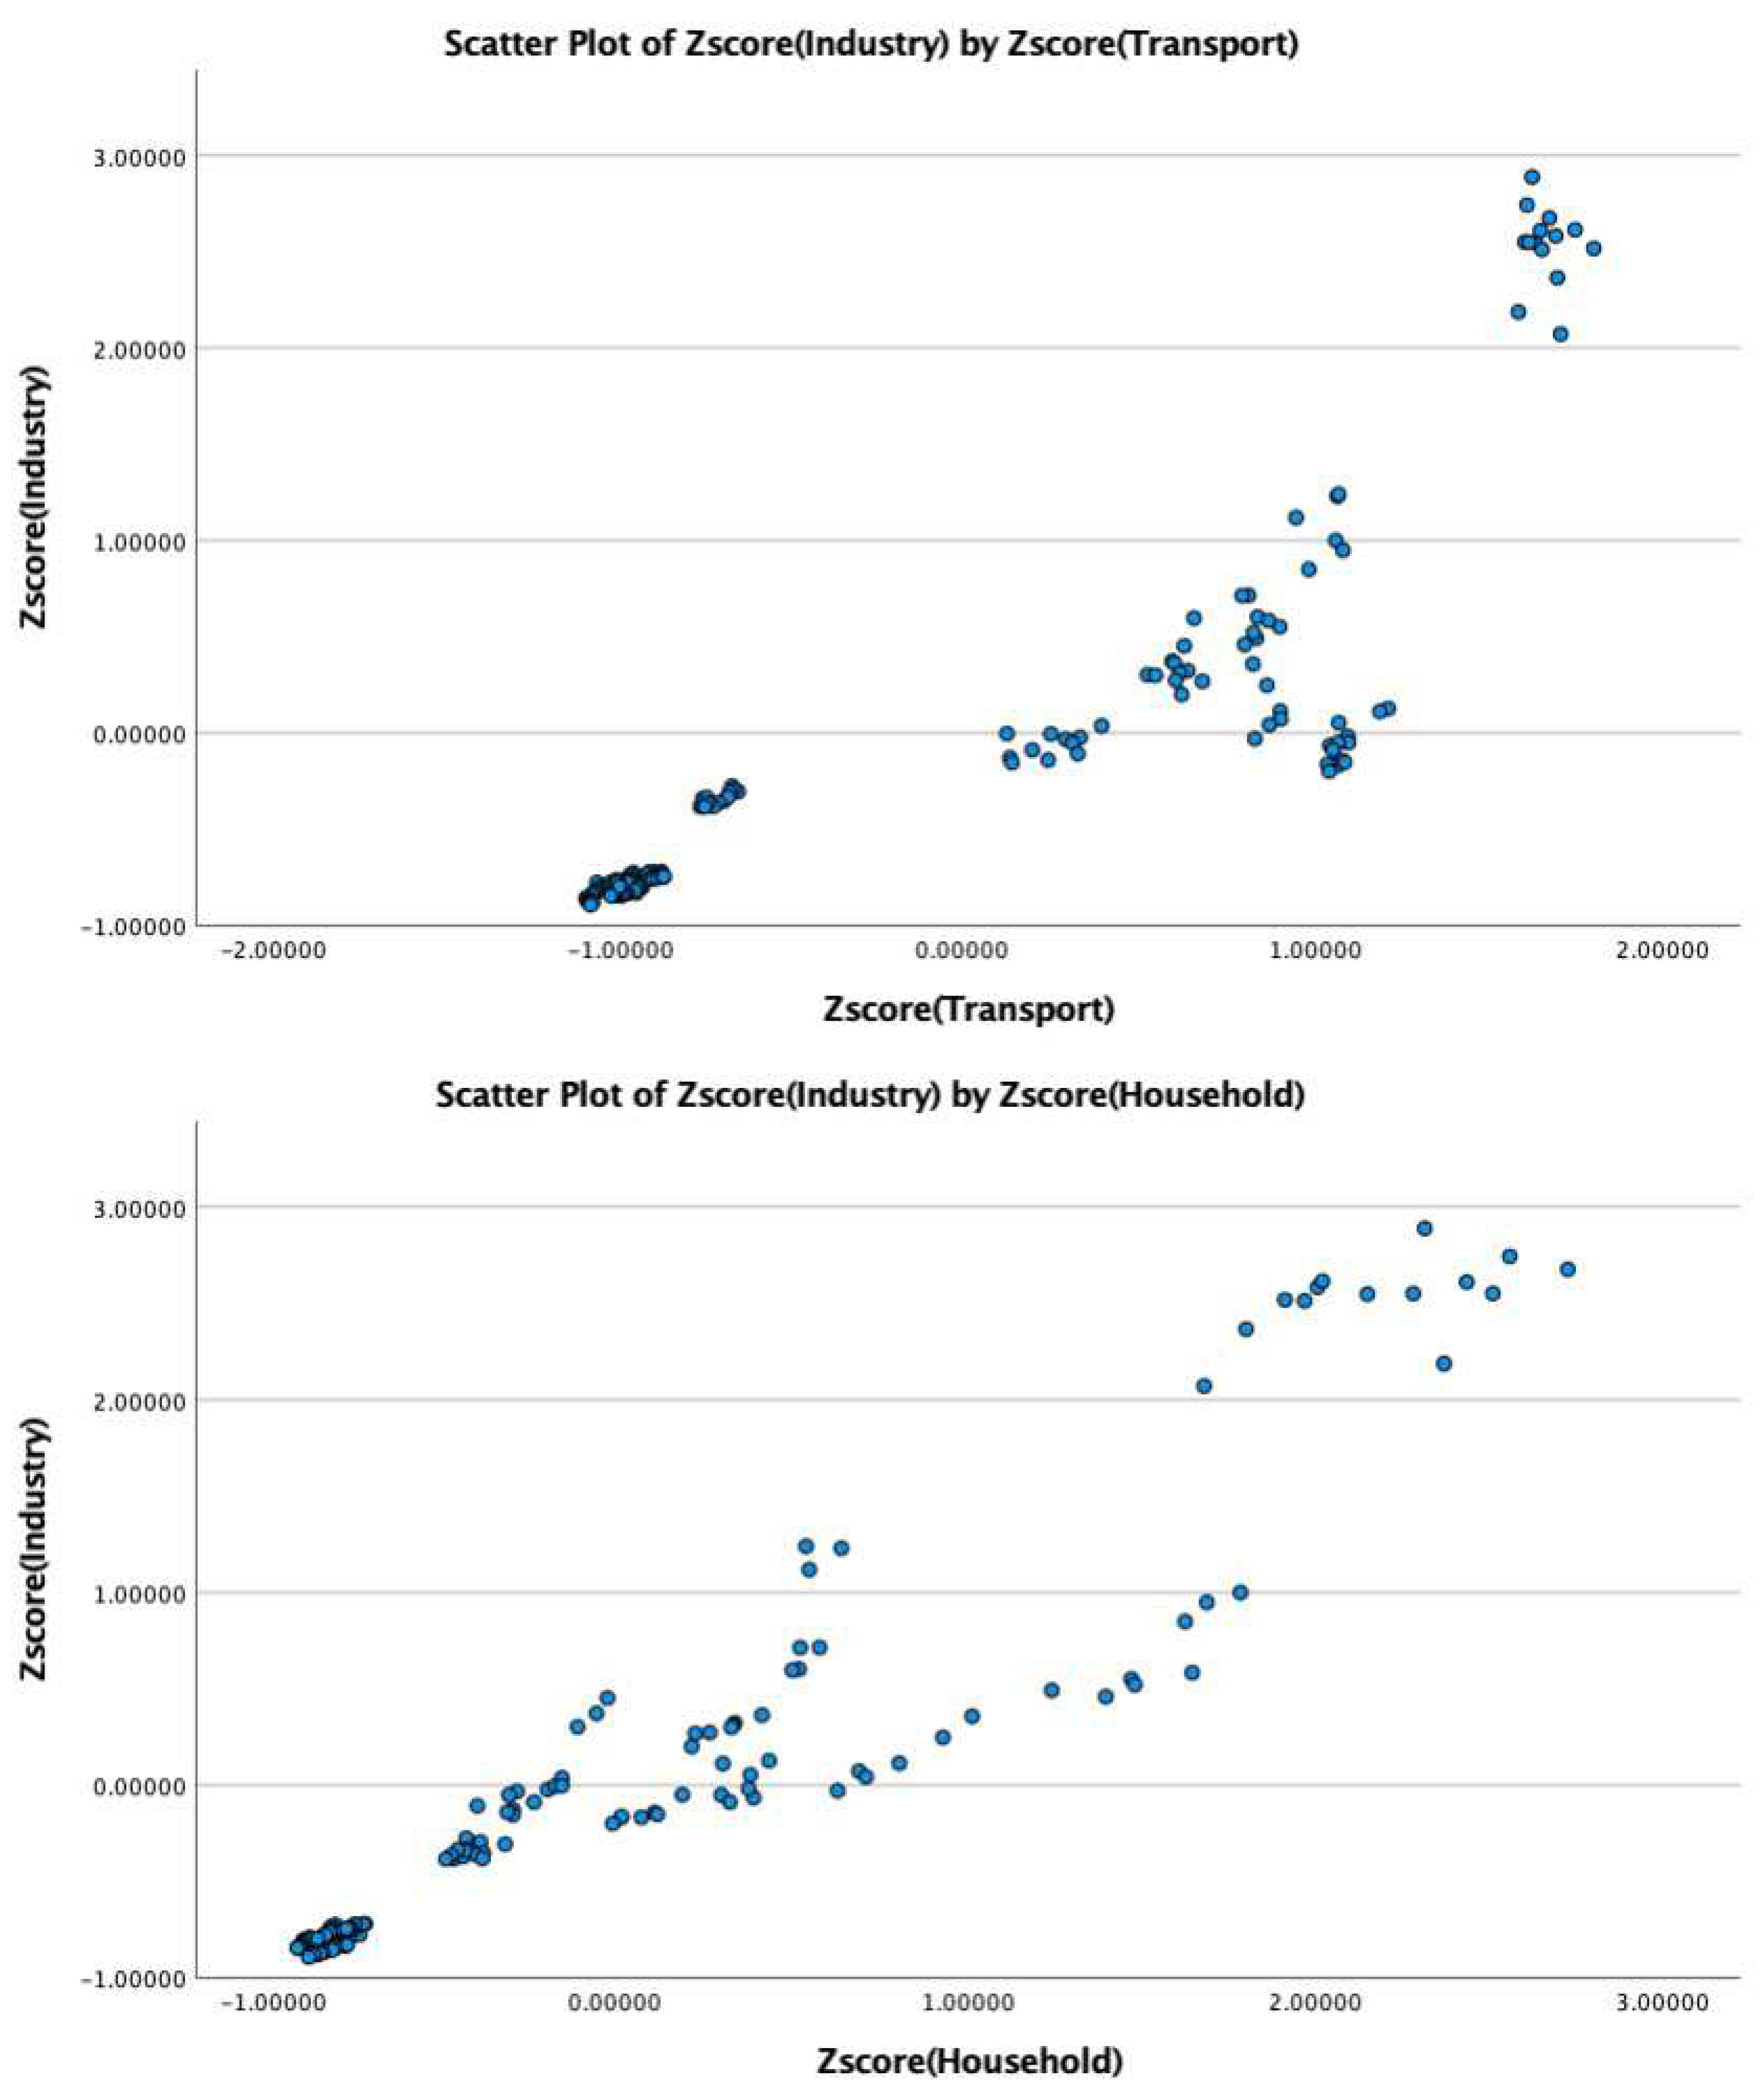
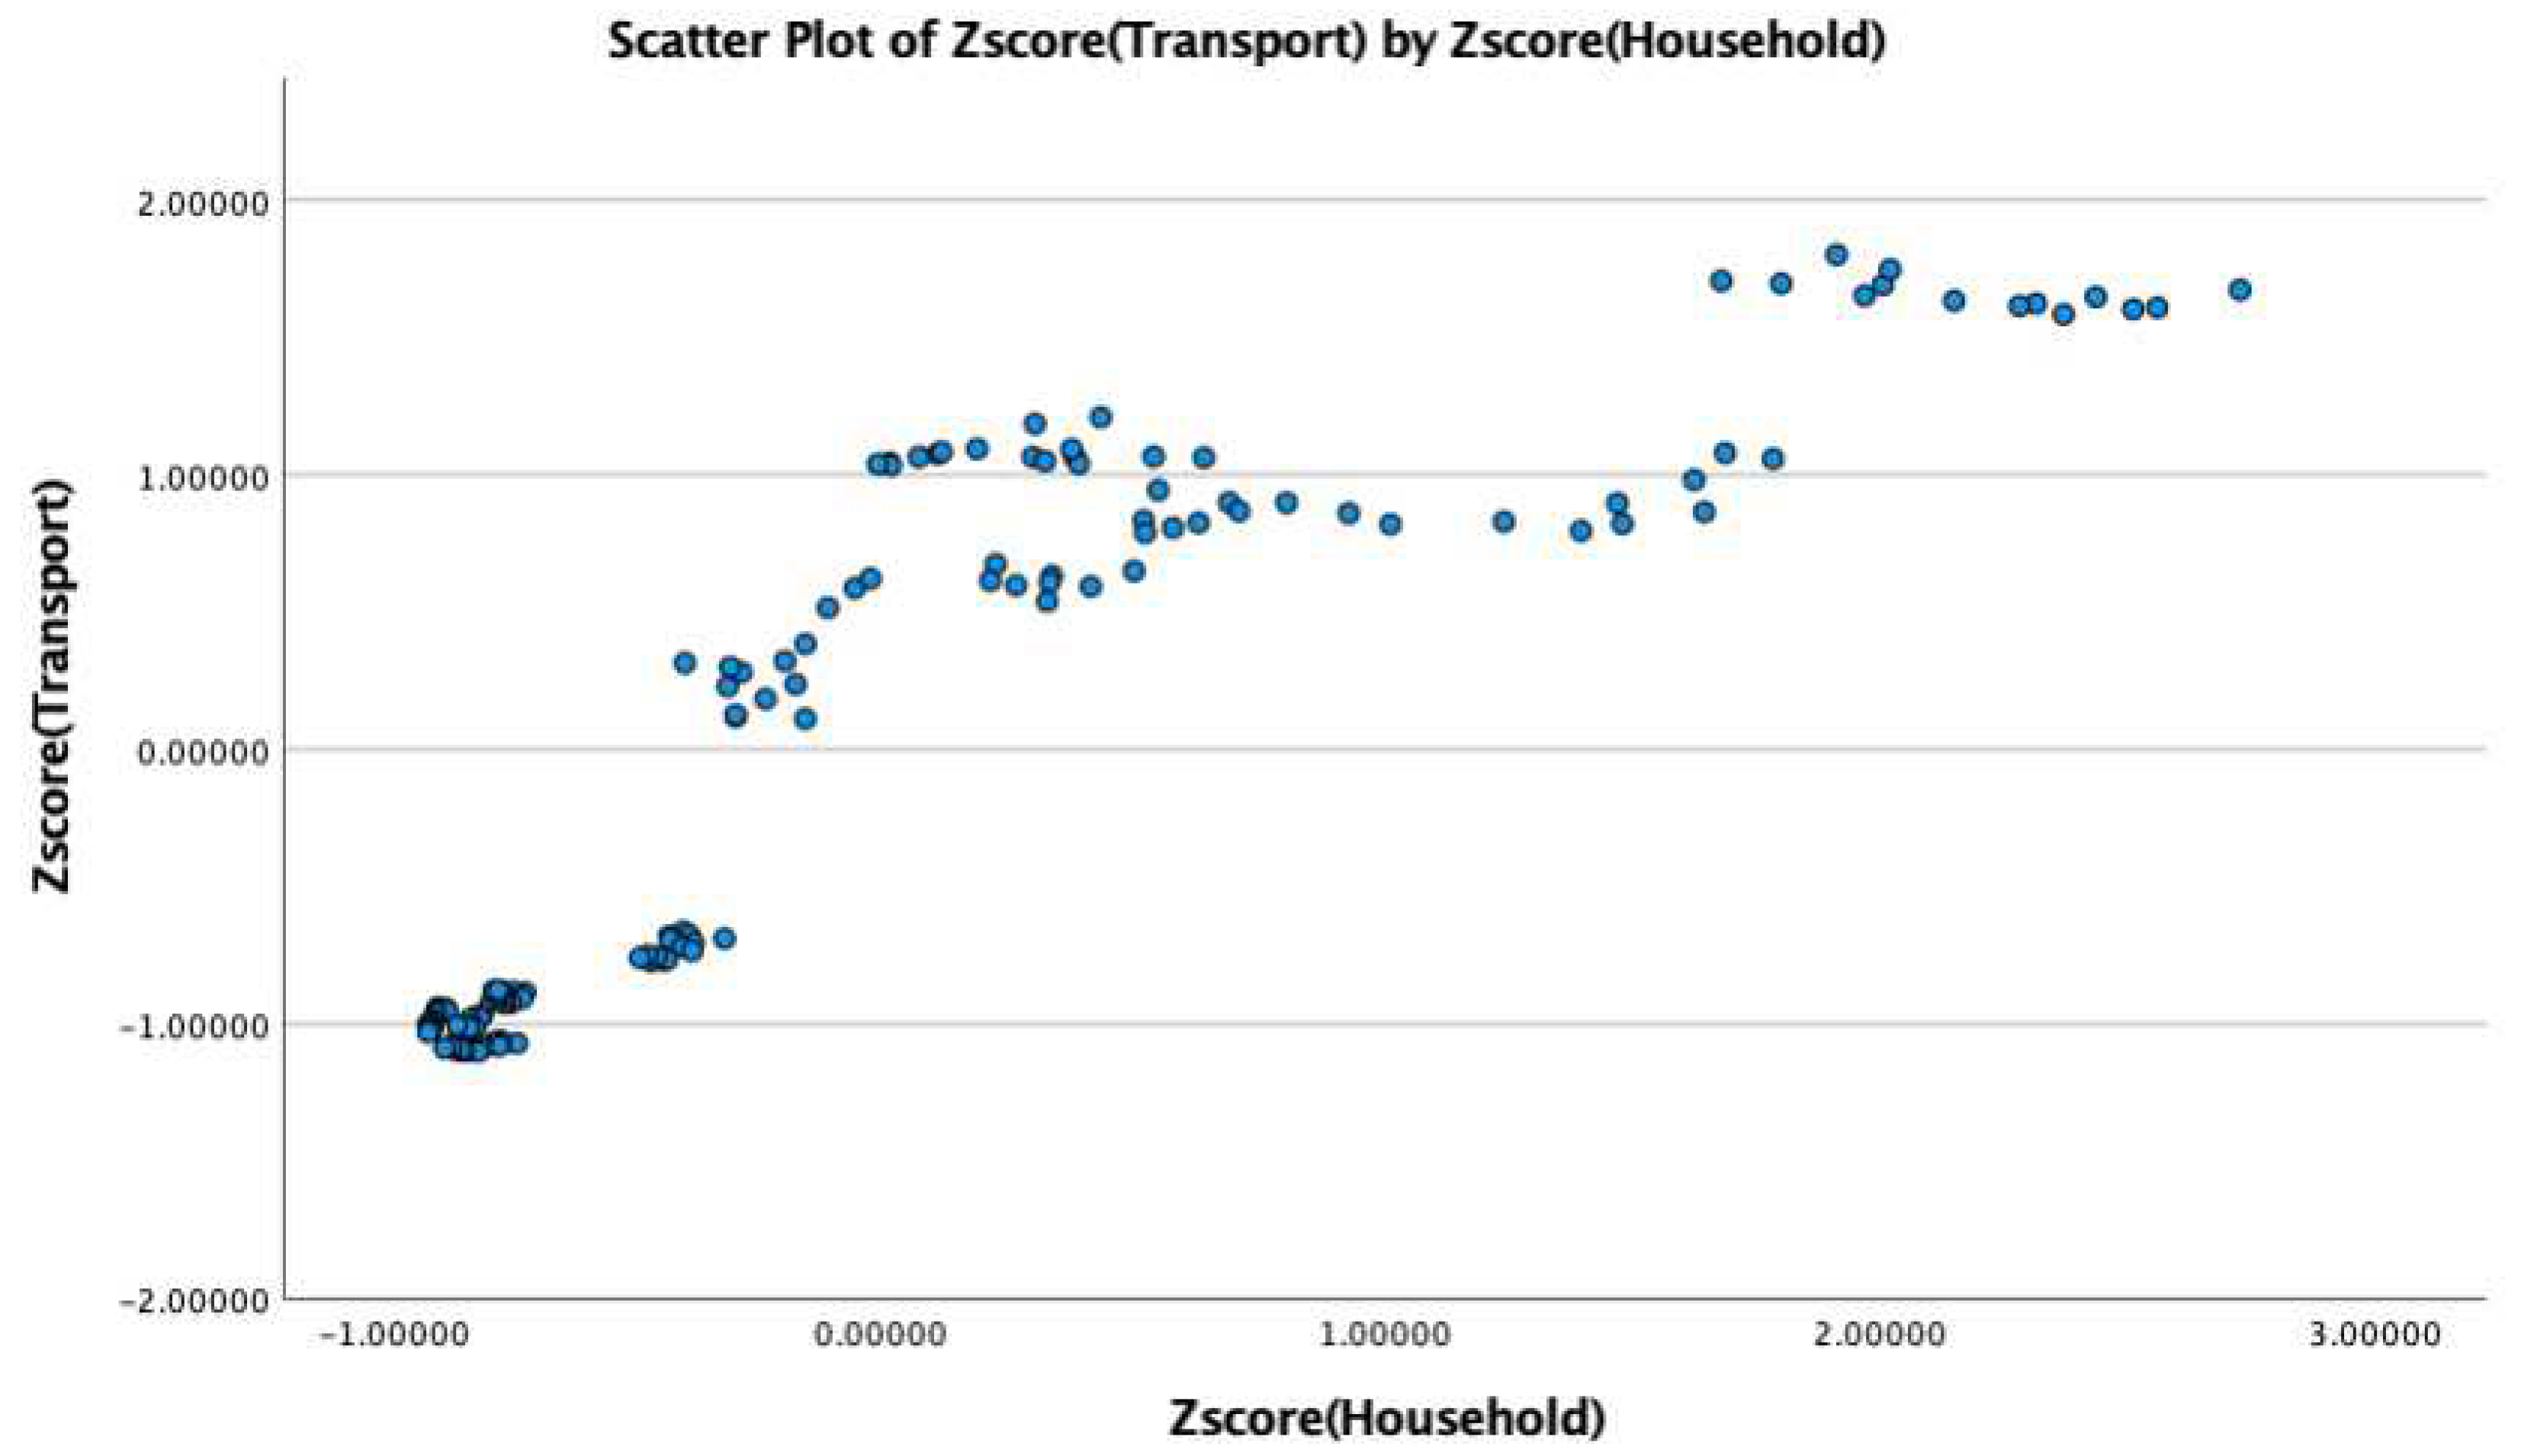
Disclaimer/Publisher’s Note: The statements, opinions and data contained in all publications are solely those of the individual author(s) and contributor(s) and not of MDPI and/or the editor(s). MDPI and/or the editor(s) disclaim responsibility for any injury to people or property resulting from any ideas, methods, instructions or products referred to in the content. |
© 2023 by the authors. Licensee MDPI, Basel, Switzerland. This article is an open access article distributed under the terms and conditions of the Creative Commons Attribution (CC BY) license (https://creativecommons.org/licenses/by/4.0/).