

Effects of Mobility Restrictions on Air Pollution in the Madrid Region during the COVID-19 Pandemic and Post-Pandemic Periods


Abstract
:1. Introduction
2. Materials and Methods
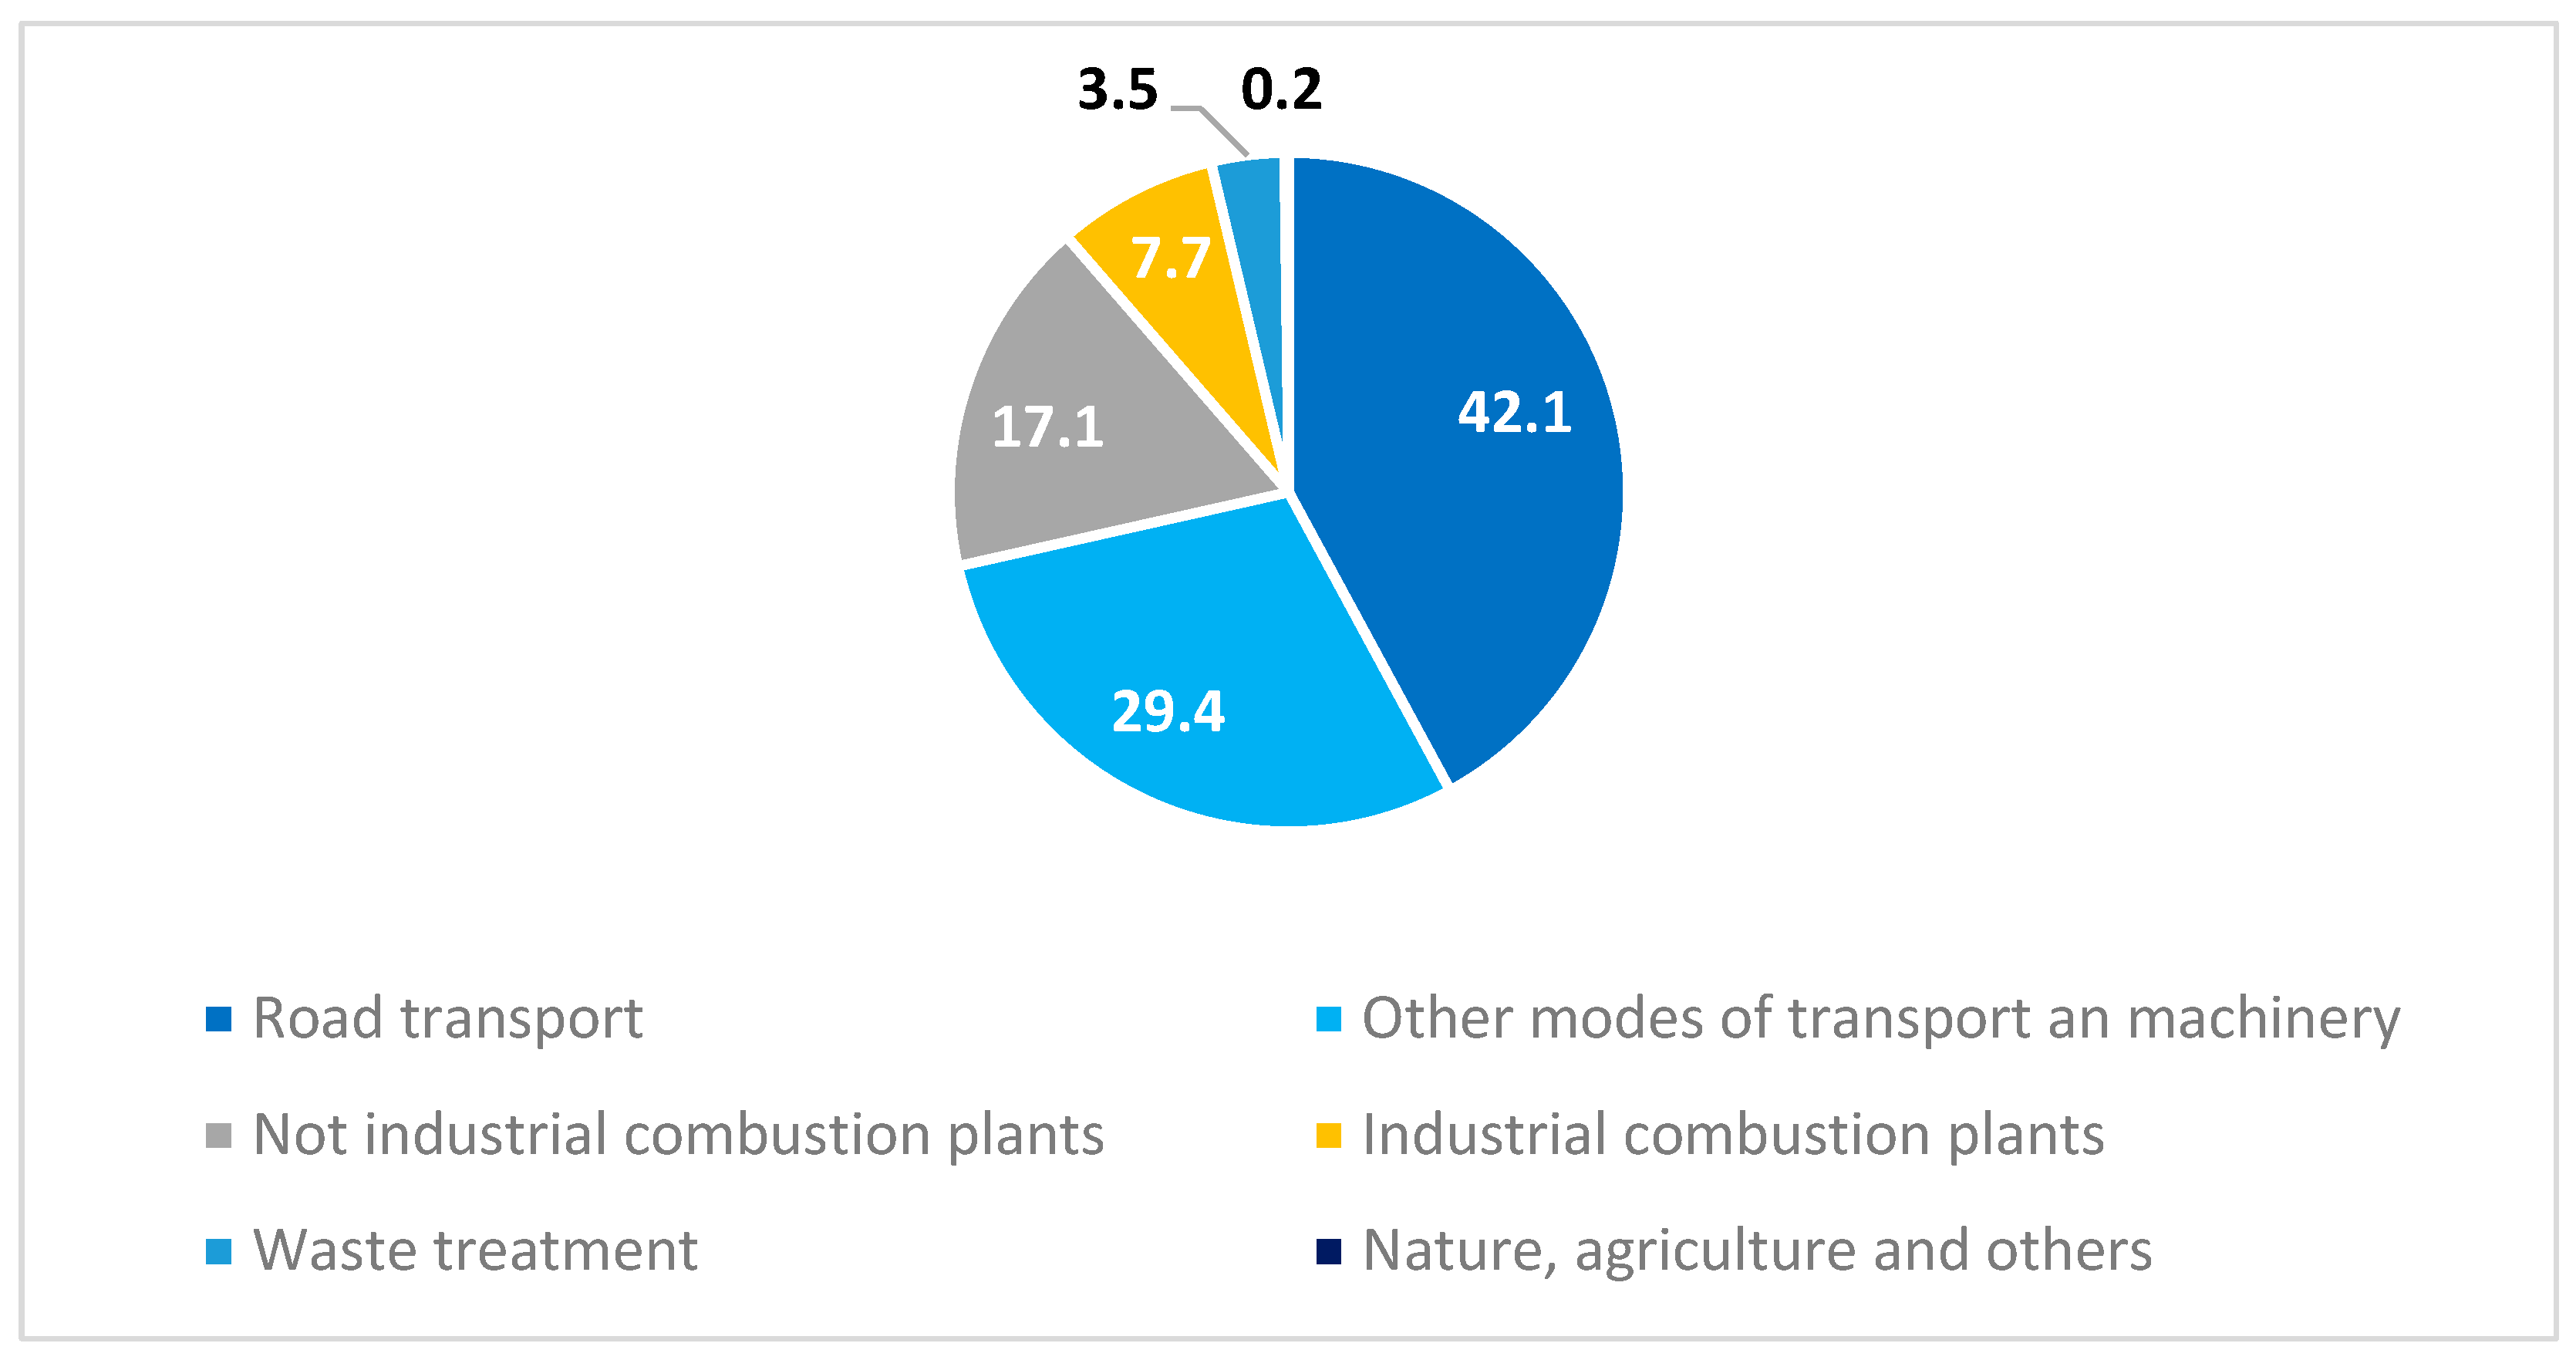
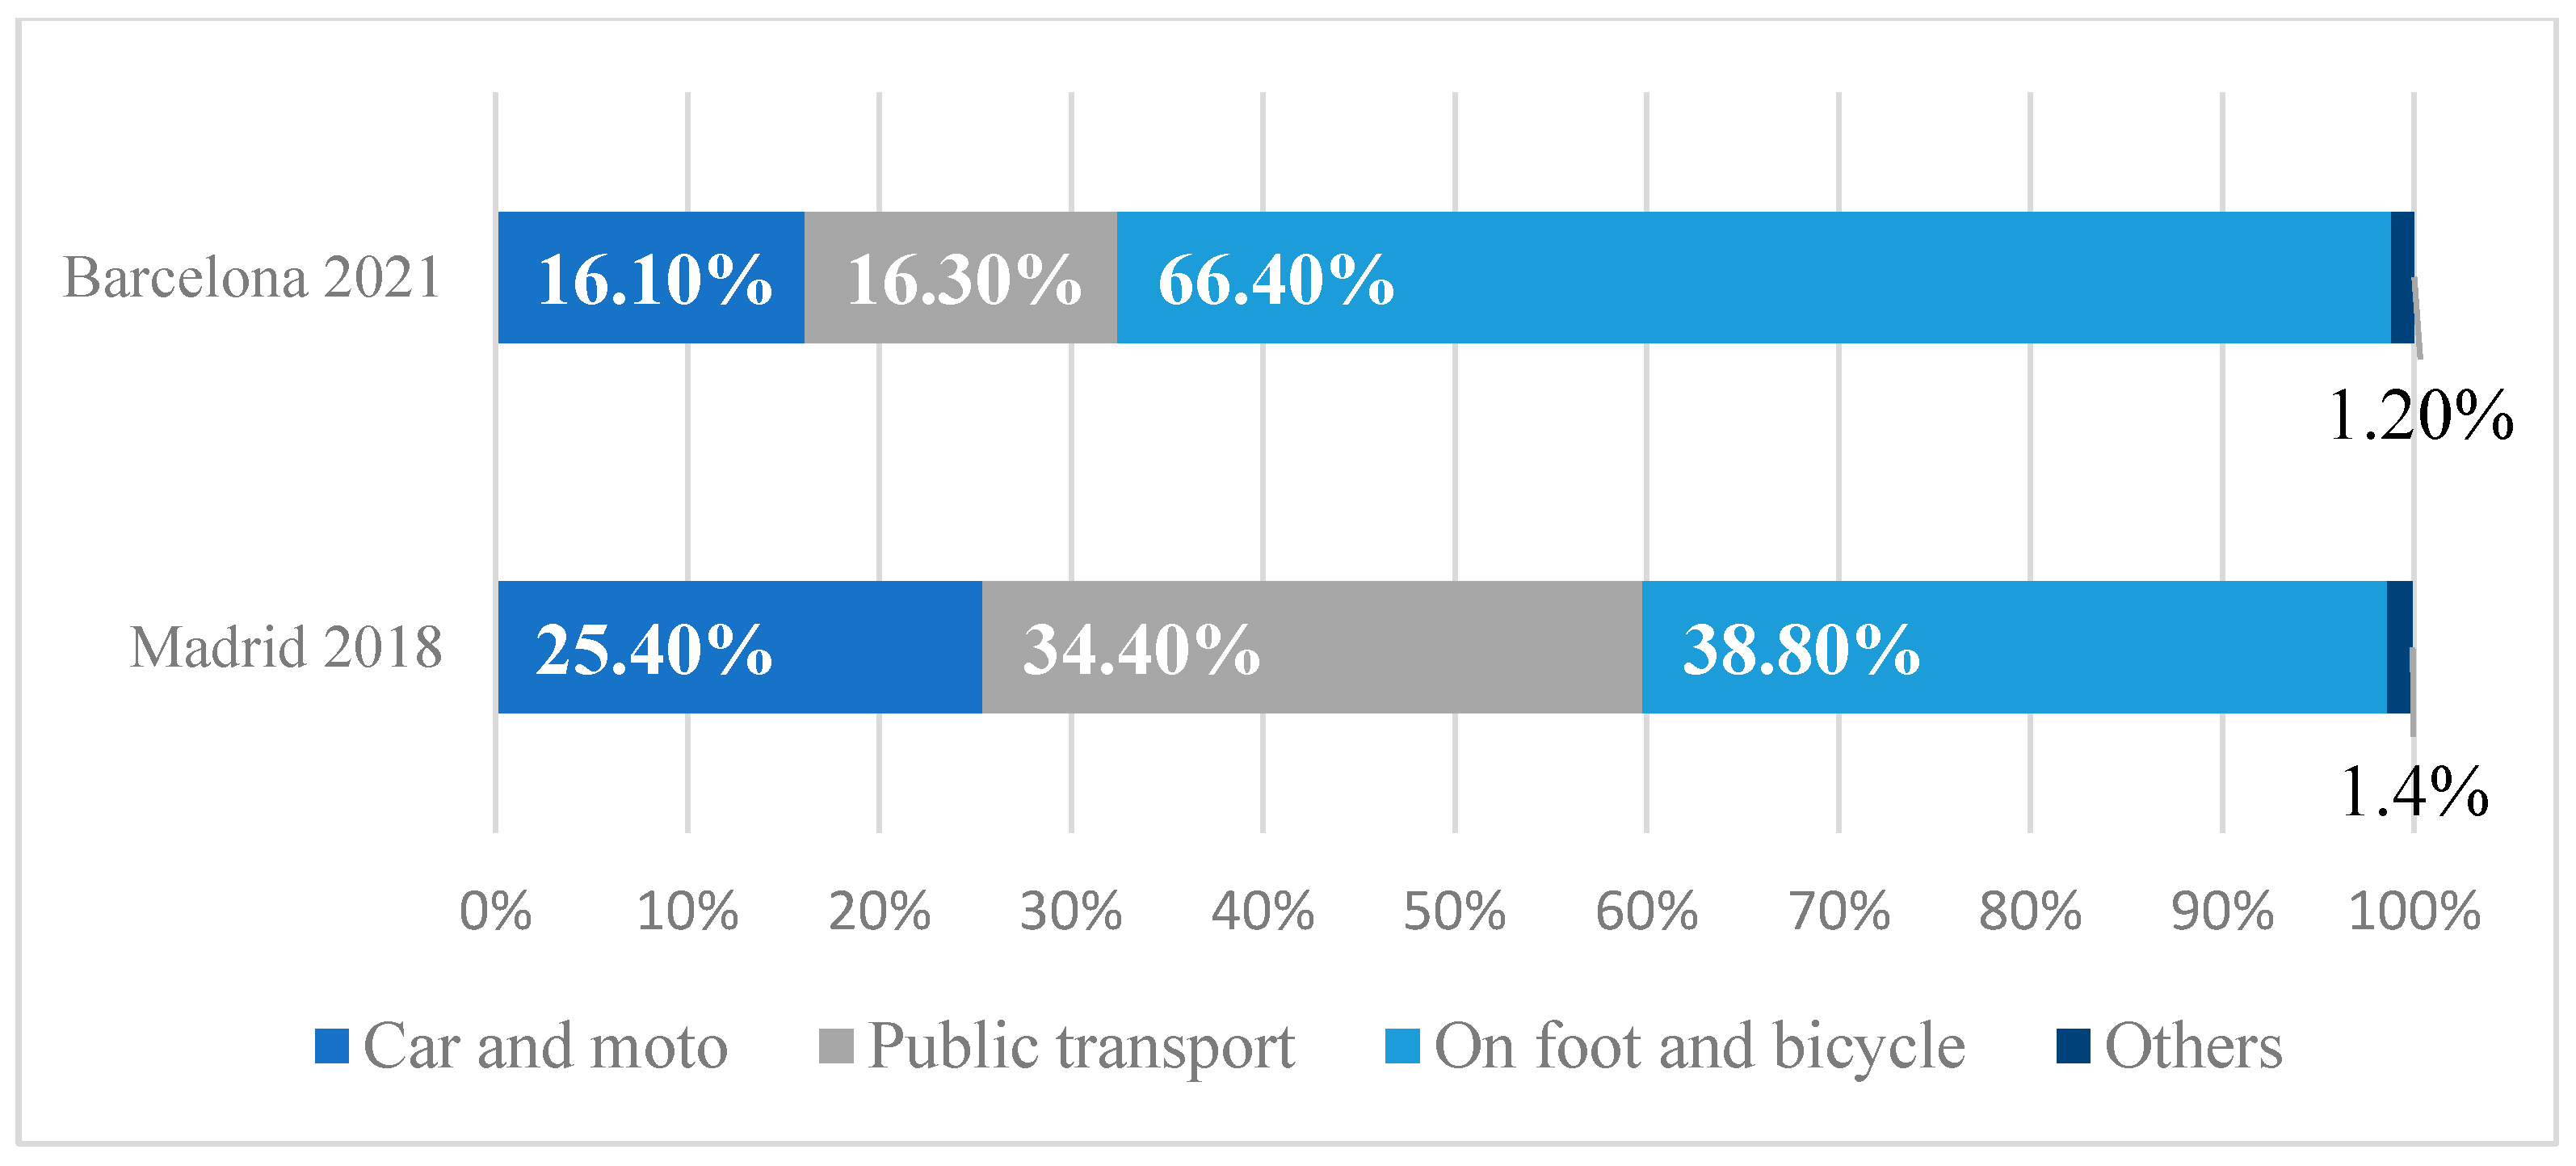
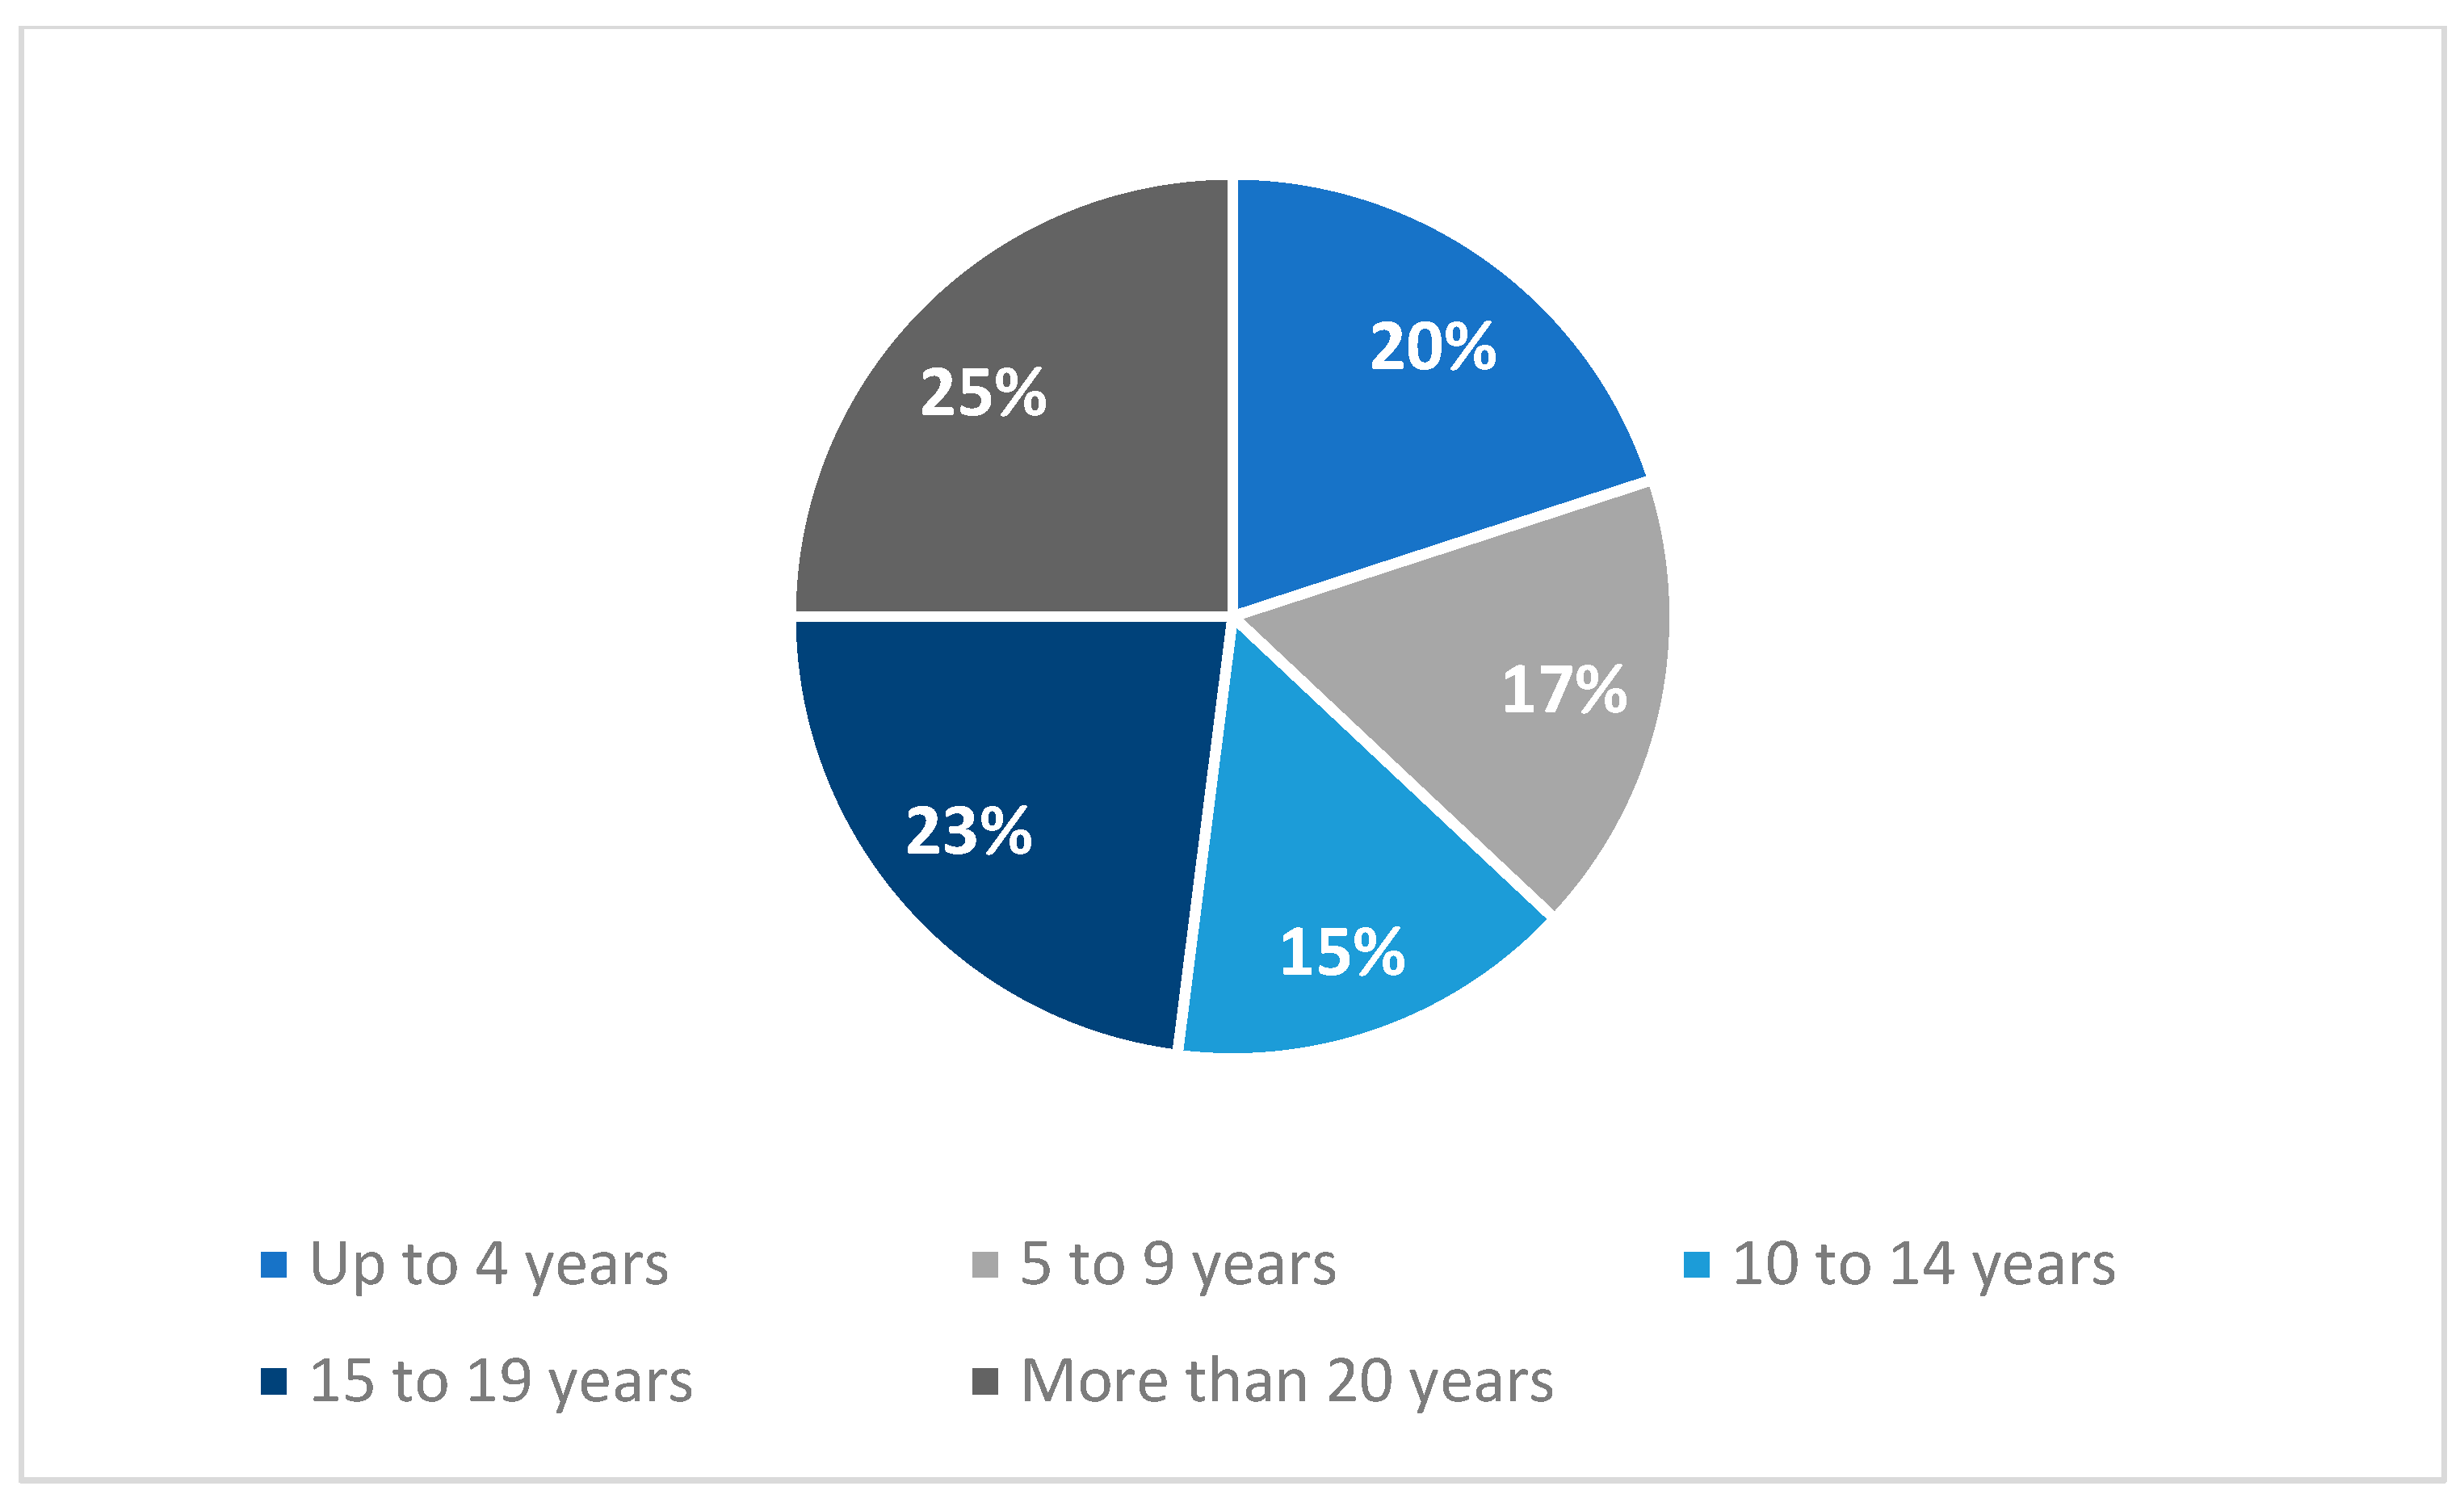
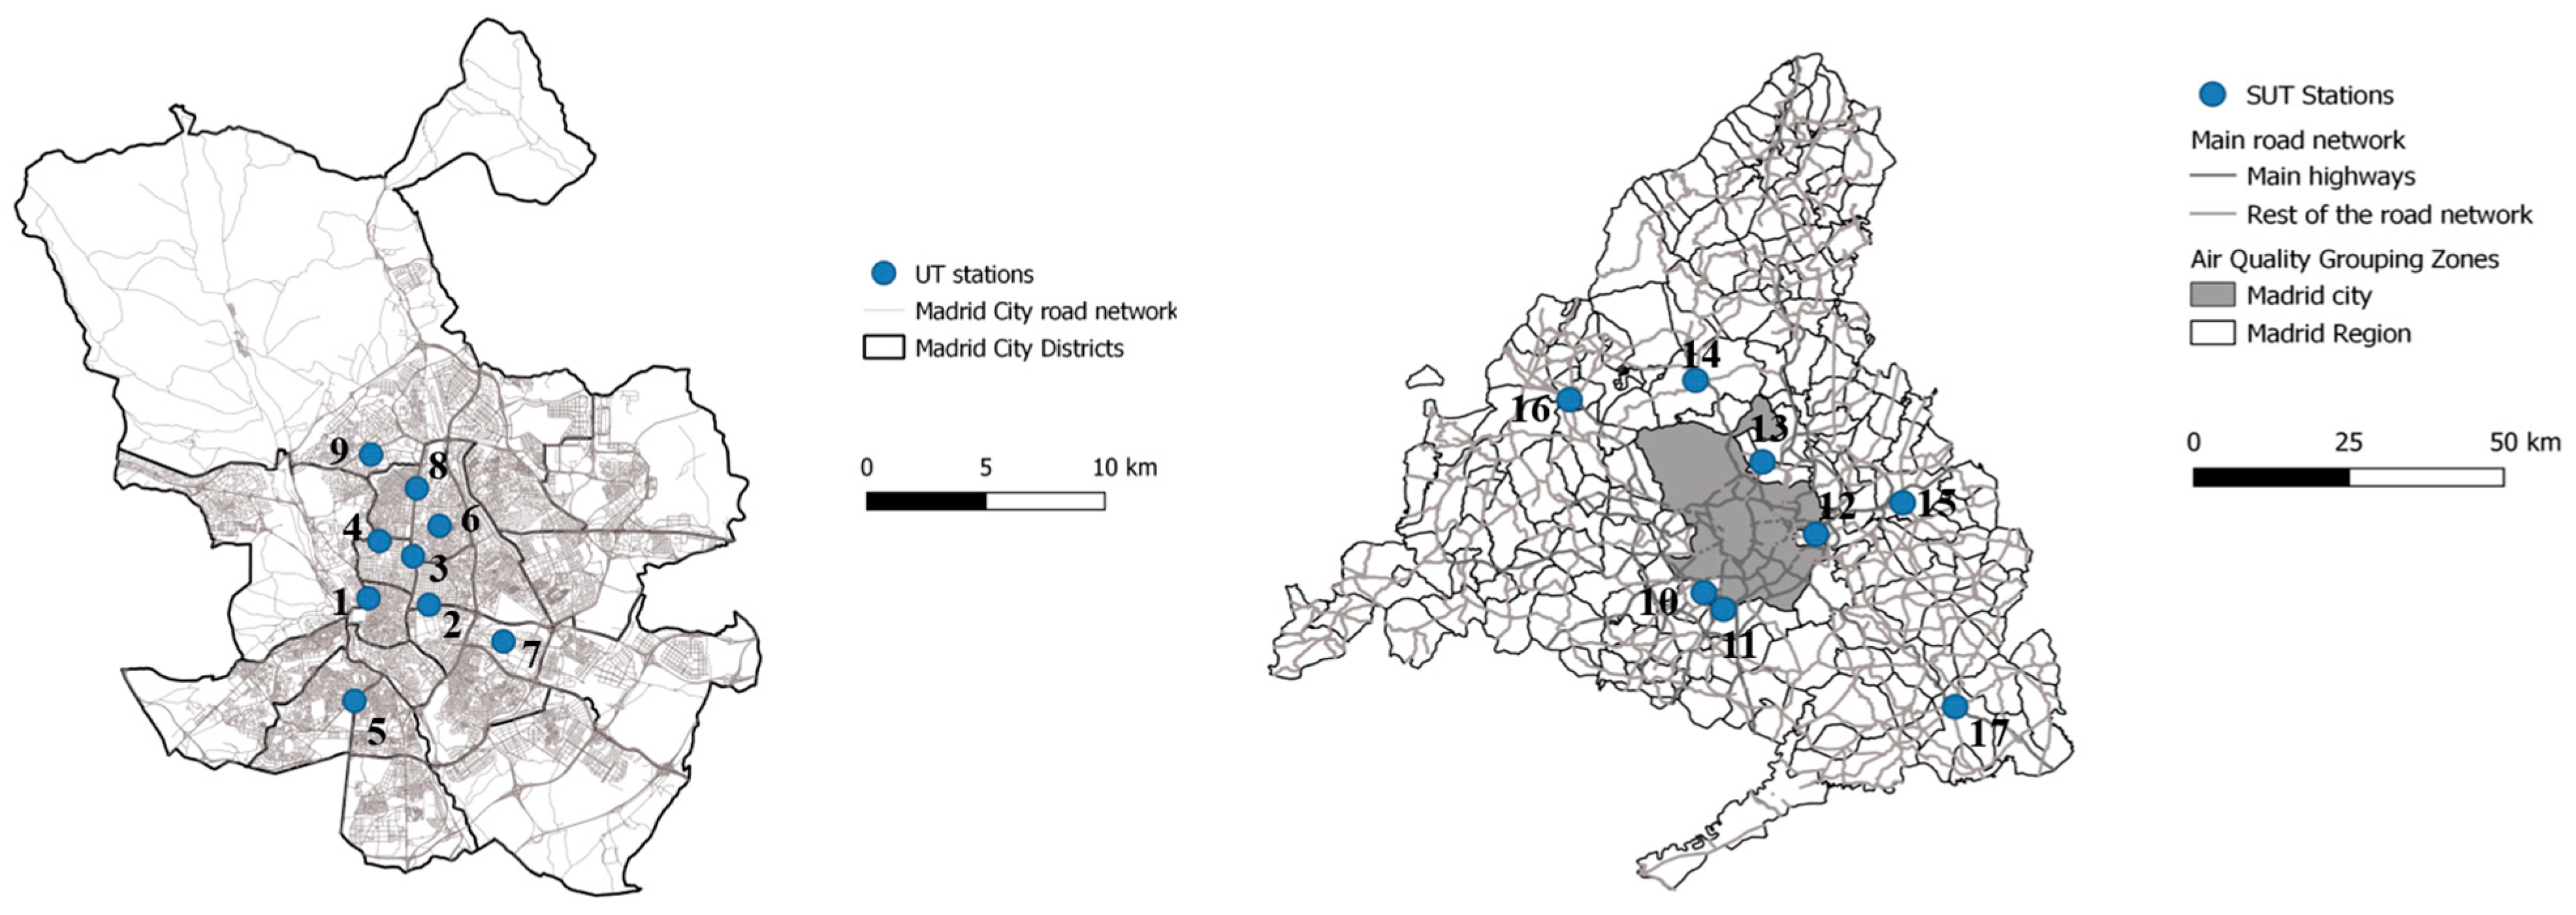
2.1. Case Study: The Madrid Metropolitan Area
2.2. Data Collection
2.3. Statistical Analysis
2.4. Software
3. Results
3.1. Descriptive Statistics of Nitrous Oxides: UT and SUT Stations
3.2. Descriptive Statistics of Particulate Matter: UT and SUT Stations
3.3. Descriptive Statistics of Ozone: UT and SUT Stations
4. Discussion
5. Conclusions and Future Works
Supplementary Materials
Author Contributions
Funding
Data Availability Statement
Acknowledgments
Conflicts of Interest
References
- UN. Health—United Nations Sustainable Development; UN: New York, NY, USA, 2022. [Google Scholar]
- Tsati, E.; Ruggeri, G.; Shairsingh, K.; Cervantes, K.; Mothe, J.; Gumy, S.; Health, W.; Malkawi, M.; Moh’d Safi, H.A.; Salter, J.; et al. WHO Ambient Air Quality Database: 2022 Status Report; WHO: Geneva, Switzerland, 2022. [Google Scholar]
- WHO. WHO Director-General’s Opening Remarks at the Media Briefing on COVID-19 on 11 March 2020. Available online: https://www.who.int/director-general/speeches/detail/who-director-general-s-opening-remarks-at-the-media-briefing-on-covid-19---11-march-2020 (accessed on 10 July 2023).
- BOCM. ORDER 338/2020, of 9 March, of the Regional Ministry of Health, Adopting Preventive Measures and Public Health Recommendations in the Community of Madrid as a Result of the Situation and Evolution of the Coronavirus (COVID-19). Off. Madrid Reg. Gazzette 2020, 59, 9–11. [Google Scholar]
- BOE Royal. Decree 463/2020, of 14 March, Declaring a State of Alarm for the Management of the Health Crisis Situation Caused by COVID-19. Off. State Gazzette 2020, 67, 25390–25400. [Google Scholar]
- BOE Royal. Decree 555/2020, of 5 June, Extending the State of Alarm Declared by Royal Decree 463/2020, of 14 March, Declaring the State of Alarm for the Management of the Health Crisis Situation Caused by COVID-19. Off. State Gazzette 2020, 159, 38027–38036. [Google Scholar]
- BOE Royal. Decree 926/2020, of 25 October, Declaring a State of Alarm to Contain the Spread of Infections Caused by SARS-CoV-2. Off. State Gazzette 2020, 282, 91912–91919. Available online: https://www.boe.es/buscar/doc.php?id=BOE-A-2020-12898 (accessed on 10 July 2023).
- BOE Royal. Decree 956/2020, of 3 November, Extending the State of Alarm Declared by Royal Decree 926/2020, of 25 October, Declaring a State of Alarm to Contain the Spread of Infections Caused by SARS-CoV-2. Off. State Gazzette 2020, 291, 95841–95845. [Google Scholar]
- Zambrano-Monserrate, M.A.; Ruano, M.A.; Sanchez-Alcalde, L. Indirect Effects of COVID-19 on the Environment. Sci. Total Environ. 2020, 728, 138813. [Google Scholar] [CrossRef]
- Baldasano, J.M. COVID-19 Lockdown Effects on Air Quality by NO2 in the Cities of Barcelona and Madrid (Spain). Sci. Total Environ. 2020, 741, 140353. [Google Scholar] [CrossRef] [PubMed]
- Briz-Redón, Á.; Belenguer-Sapiña, C.; Serrano-Aroca, Á. Changes in Air Pollution during COVID-19 Lockdown in Spain: A Multi-City Study. J. Environ. Sci. 2021, 101, 16–26. [Google Scholar] [CrossRef]
- Sicard, P.; De Marco, A.; Agathokleous, E.; Feng, Z.; Xu, X.; Paoletti, E.; Rodriguez, J.J.D.; Calatayud, V. Amplified Ozone Pollution in Cities during the COVID-19 Lockdown. Sci. Total Environ. 2020, 735, 139542. [Google Scholar] [CrossRef]
- Skirienė, A.F.; Stasiškienė, Ž. COVID-19 and Air Pollution: Measuring Pandemic Impact to Air Quality in Five European Countries. Atmosphere 2021, 12, 290. [Google Scholar] [CrossRef]
- von Schneidemesser, E.; Sibiya, B.; Caseiro, A.; Butler, T.; Lawrence, M.G.; Leitao, J.; Lupascu, A.; Salvador, P. Learning from the COVID-19 Lockdown in Berlin: Observations and Modelling to Support Understanding Policies to Reduce NO2. Atmos. Environ. X 2021, 12, 100122. [Google Scholar] [CrossRef] [PubMed]
- Sathiendrakumar, R. Greenhouse Emission Reduction and Sustainable Development. Int. J. Soc. Econ. 2003, 30, 1233–1248. [Google Scholar] [CrossRef]
- Linares, C.; Falcón, I.; Ortiz, C.; Díaz, J. An Approach Estimating the Short-Term Effect of NO2 on Daily Mortality in Spanish Cities. Environ. Int. 2018, 116, 18–28. [Google Scholar] [CrossRef] [PubMed]
- Kampa, M.; Castanas, E. Human Health Effects of Air Pollution. Environ. Pollut. 2008, 151, 362–367. [Google Scholar] [CrossRef] [PubMed]
- Ortega-García, J.A.; Martínez-Hernández, I.; Boldo, E.; Cárceles-Álvarez, A.; Solano-Navarro, C.; Ramis, R.; Aguilar-Ros, E.; Sánchez-Solis, M.; López-Hernández, F. Urban Air Pollution and Hospital Admissions for Asthma and Acute Respiratory Disease in Murcia City (Spain). An. Pediatría Engl. Ed. 2020, 93, 95–102. [Google Scholar] [CrossRef] [PubMed]
- Schwela, D. Air Pollution and Health in Urban Areas. Rev. Environ. Health 2000, 15, 13–42. [Google Scholar] [CrossRef]
- Bañuelos-Gimeno, J.; Blanco, A.; Díaz, J.; Linares, C.; López, J.A.; Navas, M.A.; Sánchez-Martínez, G.; Luna, Y.; Hervella, B.; Belda, F.; et al. Air Pollution and Meteorological Variables’ Effects on COVID-19 First and Second Waves in Spain. Int. J. Environ. Sci. Technol. 2023, 20, 2869–2882. [Google Scholar] [CrossRef]
- Bañuelos-Gimeno, J.; Blanco, A.; Díaz, J.; Linares, C.; López, J.A.; Navas, M.A.; Sánchez-Martínez, G.; Luna, Y.; Hervella, B.; Belda, F.; et al. Do Air Pollution and Meteorological Variables Have a Bearing on COVID-19 Mortality? Benchmarking of Time Series between the First and Second Waves in Nine Spanish Provinces. Rev. Sanid. Ambient. 2022, 22, 100–112. [Google Scholar]
- Linares, C.; Culqui, D.; Belda, F.; López-Bueno, J.A.; Luna, Y.; Sánchez-Martínez, G.; Hervella, B.; Díaz, J. Impact of Environmental Factors and Sahara Dust Intrusions on Incidence and Severity of COVID-19 Disease in Spain. Effect in the First and Second Pandemic Waves. Environ. Sci. Pollut. Res. 2021, 28, 51948–51960. [Google Scholar] [CrossRef]
- Ab Manan, N.; Aizuddin, A.N.; Hod, R. Effect of Air Pollution and Hospital Admission: A Systematic Review. Ann. Glob. Health 2018, 84, 670–678. [Google Scholar] [CrossRef]
- Chen, T.-M.; Kuschner, W.G.; Gokhale, J.; Shofer, S. Outdoor Air Pollution: Particulate Matter Health Effects. Am. J. Med. Sci. 2007, 333, 235–243. [Google Scholar] [CrossRef]
- Culqui, D.R.; Díaz, J.; Blanco, A.; Lopez, J.A.; Navas, M.A.; Sánchez-Martínez, G.; Luna, M.Y.; Hervella, B.; Belda, F.; Linares, C. Short-Term Influence of Environmental Factors and Social Variables COVID-19 Disease in Spain during First Wave (Feb–May 2020). Environ. Sci. Pollut. Res. 2022, 29, 50392–50406. [Google Scholar] [CrossRef]
- Díaz, J.; Linares, C.; Carmona, R.; Russo, A.; Ortiz, C.; Salvador, P.; Trigo, R.M. Saharan Dust Intrusions in Spain: Health Impacts and Associated Synoptic Conditions. Environ. Res. 2017, 156, 455–467. [Google Scholar] [CrossRef] [PubMed]
- Chen, T.-M.; Gokhale, J.; Shofer, S.; Kuschner, W.G. Outdoor Air Pollution: Ozone Health Effects. Am. J. Med. Sci. 2007, 333, 244–248. [Google Scholar] [CrossRef] [PubMed]
- WHO. Health Aspects of Air Pollution with Particulate Matter, Ozone and Nitrogen Dioxide; WHO Regional Office for Europe: Geneva, Switzerland, 2003; Available online: https://apps.who.int/iris/handle/10665/107478 (accessed on 10 July 2023).
- Grundström, M.; Hak, C.; Chen, D.; Hallquist, M.; Pleijel, H. Variation and Co-Variation of PM10, Particle Number Concentration, NOx and NO2 in the Urban Air—Relationships with Wind Speed, Vertical Temperature Gradient and Weather Type. Atmos. Environ. 2015, 120, 317–327. [Google Scholar] [CrossRef]
- Hak, C.; Larssen, S.; Randall, S.; Guerreiro, C.; Denby, B.; Horálek, J. Traffic and Air Quality—Contribution of Traffic to Urban Air Quality in European Cities; European Environment Agency: Copenhagen, Denmark, 2010; Available online: https://www.eionet.europa.eu/etcs/etc-atni/products/etc-atni-reports/etcacc_tp_2009_12_traffic_and_urban_air_quality (accessed on 10 July 2023).
- Rossi, R.; Ceccato, R.; Gastaldi, M. Effect of Road Traffic on Air Pollution. Experimental Evidence from COVID-19 Lockdown. Sustainability 2020, 12, 8984. [Google Scholar] [CrossRef]
- Schürmann, G.; Schäfer, K.; Jahn, C.; Hoffmann, H.; Bauerfeind, M.; Fleuti, E.; Rappenglück, B. The Impact of NOx, CO and VOC Emissions on the Air Quality of Zurich Airport. Atmos. Environ. 2007, 41, 103–118. [Google Scholar] [CrossRef]
- Querol, X.; Alastuey, A.; Viana, M.M.; Rodriguez, S.; Artiñano, B.; Salvador, P.; Garcia Do Santos, S.; Fernandez Patier, R.; Ruiz, C.R.; De La Rosa, J.; et al. Speciation and Origin of PM10 and PM2.5 in Spain. J. Aerosol. Sci. 2004, 35, 1151–1172. [Google Scholar] [CrossRef]
- EEA. Europe’s Air Quality Status 2023. Available online: https://www.eea.europa.eu//publications/europes-air-quality-status-2023 (accessed on 24 April 2023).
- EEA. Air Quality in Europe 2021. Available online: https://www.eea.europa.eu/publications/air-quality-in-europe-2021 (accessed on 11 January 2023).
- Sahanavin, N.; Prueksasit, T.; Tantrakarnapa, K. Relationship between PM10 and PM2.5 Levels in High-Traffic Area Determined Using Path Analysis and Linear Regression. J. Environ. Sci. 2018, 69, 105–114. [Google Scholar] [CrossRef]
- Scheel, H.E.; Areskoug, H.; Geiß, H.; Gomiscek, B.; Granby, K.; Haszpra, L.; Klasinc, L.; Kley, D.; Laurila, T.; Lindskog, A.; et al. On the Spatial Distribution and Seasonal Variation of Lower-Troposphere Ozone over Europe. J. Atmos. Chem. 1997, 28, 11–28. [Google Scholar] [CrossRef]
- Logan, J. Tropospheric Ozone: Seasonal Behavior, Trends, and Anthropogenic Influence. J. Geophys. Res. 1985, 90, 463–482. [Google Scholar] [CrossRef]
- Jacob, D.J.; Heikes, B.G.; Fan, S.M.; Logan, J.A.; Mauzerall, D.L.; Bradshaw, J.D.; Singh, H.B.; Gregory, G.L.; Talbot, R.W.; Blake, D.R.; et al. Origin of Ozone and NOx in the Tropical Troposphere: A Photochemical Analysis of Aircraft Observations over the South Atlantic Basin. J. Geophys. Res. Atmos. 1996, 101, 24235–24250. [Google Scholar] [CrossRef]
- Yang, J.; Shi, B.; Shi, Y.; Marvin, S.; Zheng, Y.; Xia, G. Air Pollution Dispersal in High Density Urban Areas: Research on the Triadic Relation of Wind, Air Pollution, and Urban Form. Sustain. Cities Soc. 2020, 54, 101941. [Google Scholar] [CrossRef]
- Zhang, H.; Wang, Y.; Hu, J.; Ying, Q.; Hu, X.M. Relationships between Meteorological Parameters and Criteria Air Pollutants in Three Megacities in China. Environ. Res. 2015, 140, 242–254. [Google Scholar] [CrossRef] [PubMed]
- Dergunov, A.; Yakubailic, O. Influence of Temperature Inversions on Air Pollution in Krasnoyarsk. E3S Web Conf. 2021, 333, 02002. [Google Scholar] [CrossRef]
- Grange, S.K.; Farren, N.J.; Vaughan, A.R.; Rose, R.A.; Carslaw, D.C. Strong Temperature Dependence for Light-Duty Diesel Vehicle NOx Emissions. Environ. Sci. Technol. 2019, 53, 6587–6596. [Google Scholar] [CrossRef] [PubMed]
- Halfon, N.; Levin, Z.; Alpert, P. Temporal Rainfall Fluctuations in Israel and Their Possible Link to Urban and Air Pollution Effects. Environ. Res. Lett. 2009, 4, 025001. [Google Scholar] [CrossRef]
- Bañuelos-Gimeno, J.; Sobrino, N.; Arce, R. Efectos Del Tráfico En La Contaminación Atmosférica. Evidencia Empírica En Las Olas de COVID-19 En La Ciudad de Madrid. In Proceedings of the XV Congreso de Ingeniería del Transporte, San Cristóbal de La Laguna, Spain, 14–16 June 2023; pp. 1–10. [Google Scholar]
- Delgado-Iniesta, M.J.; Marín-Sanleandro, P.; Díaz-Pereira, E.; Bautista, F.; Romero-Muñoz, M.; Sánchez-Navarro, A. Estimation of Ecological and Human Health Risks Posed by Heavy Metals in Street Dust of Madrid City (Spain). Int. J. Environ. Res. Public Health 2022, 19, 5263. [Google Scholar] [CrossRef]
- Madrid City Council. Madrid City Council Emissions Inventory. Available online: https://airedemadrid.madrid.es/portales/calidadaire/es/Contaminacion-atmosferica/Concepto/?vgnextfmt=default&vgnextchannel=4b3e471c5c503710VgnVCM1000008a4a900aRCRD (accessed on 27 June 2023).
- OMM. Report of the Metropolitan Mobility Observatory for 2020 and Progress 2021; OMM: Madrid, Spain, 2022; Available online: https://observatoriomovilidad.es/informes/ (accessed on 27 June 2023).
- Gkatzelis, G.I.; Gilman, J.B.; Brown, S.S.; Eskes, H.; Gomes, A.R.; Lange, A.C.; McDonald, B.C.; Peischl, J.; Petzold, A.; Thompson, C.R.; et al. The Global Impacts of COVID-19 Lockdowns on Urban Air Pollution: A Critical Review and Recommendations. Elementa 2021, 9, 00176. [Google Scholar] [CrossRef]
- Silva, A.C.T.; Branco, P.T.B.S.; Sousa, S.I.V. Impact of COVID-19 Pandemic on Air Quality: A Systematic Review. Int. J. Environ. Res. Public Health 2022, 19, 1950. [Google Scholar] [CrossRef]
- Betancourt-Odio, M.A.; Martínez-De-Ibarreta, C.; Budría-Rodríguez, S.; Wirth, E. Local Analysis of Air Quality Changes in the Community of Madrid before and during the COVID-19 Induced Lockdown. Atmosphere 2021, 12, 659. [Google Scholar] [CrossRef]
- Cárcel-Carrasco, J.; Pascual-Guillamón, M.; Langa-Sanchís, J. Analysis of the Effect of COVID-19 on Air Pollution: Perspective of the Spanish Case. Environ. Sci. Pollut. Res. 2021, 2, 36880–36893. [Google Scholar] [CrossRef]
- Gorrochategui, E.; Hernandez, I.; Pérez-Gabucio, E.; Lacorte, S.; Tauler, R. Temporal Air Quality (NO2, O3, and PM10) Changes in Urban and Rural Stations in Catalonia during COVID-19 Lockdown: An Association with Human Mobility and Satellite Data. Environ. Sci. Pollut. Res. 2022, 29, 18905–18922. [Google Scholar] [CrossRef] [PubMed]
- Pérez-Martínez, P.J.; Magalhães, T.; Maciel, I.; de Miranda, R.M.; Kumar, P. Effects of the COVID-19 Pandemic on the Air Quality of the Metropolitan Region of São Paulo: Analysis Based on Satellite Data, Monitoring Stations and Records of Annual Average Daily Traffic Volumes on the Main Access Roads to the City. Atmosphere 2022, 13, 52. [Google Scholar] [CrossRef]
- Gualtieri, G.; Brilli, L.; Carotenuto, F.; Vagnoli, C.; Zaldei, A.; Gioli, B. Quantifying Road Traffic Impact on Air Quality in Urban Areas: A Covid19-Induced Lockdown Analysis in Italy. Environ. Pollut. 2020, 267, 115682. [Google Scholar] [CrossRef] [PubMed]
- Jephcote, C.; Hansell, A.L.; Adams, K.; Gulliver, J. Changes in Air Quality during COVID-19 ‘Lockdown’ in the United Kingdom. Environ. Pollut. 2021, 272, 116011. [Google Scholar] [CrossRef]
- Jia, C.; Li, W.; Wu, T.; He, M. Road Traffic and Air Pollution: Evidence from a Nationwide Traffic Control during Coronavirus Disease 2019 Outbreak. Sci. Total Environ. 2021, 781, 146618. [Google Scholar] [CrossRef]
- Volke, M.I.; Abarca-del-Rio, R.; Ulloa-Tesser, C. Impact of Mobility Restrictions on NO2 Concentrations in Key Latin America Cities during the First Wave of Teh COVID-19 Pandemic. Urban Clim. 2023, 48, 109181. [Google Scholar] [CrossRef]
- Alemdar, K.D.; Kaya, Ö.; Canale, A.; Çodur, M.Y.; Campisi, T. Evaluation of Air Quality Index by Spatial Analysis Depending on Vehicle Traffic during the COVID-19 Outbreak in Turkey. Energies 2021, 14, 5729. [Google Scholar] [CrossRef]
- Donzelli, G.; Cioni, L.; Cancellieri, M.; Llopis-morales, A.; Morales-suárez-varela, M. Relations between Air Quality and COVID-19 Lockdown Measures in Valencia, Spain. Int. J. Environ. Res. Public Health 2021, 18, 2296. [Google Scholar] [CrossRef]
- Shanableh, A.; Al-ruzouq, R.; Khalil, M.A.; Gibril, M.B.A.; Hamad, K.; Alhosani, M.; Stietiya, M.H.; Al Bardan, M.; Almasoori, S.; Hammouri, N.A. COVID-19 Lockdown and the Impact on Mobility, Air Quality, and Utility Consumption: A Case Study from Sharjah, United Arab Emirates. Sustainability 2022, 14, 1767. [Google Scholar] [CrossRef]
- Wang, Q.; Yang, X. How Do Pollutants Change Post-Pandemic? Evidence from Changes in Five Key Pollutants in Nine Chinese Cities Most Affected by the COVID-19. Environ. Res. 2021, 197, 111108. [Google Scholar] [CrossRef]
- Connerton, P.; de Assunção, J.V.; de Miranda, R.M.; Slovic, A.D.; Pérez-Martínez, P.J.; Ribeiro, H. Air Quality during COVID-19 in Four Megacities: Lessons and Challenges for Public Health. Int. J. Environ. Res. Public Health 2020, 17, 5067. [Google Scholar] [CrossRef] [PubMed]
- Munir, S.; Coskuner, G.; Jassim, M.S.; Aina, Y.A.; Ali, A.; Mayfield, M. Changes in Air Quality Associated with Mobility Trends and Meteorological Conditions during COVID-19 Lockdown in Northern England, UK. Atmosphere 2021, 12, 504. [Google Scholar] [CrossRef]
- Reuters Spain. Allowed NO2 Levels to Exceed Limits in Madrid and Barcelona, EU Court Rules. The Guardian, 22 December 2022. Available online: https://www.theguardian.com/world/2022/dec/22/spain-allowed-no2-levels-to-exceed-limits-in-madrid-and-barcelona-eu-court-rules(accessed on 27 June 2023).
- INE. Surface Area of the Autonomous Communities and Provinces, by Altimetric Areas; National Statistics Institute INE: Madrid, Spain, 1994; pp. 1–2. Available online: https://www.ine.es/inebaseweb/pdfDispacher.do?td=154090&L=0 (accessed on 27 June 2023).
- INE. Official Population Figures Resulting from the Revision of the Municipal Register of Madrid as of 1 January; National Statistics Institute INE: Madrid, Spain, 2021. Available online: https://www.ine.es/dynt3/inebase/index.htm?padre=517&capsel=517 (accessed on 27 June 2023).
- Al Akioui Sanz, A.; De Caceres, A.M.; Del Valle, L.A. Evolution of Mobility during the COVID-19 Crisis in the Region of Madrid. Transp. Res. Procedia 2021, 58, 416–422. [Google Scholar] [CrossRef]
- Madrid City Council. Air Quality Annual Report 2019; Madrid City Council: Madrid, Spain, 2019. Available online: https://airedemadrid.madrid.es/UnidadesDescentralizadas/Sostenibilidad/CalidadAire/Publicaciones/Memorias_anuales/Ficheros/Memoria_2019.pdf (accessed on 27 June 2023).
- BOCM. Action Protocol for Episodes of Nitrogen Dioxide Pollution in the City of Madrid. Madrid’s Official Regional Gazette, 25 June 2018; p. 825. [Google Scholar]
- BOAM. Ordinance 10/2021 of 13 September Amending the Sustainable Mobility Ordinance of 5 October 2018. Madrid’s Official Regional Gazette, 21 September 2021; pp. 107–225. [Google Scholar]
- Faiz, A.; Gautam, S.; Burki, E. Air Pollution from Motor Vehicles: Issues and Options for Latin American Countries. Sci. Total Environ. 1995, 169, 303–310. [Google Scholar] [CrossRef]
- DGT. Statistics Portal; Directorate-General for Traffic: Madrid, Spain, 2023. Available online: https://www.dgt.es/menusecundario/dgt-en-cifras/ (accessed on 27 June 2023).
- ISCIII. Situation and Evolution of the COVID-19 Pandemic in Spain; ISCIII: Madrid, Spain, 2022; Available online: https://www.isciii.es/QueHacemos/Servicios/VigilanciaSaludPublicaRENAVE/EnfermedadesTransmisibles/Paginas/InformesCOVID-19.aspx (accessed on 27 June 2023).
- Madrid City Council. Air Quality. Daily Data since 2001. Madrid City Council Open Data Portal; Madrid City Council: Madrid, Spain, 2022. Available online: https://data.europa.eu/data/datasets/https-datos-madrid-es-egob-catalogo-201410-0-calidad-aire-diario?locale=es (accessed on 27 June 2023).
- Community of Madrid. Air Quality Network of the Region of Madrid; Community of Madrid: Madrid, Spain, 2021. Available online: https://www.comunidad.madrid/en/servicios/urbanismo-medio-ambiente/calidad-aire (accessed on 27 June 2023).
- StataCorp. New in Stata 15|Stata 2017; StataCorp: College Station, TX, USA, 2017; Available online: https://www.stata.com/support/faqs/resources/citing-software-documentation-faqs/ (accessed on 27 June 2023).
- Microsoft Corporation. Microsoft Software de Hojas de Cálculo Microsoft Excel|Microsoft 365 2022, Versión 2307 Compilación 16.0.16626.20170; Microsoft Corporation: Redmond, WA, USA, 2022. [Google Scholar]
- Qgis Welcome to Qgis Project! 2022. Available online: https://qgis.org/es/site/ (accessed on 27 June 2023).
- Castells-Quintana, D.; Dienesch, E.; Krause, M. Air Pollution in an Urban World: A Global View on Density, Cities and Emissions. Ecol. Econ. 2021, 189, 107153. [Google Scholar] [CrossRef]
- Kumari, P.; Toshniwal, D. Impact of Lockdown on Air Quality over Major Cities across the Globe during COVID-19 Pandemic. Urban Clim. 2020, 34, 100719. [Google Scholar] [CrossRef] [PubMed]
- Madrid City Council. State of Mobility in the City of Madrid; Madrid City Council: Madrid, Spain, 2020. Available online: https://transparencia.madrid.es/FWProjects/transparencia/Movilidad/Trafico/InformesMovilidad/Ficheros/InformeMovilidad2020.pdf (accessed on 27 June 2023).
- DatosMacro. Madrid COVID-19—Vaccines Administered 2023; DatosMacro: Madrid, Spain, 2022; Available online: https://datosmacro.expansion.com/otros/coronavirus-vacuna/espana-comunidades-autonomas (accessed on 27 June 2023).
- Hostettler Macias, L.; Ravalet, E.; Rérat, P. Potential Rebound Effects of Teleworking on Residential and Daily Mobility. Geogr. Compass 2022, 16, e12657. [Google Scholar] [CrossRef]
- Park, J.; Kim, G. Risk of COVID-19 Infection in Public Transportation: The Development of a Model. Int. J. Environ. Res. Public Health 2021, 18, 12790. [Google Scholar] [CrossRef] [PubMed]
- Jiménez, E.; Linares, C.; Martínez, D.; Díaz, J. Role of Saharan Dust in the Relationship between Particulate Matter and Short-Term Daily Mortality among the Elderly in Madrid (Spain). Sci. Total Environ. 2010, 408, 5729–5736. [Google Scholar] [CrossRef] [PubMed]
- EUMESAT. Widespread Dust Intrusion across Europe. Available online: https://www.eumetsat.int/widespread-dust-intrusion-across-europe (accessed on 31 May 2023).
- Tarriño-Ortiz, J.; Gómez, J.; Soria-Lara, J.A.; Vassallo, J.M. Analyzing the Impact of Low Emission Zones on Modal Shift. Sustain. Cities Soc. 2022, 77, 103562. [Google Scholar] [CrossRef]
- Giovanis, E. The Relationship between Teleworking, Traffic and Air Pollution. Atmos. Pollut. Res. 2018, 9, 1–14. [Google Scholar] [CrossRef]
- Chen, Y.; Gu, P.; Schulte, N.; Zhou, X.; Mara, S.; Croes, B.E.; Herner, J.D.; Vijayan, A. A New Mobile Monitoring Approach to Characterize Community-Scale Air Pollution Patterns and Identify Local High Pollution Zones. Atmos. Environ. 2022, 272, 118936. [Google Scholar] [CrossRef]
- Cárdenas-Montes, M. Evaluation of the Impact of Low-Emission Zone: Madrid Central as a Case Study. arXiv 2021, arXiv:2012.13782. [Google Scholar]
- Romero, F.; Gomez, J.; Rangel, T.; Vassallo, J.M. Impact of Restrictions to Tackle High Pollution Episodes in Madrid: Modal Share Change in Commuting Corridors. Transp. Res. Part D Transp. Environ. 2019, 77, 77–91. [Google Scholar] [CrossRef]
- Belzunegui-Eraso, A.; Erro-Garcés, A. Teleworking in the Context of the COVID-19 Crisis. Sustainability 2020, 12, 3662. [Google Scholar] [CrossRef]
- Tenailleau, Q.M.; Tannier, C.; Vuidel, G.; Tissandier, P.; Bernard, N. Assessing the Impact of Telework Enhancing Policies for Reducing Car Emissions: Exploring Calculation Methods for Data-Missing Urban Areas—Example of a Medium-Sized European City (Besançon, France). Urban Clim. 2021, 38, 100876. [Google Scholar] [CrossRef]
- Mingo, I. El Partido Que Promete Reducir Las Zonas de Bajas Emisiones y Los Que Las Ampliarían. Available online: https://www.eldebate.com/motor/20230526/partido-reduciria-zonas-bajas-emisiones-madrid-harian-mas-grandes_117255.html (accessed on 10 July 2023).


| Periods/COVID Waves | Scenarios Period (Start–End Date) | Baseline Scenario Periods (2019) | No. of Days | Mobility Measures | |
|---|---|---|---|---|---|
| Pandemic Scenario (2020 and 2021 years) | First Period | 11/March/2020 21/June/2020 | 11/March/2019 21/June/2019 | 103 | Strict lockdown. As of May, the population was authorized to leave their homes for non-essential reasons, so mobility began a slow recovery. |
| Second Period | 22/June/2020 30/November/2020 | 22/June/2019 30/November/2019 | 162 | Mobility restrictions were practically lifted nationwide in summer, although in autumn, measures were enforced including a perimeter lockdown and a night curfew. | |
| Third Period | 01/December/2020 01/March/2021 | 01/December/2019 01/March/2019 | 91 | Measures were the same as in the second wave. Perimeter lockdowns by basic health zone (BHZ) were implemented. | |
| Fourth Period | 02/March/2021 22/June/2021 | 02/March/2019 22/June/2019 | 113 | As of April 2021, all mobility restrictions were lifted in the Madrid region, although the perimeter lockdown remained in place. | |
| Fifth Period | 23/June/2021 31/October/2021 | 23/June/2019 30/October/2019 | 131 | No mobility restrictions. | |
| Sixth Period | 01/November/2021 31/December/2021 | 01/November/2019 31/December/2019 | 61 | No mobility restrictions. | |
| Periods | Period (Start–End Date) | Baseline Pre-Pandemic Scenario Period (2019) | No. of days | |
|---|---|---|---|---|
| Post-Pandemic Scenario (2022) | Seventh Period | 11/March/2022 | 11/March/2019 | 103 |
| 21/June/2022 | 21/June/2019 | |||
| Eighth Period | 22/June/2022 | 22/June/2019 | 162 | |
| 30/November/2022 | 30/November/2019 |
| No. | UT Station | Distance (km) |
|---|---|---|
| 1 | Plaza de España | 1.08 |
| 2 | Escuelas Aguirre | 1.90 |
| 3 | Castellana | 2.82 |
| 4 | Cuatro Caminos | 3.22 |
| 5 | Plaza Elíptica | 3.74 |
| 6 | Ramón y Cajal | 4.47 |
| 7 | Moratalaz | 5.06 |
| 8 | Plaza Castilla | 5.58 |
| 9 | Barrio del Pilar | 6.87 |
| No. | SUT Station | Distance (km) |
|---|---|---|
| 10 | Leganés | 9.56 |
| 11 | Getafe | 11.39 |
| 12 | Coslada | 13.79 |
| 13 | Alcobendas | 14.62 |
| 14 | Colmenar Viejo | 28.17 |
| 15 | Alcalá de Henares | 28.51 |
| 16 | Collado Villalba | 35.63 |
| 17 | Villarejo de Salvanés | 45.68 |
| Period 1 (11/Mar./2020–21/Jun./2020) | Period 2 (22/Jun./2020–30/Nov./2020) | Period 3 (01/Dec-/2020–01/Mar./2021) | Period 4 (02/Mar./2021–22/Jun./2021) | Period 5 (23/Jun./2021–31/Oct./2021) | Period 6 (01/Nov./2021–31/Dec./2021) | |||||||
|---|---|---|---|---|---|---|---|---|---|---|---|---|
| NOx | NO2 | NOx | NO2 | NOx | NO2 | NOx | NO2 | NOx | NO2 | NOx | NO2 | |
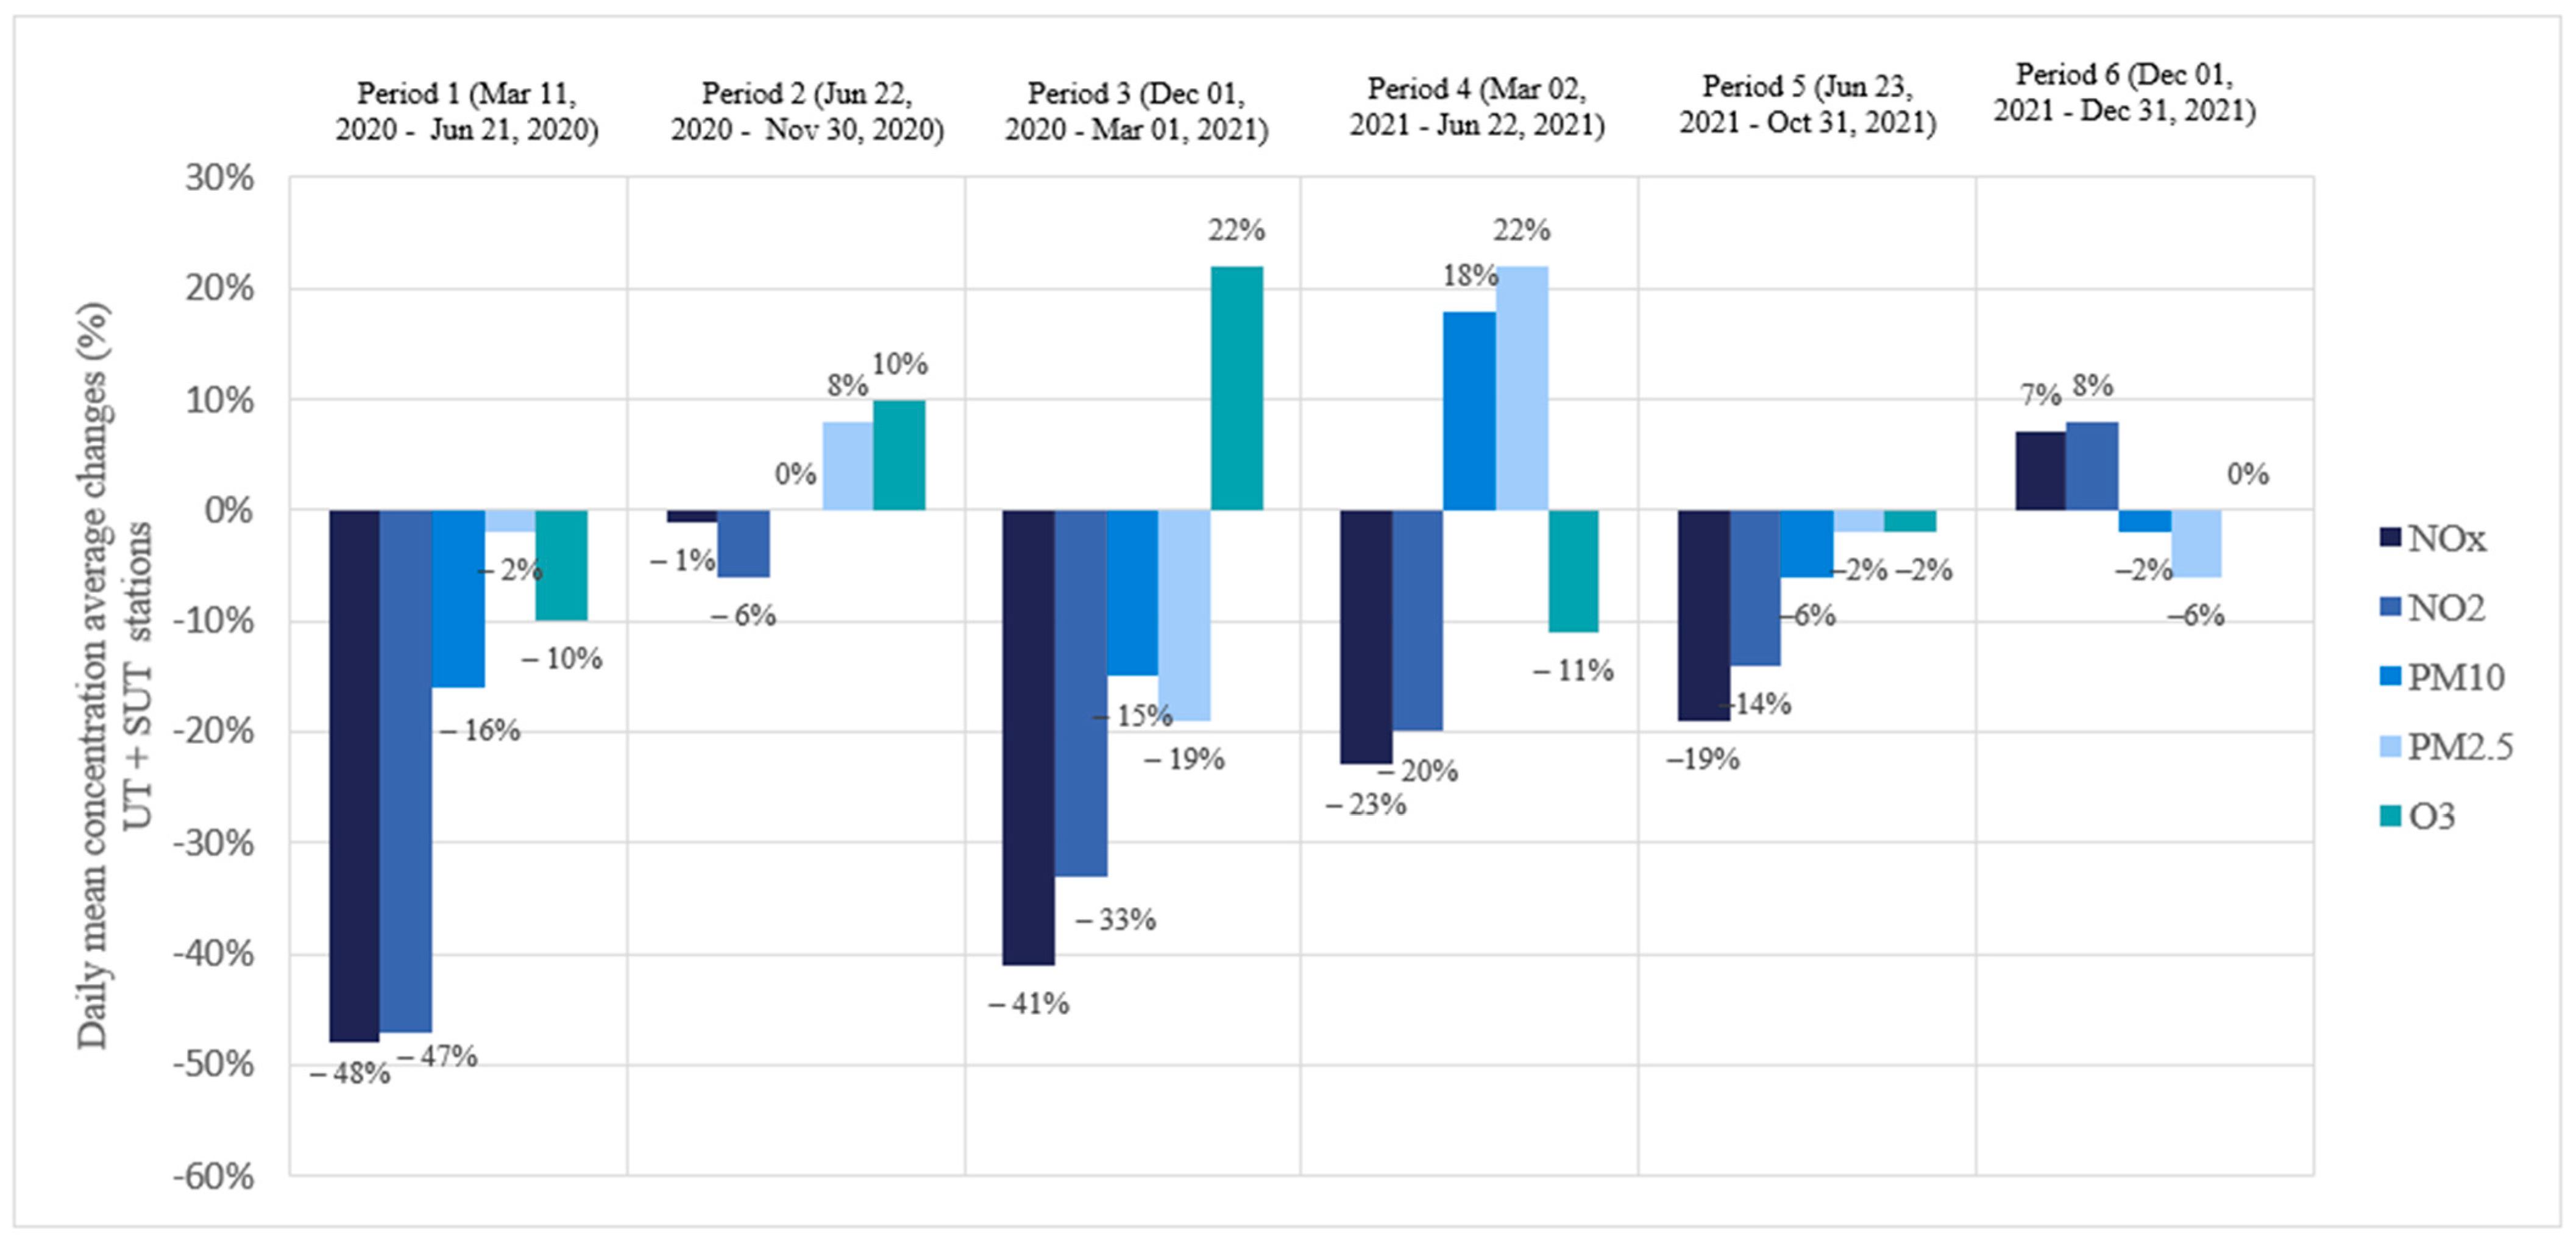
| Average changes (%) in all stations | −47.8% | −47% | −0.8% | −6.4% | −41.1% | −32.7% | −23.1% | −20.3% | −18.7% | −14% | +7.4% | +8.4% |
| Average changes (%) UT stations | −52.6% | −51% | −6.7% | −9.2% | −37.1% | −31.3% | −26% | −19.7% | −22.8% | −15.7% | −3.3% | +4.5% |
| Average changes (%) SUT stations | −42.3% | −42.7% | +5.8% | −3.3% | −45.7% | −34.3% | −19.9% | −20.9% | −14.1% | −12% | +18.2% | +12.4% |
| Station with max reduction/changes (%) | UT 2 −61.3% | UT 1 −75.5% | UT 8 −18.1% | UT 12 −19.3% | UT 5 −54.1% SUT 15 −54.2% | UT 2 −40.9% SUT 14 −40.8% | UT 2 −38.7% | UT 2 SUT 12 −36.5% | UT 1 −31.7% | UT 1 −33% | UT 2 −20.4% | UT 2 −12% |
| Station with min reduction/changes (%) | SUT 13 −39.8% | SUT 17 −30.6% | SUT 10 +13.8% | SUT 10 and 15 +1.7% | UT 8 −27.9% | UT 8 −22.2% | SUT 10 −12.1% | UT 4 −7.7% | SUTs 10 and 15 −8% | SUT 10 −2.4% | SUT 12 +39% | SUT11 +26.9% |
| Period 7 (11/Mar./2022–21/Jun./2022) | Period 8 (22/Jun./2022–30/Nov./2022) | |||
|---|---|---|---|---|
| NOx | NO2 | NOx | NO2 | |
| Average changes (%) in all stations | −32.1% | −24.7% | −19.8% | −14.2% |
| Average changes (%) in UT stations | −35.3% | −22.4% | −28.7% | −15.9% |
| Average changes (%) in SUT stations | −28.8% | −27.0% | −10.9% | −12.4% |
| Station with max reduction/changes (%) | UT 1 −68% | SUT 14 −47% | UT 1 −55% | UT 7 −26% |
| Station with min reduction/changes (%) | UT 8 −19% | UT 8 −2% | SUT 16 −1% | UT 1 +18% |
| Period 1 (11/Mar./2020–21/Jun./2020) | Period 2 (22/Jun./2020–30/Nov./2020) | Period 3 (01/Dec./2020–01/Mar./2021) | Period 4 (02/Mar./2021–22/Jun./2021) | Period 5 (23/Jun./2021–31/Oct./2021) | Period 6 (01/Nov./2021–31/Dec./2021) | |||||||
|---|---|---|---|---|---|---|---|---|---|---|---|---|
| PM2.5 | PM10 | PM2.5 | PM10 | PM2.5 | PM10 | PM2.5 | PM10 | PM2.5 | PM10 | PM2.5 | PM10 | |
| −2% | −16.1% | +7.6% | −0.4% | −19.1% | −14.6% | +21.5% | +18% | −1.9% | −6.3% | −5.6% | −1.8% | |
| Average changes (%) UT stations | −5.8% | −19% | +3.5% | −2.5% | −24.8% | −15.7% | +11.8% | +15% | +3.7% | −5.6% | −15.9% | −7.8% |
| Average changes (%) SUT stations | +2.6% | −14.8% | +12.5% | +3.7% | −12.2% | −12.4% | +33.1% | +23.9% | −8.5% | −7.6% | +6.6% | +10% |
| Station with max reduction/changes (%) | UT 5 (−15.2%) | UT 5 (−37.6%) | UT 5 (−10.2%) | UT 5 (−22.9%) | UT 2 (−41.5%) | UT 2 and 5 (−38%) | UT 2 (−10.6%) | UT 5 (−6%) | SUT 14 (−28.4%) | SUT 11 (−22.1%) | UT 3 (−20.4%) | SUT 13 (−21.6%) |
| Station with min reduction/changes (%) | SUT 16 (+28.4%) | SUT 14 (+3.1%) | UT 17 (+18.2%) | UT 4 (+11.3%) | UT 10 (−7.2%) | UT 7 (+1%) | SUT 16 (+51.2%) | SUT 14 (+45.8%) | UT 8 (+38%) | UT 8 (+8.8%) | UT 11 (+19.6%) | SUT 12 (+22.5%) |
| Period 7 (11/Mar./2022–21/Jun./2022) | Period 8 (22/Jun./2022–30/Nov./2022) | |||
|---|---|---|---|---|
| PM2.5 | PM10 | PM2.5 | PM10 | |
| Average changes (%) in all stations | +19.1% | +57.0% | +14.1% | +17.6% |
| Average changes (%) in UT stations | +23.7% | +45.3% | +37.2% | +34.7% |
| Average changes (%) in SUT stations | +14.5% | +68.7% | −8.9% | 0.5% |
| Station with max reduction/changes (%) | SUT 16 +47% | SUT 14 +127% | UT 2 +114% | UT 4 +94% |
| Station with min reduction/changes (%) | SUT 15 −0.1% | UT 2 +17% | SUT 10 −31% | SUT 10 +1% |
| Period 1 (11/Mar./2020–21/Jun./2020) | Period 2 (22/Jun./2020–30/Nov./2020) | Period 3 (01/Dec./2020–01/Mar./2021) | Period 4 (02/Mar./2021–22/Jun./2021) | Period 5 (23/Jun./2021–31/Oct./2021) | Period 6 (01/Nov./2021–31/Dec./2021) | |
|---|---|---|---|---|---|---|
| O3 | O3 | O3 | O3 | O3 | O3 | |
| Average changes (%) in all stations | −10.3% | −9.9% | 21.9% | −10.6% | −2% | −0.2% |
| Average changes (%) UT stations | −1.3% | −5.9% | 24% | −11.3% | +11% | −0.5% |
| Average changes (%) SUT stations | −13.7% | −11.4% | 21.1% | −10.4% | −5.3% | −0.1% |
| Station with max reduction/changes (%) | SUT 11 (−20%) | SUT 16 (−20.7%) | - | UT 9 (−18.9%) | SUT 16 (−15%) | SUT 15 (−16.1%) |
| Station with min reduction/changes (%) | UT 2 (+4.5%) | UT 2 (+10.2%) | UT 5 (+36.8%) | UT 2 (−3.7%) | UT 2 (+19,7%) | SUT 17 (+23.2%) |
| Period 7 (11/Mar./2022 21/Jun./2022) | Period 8 (22/Jun./2022 30/Nov./2022) | |
|---|---|---|
| O3 | O3 | |
| Average changes (%) in SUT stations | −8.6% | +3.6% |
| Station with max reduction/changes (%) | SUT 14 +17% | UT 2 +24% |
Disclaimer/Publisher’s Note: The statements, opinions and data contained in all publications are solely those of the individual author(s) and contributor(s) and not of MDPI and/or the editor(s). MDPI and/or the editor(s) disclaim responsibility for any injury to people or property resulting from any ideas, methods, instructions or products referred to in the content. |
© 2023 by the authors. Licensee MDPI, Basel, Switzerland. This article is an open access article distributed under the terms and conditions of the Creative Commons Attribution (CC BY) license (https://creativecommons.org/licenses/by/4.0/).
Share and Cite
Bañuelos-Gimeno, J.; Sobrino, N.; Arce-Ruiz, R.M. Effects of Mobility Restrictions on Air Pollution in the Madrid Region during the COVID-19 Pandemic and Post-Pandemic Periods. Sustainability 2023, 15, 12702. https://doi.org/10.3390/su151712702
Bañuelos-Gimeno J, Sobrino N, Arce-Ruiz RM. Effects of Mobility Restrictions on Air Pollution in the Madrid Region during the COVID-19 Pandemic and Post-Pandemic Periods. Sustainability. 2023; 15(17):12702. https://doi.org/10.3390/su151712702
Chicago/Turabian StyleBañuelos-Gimeno, Jorge, Natalia Sobrino, and Rosa María Arce-Ruiz. 2023. "Effects of Mobility Restrictions on Air Pollution in the Madrid Region during the COVID-19 Pandemic and Post-Pandemic Periods" Sustainability 15, no. 17: 12702. https://doi.org/10.3390/su151712702
APA StyleBañuelos-Gimeno, J., Sobrino, N., & Arce-Ruiz, R. M. (2023). Effects of Mobility Restrictions on Air Pollution in the Madrid Region during the COVID-19 Pandemic and Post-Pandemic Periods. Sustainability, 15(17), 12702. https://doi.org/10.3390/su151712702