Article

Effects of Mobility Restrictions on Air Pollution in the Madrid Region during the COVID-19 Pandemic and Post-Pandemic Periods

by
Jorge Bañuelos-Gimeno
,
Natalia Sobrino
and
Rosa María Arce-Ruiz
*
Transport Research Centre TRANSyT-UPM, c/Profesor Aranguren, 3, Ciudad Universitaria, Universidad Politécnica de Madrid, 28040 Madrid, Spain
*
Author to whom correspondence should be addressed.
Sustainability 2023, 15(17), 12702; https://doi.org/10.3390/su151712702
Submission received: 11 June 2023 / Revised: 10 August 2023 / Accepted: 16 August 2023 / Published: 22 August 2023
(This article belongs to the Special Issue Air Quality Change in Association with COVID-19 Pandemic)

Abstract

:
Air quality is one of the problems cities face today. The COVID-19 pandemic provided a unique opportunity to study the influence of traffic reduction on air quality during 2020, 2021, and 2022. The aim of this paper is to analyze the impacts and relationship between mobility restrictions in six COVID-19 wave periods and air pollution and evolution in the post-pandemic period differentiating Madrid city from its metropolitan area. We tested whether the changes produced for NO2, NOx, PM2.5, PM10, and O3 in the urban traffic and suburban traffic air quality stations data in comparison to the 2019 reference period were significant. The findings of this study show that the periods with the greatest reduction in pollutant concentrations were the first and third COVID-19 waves, when mobility restrictions were most stringent: there was strict confinement for the first wave (i.e., 47% reduction in daily average NO2 concentration), while severe weather forced a reduction in traffic in the region in the third wave period (i.e., 41% reduction in daily average NOx concentration). With the return to normal activity in the last period, pollutant concentrations began to exceed pre-pandemic levels. At the urban level, the reductions were more noticeable in relation to NO2 and NOx, while at the suburban level, changes were less prominent, except for the O3. The results are particularly inspiring for designing future mobility strategies for improving air quality in urban and metropolitan areas.

1. Introduction

Ensuring good health and well-being in the world’s population is Goal 3 of the United Nations (UN) Sustainable Development Goals (SDG) [1]. Air pollution poses the greatest environmental risk to the health of the urban population, causing cardiovascular and respiratory diseases that result in the loss of years of a healthy life and, in the most severe cases, premature death [2]. The world recently faced an unprecedented global health crisis. COVID-19 was spreading human suffering, destabilizing the global economy, and drastically changing the lives of people around the world during the last three years. It would be of interest to analyze approaches beyond the strictly health-related sphere and to study the impact of the COVID-19 pandemic on air pollution in urban areas.
The declaration of the COVID-19 pandemic by the World Health Organization (WHO) on 11 March 2020 [3] led many countries around the world, supported by the recommendations of experts, to take measures to prevent the spread of the virus. These took the form of social distancing, the suspension of all non-essential activities, and the strict confinement of a large part of the population. In Spain, the Madrid region was the first territory to become aware of the risk of COVID-19, and on 9 March, the regional authorities decided to close all its educational centers [4]. The Spanish national government declared a state of nationwide emergency from 14 March 2020 [5] to 21 June 2020 [6], during which time all citizens were obliged to stay at home except in extenuating circumstances, as indicated by the government. After the summer of 2020, the government implemented new mobility restrictions to lower the number of COVID-19 cases, resulting in a new state of emergency on 25 October 2020 [7] that was extended until 9 May 2021 [8]. During this second state of emergency, a night curfew was enforced and travel between autonomous regions (AR) was restricted. Thanks to the vaccination of the population during 2021 and 2022, no new states of emergency were applied in Spain, although waves of the virus with high incidence rates continued to occur due to the arrival of new variants, albeit with less serious consequences due to their lower mortality rate (i.e., the Omicron variant). The result is that as of October 2022, there were a total of 13,511,768 confirmed cases.
Despite the health effects of the coronavirus on the population, it seems the COVID-19 pandemic allowed the environment some respite, and for the first time in many years, it was empirically proven that air quality improved in large urban areas due to these strict mobility restrictions [9]. Many studies around the world show that the greatest reductions occurred in NO2 concentrations during the period of strict confinement, when they fell by 30–60% compared to the reference values of the previous year [10,11,12,13,14].
Air pollution is one of the most widely discussed topics in the scientific literature, especially since the discovery of its influence on climate change and health [15]. Among all the compounds currently considered pollutants, nitrogen oxides (NO2 and NOx), particulate matter with a diameter of less than 10 µm (PM2.5 and PM10), and ozone (O3) are the most important in air quality studies [16], and have the most serious impact on health. The effects of nitrogen oxides on human health are clear. Several studies found that a high concentration of these compounds in the atmosphere is associated with increased rates of hospital admissions for respiratory causes, a greater risk of myocardial infarction, and low birth weight, among others [17,18,19]. During the COVID-19 pandemic, exposure to a NO2-polluted environment was associated with increased COVID-19 incidence rates, hospital admissions, and mortality [20,21,22]. Particulate matter has very varied impacts on people’s health [23,24], among the most serious of which are ischemic stroke and chronic obstructive pulmonary disease (COPD) [19]. In the COVID-19 pandemic, it was demonstrated also that the incidence of hospital admissions and mortality rates from COVID-19 was greater in environments with PM10 and PM2.5 pollution [20,21,25,26].
The influence of O3 on human health is also discussed in the scientific literature. Some studies found an association between ozone concentrations and reduced lung function [27], while others [28] relate it to ischemic stroke, among other conditions. There is therefore no doubt that if cities want to ensure the well-being of their inhabitants, they must take measures to improve air quality. An in-depth analysis must be carried out to identify the main sources and testing strategies that best fit the objective of reducing pollution in urban areas.
According to the literature, the main sources of air emissions in urban areas vary by pollutant. The origin of airborne NO2 and NOx can mostly be attributed to human activity [29], especially road traffic [30]. Of the circulating vehicle fleet, diesel-fueled vehicles emit more NO2 and NOx than other types of vehicles [31]. Another main source of the nitrous oxides in the atmosphere is the VOC emissions [32]. The origin of particulate matter (PM) in the atmosphere is varied [33], as these pollutants are not homogeneous in their chemical composition [28]. For instance, in European urban areas, energy consumption in residential, commercial, and institutional sectors was responsible for 40% of PM10 emissions and 53% of PM2.5 emissions [34,35]. Although not comparable to NO2 and NOx, PM, and especially PM10 and PM2.5, is related to areas with a high concentration of road traffic and where building density is high [36]. The consideration of O3 as a pollutant is more complicated than the previously mentioned pollutants. This compound is naturally present in the atmosphere in the so-called “ozone layer”, but it is only considered a pollutant when it appears in the lower layer (called the troposphere). The presence of tropospheric ozone has a significant seasonal component [37], and is strongest in June, July, and August (summer) in the northern hemisphere [38]. Problems arise when the concentrations of NO2 and O3 are studied together, as they have collinearity due to the photochemical mechanism of the formation of O3 from NO2 [38,39].
Urban density also plays a key role in the accumulation of the air pollution emitted in the cities. More dense urban environments have a better accumulation of air pollutants than a non-urban environment [40]. The presence of buildings and other urban constructions stands in the way of the dispersion of the main air pollutants, increasing the concentration detected by the sensors of the air quality monitoring networks.
Last but not least, meteorology has a very important influence on air pollution [41]. Meteorological variables such as wind speed [29], temperature [42,43], and precipitation [44] have a direct influence on the concentration of these pollutants. However, previous studies found that, in Madrid, when studying the air quality of the city and the meteorological variables, the latter play an important role, but are masked by the effect that traffic-related airborne pollutants have [10,45].
Traffic density is a factor that must be taken into account when studying air quality in big cities. For instance, for the Madrid metropolitan area, Delgado Iniesta et al. in 2022 [46] studied the effects that traffic density has on air quality, and found that the greater the traffic density is, the greater the air pollution that is detected, especially for particulate matter (PM2.5 and PM10) and nitrogen oxides (NO2 and NOx) that make up the photochemical smog. In Madrid, the main source of NOx in the atmosphere is road traffic (42%), followed by other modes of transport and machinery (29%) [47] (see Figure 1).
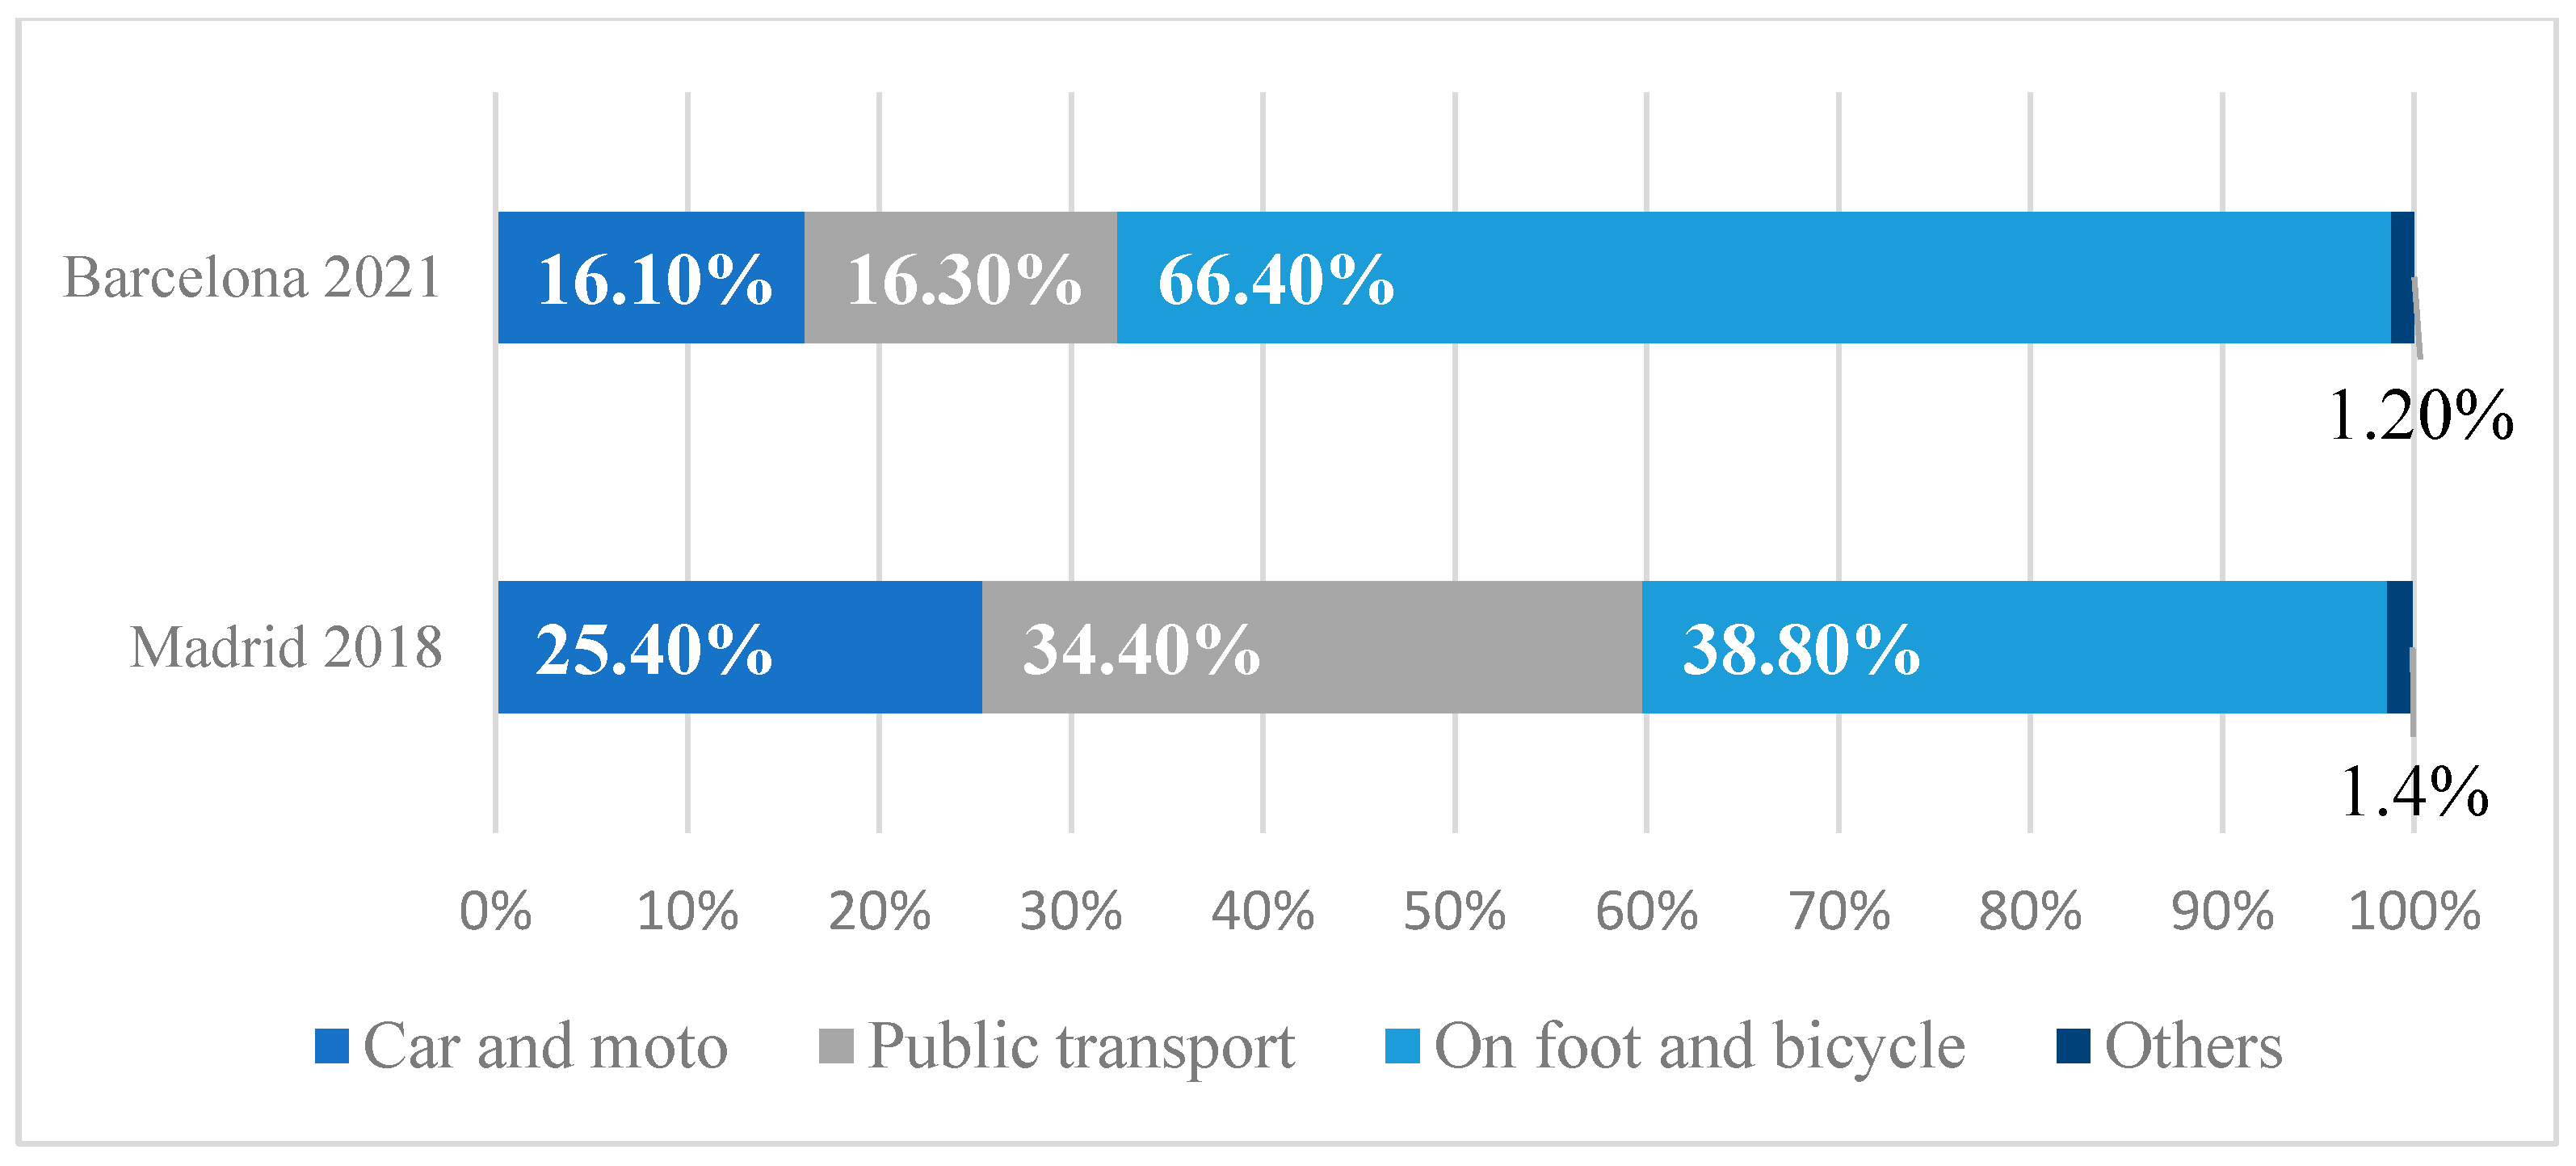
Looking at the two biggest metropolitan areas in Spain (Madrid and Barcelona), the modal split for all travel reasons is represented in Figure 2 and Figure 3. Modal split by all trip types in the urban areas of Madrid and Barcelona. Source: Metropolitan Mobility Observatory, 2020 Report [48]. The percentage of people using cars and motorcycles as their principal mode of transportation is around 40% in the Madrid region and 25.40% in the Madrid urban area. The modal distribution seems to be different in Barcelona, and the percentage of cars and motorcycles is observed to be lower in Barcelona, the next big city in Spain (see Figure 2 and Figure 3).
Many studies were published since 2020 analyzing the impacts of strict lockdowns on air pollution in urban areas (see review studies conducted by Gkatzelis et al. (2021) [49] and Silva et al. (2022) [50]). Focusing on Spanish urban areas, some authors made direct comparisons between pollutant concentrations in the lockdown period vs. the pre-COVID-19 period in cities such as Madrid and Barcelona [10,12,51,52,53,54]. At the international level, Gualtieri et al. (2020) [55], Jephcote et al. (2021) [56], Jia et al. (2021) [57], and Volke et al. (2023) [58], among others, used the same methodology to analyse in detail the impacts of traffic reduction on air quality during the COVID-19 lockdown. In addition to these direct comparisons of air pollutant concentrations, statistical tests were conducted to compare concentrations in different periods; for instance, Alemdar et al. (2021) [59] for Istanbul or Donzelli et al. (2021) [60] for Valencia in Spain, who used Student’s t-test for paired samples. Other models, such as linear correlation [61,62], linear regression [11], and generalized linear models [63,64], were used to study the relationship between air pollutants, meteorological variables, and traffic in various urban areas around the world.
This study focuses on the special case of the Madrid region, comparing urban and suburban areas, and it includes the special relationship of air quality with mobility variations and the pandemic and post-pandemic periods. Madrid exceeded EU nitrogen dioxide (NO2) limits for eight years in a row (2010–2018), and even surpassed the hourly limit [65]. It was among the regions worldwide with the greatest incidence of COVID-19 and the most stringent mobility restrictions imposed in 2020 and 2021. The main objective of this study is therefore to carry out a detailed analysis of the effects of lockdown and post-confinement mobility measures on air pollution in the Madrid region. The contribution of the study is threefold and was addressed in previous studies: (i) to analyze the changes in air pollution concentrations in the Madrid region during the pandemic period considering different waves of the virus (with different mobility restrictions) in the region and during the post-pandemic period; (ii) to analyze in detail these changes in urban vs. metropolitan areas; and (iii) to look for recommendations for designing future mobility strategies for improving air quality in urban and metropolitan areas based on the results of the analysis.
The paper is structured as follows: After the introduction in Section 1, Section 2 describes the case study of the Madrid region, the data collection, and the statistical analysis. Section 3 presents the main results of the study. The main findings are discussed in Section 4. Finally, Section 5 contains some concluding remarks, limitations, and recommendations for further research.

2. Materials and Methods

2.1. Case Study: The Madrid Metropolitan Area

The Madrid region is in the center of the Iberian Peninsula and covers an area of 8028 km2 [66]. It is administratively divided into 179 municipalities, among which a clear distinction can be made between the city of Madrid (the national and regional capital) and its metropolitan area (27 municipalities) and the periphery (152 municipalities). The population of the Madrid region in 2021 was 6,751,251 inhabitants [67], making it the most densely populated region in Spain. At the economic level, a strong contrast can be seen between the areas near the city of Madrid (more likely to correspond to the service sector) and the periphery (more dedicated to the industrial and agricultural sectors). The city has 3,312,310 inhabitants as of 2021 [67], representing 49.1% of the total population of the region. Economically, it has a very important presence in the service sector (mainly tourism) and to a much lesser extent in the secondary or industrial sector. The city of Madrid has numerous public transport lines by road (urban bus), rail (metro, which also reaches some municipalities in the metropolitan area), and sharing mobility services (e-bike sharing, e-kick scooter sharing, motosharing, carsharing, etc.). It is connected to the rest of the region by road (intercity buses) and suburban and light rail. Private road transport is divided between traffic in the city of Madrid (urban traffic) and its metropolitan area (urban and interurban traffic). Most journeys in the city are made on foot and by bicycle (38.8%), while in the metropolitan area, the percentage is 34.1% [48], while journeys between the capital and the metropolitan area are preferably made by car or motorbike (60.2%) [48]. The recovery of mobility after the lockdown did not follow a defined pattern dependent on the municipalities near Madrid [68].
In terms of air pollution, Madrid’s concentration of population, economic activity, and mobility mean that its levels of nitrous oxides and particulate matter exceed some of the thresholds legislated by the EU. For instance, throughout 2019, there were a total of three episodes of acute nitrogen dioxide pollution in the city of Madrid [69]. In compliance with current legal regulations, since 2018, the city had an action protocol in force for episodes of high NO2 pollution [70]. Two low emission zones (LEZ) were implemented in which the entry of the most polluting vehicles is banned: Madrid Distrito Centro (in force with changes since 2018) in the central core of the city, and Plaza Elíptica (in force since December 2021) in the south of the city [71]. The local regulation also includes the so-called “Madrid Low Emission Zone”, which progressively restricts access and circulation to vehicles with no labels from January 2022 to January 2025 in the whole city [71].
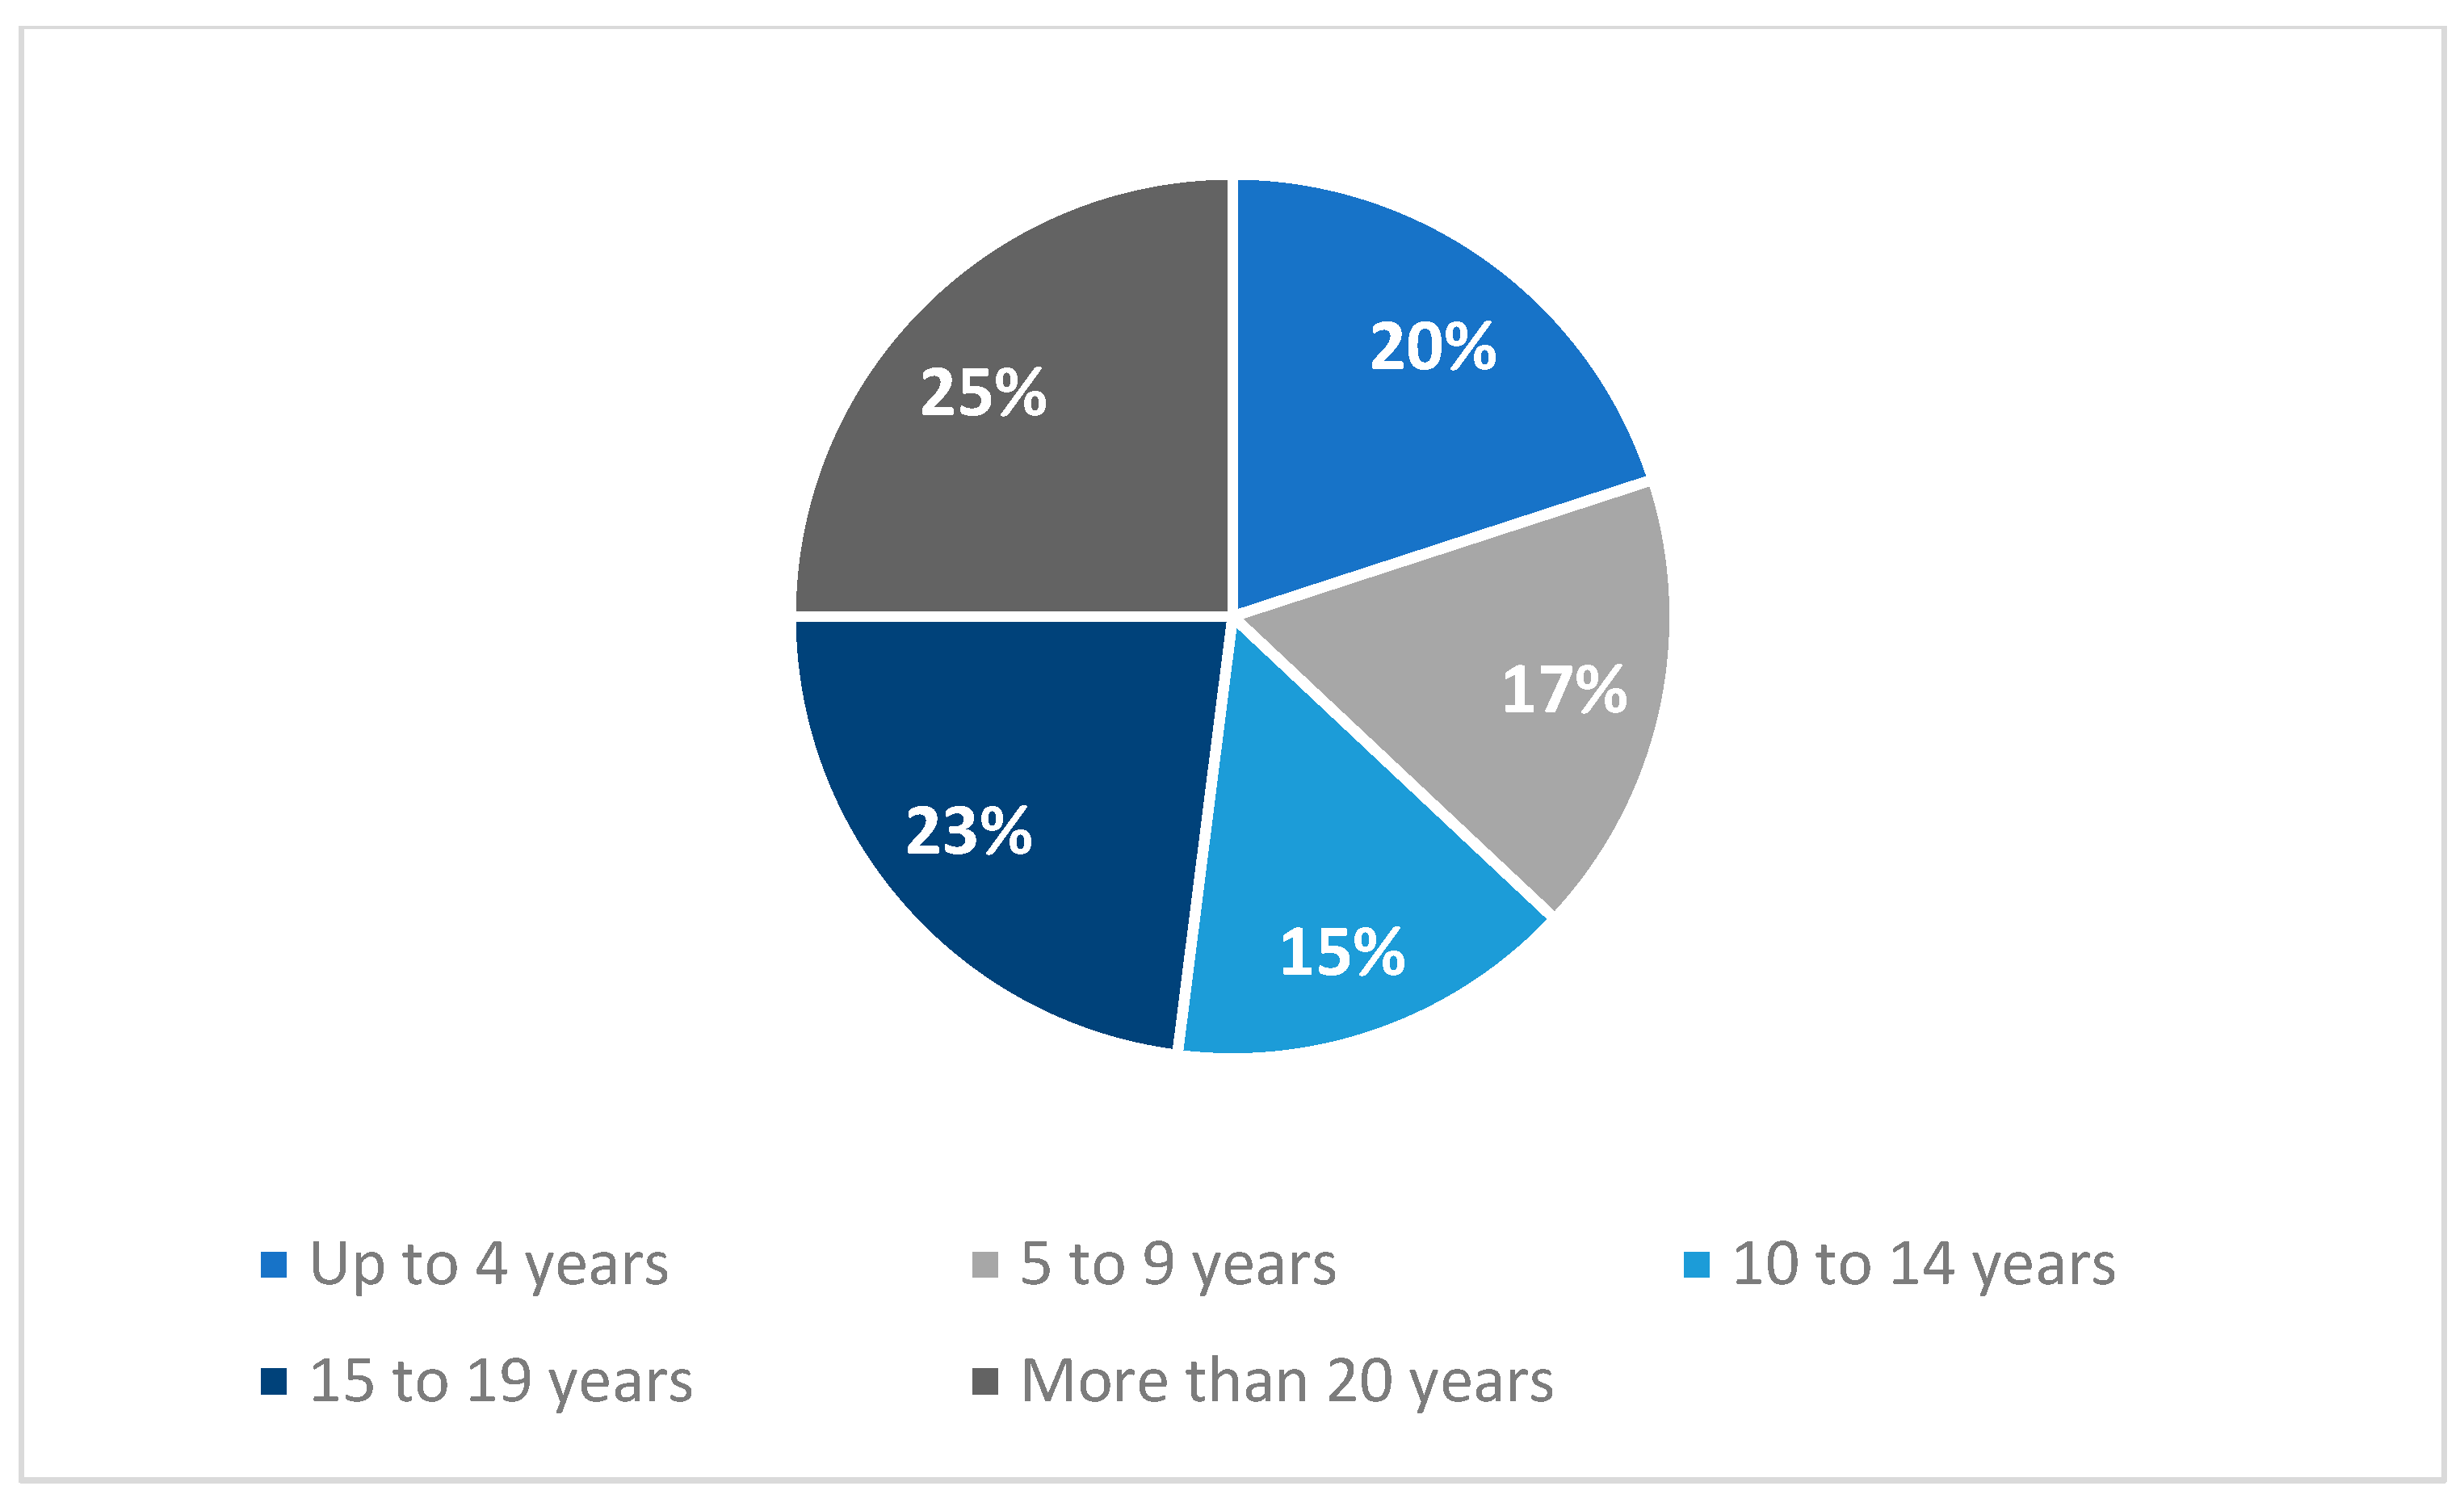
The age of the vehicles in which the citizens move is an important factor that contributes to air pollution. A much older fleet is capable of emitting more air pollutants [72]. In the Madrid region, the vehicle fleet is an ageing fleet, with at least a 63% of the vehicles being older than 10 years (see Figure 4).
In order to analyze the effect that mobility has on air quality during the course of the COVID-19 pandemic and afterwards in the region, we selected two scenarios: a pandemic scenario, in which six periods corresponding to the COVID-19 waves were identified during the years 2020 and 2021; and a post-pandemic scenario, in which two periods were identified in 2022 (see Table 1 and Table 2). Both scenarios (pandemic and post-pandemic) in the analyses are compared with the pre-pandemic baseline scenario corresponding to the year 2019, which was the last one that had a normal mobility pattern previous to the pandemic.

2.2. Data Collection

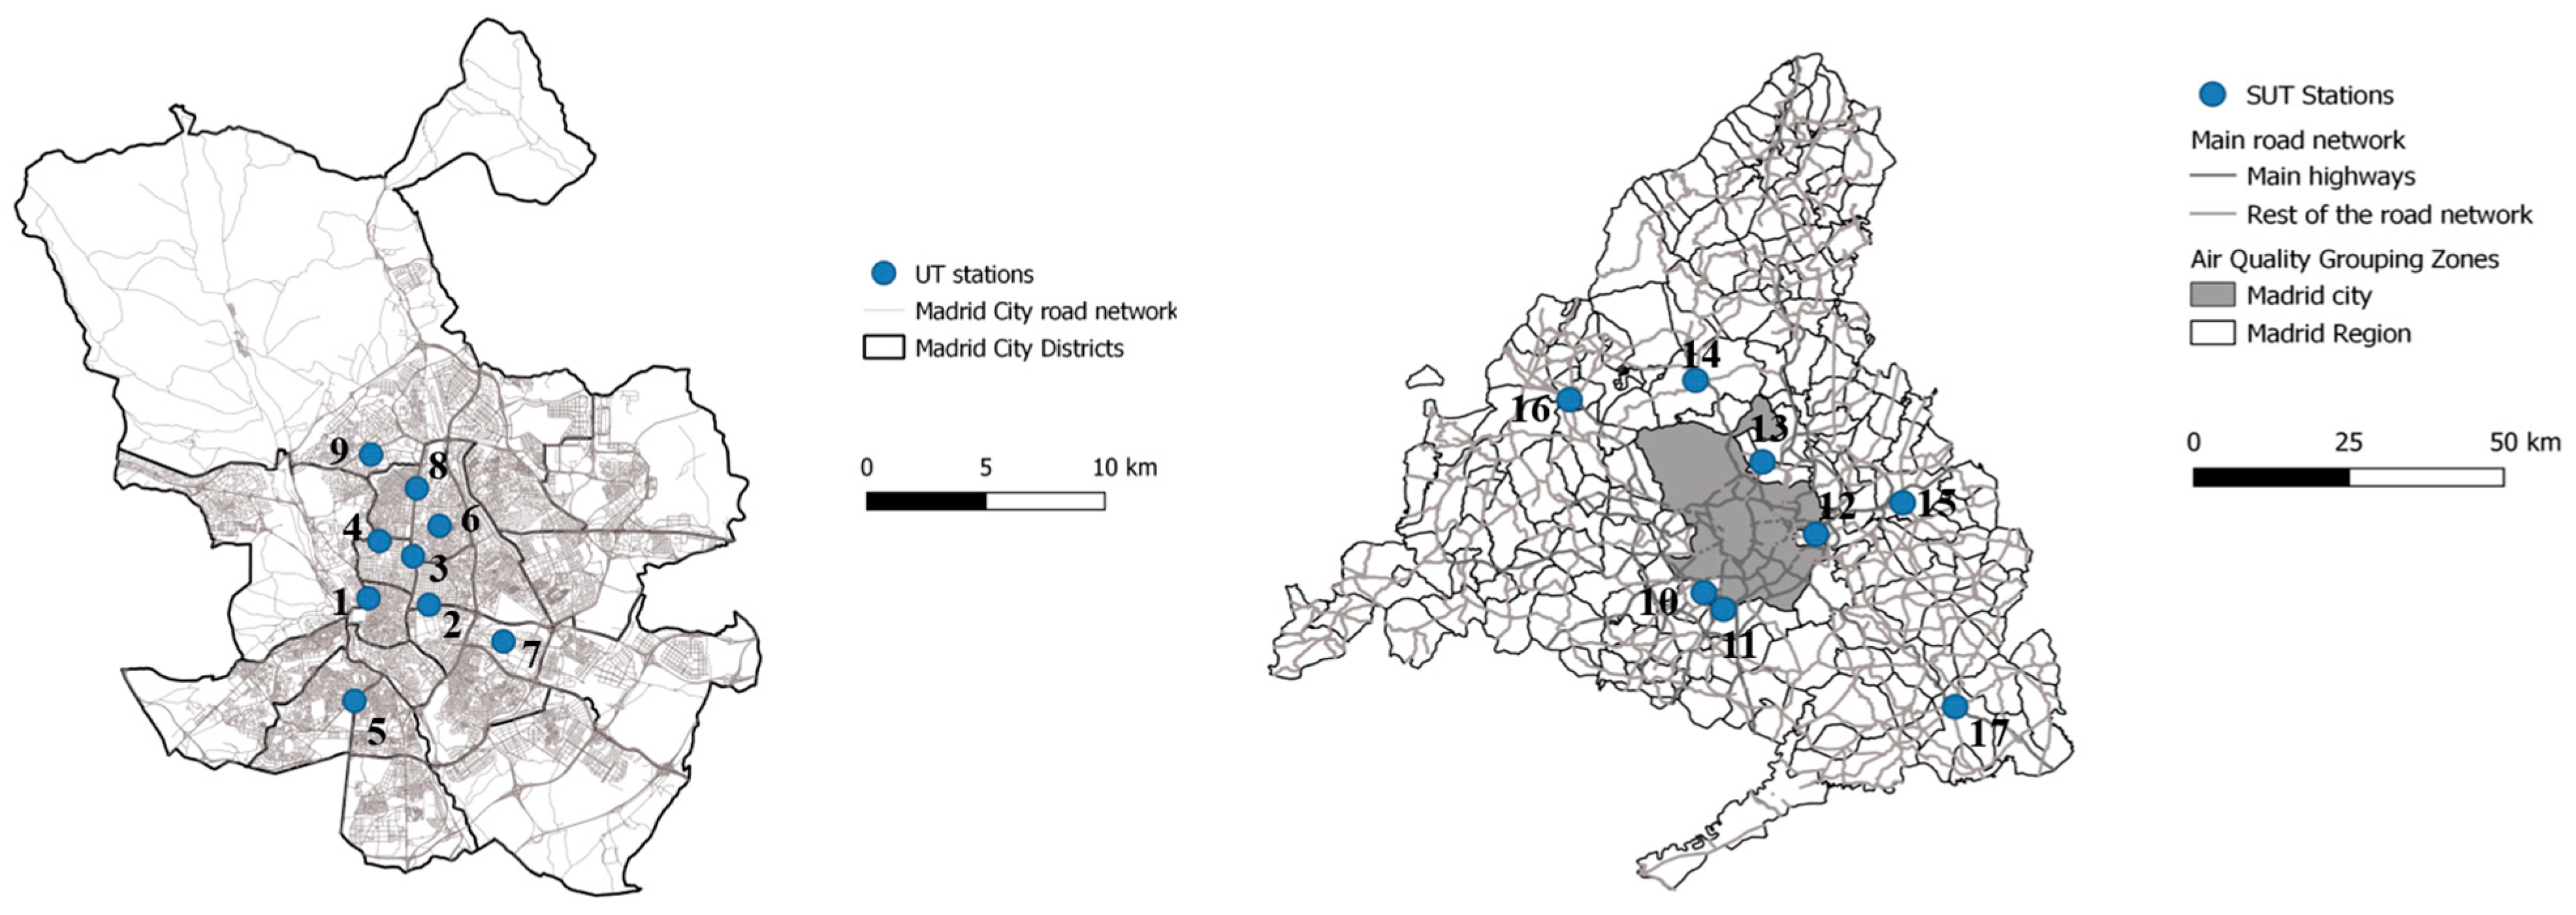
The data used in this paper refer to air quality in the Madrid region. The Madrid region’s air quality measurement network is divided into seven zones, differentiating the city of Madrid from the metropolitan and regional areas. Since the study concerns the effects of mobility restrictions, the air quality stations selected were located in the vicinity of the major road axes for urban (UT) and suburban traffic (SUT). The location of the UT and SUT stations can be seen in Figure 5, corresponding to the metropolitan and regional areas. The distances between the UT and SUT stations to Puerta del Sol, Madrid’s city center and the traditional starting point for all Spanish roads, were calculated and can be seen in Table 3 and Table 4.
The average daily concentrations of NO2, NOx, PM2.5, PM10, and O3 in 2019, 2020, 2021, and 2022 were downloaded from the open data portal of the Madrid City Council [75] and open data from the Madrid region’s air quality network [76]. Information regarding equipment, measurement error, coordinates stations, altitudes and topography of the area are published as metadata in such open data portals.

2.3. Statistical Analysis

To estimate the impact of the various mobility restrictions in each of the COVID-19 wave periods (see Table 1 and Table 2) of each of the scenarios selected on air quality, a direct percentage comparison was made between the daily average concentration of the selected air pollutants in each period and their corresponding baseline period in 2019 ((pandemic value − baseline value)/pandemic value) × 100 for each period). Student’s t-test for paired samples (for parametric data) and the Wilcoxon rank sum test (for non-parametric data) were carried out to determine whether the changes in pollutant concentrations in this period were statistically significant. We chose to reject the null hypothesis (H0) for both tests if the p-value exceeded 0.05 (α = 0.05).

2.4. Software

The analysis was performed with the statistical software Stata 15.1 [77]. The percentage differences in the concentration of airborne pollutants in the COVID-19 periods were calculated with Microsoft Excel 2022 [78]. Qgis 3.26.3 [79] was used to produce the maps.

3. Results

3.1. Descriptive Statistics of Nitrous Oxides: UT and SUT Stations

The changes in the daily average air pollutant concentrations of NO2 and NOx in the selected periods compared to the baseline period (pre-pandemic scenario 2019 year) for all air quality stations, and the comparison between UT and SUT are shown in Table 5 for the pandemic scenario (2020–2021) and Table 6 for the post-pandemic scenario (2022). Additionally, the Supplementary Tables S1 and S4 show the statistical tests performed for all stations and periods and scenarios. The bigger variations in nitrogen oxides over the analysis periods correspond to the intensity of the mobility restrictions.
Pandemic Scenario
Starting with the pandemic scenario (Table 5), during the first period, there is an average 47% reduction in the concentration of NO2 and NOx. Nitrous oxide pollutants had a bigger decrease in Madrid city than in the metropolitan areas (51% lower in UT stations versus 42.7% lower in SUT stations for NO2 pollutants). By stations, UT 1-Plaza de España (in the city center) recorded the greatest decrease compared to the reference period, reducing its daily average NO2 concentration by 75%; while SUT 17-Villarejo de Salvanés, in the metropolitan area and the furthest from the city center, saw the smallest reduction in its daily average NO2 concentration, with 30.6%. The reduction in the mobility is seen as the major cause of reduction in pollutants (see Supplementary Table S1).
With the resumption of mobility in summer 2020, in the second period, the concentration of both NO2 and NOx increased compared to the first period, although it did not recover the pre-pandemic levels. The reduction was only −6.4% for NO2 and −0.8% NOx with respect to the reference 2019 period. The average daily concentrations recorded in the air quality stations in the urban center of Madrid also fell more significantly (a 9.2% reduction in NO2 in UT stations versus 3.3% in SUT stations; average NOx concentrations increased in the SUT stations by 5.8%). The figures seemed close to the situation before the pandemic, although the teleworking that remained after confinement could reduce mobility volumes and contribute to reductions in pollution levels.
In the fourth period, average decreases in daily concentrations of 20% for NO2 and 23% for NOx were recorded in all stations. Similar reductions were recorded on average for NO2 in both UT and SUT stations, while the decline in NOx was more significant in UT than in SUT stations. These decreases are not explainable with changes in mobility and additional studies can be necessary.
The fifth period occurred in summer of 2021, when the rapid vaccination rate in Spain and the effectiveness of mask wearing enabled the mobility restrictions to be lifted. Average daily concentrations in all stations fell by 14% and 18.7% for NO2 and NOx, respectively, which was much less since in previous periods, in parallel to the return to unrestricted mobility. For both pollutants, UT stations recorded the greatest reductions: UT1 Plaza España saw the greatest decline in daily pollutant concentrations compared to the baseline period in 2019, with −33% and −31.5% for NO2 and NOx, respectively.
Finally, in the sixth period, no COVID-related mobility measures were active. Despite being a pilot period of the measures for the creation of low emission zones in the urban area, for the first time after all the waves of COVID, in coincidence with the study periods, daily mean concentrations increased by 8.4% and 7.4% on average for NO2 and NOx, respectively. UT stations saw the lowest increase in concentrations, in contrast to SUT stations where NO2 and NOx concentrations increased by 12.4% and 18.2%, respectively (Table 5 in red). Significantly, concentrations decreased the most in the UT 2-Escuelas Aguirre air quality station during this period (−12% and −20% for NO2 and NOx, respectively).
Moreover, Supplementary Table S1 shows that NO2 and NOx levels underwent statistically significant changes in most stations in the first, third, fourth, and fifth waves (periods). Among all the UT stations, UT 2-Escuelas Aguirre is particularly noteworthy because there were statistically significant changes in NO2 in all but the sixth wave (with a p-value of 0.055), and in NOx in all waves compared to the baseline scenario. For suburban areas, SUT 12-Coslada is also worth noting, as there were statistically significant changes in NO2 in all but the sixth period, and in NOx in all waves except the second. These stations therefore merit an in-depth analysis of the effects of traffic and meteorology in the future [31,55].
Post-pandemic Scenario
In the post-pandemic scenario (Table 6), in the seventh period, an average reduction of 28% for the NOx concentration and 27% for NO2 concentrations was recorded in the SUT stations. In the UT stations, the average reductions were of a 35% for NOx and 22% for NO2 (see Supplementary Table S4). By stations, the greatest reduction in NO2 concentration was recorded in SUT 14-Colmenar Viejo (−47%), which is in the metropolitan area of Madrid. For Madrid city, the greatest reduction was recorded at UT 1-Plaza de España (−71%) for NOx, while the UT 2-Escuelas Aguirre recorded the largest average reduction for NO2 (−40%), with both stations situated in the center of the city.
In the eighth period, the concentration of both NOx and NO2 continued to be below the pre-pandemic values. It did not exceed the 2019 reference period values at both the UT and SUT stations. NOx reduction was, on average, 11%, while the NO2 reduction was of 12% for the SUT, which is quite different from the urban area, where the reduction in NOx was greater, of 29%, and the NO2 was of 16%. The greatest reduction was recorded at the SUT 17-Villarejo de Salvanés for both NOx and NO2 (22% for NO2 and 21% for NOx). In the UT stations, UT 1-Plaza de España recorded the largest reduction for NOx (−55%) meanwhile the UT 7-Moratalaz registered a 26% reduction in the concentration of NO2.
Additionally, Supplementary Table S4 shows that NOx concentrations changed significantly for almost every period for the UT stations. For the SUT stations, almost every wave period recorded a significant change, with the notable exception of the sixth wave. Following the trend started in the pandemic period, UT 2-Escuelas Aguirre recorded a significant change in NOx concentration for all periods. For NO2 (see Supplementary Table S4), the same trend as NOx concentration for both urban and suburban air quality traffic stations is noted. UT 1-Plaza de España, UT 2-Escuelas Aguirre, and UT 5-Plaza Elíptica stands out for recording significant changes in the six waves considered for this study. For the SUT stations, SUT 13-Alcobendas and SUT 17-Villarejo de Salvanés stand out, registering significant changes in five of the six wave periods considered in this study.
The teleworking rates that increased in respect to the pre-pandemic period and the Madrid 360 measures can contribute to reducing mobility volumes, and consequently, to reductions in pollution levels.

3.2. Descriptive Statistics of Particulate Matter: UT and SUT Stations

The variation in PM2.5 and PM10 does not seem to follow as clear of a trend as NO2 or NOx, although they do maintain the same pattern to some extent. Table 6 (pandemic scenario) and Table 7 (post-pandemic scenario) show the main results. Additionally, the Supplementary Tables S2 and S5 show the statistical tests performed for all stations and periods and scenarios. It should be noted that not all UT and SUT stations recorded data for particulate matter.
Pandemic Scenario
Starting with the pandemic scenario (Table 7), for the first period, an average decrease of 2% was recorded for PM2.5 and 16% for PM10 considering all stations. Focusing on Madrid city, these average reductions increased up to −5.8% and −19% for PM2.5 and PM10, respectively, with UT 5-Plaza Elíptica having the greatest reduction in both pollutants (−15.2% and −37.6% for PM2.5 and PM10, respectively). In contrast, the suburban area recorded an increase in PM2.5 compared to the baseline period, with SUT 16-Collado Villalba showing the greatest rise in the daily average concentration, with 28.4% for PM2.5.
In the second period, daily average concentrations of PM2.5 of all stations increased also compared to 2019, while the daily average concentration of PM10 remained almost unchanged. As before, the air quality in the urban area declined the most, with the particularity that the pollutants in the UT 5-Plaza Elíptica decreased 10.2% and 22.9% for PM2.5 and PM10, respectively.
In the third period, the period with the heavy snowstorm, particulate matter pollution was greatly reduced by 21.5% (PM2.5) and 18% (PM10) compared to the baseline scenario in 2019 on average in all stations. During this period, air quality stations in the city of Madrid recorded the greatest reductions, with UT 2-Escuelas Aguirre reducing particulate matter concentrations the most, by −41.5% and −38% for PM2.5 and PM10, respectively.
In the fourth period, both pollutants showed very similar behavior, with increases in the daily average concentrations of 21.5% for PM2.5 and 18% for PM10. This period had the highest increase in PM concentrations of all the six waves. However, the UT 2-Escuelas Aguirre in Madrid city recorded the greatest reduction in PM2.5 compared to the baseline period (−10.6%), and UT-5 Plaza Elíptica experienced the greatest fall in daily average PM10 concentrations with 6%; in contrast, suburban stations saw a significant increase in daily concentrations. Daily average PM2.5 concentrations rose by 51.2% in SUT 16-Collado Villalba and daily average concentrations of PM10 by 45.8% in SUT 14-Colmenar Viejo.
In the fifth period, daily average concentrations of pollutant matter decreased (−1.9% and −6.3% for PM2.5 and PM10, respectively). The greatest reductions occurred in suburban air quality stations (around 8%). SUT 14-Colmenar Viejo recorded the largest drop in PM2.5 during the period (−28.4%), while SUT 11-Getafe saw the most significant fall in PM10 (−22.1%). UT 8-Plaza de Castilla had the largest increase in both pollutants.
In the sixth period, the daily average concentrations of both pollutants declined (5.6% for PM2.5 and 1.8% for PM10). Comparing urban and suburban stations, the air quality stations in Madrid city registered reductions for both pollutants (on average −15.9% and −7.8%, for PM2.5 and PM10, respectively), while SUT stations saw increases of 6.6% and 10% for PM2.5 and PM10, respectively.
Additionally, the statistical tests show no clear pattern in terms of generating statistically significant changes in concentrations for both pollutants (see Supplementary Table S2). Results for pollutant matter: mean comparison (Student’s t-test for parametric samples; P and Wilcoxon rank sum test for non-parametric samples NP) of daily average concentrations (µg/m3) from traffic air quality stations (UT and SUT) and the mean difference in the six COVID-19 waves identified in the pandemic scenario.). Most notably, in the city of Madrid, the stations UT 4-Cuatro Caminos and UT 5-Plaza Elíptica had changes in their PM2.5 concentrations that reached statistical significance in four out of the six waves. UT5-Plaza Elíptica is also noteworthy for PM10, with statistically significant changes in three out of the six waves (first, second, and third), with all associations having a p-value of less than 0.001. In the suburban area, SUT 11-Getafe showed statistically significant changes in three out of the six waves for PM10 (first, third, and fifth).
Post-pandemic Scenario
In the seventh period, as Table 8 shows, an average increase in PM2.5 (+19%) and PM10 (+57%) was registered for all stations on average. The SUT 16-Collado Villalba recorded the greatest increase in the PM2.5 concentration (+47%), while for PM10, it was recorded at SUT 11-Getafe (+127%). For the city, UT 4-Cuatro Caminos recorded an increase in both PM2.5 (+41%) and PM10 (+63%), respectively.
In the eighth period, the concentration for both PM2.5 and PM10 increased in the UT stations (+14% for PM2.5 and 17.6% for PM10) while decreasing in the SUT stations (−9% for PM2.5 and −0.5% for PM10). However, SUT 12-Coslada recorded the greatest increase for PM10 (+11%), while the same increase in PM2.5 was recorded at SUT 17-Villarejo de Salvanés. For the UT stations, UT 2-Escuelas Aguirre recorded a 114% increase in PM2.5 concentration, while the UT 4-Cuatro Caminos reported a 94% increase in PM10 concentration.
For the post-pandemic scenario, Supplementary Table S5 shows that for PM2.5 no clear trend is noted regarding significant changes in this air pollutant concentration. UT 4- Cuatro Caminos (in the urban environment) and SUT 15-Alcalá de Henares (for suburban environment) stand out, with changes being recorded in five of the six waves. SUT 17-Villarejo de Salvanés also stands out, because none of the waves registered a significant change in PM2.5 concentration. For PM10 no change trend regarding the concentration is observed. UT 4-Cuatro Caminos and UT 5-Plaza Elíptica stand out, with all six waves registering significant changes for UT 4 and five out of six for UT 5. In the suburban environment, SUT 13-Alcobendas stands out because no significant changes are observed in the post-pandemic scenario when compared to the baseline reference period of 2019 (see Supplementary Table S5).

3.3. Descriptive Statistics of Ozone: UT and SUT Stations

Ozone is only recorded by three UT stations and eight SUT stations. The variation in ozone does not appear to follow a clear trend throughout the COVID-19 waves and post-pandemic, Table 9 and Table 10 shows the main results for this pollutant.
Pandemic Scenario
During the first period, a 10.3% decrease in daily average concentrations was recorded compared to the same period in 2019 for all stations. Ozone fell most significantly in the suburban areas, with an average reduction of 13% compared to the baseline period. The station that saw the most significant drop in O3 was SUT 11-Getafe, whose average daily O3 concentrations fell by 20%. Conversely, daily average concentrations increased by 4.5% in UT 2-Escuelas Aguirre in the Madrid city center. In the summer and autumn of 2020 (second period), variations in the daily average concentration of O3 were similar to the first period, decreasing most in the suburban area, where SUT 16-Collado Villalba experienced the greatest reduction, but UT 2-Escuelas Aguirre increased its daily mean concentrations by 10.2%. In the third period, the daily mean O3 concentration increased by 21.9% compared to the same period in 2019. The station with the greatest increase in daily average O3 concentration for the period was UT 5-Plaza Elíptica (+35%) in Madrid city. The fourth period behaved similarly to the first and second period, with average recorded reductions of 10.6%. In the fifth period, the stations in Madrid city increased their daily average concentrations by an average of 11%, with UT 2-Escuelas Aguirre seeing the greatest rise (+19.7%), while stations in suburban areas saw an average decline of 5.3%. Finally, in the sixth period, there were no appreciable changes with respect to the 2019 baseline period. However, the suburban station SUT 15-Alcalá de Henares recorded the largest O3 reduction and SUT 17-Villarejo de Salvanés recorded the greatest increase.
The statistical tests revealed statistically significant changes in O3 concentrations in most of the waves for all the SUT stations (see Supplementary Table S3). The SUT 17 Villarejo de Salvanés is particularly noteworthy, as it reached statistical significance in all waves; and SUT 14 Colmenar Viejo, where changes occurred in five of the six periods, although the non-statistically significant wave—the sixth—had a p-value of 0.053. Ozone is fully recorded in two urban stations in Madrid city (UT 9-Barrio del Pilar and UT 2-Escuelas Aguirre) and partially in another one (UT 5-Plaza Elíptica); only UT 9-Barrio del Pilar presented statistical significance for three out of the six periods.
Post-pandemic Scenario
In 2022, post-pandemic scenario, UT stations did not record the ozone concentration adequately, therefore only the SUT will be taken into account.
For the SUT stations, a decrease of 8.6% in the seventh period was reported, with the SUT 14-Colmenar Viejo reporting a decline of a 17%. In the eighth period, O3 concentration increased by 3.6%, with SUT 17-Villarejo de Salvanés increasing its concentration by 14%.
In the year 2022, the same trend is noted, with significant changes in ozone concentration for almost every wave in all SUT stations (see Supplementary Table S6). SUT 16-Collado Villalba and SUT 14-Colmenar Viejo are the stations in which more periods reached statistical significance.

4. Discussion

In this study, we analyzed the impacts on air pollution of the different COVID-19 waves and the mobility restrictions implemented to stop the spread of the disease in the Madrid region and compared the effects in the main city and the metropolitan area in two scenarios: during the pandemic (years 2020 and 2021) and after the pandemic (year 2022), and their comparison to the pre-pandemic scenario (year 2019). We found a minor difference between the Madrid city (urban environment) and the rest of the Madrid region outside the Madrid city (suburban area), which causes small drops in the concentrations of the air pollutants recorded in the UT and SUT stations. This difference can be explained by a variety of factors, such as urban density and possibilities of diffusion of contamination or the concentration of several sources in the dense area [80].
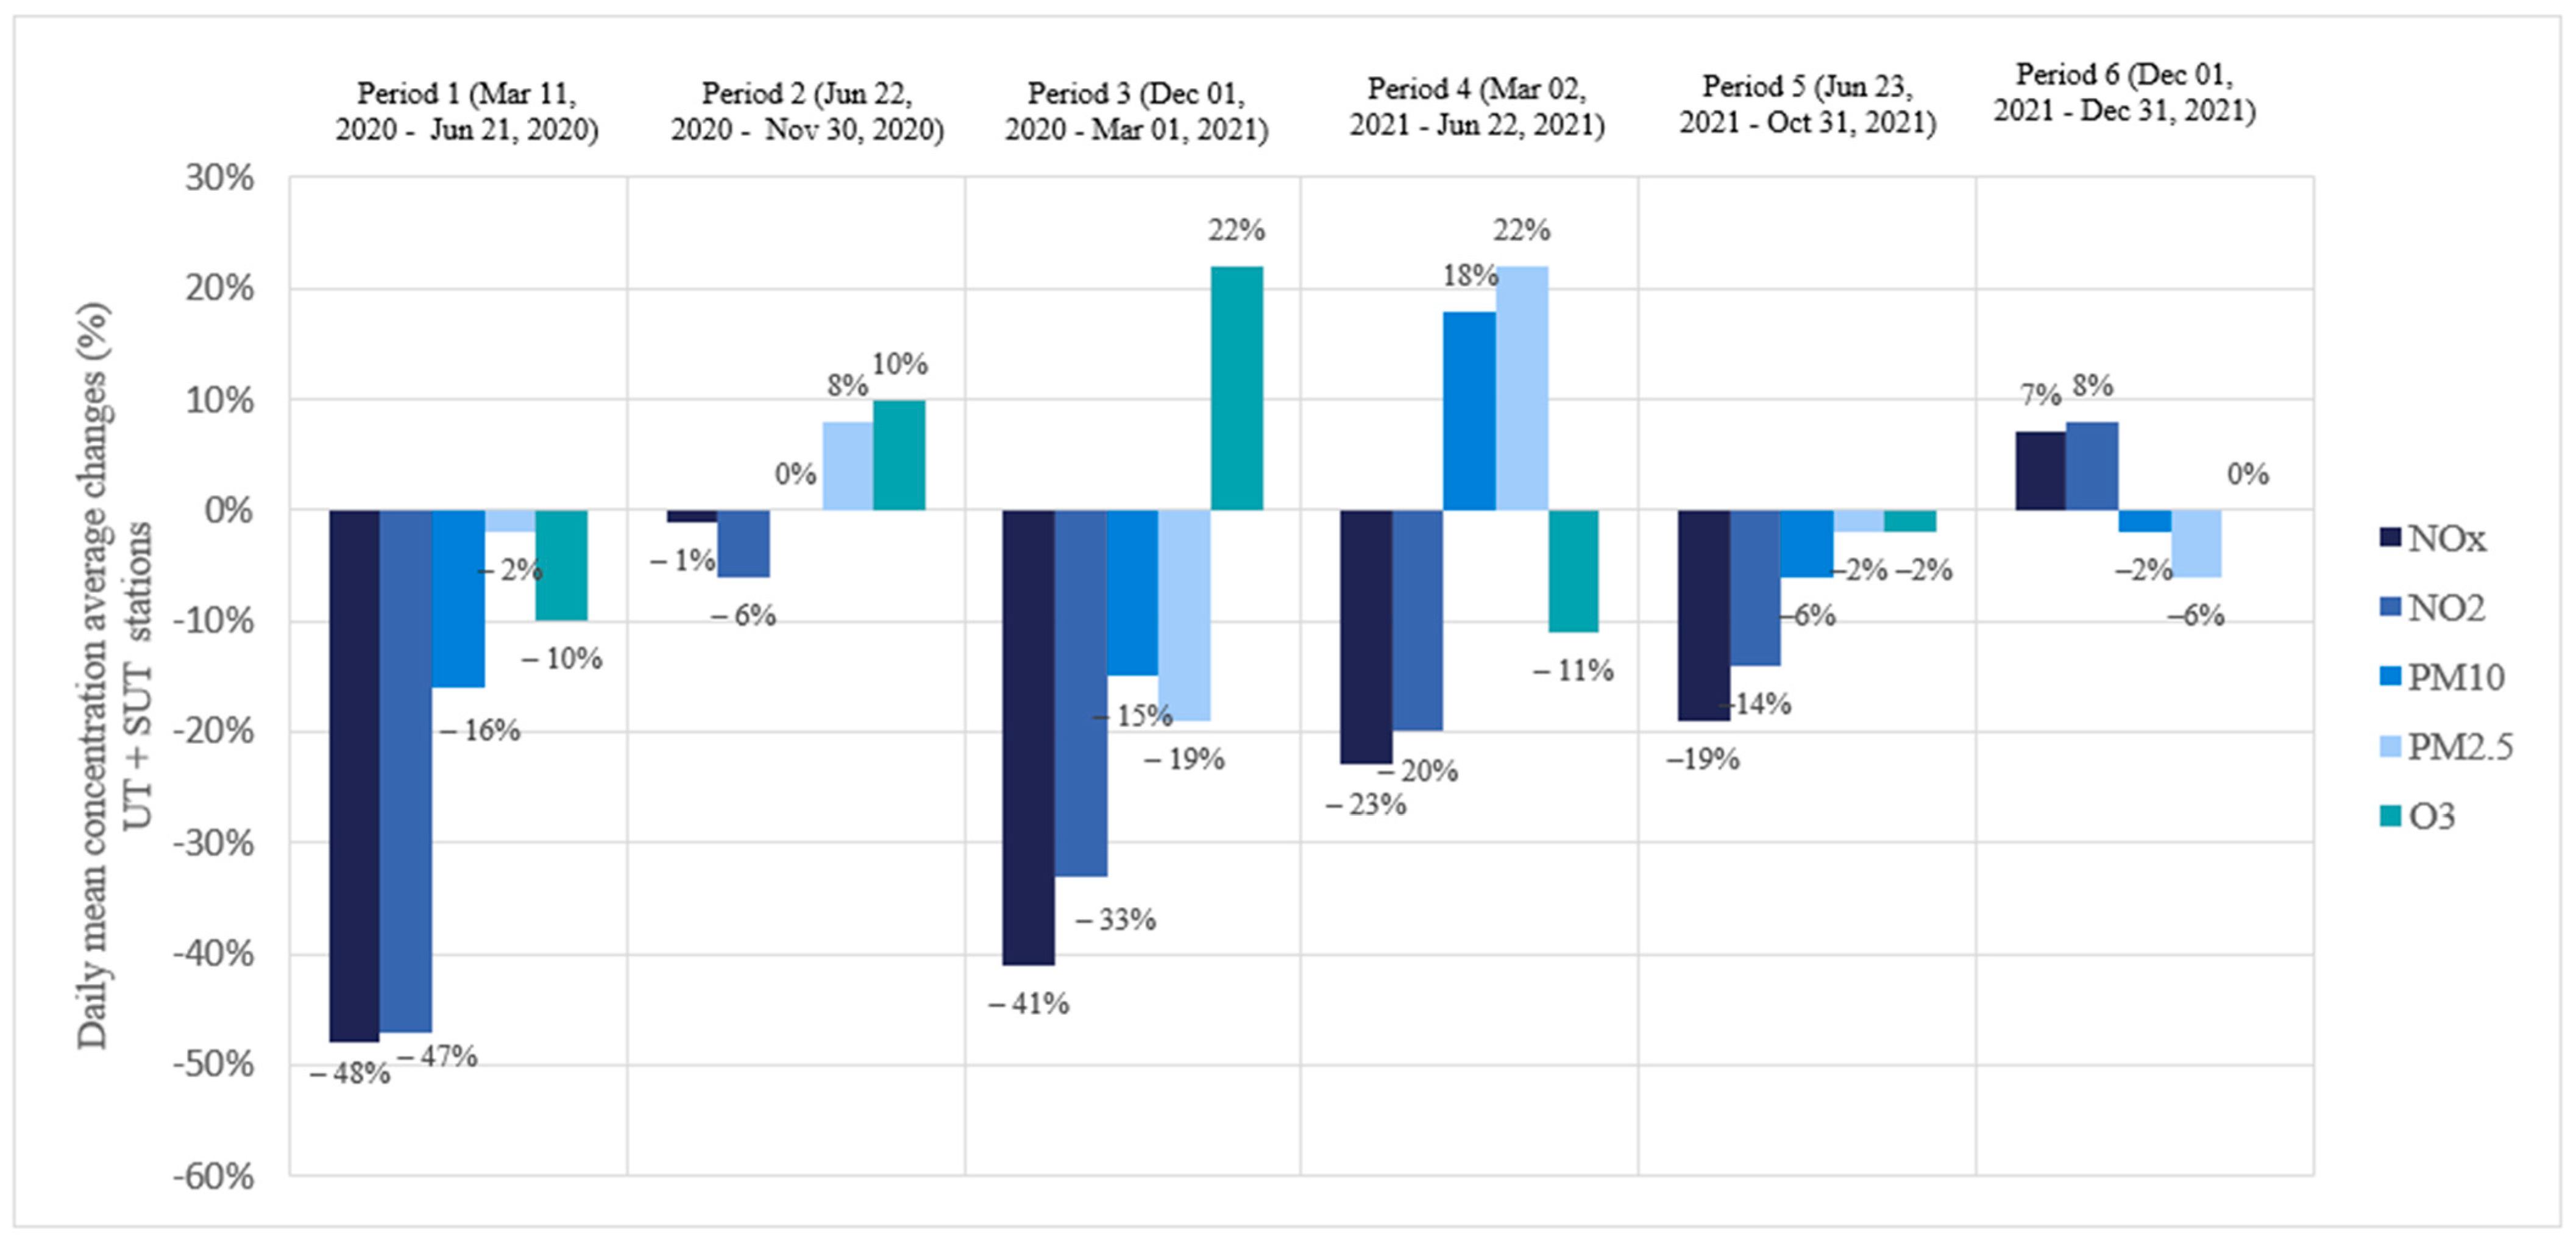
During the pandemic, the findings demonstrate that pollutant concentrations decreased the most in the first and third COVID-19 waves when mobility restrictions were strongest: there was strict confinement in the first wave, and severe weather, which forced the interruption of traffic in the region in the third wave. Figure 6 shows that the greatest decline occurred during the first period (strict lockdown) for all pollutants, but especially nitrous oxides, with a total 47% reduction in daily average concentrations for all the stations studied in the region, in line with previous research focused on Madrid city [10,11,51,52,81]. In the first period, traffic fell by 52.6% and 49.5% compared to the same period in 2019 in Madrid city and the MMA, respectively [82]. The third period also produced significant reductions in daily average concentrations of nitrous oxide, with an average of around 41% and 33% for NOx and NO2, respectively, in traffic air quality stations compared to 2019. The situation is similar for particulate matter concentrations, although they declined far less than nitrous oxides, as mobility is not their main source. The third period saw the greatest fall in these pollutants, when their mean daily concentration fell by 19% and 15% for PM10 and PM2.5, respectively. The first and fourth periods experienced the greatest reductions in ozone, with 10%. All in all, the study shows that nitrous oxides warrant a special analysis to understand the effects of COVID-19 waves, traffic, and meteorology [31,55].
The return to normal activity with the vaccination of the population by the end of 2021 (when 79% of the total population had been completely vaccinated [83]) led to greater mobility among the population, so the sixth period saw an increase in nitrous oxides. However, in addition to the resumption of normal activity, the age of the vehicle fleet in the Madrid region also increased during the COVID-19 waves, and more than 30% of the car fleet was now over 15 years old, 98% of which ran on polluting fuels (diesel and gasoline) [73]. Policies designed to achieve a fleet that is free from polluting emissions or to encourage emission-free trips should therefore also be prioritized.
After the pandemic, mobility resumed and so did the NOx and NO2 emissions, but it did not reach the levels registered in 2019 (see Figure 7). In the seventh period, the concentration of NO2 and NOx decreased in comparison to the baseline period of 2019, which can indicate that not all private transport trips recovered. This could indicate that the fear of contracting the COVID-19 disease in public transport, reported in numerous studies, such as Hostettler Macias et al. (2022) [84] and Park and Kim (2021) [85], decreased significantly. These findings are interesting and should be looked in more depth in a future study. When comparing the post-pandemic scenario in the urban and suburban environments for the nitrous oxides, the same trend is observed, with a much softer trend reported in the NO2 concentration for the UT stations, which may indicate that the concentration of this pollutant did not change in a significant way during this period.
In regard to PM2.5 and PM10 emissions, traffic is not the main source of these air pollutants in the atmosphere [33], so traffic restrictions’ effects on the concentrations of these pollutants can be masked by other emission sources, both of natural or man-made origins, such as a construction site or an episode of Saharan dust intrusions [86]. Due to one Saharan dust intrusion in March 2022 [87], an increase in both PM2.5 and PM10 concentrations was observed for all the stations in both urban and suburban environments in the post-pandemic period studied. In other waves, the PM concentration decreased in comparison to the 2019 baseline reference period.
The ozone concentration has a marked seasonal cycle, with the summer months in the northern hemisphere (June, July, and August) [39] being the ones that report the largest increase in the concentration of this air pollutant. This shows in the results of this study in the post-pandemic period, in which an increase in O3 concentration was reported in the summer months. The consideration of this pollutant as a secondary one [38] means that it is dependent of the traffic emissions, only to a lesser extent than nitrous oxides. The Madrid city air quality control network only measures ozone in two of its traffic stations, so a comparison between urban and suburban environments cannot be made. In the SUT stations, the one that is located further of Madrid city (Villarejo de Salvanés) is where the greatest changes are observed, due to a decrease in the NO2 concentration available. This is consistent with the normal behavior of this air pollutant [39].
Meteorological variables are an important factor that should be taken into account when studying the evolution of air pollution in the atmosphere. Specifically, variables such as wind speed, precipitation, and humidity play a principal role. However, Bañuelos-Gimeno et al. (2023) [45], in coincidence with Baldasano [10], found that, when studying the effects of mobility (road traffic related emissions) on air pollution and meteorological variables jointly, the road traffic had an essential role that masked the effect that meteorological variables had.
After the COVID-19 pandemic was considered under control by the health authorities and all mobility restrictions were lifted, mobility started to increase. However, the effects of the measures taken in the pandemic period still had some effect on the mobility habits of the population. Especially prominent is the prevalence of telematic activities, such as e-learning or teleworking after the pandemic.
The rate of teleworking was higher than before the pandemic, and as we explain hereafter, reduces mobility jointly with the measures of the City Council (Madrid 360) to reduce emissions in the urban area, which came into force on 21 December 2021, and may be the cause of the reduction in emissions compared to 2019 [88].
Teleworking is one of the main reasons why people stopped commuting and was found to have a positive effect on air quality [89]. Figure 8 shows the percentage of people that teleworked daily, which dramatically increased in this period, from a 6% before the pandemic for both the Madrid region and Madrid city to a 27% for the Madrid region and a 34% for Madrid city during lockdown, which indicates an urban prevalence of the teleworking phenomenon in the Madrid city in relation to the Madrid region. This could be linked to the economic distribution of the region, in which the service sector is more prominent, and thus, could not telework even during the pandemic. After the pandemic, those teleworking more than 1–2 times a week increased from between 14 and 18% before pandemic, to 26% (MA) and 35% (Madrid city) after. The percentage of workers who teleworked in Madrid city more than one day per week almost doubled in this time period.
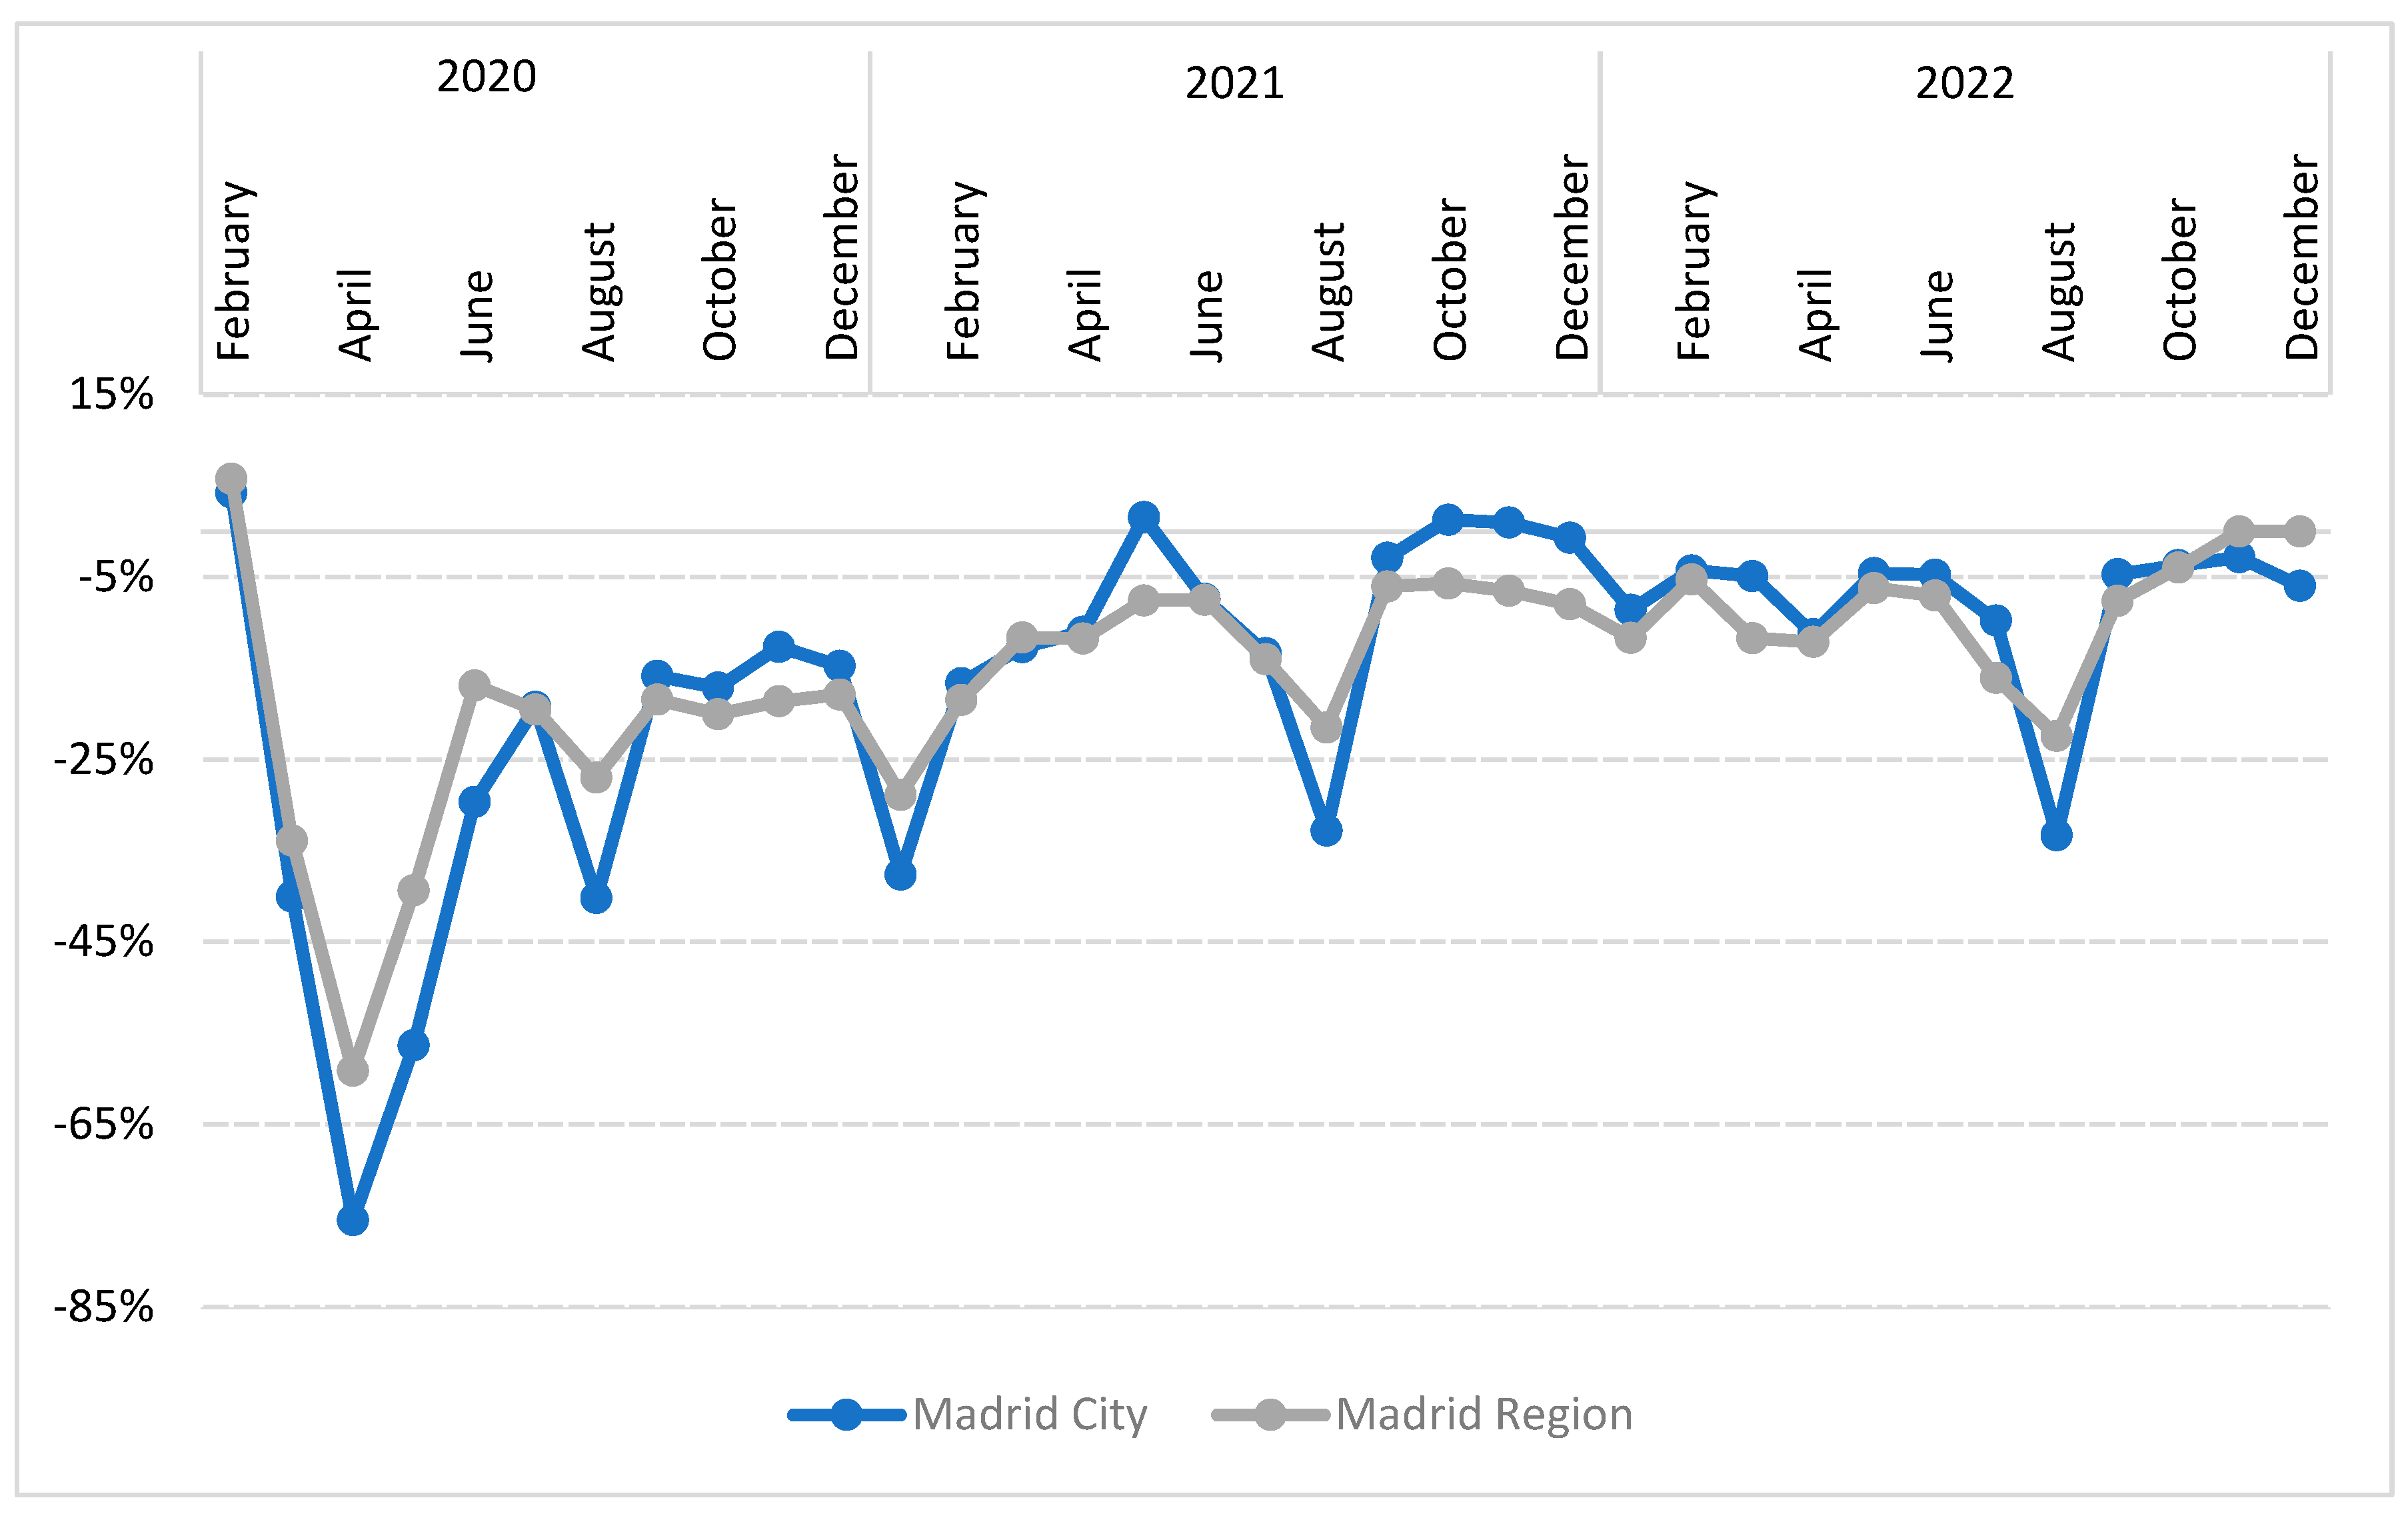
On the other side, Figure 9 shows the monthly percentage variation in traffic registered in gauging stations and Google data for both the Madrid region and Madrid city. It can be observed that the same trend is registered for both urban and suburban traffic data, with a notable reduction in the traffic in the spring months of 2020, when the home lockdown was in full force (−76% for Madrid city and −59% for the Madrid region in April 2020). This coincides with the teleworking data shown in Figure 8, when a notable increase in the number of teleworkers was observed. This reduction in the number of vehicles that were circulating on the streets matches the reduction in air pollution we calculated for the periods when the mobility restrictions were in full force. This phenomenon is also observed in studies conducted by Rossi et al. (2020) [31], Baldasano (2020) [10], and Pérez-Martínez et al. (2022) [54] in other European cities.
Similar results were found in the analysis of urban versus metropolitan areas. However, improvements in daily average pollutant concentrations are highly dependent on the activities in these areas. For example, it was shown that the reductions in daily average nitrous oxide concentrations were lower in metropolitan than in urban areas since mobility restrictions during COVID-19 waves differed depending on the area (see Table 5). This difference observed can be explained by a variety of factors, such as the presence of buildings in the city, which makes it more difficult for the air pollutant to dissipate [40]. In the Madrid region and Madrid city, this is also observed for both UT and SUT stations, with the notable exception of the first pandemic period, when mobility was completely restricted due to the home lockdown imposed by the government, which led to a similar reduction in the air pollution in both environments. Figure 9 confirms the existence of this subtle difference, with less pronounced drops for lockdown and holiday periods for the Madrid region than Madrid city. This points to the conclusion that when implementing mobility strategies to improve air quality, it is important to consider the differences between urban and metropolitan areas [90].
In conclusion, this study shows, with empirical data, that it is imperative to reduce traffic, especially polluting vehicles, in order to lower the concentrations of airborne pollutants in both urban and metropolitan areas and ensure the good health of the population. The return to normal activity means that, if no action is taken, we risk worsening air quality and increasing pollutant concentrations from pre-pandemic levels in 2019. It therefore makes sense to encourage and implement strategies to improve air quality from different perspectives, including reduction in polluting vehicles traffic: (i) strategies focused on urban areas, such as the implementation of LEZ, coupled with measures to encourage the renewal of high-emission fleets and promote public transport and shared mobility [88,91]; (ii) demand management strategies targeting metropolitan areas (i.e., Romero et al., 2019 [92]); and (iii) strategies to encourage working from home a few days a week as a security practice both to address the crisis resulting from COVID-19 and improve air quality in cities (i.e., Belzunegui-Eraso and Erro-Garcés, 2020 [93]; Tenailleau et al., 2021 [94]).

5. Conclusions and Future Works

Continued exposure to poor air quality can damage human health and the ecosystem beyond expectations. Air pollution became a serious global problem from both the environmental and health perspective. The COVID-19 pandemic provided empirical data that affords an opportunity to study ways to reduce air pollutant concentrations.
This paper initially consists of a detailed analysis of the effects of COVID-19-induced mobility restrictions on air quality in the Madrid region, differentiating Madrid city from its metropolitan area. Using data from the Madrid region’s air quality measurement network, the daily average concentration of air pollutants was compared by direct percentages in six COVID-19 wave periods in three scenarios before, during and after the COVID-19 pandemic and its corresponding reference period 2019, together with a statistical test to highlight any significant changes.
Throughout this study we demonstrate, with empirical data, that the greater the mobility restrictions (either due to the pandemic itself or to other causes), and, consequently, traffic reductions, the lower the air pollutant concentrations of nitrous oxides and particulate matter. It was also found that with the return to normal activity in the last period, pollutant concentrations began to exceed pre-pandemic levels in some of the stations studied. If we want to reduce airborne pollutant concentrations in urban and metropolitan areas, it is therefore vital to encourage emission-free trips through modal change to reduce traffic flows, or by achieving an emissions-free vehicle fleet.
Additionally, the age of the vehicle fleet is an important factor that contributes to air pollution. An older fleet causes more air pollutant emissions than a newer fleet, and the fleet in Spain is more than 15 years old in a 47.7%. It is important to reduce the age of our vehicles and update the vehicles with new technologies so we can fight the air pollution problem and its impact on the environment.
As can be seen across Europe, an increasing trend of eliminating vehicle lanes to widen the sidewalks of the streets is also occurring in the Madrid urban area. This eliminates the space that the motor vehicles such as cars or motorcycles use to travel around the city, which causes a reduction in the vehicles that travel through that zone and a reduction in the air pollution that is emitted to the city with the benefits it brings for the health of the population. The treatment of low emission zones, supposedly indisputable and fostered by the European Commission, was, however, much discussed in Madrid in recent years and was the subject of debate in the recent municipal elections; so all studies that provide data on the advantages of reducing private vehicle mobility in city centers are important to advance society’s awareness and support for the measures to be considered [95].
The results are particularly useful for designing future mobility strategies for improving air quality in urban and metropolitan areas. However, the present work has certain limitations and other aspects related to this research were found that are worth analyzing in the future. Firstly, this study identified certain air quality stations where changes in nitrogen oxides were significant during the COVID-19 period in the study (see Section 3.1) in which a special analysis of the effect of traffic and meteorology on changes in nitrogen oxides would merit a future contribution. Secondly, it might be interesting to study in detail the effect on air quality of remote working on different days of the week based on empirical data on traffic and air pollutant concentrations. Thirdly, it would be useful to conduct a more detailed analysis of the meteorological, traffic, and residential and industrial effects on the variations in the concentration levels of PMs, and further the understanding of the mixed O3 trend.

Supplementary Materials

The following supporting information can be downloaded at: https://www.mdpi.com/article/10.3390/su151712702/s1, Supplementary Tables S1–S6.

Author Contributions

J.B.-G.: conceptualization, methodology, formal analysis, investigation, data curation, writing—original draft and review and editing; N.S.: conceptualization, methodology, formal analysis, investigation, data curation, writing—original draft and review and editing, supervision; R.M.A.-R.: conceptualization, methodology, investigation, writing—original draft and review and editing, and supervision. All authors have read and agreed to the published version of the manuscript.

Funding

This research was financed through the agreement between Region of Madrid and Universidad Politécnica de Madrid for the direct granting to finance research activities on SARS-CoV-2 and COVID-19 disease, financed with REACT-UE resources from the European Regional Development Fund.

Data Availability Statement

The datasets generated during and analyzed during the current study are not publicly available due to internal work but are available from the corresponding author on reasonable request.

Acknowledgments

The authors would like to thank Yolanda Luna from the State Meteorological Agency (AEMET) and Borja López del Campo for providing some of the data and for all their help.

Conflicts of Interest

The authors declare no conflict of interest.

References

  1. UN. Health—United Nations Sustainable Development; UN: New York, NY, USA, 2022. [Google Scholar]
  2. Tsati, E.; Ruggeri, G.; Shairsingh, K.; Cervantes, K.; Mothe, J.; Gumy, S.; Health, W.; Malkawi, M.; Moh’d Safi, H.A.; Salter, J.; et al. WHO Ambient Air Quality Database: 2022 Status Report; WHO: Geneva, Switzerland, 2022. [Google Scholar]
  3. WHO. WHO Director-General’s Opening Remarks at the Media Briefing on COVID-19 on 11 March 2020. Available online: https://www.who.int/director-general/speeches/detail/who-director-general-s-opening-remarks-at-the-media-briefing-on-covid-19---11-march-2020 (accessed on 10 July 2023).
  4. BOCM. ORDER 338/2020, of 9 March, of the Regional Ministry of Health, Adopting Preventive Measures and Public Health Recommendations in the Community of Madrid as a Result of the Situation and Evolution of the Coronavirus (COVID-19). Off. Madrid Reg. Gazzette 2020, 59, 9–11. [Google Scholar]
  5. BOE Royal. Decree 463/2020, of 14 March, Declaring a State of Alarm for the Management of the Health Crisis Situation Caused by COVID-19. Off. State Gazzette 2020, 67, 25390–25400. [Google Scholar]
  6. BOE Royal. Decree 555/2020, of 5 June, Extending the State of Alarm Declared by Royal Decree 463/2020, of 14 March, Declaring the State of Alarm for the Management of the Health Crisis Situation Caused by COVID-19. Off. State Gazzette 2020, 159, 38027–38036. [Google Scholar]
  7. BOE Royal. Decree 926/2020, of 25 October, Declaring a State of Alarm to Contain the Spread of Infections Caused by SARS-CoV-2. Off. State Gazzette 2020, 282, 91912–91919. Available online: https://www.boe.es/buscar/doc.php?id=BOE-A-2020-12898 (accessed on 10 July 2023).
  8. BOE Royal. Decree 956/2020, of 3 November, Extending the State of Alarm Declared by Royal Decree 926/2020, of 25 October, Declaring a State of Alarm to Contain the Spread of Infections Caused by SARS-CoV-2. Off. State Gazzette 2020, 291, 95841–95845. [Google Scholar]
  9. Zambrano-Monserrate, M.A.; Ruano, M.A.; Sanchez-Alcalde, L. Indirect Effects of COVID-19 on the Environment. Sci. Total Environ. 2020, 728, 138813. [Google Scholar] [CrossRef]
  10. Baldasano, J.M. COVID-19 Lockdown Effects on Air Quality by NO2 in the Cities of Barcelona and Madrid (Spain). Sci. Total Environ. 2020, 741, 140353. [Google Scholar] [CrossRef] [PubMed]
  11. Briz-Redón, Á.; Belenguer-Sapiña, C.; Serrano-Aroca, Á. Changes in Air Pollution during COVID-19 Lockdown in Spain: A Multi-City Study. J. Environ. Sci. 2021, 101, 16–26. [Google Scholar] [CrossRef]
  12. Sicard, P.; De Marco, A.; Agathokleous, E.; Feng, Z.; Xu, X.; Paoletti, E.; Rodriguez, J.J.D.; Calatayud, V. Amplified Ozone Pollution in Cities during the COVID-19 Lockdown. Sci. Total Environ. 2020, 735, 139542. [Google Scholar] [CrossRef]
  13. Skirienė, A.F.; Stasiškienė, Ž. COVID-19 and Air Pollution: Measuring Pandemic Impact to Air Quality in Five European Countries. Atmosphere 2021, 12, 290. [Google Scholar] [CrossRef]
  14. von Schneidemesser, E.; Sibiya, B.; Caseiro, A.; Butler, T.; Lawrence, M.G.; Leitao, J.; Lupascu, A.; Salvador, P. Learning from the COVID-19 Lockdown in Berlin: Observations and Modelling to Support Understanding Policies to Reduce NO2. Atmos. Environ. X 2021, 12, 100122. [Google Scholar] [CrossRef] [PubMed]
  15. Sathiendrakumar, R. Greenhouse Emission Reduction and Sustainable Development. Int. J. Soc. Econ. 2003, 30, 1233–1248. [Google Scholar] [CrossRef]
  16. Linares, C.; Falcón, I.; Ortiz, C.; Díaz, J. An Approach Estimating the Short-Term Effect of NO2 on Daily Mortality in Spanish Cities. Environ. Int. 2018, 116, 18–28. [Google Scholar] [CrossRef] [PubMed]
  17. Kampa, M.; Castanas, E. Human Health Effects of Air Pollution. Environ. Pollut. 2008, 151, 362–367. [Google Scholar] [CrossRef] [PubMed]
  18. Ortega-García, J.A.; Martínez-Hernández, I.; Boldo, E.; Cárceles-Álvarez, A.; Solano-Navarro, C.; Ramis, R.; Aguilar-Ros, E.; Sánchez-Solis, M.; López-Hernández, F. Urban Air Pollution and Hospital Admissions for Asthma and Acute Respiratory Disease in Murcia City (Spain). An. Pediatría Engl. Ed. 2020, 93, 95–102. [Google Scholar] [CrossRef] [PubMed]
  19. Schwela, D. Air Pollution and Health in Urban Areas. Rev. Environ. Health 2000, 15, 13–42. [Google Scholar] [CrossRef]
  20. Bañuelos-Gimeno, J.; Blanco, A.; Díaz, J.; Linares, C.; López, J.A.; Navas, M.A.; Sánchez-Martínez, G.; Luna, Y.; Hervella, B.; Belda, F.; et al. Air Pollution and Meteorological Variables’ Effects on COVID-19 First and Second Waves in Spain. Int. J. Environ. Sci. Technol. 2023, 20, 2869–2882. [Google Scholar] [CrossRef]
  21. Bañuelos-Gimeno, J.; Blanco, A.; Díaz, J.; Linares, C.; López, J.A.; Navas, M.A.; Sánchez-Martínez, G.; Luna, Y.; Hervella, B.; Belda, F.; et al. Do Air Pollution and Meteorological Variables Have a Bearing on COVID-19 Mortality? Benchmarking of Time Series between the First and Second Waves in Nine Spanish Provinces. Rev. Sanid. Ambient. 2022, 22, 100–112. [Google Scholar]
  22. Linares, C.; Culqui, D.; Belda, F.; López-Bueno, J.A.; Luna, Y.; Sánchez-Martínez, G.; Hervella, B.; Díaz, J. Impact of Environmental Factors and Sahara Dust Intrusions on Incidence and Severity of COVID-19 Disease in Spain. Effect in the First and Second Pandemic Waves. Environ. Sci. Pollut. Res. 2021, 28, 51948–51960. [Google Scholar] [CrossRef]
  23. Ab Manan, N.; Aizuddin, A.N.; Hod, R. Effect of Air Pollution and Hospital Admission: A Systematic Review. Ann. Glob. Health 2018, 84, 670–678. [Google Scholar] [CrossRef]
  24. Chen, T.-M.; Kuschner, W.G.; Gokhale, J.; Shofer, S. Outdoor Air Pollution: Particulate Matter Health Effects. Am. J. Med. Sci. 2007, 333, 235–243. [Google Scholar] [CrossRef]
  25. Culqui, D.R.; Díaz, J.; Blanco, A.; Lopez, J.A.; Navas, M.A.; Sánchez-Martínez, G.; Luna, M.Y.; Hervella, B.; Belda, F.; Linares, C. Short-Term Influence of Environmental Factors and Social Variables COVID-19 Disease in Spain during First Wave (Feb–May 2020). Environ. Sci. Pollut. Res. 2022, 29, 50392–50406. [Google Scholar] [CrossRef]
  26. Díaz, J.; Linares, C.; Carmona, R.; Russo, A.; Ortiz, C.; Salvador, P.; Trigo, R.M. Saharan Dust Intrusions in Spain: Health Impacts and Associated Synoptic Conditions. Environ. Res. 2017, 156, 455–467. [Google Scholar] [CrossRef] [PubMed]
  27. Chen, T.-M.; Gokhale, J.; Shofer, S.; Kuschner, W.G. Outdoor Air Pollution: Ozone Health Effects. Am. J. Med. Sci. 2007, 333, 244–248. [Google Scholar] [CrossRef] [PubMed]
  28. WHO. Health Aspects of Air Pollution with Particulate Matter, Ozone and Nitrogen Dioxide; WHO Regional Office for Europe: Geneva, Switzerland, 2003; Available online: https://apps.who.int/iris/handle/10665/107478 (accessed on 10 July 2023).
  29. Grundström, M.; Hak, C.; Chen, D.; Hallquist, M.; Pleijel, H. Variation and Co-Variation of PM10, Particle Number Concentration, NOx and NO2 in the Urban Air—Relationships with Wind Speed, Vertical Temperature Gradient and Weather Type. Atmos. Environ. 2015, 120, 317–327. [Google Scholar] [CrossRef]
  30. Hak, C.; Larssen, S.; Randall, S.; Guerreiro, C.; Denby, B.; Horálek, J. Traffic and Air Quality—Contribution of Traffic to Urban Air Quality in European Cities; European Environment Agency: Copenhagen, Denmark, 2010; Available online: https://www.eionet.europa.eu/etcs/etc-atni/products/etc-atni-reports/etcacc_tp_2009_12_traffic_and_urban_air_quality (accessed on 10 July 2023).
  31. Rossi, R.; Ceccato, R.; Gastaldi, M. Effect of Road Traffic on Air Pollution. Experimental Evidence from COVID-19 Lockdown. Sustainability 2020, 12, 8984. [Google Scholar] [CrossRef]
  32. Schürmann, G.; Schäfer, K.; Jahn, C.; Hoffmann, H.; Bauerfeind, M.; Fleuti, E.; Rappenglück, B. The Impact of NOx, CO and VOC Emissions on the Air Quality of Zurich Airport. Atmos. Environ. 2007, 41, 103–118. [Google Scholar] [CrossRef]
  33. Querol, X.; Alastuey, A.; Viana, M.M.; Rodriguez, S.; Artiñano, B.; Salvador, P.; Garcia Do Santos, S.; Fernandez Patier, R.; Ruiz, C.R.; De La Rosa, J.; et al. Speciation and Origin of PM10 and PM2.5 in Spain. J. Aerosol. Sci. 2004, 35, 1151–1172. [Google Scholar] [CrossRef]
  34. EEA. Europe’s Air Quality Status 2023. Available online: https://www.eea.europa.eu//publications/europes-air-quality-status-2023 (accessed on 24 April 2023).
  35. EEA. Air Quality in Europe 2021. Available online: https://www.eea.europa.eu/publications/air-quality-in-europe-2021 (accessed on 11 January 2023).
  36. Sahanavin, N.; Prueksasit, T.; Tantrakarnapa, K. Relationship between PM10 and PM2.5 Levels in High-Traffic Area Determined Using Path Analysis and Linear Regression. J. Environ. Sci. 2018, 69, 105–114. [Google Scholar] [CrossRef]
  37. Scheel, H.E.; Areskoug, H.; Geiß, H.; Gomiscek, B.; Granby, K.; Haszpra, L.; Klasinc, L.; Kley, D.; Laurila, T.; Lindskog, A.; et al. On the Spatial Distribution and Seasonal Variation of Lower-Troposphere Ozone over Europe. J. Atmos. Chem. 1997, 28, 11–28. [Google Scholar] [CrossRef]
  38. Logan, J. Tropospheric Ozone: Seasonal Behavior, Trends, and Anthropogenic Influence. J. Geophys. Res. 1985, 90, 463–482. [Google Scholar] [CrossRef]
  39. Jacob, D.J.; Heikes, B.G.; Fan, S.M.; Logan, J.A.; Mauzerall, D.L.; Bradshaw, J.D.; Singh, H.B.; Gregory, G.L.; Talbot, R.W.; Blake, D.R.; et al. Origin of Ozone and NOx in the Tropical Troposphere: A Photochemical Analysis of Aircraft Observations over the South Atlantic Basin. J. Geophys. Res. Atmos. 1996, 101, 24235–24250. [Google Scholar] [CrossRef]
  40. Yang, J.; Shi, B.; Shi, Y.; Marvin, S.; Zheng, Y.; Xia, G. Air Pollution Dispersal in High Density Urban Areas: Research on the Triadic Relation of Wind, Air Pollution, and Urban Form. Sustain. Cities Soc. 2020, 54, 101941. [Google Scholar] [CrossRef]
  41. Zhang, H.; Wang, Y.; Hu, J.; Ying, Q.; Hu, X.M. Relationships between Meteorological Parameters and Criteria Air Pollutants in Three Megacities in China. Environ. Res. 2015, 140, 242–254. [Google Scholar] [CrossRef] [PubMed]
  42. Dergunov, A.; Yakubailic, O. Influence of Temperature Inversions on Air Pollution in Krasnoyarsk. E3S Web Conf. 2021, 333, 02002. [Google Scholar] [CrossRef]
  43. Grange, S.K.; Farren, N.J.; Vaughan, A.R.; Rose, R.A.; Carslaw, D.C. Strong Temperature Dependence for Light-Duty Diesel Vehicle NOx Emissions. Environ. Sci. Technol. 2019, 53, 6587–6596. [Google Scholar] [CrossRef] [PubMed]
  44. Halfon, N.; Levin, Z.; Alpert, P. Temporal Rainfall Fluctuations in Israel and Their Possible Link to Urban and Air Pollution Effects. Environ. Res. Lett. 2009, 4, 025001. [Google Scholar] [CrossRef]
  45. Bañuelos-Gimeno, J.; Sobrino, N.; Arce, R. Efectos Del Tráfico En La Contaminación Atmosférica. Evidencia Empírica En Las Olas de COVID-19 En La Ciudad de Madrid. In Proceedings of the XV Congreso de Ingeniería del Transporte, San Cristóbal de La Laguna, Spain, 14–16 June 2023; pp. 1–10. [Google Scholar]
  46. Delgado-Iniesta, M.J.; Marín-Sanleandro, P.; Díaz-Pereira, E.; Bautista, F.; Romero-Muñoz, M.; Sánchez-Navarro, A. Estimation of Ecological and Human Health Risks Posed by Heavy Metals in Street Dust of Madrid City (Spain). Int. J. Environ. Res. Public Health 2022, 19, 5263. [Google Scholar] [CrossRef]
  47. Madrid City Council. Madrid City Council Emissions Inventory. Available online: https://airedemadrid.madrid.es/portales/calidadaire/es/Contaminacion-atmosferica/Concepto/?vgnextfmt=default&vgnextchannel=4b3e471c5c503710VgnVCM1000008a4a900aRCRD (accessed on 27 June 2023).
  48. OMM. Report of the Metropolitan Mobility Observatory for 2020 and Progress 2021; OMM: Madrid, Spain, 2022; Available online: https://observatoriomovilidad.es/informes/ (accessed on 27 June 2023).
  49. Gkatzelis, G.I.; Gilman, J.B.; Brown, S.S.; Eskes, H.; Gomes, A.R.; Lange, A.C.; McDonald, B.C.; Peischl, J.; Petzold, A.; Thompson, C.R.; et al. The Global Impacts of COVID-19 Lockdowns on Urban Air Pollution: A Critical Review and Recommendations. Elementa 2021, 9, 00176. [Google Scholar] [CrossRef]
  50. Silva, A.C.T.; Branco, P.T.B.S.; Sousa, S.I.V. Impact of COVID-19 Pandemic on Air Quality: A Systematic Review. Int. J. Environ. Res. Public Health 2022, 19, 1950. [Google Scholar] [CrossRef]
  51. Betancourt-Odio, M.A.; Martínez-De-Ibarreta, C.; Budría-Rodríguez, S.; Wirth, E. Local Analysis of Air Quality Changes in the Community of Madrid before and during the COVID-19 Induced Lockdown. Atmosphere 2021, 12, 659. [Google Scholar] [CrossRef]
  52. Cárcel-Carrasco, J.; Pascual-Guillamón, M.; Langa-Sanchís, J. Analysis of the Effect of COVID-19 on Air Pollution: Perspective of the Spanish Case. Environ. Sci. Pollut. Res. 2021, 2, 36880–36893. [Google Scholar] [CrossRef]
  53. Gorrochategui, E.; Hernandez, I.; Pérez-Gabucio, E.; Lacorte, S.; Tauler, R. Temporal Air Quality (NO2, O3, and PM10) Changes in Urban and Rural Stations in Catalonia during COVID-19 Lockdown: An Association with Human Mobility and Satellite Data. Environ. Sci. Pollut. Res. 2022, 29, 18905–18922. [Google Scholar] [CrossRef] [PubMed]
  54. Pérez-Martínez, P.J.; Magalhães, T.; Maciel, I.; de Miranda, R.M.; Kumar, P. Effects of the COVID-19 Pandemic on the Air Quality of the Metropolitan Region of São Paulo: Analysis Based on Satellite Data, Monitoring Stations and Records of Annual Average Daily Traffic Volumes on the Main Access Roads to the City. Atmosphere 2022, 13, 52. [Google Scholar] [CrossRef]
  55. Gualtieri, G.; Brilli, L.; Carotenuto, F.; Vagnoli, C.; Zaldei, A.; Gioli, B. Quantifying Road Traffic Impact on Air Quality in Urban Areas: A Covid19-Induced Lockdown Analysis in Italy. Environ. Pollut. 2020, 267, 115682. [Google Scholar] [CrossRef] [PubMed]
  56. Jephcote, C.; Hansell, A.L.; Adams, K.; Gulliver, J. Changes in Air Quality during COVID-19 ‘Lockdown’ in the United Kingdom. Environ. Pollut. 2021, 272, 116011. [Google Scholar] [CrossRef]
  57. Jia, C.; Li, W.; Wu, T.; He, M. Road Traffic and Air Pollution: Evidence from a Nationwide Traffic Control during Coronavirus Disease 2019 Outbreak. Sci. Total Environ. 2021, 781, 146618. [Google Scholar] [CrossRef]
  58. Volke, M.I.; Abarca-del-Rio, R.; Ulloa-Tesser, C. Impact of Mobility Restrictions on NO2 Concentrations in Key Latin America Cities during the First Wave of Teh COVID-19 Pandemic. Urban Clim. 2023, 48, 109181. [Google Scholar] [CrossRef]
  59. Alemdar, K.D.; Kaya, Ö.; Canale, A.; Çodur, M.Y.; Campisi, T. Evaluation of Air Quality Index by Spatial Analysis Depending on Vehicle Traffic during the COVID-19 Outbreak in Turkey. Energies 2021, 14, 5729. [Google Scholar] [CrossRef]
  60. Donzelli, G.; Cioni, L.; Cancellieri, M.; Llopis-morales, A.; Morales-suárez-varela, M. Relations between Air Quality and COVID-19 Lockdown Measures in Valencia, Spain. Int. J. Environ. Res. Public Health 2021, 18, 2296. [Google Scholar] [CrossRef]
  61. Shanableh, A.; Al-ruzouq, R.; Khalil, M.A.; Gibril, M.B.A.; Hamad, K.; Alhosani, M.; Stietiya, M.H.; Al Bardan, M.; Almasoori, S.; Hammouri, N.A. COVID-19 Lockdown and the Impact on Mobility, Air Quality, and Utility Consumption: A Case Study from Sharjah, United Arab Emirates. Sustainability 2022, 14, 1767. [Google Scholar] [CrossRef]
  62. Wang, Q.; Yang, X. How Do Pollutants Change Post-Pandemic? Evidence from Changes in Five Key Pollutants in Nine Chinese Cities Most Affected by the COVID-19. Environ. Res. 2021, 197, 111108. [Google Scholar] [CrossRef]
  63. Connerton, P.; de Assunção, J.V.; de Miranda, R.M.; Slovic, A.D.; Pérez-Martínez, P.J.; Ribeiro, H. Air Quality during COVID-19 in Four Megacities: Lessons and Challenges for Public Health. Int. J. Environ. Res. Public Health 2020, 17, 5067. [Google Scholar] [CrossRef] [PubMed]
  64. Munir, S.; Coskuner, G.; Jassim, M.S.; Aina, Y.A.; Ali, A.; Mayfield, M. Changes in Air Quality Associated with Mobility Trends and Meteorological Conditions during COVID-19 Lockdown in Northern England, UK. Atmosphere 2021, 12, 504. [Google Scholar] [CrossRef]
  65. Reuters Spain. Allowed NO2 Levels to Exceed Limits in Madrid and Barcelona, EU Court Rules. The Guardian, 22 December 2022. Available online: https://www.theguardian.com/world/2022/dec/22/spain-allowed-no2-levels-to-exceed-limits-in-madrid-and-barcelona-eu-court-rules(accessed on 27 June 2023).
  66. INE. Surface Area of the Autonomous Communities and Provinces, by Altimetric Areas; National Statistics Institute INE: Madrid, Spain, 1994; pp. 1–2. Available online: https://www.ine.es/inebaseweb/pdfDispacher.do?td=154090&L=0 (accessed on 27 June 2023).
  67. INE. Official Population Figures Resulting from the Revision of the Municipal Register of Madrid as of 1 January; National Statistics Institute INE: Madrid, Spain, 2021. Available online: https://www.ine.es/dynt3/inebase/index.htm?padre=517&capsel=517 (accessed on 27 June 2023).
  68. Al Akioui Sanz, A.; De Caceres, A.M.; Del Valle, L.A. Evolution of Mobility during the COVID-19 Crisis in the Region of Madrid. Transp. Res. Procedia 2021, 58, 416–422. [Google Scholar] [CrossRef]
  69. Madrid City Council. Air Quality Annual Report 2019; Madrid City Council: Madrid, Spain, 2019. Available online: https://airedemadrid.madrid.es/UnidadesDescentralizadas/Sostenibilidad/CalidadAire/Publicaciones/Memorias_anuales/Ficheros/Memoria_2019.pdf (accessed on 27 June 2023).
  70. BOCM. Action Protocol for Episodes of Nitrogen Dioxide Pollution in the City of Madrid. Madrid’s Official Regional Gazette, 25 June 2018; p. 825. [Google Scholar]
  71. BOAM. Ordinance 10/2021 of 13 September Amending the Sustainable Mobility Ordinance of 5 October 2018. Madrid’s Official Regional Gazette, 21 September 2021; pp. 107–225. [Google Scholar]
  72. Faiz, A.; Gautam, S.; Burki, E. Air Pollution from Motor Vehicles: Issues and Options for Latin American Countries. Sci. Total Environ. 1995, 169, 303–310. [Google Scholar] [CrossRef]
  73. DGT. Statistics Portal; Directorate-General for Traffic: Madrid, Spain, 2023. Available online: https://www.dgt.es/menusecundario/dgt-en-cifras/ (accessed on 27 June 2023).
  74. ISCIII. Situation and Evolution of the COVID-19 Pandemic in Spain; ISCIII: Madrid, Spain, 2022; Available online: https://www.isciii.es/QueHacemos/Servicios/VigilanciaSaludPublicaRENAVE/EnfermedadesTransmisibles/Paginas/InformesCOVID-19.aspx (accessed on 27 June 2023).
  75. Madrid City Council. Air Quality. Daily Data since 2001. Madrid City Council Open Data Portal; Madrid City Council: Madrid, Spain, 2022. Available online: https://data.europa.eu/data/datasets/https-datos-madrid-es-egob-catalogo-201410-0-calidad-aire-diario?locale=es (accessed on 27 June 2023).
  76. Community of Madrid. Air Quality Network of the Region of Madrid; Community of Madrid: Madrid, Spain, 2021. Available online: https://www.comunidad.madrid/en/servicios/urbanismo-medio-ambiente/calidad-aire (accessed on 27 June 2023).
  77. StataCorp. New in Stata 15|Stata 2017; StataCorp: College Station, TX, USA, 2017; Available online: https://www.stata.com/support/faqs/resources/citing-software-documentation-faqs/ (accessed on 27 June 2023).
  78. Microsoft Corporation. Microsoft Software de Hojas de Cálculo Microsoft Excel|Microsoft 365 2022, Versión 2307 Compilación 16.0.16626.20170; Microsoft Corporation: Redmond, WA, USA, 2022. [Google Scholar]
  79. Qgis Welcome to Qgis Project! 2022. Available online: https://qgis.org/es/site/ (accessed on 27 June 2023).
  80. Castells-Quintana, D.; Dienesch, E.; Krause, M. Air Pollution in an Urban World: A Global View on Density, Cities and Emissions. Ecol. Econ. 2021, 189, 107153. [Google Scholar] [CrossRef]
  81. Kumari, P.; Toshniwal, D. Impact of Lockdown on Air Quality over Major Cities across the Globe during COVID-19 Pandemic. Urban Clim. 2020, 34, 100719. [Google Scholar] [CrossRef] [PubMed]
  82. Madrid City Council. State of Mobility in the City of Madrid; Madrid City Council: Madrid, Spain, 2020. Available online: https://transparencia.madrid.es/FWProjects/transparencia/Movilidad/Trafico/InformesMovilidad/Ficheros/InformeMovilidad2020.pdf (accessed on 27 June 2023).
  83. DatosMacro. Madrid COVID-19—Vaccines Administered 2023; DatosMacro: Madrid, Spain, 2022; Available online: https://datosmacro.expansion.com/otros/coronavirus-vacuna/espana-comunidades-autonomas (accessed on 27 June 2023).
  84. Hostettler Macias, L.; Ravalet, E.; Rérat, P. Potential Rebound Effects of Teleworking on Residential and Daily Mobility. Geogr. Compass 2022, 16, e12657. [Google Scholar] [CrossRef]
  85. Park, J.; Kim, G. Risk of COVID-19 Infection in Public Transportation: The Development of a Model. Int. J. Environ. Res. Public Health 2021, 18, 12790. [Google Scholar] [CrossRef] [PubMed]
  86. Jiménez, E.; Linares, C.; Martínez, D.; Díaz, J. Role of Saharan Dust in the Relationship between Particulate Matter and Short-Term Daily Mortality among the Elderly in Madrid (Spain). Sci. Total Environ. 2010, 408, 5729–5736. [Google Scholar] [CrossRef] [PubMed]
  87. EUMESAT. Widespread Dust Intrusion across Europe. Available online: https://www.eumetsat.int/widespread-dust-intrusion-across-europe (accessed on 31 May 2023).
  88. Tarriño-Ortiz, J.; Gómez, J.; Soria-Lara, J.A.; Vassallo, J.M. Analyzing the Impact of Low Emission Zones on Modal Shift. Sustain. Cities Soc. 2022, 77, 103562. [Google Scholar] [CrossRef]
  89. Giovanis, E. The Relationship between Teleworking, Traffic and Air Pollution. Atmos. Pollut. Res. 2018, 9, 1–14. [Google Scholar] [CrossRef]
  90. Chen, Y.; Gu, P.; Schulte, N.; Zhou, X.; Mara, S.; Croes, B.E.; Herner, J.D.; Vijayan, A. A New Mobile Monitoring Approach to Characterize Community-Scale Air Pollution Patterns and Identify Local High Pollution Zones. Atmos. Environ. 2022, 272, 118936. [Google Scholar] [CrossRef]
  91. Cárdenas-Montes, M. Evaluation of the Impact of Low-Emission Zone: Madrid Central as a Case Study. arXiv 2021, arXiv:2012.13782. [Google Scholar]
  92. Romero, F.; Gomez, J.; Rangel, T.; Vassallo, J.M. Impact of Restrictions to Tackle High Pollution Episodes in Madrid: Modal Share Change in Commuting Corridors. Transp. Res. Part D Transp. Environ. 2019, 77, 77–91. [Google Scholar] [CrossRef]
  93. Belzunegui-Eraso, A.; Erro-Garcés, A. Teleworking in the Context of the COVID-19 Crisis. Sustainability 2020, 12, 3662. [Google Scholar] [CrossRef]
  94. Tenailleau, Q.M.; Tannier, C.; Vuidel, G.; Tissandier, P.; Bernard, N. Assessing the Impact of Telework Enhancing Policies for Reducing Car Emissions: Exploring Calculation Methods for Data-Missing Urban Areas—Example of a Medium-Sized European City (Besançon, France). Urban Clim. 2021, 38, 100876. [Google Scholar] [CrossRef]
  95. Mingo, I. El Partido Que Promete Reducir Las Zonas de Bajas Emisiones y Los Que Las Ampliarían. Available online: https://www.eldebate.com/motor/20230526/partido-reduciria-zonas-bajas-emisiones-madrid-harian-mas-grandes_117255.html (accessed on 10 July 2023).
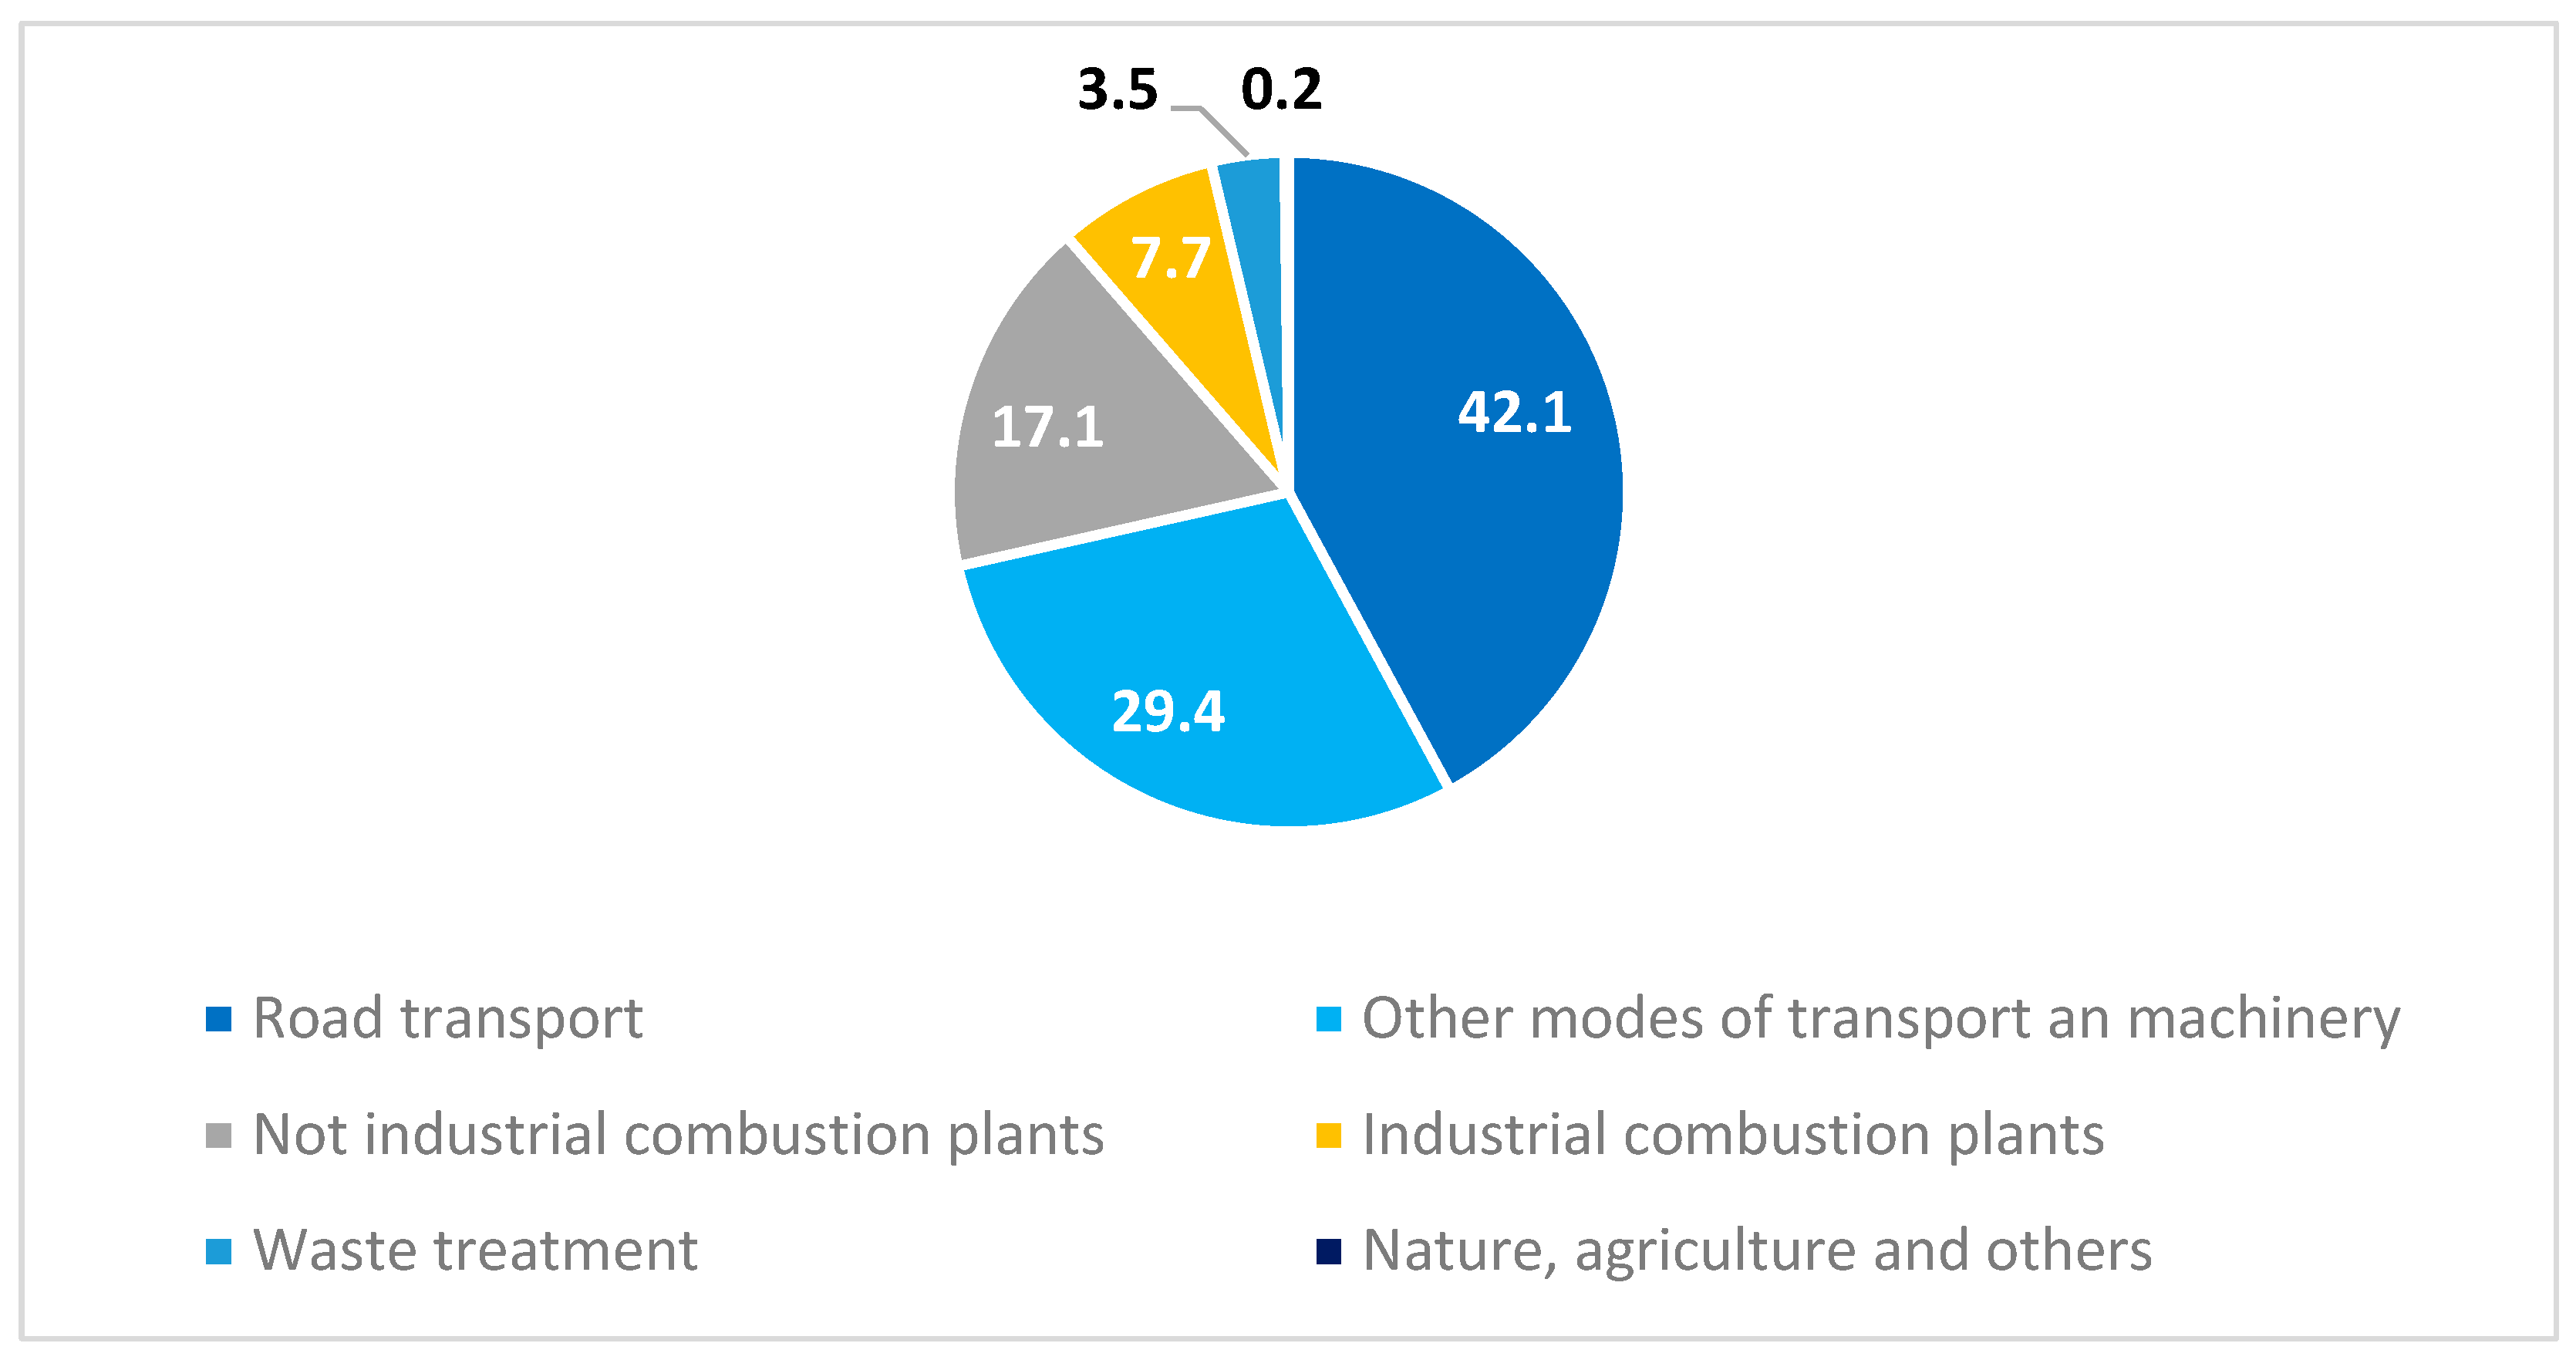
Figure 1. Nitrogen oxides emissions sources (%) in Madrid city, source: [47].
Sustainability 15 12702 g001
Figure 2. Modal distribution by all reasons for travel in the metropolitan areas of Madrid and Barcelona. Source: Metropolitan Mobility Observatory, 2020 Report [48].
Sustainability 15 12702 g002
Figure 3. Modal split by all trip types in the urban areas of Madrid and Barcelona. Source: Metropolitan Mobility Observatory, 2020 Report [48].
Sustainability 15 12702 g003
Figure 4. Age of the fleet of vehicles in the Madrid region. Source: [73].
Sustainability 15 12702 g004
Figure 5. Location of the UT (left) and SUT (right) stations in the Madrid city and Madrid region. Source: prepared by the authors with municipality and regional administrations data [75,76].
Sustainability 15 12702 g005
Figure 6. Changes (%) in daily average air pollutant concentrations in the COVID-19 waves/periods compared to the baseline pre-pandemic scenario (2019) for all traffic air quality stations in the years 2020 and 2021. Source: prepared by the authors.
Sustainability 15 12702 g006
Figure 7. Post-pandemic scenario: Changes (%) in daily average air pollutant concentrations in the selected post-pandemic (2022) periods compared to the baseline pre-pandemic scenario (2019) for all traffic air quality stations. Source: prepared by the authors.
Sustainability 15 12702 g007
Figure 8. Frequency of teleworking in the Madrid region before the COVID-19 pandemic, during, and after. Source: E.MORES-CM project survey (The E.MORES-CM project survey consisted of a series of telephonic interviews conducted between October and December 2022. The final sample consisted of 15,666 valid answers in the region of Madrid, with 16 territorial divisions crafted by the Transportation Research Centre of Universidad Politécnica de Madrid. More information is available from the authors on a reasonable request).
Sustainability 15 12702 g008
Figure 9. Monthly variation in traffic for both Madrid city and the Madrid region in the prepandemic, pandemic, and post-pandemic scenarios. Source: Madrid City Council and Google Community Mobility Report during the COVID-19 pandemic.
Sustainability 15 12702 g009
Table 1. Pandemic scenario: description of COVID-19 waves/periods and mobility restrictions in the Madrid region. Source: own elaboration based on data from the RENAVE COVID project by the Carlos III Health Institute (ISCIII) [74].
Periods/COVID WavesScenarios Period (Start–End Date)Baseline Scenario Periods (2019)No. of DaysMobility Measures
Pandemic Scenario (2020 and 2021 years)First
Period
11/March/2020
21/June/2020
11/March/2019
21/June/2019
103Strict lockdown. As of May, the population was authorized to leave their homes for non-essential reasons, so mobility began a slow recovery.
Second
Period
22/June/2020
30/November/2020
22/June/2019
30/November/2019
162Mobility restrictions were practically lifted nationwide in summer, although in autumn, measures were enforced including a perimeter lockdown and a night curfew.
Third
Period
01/December/2020
01/March/2021
01/December/2019
01/March/2019
91Measures were the same as in the second wave. Perimeter lockdowns by basic health zone (BHZ) were implemented.
Fourth
Period
02/March/2021
22/June/2021
02/March/2019
22/June/2019
113As of April 2021, all mobility restrictions were lifted in the Madrid region, although the perimeter lockdown remained in place.
Fifth
Period
23/June/2021
31/October/2021
23/June/2019
30/October/2019
131No mobility restrictions.
Sixth
Period
01/November/2021
31/December/2021
01/November/2019
31/December/2019
61No mobility restrictions.
Table 2. Post-pandemic scenario: description of periods analyzed in the Madrid region. No mobility restrictions. Source: own elaboration.
PeriodsPeriod (Start–End Date)Baseline Pre-Pandemic Scenario Period (2019)No. of days
Post-Pandemic Scenario (2022)Seventh Period11/March/202211/March/2019103
21/June/202221/June/2019
Eighth
Period
22/June/202222/June/2019162
30/November/202230/November/2019
Table 3. Madrid region UT stations and distances to Puerta del Sol.
No. UT StationDistance (km)
1Plaza de España1.08
2Escuelas Aguirre1.90
3Castellana2.82
4Cuatro Caminos3.22
5Plaza Elíptica3.74
6Ramón y Cajal4.47
7Moratalaz5.06
8Plaza Castilla5.58
9Barrio del Pilar6.87
Table 4. Madrid city SUT stations and distances to Puerta del Sol.
No. SUT StationDistance (km)
10Leganés9.56
11Getafe11.39
12Coslada13.79
13Alcobendas14.62
14Colmenar Viejo28.17
15Alcalá de Henares28.51
16Collado Villalba35.63
17Villarejo de Salvanés45.68
Table 5. Pandemic scenario: Changes (%) in the daily average air pollutant concentrations of NO2 and NOx in the selected periods compared to the baseline scenario (pre-pandemic 2019) for all air quality stations; comparison between UT and SUT. Stations with the maximum and minimum reductions are identified in the pandemic period.
Period 1
(11/Mar./2020–21/Jun./2020)
Period 2
(22/Jun./2020–30/Nov./2020)
Period 3
(01/Dec-/2020–01/Mar./2021)
Period 4
(02/Mar./2021–22/Jun./2021)
Period 5
(23/Jun./2021–31/Oct./2021)
Period 6
(01/Nov./2021–31/Dec./2021)
NOxNO2NOxNO2NOxNO2NOxNO2NOxNO2NOxNO2
Average changes (%) in all stations−47.8%−47%−0.8%−6.4%−41.1%−32.7%−23.1%−20.3%−18.7%−14%+7.4%+8.4%
Average
changes (%) UT stations
−52.6%−51%−6.7%−9.2%−37.1%−31.3%−26%−19.7%−22.8%−15.7%−3.3%+4.5%
Average changes (%) SUT stations−42.3%−42.7%+5.8%−3.3%−45.7%−34.3%−19.9%−20.9%−14.1%−12%+18.2%+12.4%
Station with max reduction/changes (%)UT 2
−61.3%
UT 1
−75.5%
UT 8
−18.1%
UT 12
−19.3%
UT 5
−54.1%
SUT 15
−54.2%
UT 2
−40.9%
SUT 14
−40.8%
UT 2
−38.7%
UT 2 SUT 12
−36.5%
UT 1
−31.7%
UT 1
−33%
UT 2
−20.4%
UT 2
−12%
Station with min reduction/changes (%)SUT 13
−39.8%
SUT 17
−30.6%
SUT 10
+13.8%
SUT 10 and 15
+1.7%
UT 8
−27.9%
UT 8
−22.2%
SUT 10
−12.1%
UT 4
−7.7%
SUTs 10 and 15
−8%
SUT 10
−2.4%
SUT 12
+39%
SUT11
+26.9%
Note: In the table, red font is used to highlight the increases versus the decreases.
Table 6. Post-pandemic scenario: Changes (%) in the daily average air pollutant concentrations of NO2 and NOx in the post-pandemic selected periods compared to the baseline scenario for all air quality stations; comparison between UT and SUT. Stations with the maximum and minimum reductions are identified in the post-pandemic period.
Period 7
(11/Mar./2022–21/Jun./2022)
Period 8
(22/Jun./2022–30/Nov./2022)
NOxNO2NOxNO2
Average changes (%) in all stations−32.1%−24.7%−19.8%−14.2%
Average changes (%) in UT stations−35.3%−22.4%−28.7%−15.9%
Average changes (%) in SUT stations−28.8%−27.0%−10.9%−12.4%
Station with max reduction/changes (%)UT 1
−68%
SUT 14
−47%
UT 1
−55%
UT 7
−26%
Station with min reduction/changes (%)UT 8
−19%
UT 8
−2%
SUT 16
−1%
UT 1
+18%
Table 7. Pandemic scenario: Changes (%) in the daily average air pollutant concentrations of PM2.5 and PM10 in the pandemic scenario with respect to the baseline scenario for all air quality stations; comparison between UT and SUT stations. Stations with the maximum and minimum reductions are identified in the pandemic period.
Period 1
(11/Mar./2020–21/Jun./2020)
Period 2
(22/Jun./2020–30/Nov./2020)
Period 3
(01/Dec./2020–01/Mar./2021)
Period 4
(02/Mar./2021–22/Jun./2021)
Period 5
(23/Jun./2021–31/Oct./2021)
Period 6
(01/Nov./2021–31/Dec./2021)
PM2.5PM10PM2.5PM10PM2.5PM10PM2.5PM10PM2.5PM10PM2.5PM10
−2%−16.1%+7.6%−0.4%−19.1%−14.6%+21.5%+18%−1.9%−6.3%−5.6%−1.8%
Average
changes (%) UT stations
−5.8%−19%+3.5%−2.5%−24.8%−15.7%+11.8%+15%+3.7%−5.6%−15.9%−7.8%
Average changes (%) SUT stations+2.6%−14.8%+12.5%+3.7%−12.2%−12.4%+33.1%+23.9%−8.5%−7.6%+6.6%+10%
Station with max reduction/changes (%)UT 5
(−15.2%)
UT 5
(−37.6%)
UT 5
(−10.2%)
UT 5
(−22.9%)
UT 2
(−41.5%)
UT 2 and 5
(−38%)
UT 2
(−10.6%)
UT 5
(−6%)
SUT 14
(−28.4%)
SUT 11
(−22.1%)
UT 3
(−20.4%)
SUT 13
(−21.6%)
Station with min reduction/changes (%)SUT 16 (+28.4%)SUT 14 (+3.1%)UT 17 (+18.2%)UT 4 (+11.3%)UT 10
(−7.2%)
UT 7 (+1%)SUT 16 (+51.2%)SUT 14 (+45.8%)UT 8 (+38%)UT 8 (+8.8%)UT 11 (+19.6%)SUT 12 (+22.5%)
Note: In the table, red font is used to highlight the increases versus the decreases.
Table 8. Post-pandemic scenario: Changes (%) in the daily average air pollutant concentrations of PM2.5 and PM10 in the post-pandemic scenario with respect to the baseline scenario for all air quality stations; comparison between UT and SUT stations. Stations with the maximum and minimum reductions are identified in the post-pandemic period.
Period 7
(11/Mar./2022–21/Jun./2022)
Period 8
(22/Jun./2022–30/Nov./2022)
PM2.5PM10PM2.5PM10
Average changes (%) in all stations+19.1%+57.0%+14.1%+17.6%
Average changes (%) in UT stations+23.7%+45.3%+37.2%+34.7%
Average changes (%) in SUT stations+14.5%+68.7%−8.9%0.5%
Station with max reduction/changes (%)SUT 16
+47%
SUT 14
+127%
UT 2
+114%
UT 4
+94%
Station with min reduction/changes (%)SUT 15
−0.1%
UT 2
+17%
SUT 10
−31%
SUT 10
+1%
Note: In the table, red font is used to highlight the increases versus the decreases.
Table 9. Pandemic scenario: Changes (%) in the daily average air pollutant concentrations of O3 in the pandemic scenario with respect to the baseline scenario for all air quality stations; comparison between UT and SUT stations. Stations with the maximum and minimum reductions are identified in the pandemic period.
Period 1
(11/Mar./2020–21/Jun./2020)
Period 2
(22/Jun./2020–30/Nov./2020)
Period 3
(01/Dec./2020–01/Mar./2021)
Period 4
(02/Mar./2021–22/Jun./2021)
Period 5
(23/Jun./2021–31/Oct./2021)
Period 6
(01/Nov./2021–31/Dec./2021)
O3O3O3O3O3O3
Average changes (%) in all stations−10.3%−9.9%21.9%−10.6%−2%−0.2%
Average
changes (%) UT stations
−1.3%−5.9%24%−11.3%+11%−0.5%
Average changes (%) SUT stations−13.7%−11.4%21.1%−10.4%−5.3%−0.1%
Station with max reduction/changes (%)SUT 11
(−20%)
SUT 16 (−20.7%)-UT 9
(−18.9%)
SUT 16
(−15%)
SUT 15
(−16.1%)
Station with min reduction/changes (%)UT 2
(+4.5%)
UT 2
(+10.2%)
UT 5
(+36.8%)
UT 2
(−3.7%)
UT 2
(+19,7%)
SUT 17 (+23.2%)
Note: In the table, red font is used to highlight the increases versus the decreases.
Table 10. Post-pandemic scenario: Changes (%) in the daily average air pollutant concentrations of O3 in the post-pandemic scenario with respect to the baseline scenario for all air quality stations; comparison between UT and SUT stations. Stations with the maximum and minimum reductions are identified in the pandemic period.
Period 7
(11/Mar./2022
21/Jun./2022)
Period 8
(22/Jun./2022
30/Nov./2022)
O3O3
Average changes (%) in SUT stations−8.6%+3.6%
Station with max reduction/changes (%)SUT 14
+17%
UT 2
+24%
Note: In the table, red font is used to highlight the increases versus the decreases.
Disclaimer/Publisher’s Note: The statements, opinions and data contained in all publications are solely those of the individual author(s) and contributor(s) and not of MDPI and/or the editor(s). MDPI and/or the editor(s) disclaim responsibility for any injury to people or property resulting from any ideas, methods, instructions or products referred to in the content.