Article

Diurnal Temperature Range and Its Response to Heat Waves in 16 European Cities—Current and Future Trends

by
George Katavoutas
*,
Dimitra Founda
,
Konstantinos V. Varotsos
and
Christos Giannakopoulos
Institute for Environmental Research and Sustainable Development, National Observatory of Athens, GR-15236 Athens, Greece
*
Author to whom correspondence should be addressed.
Sustainability 2023, 15(17), 12715; https://doi.org/10.3390/su151712715
Submission received: 5 July 2023 / Revised: 12 August 2023 / Accepted: 21 August 2023 / Published: 22 August 2023
(This article belongs to the Special Issue Climate Change and Urban Thermal Effects)

Abstract

:
An important indicator of climate change is the diurnal temperature range (DTR), defined as the difference between the daily maximum and daily minimum air temperature. This study aims to investigate the DTR distribution in European cities of different background climates in relation to the season of the year, climate class and latitude, as well as its response to exceptionally hot weather. The analysis is based on long-term observational records (1961–2019) coupled with Regional Climate Model (RCM) data in order to detect any projected DTR trends by the end of the 21st century under intermediate and high emission greenhouse gases (GHGs) scenarios. The analysis reveals marked variations in the magnitude of DTR values between the cities, on the one hand, and distinct patterns of the DTR distribution according to the climate class of each city, on the other. The results also indicate strong seasonal variability in most of the cities, except for the Mediterranean coastal ones. DTR is found to increase during hot days and heat wave (HW) days compared to summer normal days. High latitude cities experience higher increases (3.7 °C to 5.7 °C for hot days, 3.1 °C to 5.7 °C for HW days) compared to low latitude cities (1.3 °C to 3.6 °C for hot days, 0.5 °C to 3.4 °C for HW days). The DTR is projected to significantly decrease in northernmost cities (Helsinki, Stockholm, Oslo), while it is expected to significantly increase in Madrid by the end of the 21st century under both the intermediate- and high-emission scenarios, due to the asymmetric temperature change. The asymmetrical response of global warming is more pronounced under the high-emission scenario where more cities at higher latitudes (Warsaw, Berlin, Rotterdam) are added to those with a statistically significant decrease in DTR, while others (Bucharest, Nicosia, Zurich) are added to those with an increase in DTR.

1. Introduction

Near-surface air temperature is a key element of weather variables, contributing to the characterization of past, present and future climate. In all of its forms (mean, maximum, minimum), it is an essential factor for studies related to climate change, mitigation and adaptation strategies, weather and climate extremes, and more [1]. When the focus is on changes in temperature extremes, an important indicator is the diurnal temperature range (DTR), defined as the difference between the daily maximum and daily minimum air temperature, thus reflecting the temperature variation within a day. The Expert Team on Climate Change Detection and Indices (ETCCDI) has included the DTR in the list of core indices [2]. Since the DTR captures the simultaneous changes in maximum and minimum air temperatures, it is considered to provide more information than the mean air temperature on its own [3].
Several studies have been conducted addressing the importance of DTR and its effect on various sectors like human health [4,5,6], agriculture [7,8], ecosystems [9] and energy consumption [10]. Research to date has also focused on investigating factors that influence DTR variability, either on a local scale or on a global scale. For instance, changes in urbanization levels [11,12], cloud cover [13,14], land use and land cover [15,16], soil moisture, and precipitation [14,17] seem to have an impact on DTR by affecting the near-surface air temperature. The recent study of Sun et al. [18] showed that the DTR is highly sensitive to urbanization, contributing about 43.6% to the trend of DTR over the 1951–2018 period in East Asia.
Many regions across the globe have been witnessing changes in both mean climate and climatic extremes during the last decades [1]. At the same time, asymmetrical changes in temperature extremes have resulted in DTR changes that are not uniform globally. Previous studies have reported a reduction in DTR since the early twentieth century on global level, with a positive DTR trend in the first half of the previous century and a significant reduction thereafter [19,20,21]. Studies focusing on regional or local scales, like in Europe [22,23], the United States [24,25], Japan and Malaysia [26], the Tibetan Plateau [27], and Canada [28], have also detected a decreasing trend of DTR. However, even these decreasing trends depend on the study period and time scale (annual/seasonal/monthly). The study of Makowski et al. [29] has revealed a reversal in the DTR trend from decreasing to increasing between the 1970s and the 1980s, depending on the region in Europe. Increasing trends in DTR have also been reported in several regions, like Bangladesh during the monsoon period [30], some regions in India [31,32], Spain [33] and the Baltic region depending on the season [23]. Employing simulated global data coupled with atmosphere–ocean general circulation models between 1900 and 2099, Zhou et al. [34] found a decrease in the global DTR as well as in the zonal DTR of lower latitudes and subpolar region by 0.3 °C, 0.16 °C and 0.61 °C in 2099, respectively. Simulating DTR-related processes is challenging for climate models and, thus, evaluations of their latest versions are in the spotlight of scientific research [35].
The changing climate state has led to more frequent and intense hot extremes and heat waves across most regions in recent decades which, in turn, contribute to thermal risk, especially in cities where the vulnerability of urban residents to heat waves is expected to increase [1,36,37,38,39,40]. Recently, Kueh et al. [41] investigated the DTR variations during heat waves in Taiwan and found that the minimum temperature is the primary controlling factor for the variation in DTR.
The present study aims to address any DTR differentiations among 16 European cities of different background climates based on past observations and future projections along with the response of DTR under exceptionally hot weather. The study uses daily observational temperature data from the European Climate Assessment Dataset covering a period of almost 60 years (1961–2019) and daily projected temperature data from the RCA4 RCM, driven by the MPI-ESM-LR global climate model under two emission scenarios, namely RCP4.5 and RCP8.5. In this work, the analysis is divided into three primary strands. The first examines the annual and seasonal distribution of DTR and the second examines the response of DTR under exceptionally hot weather in the selected cities based on observational data and compares the results across cities in terms of their climate type and latitude. The third strand analyzes the long-term trends in DTR (1971–2100), the seasonal variation of DTR between past (1971–2000) and future (2071–2100) climates as well as the response of DTR to exceptionally hot conditions in past and future climates, all based on the RCM data.

2. Materials and Methods

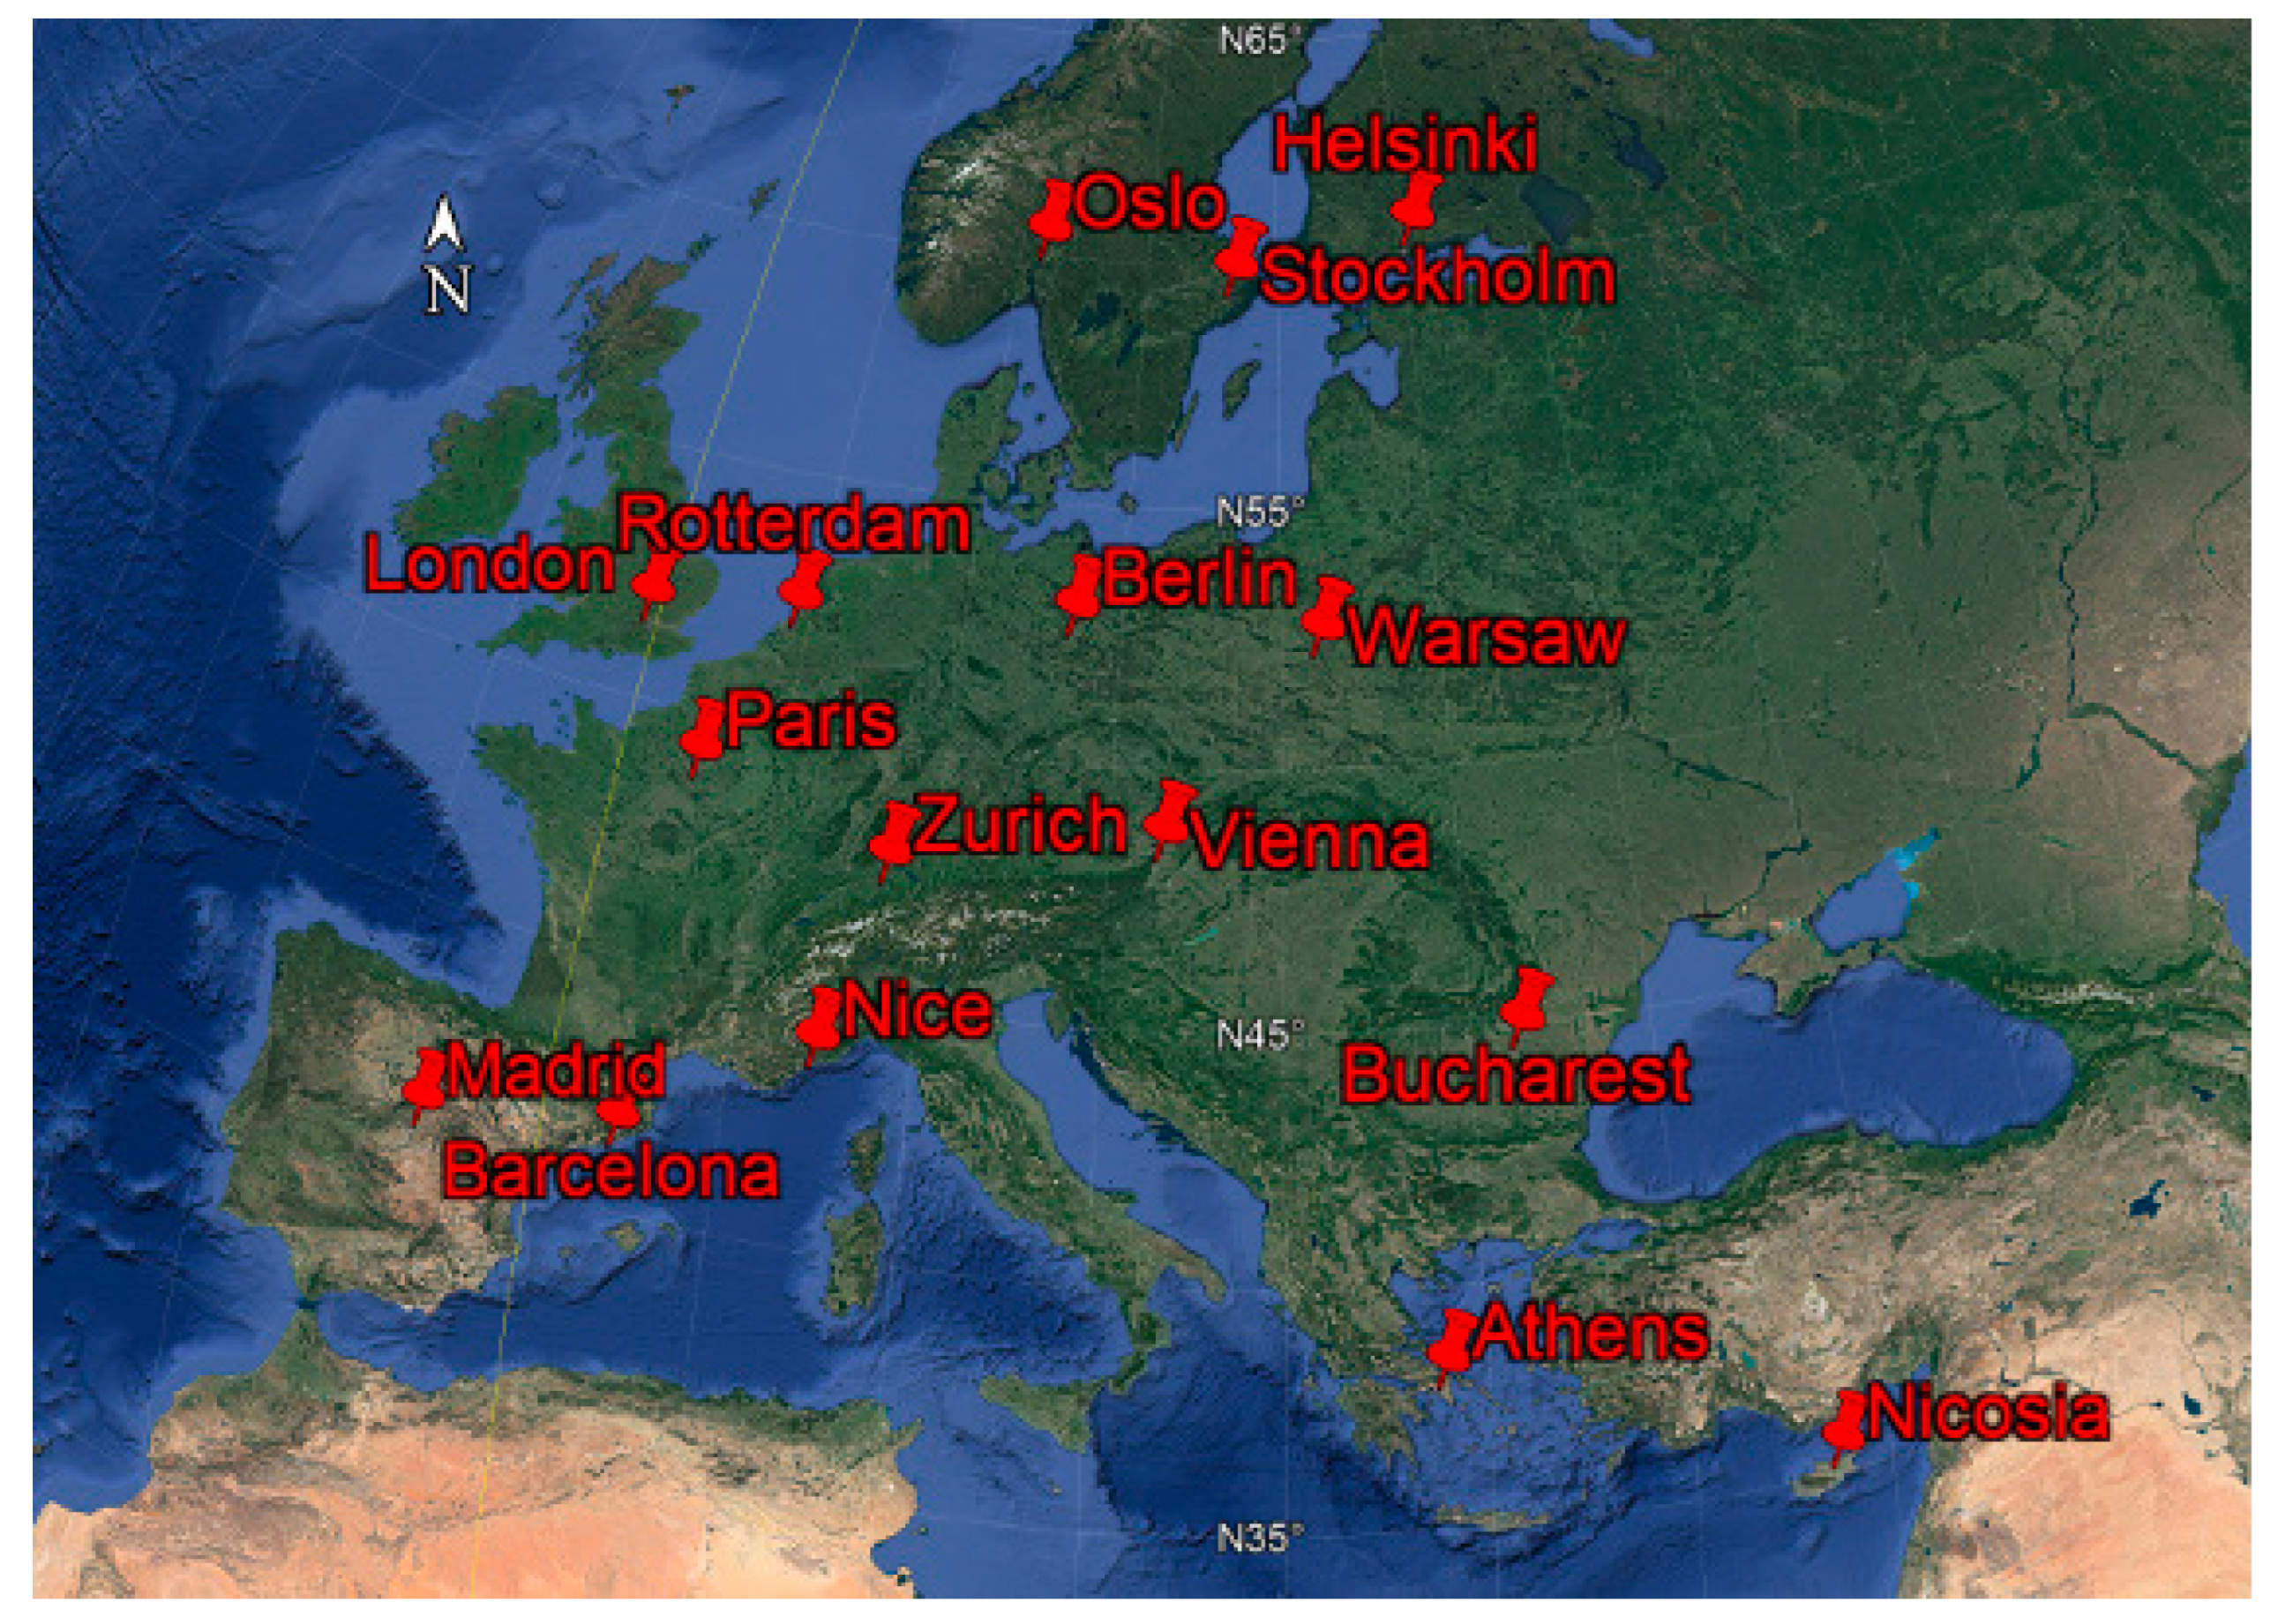
2.1. Studied Cities and Observational Data

A total of 16 European cities were selected in this study, presenting a good geographic distribution within the continent, and capturing diverse climate types (Figure 1). The main climate types observed in the studied cities are the boreal, the warm temperate and the arid, leading to the formation of six specific climate classes. In Table 1, the geographical coordinates along with the elevation and the climate class for all analyzed cities are presented. Each city’s climate class was based on the updated Köppen–Geiger climate classification [42]. According to this calculation scheme [42], the updated Köppen–Geiger climate classification has been performed on the basis of the climatic variables of air temperature and precipitation along with a dryness measure. The detailed multicriteria scheme along with the thresholds can be found in [42]. A climate class was assigned to each city, except Madrid. The climate in Madrid combines the characteristics of the Mediterranean climate with those of the cold semiarid climate and, thus, both classes were assigned to Madrid in Table 1. The six climate classes noted in the studied cities are (a) the boreal climate, fully humid with warm summers (Dfb), (b) the warm temperate climate, fully humid with hot summers (Cfa), (c) the warm temperate climate, fully humid with warm summers (Cfb), (d) the warm temperate climate with dry and hot summers (Csa), (e) the arid climate, cold steppe (BSk) and (f) the arid climate, hot steppe (BSh).
Daily maximum and daily minimum air temperatures were used for each city over the period 1961–2019. The observational data were extracted from the European Climate Assessment Dataset (ECA&D) [43] for all cities, with the exception of Athens and Nicosia. The ECA dataset contains series of daily observations for a number of climatic elements at meteorological stations throughout Europe and the Mediterranean. All data undergo rigorous quality control in order to minimize the effects of changes over time in the way the measurements have been made. The daily data for Athens were derived from the historical climatic records of the National Observatory of Athens. In addition, the daily data for Nicosia were obtained from the Ministry of Agriculture, Rural Development and Environment (Department of Meteorology) in Cyprus. The studied period (1961–2019) was selected based on the availability of daily data in the respective weather stations and, thus, in 7 out of 17 stations, no missing values were found, while for the rest of the stations the percentage of missing data corresponded to less than 0.5%.

2.2. RCM Simulations

In addition to the observational data, the simulated parameters of daily maximum and minimum air temperature from the RCA4 RCM of the Swedish Meteorological and Hydrological Institute [44] driven by the Max Planck Institute for Meteorology model MPI-ESM-LR [45] were used. The RCA4 regional climate model has a horizontal resolution of about 12 km (0.11°) and the simulated data were extracted for the closest land grid point to the stations’ locations. The boundary conditions of the regional climate model RCA4 were specified by the results of the global climate model MPI-ESM-LR. The simulations were conducted in the framework of the EURO-CORDEX experiment under the intermediate- and high-emission GHGs scenarios, namely the Representative Concentration Pathways (RCPs) 4.5 and 8.5. In particular, the RCP4.5 is a stabilization scenario, where the radiative forcing level stabilizes at 4.5 W/m2 before 2100 by implementing climate change policies for reducing greenhouse gas emissions [46]. In contrast, the scenario RCP8.5 represents the pathway with the highest greenhouse gas emissions, where no climate change policies are implemented, and the radiative forcing level reaches 8.5 W/m2 [46]. All simulations cover the period 1971–2100 with the 30-year time slice of 1971–2000 serving as the reference period. This period was selected as the reference for two reasons. The first is related to the quality and simultaneous completeness of the observational data among the considered cities and the second reason concerns the fact that the changes that are being implemented in the simulated data due to the selected scenarios start at the beginning of the 21st century. The entire period 1971–2100 was used for the long-term trends analysis, while the 30-year distant future period 2071–2100 was used for comparison reasons with the reference period (1971–2000).
The empirical quantile mapping (EQM) technique was used for the statistical bias correction of daily maximum air temperature, daily minimum air temperature and diurnal temperature range. When using EQM, the observed empirical probability density function (PDF) is used to correct the 1st to 99th percentiles of the predicted empirical probability density function (PDF), while a constant extrapolation is used for lower or higher values falling outside this range [47,48,49,50,51]. This technique is capable of correcting the discrepancies in the distribution of the simulated parameters against the observed ones. This is achieved by constructing a transfer function that has been calibrated over the reference period to map quantiles from the empirical cumulative distribution function of the model output onto the corresponding distribution of observations [47,48,49,50,51]. The references indicated above provide further technical details on this technique.

2.3. Analysis

The response of DTR to exceptionally hot weather (hot days and HW days) was examined in the current study. The identification of heat waves was based on an upper percentile temperature threshold. In particular, the adopted definition assumes a period of at least three consecutive days with the daily maximum air temperature (Tmax) above the 95th percentile of its summer (June, July, August) distribution over the 1971–2000 reference period (Table 2). Therefore, the days that met the criteria of duration and Tmax exceedance were considered HW days. On the contrary, the days that only met the criterion of Tmax exceedance regardless of the duration were considered hot days. The aforementioned HW definition has been extensively used in the literature to capture a period of excess heat (e.g., [37,41]). Table 2 presents not only the 95th percentile of Tmax based on observations but also based on simulations over the 1971–2000 reference period. Both thresholds coincide in the majority of the cities with the difference between they are up to 0.2 °C.
The ordinary least squares regression model was selected to analyze the long-term trends of DTR along with the nonparametric Mann–Kendall trend test for the assessment of statistical significance of trends and for the detection of the starting year when the trends become statistically significant (95% confidence level). In addition, the 95th percentile confidence intervals as derived by bootstrap [52,53,54] were calculated to assess the statistically significance of the means of DTR between the future period (2071–2100) and the reference period (1971–2000).

3. Results

3.1. Distribution of DTR Based on Observations (1961–2019) per Climate Type

Figure 2 presents the relative frequency curves (RFCs) of DTR based on observational data for all cities and for the period 1961–2019. A bin size of 1 °C was used for creating the RFCs. For a better presentation of the results, the RFCs of DTR were grouped according to the climate type (Table 1), namely the boreal climate (Df), the warm temperate-fully humid climate (Cf) and the warm temperate with dry summer climate (Cs) along with an arid climate (BS). The RFCs of DTR in cities with a boreal climate (Dfb) show a right-skewed distribution with a relatively similar pattern (Figure 2a). The DTR values with the highest relative frequency are found at around 3.6 °C in Stockholm and reach up to 6.6 °C in Warsaw. At least 95% of DTR values are less than 15 °C in these cities. The RFCs of DTR in cities with a warm temperate climate that is fully humid with warm summers (Cfb) also reveal right-skewed distributions (Figure 2b). The DTR values with the highest relative frequency are found at around 5.3 °C in Rotterdam and reach up to 8.0 °C in Berlin. On the contrary, the distribution of DTR in Bucharest, which features a warm temperature fully humid climate with hot summers (Cfa) is left-skewed with a flattened curve. Therefore, high relative frequencies are observed in a wide range of DTR values, with the highest one to be noted around 12.6 °C. Unlike the previous skewed distributions, the distribution of DTR in cities featuring a warm temperate climate with dry and hot summers (Csa) appear to be symmetrical (Figure 2c). The highest relative frequency is observed at around 7.1 °C in Nice and reaches up to 9.2 °C in Athens. Finally, the RFCs of DTR in Nicosia (BSh) and Madrid (Csa + BSk) indicate left-skewed distributions, resulting in increased relative frequencies at higher DTR levels. In particular, the DTR values with the highest relative frequency are found at around 15 °C in Nicosia and 17 °C in Madrid.

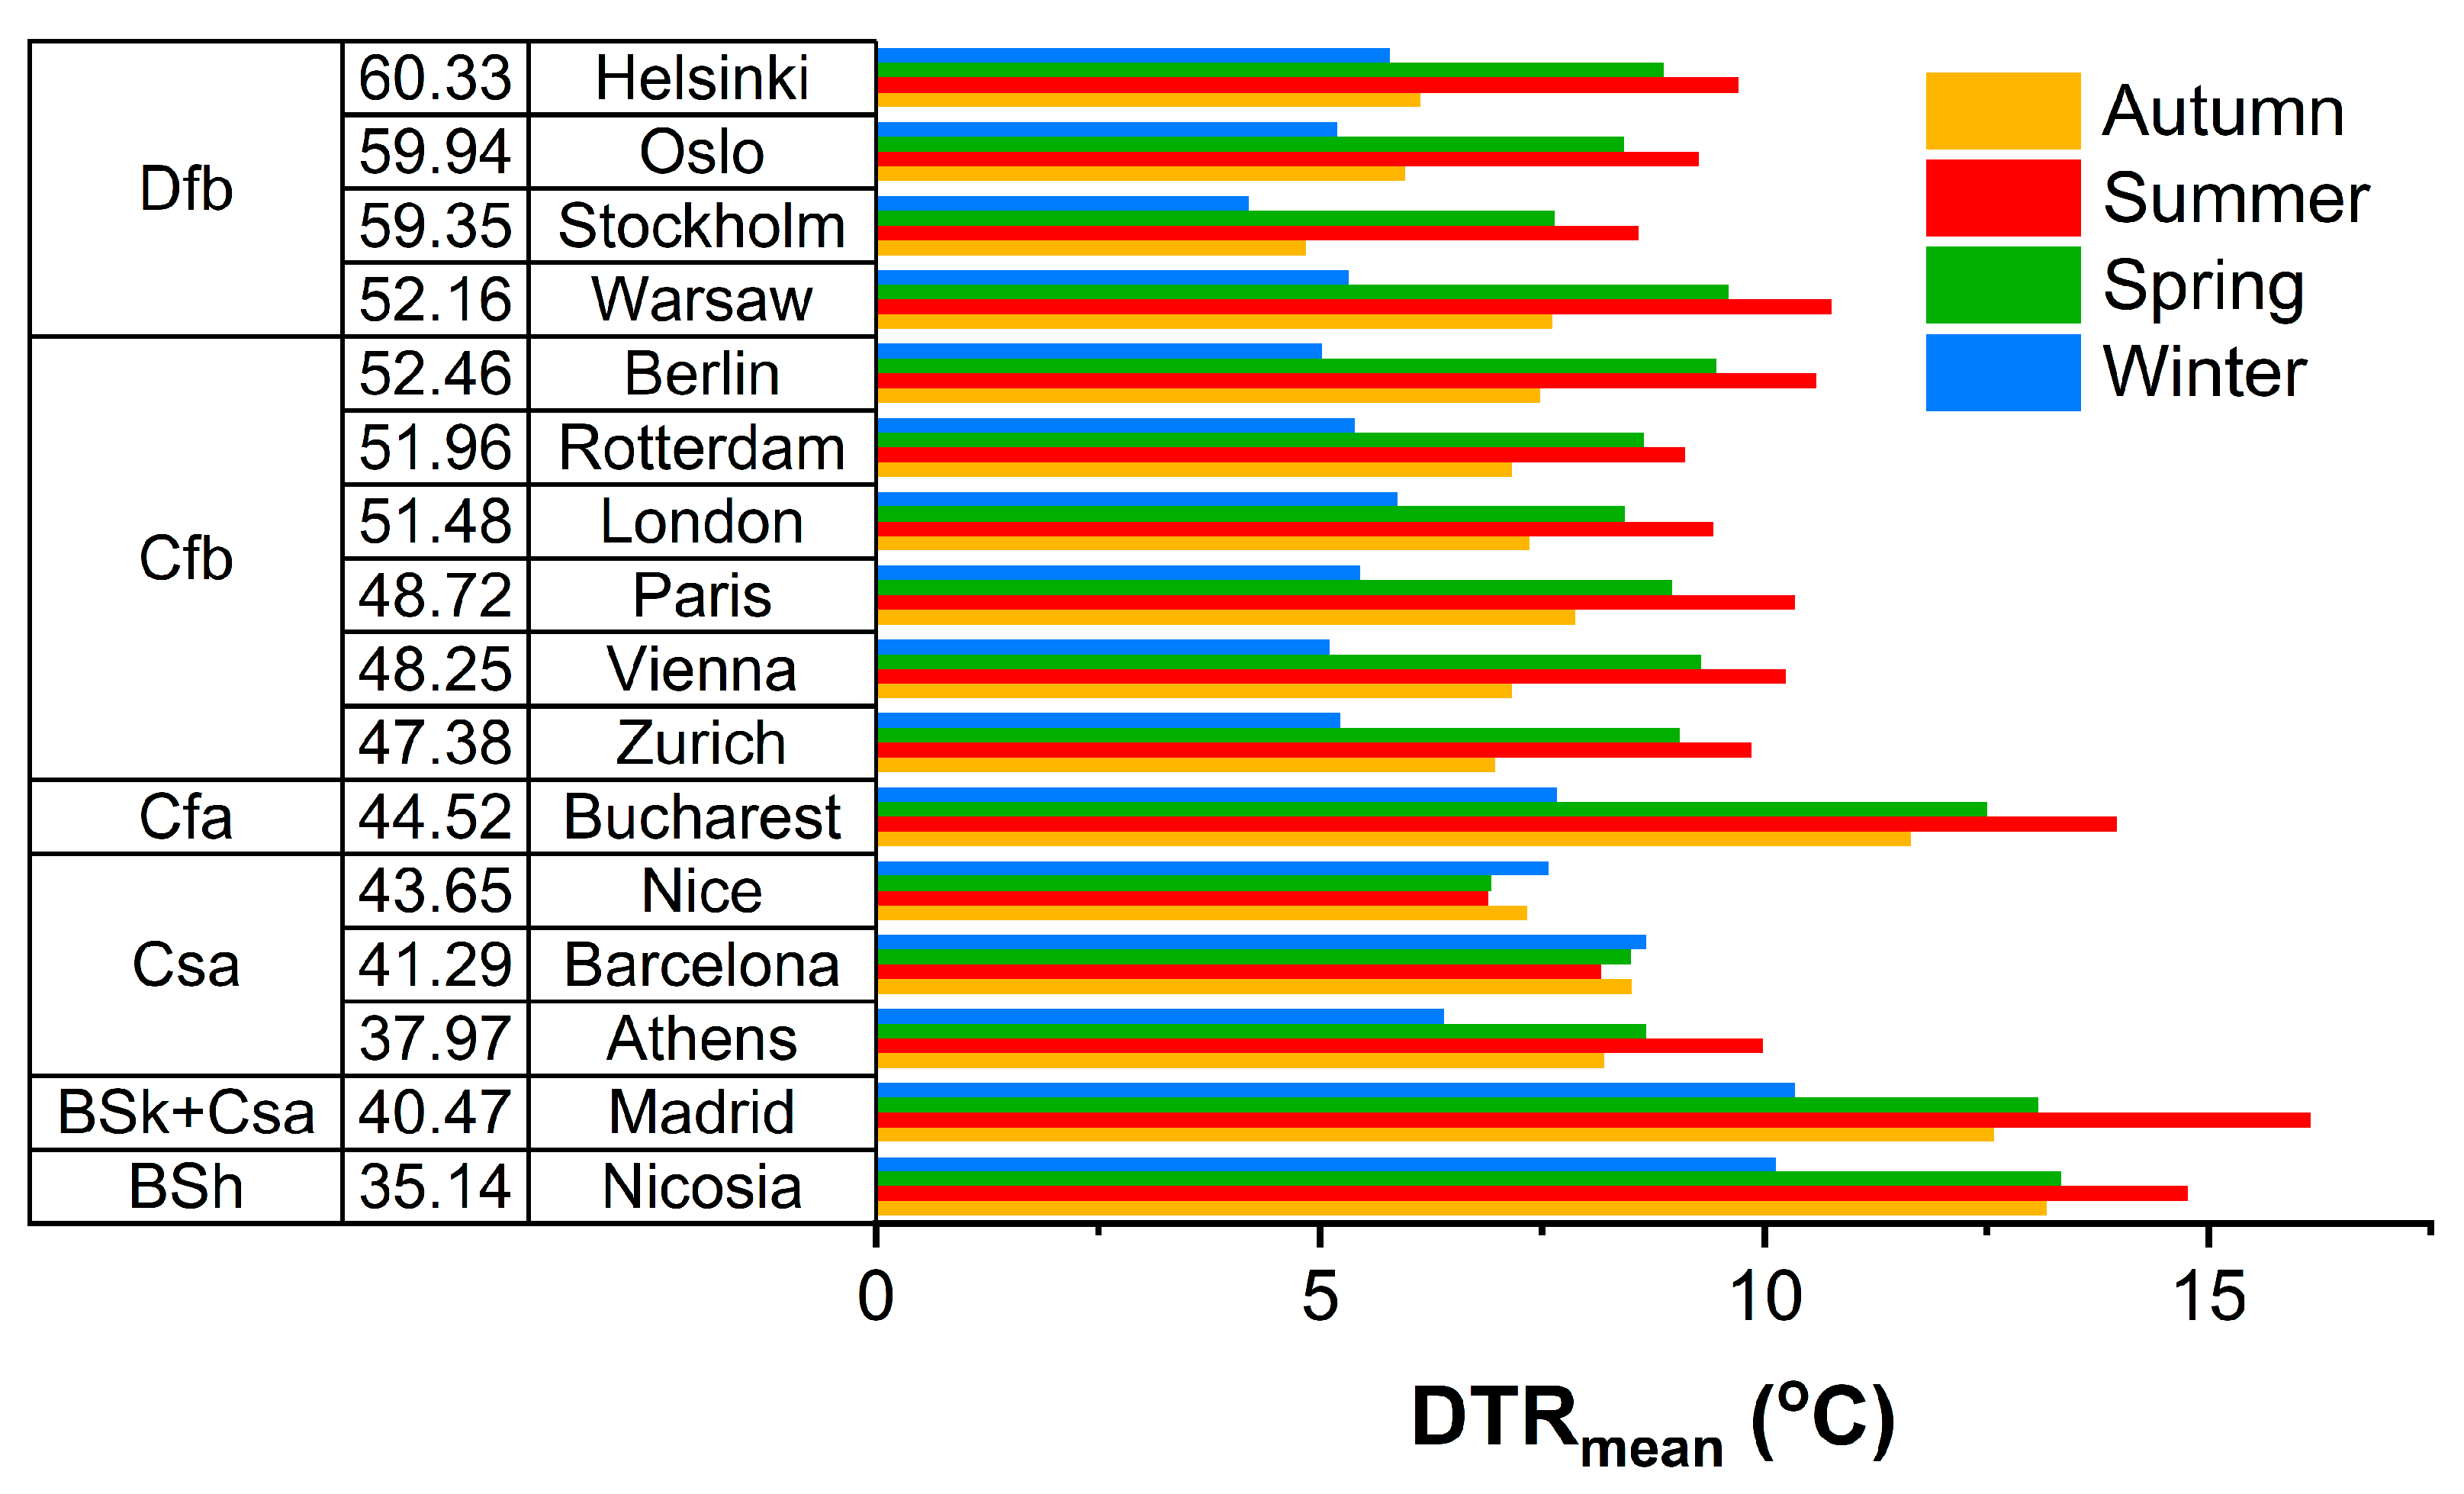
3.2. Seasonal Variation of Mean DTR Based on Observations (1961–2019)

In Figure 3, the seasonal variation of mean DTR sorted by climate class and latitude is shown. The results show strong seasonal variability in most of the cities, with the highest mean DTR observed during summer, while the lowest noted during winter. During the transitional seasons, the mean DTR values are formulated at intermediate levels, being higher in spring than in autumn. However, this seasonal variability is considerably weakened in the Mediterranean cities of Nice and Barcelona and to a smaller degree in Athens. The latter outcome probably reflects the proximity of these cities and especially of the respective stations to the coastline. In addition, the mean DTR in winter shows some latitudinal variability, being lower at the cities located at latitudes higher than that of Zurich, ranging between 4.2 °C and 5.9 °C, compared to the cities at lower latitudes, ranging from 6.4 °C to 10.3 °C. However, the mean DTR values in summer and spring in these northern cities reach similar or even higher DTR values compared to the coastal Mediterranean cities of Nice, Barcelona and Athens. Madrid and Nicosia are the cities with the highest mean DTR in all seasons, probably reflecting the characteristics of the arid climate along with the high elevation in the case of Madrid. Bucharest follows with high DTR values in all seasons except winter, an outcome that is probably related to the hot summer conditions under a temperate fully humid climate.

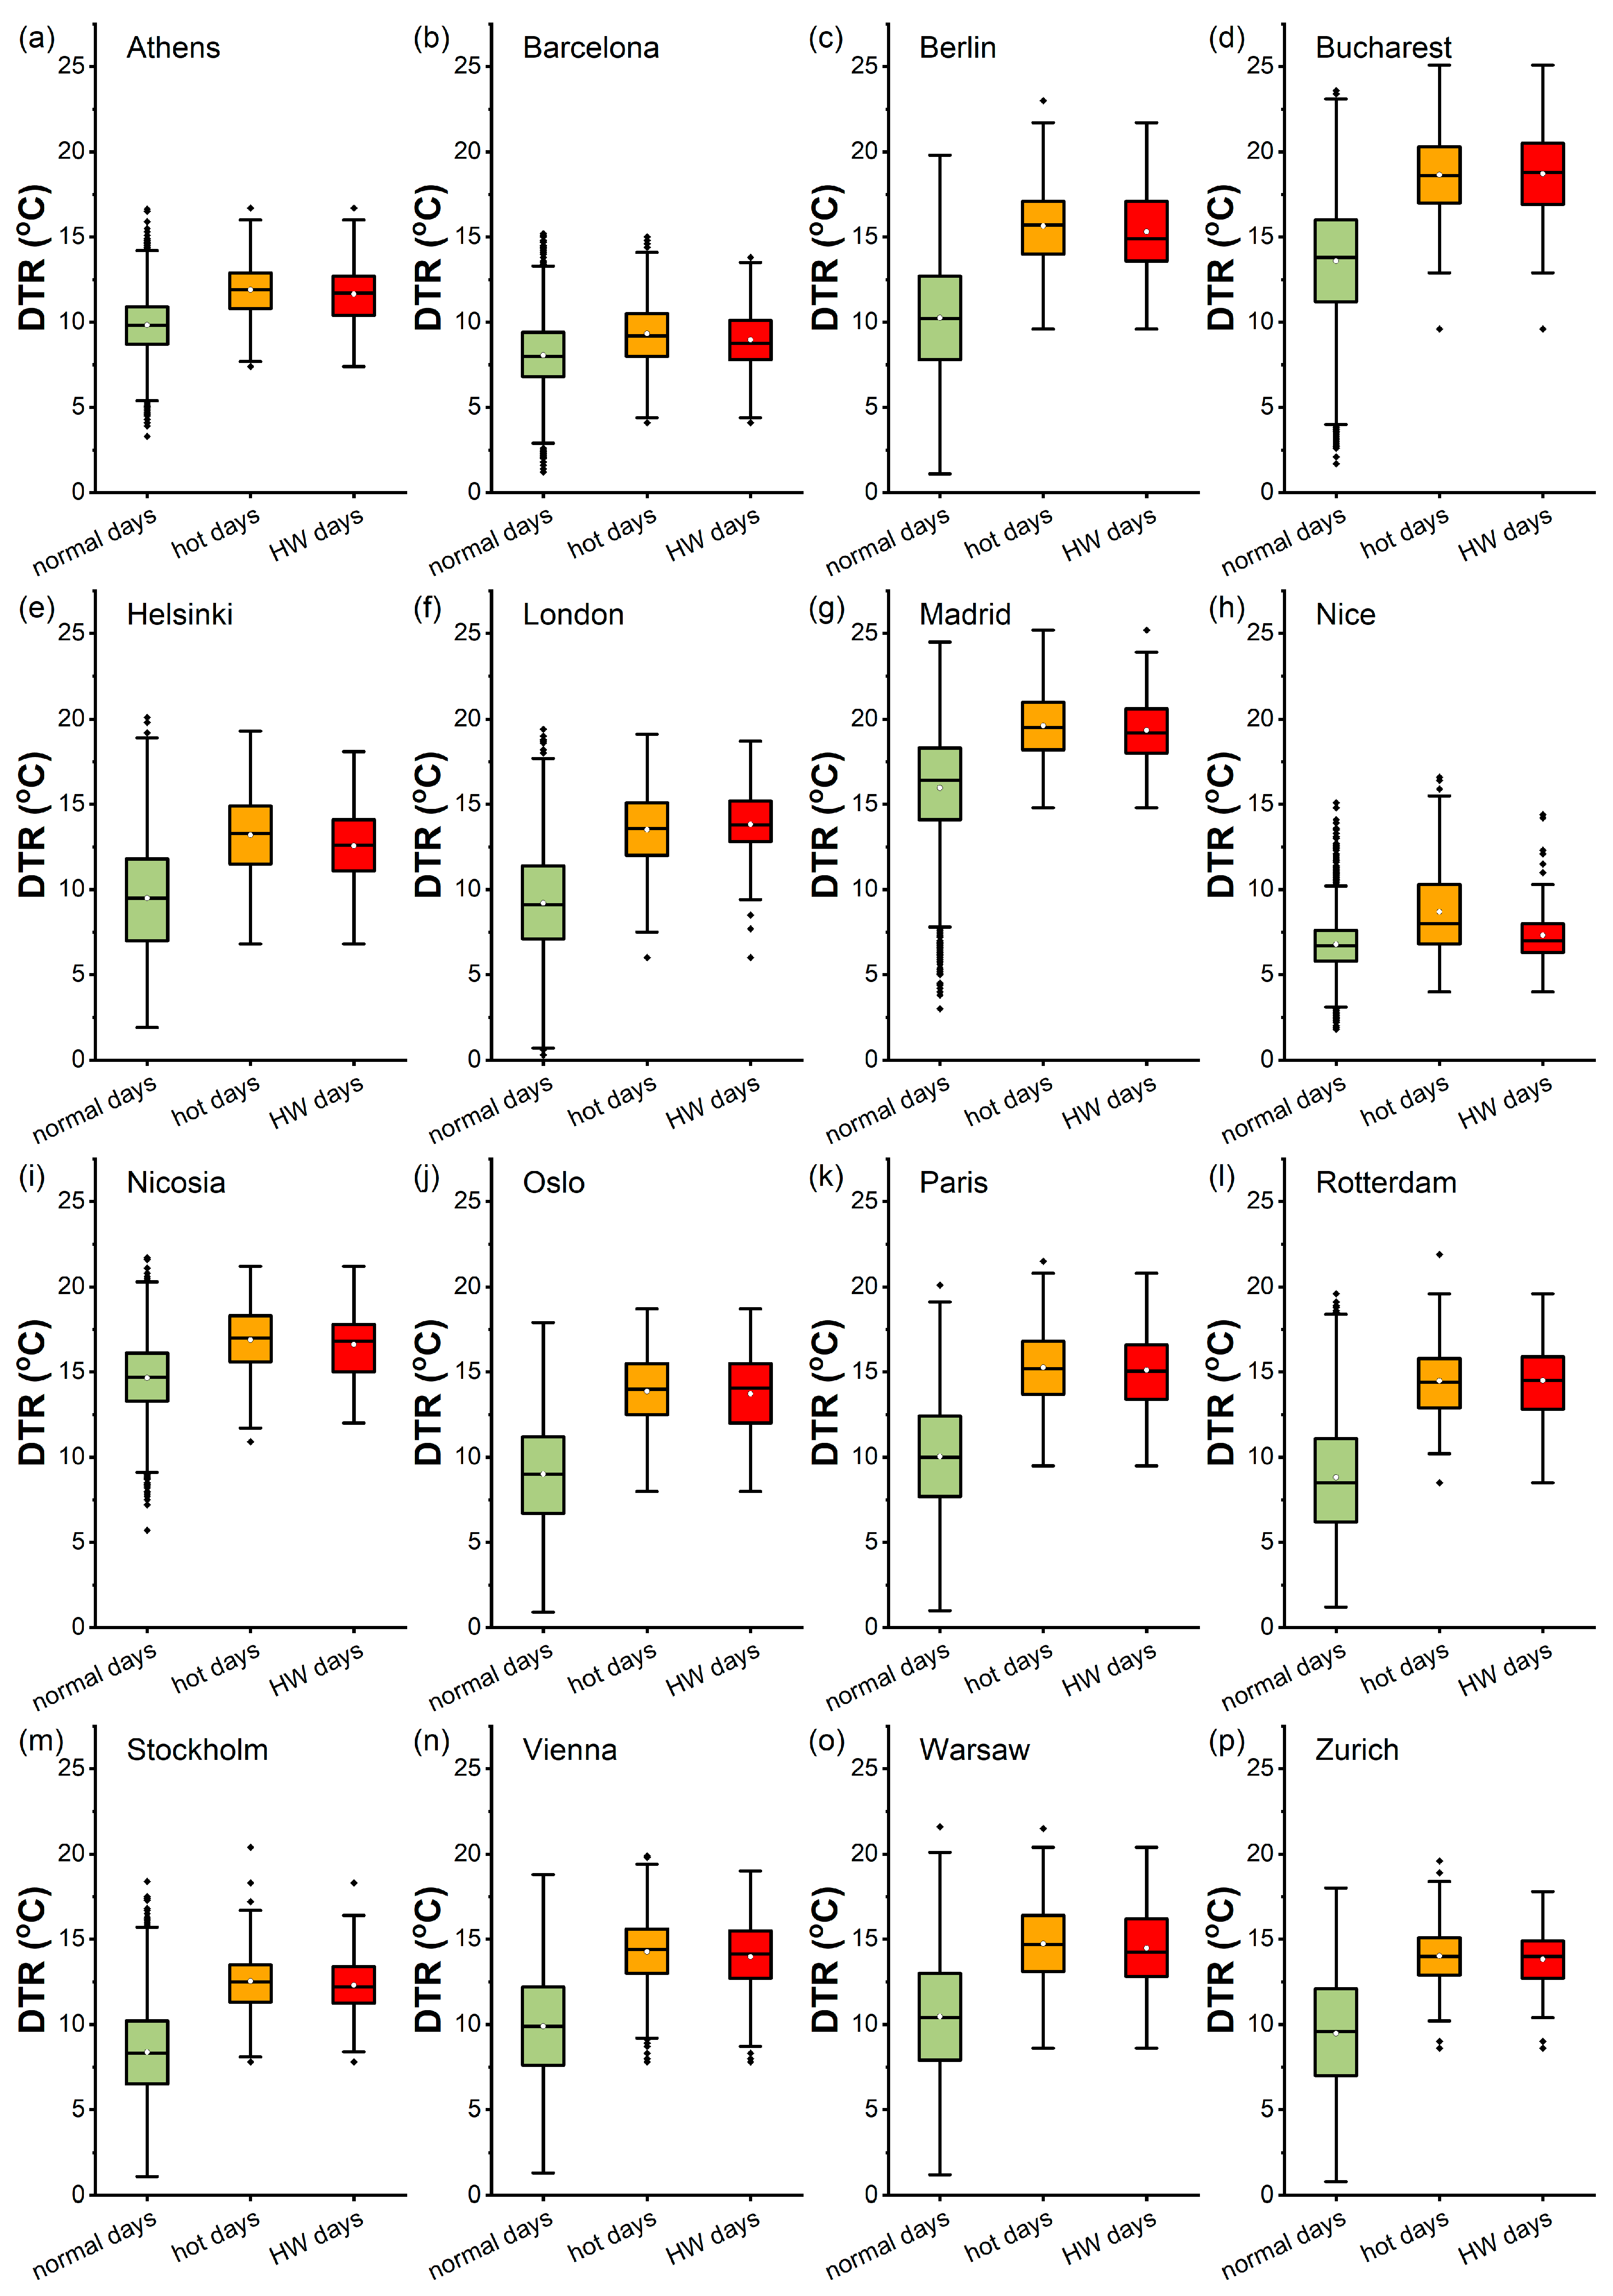
3.3. Response of DTR to Exceptionally Hot Weather

In Figure 4, the comparison of DTR between summer normal days, hot days and HW days based on observational data for all cities over the period 1961–2019 is shown. It is evident that the DTR during both hot days and HW days is higher compared to the DTR during summer normal days in all cities. In addition, the DTR during HW days seems to be slightly lower than that during hot days in most of the cities by comparing the means, the medians, and the interquartile ranges (lengths of the boxes). Although the maximum air temperature is formed at roughly the same levels on hot days and on HW days, the minimum air temperature appears to be a bit higher on HW days than on hot days, which is what causes the observed modest variation in DTR. This is probably related to the accumulation of heat due to compact and dense urban environment during nighttime in cities in the occurrence of prolonged heat episodes.
In particular, the mean DTR for normal summer days ranges between 8.0 and 10.5 °C for all cities, except for Nice (6.8 °C), which shows lower mean DTR values and Nicosia (14.6 °C), Madrid (16.0 °C) and Bucharest (13.6 °C), which present the highest values. Although the DTR during hot days and HW days is higher compared to normal days, the observed changes vary between the cities. This can be better seen in Figure 5, where the change of mean DTR between normal days and either hot days (Figure 5a) or HW days (Figure 5b) per latitude along with the climate class is depicted. The change of the mean DTR between summer normal days and hot days is greater for the cities in higher latitudes featuring either boreal climates or temperate fully humid climates ranging from 3.7 °C to 5.7 °C (Figure 5a). In contrast, the change is less pronounced in cities with Mediterranean or arid climates that range in temperature from 1.3 °C to 3.6 °C. This pattern is mostly preserved when compared to HW days, although the changes in DTR are slightly lower in most of the cities except London (Figure 5b).

3.4. Trends in the Projected DTR (1971–2100)

Figure 6 presents the trends in the mean annual DTR based on simulations of the period 1971–2100 under the RCPs 4.5 and 8.5, for all cities. A statistically significant decreasing trend in mean DTR is projected for the cities at the highest latitudes (Oslo, Stockholm, and Helsinki) under the RCP4.5, at a rate of −0.03 °C/decade, −0.03 °C/decade and −0.07 °C/decade, respectively, suggesting higher increasing rates in the minimum air temperature compared to the maximum air temperature (Figure 6a). At the same time, the opposite result is projected for Madrid (statistically significant increasing trend, +0.05 °C/decade), while no statistically significant trends in mean DTR are projected for the rest of the cities.
Regarding the RCP8.5 scenario, more cities are anticipated to experience a statistically significant decreasing trend in mean DTR, including Berlin, Rotterdam, Warsaw, Oslo, Stockholm, and Helsinki at higher latitudes and Barcelona at lower latitudes, with a rate of decrease ranging from −0.02 to −0.12 °C/decade (Figure 6b). On the contrary, a statistically significant increasing trend in DTR is projected in Madrid (+0.10 °C/decade), Bucharest (+0.07 °C/decade), Nicosia (+0.03 °C/decade), and Zurich (+0.02 °C/decade), although the trends in the latter two cities become statistically significant shortly before the end of the century.

3.5. Seasonal Variation in DTR under Climate Change

In Figure 7, the seasonal distribution of DTR between the reference period (1971–2000) and the future period (2071–2100) in each of the cities under the RCPs 4.5 and 8.5 is shown. In order to achieve a more enhanced visualization of the connections and differences between the cities, the seasonal changes of mean DTR between the future and reference period were sorted by latitude as shown in Figure 8. The embedded red asterisks in Figure 7 and the red dots in Figure 8 indicate where the difference of mean DTR between the future period and the reference period is found statistically significant at the 95% confidence level according to the bootstrap method. In autumn, the DTR over the period 2071–2100 is projected to be lower compared to the DTR during the reference period in most of the cities, with the mean difference ranging from −0.1 °C to −0.7 °C regardless of the scenario. However, the mean DTR difference is statistically significant only in Helsinki (−0.4 °C/RCP4.5, −0.7 °C/RCP8.5) and Stockholm (−0.2 °C/RCP4.5 and RCP8.5) under both scenarios and in Warsaw (−0.4 °C) and Nicosia (−0.4 °C) under the RCP8.5. On the contrary, in Madrid, the DTR over the period 2071−2100 in autumn is foreseen to be higher than that during the reference period under both scenarios, although these differences are not statistically significant.
The majority of cities are anticipated to see an increase in DTR during the winter months between 2071 and 2100, with the mean difference varying between +0.1 °C and +2.2 °C. The most pronounced and statistically significant increases in DTR are projected in Madrid (+0.7 °C/RCP4.5, +1.2 °C/RCP8.5), Bucharest (+0.7 °C/RCP4.5, +2.2 °C/RCP8.5), Athens (+0.4 °C/RCP8.5), Berlin (+0.3 °C/RCP8.5), Vienna (+0.8 °C/RCP8.5), and Zurich (+0.4 °C/RCP8.5). On the other hand, the cities at the highest latitudes like Oslo, Stockholm, and Helsinki are foreseen to experience a statistically significant decrease in DTR during winter in the future with the mean difference ranging from −0.5 °C to −1.5 °C.
In summer, a statistically significant decrease in DTR is projected in the northern cities of Oslo, Stockholm, and Helsinki in the future (2071–2100) with the mean difference ranging between −0.4 °C and −0.7 °C under the RCP4.5 and from −0.6 °C to −1.6 °C under the RCP8.5. A statistically significant decrease in DTR is also foreseen in Athens (−0.2 °C/RCP4.5, −0.3 °C/RCP8.5) and Nice (−0.3 °C RCP4.5, −0.4 °C/RCP8.5), although these differences are formed at lower levels compared to the former ones. On the contrary, the mean DTR in summer is projected to increase in Madrid, Nicosia, Paris, Rotterdam, Vienna and Zurich under both scenarios. However, the mean difference is expected to be statistically significant in Nicosia (+0.3 °C/RCP4.5, +0.5 °C/RCP8.5), Zurich (+0.6 °C/RCP4.5, +0.9 °C/RCP8.5), Madrid (+0.4 °C/RCP8.5) and Paris (+1.0 °C/RCP8.5).
In spring, most of the cities are expected to experience a decrease in DTR during the period 2071−2100, with the mean difference ranging from −0.1 °C to −1.1 °C. The most pronounced decreases that are at the same time statistically significant are foreseen in Helsinki (−0.8 °C/RCP4.5, −1.1 °C/RCP8.5), London (−0.5 °C/RCP4.5, −0.9 °C/RCP8.5), Paris (−0.5 °C/RCP4.5, −0.9 °C/RCP8.5), Rotterdam (−0.5 °C/RCP4.5, −0.9 °C/RCP 8.5), Berlin (−0.6 °C/RCP8.5), Oslo (−0.6 °C/RCP 8.5), Stockholm (−0.4 °C/RCP8.5) and Warsaw (−0.4 °C/RCP4.5). On the other hand, increases in DTR during the period 2071–2100 are only projected in Nicosia, Athens, Bucharest and Madrid, with the mean difference (statistically significant) to range between +0.3 °C and +0.9 °C.

3.6. Response of DTR to Exceptionally Hot Weather in the Future

Figure 9 illustrates the DTR under summer normal days, hot days and HW days for the reference (1971–2000) and the future period (2071–2100) under the RCP8.5. It is noted that the identification of hot days and HW days follows the procedure described in Section 2.3 and the 95th percentile of Tmax was based on the simulated data. From Figure 9, it is evident that the DTR during hot days and HW days is higher compared to the DTR during normal days in all cities for both the reference period (1971–2000) and the future period (2071–2100). Although the aforementioned pattern is preserved in the future compared to the reference period, the DTR is projected to be lower in the future period than in the reference period for each of the day categories (normal, hot, HW days) in the majority of the cities. However, the decrease of DTR over the future period is found to be smaller for the normal days than for the hot days and HW days. In particular, the difference of the mean DTR between the future period and the reference period for the normal days ranges from −0.3 °C to −2.0 °C, whilst it ranges between −0.8 °C and −2.7 °C for the hot days and from −0.9 °C to −2.8 °C for the HW days. Lower DTR values in future under normal, hot and HWs days is consistent almost across all cities, except for Rotterdam, Berlin and Nice, with projected increases in DTR under hot weather conditions.

4. Discussion and Conclusions

Today, climate change has emerged as one of the most significant threats to our planet. Long-term historical records of climatic data provide evidence of increased global and ocean mean temperatures, melting glaciers and rising sea levels, accompanied by simultaneous increases in the frequency and severity of extreme weather events like heat waves, floods, storms, droughts and others, with direct devastating impacts on humans and ecosystems [1]. Climate change is manifested through a number of indicators. In this study, we investigated the diurnal temperature range (DTR) as a key indicator, which combines the daily maximum and daily minimum air temperature. In particular, the study investigated the climatic features (mean values, distribution shape, seasonality) and trends of the DTR in 16 European cities of different background climates. The analysis was based on long-term observational data (1961−2019) along with RCM-simulated data in order to detect any projected DTR trends by the end of the 21st century, under intermediate- and high-emission GHG scenarios. Our research adds to existing relevant studies in the field by attempting to answer questions, among others, concerning the response of DTR during hot days and heat wave days in places with varied background climates.
The DTR frequency distribution analysis revealed variations in the range of DTR values among the cities but also distinct patterns of the DTR distribution according to the climate class of each city. The cities featuring either boreal climate (Dfb) or warm temperate climate that is fully humid with warm summer (Cfb) reveal right-skewed distributions, whilst those with a Mediterranean climate (Csa) show a symmetrical one. On the contrary, left-skewed distributions with flattened curves are noted for the cities with either arid climatic characteristics (BSh, BSk) or with warm temperature climates that are fully humid with hot summers (Cfa). The results also show strong seasonal variability in most of the cities, with the highest mean DTR being observed during summers, while the lowest one during winters. This outcome is consistent with the findings of previous studies in other regions [23]. However, an attenuation in seasonal variability of DTR is observed in Mediterranean cities, which is probably related to the proximity of these cities and especially of the respective stations to the coastline, and the consequent breeze effect on temperature extremes especially during the warm period of the year. Previous studies have also reported differences in DTR between maritime and continental sites [23,55]. Despite this, no reduction in seasonal variability of DTR is observed for higher latitude coastal cities such as Rotterdam and Helsinki.
Madrid and Nicosia are the cities with the highest mean DTR in all seasons, probably reflecting the characteristics of the arid climate along with the high elevation in the case of Madrid. Previous studies have shown that higher elevations are associated with higher DTR [55,56]. Nevertheless, the connection between DTR and elevation is not straightforward, and it depends on elevation and other local particularities (e.g., distance from the coast) [23,55,57].
From the analysis of observational data, we also found a substantial increase in DTR during both hot days and HW days compared to normal summer days across all cities. In most of the cities, however, the DTR during HW days was found to be slightly lower than that during hot days, due to the higher minimum air temperature during HWs. This outcome can be attributed to the heat accumulation in urban environments during nighttime when consecutive days of excessive heat take place [58]. Minimum temperature has also been reported as a primary controlling factor in DTR variation during heat waves [41]. The observed increase in DTR during hot days (HW days) compared to normal days varies across the cities. It is greater for the cities at higher latitudes, ranging from 3.7 °C to 5.7 °C (HW days range 3.1 °C to 5.7 °C), than at lower latitudes, ranging from 1.3 °C to 3.6 °C (HW days range 0.5 °C to 3.4 °C).
Model simulations suggested that DTR is projected to significantly decrease in northernmost cities (Helsinki, Stockholm, Oslo), while it is expected to increase in Madrid by the end of the 21st century under both the intermediate- and high-emission scenarios, due to asymmetric changes in daily maximum and minimum air temperatures. The asymmetrical response of global warming is more pronounced under the high-emission scenario where more cities at higher latitudes (Warsaw, Berlin, Rotterdam) are added to those with statistically significant decreases in DTR, while others (Bucharest, Nicosia, Zurich) are added to those with increases in DTR. Asymmetrical changes in maximum and minimum air temperatures lead to a mosaic of either downward or upward trends in DTR depending on the region/site, suggesting topographical and geographical variabilities, although there are cities with no significant trend. Most previous studies have shown a decrease in global DTR over recent decades [19,20,21,59], while some other studies that focus on specific regions have reported increasing trends in DTR [23,30,31,32,33,60]. In Spain, for example, the maximum air temperature has increased at a higher rate than the minimum air temperature since 1961 [33], and in the Baltic region, an increasing trend in DTR depending on the season has also been reported [23]. The study of Zhou et al. [34] has found a decrease in DTR over most regions worldwide by the end of the 21st century, especially in northern high latitudes, although some increases in certain regions in the Mediterranean were also found. These findings are consistent with our results.
Cities with the most pronounced DTR trends by the end of the 21st century reveal a clear signal on the seasonal scale as well. Therefore, the DTR decreases in all seasons in cities located at northern high latitudes (Helsinki, Stockholm, Oslo). On the contrary, the DTR increases in all seasons in Madrid with the most pronounced changes projected during winter and spring. In most cities, significant change in DTR was found solely at certain seasons, implying asymmetrical changes in the future temperature extremes depending on the season. Yet, there were seasons where no significant change in DTR was detected, implying synchronous variations in temperature extremes in the future. Therefore, for example, significant increases in DTR are foreseen in Bucharest during winter and spring, and in Nicosia during spring and summer, while significant decreases in DTR are projected in London, Paris and Rotterdam during spring.
Although the causes of DTR reduction is beyond the scope of this paper, recent studies based on observations or model simulations provide evidence that DTR variations are mostly related to changing levels in clouds and soil moisture [61,62]. Clouds reflect sunlight during daytime, but retain warmth at night, contribution to increased minimum air temperature levels. Climatic anomalies and long-term decline in DTR due to faster increasing rates in nighttime than in daytime air temperature, is a global phenomenon with profound ecological impacts. Warmer nights and reduced DTR may affect not only humans but also different plant species and agricultural production. For instance, warmer night temperatures are associated with increased plant respiration rates, which in turn impact the amount of carbon necessary to develop seeds [62].
Considering the critical role of DTR in various sectors, like human health, agriculture, ecosystems and energy consumption, an attempt was made to investigate the DTR differentiations in 16 European cities in relation to season, climate class and latitude along with the response of DTR under exceptionally hot weather. Daily data from observations and future projections were combined to gain better understanding of the DTR changes in an ever-changing climate. Identifying and assessing the DTR changes, as a key indicator of temperature extremes, provides useful information for various socioeconomic activities and could be used for more effective adaptation planning to climate change.

Author Contributions

Conceptualization, G.K. and D.F.; methodology, G.K., D.F., K.V.V. and C.G.; validation, G.K. and K.V.V.; formal analysis, G.K. and K.V.V.; investigation, G.K. and K.V.V.; resources, D.F. and C.G.; data curation, G.K. and K.V.V.; visualization, G.K.; writing—original draft preparation, G.K.; writing—review and editing, G.K., D.F., K.V.V. and C.G.; funding acquisition, C.G. All authors have read and agreed to the published version of the manuscript.

Funding

This research was partially supported by the European Union’s Horizon 2020 research and innovation programme under grant agreement 101037424, project ARSINOE (Climate resilient regions through systemic solutions and innovations) as well as by the National Development Program—Public Investments Program as part of sub-project 1 “Support for upgrading the operation of the National Network for Climate Change (Climpact)” of the project with code no. 2023NA11900001 (Code 5201588), project CLIMPACT (Supporting the upgrading of the operation of the National Network for Climate Change).

Institutional Review Board Statement

Not applicable.

Informed Consent Statement

Not applicable.

Data Availability Statement

The data analyzed in this study can be found at https://www.ecad.eu (accessed on 20 October 2022) for all stations except Athens and Nicosia, at https://data.climpact.gr/en/dataset (accessed on 20 October 2022) for Athens (NOA) and at http://www.moa.gov.cy/moa/dm/dm.nsf/home_en/home_en?openform (accessed on 20 October 2022) for Nicosia.

Acknowledgments

We acknowledge the data providers in the ECA&D project (https://www.ecad.eu, accessed on 20 October 2022, [43]), in the CLIMPACT project (https://climpact.gr/main/, accessed on 20 October 2022), as well as in the Ministry of Agriculture, Rural Development and Environment (Department of Meteorology) in Cyprus (http://www.moa.gov.cy/moa/dm/dm.nsf/home_en/home_en?openform, accessed on 20 October 2022).

Conflicts of Interest

The authors declare no conflict of interest.

References

  1. IPCC. Climate Change 2021: The Physical Science Basis; Contribution of Working Group I to the Sixth Assessment Report of the Intergovernmental Panel on Climate Change; Masson-Delmotte, V., Zhai, P., Pirani, A., Connors, S.L., Péan, C., Berger, S., Caud, N., Chen, Y., Goldfarb, L., Gomis, M.I., et al., Eds.; Cambridge University Press: Cambridge, UK; New York, NY, USA, 2021; p. 239. [Google Scholar] [CrossRef]
  2. Zhang, X.; Alexander, L.; Hegerl, G.C.; Jones, P.; Tank, A.K.; Peterson, T.C.; Trewin, B.; Zwiers, F.W. Indices for Monitoring Changes in Extremes Based on Daily Temperature and Precipitation Data. Wiley Interdiscip. Rev. Clim. Chang. 2011, 2, 851–870. [Google Scholar] [CrossRef]
  3. Braganza, K.; Karoly, D.J.; Arblaster, J.M. Diurnal Temperature Range as an Index of Global Climate Change during the Twentieth Century. Geophys. Res. Lett. 2004, 31, L13217. [Google Scholar] [CrossRef]
  4. Lee, W.; Kim, Y.; Sera, F.; Gasparrini, A.; Park, R.; Choi, H.M.; Prifti, K.; Bell, M.L.; Abrutzky, R.; Guo, Y.; et al. Projections of Excess Mortality Related to Diurnal Temperature Range under Climate Change Scenarios: A Multi-Country Modelling Study. Lancet Planet. Health 2020, 4, e512–e521. [Google Scholar] [CrossRef] [PubMed]
  5. Wang, Z.; Zhou, Y.; Luo, M.; Yang, H.; Xiao, S.; Huang, X.; Ou, Y.; Zhang, Y.; Duan, X.; Hu, W.; et al. Association of Diurnal Temperature Range with Daily Hospitalization for Exacerbation of Chronic Respiratory Diseases in 21 Cities, China. Respir. Res. 2020, 21, 251. [Google Scholar] [CrossRef]
  6. Davis, R.E.; Hondula, D.M.; Sharif, H. Examining the diurnal temperature range enigma: Why is human health related to the daily change in temperature? Int. J. Biometeorol. 2020, 64, 397–407. [Google Scholar] [CrossRef]
  7. Huang, Y.; Jiang, N.; Shen, M.; Guo, L. Effect of Preseason Diurnal Temperature Range on the Start of Vegetation Growing Season in the Northern Hemisphere. Ecol. Indic. 2020, 112, 106161. [Google Scholar] [CrossRef]
  8. Lobell, D.B. Changes in Diurnal Temperature Range and National Cereal Yields. Agric. For. Meteorol. 2007, 145, 229–238. [Google Scholar] [CrossRef]
  9. Adekanmbi, A.A.; Sizmur, T. Importance of Diurnal Temperature Range (DTR) for Predicting the Temperature Sensitivity of Soil Respiration. Front. Soil Sci. 2022, 2, 969077. [Google Scholar] [CrossRef]
  10. Bravo Dias, J.; Soares, P.M.M.; Carrilho da Graça, G. The Shape of Days to Come: Effects of Climate Change on Low Energy Buildings. Build. Environ. 2020, 181, 107125. [Google Scholar] [CrossRef]
  11. Wang, K.; Ye, H.; Chen, F.; Xiong, Y.; Wang, C. Urbanization Effect on the Diurnal Temperature Range: Different Roles under Solar Dimming and Brightening. J. Clim. 2012, 25, 1022–1027. [Google Scholar] [CrossRef]
  12. Ren, G.; Zhou, Y. Urbanization Effect on Trends of Extreme Temperature Indices of National Stations over Mainland China, 1961–2008. J. Clim. 2014, 27, 2340–2360. [Google Scholar] [CrossRef]
  13. Karl, T.R.; Kukla, G.; Gavin, J. Recent Temperature Changes during Overcast and Clear Skies in the United States. J. Appl. Meteorol. Climatol. 1987, 26, 698–711. [Google Scholar] [CrossRef]
  14. Dai, A.; Trenberth, K.E.; Karl, T.R. Effects of Clouds, Soil Moisture, Precipitation, and Water Vapor on Diurnal Temperature Range. J. Clim. 1999, 12, 2451–2473. [Google Scholar] [CrossRef]
  15. Shen, X.; Liu, B.; Lu, X. Effects of Land Use/Land Cover on Diurnal Temperature Range in the Temperate Grassland Region of China. Sci. Total Environ. 2017, 575, 1211–1218. [Google Scholar] [CrossRef] [PubMed]
  16. Schultz, N.M.; Lawrence, P.J.; Lee, X. Global Satellite Data Highlights the Diurnal Asymmetry of the Surface Temperature Response to Deforestation. J. Geophys. Res. Biogeosci. 2017, 122, 903–917. [Google Scholar] [CrossRef]
  17. He, B.; Huang, L.; Wang, Q. Precipitation Deficits Increase High Diurnal Temperature Range Extremes. Sci. Rep. 2015, 5, 12004. [Google Scholar] [CrossRef] [PubMed]
  18. Sun, X.; Wang, C.; Ren, G. Changes in the Diurnal Temperature Range over East Asia from 1901 to 2018 and Its Relationship with Precipitation. Clim. Chang. 2021, 166, 44. [Google Scholar] [CrossRef]
  19. Vose, R.S.; Easterling, D.R.; Gleason, B. Maximum and Minimum Temperature Trends for the Globe: An Update through 2004. Geophys. Res. Lett. 2005, 32, L23822. [Google Scholar] [CrossRef]
  20. Thorne, P.W.; Menne, M.J.; Williams, C.N.; Rennie, J.J.; Lawrimore, J.H.; Vose, R.S.; Peterson, T.C.; Durre, I.; Davy, R.; Esau, I.; et al. Reassessing Changes in Diurnal Temperature Range: A New Data Set and Characterization of Data Biases. J. Geophys. Res. Atmos. 2016, 121, 5115–5137. [Google Scholar] [CrossRef]
  21. Sun, X.; Ren, G.; You, Q.; Ren, Y.; Xu, W.; Xue, X.; Zhan, Y.; Zhang, S.; Zhang, P. Global Diurnal Temperature Range (DTR) Changes since 1901. Clim. Dyn. 2019, 52, 3343–3356. [Google Scholar] [CrossRef]
  22. Tank, A.M.G.K.; Können, G.P. Trends in Indices of Daily Temperature and Precipitation Extremes in Europe, 1946–1999. J. Clim. 2003, 16, 3665–3680. [Google Scholar] [CrossRef]
  23. Jaagus, J.; Briede, A.; Rimkus, E.; Remm, K. Variability and Trends in Daily Minimum and Maximum Temperatures and in the Diurnal Temperature Range in Lithuania, Latvia and Estonia in 1951–2010. Theor. Appl. Climatol. 2014, 118, 57–68. [Google Scholar] [CrossRef]
  24. Karl, T.R.; Kukla, G.; Razuvayev, V.N.; Changery, M.J.; Quayle, R.G.; Heim, R.R., Jr.; Easterling, D.R.; Fu, C.B. Global Warming: Evidence for Asymmetric Diurnal Temperature Change. Geophys. Res. Lett. 1991, 18, 2253–2256. [Google Scholar] [CrossRef]
  25. Qu, M.; Wan, J.; Hao, X. Analysis of Diurnal Air Temperature Range Change in the Continental United States. Weather Clim. Extrem. 2014, 4, 86–95. [Google Scholar] [CrossRef]
  26. Doan, Q.-V.; Chen, F.; Asano, Y.; Gu, Y.; Nishi, A.; Kusaka, H.; Niyogi, D. Causes for Asymmetric Warming of Sub-Diurnal Temperature Responding to Global Warming. Geophys. Res. Lett. 2022, 49, e2022GL100029. [Google Scholar] [CrossRef]
  27. You, Q.; Min, J.; Jiao, Y.; Sillanpää, M.; Kang, S. Observed Trend of Diurnal Temperature Range in the Tibetan Plateau in Recent Decades. Int. J. Climatol. 2016, 36, 2633–2643. [Google Scholar] [CrossRef]
  28. Zhang, X.; Vincent, L.A.; Hogg, W.D.; Niitsoo, A. Temperature and Precipitation Trends in Canada during the 20th Century. Atmos. Ocean 2000, 38, 395–429. [Google Scholar] [CrossRef]
  29. Makowski, K.; Wild, M.; Ohmura, A. Diurnal Temperature Range over Europe between 1950 and 2005. Atmos. Chem. Phys. 2008, 8, 6483–6498. [Google Scholar] [CrossRef]
  30. Shahid, S.; Harun, S.B.; Katimon, A. Changes in Diurnal Temperature Range in Bangladesh during the Time Period 1961–2008. Atmos. Res. 2012, 118, 260–270. [Google Scholar] [CrossRef]
  31. Jhajharia, D.; Singh, V.P. Trends in Temperature, Diurnal Temperature Range and Sunshine Duration in Northeast India. Int. J. Climatol. 2011, 31, 1353–1367. [Google Scholar] [CrossRef]
  32. Mall, R.K.; Chaturvedi, M.; Singh, N.; Bhatla, R.; Singh, R.S.; Gupta, A.; Niyogi, D. Evidence of Asymmetric Change in Diurnal Temperature Range in Recent Decades over Different Agro-Climatic Zones of India. Int. J. Climatol. 2021, 41, 2597–2610. [Google Scholar] [CrossRef]
  33. Del Río, S.; Cano-Ortiz, A.; Herrero, L.; Penas, A. Recent Trends in Mean Maximum and Minimum Air Temperatures over Spain (1961–2006). Theor. Appl. Climatol. 2012, 109, 605–626. [Google Scholar] [CrossRef]
  34. Zhou, L.; Dickinson, R.E.; Dirmeyer, P.; Dai, A.; Min, S.-K. Spatiotemporal Patterns of Changes in Maximum and Minimum Temperatures in Multi-Model Simulations. Geophys. Res. Lett. 2009, 36, L02702. [Google Scholar] [CrossRef]
  35. Wang, K.; Clow, G.D. The Diurnal Temperature Range in CMIP6 Models: Climatology, Variability, and Evolution. J. Clim. 2020, 33, 8261–8279. [Google Scholar] [CrossRef]
  36. Perkins-Kirkpatrick, S.E.; Lewis, S.C. Increasing Trends in Regional Heatwaves. Nat. Commun. 2020, 11, 3357. [Google Scholar] [CrossRef] [PubMed]
  37. Founda, D.; Katavoutas, G.; Pierros, F.; Mihalopoulos, N. Centennial Changes in Heat Waves Characteristics in Athens (Greece) from Multiple Definitions Based on Climatic and Bioclimatic Indices. Glob. Planet. Chang. 2022, 212, 103807. [Google Scholar] [CrossRef]
  38. Katavoutas, G.; Founda, D. Intensification of Thermal Risk in Mediterranean Climates: Evidence from the Comparison of Rational and Simple Indices. Int. J. Biometeorol. 2019, 63, 1251–1264. [Google Scholar] [CrossRef]
  39. Katavoutas, G.; Founda, D.; Varotsos, K.V.; Giannakopoulos, C. Climate Change Impacts on Thermal Stress in Four Climatically Diverse European Cities. Int. J. Biometeorol. 2022, 66, 2339–2355. [Google Scholar] [CrossRef]
  40. Katavoutas, G.; Georgiou, G.K.; Asimakopoulos, D.N. Studying the urban thermal environment under a human-biometeorological point of view: The case of a large coastal metropolitan city, Athens. Atmos. Res. 2015, 152, 82–92. [Google Scholar] [CrossRef]
  41. Kueh, M.-T.; Lin, C.-Y.; Chuang, Y.-J.; Sheng, Y.-F.; Chien, Y.-Y. Climate Variability of Heat Waves and Their Associated Diurnal Temperature Range Variations in Taiwan. Environ. Res. Lett. 2017, 12, 074017. [Google Scholar] [CrossRef]
  42. Kottek, M.; Grieser, J.; Beck, C.; Rudolf, B.; Rubel, F. World Map of the Köppen-Geiger Climate Classification Updated. Meteorol. Z 2006, 15, 259–263. [Google Scholar] [CrossRef] [PubMed]
  43. Klein Tank, A.M.G.; Wijngaard, J.B.; Können, G.P.; Böhm, R.; Demarée, G.; Gocheva, A.; Mileta, M.; Pashiardis, S.; Hejkrlik, L.; Kern-Hansen, C.; et al. Daily Dataset of 20th-Century Surface Air Temperature and Precipitation Series for the European Climate Assessment. Int. J. Climatol. 2002, 22, 1441–1453. [Google Scholar] [CrossRef]
  44. Strandberg, G.; Bärring, L.; Hansson, U.; Jansson, C.; Jones, C.; Kjellström, E.; Kupiainen, M.; Nikulin, G.; Samuelsson, P.; Ullerstig, A. CORDEX Scenarios for Europe from the Rossby Centre Regional Climate Model RCA4; No. 116; SMHI: Norrköping, Sverige, 2015.
  45. Popke, D.; Stevens, B.; Voigt, A. Climate and Climate Change in a Radiative-Convective Equilibrium Version of ECHAM6. J. Adv. Model. Earth Syst. 2013, 5, 1–14. [Google Scholar] [CrossRef]
  46. Van Vuuren, D.P.; Edmonds, J.; Kainuma, M.; Riahi, K.; Thomson, A.; Hibbard, K.; Hurtt, G.C.; Kram, T.; Krey, V.; Lamarque, J.F.; et al. The representative concentration pathways: An overview. Clim. Chang. 2011, 109, 5. [Google Scholar] [CrossRef]
  47. Iturbide, M.; Bedia, J.; Herrera, S.; Baño-Medina, J.; Fernández, J.; Frías, M.D.; Manzanas, R.; San-Martín, D.; Cimadevilla, E.; Cofiño, A.S.; et al. The R-Based Climate4R Open Framework for Reproducible Climate Data Access and Post-Processing. Environ. Model. Softw. 2019, 111, 42–54. [Google Scholar] [CrossRef]
  48. Casanueva, A.; Herrera, S.; Iturbide, M.; Lange, S.; Jury, M.; Dosio, A.; Maraun, D.; Gutiérrez, J.M. Testing Bias Adjustment Methods for Regional Climate Change Applications under Observational Uncertainty and Resolution Mismatch. Atmos. Sci. Lett. 2020, 21, e978. [Google Scholar] [CrossRef]
  49. Varotsos, K.V.; Karali, A.; Lemesios, G.; Kitsara, G.; Moriondo, M.; Dibari, C.; Leolini, L.; Giannakopoulos, C. Near future climate change projections with implications for the agricultural sector of three major Mediterranean islands. Reg. Environ. Chang. 2021, 21, 16. [Google Scholar] [CrossRef]
  50. Karali, A.; Varotsos, K.V.; Giannakopoulos, C.; Nastos, P.P.; Hatzaki, M. Seasonal fire danger forecasts for supporting fire prevention management in an eastern Mediterranean environment: The case of Attica, Greece. Nat. Hazards Earth Syst. Sci. 2023, 23, 429–445. [Google Scholar] [CrossRef]
  51. Varotsos, K.V.; Dandou, A.; Papangelis, G.; Roukounakis, N.; Kitsara, G.; Tombrou, M.; Giannakopoulos, C. Using a New Local High Resolution Daily Gridded Dataset for Attica to Statistically Downscale Climate Projections. Clim. Dyn. 2023, 60, 2931–2956. [Google Scholar] [CrossRef]
  52. Efron, B. Better bootstrap confidence intervals. J. Am. Stat. Assoc. 1987, 82, 171–185. [Google Scholar] [CrossRef]
  53. Wilcox, R. Introduction to Robust Estimation and Hypothesis Testing; Academic Press: Amsterdam, The Netherlands; Boston, MA, USA, 2012. [Google Scholar]
  54. Varotsos, K.V.; Giannakopoulos, C.; Tombrou, M. Ozone-temperature relationship during the 2003 and 2014 heatwaves in Europe. Reg. Environ. Chang. 2019, 19, 1653–1665. [Google Scholar] [CrossRef]
  55. Jackson, L.S.; Forster, P.M. An empirical study of geographic and seasonal variations in diurnal temperature range. J. Clim. 2010, 23, 3205–3221. [Google Scholar] [CrossRef]
  56. Zhang, Y.; Shen, X.; Fan, G. Elevation-dependent trend in diurnal temperature range in the northeast China during 1961–2015. Atmosphere 2021, 12, 319. [Google Scholar] [CrossRef]
  57. Linacre, E. The effect of altitude on the daily range of temperature. J. Climatol. 1982, 2, 375–382. [Google Scholar] [CrossRef]
  58. Founda, D.; Santamouris, M. Synergies between urban heat island and heat waves in Athens (Greece), during an extremely hot summer (2012). Sci. Rep. 2017, 7, 10973. [Google Scholar] [CrossRef] [PubMed]
  59. Guan, X.; Cao, C.; Zeng, X.; Sun, W. Evidence of decreasing diurnal temperature range in eastern Northern Hemisphere. Environ. Res. Commun. 2022, 4, 031004. [Google Scholar] [CrossRef]
  60. Huang, X.; Dunn, R.J.; Li, L.Z.; McVicar, T.R.; Azorin-Molina, C.; Zeng, Z. Increasing Global Terrestrial Diurnal Temperature Range for 1980–2021. Geophys. Res. Lett. 2023, 50, e2023GL103503. [Google Scholar] [CrossRef]
  61. Stone, D.; Weaver, A. Factors contributing to diurnal temperature range trends in twentieth and twenty-first century simulations of the CCCma coupled model. Clim. Dyn. 2003, 20, 435–445. [Google Scholar] [CrossRef]
  62. Cox, D.T.; Maclean, I.M.; Gardner, A.S.; Gaston, K.J. Global variation in diurnal asymmetry in temperature, cloud cover, specific humidity and precipitation and its association with leaf area index. Glob. Chang. Biol. 2020, 26, 7099–7111. [Google Scholar] [CrossRef]
Figure 1. Geographical distribution of the selected cities in Europe (Map was created by using Google Earth Pro; Map data SIO, NOAA, U.S. Navy, NGA, GEBCO; Image Landsat; Image IBCAO).
Sustainability 15 12715 g001
Figure 2. Frequency distribution of DTR based on observations (1961–2019) grouped according to the climate class of each city, namely the (a) boreal climate, fully humid with warm summers (Dfb); (b) warm temperate climate, fully humid with hot (Cfa) and warm (Cfb) summers; (c) warm temperate climate with dry and hot summers (Csa) along with arid climates, cold steppe (BSk) and hot steppe (BSh) (bin size 1.0 °C).
Sustainability 15 12715 g002
Figure 3. Mean DTR per season sorted by climate class and latitude, based on observations (1961–2019).
Sustainability 15 12715 g003
Figure 4. Distribution of DTR for normal days (green boxplots), hot days (orange boxplots) and HW days (red boxplots) based on observations (1961–2019) in summer for all cities (ap). Inside the box, the white dot indicates the average and the horizontal line indicates the median. The box covers the 25–75% percentiles and whiskers range within 1.5 times of the interquartile range. The black rhombuses beyond the whiskers indicate outliers. The distinction between days (normal days, hot days, HW days) was made according to the defined criteria in Section 2.3.
Sustainability 15 12715 g004
Figure 5. Change of mean DTR per latitude along with the climate class between (a) hot days and normal days; (b) HW days and normal days, based on observations (1961–2019) in summer for all cities. The geographical distribution of the cities and other details regarding coordinates, altitude and climate class can be found in Figure 1 and Table 1, respectively. The distinction between days (normal days, hot days, HW days) was made according to the defined criteria in Section 2.3.
Sustainability 15 12715 g005
Figure 6. Projected DTR trends per decade sorted by latitude over the period 1971–2100 under (a) RCP4.5; (b) RCP8.5. Statistical significance at the 95% confidence level is based on Mann–Kendall trend analysis. Years in the parentheses denote the years when the trends become statistically significant. The abbreviation for the name of each city can be found in Table 1.
Sustainability 15 12715 g006
Figure 7. Comparison of seasonal distribution of DTR between the reference period (1971–2000) and the future period (2071–2100) under the RCP4.5 and the RCP8.5 for all cities (ap). Red asterisks indicate where the difference of mean DTR between the future period and the reference period is statistically significant at the 95% confidence level according to the bootstrap method. Inside the box, the white dot indicates the average and the horizontal line indicates the median. The box covers the 25–75% percentiles and whiskers range within 1.5 times of the interquartile range. The black rhombuses beyond the whiskers indicate outliers.
Sustainability 15 12715 g007
Figure 8. Seasonal changes of mean DTR for all cities sorted by latitude between the future period (2071–2100) and the reference period (1971–2000) under the RCP4.5 (ad) and the RCP8.5 (eh). Red dots indicate where the difference of mean DTR between the future period and the reference period is statistically significant at the 95% confidence level according to the bootstrap method. The abbreviation for the name of each city can be found in Table 1.
Sustainability 15 12715 g008
Figure 9. Comparison of DTR for normal days, hot days and HW days between the reference period (1971–2000) and the future period (2071–2100) under the RCP8.5 for all cities (ap). Inside the box, the white dot indicates the average and the horizontal line indicates the median. The box covers the 25–75% percentiles and whiskers range within 1.5 times of the interquartile range. The black rhombuses beyond the whiskers indicate outliers. The distinction between days (normal days, hot days, HW days) was made according to the defined criteria in Section 2.3.
Sustainability 15 12715 g009
Table 1. List of the studied cities along with the coordinates and the elevation of the respective stations as well as the climate class.
CityLongitude (deg.)Latitude (deg.)Elevation (m)Climate Class
Athens (ATH)23.7237.97107Csa
Barcelona (BAR)2.0741.294Csa
Berlin (BER)13.3052.4651Cfb
Bucharest (BUC)26.0844.5290Cfa
Helsinki (HEL)24.9660.3351Dfb
London (LON)−0.4551.4825Cfb
Madrid (MAD)−3.5640.47609BSk + Csa
Nice (NCE)7.2143.652Csa
Nicosia (NCO)33.4035.14160BSh
Oslo (OSL)10.7259.9494Dfb
Paris (PAR)2.3848.7289Cfb
Rotterdam (ROT)4.4551.96−4Cfb
Stockholm (STO)18.0559.3544Dfb
Vienna (VIE)16.3648.25198Cfb
Warsaw (WAR)20.9652.16107Dfb
Zurich (ZUR)8.5747.38555Cfb
Table 2. The 95th percentile of Tmax based on observations and simulations in the summer (June, July, August) over the 1971–2000 reference period for each city.
City95th Percentile of Tmax
(Observations)
95th Percentile of Tmax
(Simulations)
Athens36.936.9
Barcelona30.430.4
Berlin30.830.9
Bucharest34.434.2
Helsinki27.327.3
London29.028.9
Madrid37.737.7
Nice29.929.9
Nicosia40.340.2
Oslo27.627.5
Paris31.231.2
Rotterdam28.528.5
Stockholm28.428.3
Vienna31.431.4
Warsaw30.030.0
Zurich29.429.4
Disclaimer/Publisher’s Note: The statements, opinions and data contained in all publications are solely those of the individual author(s) and contributor(s) and not of MDPI and/or the editor(s). MDPI and/or the editor(s) disclaim responsibility for any injury to people or property resulting from any ideas, methods, instructions or products referred to in the content.

