Article

Comparative Analysis of Multi-Criteria Decision Making and Life Cycle Assessment Methods for Sustainable Evaluation of Concrete Mixtures

Department of Engineering Technology, Texas State University, San Marcos, TX 78666, USA
Sustainability 2023, 15(17), 12746; https://doi.org/10.3390/su151712746
Submission received: 27 July 2023 / Revised: 16 August 2023 / Accepted: 17 August 2023 / Published: 23 August 2023

Abstract

:
In previous literature, multi-criteria decision-making (MCDM) methods and life cycle assessment (LCA) methods, integrating different properties, have been applied to cementitious materials separately. This study addresses the existing gap in the research by comparing LCA methods with durability parameters integrated and MCDM methods in concrete mixtures. The aim is to assess the differences between these two approaches when assessing the overall sustainability of cementitious materials. Concrete mixtures containing conventional and recycled materials, such as supplementary cementitious materials (SCMs) and recycled concrete aggregate (RCA), are evaluated based on their mechanical properties, durability parameters, environmental impact, and cost. The results highlight the positive impact of SCM usage on concrete performance and emphasizes the importance of reducing cement content for sustainability. Careful RCA utilization is crucial due to the variable outcomes when combined with SCMs. The results also exhibit that various MCDM methods show acceptable differences when ranking concrete mixtures, offering flexibility in property weighting for concrete applications. In contrast, different LCA methods with durability integrated yield higher differences, emphasizing the superior consistency of MCDM methods. The sensitivity analysis highlights the significance of weight methods and concrete parameters. Standardizing procedures for specific concrete applications is recommended to ensure the reliability and relevance of results.

1. Introduction

In recent times, sustainability has emerged as a critical consideration across various industries, and the construction sector is no exception. Among the materials commonly used in construction, concrete plays a significant role due to its versatility, strength, and durability. Concrete is currently the second most used material (after water) and the most used construction material worldwide [1,2]. Despite its widespread use, the environmental impact of concrete production cannot be ignored, especially concerning one of its key components: the cement. The production of cement is responsible for 5–8% of total CO2 emissions every year due to the enormous demand for this material in various structures, such as bridges or dams [3,4,5,6]. This has led to a growing emphasis on the sustainability of concrete materials, driven by the urgent need to optimize resource utilization and minimize its environmental footprint.
Evaluating the sustainability of concrete involves considering several key factors. Firstly, the selection of locally available raw materials and recycled materials, including supplementary cementitious materials (SCM), plays a crucial role in improving its environmental impact [7,8,9]. Secondly, assessing the manufacturing process is crucial, with a strong emphasis on minimizing energy consumption and greenhouse gas emissions [10,11,12]. Additionally, recycling and reusing concrete waste, such as utilizing recycled concrete aggregates (RCA), contribute to sustainability efforts by reducing landfill waste and conserving valuable resources [13,14,15,16,17]. Lastly, evaluating the longevity of concrete materials is instrumental in identifying opportunities for design improvements and maintenance strategies that extend their service life [18,19,20].
One of the most effective ways to assess the sustainability of cementitious materials is through life cycle assessments (LCAs). LCAs are a systematic approach used to evaluate the environmental impacts of a product, process, or activity throughout its entire life cycle, from raw material extraction to disposal [21,22]. By analyzing the different life stages of concrete materials, LCAs offer a comprehensive perspective on environmental impacts, encompassing factors such as energy consumption, greenhouse gas emissions, water usage, waste generation, and ecological footprints. Conducting LCAs provides valuable insights into the effectiveness of different sustainable approaches, such as the addition of SCMs in concrete materials.
Previous research has shown that incorporating various SCMs in cement composites can significantly improve the environmental impact of concrete materials [23,24,25,26,27]. For instance, adding fly ash (FA) can effectively reduce the environmental impact when the replacement percentage is below 40% [23,25]. However, concerns have arisen due to the decreasing availability of fly ash, which could lead to increased material costs and transportation impacts [26]. Another widely used SCM, ground granulated blast furnace slag (GGBFS), has been identified as a better alternative in terms of overall environmental performance [23,25]. Notably, the incorporation of GGBFS not only reduces cement content and thus the material’s environmental impact but also accelerates CO2 uptake during concrete’s service life, leading to a reduction in the CO2 emissions associated with these materials [28,29].
Despite the advantages of traditional recycled materials, such as SCMs, their limited availability necessitates exploring new options that can be utilized in concrete materials without compromising their properties [23,24]. As part of this exploration, promising results have been observed with other materials, like RCA, in terms of reducing natural resource depletion and waste generation [9,14,30]. However, it is essential to consider the functional unit used, as concrete mixtures containing RCA may exhibit higher impacts compared with conventional mixtures with natural aggregate (NA) [31,32]. Factors such as greater transportation distances, the lower availability of RCA plants, and potential reductions in concrete properties when RCA is included in the mix design contribute to this difference [8,31,32].
Overall, LCAs enable decision-makers to compare different alternatives, identify hotspots where environmental improvements can be made, and make informed choices to minimize negative environmental impacts. However, the parameters included in the analysis can influence the outputs [33]. In an LCA, different concrete mixtures are compared using a functional unit (FU), which is a normalized unit used to provide results. This functional unit may include various concrete parameters, such as compressive strength or durability. While previous literature has successfully included mechanical properties in the analysis due to the ease of estimating this property [8,34,35], integrating concrete durability parameters presents challenges. While this integration leads to a more reliable analysis, it also increases the complexity of the study, making it less intuitive for real-life applications. As a result, different studies have employed various methods to estimate the service life and longevity of concrete mixtures [20,36,37,38], making standardization difficult due to the complexity and the wide range of available tests.
To simplify the decision-making process, new methods, like Multi-Criteria Decision Making (MCDM), have emerged to enhance the analysis of LCA by incorporating additional factors beyond traditional environmental impacts. MCDM techniques enable the integration of multiple criteria and stakeholder preferences into decision-making processes [39]. These methods utilize mathematical models and decision algorithms to systematically compare and rank different alternatives based on multiple criteria. MCDM facilitates the consideration of trade-offs between environmental impacts, economic costs, social benefits, and durability parameters, enabling a more balanced decision-making approach. Previous investigations have shown that MCDM methods can be successfully used in concrete materials [40,41,42,43,44,45,46]. For instance, Kurda et al. [40] utilized a novel MCDM method to assess the overall sustainability of cementitious materials, validating this approach to analyze non-traditional materials in terms of mechanical properties, cost, environmental impact, and service life. Other studies employed standardized MCDM methods, such as Technique for Order Preference by Similarity to Ideal Solution (TOPSIS), to select different alternatives in building construction, demonstrating the accuracy of these methods in selecting the best alternative [44,45]. However, the results are highly affected by the weighting scenarios, requiring an appropriate selection of these weights [47].
Despite these advances, in previous literature, MCDM methods and LCA methods, integrating different properties, have been applied to cementitious materials separately, and their comparison remains unknown. Additionally, it is still not clear what method is more effective when analyzing the overall sustainability of concrete mixtures. To address this gap, the aim of this study is to compare MCDM methods with traditional LCA methods, integrating different properties, in order to assess the overall sustainability of cementitious materials. For this purpose, typical concrete mixtures with different materials will be analyzed, and a literature review will be conducted to estimate their properties, enabling a comprehensive sustainable analysis. After this, different widely used MCDM methods and LCA methods with properties included will be employed in the analysis to compare their effectiveness. The analysis will involve examining various options of each group, including a sensitivity analysis of the results. Figure 1 shows the flow diagram of how the study was performed.

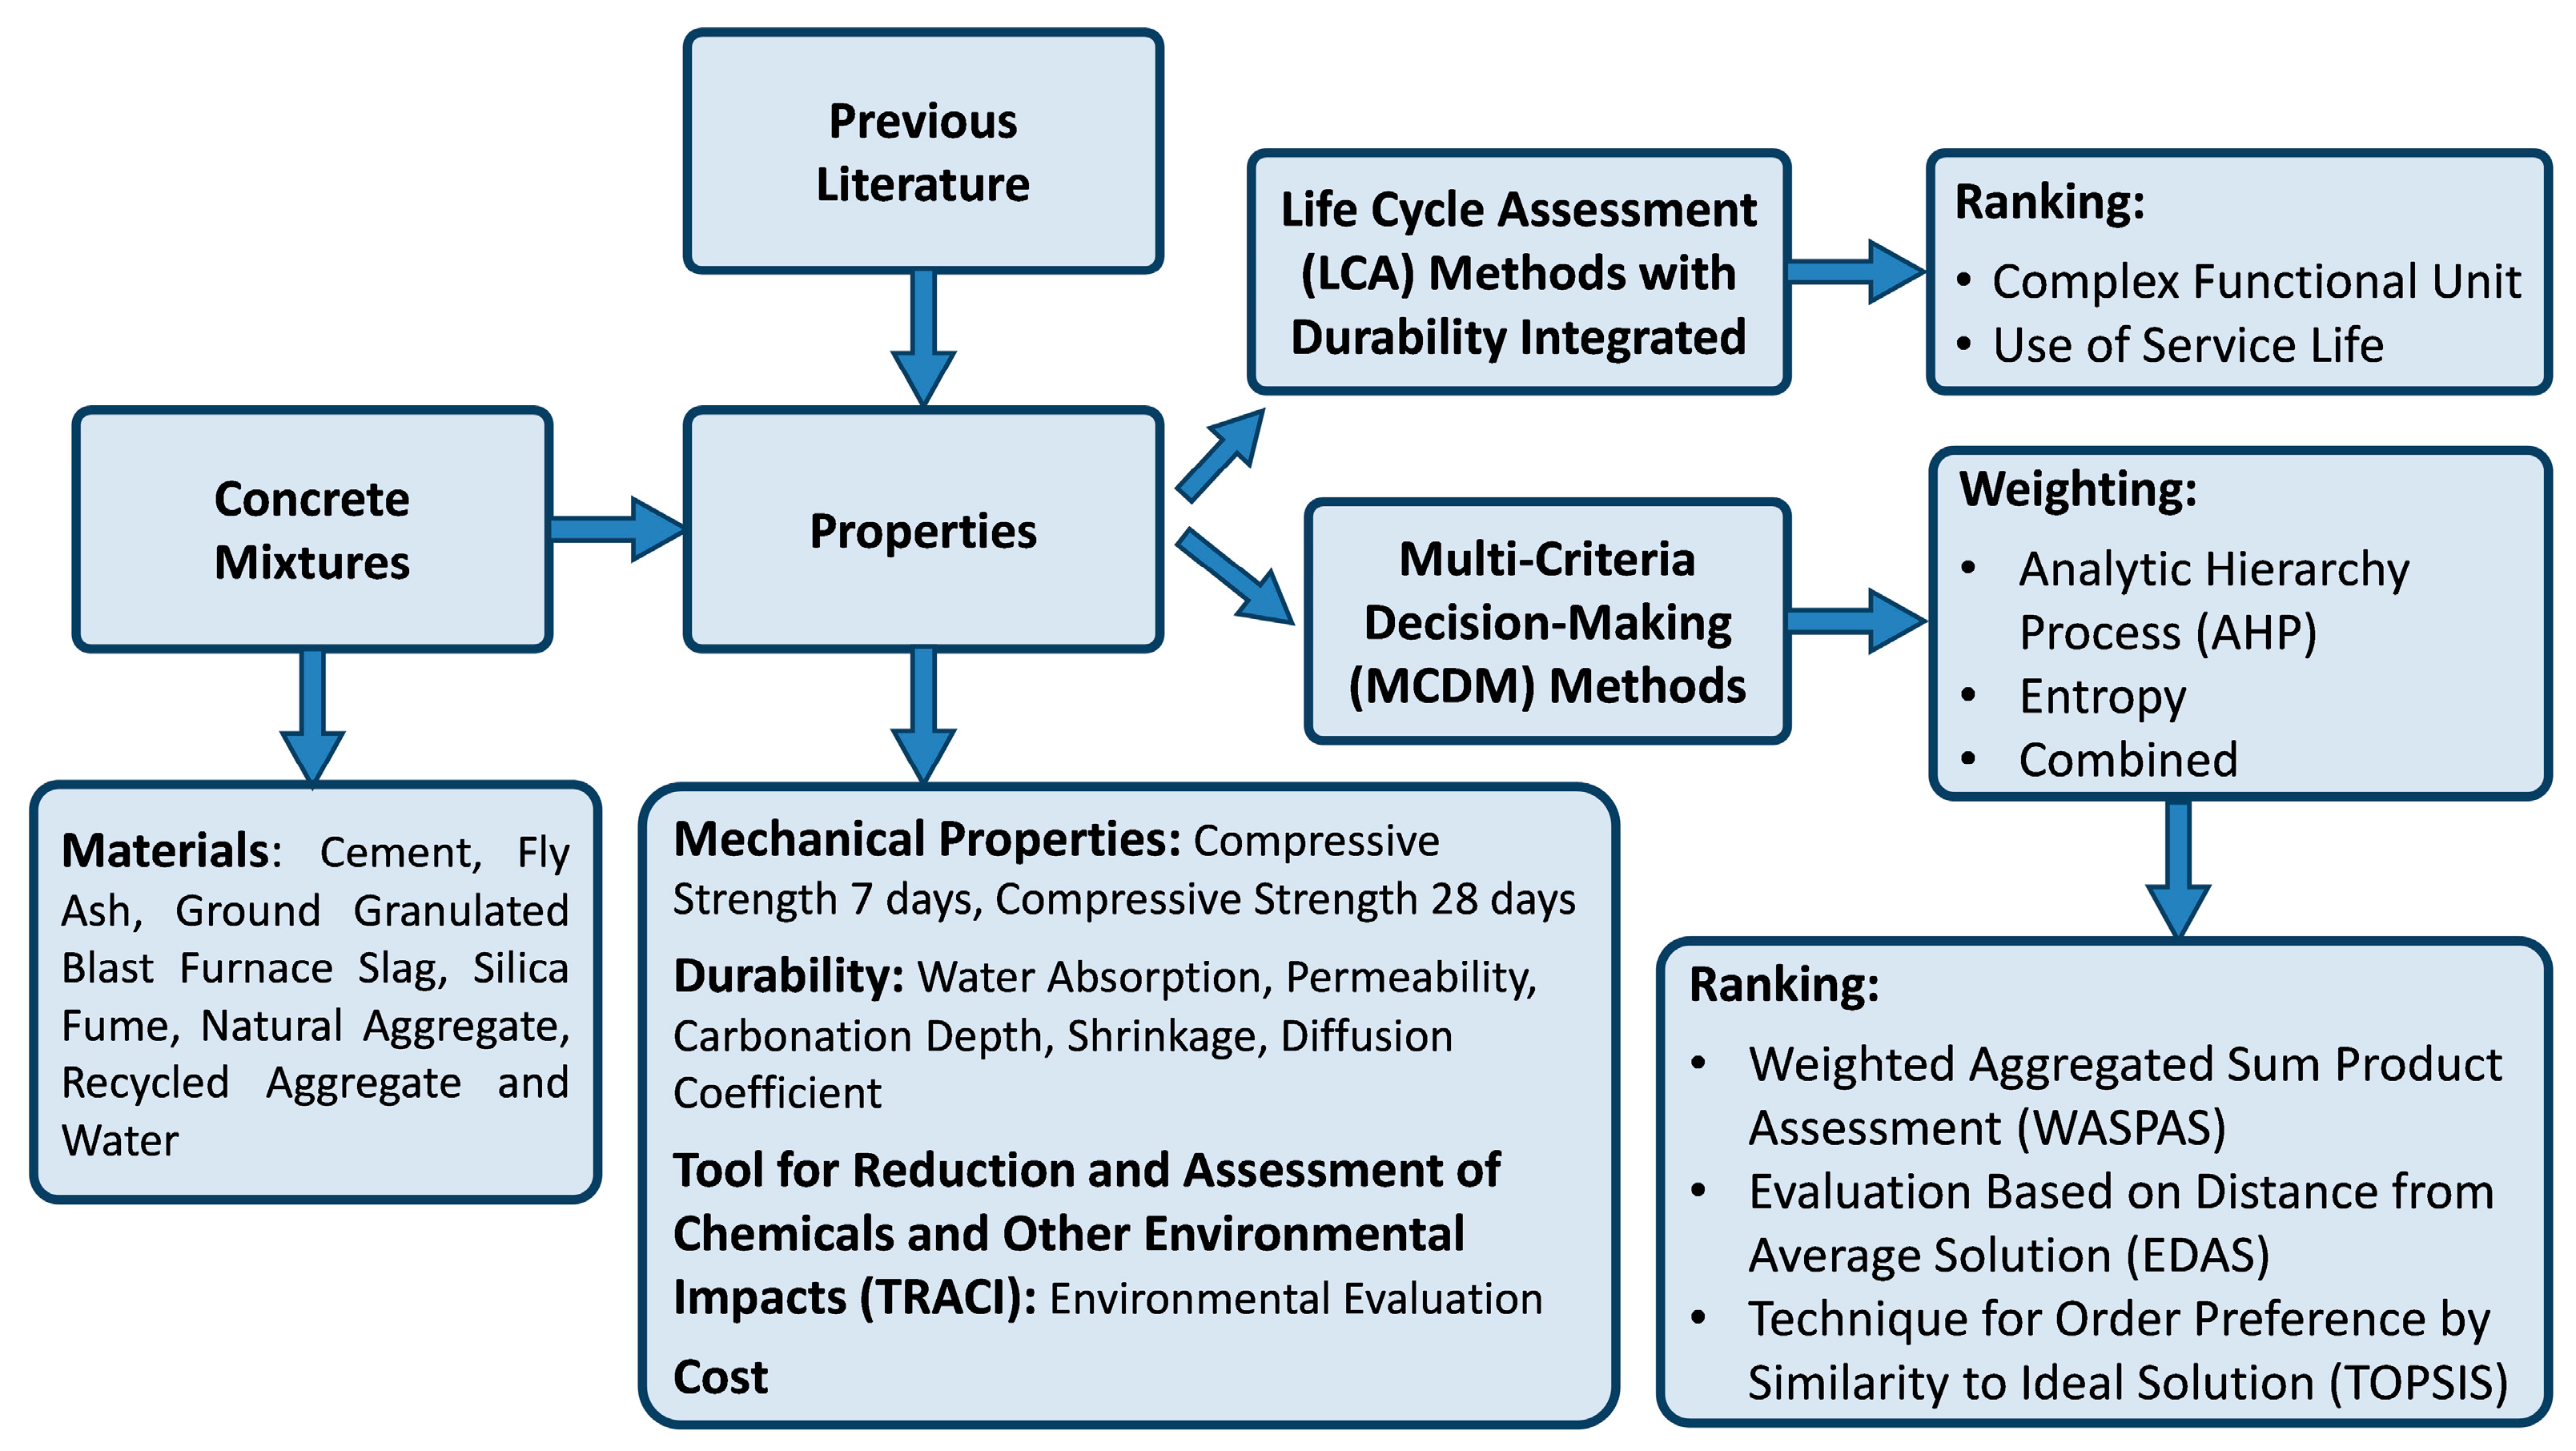
2. Materials and Methods

2.1. Determination of the Mix Design for the Selected Mixtures

This study aimed to develop an optimal approach for integrating various material properties into sustainability analysis, with a focus on investigating the impact of various SCMs and types of aggregate on the final outcomes. Twelve mixtures were used to conduct this research. Four different binder compositions were employed, namely (i) 100% ordinary Portland cement (OPC), (ii) 80% OPC and 20% FA Class F, (iii) 70% OPC and 30% GGBFS, and (iv) 90% OPC and 10% Silica Fume (SF). To ensure consistency, all cementitious materials were replaced based on their mass. Additionally, three different aggregate compositions were incorporated, comprising the following: (1) 100% NA, (2) 50% NA + 50% RCA, and (3) 100% RCA.
Throughout the study, the water-to-binder ratio (w/b) remained constant across all mixtures, ensuring a standardized approach. It was assumed that in each examined mixture, the cement paste (cement + water) constituted 30% of the concrete volume, while the remaining 70% consisted of natural aggregate, comprising 28% fine aggregate and 42% coarse aggregate.
The nomenclature of the samples followed the convention of CX-Y, where ‘X’ denoted the RCA content (i.e., 0%, 50%, or 100%) and “Y” represented the type of SCM used, such as “R” for reference, “F” for fly ash, “G” for slag, and “S” for silica fume. Detailed mixture proportions for each studied concrete can be found in Table 1.
Once the mixture proportions of the concretes were chosen, a comprehensive literature review was conducted to estimate the various properties of the different mixtures [19,48,49,50,51,52,53,54,55,56,57,58,59,60,61,62]. The sustainability analysis in this study encompasses mechanical properties, durability, environmental performance, and cost.
In terms of mechanical properties, the compressive strength is chosen as the main parameter. This choice is substantiated by its significance in assessing material performance. The analysis focuses on two specific ages, 7 and 28 days. The selection of the 28-day compressive strength measurement is based on its widespread use as a standard for assessing long-term strength in concrete materials. Concurrently, the selection of the 7-day value offers insights into the early-stage performance of these concrete compositions. The assessment of durability properties encompasses several crucial parameters that provide insights into the concrete’s long-term performance: (i) Water Absorption (WA); (ii) Permeability; (iii) Carbonation Depth (CD); (iv) Shrinkage; and (v) Diffusion Coefficient (DC). Table 2 presents the values for all mechanical and durability properties used in this study. A further explanation for the environmental impact and cost analysis will be provided in the subsequent section.

2.2. Life Cycle Assessment (LCA) Methods with Integration of Concrete Parameters

2.2.1. LCA Estimation

To evaluate the environmental impact, the “Tool for the Reduction and Assessment of Chemical and other Environmental Impacts” (TRACI) methodology is employed. This methodology offers a comprehensive framework for assessing and quantifying the environmental consequences associated with the concrete mixtures.
To carry out this assessment, this study follows the stages of an LCA methodology, which is based on the internationally recognized standards ISO 14040 [21] and ISO 14044 [22].

2.2.2. Goal and Scope Definition

The initial stage of the LCA process involves defining the purpose, boundaries, and objectives of the assessment. The goal and scope statement serves as a guide, outlining the specific system to be evaluated, the functional unit, the intended applications of the assessment, and any assumptions or limitations. This stage is crucial in establishing the groundwork for the entire LCA process.
In this study, a “cradle-to-gate” approach was chosen for the system boundary. This boundary enables the quantification of the embodied environmental impacts of the concrete material, encompassing the stages from raw material extraction (cradle) to concrete production (gate). By considering this boundary, the assessment focuses on the most significant stages that contribute to the environmental impact of a concrete mixture.
The chosen FU for the assessment was 1 m3 of concrete. This unit serves as a reference for comparing and quantifying the environmental impacts of different concrete mixtures. It is important to note that, at this stage, other specific concrete properties, such as compressive strength or durability parameters, were not included. These properties will be considered in the overall analysis to avoid redundancy and ensure a comprehensive evaluation.

2.2.3. Life Cycle Inventory (LCI)

In this stage, data on inputs and outputs associated with the life cycle of the product, process, or activity being assessed are collected and compiled. This includes information on raw material extraction, energy consumption, emissions, waste generation, and transportation at each life cycle stage. The LCI provides a comprehensive inventory of the environmental flows associated with the system under study.
As an initial step in the LCI stage, it is important to collect data on the inputs (such as energy and materials) and outputs (including emissions and waste) associated with the production of each material. This data collection process ensures a thorough understanding of the environmental impacts at every stage of the life cycle. In this study, the data were obtained from the ecoinvent database [63], a reliable and widely used source of life cycle inventory data. Additionally, transport distances were collected from the Life Cycle Inventory of Portland Cement Concrete [64], which provides specific information on different SCMs and aggregate types.
Furthermore, a previous study [65] estimated the CO2 uptake during the demolition and crushing process of RCA. They quantified the amount of CO2 absorbed to be 10.8 kg per ton. Consequently, this value is subtracted from the CO2 produced during RCA pre-treatment to consider this beneficial effect.

2.2.4. Life Cycle Impact Assessment (LCIA)

In the LCIA stage, the collected inventory data are analyzed and evaluated to determine its potential environmental impacts. This assessment involves examining the inventory data within predetermined impact categories, such as climate change, ozone depletion, resource depletion, human toxicity, and ecosystem damage. Various characterization models and indicators are utilized to quantify and assess the potential impacts across different life cycle stages.
In this study, the TRACI methodology (mid-point approach, by U.S EPA) was used to estimate the total environmental impact of the mixtures. Nine categories included in the TRACI methodology were used to analyze the environmental impact of the studied mortars: (i) Acidification Potential (AP); (ii) Global Warming Potential (GWP); (iii) Eutrophication Potential (EP); (iv) Ozone Depletion Potential (ODP); (v) Particulate Matter Formation (PMF); (vi) Smog Formation (SF); (vii) Ecotoxicity–Freshwater (ET-FW); (viii) Human Toxicity–Carcinogenic (HT-C); and (ix) Human Toxicity–Non-Carcinogenic (HT-NC). Table 3 presents the LCIA data for the different raw materials and processes for the environmental categories that were analyzed in this study.
The LCIA data are standardized by converting them into a common unit according to the category indicator. To estimate the relative contribution of each substance to each impact category, normalization factors obtained from databases created by the U.S. Environmental Protection Agency (EPA) [66] are applied. By utilizing these normalization factors, the impacts per year are calculated and compared across the different mixtures.

2.3. Cost Analysis

In addition to the LCA results, this investigation also considers the cost analysis of each studied concrete mixture to evaluate its feasibility in the industry. To accomplish this, average unit cost data from various sources were obtained and utilized [67,68,69]. Table 4 presents the cost of the raw materials per unit weight in US dollars. The total cost of each mixture was computed by multiplying the unit prices of the raw materials by the weight of each raw material per unit volume (m3).
Table 5 presents the results of the environmental performance, in terms of impacts per year, and cost for all studied mixtures. Regarding the cost, it is worth noticing that mixtures with RCA possess higher costs than concretes with NA. This price increase can be attributed to a few factors. First, the availability of natural raw materials for NA tends to be abundant, which can contribute to its relatively lower cost compared with RCA. Second, the transportation distances involved in sourcing RCA can be greater than those for NA, as mentioned in the previous literature [31]. Since RCA plants might be limited in number and may not be located in close proximity to construction sites, the transportation of RCA over longer distances can increase the overall cost. Nonetheless, this is expected to change in the future with taxes and regulations promoting the use of RCA that could balance these prices.
Moreover, the use of SCMs decreased the cost of concrete mixtures between 7 and 12%, except for the ones that used SF (because SF is more expensive than OPC). Therefore, in terms of cost, the use of these recycled materials (i.e., FA and GGBFS) is beneficial compared with traditional OPC. In contrast, careful use should be taken when employing SF in concrete mixtures since the cost can rise up by 19% depending on the aggregate type used.

2.4. LCA Methods with Integration of Concrete Parameters

2.4.1. Complex Functional Units

In this study, several traditional LCA methods will be evaluated. The first LCA method has concrete parameters integrated in the analysis by utilizing complex FUs, as in Panesar et al. (2017) [33]. For that, nine different concrete parameters are used in the analysis, which include the two mechanical properties, five durability parameters (shown in Table 2), TRACI value, and cost (presented in Table 5). It is worth mentioning that volume is also included as a functional unit since all concrete mixtures are normalized by 1 cubic meter. Equations (1a) and (1b) show how the FU of each parameter is calculated based on the relative property of the base material and each alternative concrete material that is modeled. If the property is beneficial, Equation (1a) is used, while Equation (1b) is employed when the property is not beneficial.
F U i , j = P r o p e r t y   j   a l t e r n a t i v e m a t e r i a l   i P r o p e r t y   j   r e f e r e n c e m a t e r i a l
F U i , j = P r o p e r t y   j   r e f e r e n c e m a t e r i a l P r o p e r t y   j   a l t e r n a t i v e m a t e r i a l   i
After calculating all the different functional units, we combined them to take all the concrete parameters into account. Equation (2) presents the functional unit used to compare the different concrete mixtures.
C o m p l e x   F U i = j F U i , j

2.4.2. Inclusion of Service Life into the Assessment

The second LCA method utilizes a service estimation approach for various concrete mixtures. This method leverages laboratory durability parameters to estimate the lifespan of the concrete. Specifically, it employs the Life−365 Service Life Prediction Model TM, developed by Ehlen, Thomas, and Bentz in 2001 [70]. Previous studies have successfully employed this software to predict the service life of concrete mixtures based on their diffusivity coefficient [71,72]. The values from Table 2 and Table 5 were used in the analysis. To ensure coherence, only one parameter from each group (mechanical properties, durability, environmental impacts, and cost) was considered, as including more parameters would lead to units that lack meaning. Equation (3) demonstrates the calculation involved in the service life method for the various concrete mixtures.
S e r v i c e   L i f e   M e t h o d i = T R A C I   R e s u l t i C o s t i C o m p r e s s i v e   S t r e n g t h i S e r v i c e   Y e a r s i

2.5. Multi-Criteria Decision-Making Analysis

2.5.1. Weighting of Criteria

After the LCA methods, different MCDM methods were used to compare them with the traditional methods. For that, all the properties shown in Table 2 (mechanical and durability parameters) and Table 5 (TRACI value (environmental impact) and cost) were used. The chosen weighting scenario involves assigning weights to general business scenarios, considering typical weights of the category group based on the importance of properties in concrete materials. This scenario considers a weight of 40% for mechanical properties and cost and 10% for durability parameters and environmental impact.
After that, to select the different weights for each mechanical property and durability parameter inside their group, three different options were utilized: (i) the Analytic Hierarchy Process (AHP) method, (ii) the Entropy method, and (iii) the Combined method. Detailed explanations of these methods will be provided in the upcoming sections.
Combining the two different weight scenarios and the three options for the groups with two or more properties, six different situations were studied for all concrete mixtures.
  • AHP Method
The AHP method, introduced by Saaty [73], is a valuable tool for determining the relative weights of predefined criteria (w, aj). This method facilitates the assessment of the relative importance of each criterion or alternative within a decision-making problem through pairwise comparisons. To express these comparisons, the Saaty Fundamental Scale is utilized, which consists of nine semantic values converted into numerical integers ranging from 1 to 9. These values represent different degrees of relevance between criteria, where 1 signifies equal importance and 9 indicates extreme significance of one criterion over another. Table 6 presents the scale to compare criteria in pairs.
During the decision-making process, industry experts are requested to choose one of the nine semantic alternatives on the fundamental scale for each criterion comparison, thus creating customized questionnaires for each decision-maker. The gathered judgments are used to form a comparison matrix, where the rows and columns represent the involved criteria. Each position (aij) in the matrix represents the expert’s judgment regarding the relative comparison between criteria i and j, utilizing Saaty’s fundamental scale. It is important to note that the inverse values of the scale can also be utilized in filling the comparison matrix. This inclusion is significant because if criterion i is considered significantly more relevant than criterion j, then criterion j should be equally considered less relevant compared with i. Consequently, AHP comparison matrices are always reciprocal, ensuring that if aij = x, then aji = 1/x. Equation (4) shows the comparison matrix A.
A = a i j = a 11 1 / a 21 a 21 a 22 1 / a n 1 1 / a n 2 a n 1 a n 2 a n n
where aij is the relative comparison between criteria i and j; i = 1, 2, …, m; j = 1, 2, …, m.
Once the comparison matrix is constructed, the AHP method enables the determination of criterion weights (w,ai) by extracting the eigenvector associated with the largest eigenvalue of the comparison matrix. Equation (5) shows the calculation of each criterion weight.
w , a i = j = 1 n a i j / i = 1 n a i j n
However, to ensure mathematical validity, the comparison matrix must exhibit consistency. Saaty [73] introduced a method for analytically assessing the consistency of the matrix, known as the Consistency Index (CI), which is calculated according to Equation (6).
C I = λ m a x n n 1
where λmax is the largest eigenvector and n is the number of properties used.
The consistency ratio (CR) was computed to evaluate the consistency of each judgment, following the outlined procedure. It is worth noting that when a judgment is entirely consistent, the CR value is 0. However, due to the inherent biases and uncertainties inherent in decision-making involving human participation, a consistency ratio below 0.1 is considered acceptable for this study. Equation (7) outlines the calculation for obtaining the CR.
The Random Index (RI) is directly associated with the size of the matrix used. Table 7 shows the RI value for various decision-making scenarios. Since we used this analysis for mechanical properties, with 2 attributes, and durability parameters, with 5, their RI were 0.00 and 1.12, respectively. However, irrespective of the number of attributes, the consistency of pairwise comparison matrices was rigorously evaluated. In cases where inconsistencies were identified in the judgments, the respective questionnaires were excluded from the analysis.
C R = C I R I
  • Entropy Method
The entropy weight method (EWM) is a widely studied and applied model for determining information weights [74,75]. In contrast to subjective weighting models, the EWM offers a significant advantage by eliminating the influence of human factors on indicator weights, thus improving the objectivity of comprehensive evaluation results [76]. By relying exclusively on unbiased data, the EWM approach effectively overcomes the limitations of subjective weighting methods [77]. Therefore, in this study, the incorporation of the EWM aims to minimize potential biases associated with stakeholder-based weighting.
The basic process of the Entropy objective weighting method can be summarized as follows.
Step 1. Create a standard decision-making matrix (Equation (8)) with m evaluated alternatives and n criteria for each alternative.
X = x i j = x 11 x 12 x 21 x 22 x 1 n x 2 n x m 1 x m 2 x m n
where xij is the evaluated value of ith alternative on jth criterion; i = 1, 2, …, m; j = 1, 2, …, n.
Step 2. Normalize the standard decision-matrix using Equation (9).
y i j = x i j i = 1 n x i j
where yij is the normalized value of data of the standard decision-making matrix.
Step 3. Compute the normalized Entropy values using Equation (10).
e j = h · i = 1 m y i j · ln y i j
in which h = 1/ln (m)
Step 4. Calculate the Entropy objective weight (w,e) for each criterion as in Equation (11).
w , e j = 1 e j j = 1 n ( 1 e j )
where j = 1 n w , e j = 1
  • Combined Method
The combination weighting method offers a comprehensive approach that considers both subjective and objective weights of the evaluation criteria. In the “multi-criteria decision” evaluation method, the assigned weight to each criterion significantly influences the evaluation outcome and the selection of the optimal solution. By utilizing the combination weighting method, potential biases arising from individual subjective or objective weights can be alleviated.
The weights obtained from the AHP method and the entropy weight method are represented as w,a = (w,a1, w,a2, …, w,an) and w,e = (w,e1, w,e2, …, w,en), respectively. The calculation of a combined weight that integrates both the subjective and objective weights of the n criteria can be expressed as Equation (12).
w , c j = w , a j · w , e j j = 1 n w , a j · w , e j

2.5.2. Preference Ranking

As mentioned earlier, this study integrates three MCDM methodologies: (1) Weighted Aggregated Sum Product Assessment (WASPAS), (2) Evaluation Based on Distance from Average Solution (EDAS), and (3) Technique for Order Preference by Similarity to Ideal Solution (TOPSIS). These methodologies were chosen to create a unified index that can rank the alternatives and identify the most favorable options.
  • WASPAS
In 2012, Zavadskas et al. [78] introduced the WASPAS method, which is a robust analysis technique for Multi-Criteria Decision Making (MCDM). This method integrates two widely recognized MCDM approaches, namely the weighted sum model (WSM) and the weighted product model (WPM), to leverage their respective strengths and achieve a comprehensive evaluation. The following steps delineate the procedure for implementing the WASPAS method.
Step 1. Establish the standard decision-making matrix X = [xij] where xij is the evaluated value of ith alternative on jth criterion; i = 1, 2, …, m; j = 1, 2, …, n.
Step 2. Normalize the standard decision matrix depending on whether the data for each criterion are beneficial (the highest value is desired, Equation (13a)) or non-beneficial (the lowest value is desired, Equation (13b)).
x ¯ i j = x i j max j x i j , ( i = 1 , 2 , , m ; j = 1 , 2 , , n )
x ¯ i j = min j x i j x i j , ( i = 1 , 2 , , m ; j = 1 , 2 , , n )
where maxj is the maximum value of criterion j and minj is the minimum value of criterion j.
Step 3. Calculate the weighted normalized decision matrix based on the WSM and WPM approaches using Equations (14a) and (14b), correspondingly.
W S M i = j = 1 n x ¯ i j w j , ( i = 1 , 2 , , m ; j = 1 , 2 , , n )
W P M i = j = 1 n ( x ¯ i j ) w j , ( i = 1 , 2 , , m ; j = 1 , 2 , , n )
where wj is the weight assigned to each criterion.
Step 4. Utilize Equation (15) to apply a unified generalized criterion (λ) that combines the WSM and WPM methods.
W A S P A S i = λ · W S M i + 1 λ · W P M i
where WASPASi represents the joint performance score value for each alternative. The parameter λ ranges from 0 to 1. When λ is set to 1, the ranking is determined based on the WSM method, while a value of 0 assigns ranking according to the WPM method. In this study, to ensure an equal weighting of the importance of both WSM and WPM, a commonly employed value for the joint generalized criterion λ is 0.5.
Once the WASPAS values for all alternatives have been acquired, they are then organized in a ranking order according to their respective values. Notably, a higher value on this scale indicates a greater level of environmental friendliness associated with the alternative.
  • EDAS
Initially presented as a ranking technique by Keshavarz Ghorabaee et al. [79,80], the EDAS method employs a measurement of distance from the average solution, which is connected to the best alternative approach. This method employs two metrics: positive distance from the average and negative distance from the average, offering insights into the degree to which each alternative option deviates from the average solution. One notable advantage of the EDAS method, which distinguishes it from other MCDM ranking methods and is often favored by researchers [81], is its distinctive normalization approach based on the average solutions for each criterion. The ranking process of EDAS encompasses the following steps.
Step 1. Establish the standard decision-making matrix X = [xij] where xij is the evaluated value of ith alternative on jth criterion; i = 1, 2, …, m; j = 1, 2, …, n. Subsequently, the average solution for all criteria can be obtained using Equation (16).
N j = i = 1 n x i j a
where a is the total criteria.
Step 2.a. Calculate the positive distance from the average (PDAij) by applying Equation (17a) when the criterion type is positive and Equation (17b) when the criterion type is negative.
P D A i j = max 0 , x i j N j N j
P D A i j = max 0 , N j x i j N j
Step 2.b. Calculate the negative distance from the average (NDAij) by applying Equation (18a) when the criterion type is positive and Equation (18b) when the criterion type is negative.
N D A i j = max 0 , N j x i j N j
N D A i j = max 0 , x i j N j N j
Step 3. Determine the weighted sum of PDAij (positive distance from the average) and NDAij (negative distance from the average) for the alternatives by utilizing Equation (19a) for PDAij and Equation (19b) for NDAij.
S P i = j = 1 n w j · P D A i j
S N i = j = 1 n w j · N D A i j
where SPi is the weighted sum of PDAij and SNi is the weighted sum of NDAij.
Step 4. Normalize SPi and SNi values using Equations (20a) and (20b), respectively.
N S P i = S P i m a x i ( S P i )
N S N i = 1 S N i m a x i ( S N i )
where NSPi and NSNi are the normalized values for SPi and SNi, respectively.
Step 5. Calculate the performance score for each alternative in the EDAS method (EDASi) by using Equation (21).
E D A S i = 1 2 · N S P i + N S N i
Upon obtaining the EDAS values for all alternatives, the next step involves arranging them in a ranking order based on their respective values. It is worth highlighting that a higher value on this scale corresponds to a higher sustainability attributed to the particular alternative.
  • TOPSIS
The TOPSIS method was introduced by Hwang and Yoon in 1981 [82]. This method ranks alternatives by calculating the Euclidean geometric distance for each option. The ideal alternative is determined by having the shortest distance to the positive ideal solution and the greatest distance from the negative ideal solution. The subsequent steps provide an overview of the implementation process for the TOPSIS method.
Step 1. Establish the standard decision-making matrix X = [xij] where xij is the evaluated value of ith alternative on jth criterion; i = 1, 2, …, m; j = 1, 2, …, n.
Step 2. Normalize the standard decision-making matrix using Equation (22).
x ¯ i j = x i j i = 1 m x i j 2 , ( i = 1 , 2 , , m ; j = 1 , 2 , , n )
Step 3. Compute the weighted normalized decision matrix V= [vij] by performing element-wise multiplication between the normalized standard decision-making matrix and the previously determined weights [wj], using Equation (23).
v i j = x ¯ i j w j , ( i = 1 , 2 , , m ; j = 1 , 2 , , n )
Step 4. Identify the positive and negative ideal solutions by employing Equation (24a) for benefit criteria (associated with K) and Equation (24b) for non-benefit or cost criteria (associated with K’).
V 1 + , , V n + = m a x i v i j j ϵ K m i n i v i j j ϵ K ' ) } , ( i = 1 , 2 , , m )
V 1 , , V n = m i n i v i j j ϵ K m a x i v i j j ϵ K ' ) } , ( i = 1 , 2 , , m )
Step 5. Calculate the separation distances from the positive and negative ideal solutions by applying Equation (25a) for the positive ideal solution and Equation (25b) for the negative ideal solution.
S i + = j = 1 n v i j v j + 2 , ( i = 1 , 2 , , m ; j = 1 , 2 , , n )
S i = j = 1 n ( v i j v j ) 2 , ( i = 1 , 2 , , m ; j = 1 , 2 , , n )
where Si+ and Si are the deviation distances from the positive and negative ideal solutions, respectively.
Step 6. Calculate the performance score for each alternative in the TOPSIS method (TOPSISi) by using Equation (26). The TOPSIS values range from 0 to 1, with higher values indicating a better evaluation of alternatives.
T O P S I S i = S i S i + + S i , ( i = 1 , 2 , , m )
After acquiring the TOPSIS values for all the available alternatives, the subsequent task is to arrange them in a ranked sequence according to their individual values. A greater value on this scale aligns with an increased level of sustainability attributed to the specific alternative.

3. Results and Discussion

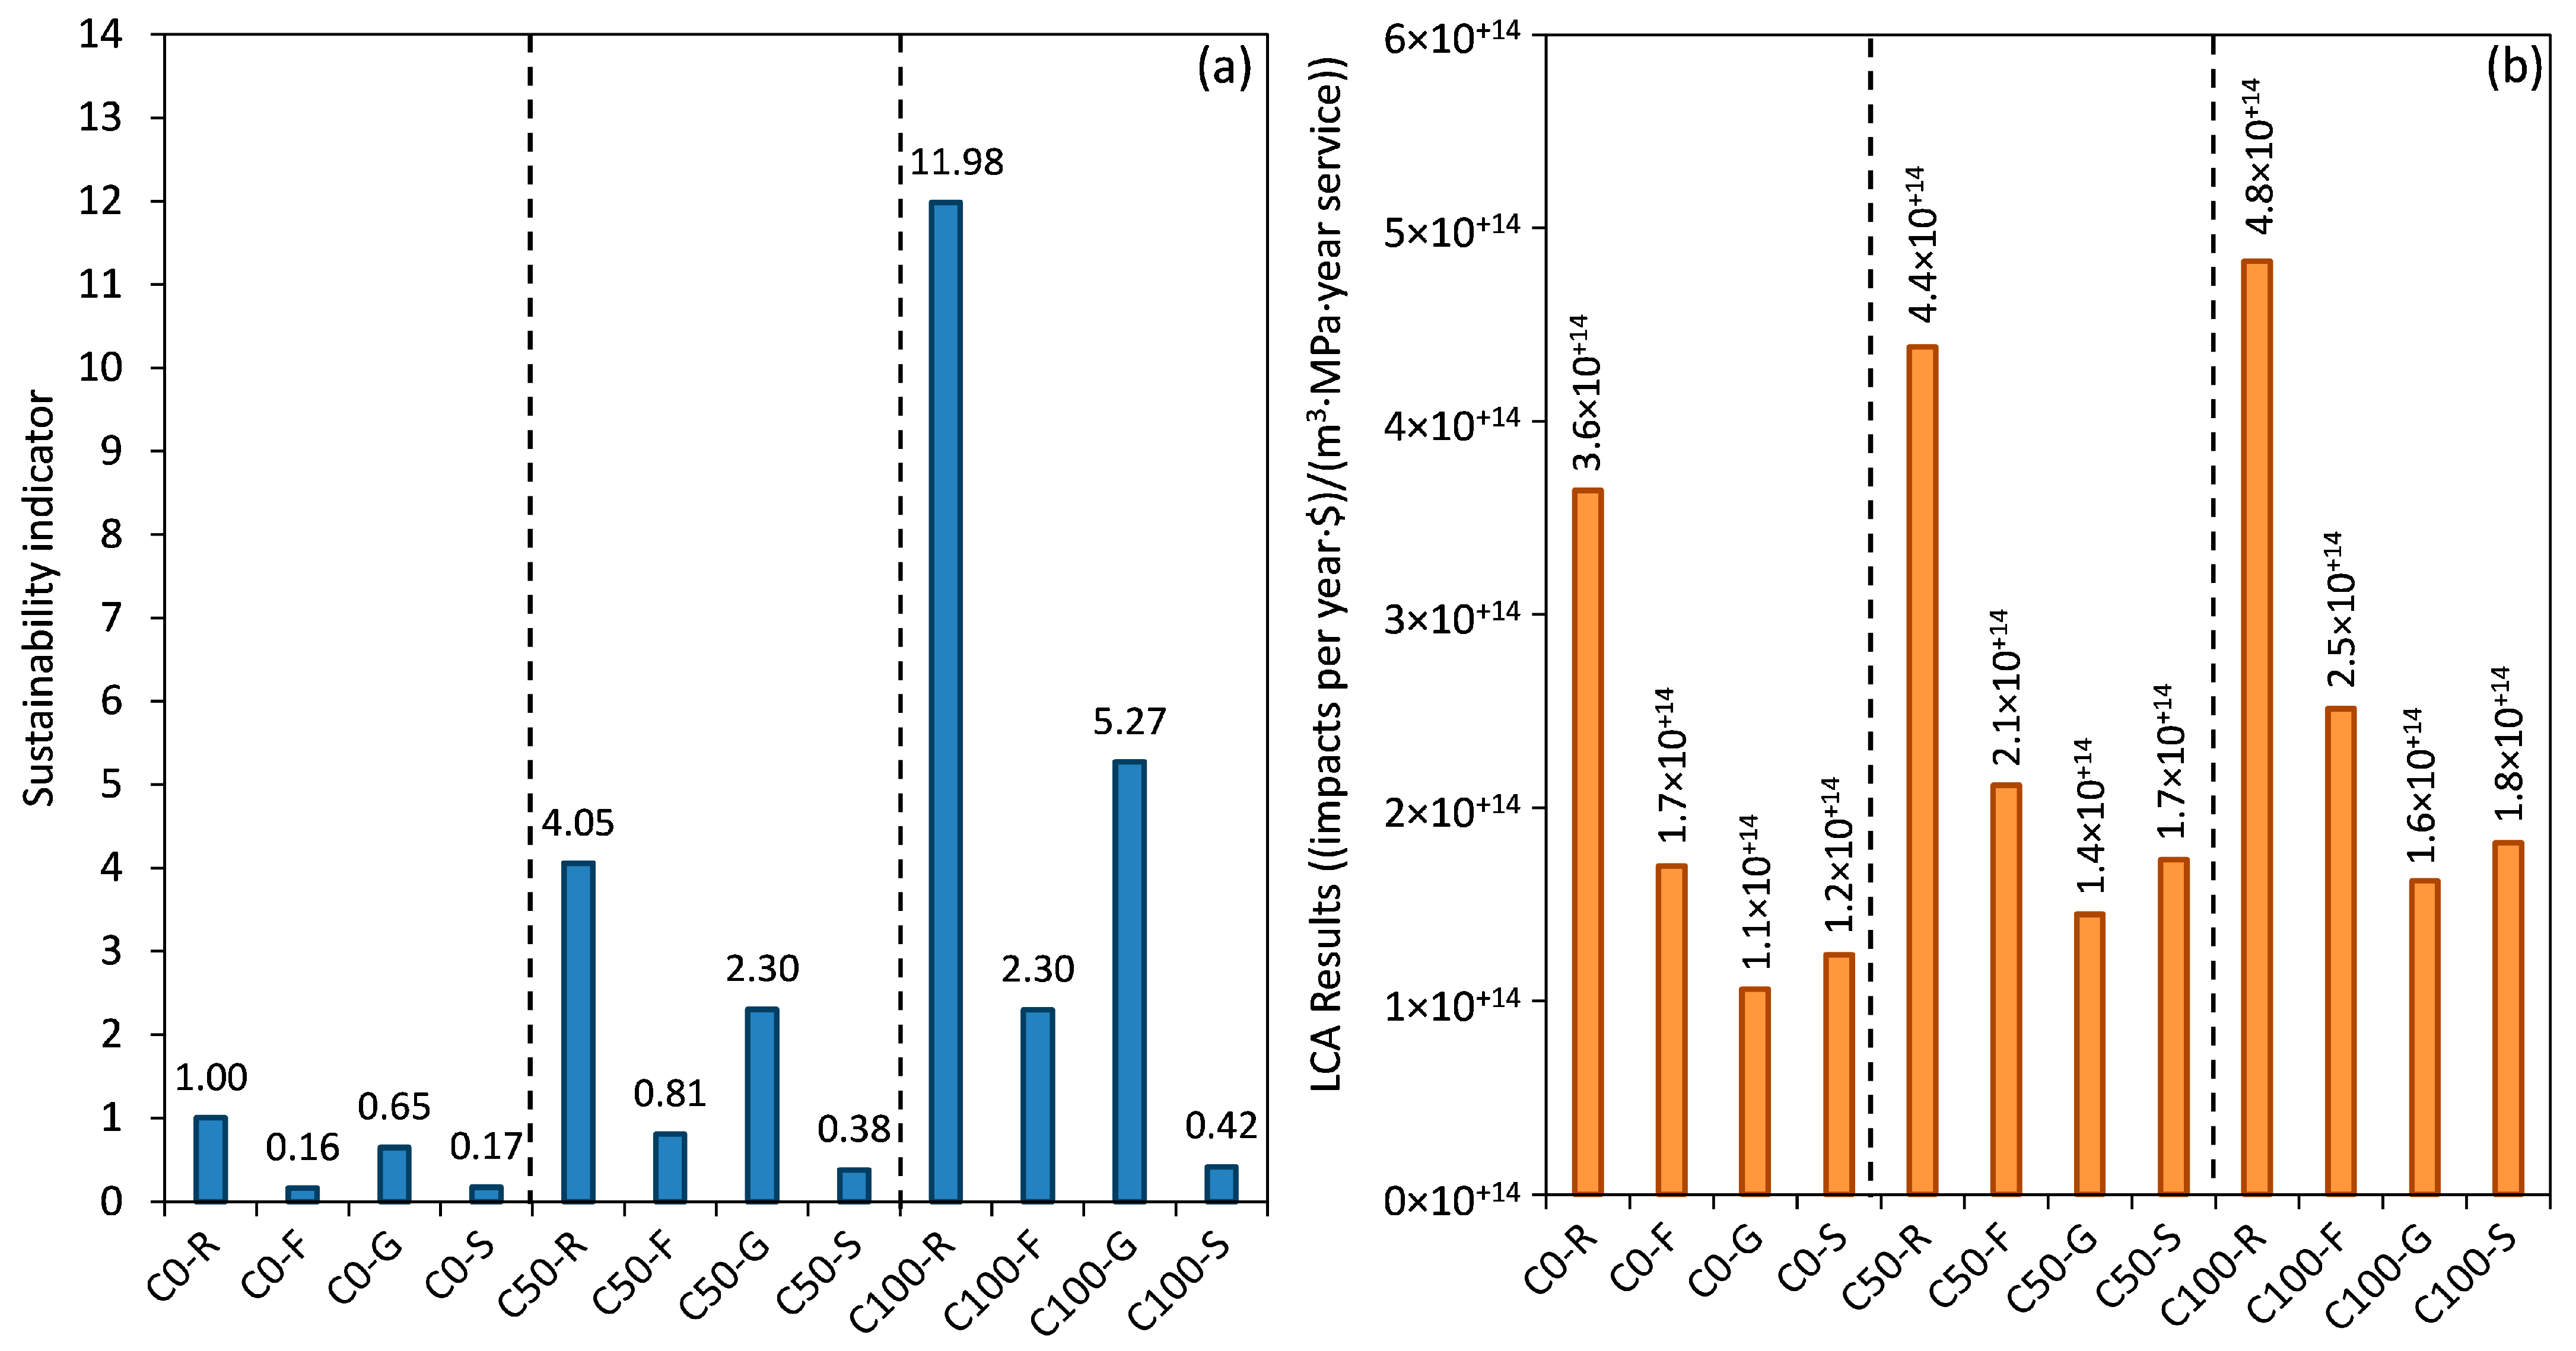
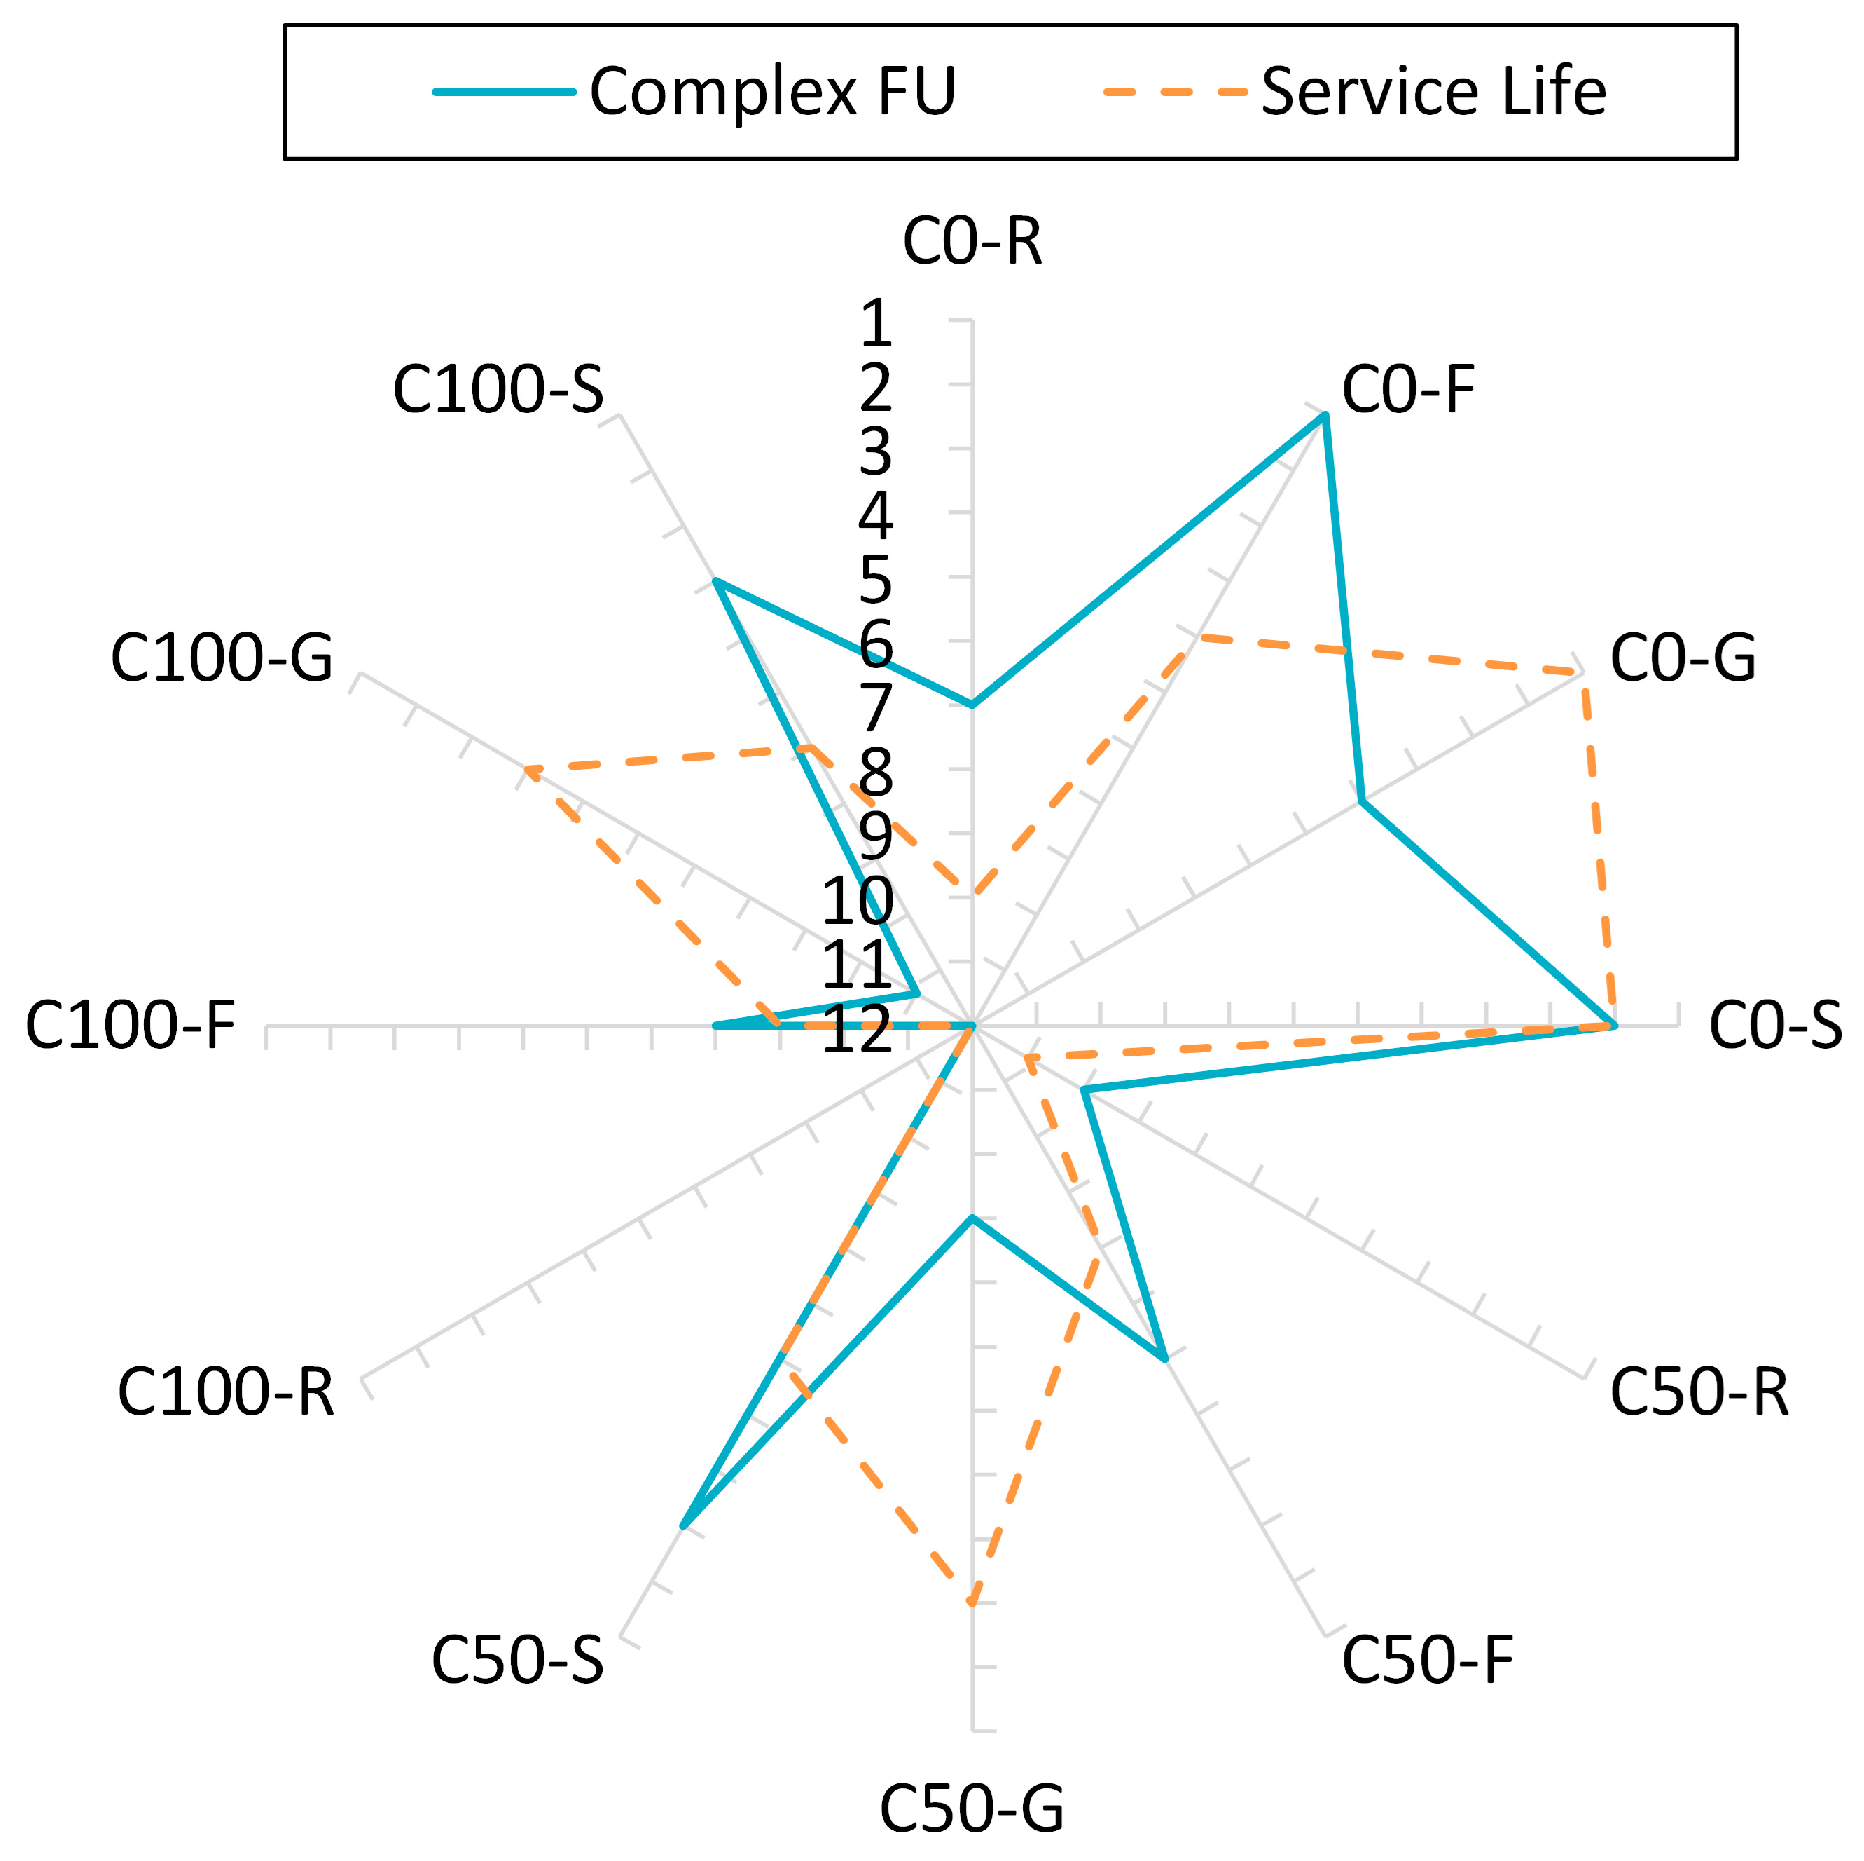
3.1. Results of LCA Methods with Properties Integrated in the Analysis

The results of different LCA methods with integrated durability are presented in Figure 2. The figure is divided into two parts, Figure 2a and Figure 2b, each providing specific insights into the sustainability indicators in the complex FU method and the results when including service life in the analysis.
In Figure 2a, which focuses on complex FUs, the environmental impact of all concrete mixtures is depicted, where higher values indicate lower environmental performance. The results showed that the utilization of RCA (partial or total) did not lead to an improvement in environmental performance compared with the corresponding mixtures with NA, such as C50-F compared with C0-F. This can be attributed to the lower durability performance of RCA concrete, considering the five parameters included in the analysis. Regarding the effect of SCMs, the addition of SF consistently demonstrated the best environmental performance across all studied mixtures when compared with their corresponding references, such as C100-S compared with C100-R. Furthermore, the influence of the aggregate used on environmental performance was observed, as the effectiveness of SCMs varied depending on the presence of RCA. For example, while C0-G exhibited a sustainability indicator that was 306% higher than C0-F, C100-G showed a sustainability indicator that was 129% higher than C100-F.
Figure 2b focuses on the impacts per year of each mixture, considering different material parameters, including service life. Similar to Figure 2a, mixtures containing RCA showed higher environmental impacts compared with those with NA. However, the extent of change compared with the previous LCA method (Figure 2a) differed. For instance, the complete replacement of NA with RCA (C100-R) showed a 33% increase in environmental impact compared with C0-R. This lower percentage increase can be attributed to the fewer durability parameters considered, as in this case, only service life was taken into account. When it comes to the effect of SCMs, these consistently demonstrated the best performance across all mixtures. Unlike the previous LCA method (Figure 2a), the differences in the use of different aggregate types showed smaller variations (in percentage) when comparing the effectiveness of different SCMs. For example, while C50-G exhibited a performance that was 19.6% better than C50-S, C100-G showed a performance that was 12.1% better than C50-S. The reason is attributed to the bigger absolute value of the service life method and thus the lower relative differences between concrete mixtures. In addition, the service life method contains less properties included (1 per category), so less parameters are included in the analysis. This could also be another reason because the addition of RCA highly affects the properties of concrete and, therefore, the relative variations between mixtures.
In summary, the different LCA methods incorporating durability consistently indicate that the addition of SCMs provides better environmental performance compared with mixtures containing only OPC, regardless of the type of aggregate used. However, the use of RCA does not enhance the environmental performance of concrete compared with the corresponding mixtures with NA. Additionally, the choice of aggregate significantly influences the environmental performance due to its properties and interaction with SCMs.
Figure 3 presents the average rankings for various concrete mixtures analyzed using different LCA methods with durability integrated in the analysis. A lower average ranking indicates a more environmentally friendly concrete mixture.
The results obtained through the service life method reveal that mixtures containing 100% OPC generally have lower rankings compared with mixtures incorporating SCMs, regardless of the type of aggregate used. For example, the average ranking for C50-R falls between 10 and 11, while the average ranking for C50-F ranges between 6 and 8. Among the different SCMs studied, their rankings varied depending on the LCA method used. For instance, GGBFS exhibited the highest ranking when considering service life, but the worst ranking when using the complex FU method.
Regarding the type of aggregate used, the results showed that the inclusion of RCA did not significantly improve the rankings of the different mixtures. When comparing C50 and C100 mixtures with their corresponding C0 counterparts, both with and without SCMs, all of them demonstrated worse rankings. Moreover, the type of aggregate used affected the optimal SCM addition. For example, in the complex FU results, C0-F had a higher ranking compared with C0-S, whereas C50-F had a lower ranking than C50-S.
The interplay between optimal SCM addition and aggregate type yields intriguing results. The ranking discrepancies between C0-F and C0-S and between C50-F and C50-S emphasize the influence of aggregate selection on the performance of SCM-enhanced mixtures. This further underscores the need for a holistic evaluation that considers both SCM dosage and aggregate characteristics to determine the most sustainable concrete formulation.

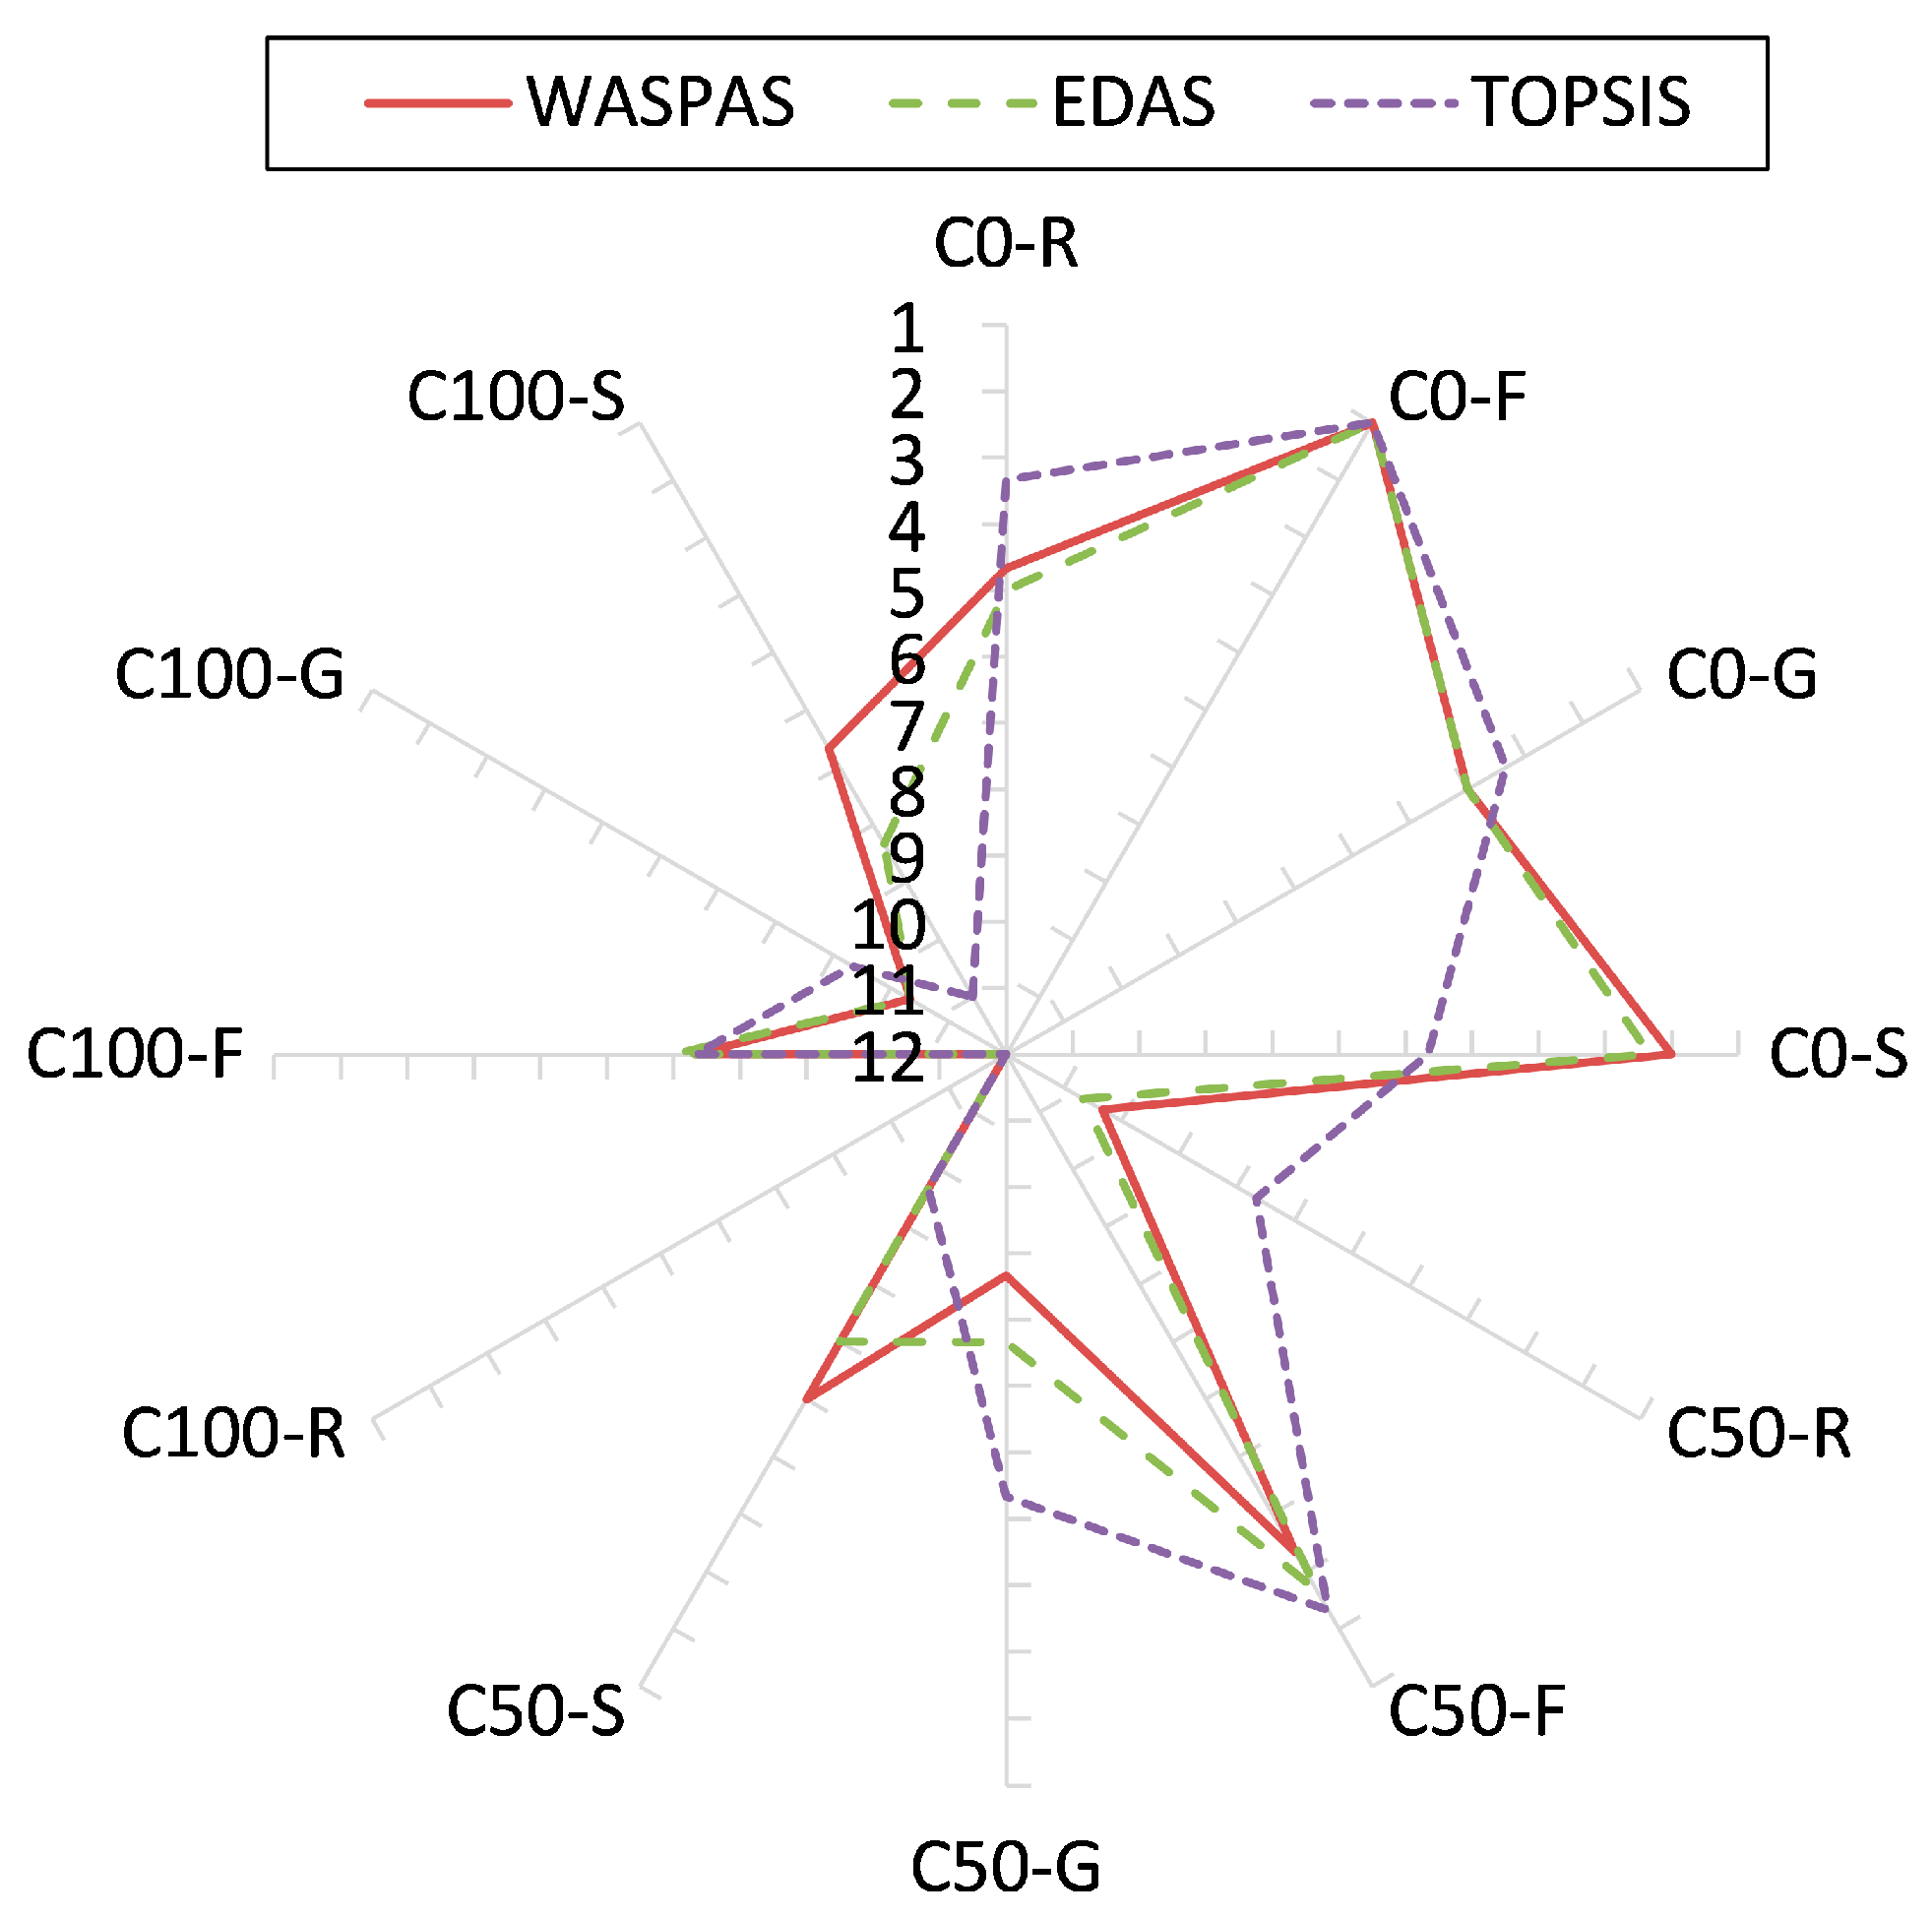
3.2. Multi-Criteria Decision-Making (MCDM) Methods

Table 8 illustrates the assigned weights for various scenarios, providing valuable insights into their impact on the final decision and enabling sensitivity analysis. The weights were derived from two distinct scenarios, offering a comprehensive understanding of their influence.
Regarding mechanical properties, the subjective method (AHP) assigned higher weights to compressive strength at 28 days, while the objective method (entropy) showed the opposite trend. However, in the combined method, compressive strength at 28 days possessed a higher weight than 7-day compressive strength. This finding aligns logically with the general consideration of long-term strength being more crucial than early strength.
Moving on to durability, noticeable differences emerged between the AHP and entropy methods. The subjective AHP method indicated higher percentages associated with the diffusion coefficient and permeability. Conversely, the objective entropy method assigned higher weights to shrinkage and lower weights to carbonation depth. This disparity indicates that certain properties exhibit greater variation among the mixtures, allowing for a more accurate comparison. Nevertheless, the results suggest that the diffusion coefficient is the most important durability parameter based on the combined method weights.
Overall, Table 8 offers valuable insights into the weights assigned to different scenarios. These findings enhance our understanding of the decision-making process and its sensitivity to different scenarios and property assessments.
Figure 4 illustrates the total scores obtained from various MCDM methodologies using combined weighting. Each MCDM method calculates the total score based on different parameters, resulting in varying absolute values. Higher values indicate better performance.
In the case of the WASPAS method, the results show relatively similar scores across all mixtures, ranging between 0.7 and 0.9. This suggests that the use of SCMs is beneficial for increasing the total score of concrete mixtures, regardless of the type of aggregate. FA addition exhibits the best performance. Additionally, the use of RCA generally decreases the total score compared with mixtures with NA. However, interestingly, the mixture C50-F demonstrates a better score than the C0-R and C0-G mixtures. This suggests that the addition of FA is advantageous for improving the overall score when applying the WASPAS method, making it the most effective SCM overall among those studied.
The results obtained through the EDAS method show more pronounced differences compared with the WASPAS method. Mixtures with SCM additions generally exhibit significantly higher scores compared with their corresponding mixtures without SCMs. For example, the mixture C0-F achieves a score 41.4% higher than the C0-R. Similar to the WASPAS results, the use of RCA influences the effect of SCM inclusion. While C0-F shows a 29.5% higher score than C0-G, the percentage difference between C100-F and C100-G is 40.4%.
The TOPSIS method yields similar results to the previous methods. Mixtures with 100% OPC display lower performance compared with mixtures incorporating SCMs, with FA addition being the best one among the studied SCMs. The use of RCA also reduces performance compared with mixtures with NA.
Overall, the findings suggest that the use of SCMs is beneficial for improving the overall performance of concrete mixtures when considering various parameters in the analysis (holistic approach). This highlights the importance of reducing cement content for sustainability purposes. Furthermore, the results emphasize the need for the cautious utilization of RCA, as different replacement percentages may yield different effects, particularly when SCMs are also included in the mixture.
Figure 5 presents the results obtained from all the MCDM methods studied. The results consistently indicate that mixtures without SCMS are ranked lower than their corresponding mixtures, regardless of the MCDM method employed. Overall, concretes containing FA exhibit the best performance among the studied mixtures.
When examining the differences between the MCDM methods, TOPSIS exhibits higher variations compared with the other two methods (WASPAS and EDAS). TOPSIS results also indicate better performance for mixtures with GGBFS compared with the other two methods. However, when using the TOPSIS method, SF addition demonstrates worse performance compared with the results obtained from WASPAS and EDAS. Notably, the most significant difference between the methods is observed in C0-S mixtures. While the average ranking of C0-S is 5.7 using TOPSIS, the same mixture achieves an average ranking of 2.0 and 2.3 when evaluated with WASPAS and EDAS, respectively.
These differences between the various MCDM methods could be attributed to the underlying reasoning behind each approach. While WASPAS and EDAS estimate the variation of each mixture compared with an average or general solution, TOPSIS uses the best mixture as the reference for comparison with the other mixtures. Nonetheless, it is crucial to note that all MCDM methods consistently showed similar results among all studied mixtures. Therefore, choosing a specific MCDM method may not be a critical factor when comparing concrete mixtures based on these findings. This cohesiveness in results highlights that the broader conclusions drawn about the sustainability of concrete mixtures remain robust and consistent.

3.3. LCA Methods with Durability Integrated vs. MCDM Methods

Table 9 presents the rankings for the different mixtures using MCDM and LCA methods with integration of durability.
Substantial differences exist between the MCDM and LCA methods. For example, MCDM assigns a ranking ranging from 2.3 to 3.3 for the C50-F mixture, whereas the LCA methods rank this mixture as 6 and 8. This indicates that the choice of methodology greatly influences the results. However, the rankings for the reference mixtures show minimal differences, as each method yields similar rankings for these mixtures, particularly C50-R and C100-R.
It is worth mentioning that even though different MCDM methods show variations in rankings for the studied mixtures, the various LCA methods with durability included exhibit higher differences. In fact, if we calculate the average standard deviation for both groups (MCDM and LCA methods), LCA methods have more than twice the standard deviation of MCDM methods. This demonstrates the better consistency of MCDM methods when analyzing concrete materials.
Moreover, these methods can be compared to determine which one is more appropriate when analyzing the sustainability of concrete mixtures. Different applications may require different focuses. MCDM methods are seen as more useful because the properties’ weights can be adjusted depending on the application of the concrete structure, providing greater flexibility and adaptability in decision-making processes. MCDM methods can also be employed iteratively, allowing for real-time adaptation as new data become available or as project requirements evolve. This dynamic nature is particularly advantageous in the construction industry, where conditions and priorities can change over the course of a project’s lifecycle.
Additionally, MCDM methods encourage active stakeholder involvement throughout the decision-making process. This collaborative approach fosters transparency, as decisions are not solely based on mathematical calculations but also consider input from various stakeholders. This can result in more well-rounded and informed choices that align with broader sustainability objectives.

3.4. Sensitivity Analysis

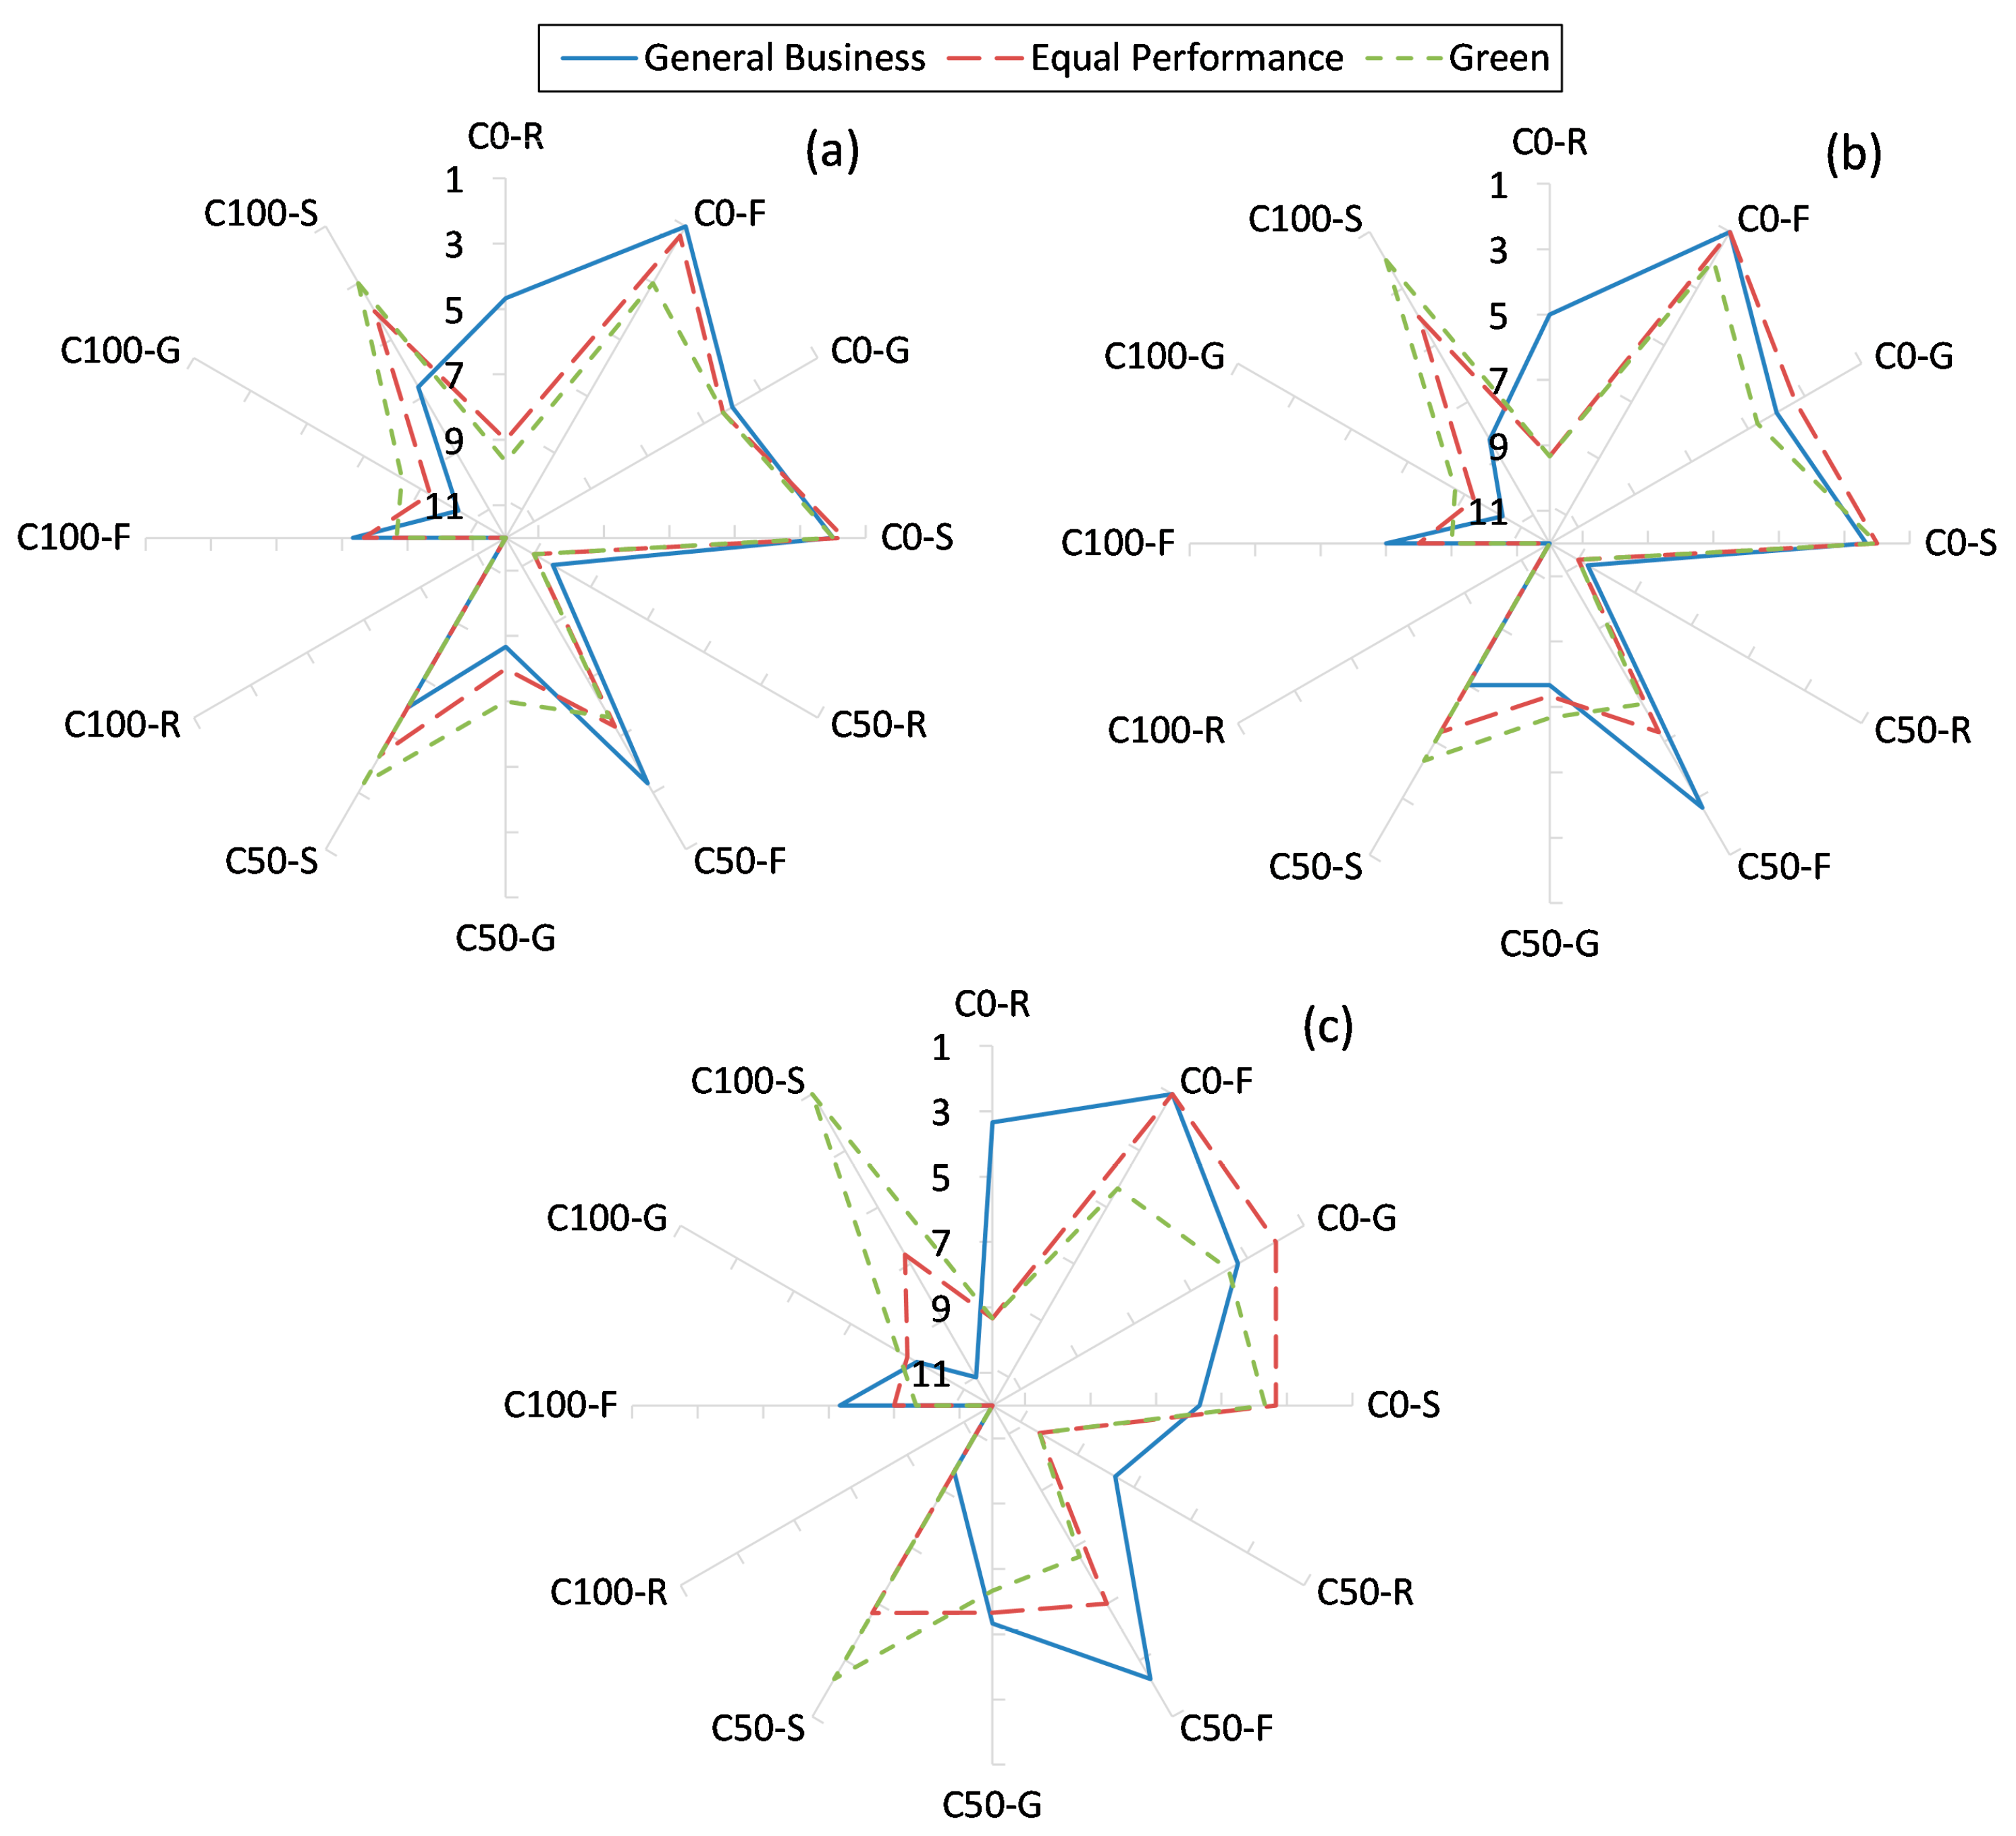
3.4.1. Effect of Weighting Scenarios in the Results of MCDM Methods

It is important to highlight that decision-making processes can employ various types of weighting methods. To conduct a sensitivity analysis, two additional weighting scenarios, apart from the general business one, were considered for criteria elicitation. In the first additional scenario, an equal weightage approach was adopted, assigning the same weight (25%) to all criteria. In the second scenario, mechanical properties and cost were given a weight of 10%, while durability parameters and environmental impact were assigned a weight of 40%, signifying the importance of environmentally friendly parameters (referred to as “green” for clarity). Figure 6 presents the average rankings for various mixtures obtained through different MCDM methodologies and diverse weight scenarios.
Notably, the effects of SCMs are influenced by the chosen weight scenarios across all MCDM methods. For example, in the green weight scenario, mixtures incorporating SF achieve higher average rankings compared with other scenarios, such as general business and equal performance scenarios. This can be attributed to the higher weights assigned to durability parameters and the lower weight of cost, which addresses the principal drawback of SF addition, in the green scenario. While GGBFS addition exhibits similar effects as concrete with SF, the trends are reversed for mixtures with FA. In this case, the general business scenario proves to be the most beneficial for FA mixtures due to the combined effect of strength development and cost reduction, resulting in a positive impact on overall performance.
The results indicate that the choice of weight method influences the rankings regardless of the MCDM methodology used. Therefore, it is crucial to select appropriate weights that consider the most important parameters for each specific application. It is worth noting that the TOPSIS method exhibits greater differences compared with WASPAS or EDAS due to using the best mixture as the reference for comparison.
Furthermore, while this study evaluated different weight scenarios to account for potential differences, it is suggested that standardized weights be designed for specific concrete applications. This standardization would ensure consistency and facilitate meaningful comparisons in these analyses.

3.4.2. Effect of Number of Categories Used in the Analysis

This sensitivity analysis focuses on evaluating the effect of using a smaller number of categories. To achieve this, the assessment was repeated with the exclusion of certain mechanical and durability parameters, leaving only one parameter per group. Specifically, the following parameters were removed: (1) compressive strength at 7 days; (2) water absorption; (3) permeability; (4) carbonation depth; and (5) shrinkage.
Figure 7 visually represents the sum of the ranking changes resulting from variations in the number of categories used, underscoring the significance of the number and categories employed when classifying different concrete mixtures. Notably, the service life methodology, which already utilizes a reduced number of categories, did not impact the overall ranking, and therefore is not included in this figure.
Among the MCDM methods, the WASPAS methodology exhibits the lowest overall changes, with a 39.0% difference compared with the MCDM average, indicating that reducing the number of categories in the analysis has a relatively minor impact. In contrast, the TOPSIS method shows the highest difference with a 51.2% difference compared with the MCDM average. As for the LCA methodologies with integrated durability properties, the complex FU method displays an overall change of 12 due to the reduced number of categories.
Generally, when considering the average of the MCDM methods, they show higher overall changes compared with the complex FU method. However, the difference is not substantial. This suggests that all the methods lead to comparable alterations in the mixture rankings. Consequently, it is advisable to use methods with simpler applications rather than complex ones. MCDM methods are recommended as they allow for the incorporation of weight selection based on the material’s application, providing greater flexibility and adaptability.

3.4.3. Effect of Number of Concrete Mixtures on the Average Rankings

In this case, the twelve concrete mixtures were divided into three groups to evaluate the effect of the number of alternatives on the final average rankings. Subsequently, the results were obtained, and the alternatives were ranked for each group.
Table 10 presents the effect of the number of concrete mixtures on the average rankings using various methodologies. When a smaller number of mixtures are considered in the analysis, the LCA-integrated durability methods demonstrate consistency in their results. Only mixtures with FA and GGBFS additions, as well as C0-S, show slight changes in their average rankings. This indicates that when comparing a reduced number of mixtures, different methods yield more similar results, making the choice of the best method less critical.
Similarly, the average rankings using different MCDM methods are relatively consistent. However, the type of aggregate used may have an influence on these results when using different MCDM methods. For example, while C50-G shows a better ranking than C50-S using the WASPAS method, C50-G shows a worse ranking than C50-S using the TOPSIS methodology.
Nonetheless, these changes are significantly smaller compared with those observed when a larger number of mixtures are considered. This further supports the earlier comment that when comparing fewer mixtures, the specific choice of method becomes less important than when analyzing a larger number of concrete mixtures.

4. Conclusions

Based on the comprehensive analysis of the research findings, several key conclusions can be drawn regarding the comparison between MCDM and LCA methods with durability integrated in concrete mixtures:
  • Unlike MCDM methods, various LCA methods with integrated durability show higher differences, with over twice the standard deviation. This highlights the superior consistency of MCDM methods in analyzing the overall sustainability of concrete materials. Furthermore, MCDM methods offer the advantage of adjustability, allowing for the tailored weighting of properties based on the specific application of the concrete structure. This flexibility enhances the usefulness of MCDM methods in decision-making processes concerning the sustainability of concrete mixtures compared with LCA methods with properties integrated.
  • MCDM methods also possess capacity for real-time adaptation through iterative application, thus accommodating evolving project dynamics. Furthermore, MCDM methods advocate active participation by stakeholders throughout the decision-making journey. This collaborative approach fosters transparency, as the decisions made are not solely derived from mathematical calculations but are enriched by inputs from diverse stakeholders. This inclusive process culminates in well-rounded choices aligned with overarching sustainability objectives.
  • The results from all the studied methods consistently demonstrate the advantageous impact of SCMs in enhancing the overall sustainable performance of concrete mixtures, considering various parameters in a holistic approach. This reinforces the significance of reducing cement content as a vital step in promoting sustainability in concrete construction. Additionally, the findings underscore the importance of the prudent and careful use of RCA, as varying replacement percentages can lead to diverse outcomes in terms of sustainability, especially when SCMs are also incorporated into the mixture. The interplay between optimal SCM addition and aggregate type highlights the need for a holistic evaluation to determine the most sustainable concrete formulation.
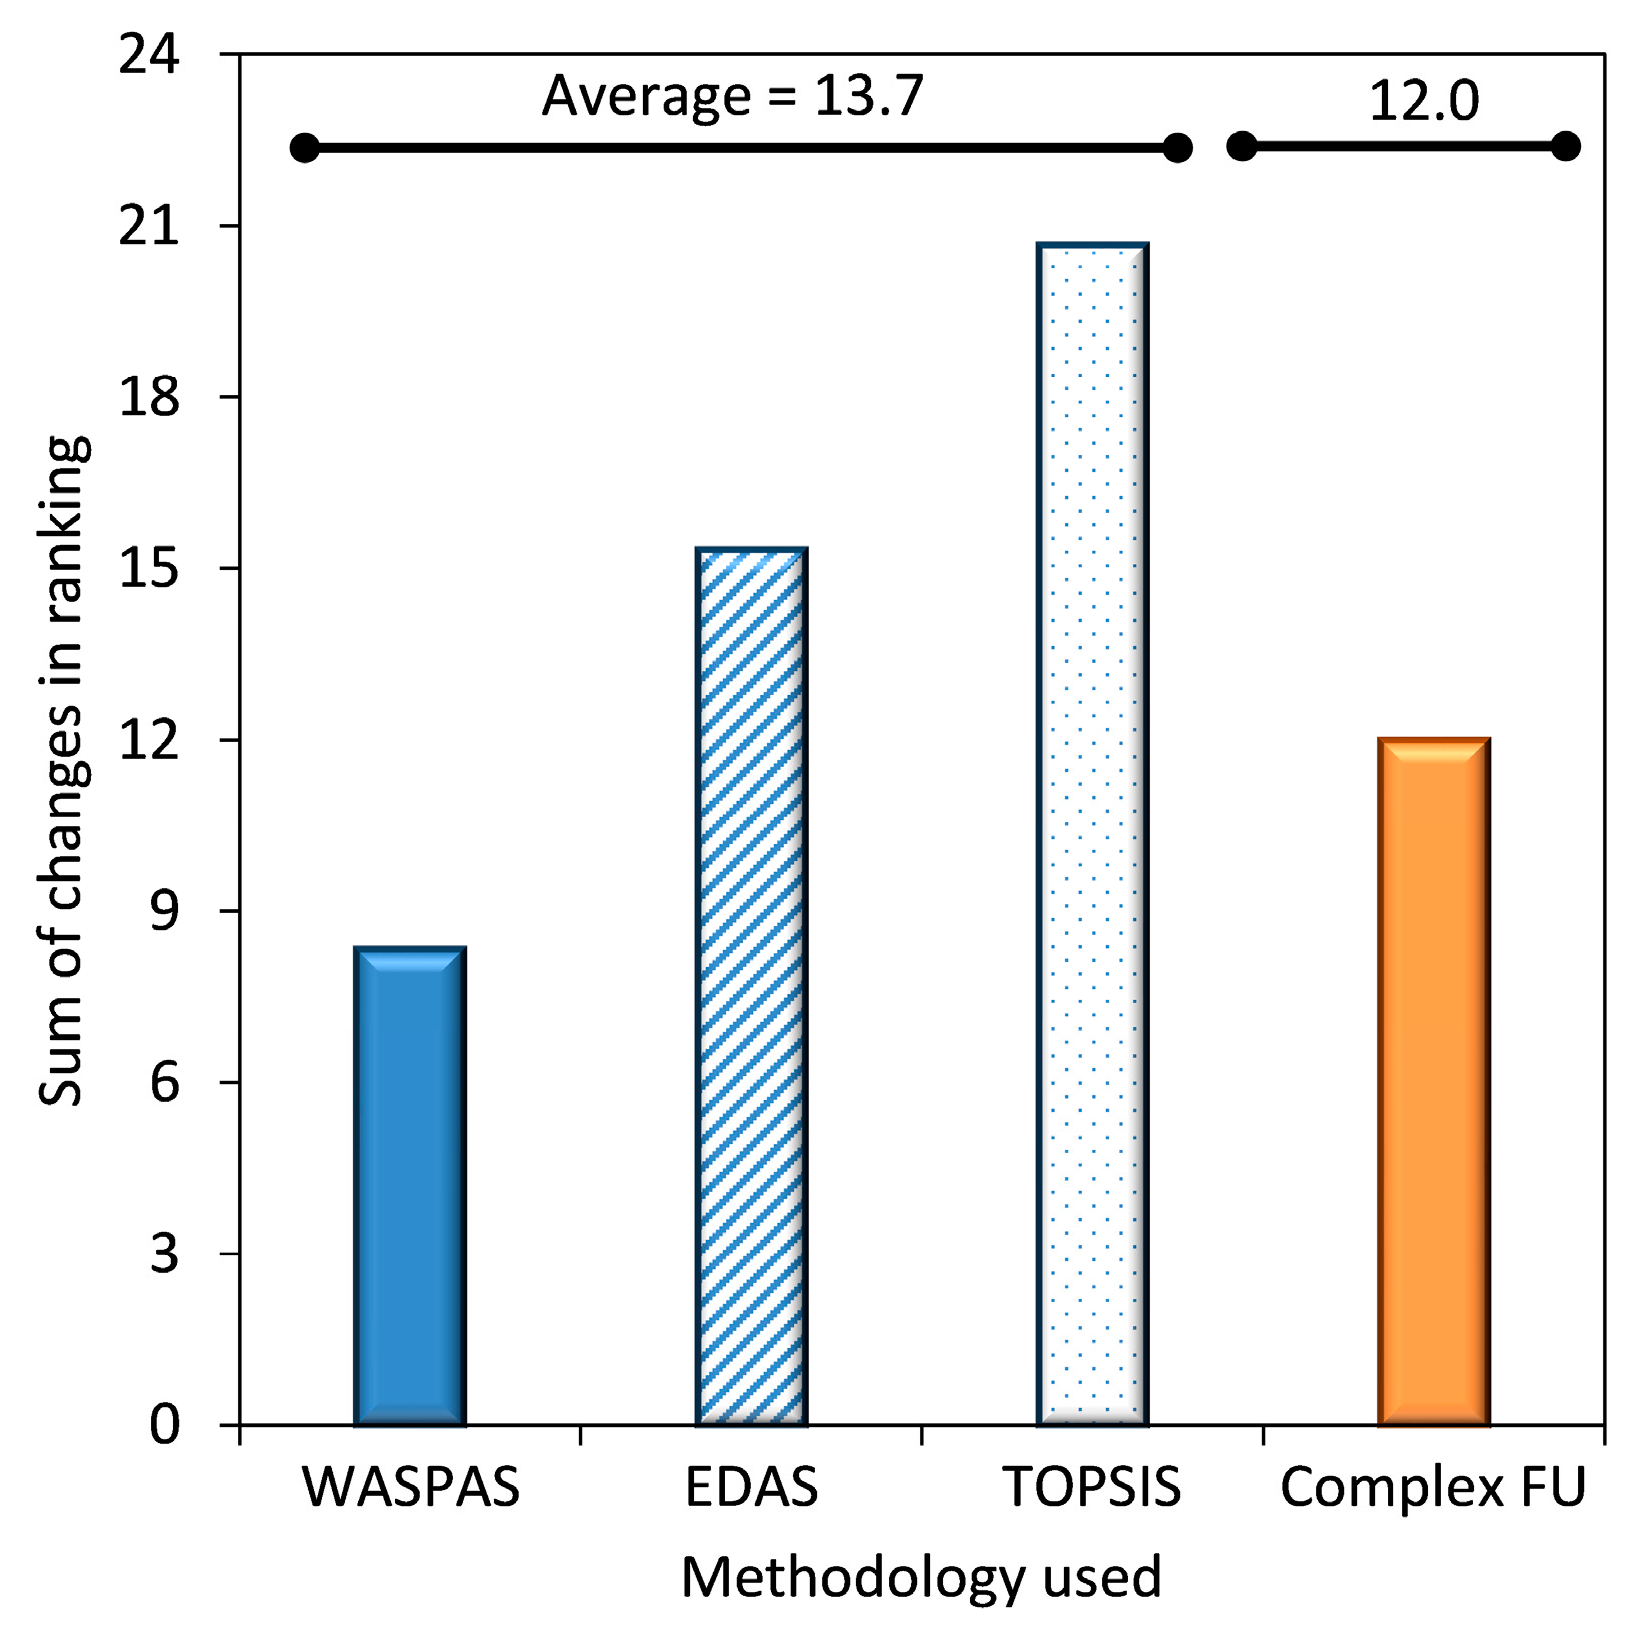
  • While various MCDM methods do yield differing results due to their unique reasoning approaches, the choice of a specific MCDM method may not significantly impact the comparison of concrete mixtures, as the observed differences between them were acceptable. This suggests that decision-makers can select a suitable MCDM method based on their preferences and the specific context of the sustainability assessment.
  • The sensitivity analysis reveals that weights and the number of concrete parameters play crucial roles in the analysis. This study indicates that both the choice of weight method and the concrete parameters significantly influence the rankings, regardless of the methodology employed. To ensure consistency and enable meaningful comparisons in such analyses, it is recommended to adopt standardized procedures tailored to specific concrete applications. Such standardization will enhance the reliability and relevance of the results, promoting more informed decision-making processes in the context of sustainability assessments for concrete materials.

Funding

This research was funded by Texas State University System, grant number “Start-Up Fund no. 9000002960”.

Institutional Review Board Statement

Not applicable.

Informed Consent Statement

Not applicable.

Data Availability Statement

The data that support the findings of this study are available upon reasonable request. Researchers interested in accessing the data can contact the corresponding author ([email protected]). Due to privacy and ethical considerations, certain restrictions may apply to the release of sensitive or confidential data. However, efforts will be made to provide the data in a format that ensures anonymity and adheres to relevant regulations and guidelines. Please note that any data provided should be used strictly for the purposes of academic research, with appropriate acknowledgment and citation of the original study.

Conflicts of Interest

The authors declare no conflict of interest.

References

  1. International Energy Agency (IEA). Cement Technology Roadmap 2009—Carbon Emissions Reductions up to 2050. 2009. Available online: https://www.iea.org/reports/cement-technology-roadmap-carbon-emissions-reductions-up-to-2050 (accessed on 28 May 2023).
  2. Skrzypczak, I.; Kokoszka, W.; Zieba, J.; Lesniak, A.; Bajno, D.; Bednarz, L. A Proposal of a Method for Ready-Mixed Concrete Quality Assessment Based on Statistical-Fuzzy Approach. Materials 2020, 13, 5674. [Google Scholar] [CrossRef]
  3. Andrew, R.M. Global CO2 emissions from cement production, 1928–2017. Earth Syst. Sci. Data 2018, 10, 2213–2239. [Google Scholar] [CrossRef]
  4. Turner, L.K.; Collins, F.G. Carbon dioxide equivalent (CO2-e) emissions: A comparison between geopolymer and OPC cement concrete. Constr. Build. Mater. 2013, 43, 125–130. [Google Scholar] [CrossRef]
  5. Li, H.; Liebscher, M.; Yang, J.; Davoodabadi, M.; Li, L.; Du, Y.; Yang, B.; Hempel, S.; Mechtcherine, V. Electrochemical oxidation of recycled carbon fibers for an improved interaction toward alkali-activated composites. J. Clean. Prod. 2022, 368, 133093. [Google Scholar] [CrossRef]
  6. Li, H.; Wang, L.; Zhang, Y.; Yang, J.; Tsang, D.C.W.; Mechtcherine, V. 3—Biochar for sustainable construction industry. In Current Developments in Biotechnology and Bioengineering; Ngo, H.H., Guo, W., Pandey, A., Varjani, S., Tsang, D.C.W., Eds.; Elsevier: Amsterdam, The Netherlands, 2023; pp. 63–95. [Google Scholar] [CrossRef]
  7. Martinez-Lage, I.; Vazquez-Burgo, P.; Velay-Lizancos, M. Sustainability evaluation of concretes with mixed recycled aggregate based on holistic approach: Technical, economic and environmental analysis. Waste Manag. 2020, 104, 9–19. [Google Scholar] [CrossRef]
  8. Moro, C.; Francioso, V.; Schager, M.; Velay-Lizancos, M. TiO2 nanoparticles influence on the environmental performance of natural and recycled mortars: A life cycle assessment. Environ. Impact Assess. Rev. 2020, 84, 106430. [Google Scholar] [CrossRef]
  9. Marinkovic, S. Life-Cycle Assessment (LCA) of Concrete with Recycled Aggregates (RAs); Woodhead Publishing: Sawston, UK, 2013; pp. 569–604. [Google Scholar] [CrossRef]
  10. Worrell, E.; Martin, N.; Price, L. Potentials for energy efficiency improvement in the US cement industry. Energy 2000, 25, 1189–1214. [Google Scholar] [CrossRef]
  11. Madlool, N.A.; Saidur, R.; Rahim, N.A.; Kamalisarvestani, M. An overview of energy savings measures for cement industries. Renew. Sust. Energ. Rev. 2013, 19, 18–29. [Google Scholar] [CrossRef]
  12. Griffiths, S.; Sovacool, B.K.; Furszyfer Del Rio, D.D.; Foley, A.M.; Bazilian, M.D.; Kim, J.; Uratani, J.M. Decarbonizing the cement and concrete industry: A systematic review of socio-technical systems, technological innovations, and policy options. Renew. Sust. Energ. Rev. 2023, 180, 113291. [Google Scholar] [CrossRef]
  13. Colangelo, F.; Forcina, A.; Farina, I.; Petrillo, A. Life Cycle Assessment (LCA) of different kinds of concrete containing waste for sustainable construction. Buildings 2018, 8, 70. [Google Scholar] [CrossRef]
  14. Ding, T.; Xiao, J.; Tam, V.W.Y. A closed-loop life cycle assessment of recycled aggregate concrete utilization in China. Waste Manag. 2016, 56, 367–375. [Google Scholar] [CrossRef] [PubMed]
  15. De Schepper, M.; Van den Heede, P.; Van Driessche, I.; De Belie, N. Life Cycle Assessment of Completely Recyclable Concrete. Materials 2014, 7, 6010–6027. [Google Scholar] [CrossRef] [PubMed]
  16. Huang, H.; Ren, X.; Liu, Z.; Wang, F. Development of low-carbon and cost-effective ultra-high performance concrete using carbonated recycled fine aggregate. Constr. Build. Mater. 2023, 399, 132575. [Google Scholar] [CrossRef]
  17. Moro, C.; Francioso, V.; Lopez-Arias, M.; Velay-Lizancos, M. CO2 curing of mortar with natural and recycled concrete aggregate: An environmental and economic assessment. Constr. Build. Mater. 2023, 399, 132587. [Google Scholar] [CrossRef]
  18. Gursel, A.P.; Maryman, H.; Ostertag, C. A life-cycle approach to environmental, mechanical, and durability properties of green concrete mixes with rice husk ash. J. Clean. Prod. 2016, 112, 823–836. [Google Scholar] [CrossRef]
  19. Konečný, P.; Ghosh, P.; Hrabová, K.; Lehner, P.; Teplý, B. Effective methodology of sustainability assessment of concrete mixtures. Mater. Struct. 2020, 53, 98. [Google Scholar] [CrossRef]
  20. Marinković, S.; Carević, V.; Dragaš, J. The role of service life in Life Cycle Assessment of concrete structures. J. Clean. Prod. 2021, 290, 125610. [Google Scholar] [CrossRef]
  21. ISO 14040; Environmental Management—Life Cycle Assessment—Principles and Framework. International Organization for Standardization (ISO): Geneva, Switzerland. Available online: https://www.iso.org/standard/37456.html (accessed on 1 May 2023).
  22. ISO 14044; Environmental Management—Life Cycle Assessment—Requirements and Guidelines. International Organization for Standardization (ISO): Geneva, Switzerland. Available online: https://www.iso.org/standard/38498.html (accessed on 1 May 2023).
  23. Rahla, K.M.; Mateus, R.; Bragana, L. Comparative sustainability assessment of binary blended concretes using Supplementary Cementitious Materials (SCMs) and Ordinary Portland Cement (OPC). J. Clean. Prod. 2019, 220, 445–459. [Google Scholar] [CrossRef]
  24. Zhu, H.; Chen, W.; Cheng, S.; Yang, L.; Wang, S.; Xiong, J. Low carbon and high efficiency limestone-calcined clay as supplementary cementitious materials (SCMs): Multi-indicator comparison with conventional SCMs. Constr. Build. Mater. 2022, 341, 127748. [Google Scholar] [CrossRef]
  25. Tait, M.W.; Cheung, W.M. A comparative cradle-to-gate life cycle assessment of three concrete mix designs. Int. J. Life Cycle Ass. 2016, 21, 847–860. [Google Scholar] [CrossRef]
  26. Panesar, D.K.; Kanraj, D.; Abualrous, Y. Effect of transportation of fly ash: Life cycle assessment and life cycle cost analysis of concrete. Cem. Concr. Compos. 2019, 99, 214–224. [Google Scholar] [CrossRef]
  27. Francioso, V.; Lopez-Arias, M.; Moro, C.; Jung, N.; Velay-Lizancos, M. Impact of Curing Temperature on the Life Cycle Assessment of Sugarcane Bagasse Ash as a Partial Replacement of Cement in Mortars. Sustainability 2023, 15, 142. [Google Scholar] [CrossRef]
  28. Yi, Z.; Wang, T.; Guo, R. Sustainable building material from CO2 mineralization slag: Aggregate for concretes and effect of CO2 curing. J. CO2 Util. 2020, 40, 101196. [Google Scholar] [CrossRef]
  29. Moro, C.; Francioso, V.; Lopez-Arias, M.; Velay-Lizancos, M. Modification of self-cleaning activity on cement pastes containing nano-TiO2 due to CO2 curing. Constr. Build. Mater. 2022, 330, 127185. [Google Scholar] [CrossRef]
  30. Shi, X.; Mukhopadhyay, A.; Zollinger, D.; Grasley, Z. Economic input-output life cycle assessment of concrete pavement containing recycled concrete aggregate. J. Clean. Prod. 2019, 225, 414–425. [Google Scholar] [CrossRef]
  31. Zhang, Y.; Luo, W.; Wang, J.; Wang, Y.; Xu, Y.; Xiao, J. A review of life cycle assessment of recycled aggregate concrete. Constr. Build. Mater. 2019, 209, 115–125. [Google Scholar] [CrossRef]
  32. Visintin, P.; Xie, T.; Bennett, B. A large-scale life-cycle assessment of recycled aggregate concrete: The influence of functional unit, emissions allocation and carbon dioxide uptake. J. Clean. Prod. 2019, 248, 119243. [Google Scholar] [CrossRef]
  33. Panesar, D.K.; Seto, K.E.; Churchill, C.J. Impact of the selection of functional unit on the life cycle assessment of green concrete. Int. J. Life Cycle Ass. 2017, 22, 1969–1986. [Google Scholar] [CrossRef]
  34. Marinkovic, S.; Dragaš, J.; Ignjatovic, I.; Tosic, N. Environmental assessment of green concretes for structural use. J. Clean. Prod. 2017, 154, 633–649. [Google Scholar] [CrossRef]
  35. Knoeri, C.; Sany-Mengual, E.; Althaus, H.J. Comparative LCA of recycled and conventional concrete for structural applications. Int. J. Life Cycle Ass. 2013, 18, 909–918. [Google Scholar] [CrossRef]
  36. Li, C.; Li, J.; Ren, Q.; Zheng, Q.; Jiang, Z. Durability of concrete coupled with life cycle assessment: Review and perspective. Cem. Concr. Compos. 2023, 139, 105041. [Google Scholar] [CrossRef]
  37. Dezhampanah, S.; Nikbin, I.; Charkhtab, S.; Fakhimi, F.; Bazkiaei, S.M.; Mohebbi, R. Environmental performance and durability of concrete incorporating waste tire rubber and steel fiber subjected to acid attack. J. Clean. Prod. 2020, 268, 122216. [Google Scholar] [CrossRef]
  38. Zhang, Y.; Zhang, J.; Luo, W.; Wang, J.; Shi, J.; Zhuang, H.; Wang, Y. Effect of compressive strength and chloride diffusion on life cycle CO2 assessment of concrete containing supplementary cementitious materials. J. Clean. Prod. 2019, 218, 450–458. [Google Scholar] [CrossRef]
  39. Taherdoost, H.; Madanchian, M. Multi-Criteria Decision Making (MCDM) Methods and Concepts. Encyclopedia 2023, 3, 77–87. [Google Scholar] [CrossRef]
  40. Kurda, R.; de Brito, J.; Silvestre, J.D. CONCRETop—A multi-criteria decision method for concrete optimization. Environ. Impact Assess. Rev. 2019, 74, 73–85. [Google Scholar] [CrossRef]
  41. Soni, A.; Chakraborty, S.; Kumar Das, P.; Kumar Saha, A. Materials selection of reinforced sustainable composites by recycling waste plastics and agro-waste: An integrated multi-criteria decision making approach. Constr. Build. Mater. 2022, 348, 128608. [Google Scholar] [CrossRef]
  42. Yoris-Nobile, A.I.; Lizasoain-Arteaga, E.; Slebi-Acevedo, C.J.; Blanco-Fernandez, E.; Alonso-Cañon, S.; Indacoechea-Vega, I.; Castro-Fresno, D. Life cycle assessment (LCA) and multi-criteria decision-making (MCDM) analysis to determine the performance of 3D printed cement mortars and geopolymers. J. Sustain. Cem. Based Mater. 2022, 12, 609–626. [Google Scholar] [CrossRef]
  43. Shmlls, M.; Abed, M.; Fořt, J.; Horvath, T.; Bozsaky, D. Towards closed-loop concrete recycling: Life cycle assessment and multi-criteria analysis. J. Clean. Prod. 2023, 410, 137179. [Google Scholar] [CrossRef]
  44. Chen, C.H. A Novel Multi-Criteria Decision-Making Model for Building Material Supplier Selection Based on Entropy-AHP Weighted TOPSIS. Entropy 2020, 22, 259. [Google Scholar] [CrossRef]
  45. Navarro, I.J.; Martí, J.V.; Yepes, V. Analytic Network Process-Based Sustainability Life Cycle Assessment of Concrete Bridges in Coastal Regions. Sustainability 2022, 14, 688. [Google Scholar] [CrossRef]
  46. Revilla-Cuesta, V.; Skaf, M.; Espinosa, A.B.; Ortega-López, V. Multi-criteria feasibility of real use of self-compacting concrete with sustainable aggregate, binder and powder. J. Clean. Prod. 2021, 325, 129327. [Google Scholar] [CrossRef]
  47. Ayan, B.; Abacıoğlu, S.; Basilio, M.P. A Comprehensive Review of the Novel Weighting Methods for Multi-Criteria Decision-Making. Information 2023, 14, 285. [Google Scholar] [CrossRef]
  48. Limbachiya, M.; Meddah, M.S.; Ouchagour, Y. Performance of Portland/Silica Fume Cement Concrete Produced with Recycled Concrete Aggregate. ACI Mater. J. 2012, 109, 91–100. [Google Scholar] [CrossRef]
  49. Tüfekçi, M.M.; Çakır, Ö. An Investigation on Mechanical and Physical Properties of Recycled Coarse Aggregate (RCA) Concrete with GGBFS. Int. J. Civ. Eng. 2017, 15, 549–563. [Google Scholar] [CrossRef]
  50. Habibi, A.; Ramezanianpour, A.M.; Mahdikhani, M.; Bamshad, O. RSM-based evaluation of mechanical and durability properties of recycled aggregate concrete containing GGBFS and silica fume. Constr. Build. Mater. 2021, 270, 121431. [Google Scholar] [CrossRef]
  51. Çakır, Ö. Experimental analysis of properties of recycled coarse aggregate (RCA) concrete with mineral additives. Constr. Build. Mater. 2014, 68, 17–25. [Google Scholar] [CrossRef]
  52. Majhi, R.K.; Nayak, A.N.; Mukharjee, B.B. Development of sustainable concrete using recycled coarse aggregate and ground granulated blast furnace slag. Constr. Build. Mater. 2018, 159, 417–430. [Google Scholar] [CrossRef]
  53. Kurda, R.; de Brito, J.; Silvestre, J.D. Water absorption and electrical resistivity of concrete with recycled concrete aggregates and fly ash. Cem. Concr. Compos. 2019, 95, 169–182. [Google Scholar] [CrossRef]
  54. Al-Yaqout, A.; El-Hawary, M.; Nouh, K.; Khan, P.B. Corrosion Resistance of Recycled Aggregate Concrete Incorporating Slag. ACI Mater. J. 2020, 117, 111–222. [Google Scholar] [CrossRef]
  55. Jalilifar, H.; Sajedi, F.; Toosi, V.R. Evaluating the durability of recycled concrete made of coarse recycled aggregate concrete containing silica-fume and natural zeolite. Rev. Construcción 2019, 19, 457–473. [Google Scholar] [CrossRef]
  56. Zhao, J.; Shumuye, E.D.; Wang, Z.; Bezabih, G.A.; Yi, H. Performance of GGBS Cement Concrete under Natural Carbonation and Accelerated Carbonation Exposure. J. Eng. 2021, 2021, 1–16. [Google Scholar] [CrossRef]
  57. von Greve-Dierfeld, S.; Lothenbach, B.; Vollpracht, A.; Wu, B.; Huet, B.; Andrade, C.; Medina, C.; Thiel, C.; Gruyaert, E.; Vanoutrive, H.; et al. Understanding the carbonation of concrete with supplementary cementitious materials: A critical review by RILEM TC 281-CCC. Mater. Struct. 2020, 53, 136. [Google Scholar] [CrossRef]
  58. Ahmad, J.; Martinez-Garcia, R.; Szelag, M.; de-Prado-Gil, J.; Marzouki, R.; Alqurashi, M.; Hussein, E.E. Effects of Steel Fibers (SF) and Ground Granulated Blast Furnace Slag (GGBS) on Recycled Aggregate Concrete. Materials 2021, 14, 7497. [Google Scholar] [CrossRef] [PubMed]
  59. Limbachiya, M.; Meddah, M.S.; Ouchagour, Y. Use of recycled concrete aggregate in fly-ash concrete. Constr. Build. Mater. 2012, 27, 439–449. [Google Scholar] [CrossRef]
  60. Yuan, W.B.; Mao, L.; Li, L.Y. A two-step approach for calculating chloride diffusion coefficient in concrete with both natural and recycled concrete aggregates. Sci. Total Environ. 2023, 856, 159197. [Google Scholar] [CrossRef] [PubMed]
  61. Kou, S.C.; Poon, C.S. Long-term mechanical and durability properties of recycled aggregate concrete prepared with the incorporation of fly ash. Cem. Concr. Compos. 2013, 37, 12–19. [Google Scholar] [CrossRef]
  62. Ahmed, S.F.U. Properties of Concrete Containing Recycled Fine Aggregate and fly ash. J. Solid Waste Technol. Manag. 2014, 1, 70–78. [Google Scholar] [CrossRef]
  63. Wernet, G.; Bauer, C.; Steubing, B.; Reinhard, J.; Moreno-Ruiz, E.; Weidema, B. The ecoinvent database version 3 (part I): Overview and methodology. Int. J. Life Cycle Ass. 2016, 21, 1218–1230. [Google Scholar] [CrossRef]
  64. Marceau, M.L.; Nisbet, M.A.M.A.; Vangeem, M.G. Life Cycle Inventory of Portland Cement Concrete; PCA R&D Serial No. 3007. 2007. Available online: http://large.stanford.edu/courses/2016/ph240/pourshafeie2/docs/marceau-2007.pdf (accessed on 6 March 2023).
  65. Kikuchi, T.; Kuroda, Y. Carbon dioxide uptake in demolished and crushed concrete. J. Adv. Concr. Technol. 2011, 9, 115–124. [Google Scholar] [CrossRef]
  66. Ryberg, M.; Vieira, M.D.M.; Zgola, M.; Bare, J.; Rosenbaum, R.K. Updated US and Canadian normalization factors for TRACI 2.1. Clean Technol. Envir. 2014, 16, 329–339. [Google Scholar] [CrossRef]
  67. United States Geological Survey (USGS). Mineral Commodity Summaries 2023; United States Geological Survey (USGS): Reston, VA, USA, 2023. [CrossRef]
  68. Acuity International. CostCenter Cost Engineering Suite. 2022. Available online: https://costcenter.com/about-ptc/ (accessed on 11 March 2023).
  69. United States Environmental Protection Agency (EPA). Average US Cost of Water. Available online: https://www.epa.gov/watersense/data-and-information-used-watersense#Cost%20of%20Water (accessed on 11 March 2023).
  70. Ehlen, M.A.; Thomas, M.D.; Bentz, E.C. Life-365 service life prediction modelTM version 2.0. Concr. Int. 2009, 31, 41–46. [Google Scholar]
  71. Deiveegan, A.; Jayadurgalakshmi, M.; Kumar, T.U. Service Life Prediction of Concrete Structure Using Life-365 Software. Turk. J. Comput. Math. Educ. 2021, 12, 1816–1826. [Google Scholar] [CrossRef]
  72. Zahid, C.Z.B.; Rezwan, M.M.; Redwan-Ul-Islam; Mohammed, T.U. Service Life Optimization and Life Cycle Assessment of Concrete Using SCMs as Partial Replacement of Cement. J. Phys. Conf. Ser. 2023, 2023, 012008. [Google Scholar] [CrossRef]
  73. Saaty, T.L. The Analytic Hierarchy Process; McGraw-Hill Company: New York, NY, USA, 1980. [Google Scholar]
  74. Liu, L.; Zhou, J.; An, X.; Zhang, Y.; Yang, L. Using fuzzy theory and information entropy for water quality assessment in Three Gorges region, China. Expert Syst. Appl. 2010, 37, 2517–2521. [Google Scholar] [CrossRef]
  75. Qu, W.; Li, J.; Song, W.; Li, X.; Zhao, Y.; Dong, H.; Wang, Y.; Zhao, Q.; Qi, Y. Entropy-Weight-Method-Based Integrated Models for Short-Term Intersection Traffic Flow Prediction. Entropy 2022, 24, 849. [Google Scholar] [CrossRef] [PubMed]
  76. Ding, X.; Chong, X.; Bao, Z.; Xue, Y.; Zhang, S. Fuzzy Comprehensive Assessment Method Based on the Entropy Weight Method and Its Application in the Water Environmental Safety Evaluation of the Heshangshan Drinking Water Source Area, Three Gorges Reservoir Area, China. Water 2017, 9, 329. [Google Scholar] [CrossRef]
  77. Wang, E.; Alp, N.; Shi, J.; Wang, C.; Zhang, X.; Chen, H. Multi-criteria building energy performance benchmarking through variable clustering based compromise TOPSIS with objective entropy weighting. Energy 2017, 125, 197–210. [Google Scholar] [CrossRef]
  78. Mardani, A.; Nilashi, M.; Zakuan, N.; Loganathan, N.; Soheilirad, S.; Saman, M.Z.M.; Ibrahim, O. A systematic review and meta-Analysis of SWARA and WASPAS methods: Theory and applications with recent fuzzy developments. Appl. Soft Comput. 2017, 57, 265–292. [Google Scholar] [CrossRef]
  79. Keshavarz Ghorabaee, M.; Zavadskas, E.K.; Olfat, L.; Turskis, Z. Multi-Criteria Inventory Classification Using a New Method of Evaluation Based on Distance from Average Solution (EDAS). Informatica 2015, 26, 435–451. [Google Scholar] [CrossRef]
  80. Keshavarz Ghorabaee, M.; Amiri, M.; Salehi Sadaghiani, J.; Hassani Goodarzi, G. Multiple criteria group decision-making for supplier selection based on COPRAS method with interval type-2 fuzzy sets. Int. J. Adv. Manuf. Technol. 2014, 75, 1115–1130. [Google Scholar] [CrossRef]
  81. Rashid, T.; Ali, A.; Chu, Y.M. Hybrid BW-EDAS MCDM methodology for optimal industrial robot selection. PLoS ONE 2021, 16, e0246738. [Google Scholar] [CrossRef]
  82. Hwang, C.-L.; Yoon, K. (Eds.) Methods for Multiple Attribute Decision Making. In Multiple Attribute Decision Making: Methods and Applications A State-of-the-Art Survey; Springer: Berlin/Heidelberg, Germany, 1981; pp. 58–191. [Google Scholar] [CrossRef]
Figure 1. Flow diagram of the investigation.
Sustainability 15 12746 g001
Figure 2. Results of LCA methods with properties integrated in the analysis: (a) Complex Functional Unit. (b) Use of Service Life.
Sustainability 15 12746 g002
Figure 3. Average ranking for studied mixtures using various LCA methods incorporating durability.
Sustainability 15 12746 g003
Figure 4. Total score for different MCDM methodologies using combined weighting.
Sustainability 15 12746 g004
Figure 5. Average ranking for studied mixtures using the different MCDM methods.
Sustainability 15 12746 g005
Figure 6. Effect of different weight scenarios in various MCDM methods: (a) WASPAS. (b) EDAS. (c) TOPSIS.
Sustainability 15 12746 g006
Figure 7. Sum of changes in ranking due to the number of categories used.
Sustainability 15 12746 g007
Table 1. Mixture proportions of concrete mixtures.
MixtureOPC
(kg/m3)
FA Class F
(kg/m3)
GGBFS
(kg/m3)
SF
(kg/m3)
FNA *
(kg/m3)
CAN *
(kg/m3)
FRCA *
(kg/m3)
CRCA *
(kg/m3)
Water
(kg/m3)
C0-R400.00.00.00.0734.61060.30.00.0180.0
C0-F320.080.00.00.0734.61060.30.00.0180.0
C0-G280.00.0120.00.0734.61060.30.00.0180.0
C0-S360.00.00.040.0734.61060.30.00.0180.0
C50 R400.00.00.00.0367.3530.2320.0480.1180.0
C50-F320.080.00.00.0367.3530.2320.0480.1180.0
C50-G280.00.0120.00.0367.3530.2320.0480.1180.0
C50-S360.00.00.040.0367.3530.2320.0480.1180.0
C100-R400.00.00.00.00.00.0640.1960.1180.0
C100-F320.080.00.00.00.00.0640.1960.1180.0
C100-G280.00.0120.00.00.00.0640.1960.1180.0
C100-S360.00.00.040.00.00.0640.1960.1180.0
* FNA: Fine Natural Aggregate; CNA: Coarse Natural Aggregate; FRCA: Fine Recycled Concrete Aggregate; CRCA: Coarse Recycled Concrete Aggregate.
Table 2. Properties used for all different materials in the analysis [19,48,49,50,51,52,53,54,55,56,57,58,59,60,61,62].
MixtureCS * 7 Days
(MPa)
CS * 28 Days
(MPa)
WA *
(%)
Permeability
(Ω ∙ m)
CD *
(mm)
Shrinkage
(με)
DC *
(m2/s)
C0-R41.947.64.998.05.0280.03.7 × 10–12
C0-F36.754.94.2197.05.3195.02.4 × 10–12
C0-G29.542.74.7120.37.0233.32.4 × 10–12
C0-S45.856.04.5140.07.0190.01.2 × 10–12
C50 R42.044.46.976.55.3425.04.6 × 10–12
C50-F43.053.26.0150.05.6425.03.0 × 10–12
C50-G31.540.16.598.27.4354.23.0 × 10–12
C50-S44.649.36.8120.07.4150.01.5 × 10–12
C100-R43.844.37.566.05.6810.05.4 × 10–12
C100-F40.950.76.5135.06.1695.03.5 × 10–12
C100-G33.541.67.3105.67.8675.03.5 × 10–12
C100-S47.753.26.5120.07.8160.01.8 × 10–12
* CS: Compressive Strength; WA: Water Absorption; CD: Carbonation Depth; DC: Diffusion Coefficient.
Table 3. LCIA data for all different materials and processes using [63,64,65].
MixtureUnitAP *
(kg SO2 eq.)
GWP *
(kg CO2 eq.)
EP *
(kg N eq.)
ODP *
(kg CFC-11 eq.)
PMF *
(kg PM2.5 eq.)
SMF *
(kg O3 eq.)
ET-FW * (CTUe)HT-C * (CTUh)HT-NC * (CTUh)
OPCkg1.6 × 10–38.8 × 10–17.6 × 10–42.3 × 10–92.2 × 10–43.4 × 10–23.31.9 × 10–81.1 × 10⁻⁷
FAkg1.7 × 10–42.8 × 10–28.5 × 10–36.5 × 10–102.8 × 10–54.9 × 10–34.2 × 10+16.0 × 10–83.4 × 10–6
GGBFSkg1.0 × 10–31.0 × 10–12.7 × 10–41.0 × 10–91.1 × 10–46.2 × 10–31.48.3 × 10–92.5 × 10⁻⁸
SFkg1.7 × 10–53.4 × 10–34.0 × 10–66.2 × 10–112.4 × 10–64.7 × 10–43.4 × 10–23.2 × 10–107.6 × 10⁻¹⁰
FNAkg2.4 × 10–43.5 × 10–26.9 × 10–52.6 × 10–103.1 × 10–53.5 × 10–32.2 × 10–12.2 × 10–96.7 × 10⁻⁹
CNAkg5.4 × 10–51.0 × 10–22.8 × 10–51.1 × 10–101.2 × 10–59.2 × 10–41.3 × 10–11.8 × 10–92.3 × 10⁻⁹
FRCAkg3.7 × 10–5−6.5 × 10–33.6 × 10–67.3 × 10–113.6 × 10–51.2 × 10–39.6 × 10–32.3 × 10–101.5 × 10⁻¹⁰
CRCA kg3.7 × 10–5−6.5 × 10–33.6 × 10–67.3 × 10–113.6 × 10–51.2 × 10–39.6 × 10–32.3 × 10–101.5 × 10⁻¹⁰
Water kg2.0 × 10–64.3 × 10–41.3 × 10–65.7 × 10–125.7 × 10–72.7 × 10–55.6 × 10–34.6 × 10–111.1 × 10⁻¹⁰
Transportation t × km1.0 × 10–31.9 × 10–12.0 × 10–43.1 × 10–91.2 × 10–43.0 × 10–21.71.4 × 10–84.5 × 10⁻⁸
Concrete
Production
m31.1 × 10–14.73.6 × 10–33.7 × 10–93.8 × 10–32.03.52.3 × 10–87.9 × 10⁻⁸
*AP: Acidification Potential; GWP: Global Warming Potential; EP: Eutrophication Potential; ODP: Ozone Depletion Potential; PMF: Particulate Matter Formation; SMF: Smog Formation; ET-FW: Ecotoxicity–Freshwater; HT-C: Human Toxicity–Carcinogenic; HT-NC: Human Toxicity–Non-Carcinogenic.
Table 4. Unit price for raw materials.
MaterialUnit PriceSource
OPC$130.0/tonUS Geological Survey, 2023 [67]
FA Class F$51.5/tonAverage of several USA providers
GGBFS$53.0/tonUS Geological Survey, 2023 [67]
SF$475.0/tonAverage of several USA providers
NA$11.0/tonUS Geological Survey, 2023 [67]
RCA$24.0/tonCostcenter by Acuity International, 2022 [68]
Water$1.5/tonEPA WaterSense, 2019 [69]
Table 5. TRACI and cost values per unit volume of the different studied mixtures using [63,64,65,66,67,68,69].
MixtureTRACI
(Impacts per Year)
Cost
($)
C0-R3.44 × 10+1572.0
C0-F3.01 × 10+1565.7
C0-G2.75 × 10+1562.8
C0-S3.18 × 10+1585.8
C50 R3.21 × 10+1581.4
C50-F2.77 × 10+1575.1
C50-G2.51 × 10+1572.1
C50-S2.94 × 10+1595.2
C100-R2.97 × 10+1590.7
C100-F2.54 × 10+1584.4
C100-G2.28 × 10+1581.4
C100-S2.71 × 10+15104.5
Table 6. Numerical scale to compare criteria in pairs.
Importance ScaleInterpretation
1Both criteria are equally important
3One criterion is slightly more important over other
5One criterion is more important over other
7One criterion is strongly more important over other
9One criterion is extremely more important over other
2, 4, 6, 8Intermediate values
Table 7. RI values corresponding to various attribute sizes.
n123456
RI0.000.000.580.901.121.24
Table 8. Weights assigned to each of the different scenarios.
ParameterWeighting Method Used
AHPEntropyCombined
Mechanical Properties40.0%40.0%40.0%
Compressive Strength—7 days10.0%25.2%14.5%
Compressive Strength—28 days30.0%14.8%25.5%
Durability10.0%10.0%10.0%
Water Absorption1.3%0.6%0.4%
Permeability2.7%1.3%1.8%
Carbonation Depth0.8%0.4%0.2%
Shrinkage0.4%5.2%1.2%
Diffusion Coefficient4.7%2.6%6.5%
TRACI10.0%10.0%10.0%
Cost40.0%40.0%40.0%
Table 9. Average ranking for all different mixtures and methods.
MixtureMethod
WASPASEDASTOPSISComplex FUService Life
C0-R4.75.03.37.010.0
C0-F1.01.01.01.05.0
C0-G4.04.03.35.01.0
C0-S2.02.35.72.02.0
C50 R10.310.77.710.011.0
C50-F3.32.72.36.08.0
C50-G8.77.75.39.03.0
C50-S6.07.09.73.06.0
C100-R12.012.012.012.012.0
C100-F7.37.07.38.09.0
C100-G10.310.39.311.04.0
C100-S6.78.311.04.07.0
Table 10. Average ranking for all mixtures and methods using less alternatives in the analysis.
MixtureWASPASEDASTOPSISComplex FUService Life
C0-R4.04.03.74.04.0
C0-F1.01.01.01.03.0
C0-G3.02.72.03.02.0
C0-S2.02.33.32.01.0
C50 R4.04.03.04.04.0
C50-F1.01.01.02.03.0
C50-G3.02.32.03.02.0
C50-S2.02.74.01.01.0
C100-R4.04.03.04.04.0
C100-F1.31.01.02.03.0
C100-G3.03.02.03.02.0
C100-S1.72.04.01.01.0
Disclaimer/Publisher’s Note: The statements, opinions and data contained in all publications are solely those of the individual author(s) and contributor(s) and not of MDPI and/or the editor(s). MDPI and/or the editor(s) disclaim responsibility for any injury to people or property resulting from any ideas, methods, instructions or products referred to in the content.

