Article

The Classification of Riparian Habitats and Assessment of Fish-Spawning Habitat Suitability: A Case Study of the Three Gorges Reservoir, China

1
Resource and Environmental Research Center, Chinese Academy of Fishery Sciences, Beijing 100141, China
2
Scientific Observing and Experimental Station of Fishery Remote Sensing, Ministry of Agriculture and Rural Affairs, Beijing 100141, China
3
Yangtze River Fisheries Research Institute, Chinese Academy of Fishery Sciences, Wuhan 430223, China
*
Author to whom correspondence should be addressed.
Sustainability 2023, 15(17), 12773; https://doi.org/10.3390/su151712773
Submission received: 8 June 2023 / Revised: 31 July 2023 / Accepted: 22 August 2023 / Published: 23 August 2023

Abstract

:
After the completion of the Three Gorges Reservoir (TGR), there was a significant and drastic transformation of the original river habitat. These changes led to the loss of the original fish habitat and the emergence of a new habitat. To effectively classify and assess fish-spawning habitats in the TGR, a novel coastal complexity index (CCI) was developed. The CCI was formulated utilizing satellite remote sensing data and considering the river coastal line and river centerline on the river-reach scale. By integrating the CCI with river morphology, five river habitats were identified: the backwater bay, point bar, straight river channel, convex-bank point bar, and concave-bank deep pool. In order to evaluate the suitability of these habitats for sticky-egg-spawning fish, a single-factor habitat suitability curve was constructed using three key habitat factors: the CCI, slope, and vegetation coverage. This process involved the employment of two distinct methods: the habitat utilization method and the habitat preference method. The former only considered the survey data of spawning grounds, while the latter integrated the overall distribution of habitats in the TGR. Subsequently, a habitat suitability index (HSI) was established to assess the overall suitability of the identified habitats for sticky-egg-spawning fish. The results demonstrated a high classification accuracy, with the backwater bay representing the most prevalent habitat type, accounting for 43.31% of the total habitat types. When considering slope and vegetation coverage, the optimal ranges obtained through the two habitat suitability analysis methods were similar. However, for the CCI, there were variations in the optimal ranges obtained using the two methods. The habitat utilization method indicated an optimal interval of 2–4, while the habitat preference method provided an optimal interval of 4–8. Nonetheless, the assessment results for the spawning habitats’ suitability using both methods yielded essentially identical outcomes. Specifically, the backwater bay, convex-bank point bar, and concave-bank deep pool habitats exhibited higher suitability for spawning than point bar and straight river channel habitats. Further analysis revealed that approximately 75% of the 230 identified backwater bays were categorized as high-quality or higher-quality spawning habitats. In the time since this research was conducted, its findings have served as a theoretical foundation for the protection of aquatic biological resources and habitats.

1. Introduction

The Three Gorges Reservoir (TGR) is an important ecologically sensitive area in China [1]. The reservoir began to store water in 2003 and reached its normal water level of 175 m in 2010. With the construction of the TGR, the water body has changed dramatically from “river facies” to “river reservoir”, resulting in great changes in the surrounding ecosystem’s structure, processes, and function. In recent years, an increasing number of studies have been published on the ecosystem and habitat of the TGR, including habitat quality evaluation [2,3], habitat suitability analysis [4,5], the ecological operation of the reservoirs [6,7,8], and the impacts of riparian vegetation [9,10]. However, the TGR contains reservoirs and many tributaries, and the relevant aquatic habitats and ecosystems are complex. It is necessary to study the key habitats of aquatic organisms by studying the classification of physical habitats, understanding the relationship between physical habitats and functional habitats, and analyzing and evaluating the suitability of different types of habitats [5].
With the exploration of river structures, processes, and functions, the classification of river habitats has gradually developed. Early river classification studies were mainly based on river plane morphology [11] or the characteristics of hydrodynamic processes [12] on the macro-scale. Subsequent research has been carried out from the macro- to micro-scale. The classification of river habitats is mainly based on the characteristics of river geomorphology, hydrology, and ecology. Habitat classification using Rosgen’s method is the most common approach. In this method, rivers are divided into categories I, II, and III [13]. Bisson’s classification is mainly based on water depth, current velocity, riverbed topography, and water surface slope [14]. In addition, there are many studies using the index system, and methods of river habitat classification were constructed based on stream order, elevation, slope, sinuosity and river network density, water quality, and flow patterns [15,16,17]. River habitats can be divided into riverway habitats and riparian habitats. Most of the above studies analyzed the habitat units in riverways, with few studies exploring classification based on river shoreline morphology.
River habitat classification refers to the description and management of river topography and riverbank morphology [18]. Understanding the spatial distribution of these habitat types is crucial for assessing the ecological significance and functioning of riparian ecosystems. It provides insights into the availability and arrangement of different habitats, which are essential for various ecological processes and the overall health of the riverine environment. The study of habitat function can help us to establish the relationships between ecological factors and fish habitats (such as spawning grounds). In habitat function research, habitat suitability analysis can be used to predict the possible areas of fish distribution and assess the suitability of different habitats [19]. For example, the suitability of the spawning habitat of lake trout can be analyzed based on water depth, sediment, and current velocity; these data can then be used to locate spawning populations in rivers [20]. In a previous study, the habitat suitability of four domestic fish species was evaluated based on the parameters of water quantity, water level, water temperature, and flow velocity [21]. Five environmental variables—sea surface temperature (SST), mixed layer depth (MLD), sea surface height anomaly (SSHA), chlorophyll-a concentration (CHA), and ocean bathymetry (BAH)—were used in another study to predict habitat suitability index values [22]. The above-mentioned studies on habitat suitability mostly investigated hydrological characteristics and water physical and chemical properties, such as water depth, sediment, river current, riverbed morphology, and environmental characteristics. However, to our knowledge, there are few studies on the habitat suitability evaluation of sticky-egg-spawning fish based on habitat classification results, and no relevant reports have been found thus far.
In view of these issues, we aimed to address several challenges by developing a method for classifying riparian habitats using remote sensing data and focusing on riparian morphological characteristics. The primary objective was to assess the suitability of these habitats for sticky-egg-spawning fish, offering a more efficient and cost-effective alternative to traditional field survey methods. In order to achieve this goal, a coastal complexity index was constructed based on water body vectors and the river center, enabling the classification of riparian habitats. By integrating this index with river morphology, five distinct riparian habitat types were identified. Subsequently, the suitability of these habitats for sticky-egg-spawning fish was analyzed using two methods: the habitat utilization method, and the habitat preference method. The findings of this study have practical implications for habitat management and aquatic habitat protection. The results provide valuable insights and support this new method for the classification of riparian habitats, which can contribute to the development of more effective habitat management strategies.

2. Materials and Methods

2.1. Study Area

The TGR is located in the upper reaches of the Yangtze River, China, having a humid monsoon climate in the middle subtropical zone, with an average annual temperature range from 17 to 19 °C. When the water level of the reservoir reaches 175 m, the water area expands to 1084 km2, with a total storage capacity of 39.3 billion m3 [23,24]. The main stream of the Yangtze River crosses the TGR area from west to east. The study area starts from Mudong Town, Banan County, Chongqing (106°47′56.789″ E, 29°35′29.962″ N), in the west and extends to the Three Gorges Dam (111°00′0.068″ E, 30°49′34.815″ N) in Yichang City, Hubei Province, in the east. The study area represents the main channel of the TGR, excluding tributaries, with a length of approximately 573.46 km (Figure 1).

2.2. Data Acquisition and Processing

2.2.1. Satellite Data Acquisition and Preprocessing

RapidEye and Sentinel-2 satellite (Table 1) data from the same period as the field survey data (March to April 2017) were utilized to extract water body information for the TGR. The RapidEye data were received from the data provider, covering a spectral range of 440–850 nm with a spatial resolution of 5 m. The data acquired imagery in five bands (i.e., blue, green, red, red edge, and near-infrared) [25]. The Sentinel-2 data were downloaded from the ESA Sentinel-2 Pre-operation Hub (https://scihub.copernicus.eu/, accessed on 1 March 2021). The spatial resolution of the blue, green, red, and near-infrared bands was 10 m [26]. The images underwent preprocessing steps, including orthorectification, geometric correction, atmospheric correction, and resolution resampling (resampling to 10 m), to derive surface reflectance data.

2.2.2. Extraction of Water Body Information

Based on the differences in reflectance between water bodies and other objects in the near-infrared band, the Normalized Difference Water Index (NDWI) is constructed. The NDWI combines the green band and near-infrared band, which effectively enhances water body information while suppressing vegetation information. The NDWI can be used to identify water and other objects and is commonly used to extract water body information. The calculation method is shown in Formula (1) [27,28]:
N D W I = p ( G r e e n ) p ( N I R ) p G r e e n + p ( N I R )
where p(Green) represents the reflectance of the green band, and p(NIR) represents the reflectance of the near-infrared band. River water body information was extracted using the Otsu method [29], and the results are shown in Figure 1.

2.2.3. River Centerline

The centerline of a river plays a crucial role in capturing its characteristics, such as its trends, length, longitudinal gradient, and bending coefficient. In this study, the river centerline was manually drawn based on the extracted river water body vector information. In addition, the estimated river width was approximately 939 m. This information served as fundamental data for the classification of riparian habitats on the river scale.

2.2.4. Field Data

In the Wanzhou to Yunyang reach of the TGR, fish eggs, larvae, and juveniles were collected along the riverbanks using hand nets from March to April 2017. Most fish in the TGR produce sticky eggs, which adhere to Bermuda grass (Cynodon dactylon) [30,31]. The specific survey method was based on the resources used in the early life stages of fish species with sinking and sticky eggs [32]. Specifically, for fish that use plants as a spawning substrate, we picked the fish eggs attached to them. Then, the areas where the eggs and larvae were collected were identified as the sticky-egg-spawning grounds.

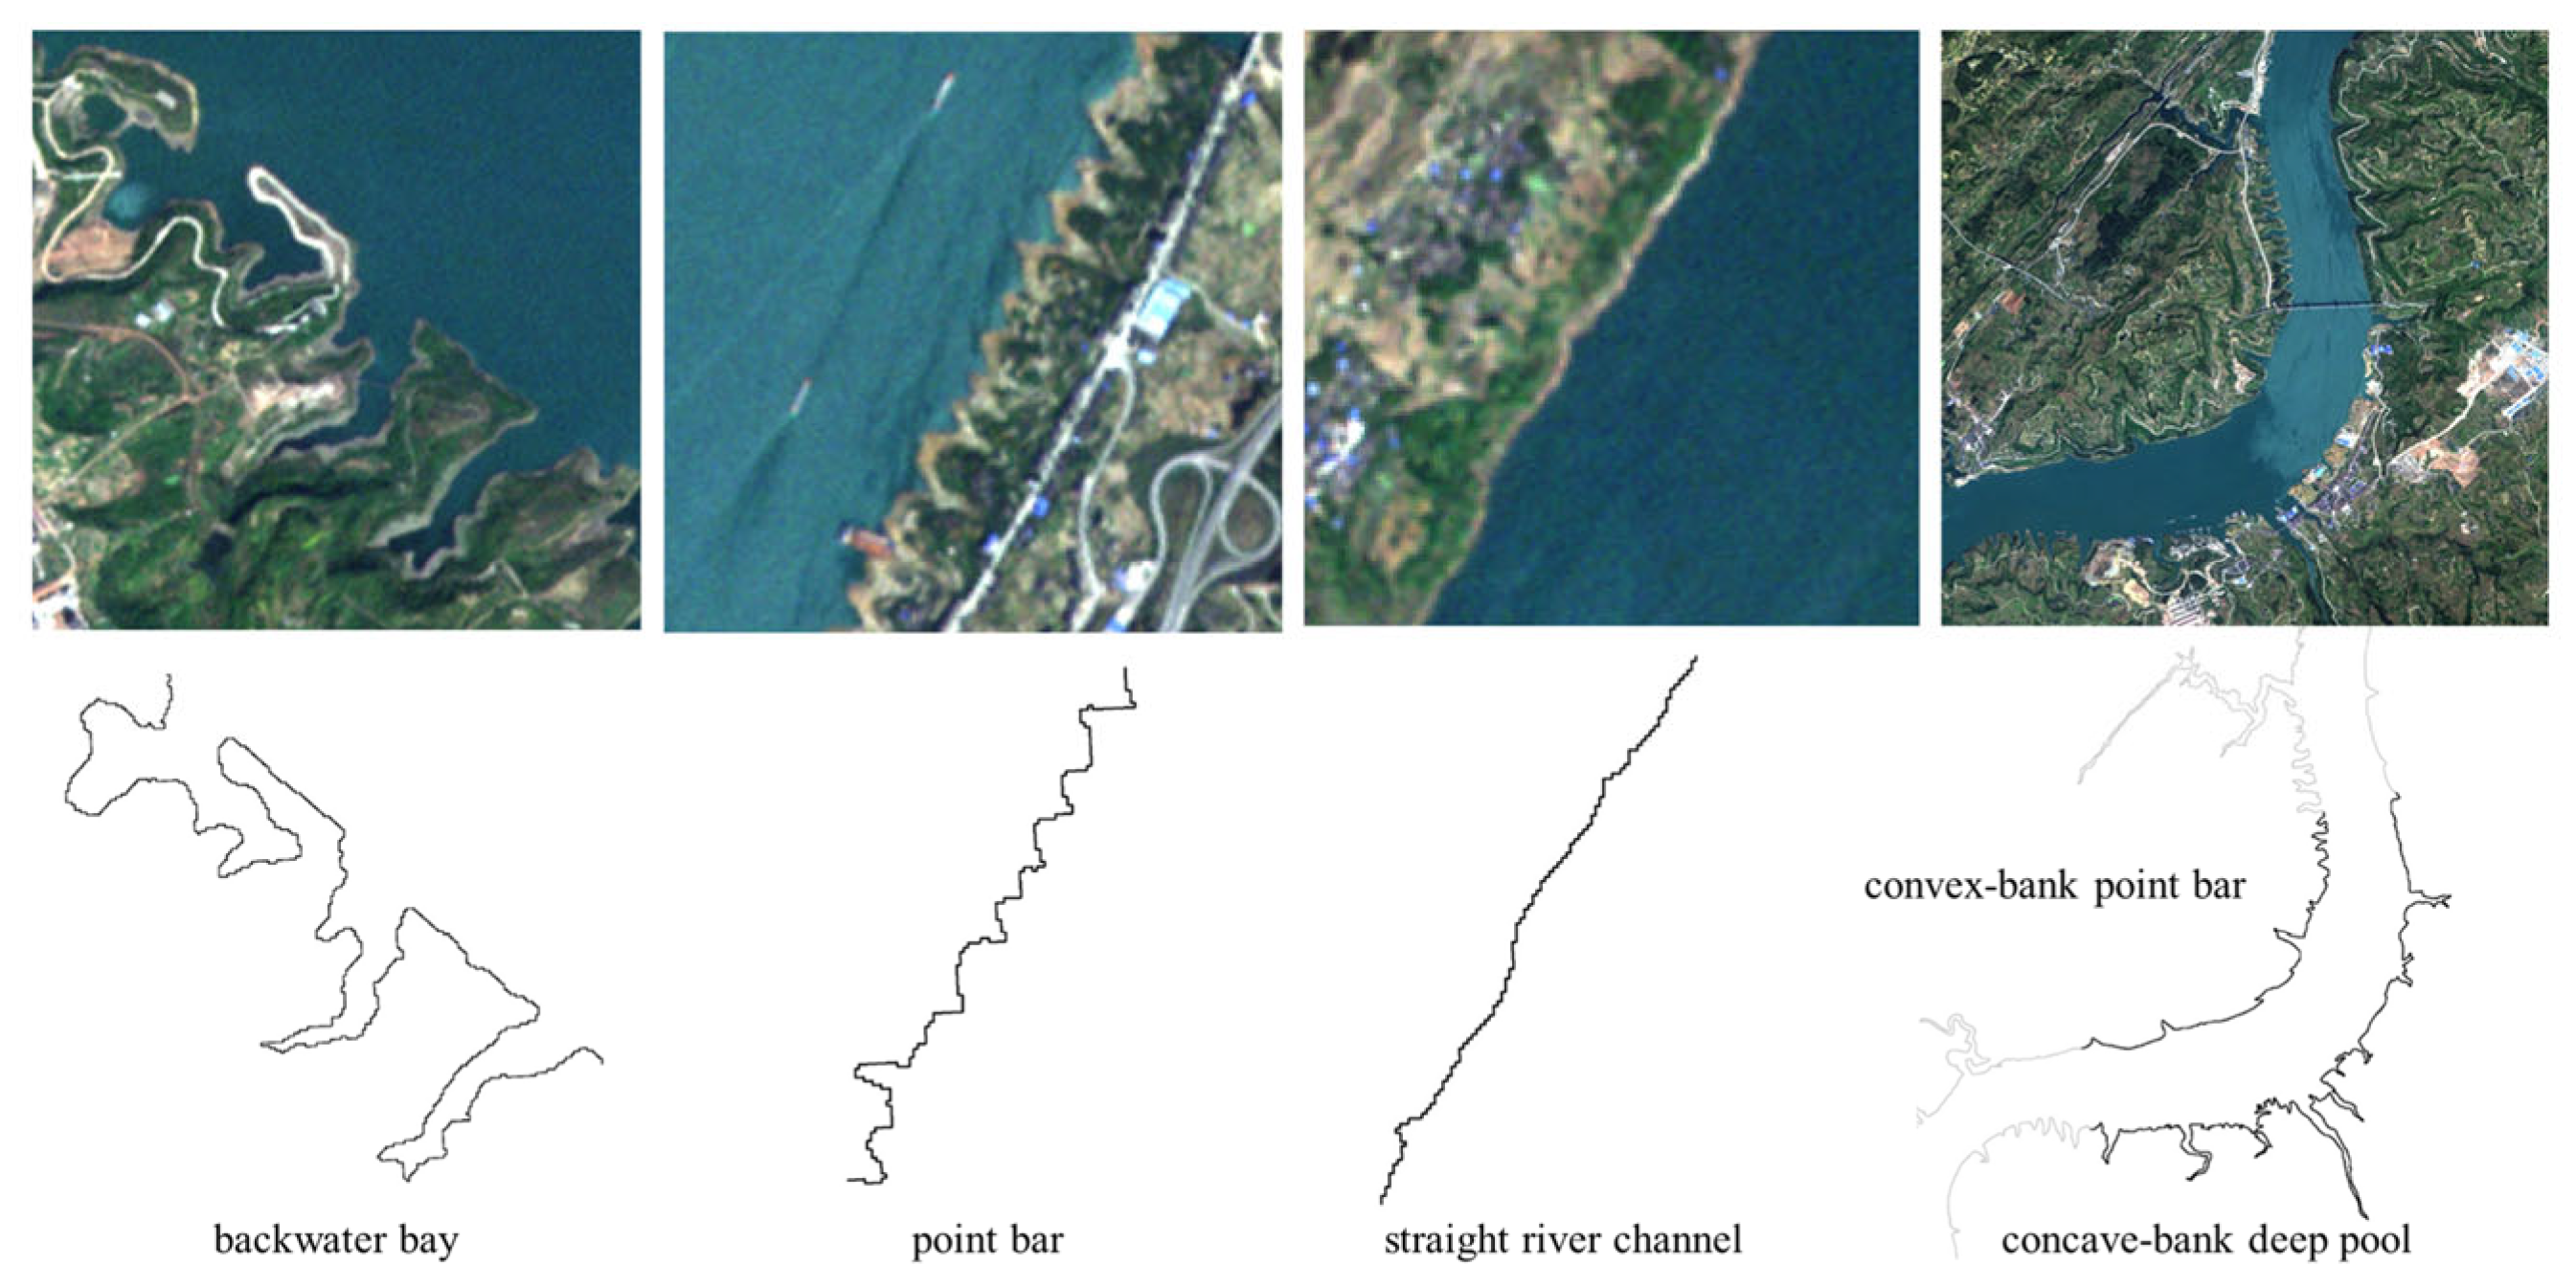
2.3. Riparian Habitat Classification

On the river scale, riparian habitats can be categorized into five types based on the morphology of the river shoreline. These types include the backwater bay, point bar, straight river channel, convex-bank point bar, and concave-bank deep pool. The backwater bay refers to an area where the water flow is slow. The point bar represents a jagged beach on a straight river, with isolated beaches. The convex bank at a bend in the river forms a point bar with a gentle slope, while the concave bank undergoes scouring and forms a deep pool [33].
To classify the riparian habitats, the coastal complexity index (CCI) was developed, taking into account the differences in shoreline length among the three habitat types: the backwater bay, point bar, and straight river channel. The CCI considers the length of both the river shoreline and the centerline. The calculation method for the CCI is illustrated in Formula (2):
CCI = C/L,
where C and L represent the lengths of the river shoreline and centerline, respectively. A higher CCI value indicates greater coastal complexity. When the CCI is equal to or greater than 2, the riparian habitat type is classified as a backwater bay. When the CCI is equal to or greater than 1.5 and less than 2, the habitat is a point bar. When the CCI is less than 1.5, the habitat is a straight river channel. It should be noted that the point bar and straight river channel habitat types apply to straight sections of the river.
For concave-bank deep pools and convex-bank point bars, these two habitat types occur in curved river sections. It is worth noting that these two habitat types are related to shoreline morphology and geometric shape, and it is generally believed that concave banks form deep pools and convex banks form point bars. In this study, the CCI was not used to identify these two habitats. The classification of these two habitat types is determined by the geometric shape of the coastline, with convex banks bending into the rivers and concave banks bending into the land. Figure 2 illustrates the five typical habitat types. Finally, the number, proportion (Formula (3)), and density (number of habitat types per kilometer, Formula (4)) of each habitat type were calculated. We also calculated the CCI values for all the habitat types:
proportion = N/TN,
density = N/TL,
where N, TN, and TL represent the number of a certain habitat type, the number of habitats of all types, and the total length of the river centerline in the TGR, respectively.

2.4. Suitability of Spawning Habitats

Using the three habitat factors of the CCI, slope, and vegetation coverage [34], in combination with the survey data obtained from the sticky-egg-spawning grounds of the fish, a univariate factor habitat suitability curve was constructed for the TGR. The slope and vegetation coverage values were the average values within the riparian range of the 50 m buffer zone surrounding the habitat unit. Slope, as an angle of inclination to the horizontal plane, has values in the range of 0 to 90. In this study, the slope was calculated using DEM data. For vegetation coverage, we used the normalized difference vegetation index (NDVI) parameters as the main input parameters and a pixel binary model to perform the calculation, with the result expressed as a percentage.
In this study, we used the habitat utilization method and habitat preference method [35], respectively, to construct a univariate habitat suitability curve. The habitat suitability value obtained with the former is called the use value, while the value of the latter is the preference value. It should be noted that the habitat utilization method only considered the survey data of the spawning grounds and was mainly based on the frequency distribution of habitat characteristics, while the habitat preference method integrated the overall distribution of habitats in the TGR. Then, using the arithmetic average method, the habitat suitability index (HSI) was calculated by combining the habitat suitability curves of the three factors with the same weight [36,37]. The calculation method for the HSI is shown in Formula (5):
HSI = (IS + IV + ICCI)/3,
where IS, IV, and ICCI represent the habitat suitability value of slope, vegetation coverage, and the CCI, respectively. The HSI value is based on hypothesized species–habitat relationships rather than proven cause-and-effect relationships. It can reflect the suitability of a certain area as a fish habitat, with a range from 0 to 1; the larger the value is, the higher the suitability is. The value also serves as a basis for improved decision making and an increased understanding of species–habitat relationships. In this study, the following classification criteria were applied: an HSI in the range of 0–0.25 indicates a low-quality spawning habitat, 0.25–0.5 represents a medium-quality spawning habitat, 0.5–0.75 denotes a high-quality spawning habitat, and 0.75–1 represents a higher-quality spawning habitat. The HSI calculated using the habitat utilization method is recorded as the HSI_use value, while the HSI calculated using the preference method is recorded as the HSI_preference value.

3. Results

3.1. Spatial Distribution of Habitat Types in the TGR

The spatial distribution of different habitat types in various sections of the TGR is shown in Figure 3. It can be observed that the backwater bays are widely distributed, whereas point bars or straight river channels are relatively scarce. The backwater bays exhibit longer lengths and larger scales from Badong to Zigui, while they are shorter from Yunyang to Fengjie. Conversely, point bars and straight river channels are widely distributed in the Yunyang to Fengjie section. Convex-bank point bars and concave-bank deep pools are predominantly found in the Fuling, Zhongxian, and Wanzhou river sections. Through visual interpretation of the riparian habitats, it was found that the visual interpretation results were similar to the classification results based on the riparian habitat classification method, indicating that the accuracy of riparian habitat classification in this study was high.
Table 2 shows the statistical results of the number, proportion, and density of habitat types in the TGR. The results show that the backwater bay is the main habitat type observed in the TGR (accounting for 43.3% of the total number of habitat types, with an average of approximately 0.4 per kilometer), followed by point bars (18.3% and 0.17) and straight river channels (17.3% and 0.16). The concave-bank deep pools and convex-bank point bars are distributed almost symmetrically, with 57 and 55, respectively (around 10% and 0.10).

3.2. Habitat Factor Analysis of Spawning Grounds

Through laboratory identification, we found that the collected sampling species primarily consisted of carp (Cyprinus carpio) and crucian carp (Carassius auratus). Taking habitat type as the research unit, the field survey results revealed a total of 27 spawning grounds for fish with sticky eggs, including 14 spawning grounds in backwater bays, 2 in point bars, 2 in straight river channels, 5 in convex-bank point bars, and 4 in concave-bank deep pools. The statistical results of the maximum and minimum values of slope, vegetation coverage, and the CCI corresponding to each habitat type are shown in Table 3.
It can be seen from Table 3 that there are significant variations in slope and the CCI among the different habitat types, while the difference in vegetation coverage is relatively small. For the slope, its value is less than 35° overall, with a minimum value of approximately 9° for backwater bays and 15° for convex-bank point bars and concave-bank deep pools. On the other hand, the point bar and straight river channel types exhibit larger slopes. The vegetation coverage of each habitat type is no less than 30%, with backwater bays having the highest maximum value of 73%. The CCI of backwater bays is the highest, with a maximum value of approximately 9. In contrast, the CCI values of the point bars and the straight river channels are below 2, indicating a simpler shoreline structure in the straight river channels. The CCI range of convex-bank point bars is smaller than that of the concave-bank deep pools.
To further analyze the distribution of sticky-egg-spawning grounds in different ranges of slope, vegetation coverage, and the CCI, the number of spawning grounds for each habitat factor was counted at different intervals, and the results are shown in Figure 4. The X-axis represents the different interval ranges of slope, vegetation coverage, and the CCI, while the Y-axis represents the number of spawning grounds in the habitats within different interval ranges.
For the number of spawning grounds, the slope is concentrated in the range of 10–20°, the vegetation coverage is in the range of 40–60%, and the CCI is in the range of 2–4. In the above three ranges, the number of sticky-egg-spawning grounds is no less than 13, accounting for approximately 50% of the total number.

3.3. Habitat Suitability Index Curve

The use values and preference values of the three habitat factors—namely, the slope, vegetation coverage, and CCI—in the sticky-egg-spawning grounds are shown in Figure 5. The X-axis represents the different interval ranges of slope, vegetation coverage, and the CCI, while the Y-axis represents the habitat suitability (use value and preference value) of a single variable. The change trends of the usage curve and preference curve for slope and vegetation coverage are similar. With an increase in the slope and vegetation coverage value, both the usage value and preference value initially increase and then decrease, showing a consistent pattern. The curves for slope and vegetation coverage align well with each other. However, for the CCI, although the two curves show a trend of first increasing and then decreasing, the region where the curves reach their maximum values differs between the two.
From a suitability point of view, when the slope is in the range of 10–20°, the use value and preference value are the highest. When the slope is 20–30° or 30–40°, the values of the two methods are different, with a use value of 0.50 or 0.13 and a preference value of 0.72 or 0.70, respectively. For vegetation coverage, the maximum values for both use and preference are observed in the range of 40–60%. When the vegetation coverage is 60–80%, the difference between the use value and the preference value is the largest, at 0.32 and 0.61, respectively. For the CCI, the maximum usage value corresponds to a range of 2–4, while the preference value is 6–8. In the range of 2–4, the preference value is approximately 0.58, while in the range of 6–8, the usage value is only approximately 0.15. In summary, we believe that when the use value and preference value are maximal, the corresponding range of slope, vegetation coverage, and the CCI indicates a more suitable spawning habitat for sticky-egg-spawning fishes.

3.4. Mapping the Suitability of Spawning Habitats

The prediction results for the suitability of the habitats of sticky-egg-spawning fish in TGR using the HSI_use value and HSI_preference value are shown in Figure 6. The prediction results obtained using the two methods are fundamentally identical. The results show that there are more regions with high-quality sticky-egg-spawning habitats. Moreover, the suitability of sticky-egg-spawning habitats in the Fuling–Yunyang River section is higher. The HSI_preference value slightly exceeds the HSI_use value, and the HSI_preference value indicates fewer regions in low-quality spawning habitats.
The prediction results were validated using data from eight sticky-egg-spawning grounds in the Fengdu County–Wanzhou District and Yunyang County–Badong County sections of the TGR. The HSI_use value was found to be lower than the HSI_preference value. The accuracy of the HSI_use value predictions is approximately 75%, while that of the HSI_preference value is around 87.5%.
The numbers of different sticky-egg-spawning habitat types in the low-, medium-, high-, and higher-quality categories are shown in Figure 7. High-quality and higher-quality spawning habitats were predominantly concentrated in backwater bays, convex-bank point bars, and concave-bank deep pools. In terms of the HSI_use value and HSI_preference value, backwater bays accounted for approximately 74.35% and 81.30% of the high-quality and higher-quality spawning habitats, respectively. Concave-bank deep pools accounted for 90%, while convex-bank point bars accounted for approximately 70%. The spawning habitats in the point bars were concentrated in the middle-quality and high-quality areas. For the straight river channels, no higher-quality spawning habitats were found; instead, these areas showed mostly low-quality and medium-quality spawning habitats, with the HSI_use value and HSI_preference values accounting for 75.00% and 58.70%, respectively.
To summarize, both methods were found to accurately predict the suitability of habitats for sticky-egg-spawning fish in the TGR. The spawning habitats of backwater bays, convex-bank point bars, and concave-bank deep pools were concentrated in the high-quality and higher-quality regions, mainly in the Fuling–Yunyang section. The habitat suitability of point bar and straight river channel environments was low.

4. Discussion

4.1. Comparison of River Habitat Classification Methods

Due to the complexity of river habitats and the different academic backgrounds and application aims of researchers, our understanding of river habitats is diverse. The characteristics of river habitats are affected by geomorphology, precipitation, temperature, development history, and other factors [38,39]. There is no uniform standard for river habitat classification due to the spatial heterogeneity of various factors [40]. For example, based on the stream order, elevation, slope, sinuosity, and river network density, the habitats in the Chishui River basin were divided into six sub-groups: steep tributaries, high-altitude headwater habitats, upstream dense river net habitats, midstream low-curved habitats, low-altitude estuary tributaries, and downstream flat habitats [15]. The habitats in the Taizi River basin were divided into five classes (excellent, good, fair, poor, or seriously polluted) based on water quality [17]. In addition, based on the morphology of the river’s geomorphic and water conservancy properties, the habitats were divided into rapids and slow-flowing units [41]. Both the index selection and classification results were diverse in the above analyses. In this study, a CCI was constructed based on the characteristics of the shoreline. The CCI can be used to describe the complexity of the shoreline. Based on the index and morphological parameters, riparian habitats were divided into five types: backwater bays, point bars, straight river channels, convex bank point bars, and concave bank deep pools. This classification method achieved good results for the shoreline habitat classification of the TGR and has reference value for research on other reservoirs (especially river reservoirs). In future research, the applicability of the classification of natural river riparian habitats will be tested further.

4.2. Assessment Methods for Habitat Suitability

The construction of a suitability curve of key factors is an important task in fish functional habitat suitability assessment [2,42]. Previous studies have found that water depth, velocity and sediment, vegetation coverage, and slope, among other factors, are commonly used for assessing habitat suitability [43,44,45,46,47]. In this study, the CCI, vegetation coverage, and slope were selected to construct the habitat suitability curve. The advantage of this approach is that no field measurements are required, and the three indicators can be quickly obtained through remote sensing data, enabling continuous observations over a large range. In addition, the CCI can characterize the river shoreline complexity and flow velocity along the shore. The larger the CCI value is, the more complex the shoreline is, and the smaller the shore velocity is. Vegetation is the main spawning medium for sticky-egg-laying fish. Additionally, the slope has an impact on the velocity and depth of the river bank. In this study, we did not employ the current mainstream habitat suitability models, because it is difficult to obtain continuous and large-scale data for parameters such as velocity and water depth.
There are many studies on habitat utilization methods for constructing habitat suitability curves [47,48,49]. However, the proposed method is based on frequency distribution, which can be obtained from the habitat use of the target species in a specific life stage, without considering the availability of a given habitat type. In this study, the habitat utilization method and habitat preference method were compared. The former only considered the survey data of spawning grounds, while the latter integrated the overall distribution of habitats in the TGR, considering the availability of a given habitat type. For slope and vegetation coverage, the optimal ranges of the two methods were found to be consistent, but the value of the habitat preference method was larger in the other intervals. For the CCI, the optimal range of the two methods was different. When the use value is the maximum, the corresponding CCI is 2–4, while when the preference value is the maximum, the CCI is 6–8 (Figure 5). This is because, when considering the distribution of all habitats in the TGR, the number of habitats within the 6–8 range of the CCI is less than that within the 2–4 range. That is to say, when the CCI is 6–8, the proportion of this habitat number to the number of all habitats is lower compared to the proportion with a CCI between 2 and 4. This decrease in the habitat proportion may lead to an increase in the preference values, consequently resulting in different CCI ranges when both the use value and preference values are at their maximum. In practical applications, appropriate indicators and methods should be selected for the habitat simulation according to different purposes and research scales.
In addition, it should be pointed out that the survey results of the spawning grounds in this study were consistent with our expectations; the largest number of spawning ground habitats were located in backwater bays, while the point bars and straight river channels had the fewest spawning grounds (Table 3). However, the limitation of our study was that only one year’s worth of spawning ground survey data were available, and long-term survey data were lacking. The number and stability of spawning ground data could potentially influence the accuracy of our habitat suitability assessment. In future research, we intend to address this limitation by conducting ongoing investigations of spawning grounds and incorporating long-term survey data for a more comprehensive analysis.

4.3. Application Prospects

With the utilization of rivers, the number of reservoirs is increasing, and the protection of fish resources in reservoirs has attracted the attention of researchers [50,51,52,53,54]. The application prospects of the main results of this study concern two aspects: (1) the zoning protection of important habitats, and (2) the protection of backwater sections in the tributaries.
The prediction results for the suitability of the spawning habitats showed that approximately 75% of the 230 backwaters had an HSI value greater than 0.5, indicating the presence of high-quality or higher-quality spawning habitats. There are many widely distributed backwater bay habitats in the TGR, most of which are suitable sticky-egg-spawning grounds. Therefore, the protection of habitats in backwater bays is of crucial importance and should be strengthened in the future. In addition, the water level of the main stream rises as the water returns to the tributary estuaries, which slows the flow velocity of the tributaries. The tributaries can change from river channels into backwater bays, and their water environments and species diversity can also be affected [55,56,57]. In habitat protection, in addition to paying attention to the reservoir itself, the inflow tributaries also represent key areas required for fish to complete their lifecycles. The comprehensive consideration of tributaries, reservoir basins, and river basins will help to improve the effective management of the fish populations, communities, and habitats in the reservoir.
In this study, the main stream of the TGR was investigated, but we still employed the habitat classification methods for tributaries and river basins. In future research, we will focus on differences between habitat types in different inflow tributaries and provide a scientific basis for the habitat protection of aquatic biological resources, as well as the sticky-egg-spawning habitats of fish.

5. Conclusions

This paper proposes a novel approach for classifying river habitats, resulting in the identification of five distinct habitat types: the backwater bay, point bar, straight river channel, convex-bank point bar, and concave-bank deep pool. A habitat model was developed to assess the suitability of these habitats as spawning grounds for sticky-egg-laying fish. The results demonstrate a high accuracy in habitat classification, highlighting backwater bays as the predominant habitat type in the TGR. This study shows that the CCI, slope, and vegetation coverage can be used to evaluate spawning habitat suitability, achieving good results. Our analyses indicate that the backwater bay, convex-bank point bar, and concave-bank deep pool areas exhibit high suitability for the spawning of fish, whereas point bar and straight river channel areas show lower suitability in the TGR. Moreover, the presented method provides a valuable foundation for further research assessing fish habitat suitability and can also be applied to evaluate habitats in other rivers.

Author Contributions

Conceptualization, Z.M., L.Y. and L.W.; methodology, Z.M., L.Y. and L.W.; software, Z.M. and F.D.; validation, Z.M., L.Y., F.D., Y.Z. and Z.N.; formal analysis, Z.M., L.Y. and L.W.; investigation, L.Y., F.D., Y.Z., Z.N. and Y.L. (Yunfeng Li); resources, Z.N., Y.L. (Yunfeng Li), Y.L. (Yingren Li) and L.W.; data curation, Z.M. and F.D.; writing—original draft preparation, Z.M.; writing—review and editing, Z.M., L.Y. and L.W.; visualization, Z.M.; supervision, Z.N., Y.L. (Yingren Li) and L.W.; project administration, Z.M., Z.N., Y.L. (Yingren Li) and L.W.; funding acquisition, Z.M., Z.N., Y.L. (Yingren Li) and L.W. All authors have read and agreed to the published version of the manuscript.

Funding

This research was funded by the Central Public Interest Scientific Institution Basal Research Fund, CAFS, China (No. 2022A002, 2020TD11 and 2018HY-ZD0101); Investigation and Loss Assessment of Fish Spawning and Hatching in the Fluctuation Area of the Three Gorges Reservoir, Yangtze River Basin Fisheries Administration Office, Ministry of Agriculture and Rural Affairs.

Institutional Review Board Statement

Not applicable.

Informed Consent Statement

Not applicable.

Data Availability Statement

Data can be made available upon request.

Conflicts of Interest

The authors declare no conflict of interest.

References

  1. Hu, J.; Yu, Y.; Gui, R.; Zheng, W.; Guo, A. Spatial Distribution Analysis of Landslide Deformations and Land-Use Changes in the Three Gorges Reservoir Area by Using Interferometric and Polarimetric SAR. Remote Sens. 2023, 15, 2302. [Google Scholar] [CrossRef]
  2. Liu, S.; Liao, Q.; Xiao, M.; Zhao, D.; Huang, C. Spatial and Temporal Variations of Habitat Quality and Its Response of Landscape Dynamic in the Three Gorges Reservoir Area, China. Int. J. Environ. Res. Public Health 2022, 19, 3594. [Google Scholar] [CrossRef] [PubMed]
  3. Chu, L.; Sun, T.; Wang, T.; Li, Z.; Cai, C. Evolution and Prediction of Landscape Pattern and Habitat Quality Based on CA-Markov and InVEST Model in Hubei Section of Three Gorges Reservoir Area (TGRA). Sustainability 2018, 10, 3854. [Google Scholar] [CrossRef]
  4. Perera, H.; Zhong-Jie, L.I.; Silva, S.; Zhang, T.L.; Liu, J.S. Effect of the distance from the dam on river fish community structure and compositional trends, with reference to the Three Gorges Dam, Yangtze River, China. Acta Hydrobiol. Sin. 2014, 38, 438–445. [Google Scholar] [CrossRef]
  5. Yi, Y.; Wang, Z.; Yang, Z. Impact of the Gezhouba and Three Gorges Dams on habitat suitability of carps in the Yangtze River. J. Hydrol. 2010, 387, 283–291. [Google Scholar] [CrossRef]
  6. Cai, W.; Zhang, L.; Zhu, X.; Zhang, A.; Yin, J.; Wang, H. Optimized reservoir operation to balance human and environmental requirements: A case study for the Three Gorges and Gezhouba Dams, Yangtze River basin, China. Ecol. Inform. 2013, 18, 40–48. [Google Scholar] [CrossRef]
  7. Wang, J.N.; Dong, Z.R.; Liao, W.G.; Li, C. An environmental flow assessment method based on the relationships between flow and ecological response: A case study of the Three Gorges Reservoir and its downstream reach. Sci. China Technol. Sci. 2013, 6, 1471–1484. [Google Scholar] [CrossRef]
  8. Huang, L.; Li, X.; Fang, H.; Yin, D.; Si, Y.; Wei, J.; Liu, J.; Hu, X.; Zhang, L. Balancing social, economic and ecological benefits of reservoir operation during the flood season: A case study of the Three Gorges Project, China. J. Hydrol. 2019, 572, 422–434. [Google Scholar] [CrossRef]
  9. New, T.; Xie, Z. Impacts of large dams on riparian vegetation: Applying global experience to the case of China’s Three Gorges Dam. Biodivers. Conserv. 2008, 17, 3149–3163. [Google Scholar] [CrossRef]
  10. Tian, M.; Zhou, J.; Jia, B.; Lou, S.; Wu, H. Impact of Three Gorges Reservoir Water Impoundment on Vegetation–Climate Response Relationship. Remote Sens. 2020, 12, 2860. [Google Scholar] [CrossRef]
  11. Leopold, L.B.; Wolman, M.G. River Channel Patterns—Braided, Meandering and Straight. Prof. Geographer 1957, 9, 39–85. [Google Scholar] [CrossRef]
  12. Schumm, S.A. The Fluvial System; Wiley: New York, NY, USA, 1977. [Google Scholar]
  13. Rosgen, D.L. A Classification of Natural Rivers. Catena 1994, 22, 169–199. [Google Scholar] [CrossRef]
  14. Bisson, P.A. A system of naming habitat types in small streams, with examples of habitat utilization by Salmonids during low stream flow. In Aquisition & Utilization of Aquatic Habitat Information; American Fisheries Society: Grand Rapids, MI, USA, 1981; pp. 62–73. [Google Scholar]
  15. Yu, F.; Liu, F.; Xia, Z.; Lin, P.; Xu, C.; Wang, J.; Hou, M.; Zou, X. Classification and Assessment Methods for Mountain Channel Habitats in the Chishui River Basin, China. Water 2022, 14, 515. [Google Scholar] [CrossRef]
  16. Zhang, Y.; Arthington, A.H.; Bunn, S.E.; Mackay, S.; Xia, J.; Kennard, M. Classification of flow regimes for environmental flow assessment in regulated rivers: The huai river basin, China. River Res. Appl. 2012, 28, 989–1005. [Google Scholar] [CrossRef]
  17. Wan, J.; Bu, H.; Zhang, Y.; Meng, W. Classification of rivers based on water quality assessment using factor analysis in Taizi River basin, northeast China. Environ. Earth Sci. 2013, 69, 909–919. [Google Scholar] [CrossRef]
  18. Rinaldi, M.; Gurnell, A.M.; Del Tánago, M.G.; Bussettini, M.; Hendriks, D. Classification of river morphology and hydrology to support management and restoration. Aquat. Sci. 2016, 78, 17–33. [Google Scholar] [CrossRef]
  19. Zhang, P.; Yang, Z.; Cai, L.; Qiao, Y.; Chen, X.; Chang, J. Effects of upstream and downstream dam operation on the spawning habitat suitability of Coreius guichenoti in the middle reach of the Jinsha River. Ecol. Eng. 2018, 120, 198–208. [Google Scholar] [CrossRef]
  20. Nicholas, E.J.; Michael, P.; Sarah, P.; Steve, C. Evidence of lake trout (Salvelinus namaycush) spawning and spawning habitat use in the Dog River, Lake Superior. J. Great Lakes Res. 2018, 44, 1117–1122. [Google Scholar] [CrossRef]
  21. Yi, Y.; Le, S. Habitat Suitability Function of Four Major Chinese Carps Spawning Sites in the Yangtze River. J. Basic Sci. Eng. 2011, 19, 117–122. [Google Scholar]
  22. Chang, Y.J.; Sun, C.L.; Chen, Y.; Yeh, S.Z.; Dinardo, G. Habitat suitability analysis and identification of potential fishing grounds for swordfish, Xiphias gladius, in the South Atlantic Ocean. Int. J. Remote Sens. 2012, 33, 7523–7541. [Google Scholar] [CrossRef]
  23. Liu, P.; Li, L.; Guo, S.; Xiong, L.; Zhang, W.; Zhang, J.; Xu, C. Optimal design of seasonal flood limited water levels and its application for the Three Gorges Reservoir. J. Hydrol. 2015, 527, 1045–1053. [Google Scholar] [CrossRef]
  24. Zhang, S.; Jing, Z.; Yi, Y.; Wu, Y.; Zhao, Y. The dynamic capacity calculation method and the flood control ability of the Three Gorges Reservoir. J. Hydrol. 2017, 555, 361–370. [Google Scholar] [CrossRef]
  25. Farsad Layegh, N.; Darvishzadeh, R.; Skidmore, A.K.; Persello, C.; Krüger, N. Integrating Semi-Supervised Learning with an Expert System for Vegetation Cover Classification Using Sentinel-2 and RapidEye Data. Remote Sens. 2022, 14, 3605. [Google Scholar] [CrossRef]
  26. Pacheco-Pascagaza, A.M.; Gou, Y.; Louis, V.; Roberts, J.F.; Rodríguez-Veiga, P.; Da Conceição Bispo, P.; Espírito-Santo, F.D.B.; Robb, C.; Upton, C.; Galindo, G.; et al. Near Real-Time Change Detection System Using Sentinel-2 and Machine Learning: A Test for Mexican and Colombian Forests. Remote Sens. 2022, 14, 707. [Google Scholar] [CrossRef]
  27. McFeeters, S.K. The use of the Normalized Difference Water Index (NDWI) in the delineation of open water features. Int. J. Remote Sens. 1996, 17, 1425–1432. [Google Scholar] [CrossRef]
  28. Choi, Y.; Ban, H.; Han, H.; Hong, S. A Maritime Cloud-Detection Method Using Visible and Near-Infrared Bands over the Yellow Sea and Bohai Sea. Remote Sens. 2022, 14, 793. [Google Scholar] [CrossRef]
  29. Otsu, N. A Threshold Selection Method from Gray-Level Histograms. IEEE Trans. Syst. Man Cybern. 2007, 9, 62–66. [Google Scholar] [CrossRef]
  30. Xu, W.; Yang, Z.; Yi, R.; Yao, J.; Chen, X. Relationship between environmental variables and egg abundance of the four major Chinese carps, downstream of the Three Gorges Reservoir. River Res. Appl. 2021, 37, 1191–1200. [Google Scholar] [CrossRef]
  31. Yang, S.; Gao, X.; Ma, B.; Kong, Y.; Liu, H. Seasonal Dynamics of Fish Community in Mudong Section of the Three Gorges Reservoir of the Yangtze River, China. Chin. J. Appl. Environ. Biol. 2010, 16, 555–560. [Google Scholar]
  32. CN-HJ 710.7; Technical Guidelines for Biodiversity Monitoring—Inland Water Fish. Ministry of Environmental Protection: Beijing, China, 2014.
  33. Qian, N. Fluvial Processes Study; Science Press: Beijing, China, 1987. [Google Scholar]
  34. Gutman, G.; Ignatov, A. The derivation of the green vegetation fraction from NOAA/AVHRR data for use in numerical weather prediction models. Int. J. Remote Sens. 1998, 19, 1533–1543. [Google Scholar] [CrossRef]
  35. Yi, Y.; Cheng, X.; Zhou, J. Research progress in habitat suitability assessment methods. Ecol. Environ. Sci. 2013, 22, 887–893. [Google Scholar] [CrossRef]
  36. Yi, Y.; Wang, Z.; Yang, Z. Two-dimensional habitat modeling of Chinese sturgeon spawning sites. Ecol. Model. 2010, 221, 864–875. [Google Scholar] [CrossRef]
  37. Hess, G.R.; Bay, J.M. A Regional Assessment of Windbreak Habitat Suitability. Environ. Monit. Assess. 2000, 61, 239–256. [Google Scholar] [CrossRef]
  38. Lee, B.; Leroy, P.N.; Daniel, M.; Thomas, D.; Gordon, R.; George, P.; Michael, P. The Network Dynamics Hypothesis: How Channel Networks Structure Riverine Habitats. Bioscience 2004, 54, 413–427. [Google Scholar] [CrossRef]
  39. Allan, J.D. Stream Ecology: Structure and Function of Running Waters; Chapman & Hall: London, UK, 2021. [Google Scholar]
  40. Cohen, P.; Andriamahefa, H.; Wasson, J.G. Towards a regionalization of aquatic habitat: Distribution of mesohabitats at the scale of a large basin. Regul. Rivers: Res. Manag. 1998, 14, 391–404. [Google Scholar] [CrossRef]
  41. Hawkins, C.P.; Kershner, J.L.; Bisson, P.A.; Bryant, M.D.; Decker, L.M.; Gregory, S.V.; Mccullough, D.A.; Overton, C.K.; Reeves, G.H.; Steedman, R.J. A Hierarchical Approach to Classifying Stream Habitat Features. Fisheries 1993, 18, 3–12. [Google Scholar] [CrossRef]
  42. Yao, W.; Zhao, T.; Chen, Y.; Yu, G.; Xiao, M. Assessing the river habitat suitability and effects of introduction of exotic fish species based on anecohydraulic model system. Ecol. Inform. 2018, 45, 59–69. [Google Scholar] [CrossRef]
  43. Kang, H.; Choi, B. Dominant Fish and Macroinvertebrate Response to Flow Changes of the Geum River in Korea. Water 2018, 10, 942. [Google Scholar] [CrossRef]
  44. Belgiorno, V.; Naddeo, V.; Scannapieco, D.; Zarra, T.; Ricco, D. Ecological status of rivers in preserved areas: Effects of meteorological parameters. Ecol. Eng. 2013, 53, 173–182. [Google Scholar] [CrossRef]
  45. Zhang, P.; Cai, L.; Yang, Z.; Chen, X.; Qiao, Y.; Chang, J. Evaluation of fish habitat suitability using a coupled ecohydraulic model: Habitat model selection and prediction. River Res. Appl. 2018, 34, 937–947. [Google Scholar] [CrossRef]
  46. Nukazawa, K.; Shiraiwa, J.I.; Kazama, S. Evaluations of seasonal habitat variations of freshwater fishes, fireflies, and frogs using a habitat suitability index model that includes river water temperature. Ecol. Model. 2011, 222, 3718–3726. [Google Scholar] [CrossRef]
  47. Baruah, A.; Kumar Sarma, A.; Hinge, G. Hydrological–Hydrodynamic Nexus for Evaluation of Fish Habitat Suitability in the Bhogdoi River, India. J. Hydrol. Eng. 2021, 26, 04021032. [Google Scholar] [CrossRef]
  48. Vayghan, A.H.; Poorbagher, H.; Shahraiyni, H.T.; Fazli, H.; Saravi, H.N. Suitability indices and habitat suitability index model of Caspian kutum (Rutilus frisii kutum) in the southern Caspian Sea. Aquat. Ecol. 2013, 47, 441–451. [Google Scholar] [CrossRef]
  49. Li, H.; Zhang, H.; Yu, L.; Cao, K.; Wang, D.; Duan, X.; Ding, F.; Mao, Z.; Wang, K.; Liu, S.; et al. Managing Water Level for Large Migratory Fish at the Poyang Lake Outlet: Implications Based on Habitat Suitability and Connectivity. Water 2022, 14, 2076. [Google Scholar] [CrossRef]
  50. Guo, W.; Wang, H.; Xu, J.; Xia, Z. Ecological operation for Three Gorges Reservoir. Water Sci. Eng. 2011, 4, 143–156. [Google Scholar] [CrossRef]
  51. Ba, J.; Chen, D. Invasive fishes in Three Gorges Reservoir area and preliminary study on effects of fish invasion owing to impoundment. J. Lake Sci. 2012, 24, 5. [Google Scholar] [CrossRef]
  52. Gido, K.B.; Matthews, W.J.; Wolfinbarger, W.C. Long-Term Changes in a Reservoir Fish Assemblage: Stability in an Unpredictable Environment. Ecol. Appl. 2000, 10, 1517–1529. [Google Scholar] [CrossRef]
  53. Franssen, N.R.; Tobler, M. Upstream effects of a reservoir on fish assemblages 45 years following impoundment. J. Fish Biol. 2013, 82, 1659–1670. [Google Scholar] [CrossRef]
  54. Miranda, L.; Coppola, G.A.B.J. Reservoir Fish Habitats: A Perspective on Coping with Climate Change. Rev. Fish. Sci. Aquac. 2020, 28, 478–498. [Google Scholar] [CrossRef]
  55. Holbach, A.; Wang, L.; Chen, H.; Hu, W.; Schleicher, N.; Zheng, B.; Norra, S. Water mass interaction in the confluence zone of the Daning River and the Yangtze River—A driving force for algal growth in the Three Gorges Reservoir. Environ. Sci. Pollut. Res. 2013, 20, 7027–7037. [Google Scholar] [CrossRef]
  56. Yang, L.; Liu, D.; Huang, Y.; Yang, Z.; Ji, D.; Song, L. Isotope analysis of the nutrient supply in Xiangxi Bay of the Three Gorges Reservoir. Ecol. Eng. 2015, 77, 65–73. [Google Scholar] [CrossRef]
  57. Zhao, Y.; Zheng, B.; Wang, L.; Qin, Y.; Hong, L.; Wei, C. Characterization of Mixing Processes in the Confluence Zone between the Three Gorges Reservoir Mainstream and the Daning River Using Stable Isotope Analysis. Environ. Sci. Technol. 2016, 50, 9907–9914. [Google Scholar] [CrossRef]
Figure 1. Study area. The legend represents the extraction results of the water body information and the lower right corner shows the Yangtze River Basin.
Sustainability 15 12773 g001
Figure 2. Schematic diagram of the 5 habitat types.
Sustainability 15 12773 g002
Figure 3. Spatial distribution of habitat types in the Three Gorges Reservoir, China. (a) Spatial distribution of habitats in the main stream of the Three Gorges Reservoir; (b) habitat types in the Wanzhou–Fengjie section; (c) habitat types in the Wushan–Zigui section.
Sustainability 15 12773 g003
Figure 4. Distribution histogram of spawning grounds at different intervals for three habitat factors: (a) slope; (b) vegetation coverage; and (c) the CCI. The X-axis represents the different interval ranges of slope, vegetation coverage, and the CCI, while the Y-axis represents the number of spawning grounds in habitats within different interval ranges.
Sustainability 15 12773 g004
Figure 5. The usage and preference values of spawning grounds for a single variable: (a) slope; (b) vegetation coverage; (c) CCI.
Sustainability 15 12773 g005
Figure 6. Spatial distribution map of fish-spawning habitat suitability in the Three Gorges Reservoir. (a) Three Gorges Reservoir subsection HSI_use value; (b) Three Gorges Reservoir subsection HSI_preference value.
Sustainability 15 12773 g006
Figure 7. Statistical map of fish-spawning habitat suitability in the Three Gorges Reservoir: (a) HSI_use value; (b) HSI_preference value.
Sustainability 15 12773 g007
Table 1. RapidEye and Sentinel-2 satellite spectral band parameters.
RapidEyeSentinel-2
BandCentre WavelengthBandwidthCentre WavelengthBandwidth
Blue4757049065
Green5557056035
Red657.55566530
Red edge71040
Near Infrared80590842115
Table 2. The results according to habitat type in the Three Gorges Reservoir, China.
Habitat TypeNumberProportion/(%)Density
Backwater bay23043.30.40
Point bar9718.30.17
Straight river channel9217.30.16
Convex-bank point bar5510.40.10
Concave-bank deep pool5710.70.10
Table 3. Statistical table of the habitat types and habitat factors of spawning grounds in the investigated river section.
Habitat TypeNumber of Spawning GroundsSlope/(°)Vegetation CoverageCCI
MinMaxMinMaxMinMax
Backwater bay148.9823.020.390.732.168.98
Point bar225.6432.120.410.521.521.77
Straight river channel226.1530.400.480.491.341.45
Convex-bank point bar513.0321.710.300.651.592.30
Concave-bank deep pool414.8620.820.520.632.404.66
Disclaimer/Publisher’s Note: The statements, opinions and data contained in all publications are solely those of the individual author(s) and contributor(s) and not of MDPI and/or the editor(s). MDPI and/or the editor(s) disclaim responsibility for any injury to people or property resulting from any ideas, methods, instructions or products referred to in the content.

