Article

The Impact of Vegetation Canopy on the Outdoor Thermal Environment in Cold Winter and Spring

1
School of Environmental and Geographical Sciences, Shanghai Normal University, Shanghai 200234, China
2
Yangtze River Delta National Observatory of Wetland Ecosystem, Shanghai Normal University, Shanghai 200234, China
*
Author to whom correspondence should be addressed.
Sustainability 2023, 15(17), 12818; https://doi.org/10.3390/su151712818
Submission received: 30 July 2023 / Revised: 17 August 2023 / Accepted: 22 August 2023 / Published: 24 August 2023

Abstract

:
The current study investigated the impact of vegetation canopy on the outdoor thermal environment in cold winter and spring, a less-explored aspect of its climate effects. Firstly, we conducted on-site observations of meteorology parameters on a campus in a hot summer and cold winter region. Then the ENVI-met microclimate simulation model was utilized to simulate the air temperature, relative humidity, wind speed and direction, and solar radiation of typical winter and spring days. Furthermore, the PET index was calculated to evaluate the thermal conditions. Our findings revealed that during the daytime, the vegetation canopy raised air temperature and relative humidity, reduced wind speed, and mitigated solar radiation. Solar radiation emerged as the primary factor affecting thermal comfort in the cold winter and spring. The presence of deciduous broad-leaved vegetation notably reduced cold discomfort and improved thermal comfort in the cold winter and spring. Finally, we propose replacing evergreen broad-leaved vegetation with deciduous broad-leaved vegetation in hot summer and cold winter regions to ensure year-round thermal comfort, especially in the cold winter and spring.

1. Introduction

The proportion of the world’s population residing in urban areas surpassed the 55 percent milestone in 2018 [1]. Cities are centers of social innovation and economic development, which are highly susceptible to climate change, such as extreme temperatures [2,3]. The global urban population will grow by about 397 million people from 2015 to 2020, with over 90% of this growth occurring in developing countries [1]. As the largest developing country, China’s cities are expanding rapidly as part of the urbanization process, resulting in an escalation of urban climate issues amidst global warming concerns [4,5,6]. The contradiction between people’s pursuit of a healthy and comfortable outdoor environment and the poor urban climate is gradually coming to the fore [7,8,9].
The urban thermal environment is a comprehensive representation of the thermal conditions within the urban spatial environment, a concept developed upon the study of urban heat islands by environmental and meteorological researchers in recent years [10,11]. China released the “Guidelines for environmental performance assessment of urban ecological construction” in 2015, which included the evaluation of urban thermal environmental quality into the environmental quality evaluation system for the first time [12]. Thermal comfort evaluation is closely related to people’s lives and has significant practicality. It aims to assess the impact of the external thermal environment on people’s work and daily activities while discussing corresponding measures to enhance the thermal environment [13]. The microthermal environment is a physical environment directly related to human health and work efficiency that is susceptible to human factors, including the characteristics of the small-scale underlying surface and the arrangement of infrastructure patterns [14]. Improving the urban outdoor microthermal environment and enhancing the comfort of urban inhabitants is an important focus of urban ecology and urban thermal environment research.
Vegetation plays a critical role in the urban environment in summer as it can consume surface energy through photosynthesis and transpiration, and its shading capability is highly effective in blocking solar radiation [15,16,17]. Additionally, the vegetation canopy can indeed have a dragging effect on airflow, which results in obstruction and a reduction of wind speed [18,19]. Air temperature, solar radiation, wind speed, and humidity are the basic microclimate parameters to fully evaluate the human thermal environment in urban open spaces [8]. At present, the relationship between thermal comfort and vegetation is well-examined [15,18,20,21,22]. Many thermal indices were used to evaluate the climatic effects of vegetation, and the physiological equivalent temperature (PET) was the most frequently used thermal index in small-scale studies [21]. The arrangement [18], location [15], and irrigation [22] of vegetation are all relevant to improving thermal comfort in the summer. In winter, less attention is given to the impact of the vegetation canopy on outdoor microclimate parameters. Limited studies focus on winter thermal comfort in cold regions at mid- to high-latitudes [23,24] or high altitudes [25,26]. For instance, thermal discomfort in winter is observed in the presence of vegetation with a difference in mean radiant temperature [23]. A simulation conducted by Afshar [25] in Iran indicated that evergreens such as Eldarica pine, mainly due to the creation of permanent shadows, might not be the right option in regions with cold winters. However, it is worth noting that China has a wide range of hot-summer and cold-winter regions [27] with large populations, which warrants more attention to the impact of vegetation on the outdoor thermal environment in the cold winter and spring.
The current study focused on a campus, which is a typical type of urban open space, to investigate the impact of vegetation canopy on the outdoor thermal environment in the cold winter and spring. The objectives of the current study include the following: (i) examining the spatial and temporal characteristics of the influence of vegetation canopy on the outdoor thermal environment based on on-site observations and ENVI-met simulations on typical winter days and cold early spring days; (ii) evaluating the thermal environment with the thermal comfort index PET and assessing the contribution of different factors with the aim of reducing cold discomfort; and (iii) investigating strategies for improving thermal comfort during the cold winter and spring.

2. Materials and Methods

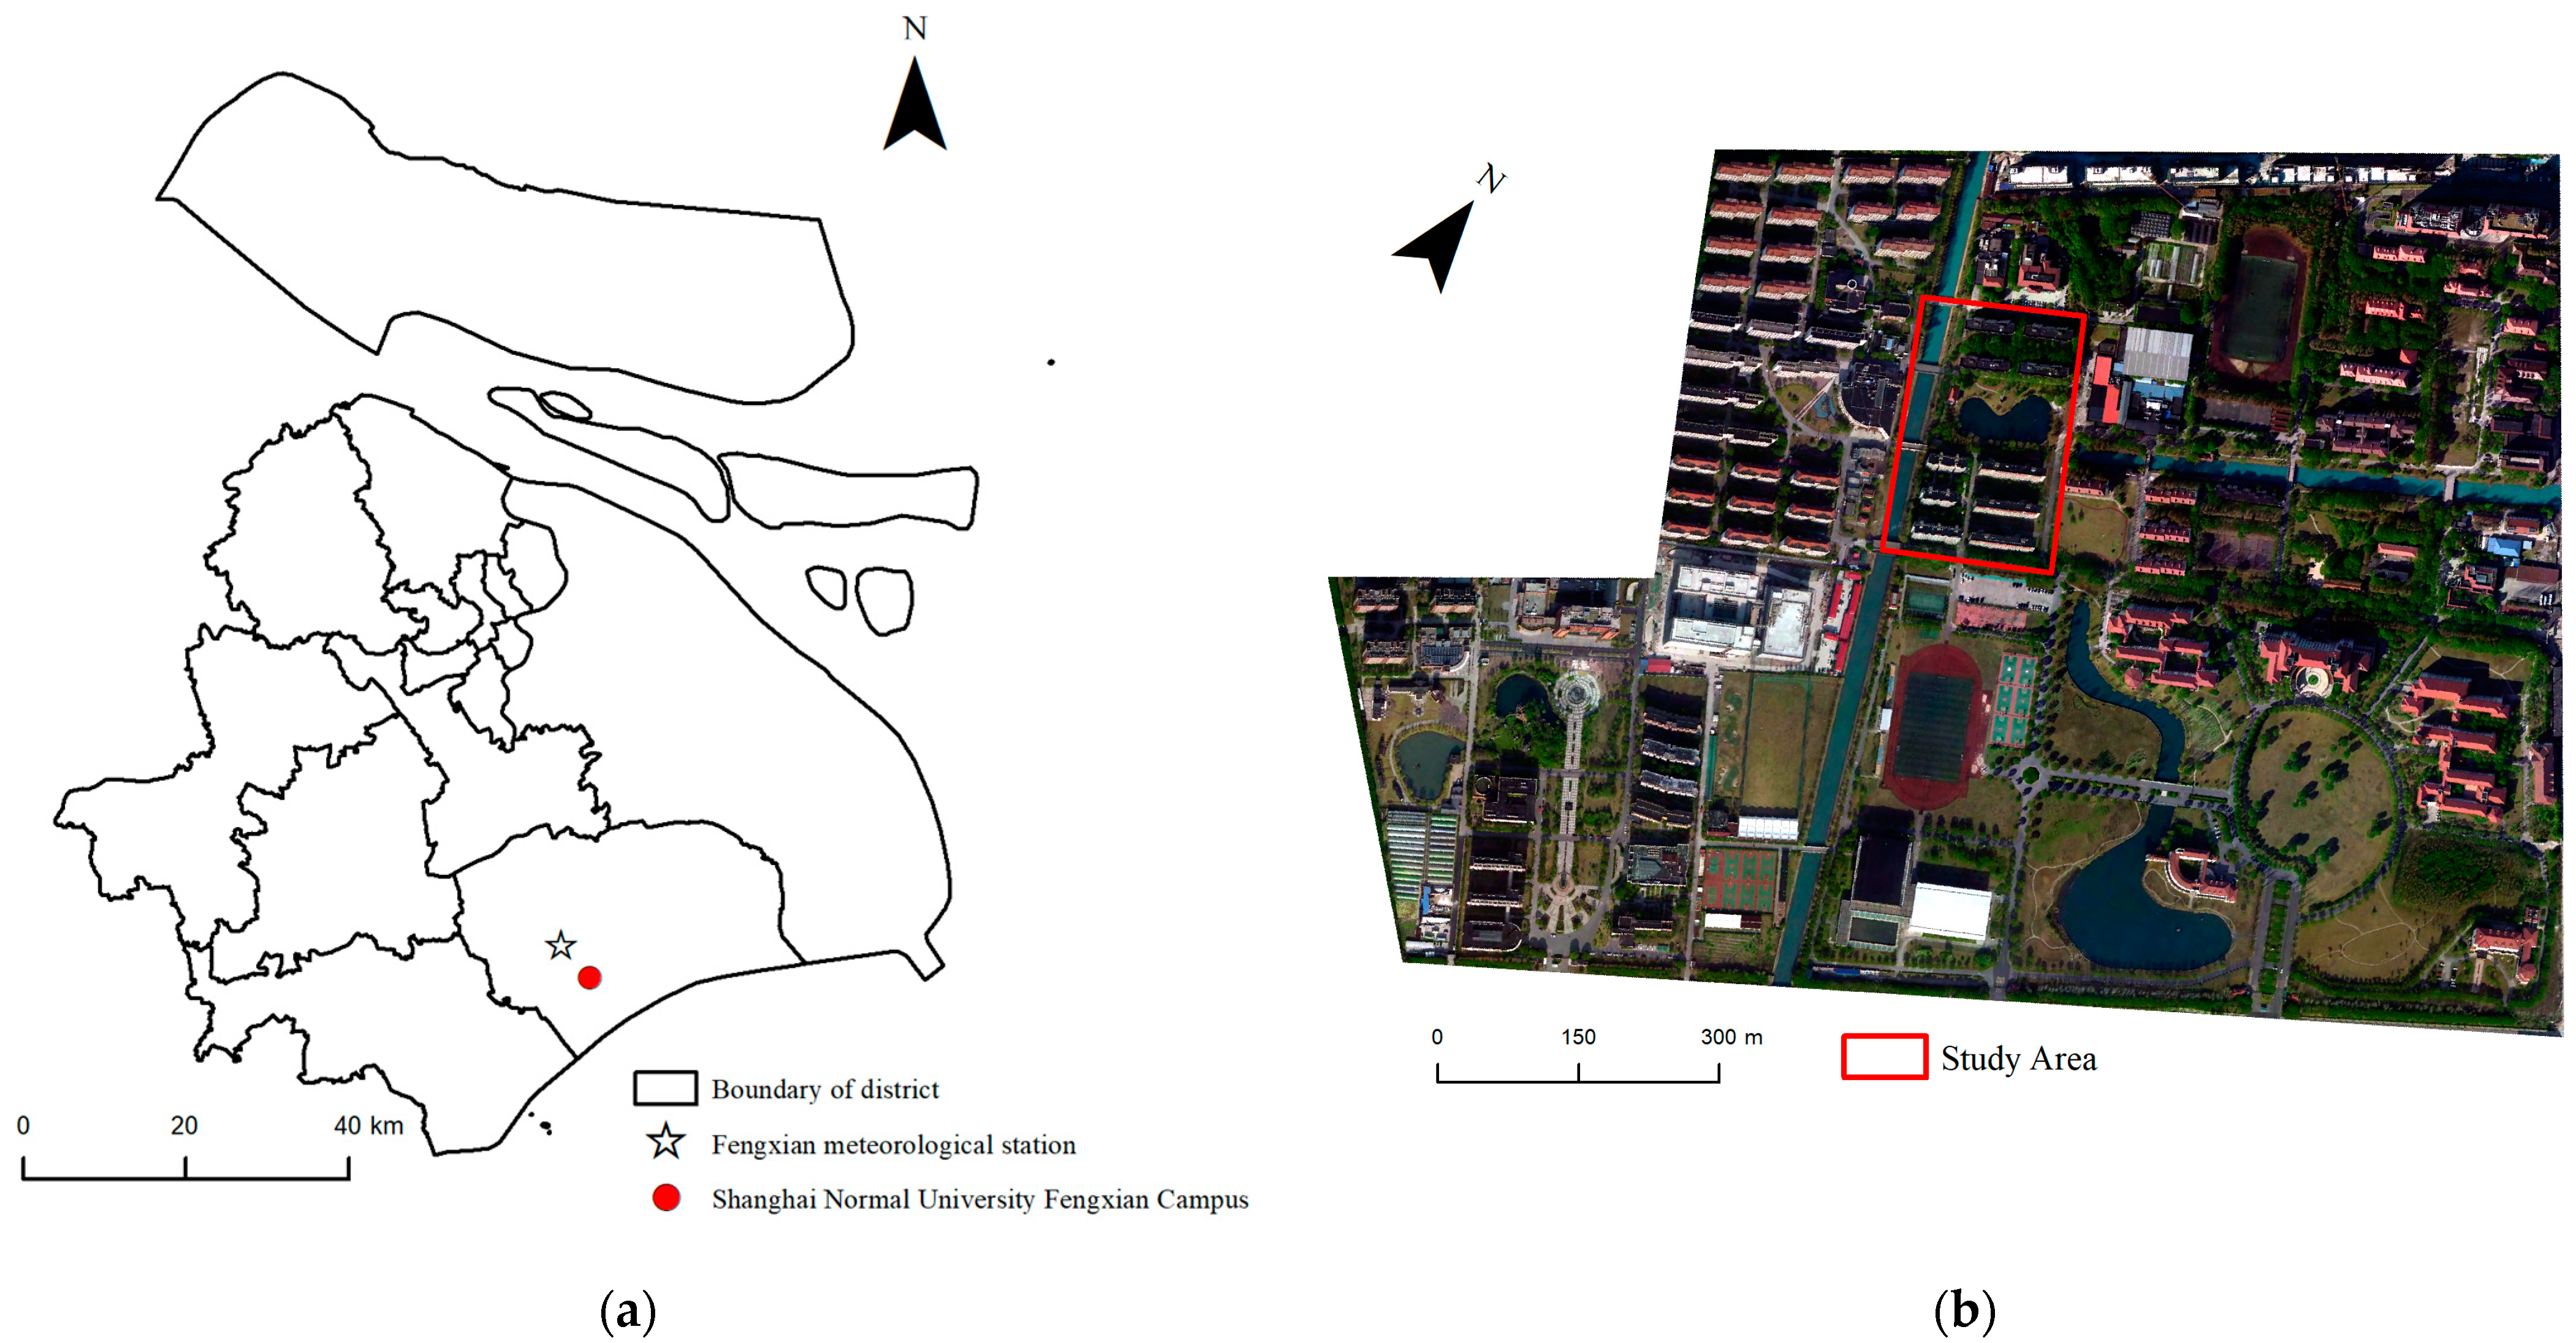
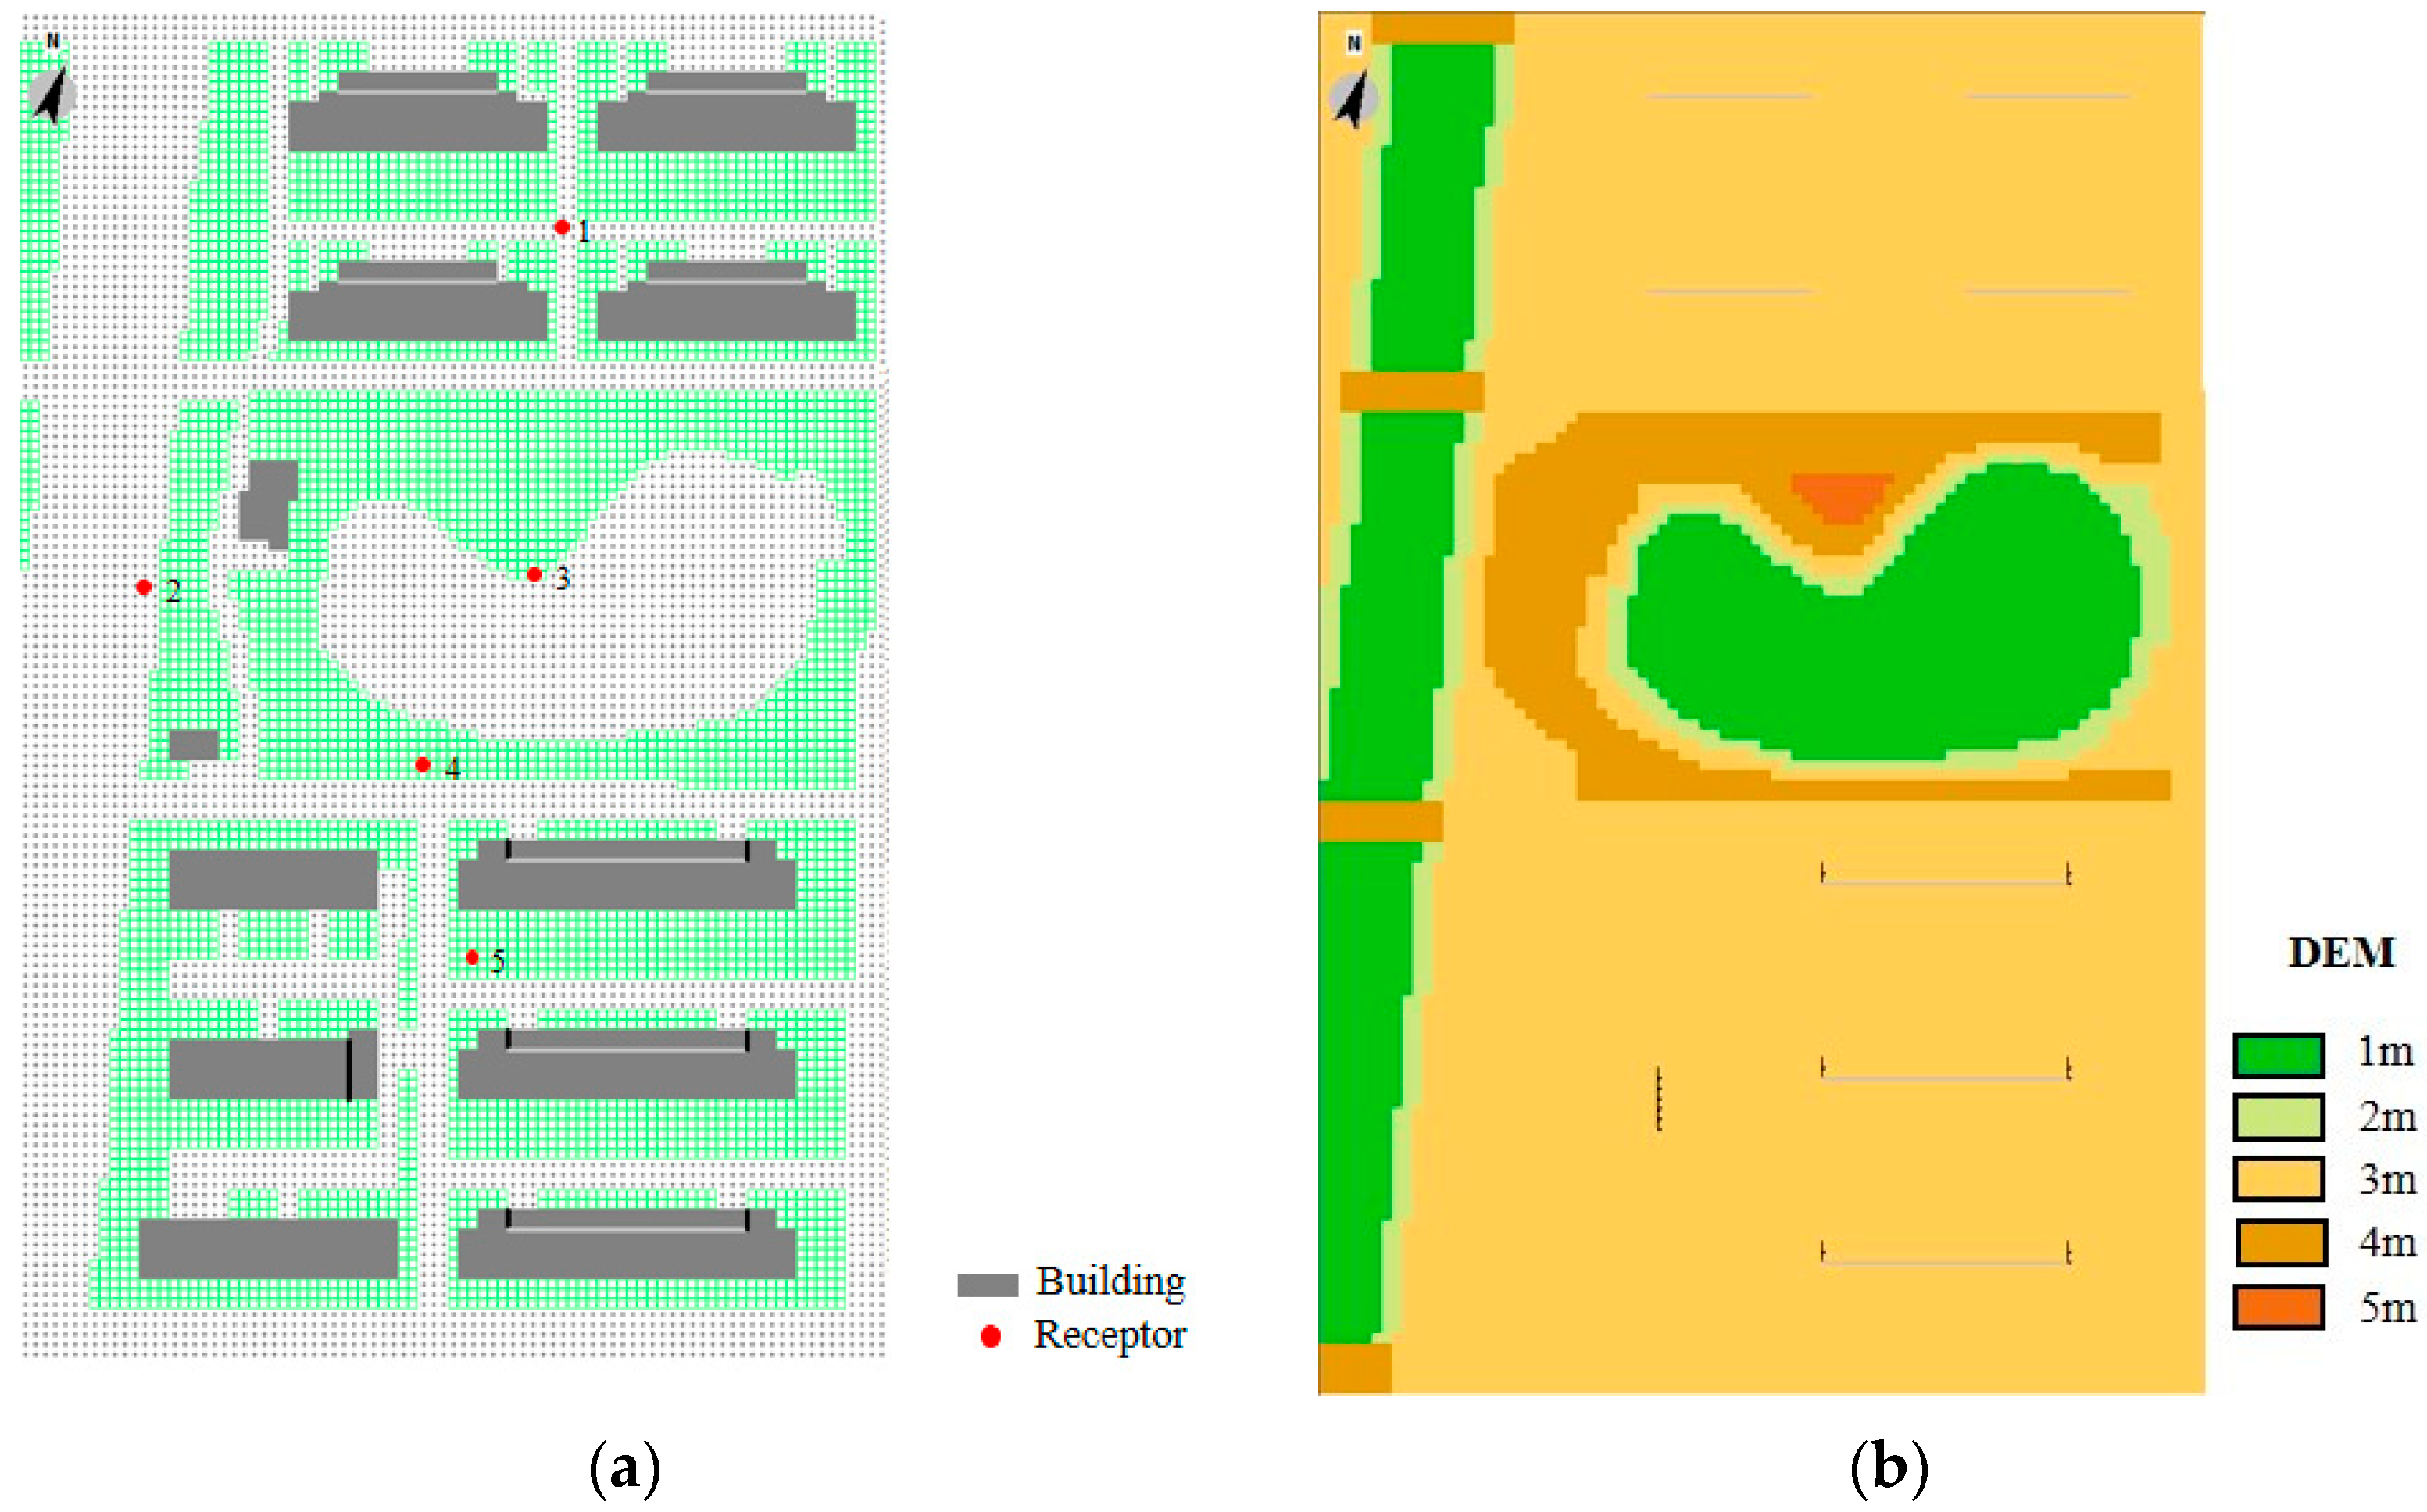
2.1. Study Area and Measured Site

Shanghai has a subtropical monsoon climate (120°50′–122°06′ E, 30°40′–31°52′ N) with sufficient annual precipitation. According to the Shanghai Statistical Yearbook from 2011 to 2021, the average temperature of the coldest month is 5.4 °C (the number of days with the average daily temperature ≤ 5 °C is 0–90 days), and the average temperature of the hottest month is 29.1 °C, which belongs to the hot-summer and cold-winter regions [27].
As shown in Figure 1, Shanghai Normal University Fengxian Campus is located in Fengxian District in the south of Shanghai. A typical dormitory area with a total area of 46,980 m2 was selected as the study area, which included 12 buildings (at a height of 5–18 m), artificial lakes, grassland, and trees. The included vegetation types are evergreen broadleaf, deciduous broadleaf, conifer, shrub, and grass.

2.2. On-Site Observations and Data Processing

Based on the “Division of Climatic Seasons” [28] and the meteorological data from Shanghai Xujiahui Station, the commencement of winter in 2022 and spring in 2023 in Shanghai occurred on 30 November 2022, and 4 March 2023, respectively. Therefore, the current study chose 20 January 2023 as a typical sunny day in winter and 6 March 2023 as a sunny day in early spring to conduct the on-site observations. Five Kestrel NK5500 weather stations were utilized for measuring meteorological parameters, including air temperature ( T a ), relative humidity (RH), wind speed (U), wind direction (WDir), and barometric pressure (BP). The weather stations offer high accuracy levels for the measured parameters: ±0.5 °C for air temperature with a resolution of 0.1 °C, ±2% for relative humidity with a resolution of 0.1%, and ±3% for wind speed with a resolution of 0.1 m · s 1 . The five observation sites were evenly distributed in the study area (Table 1), with diverse underlying surfaces, including impervious surfaces and grassland (Figure 2). The on-site observations were conducted from 8:00 to 20:00 local time, and the data recording interval was 10 min. To enable the observation of meteorological parameters at pedestrian height (at a height of 1.5 m above the ground), we installed the Kestrel NK5500 weather stations on a tripod with a height of 1.5 m.
In the current study, to mitigate the impact of abnormal values, we employed the Simple Moving Average (SMA) method to average T a and RH [29]. The SMA method equation is as follows:
S M A i = P i n + P i n + 1 + + P i + P i + n 1 + P i + n n
where i represents a certain time and 2n + 1 is the period of the moving average. The current study takes n to be 2 and the period to be 5.

2.3. Simulation Settings
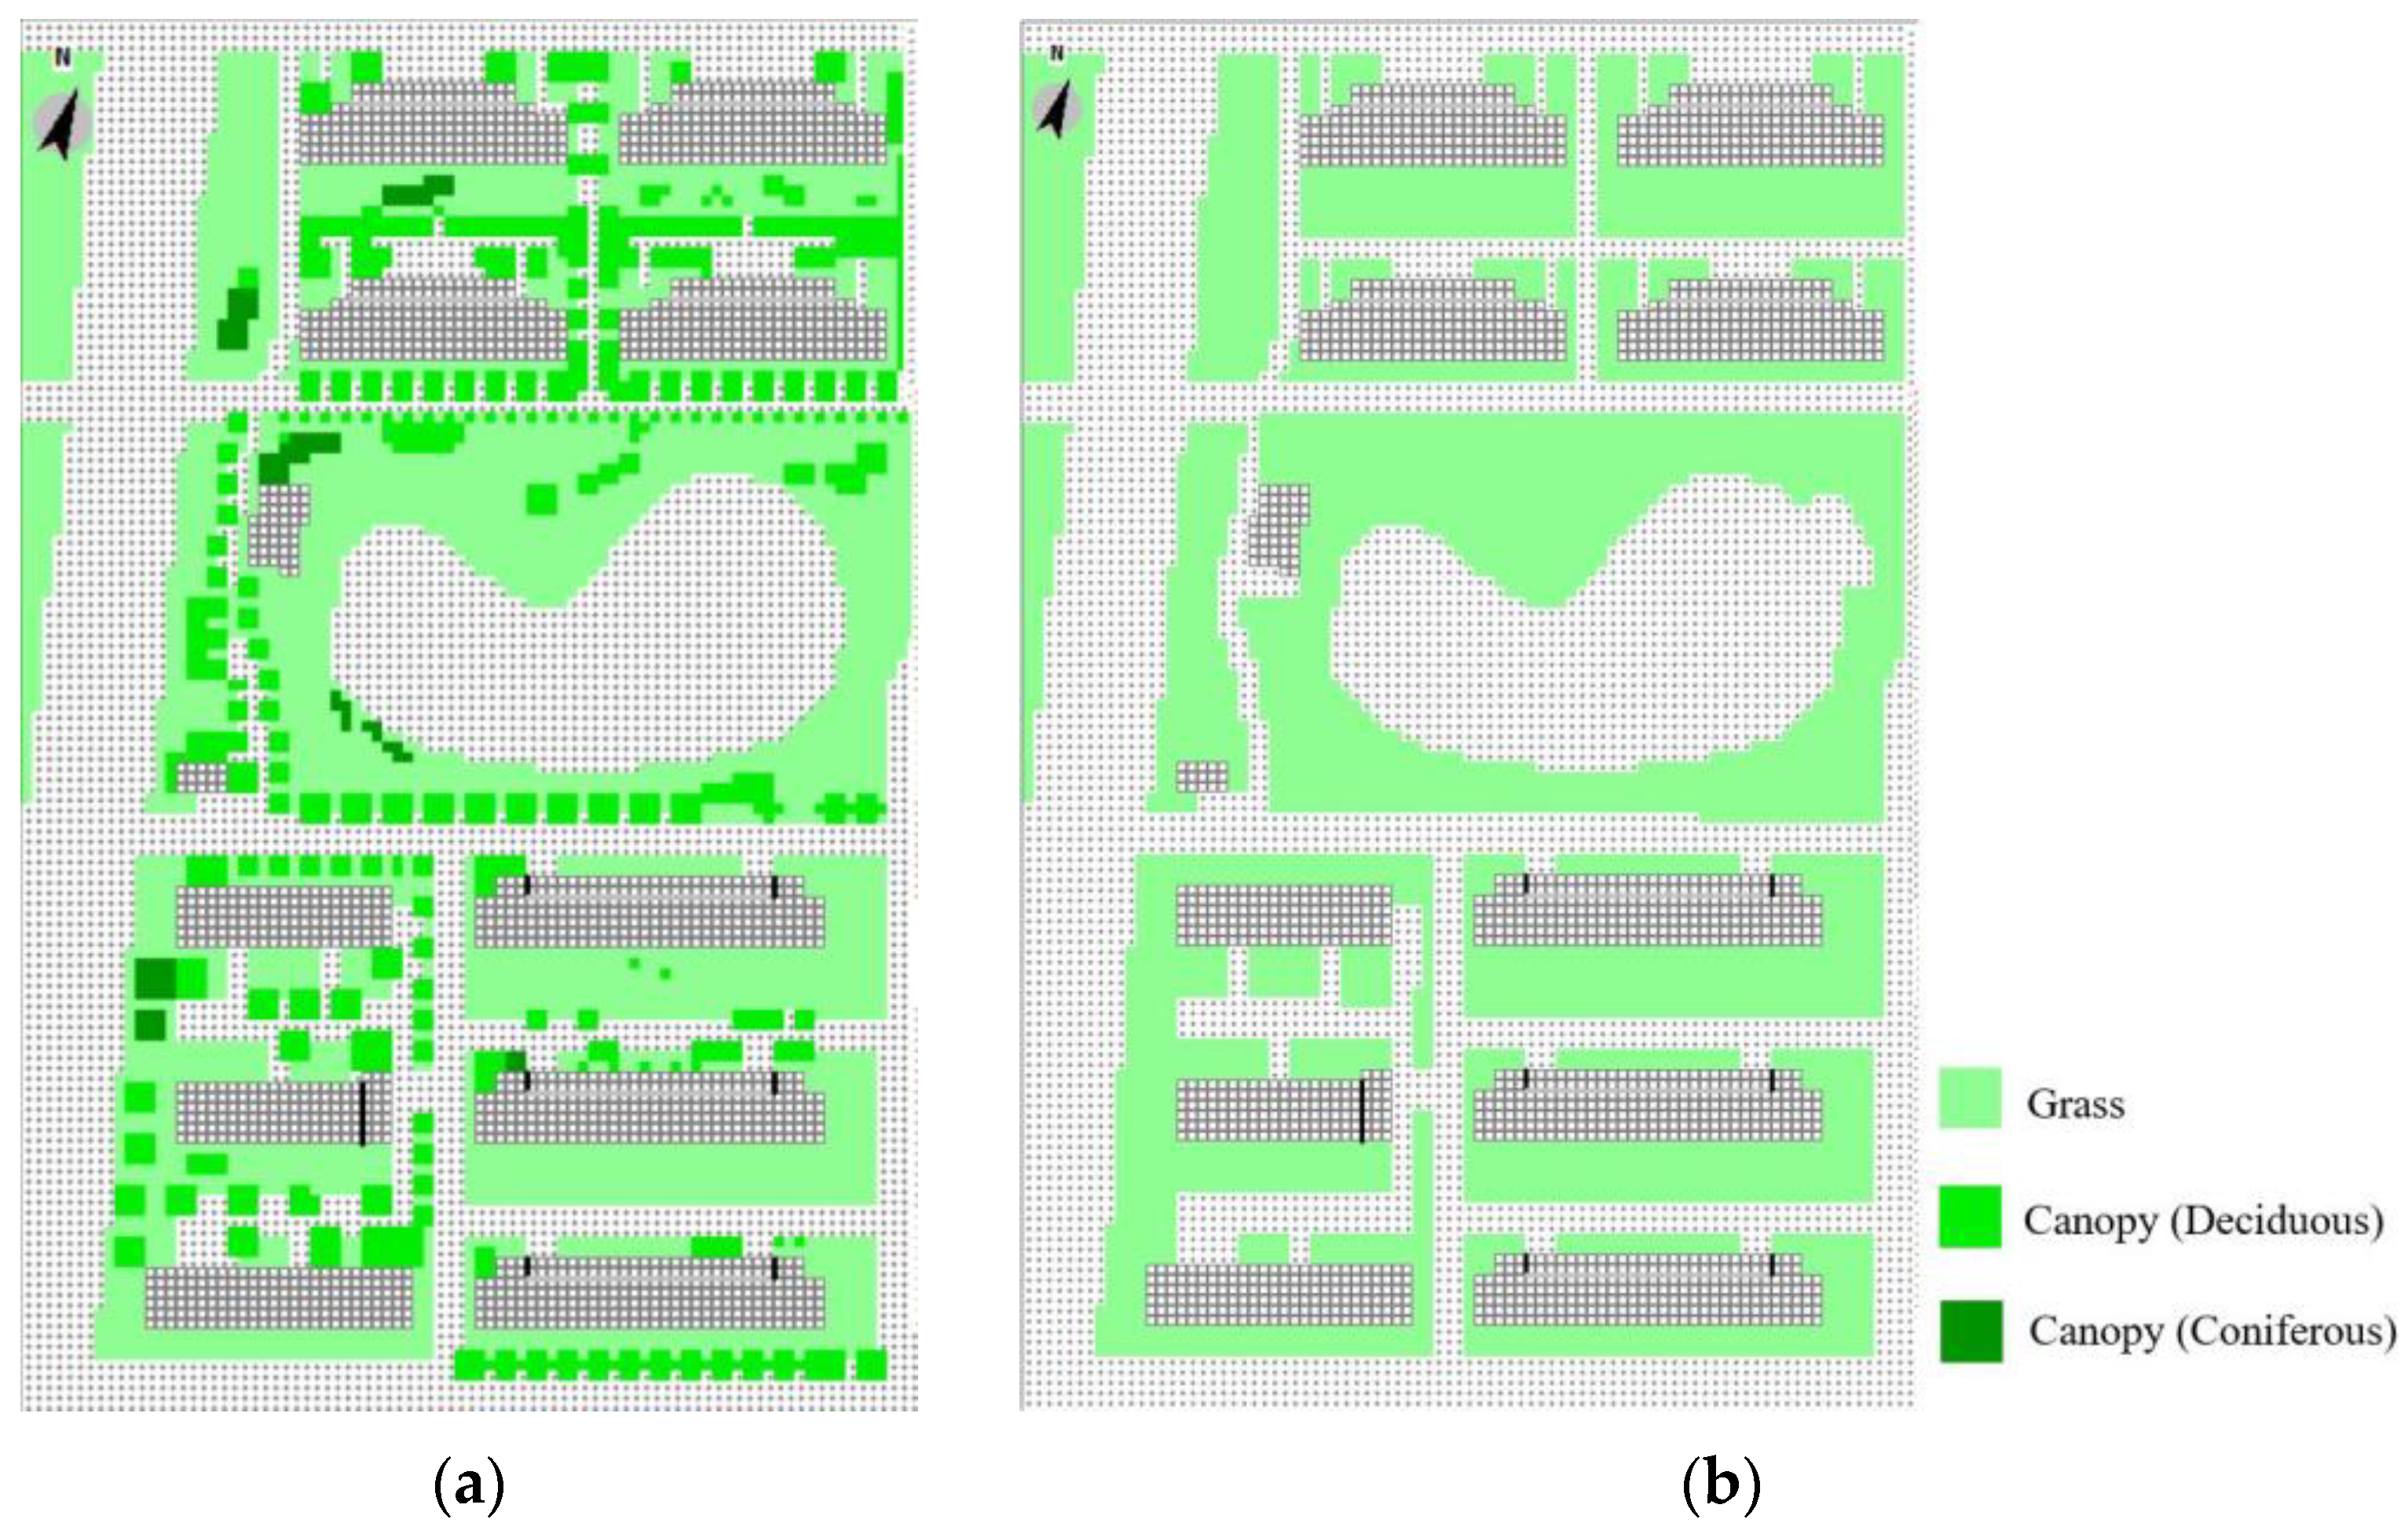
ENVI-met is a three-dimensional microclimate model with high spatial and temporal resolution that is currently the most widely used urban microclimate simulation research tool in the world [18,30]. The ENVI-met model is primarily composed of two main components in the pre-processing (Figure 3), which are used to generate “Area input file” and “Configuration file” [31]. In the “Area input file”, the first step involves creating a detailed geometry model of the site. This includes specifying the model’s location, defining its geometry, and setting up nesting grids for more refined simulations if needed. Next, a comprehensive database of building materials, soils, and plants is established based on their physical and thermal properties. This database is crucial for distinguishing between different underlying surface models and vegetation models. The leaf area density (LAD) is particularly important for accurately representing the vegetation model. In addition, a numerical simulation of the meteorological model must be constructed, including T a , RH, U, WDir, specific humidity at a height of 2500 m, and cloud cover for boundary simple forcing. After the simulation, we obtain “Output file” which contains the simulated temperature, humidity, wind speed, and solar radiation—four basic parameters for the calculation of the thermal comfort index PET.

2.3.1. Case Design

The core-domain for the simulation covered the same area as the on-site observations, which was a rectangle of 174 m × 270 m in the horizontal direction. The core-domain was discretized into a total of 87 × 135 grids with a grid size of 2 m × 2 m. For evaluating the precision of the ENVI-met simulations, five receptors were positioned to correspond to the observation sites, mirroring their locations (Figure 4a). Moreover, to ensure stability in areas near the border of the main model domain, a 7-grid-deep border was introduced around the perimeter. This border region was defined by an interleaved distribution of loamy soils and asphalt roads [18,32]. The building heights within the core-domain are 5 m and 18 m. To improve the representation of the buildings and minimize the grid-induced zigzag effect, the entire simulation domain was rotated clockwise by 21 degrees.
In the current study, the terrain was taken into account to more accurately describe the real scene. A DEM model was incorporated into the core-domain (Figure 4b). The height of the core-domain was fixed at 42 m (ensuring that the simulation domain’s height is more than twice the height of the tallest building), and we performed grid sensitivity testing with different vertical grid resolutions of 3 m, 2 m, 1 m, and 0.5 m. Furthermore, two cases were designed: the original case (Figure 5a) and the designed case (Figure 5b). The original case represented the current campus scene, including the existing vegetation canopy, and the designed case portrayed the campus scene without any vegetation canopy. In total, ten cases were considered in the study, as presented in Table 2.

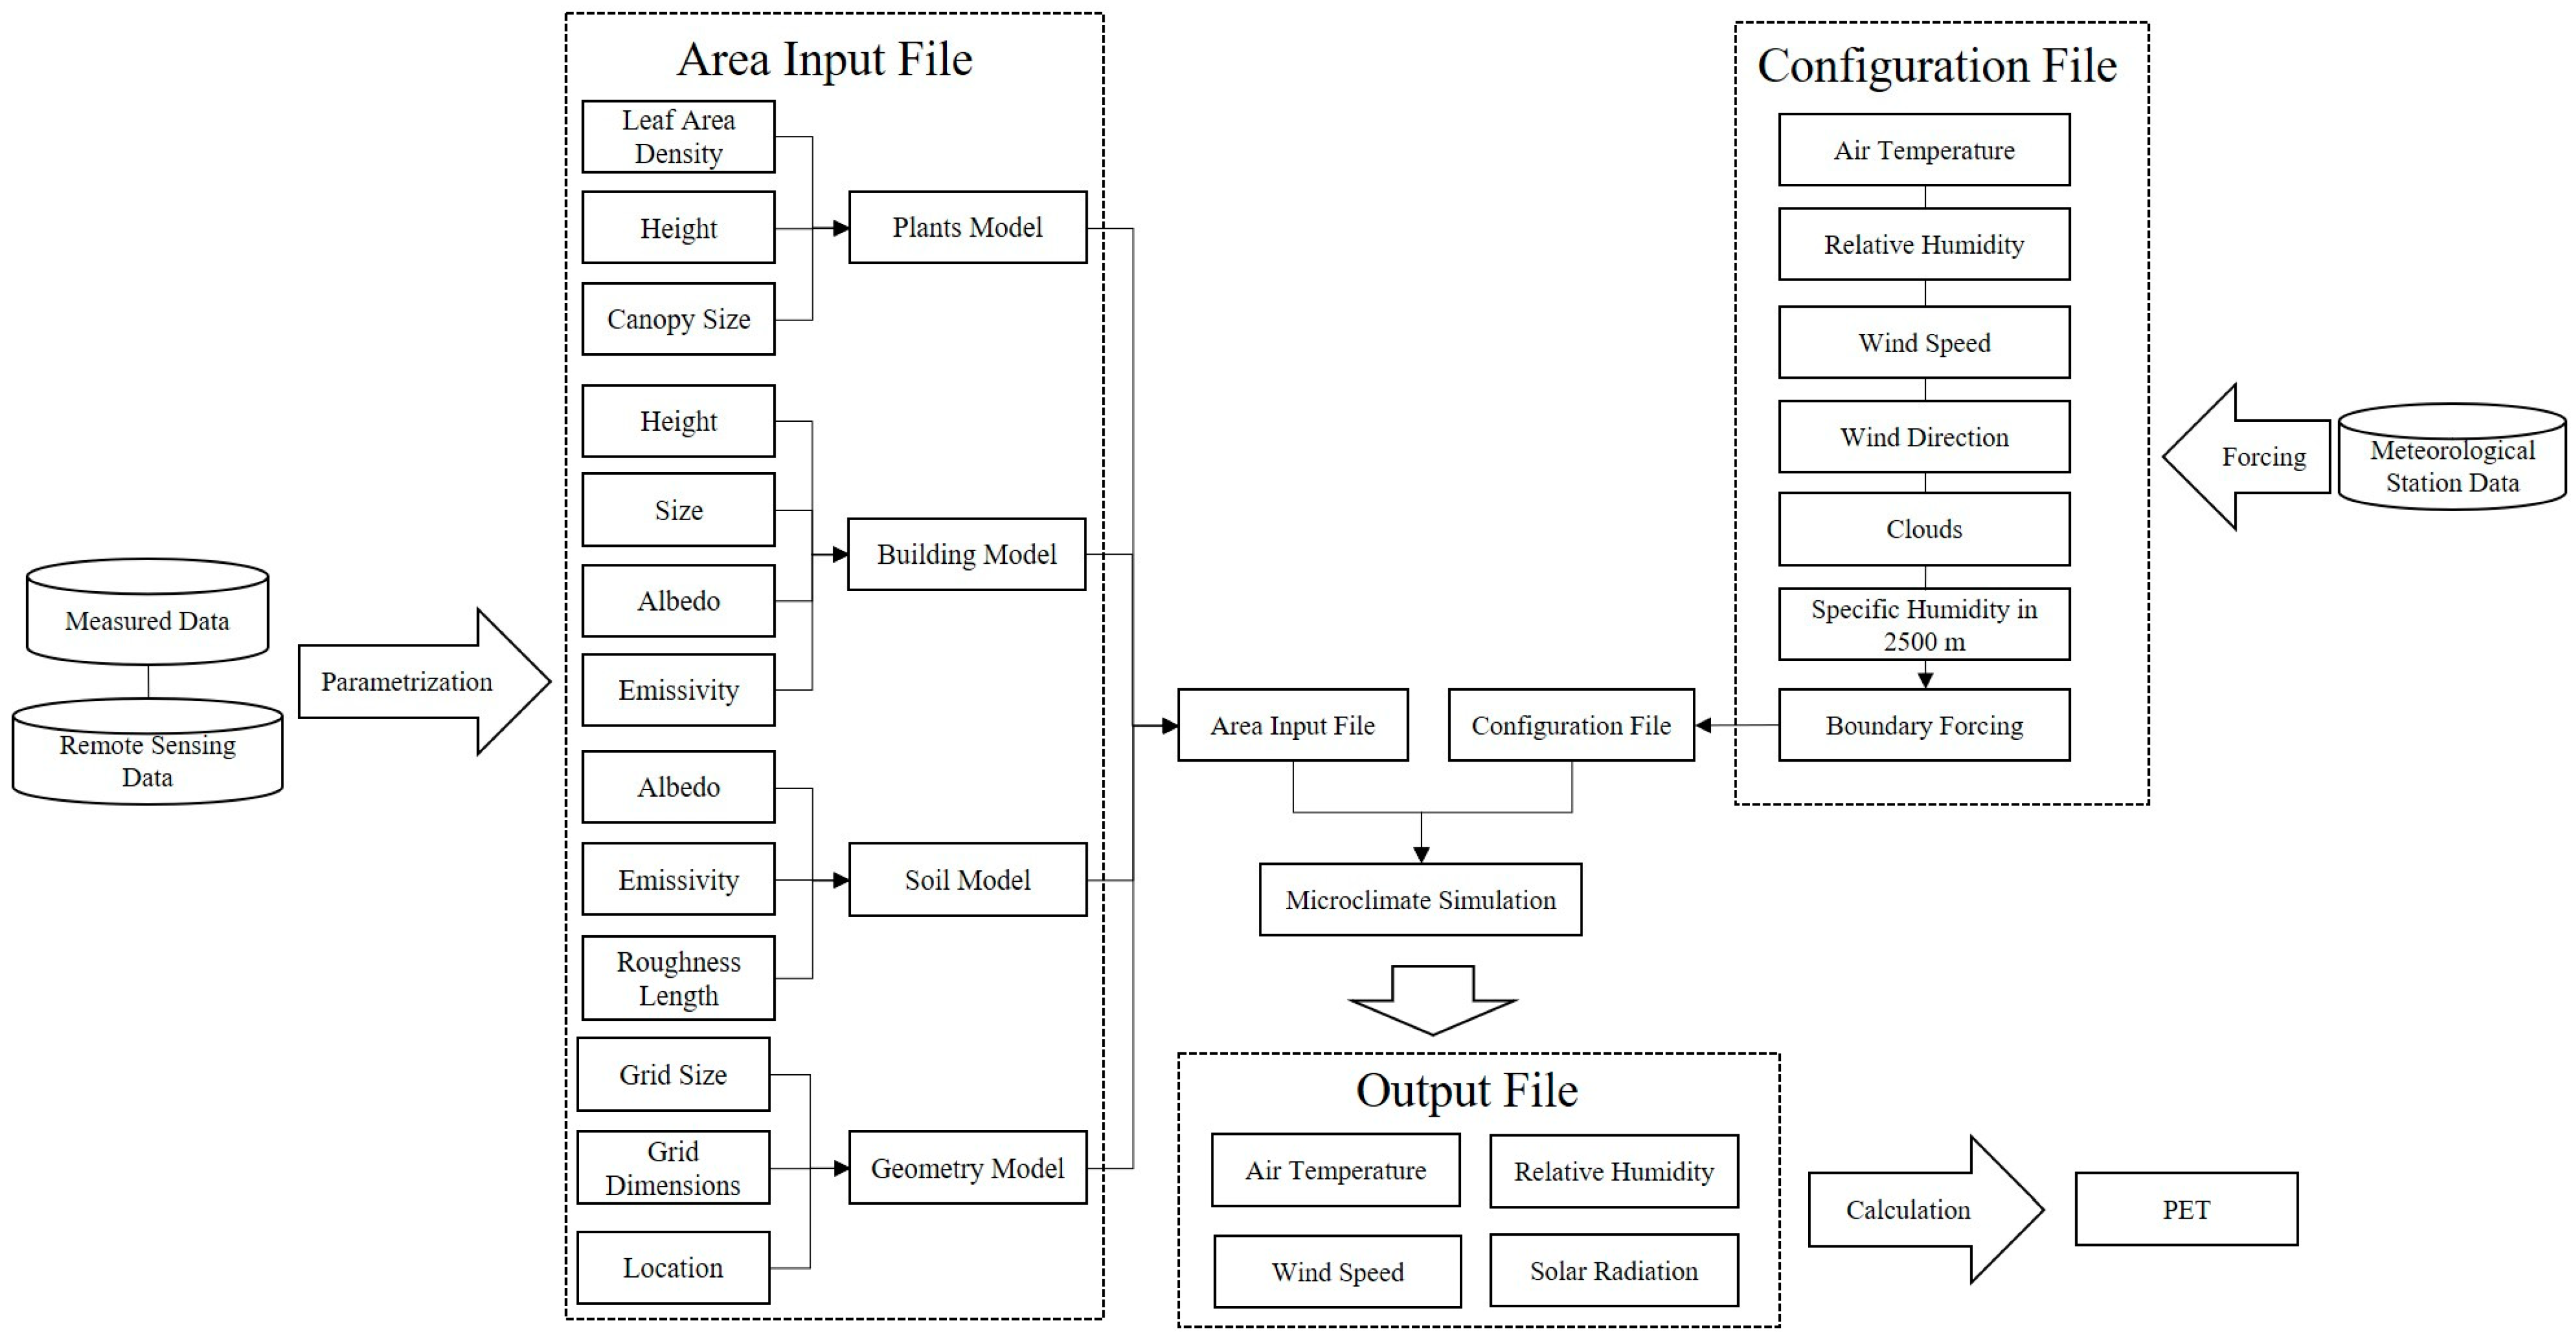
2.3.2. Parametrization

  • Surface and building parameters;
Based on the actual underlying surface and building conditions in the study area, we chose several materials from the ENVI-met default database to represent the soil and building surfaces within the model. The specific parameters for these materials are provided in Table 3.
2.
Vegetation parameters
In the current study, we employed the default parameters from the ENVI-met plants database for grass, while the Leaf Area Index (LAI) of the main tree species in the study area was measured using the third generation of Tracing Radiation and Architecture of Canopies (TRAC-III). The specific parameters for the plant model are shown in Table 4. LAD is the total one-sided leaf area (m2) per unit volume (m3). The value of LAD was calculated using an empirical LAD model [33]. Additionally, a simple vertical plant model was constructed and incorporated into the plant database. The empirical equations are as follows:
L A I   = 0 h L A D z d z = 0 h L m h z m h   z n exp n 1 h z m h z d z ,
n   = 6   0 z z m 0.5   z m z h
where h is tree height, L m is the maximum value of LAD at the corresponding height of z m , z is the height of different layers of tree canopy, and n is the number of layers, which was defined as 10 in the current study.
3.
Boundary conditions
In the current study, ENVI-met (version 5.1.1) was used to simulate the meteorological parameters. The simulation was conducted from 6:00 to 22:00 for 20 January and 6 March 2023. To set the boundary conditions for meteorology, the model employed simple forcing. The required input parameters include T a and RH data at a height of 2 m, U and Wdir at a height of 10 m, the specific humidity at a height of 2500 m, and cloud cover conditions. T a , RH, U, and Wdir data were obtained from Fengxian meteorological station [34]. For specific humidity at a height of 2500 m, we calculated the near-surface specific humidity using the measured T a , RH, and BP. The calculation equations for specific humidity on sunny days [35] are as follows:
V = R H   ×   V s 100 ,
Q = 0.622 V P   0.278 V
where V is water vapor pressure, P is barometric pressure, RH is relative humidity, V s is saturated water vapor pressure, and Q is specific humidity.
The boundary condition parameters for ENVI-met simulations are shown in Figure 6 and summarized in Table 5.

2.4. Outdoor Thermal Comfort Indices

Thermal comfort is defined as ‘‘the condition of the mind in which satisfaction is expressed with the thermal environment’’ [36,37]. The thermal comfort index considered various environmental factors, such as air temperature, relative humidity, wind speed, mean radiation temperature, and factors like clothing and metabolic level [38]. For outdoor thermal comfort evaluation, Höppe introduced the physiological equivalent temperature (PET) based on Munich Energy-balance Model for Individuals (MEMI) [39]. PET is widely used for outdoor thermal environment evaluation for the following advantages: (1) It relies on a detailed thermophysiological mechanism, providing a basis for accurate evaluation of outdoor thermal conditions; (2) The unit of PET is °C, commonly used for daily assessments of hot and cold conditions, making it easily understandable and accepted; (3) PET enables the evaluation of various climate types [13].
PET is calculated based on the human energy balance equation of the MEMI model [39]:
M + W + R + C +   E D + E Re + E Sw + S = 0
where M is the metabolic rate (internal energy production by oxidation of food), W is the physical work output, R is the net radiation of the body, C is the convective heat flow, E D is the latent heat flow to evaporate water into water vapor diffusing through the skin (imperceptible perspiration), E R e is the sum of heat flows for heating and humidifying the inspired air, E S w is the heat flow due to evaporation of sweat, and S is the storage heat flow for heating or cooling the body mass. The air temperature affects C and E R e . The air humidity affects E D , E R e , and E S w . The air velocity affects C and E S w . The mean radiant temperature affects R [39].
In ENVI-met, the Bio-met module facilitates the calculation of thermal comfort. PET can be calculated using the simulated wind speed, temperature, and humidity, along with individual-specific parameters. Table 6 shows the individual-specific parameters configured based on the typical user profiles at a university campus under winter and early spring climatic conditions, referring to the thermal insulation properties of clothing worn by individuals during these seasons [40,41].

2.5. Precision Evaluation Indices

The current study evaluated the accuracy of hourly T a and RH simulations by ENVI-met. The three statistical parameters used were the Coefficient of Determination ( R 2 ), the Root Mean Square Error (RMSE), and the Mean Bias Error (MBE) [42,43], which can be expressed as:
R 2 = 1   i = 1   N S i   O i 2 i = 1 N O i O - 2 ,
R M S E = i = 1   N S i   O i 2 N 0.5 ,
M B E = i = 1 N S i   O i N
where S i is the simulated result by ENVI-met, O i is the number of observations, O - is the average value of the observations, and N is the amount of data.

3. Results

3.1. The Vertical Grid Sensitivity Tests

Table 7 shows the precision at different vertical grid resolutions. In all the vertical grid sensitivity test cases, the R2 for T a ranges from 0.92 to 0.94, with an RMSE between 1.12 and 1.30 °C. For RH, the R2 ranges from 0.46 to 0.51, with an RMSE between 7.59% and 8.50%. These results demonstrate relatively high R2 values and low RMSE values, indicating that the simulation outcomes of ENVI-met are considered reliable. As the vertical mesh size decreased, the R2 for T a showed a gradual increase, approaching 1. Simultaneously, the RMSE decreased consistently, moving closer to 0. However, when reducing the grid size from 1 m to 0.5 m, T a changed from being underestimated (MBE less than 0) to being overestimated (MBE greater than 0). For RH, the general trend of R2 was decreasing, indicating larger deviations between simulations and observations. When reducing the grid size from 1 m to 0.5 m, the RMSE increased significantly, and RH changed from being underestimated (MBE less than 0) to being overestimated (MBE greater than 0). In general, the results indicated that decreasing the vertical grid size led to an increase in accuracy (higher R2 values and lower RMSE) for T a but a decrease in accuracy (lower R2 values and higher RMSE) for RH. Additionally, the mean bias error (MBE) for T a changed from underestimation to overestimation with decreasing grid size, while the MBE for RH gradually increased. Considering the trade-off between accuracy and computational cost, a vertical mesh size of 1 m was selected for the current study.

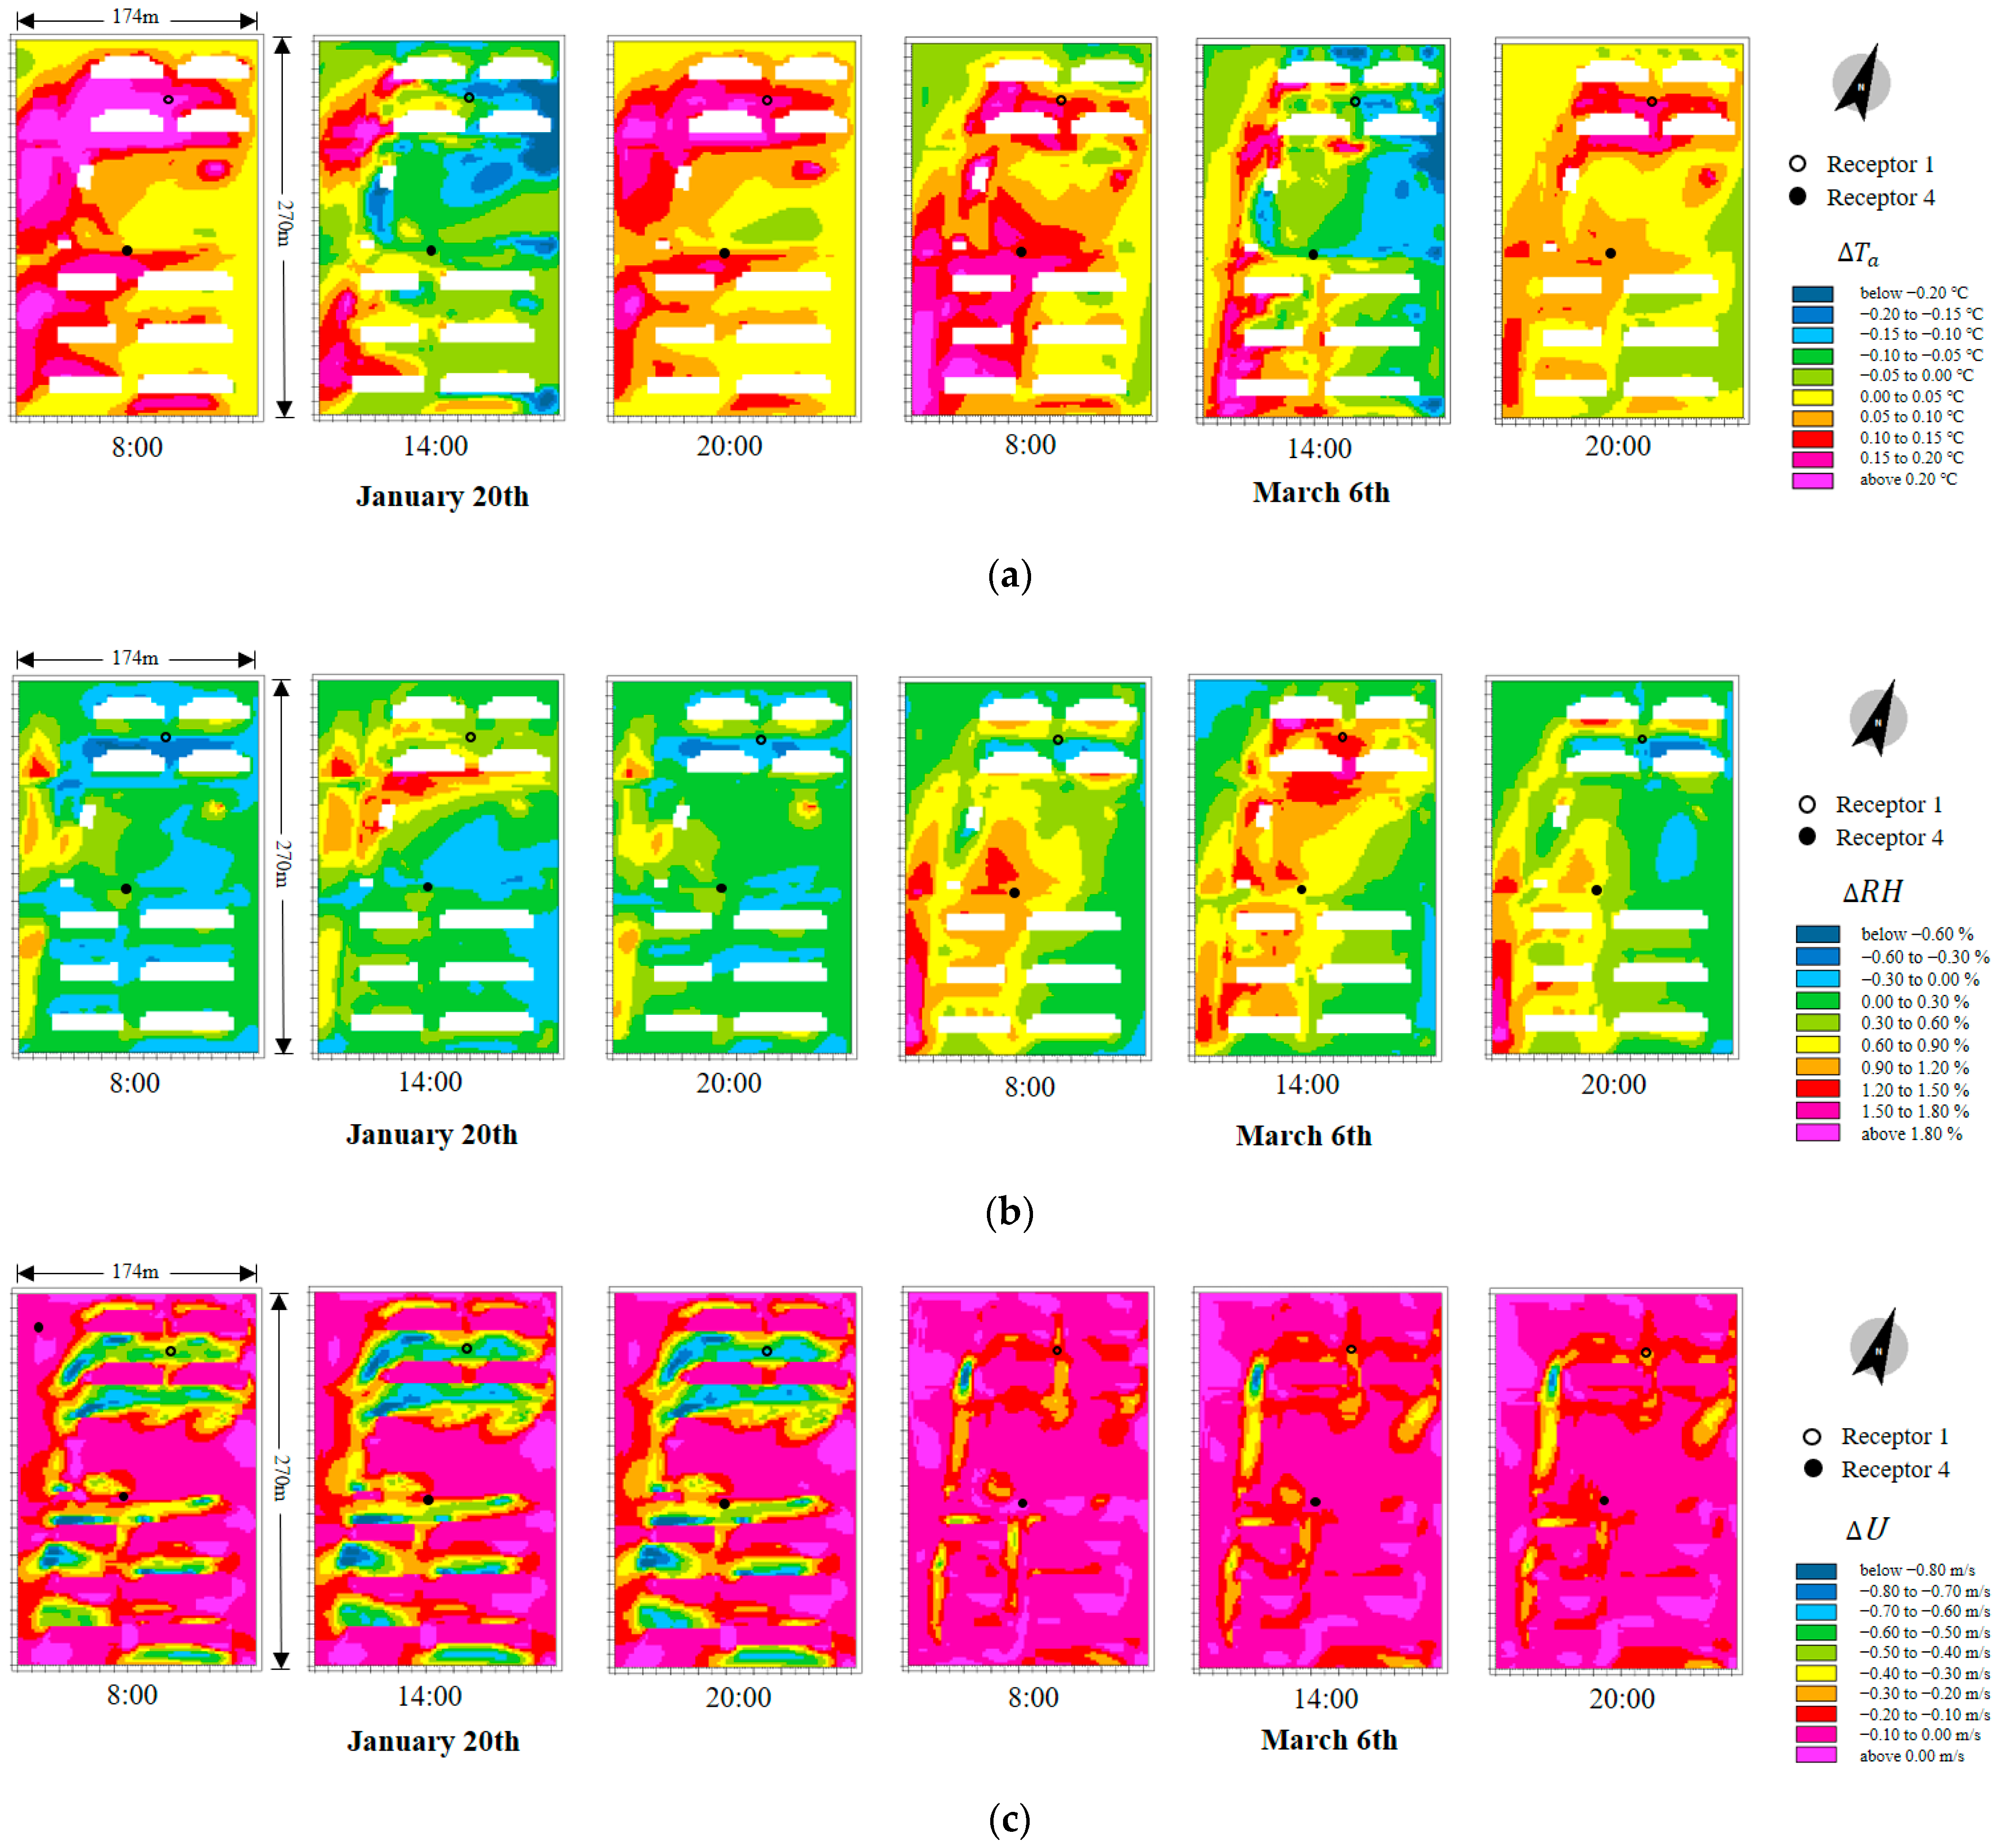
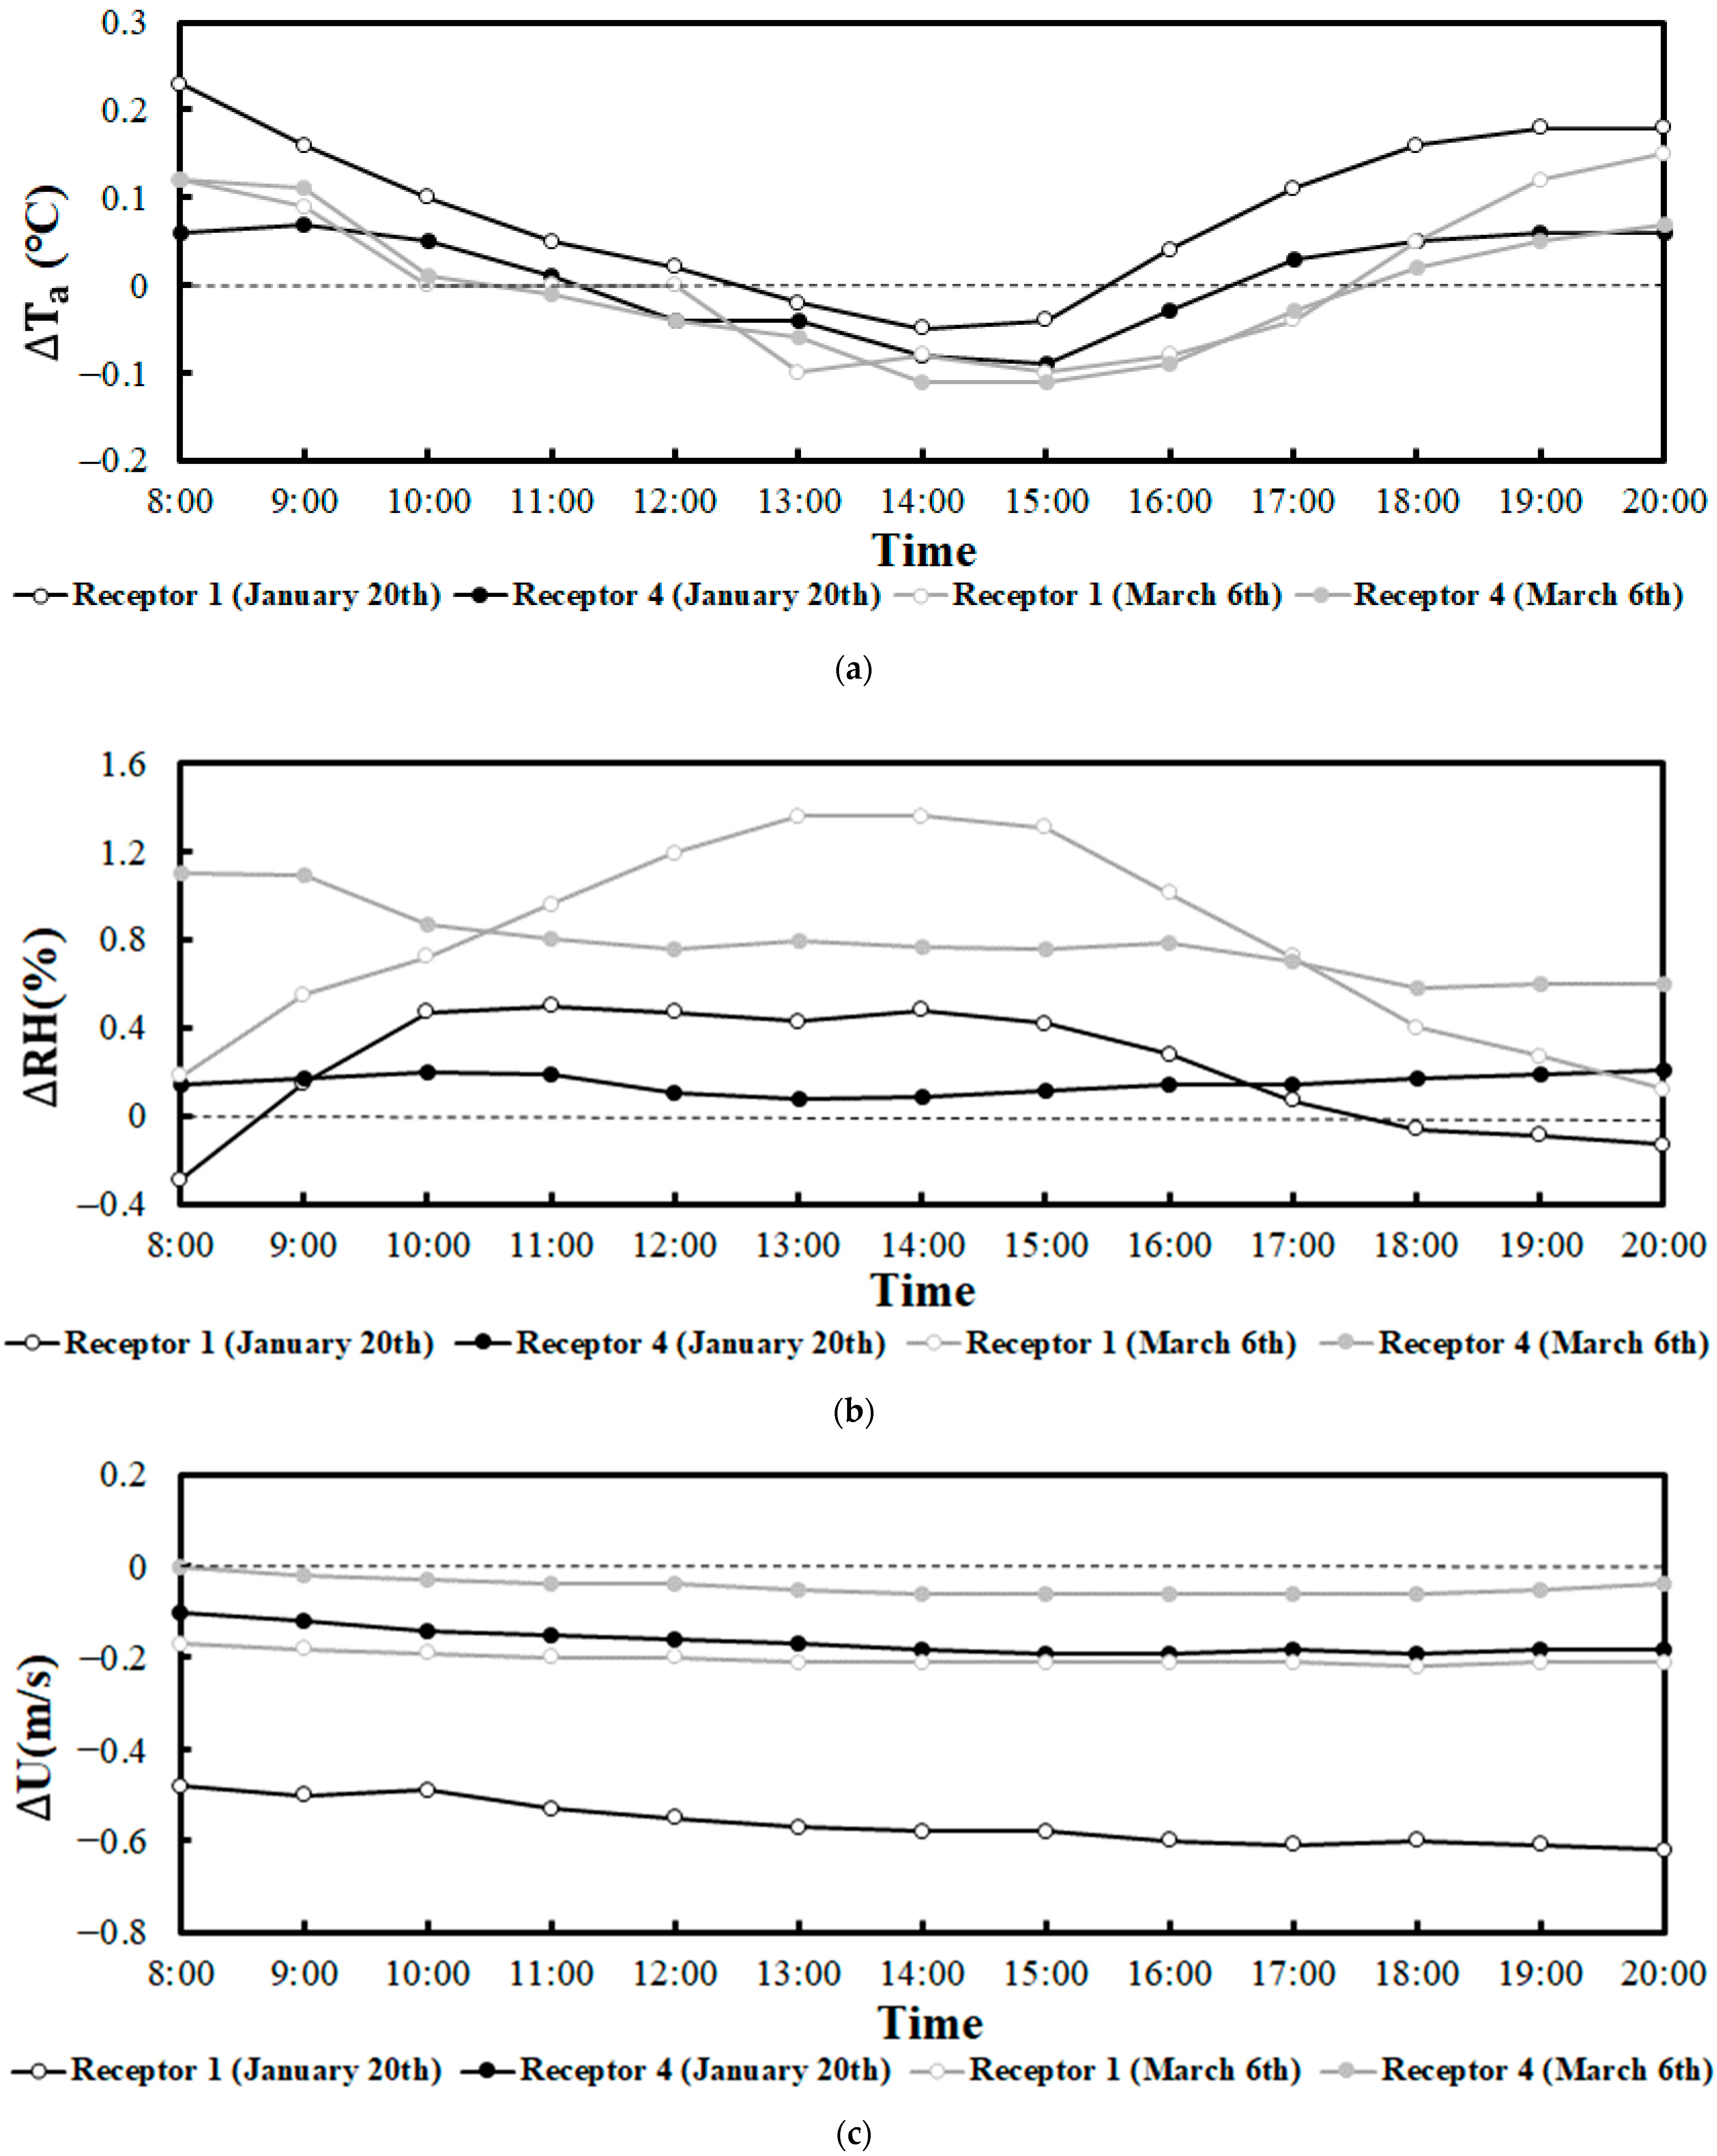
3.2. The Impact of Vegetation Canopy on Near-Surface T a , RH, and U

To investigate the impact of vegetation canopy on the outdoor thermal environment, we calculated the differences in simulated T a , RH, and U ( T a ,   RH, and U) at pedestrian height (a height of 1.5 m above the land surface) between two cases: one with vegetation canopy and the other without vegetation canopy.
In the current study, we selected the simulations of 8:00, 14:00, and 20:00 as the representative thermal conditions of the morning, afternoon, and evening (Figure 7). In addition, two receptors (receptor 1 and receptor 4, which correspond to the observation sites 1 and 4), situated below the vegetation canopy, were set to record the near-surface meteorological variations (Figure 8). It is important to note that receptor 1 experienced partial building shade, and the vegetation canopy surrounding it was denser compared with receptor 4 (Table 1).
Figure 7a displays the spatial variation of the near-surface T a . At 8:00 and 20:00, a majority of the area showed positive T a , with high-value areas concentrated below the vegetation canopy and its downwind regions. We can conclude that the vegetation canopy had a warming effect on the thermal environment in the morning and evening. Warmed air during the daytime becomes trapped within and below the tree crowns, resulting in reduced turbulent exchange with air above the canopy. Especially at 14:00, there are extensive negative areas, predominantly located below the vegetation canopy and its downwind area, indicating that the vegetation canopy had a cooling effect on the thermal environment during the afternoon. Figure 8a shows the variation of T a during 8:00 and 20:00 at receptors 1 and 4. Both receptors exhibited consistent temporal trends on both days. The highest T a occurred at 8:00, signifying the most significant warming effect of the vegetation canopy on the thermal environment in the morning. Subsequently, T a decreased, turning negative at 12:00, indicating the start of the vegetation canopy’s cooling effect. The cooling effect reached its maximum at 15:00, after which T a increased, and at 17:00, the vegetation canopy resumed its warming effect on the thermal environment. It can be concluded that the vegetation canopy acts as a thermal insulation layer for the atmosphere, leading to cooling effects during the daytime and non-effect or warming effects in the evening.
From the spatial variations of RH, we can see that the majority of the area exhibited positive RH, which indicates that the vegetation canopy has a humidifying effect throughout the day. Specifically, the areas of the humidifying effect will also be affected by the background wind conditions. The background winds of the two days were northeasterly and southerly, and the humidifying areas were located below the vegetation canopy and their downwind areas on 20 January and 6 March, respectively. The variation of RH from 8:00 to 20:00 at receptors 1 and 4 is shown in Figure 8b. Both receptors experienced a generally humidifying effect from the vegetation canopy on both days. The higher background wind speed on 20 January (3.12 m · s 1 ) compared with 6 March (2.26 m · s 1 ) resulted in a weaker daily average humidifying effect at receptors on 20 January (0.21%) than on 6 March (0.78%). The humidifying effect of the vegetation canopy was more pronounced when the background wind speed was lower.
Figure 7c depicts large negative areas of ∆U below the vegetation canopy, indicating that the vegetation canopy plays a role in reducing wind velocity in the wind environment, which is defined as the wind shield effect. Notably, the negative area of ∆U on 20 January was more extensive than that on 6 March causing the higher background wind speed of 20 January (3.12 m · s 1 ) comparing to 6 March (2.26 m · s 1 ), which indicated that the wind shield effect is pronounced with higher background wind speed. Changing curves in U between 8:00 and 20:00 at receptor 1 and receptor 4 are shown in, Due to the absence of hourly wind speed boundary conditions, the daily variation of U and ∆U was not significant (Figure 8c). Nevertheless, the denser canopy at receptor 1 resulted in a more substantial wind shield effect (−0.56 m · s 1 and −0.16 m · s 1 ) compared with receptor 4 (−0.20 m · s 1 and −0.04 m · s 1 ).

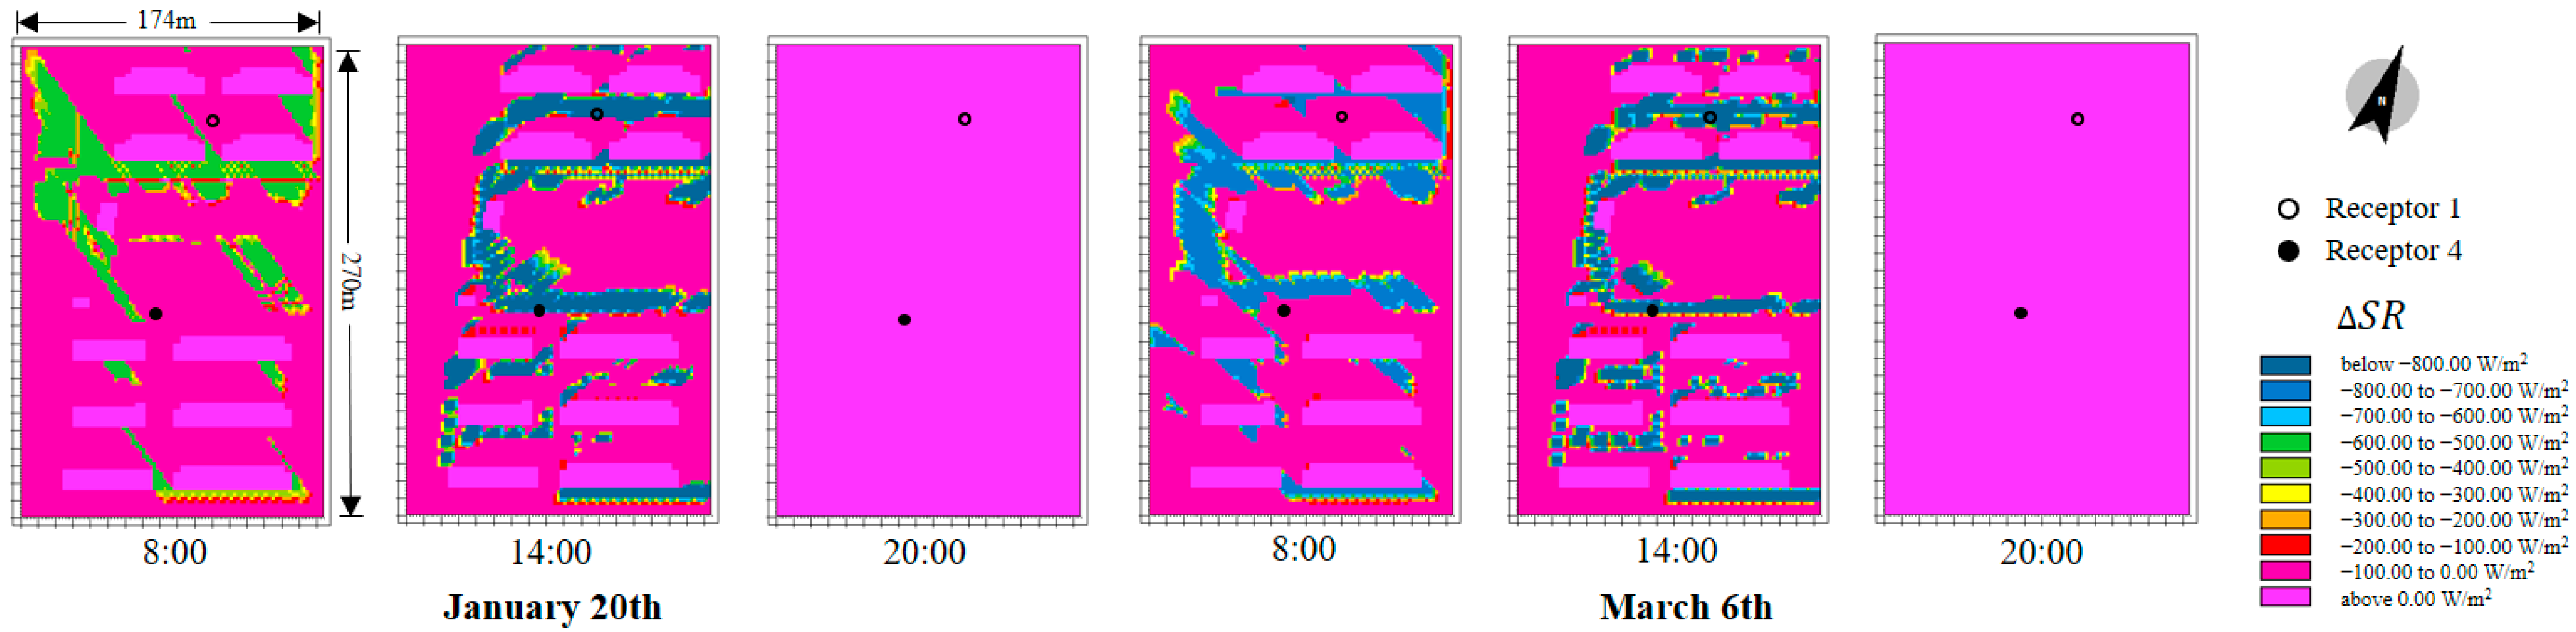
3.3. The Impact of Vegetation Canopy on Near-Surface Solar Radiation

In the current study, the sum of solar radiation (SR) includes direct solar radiation and diffuse sky radiation in the short-wavelength region. We calculated the difference in sum solar radiation ( SR ) at pedestrian height between the original case and the designed case (Figure 9) to illustrate the effect of vegetation canopy on near-surface solar radiation. The vegetation canopy plays a role in reducing solar radiation on the thermal environment in the morning and afternoon, as observed by negative areas of ∆SR at 8:00 and 14:00. At 20:00, when solar radiation is absent, ∆SR across the scene equals 0. The solar altitude continuously changed throughout the day at the same location. When comparing 8:00 and 14:00, the solar altitude at 14:00 was larger, resulting in a more pronounced reduction of solar radiation by the vegetation canopy. However, the shading area would be smaller compared with 8:00. Additionally, in winter (20 January), the solar altitude was smaller than in early spring (6 March). Consequently, the reduction of solar radiation caused by the vegetation canopy would be smaller in winter, but the shading area would be larger.
Throughout the day, the amount of SR reduced by the vegetation canopy initially increased and then decreased. Notably, the amount of SR decreased more on 6 March than on 20 January (Figure 10), which indicated that the shading effect of the vegetation canopy was more pronounced in early spring. For example, on 20 January, SR at receptor 1 increased by 873.86 W · m 2 from 11:00 to 12:00. This increase was attributed to the buildings in the south, which weakened the shading effect of the vegetation canopy on near-surface solar radiation during that hour.

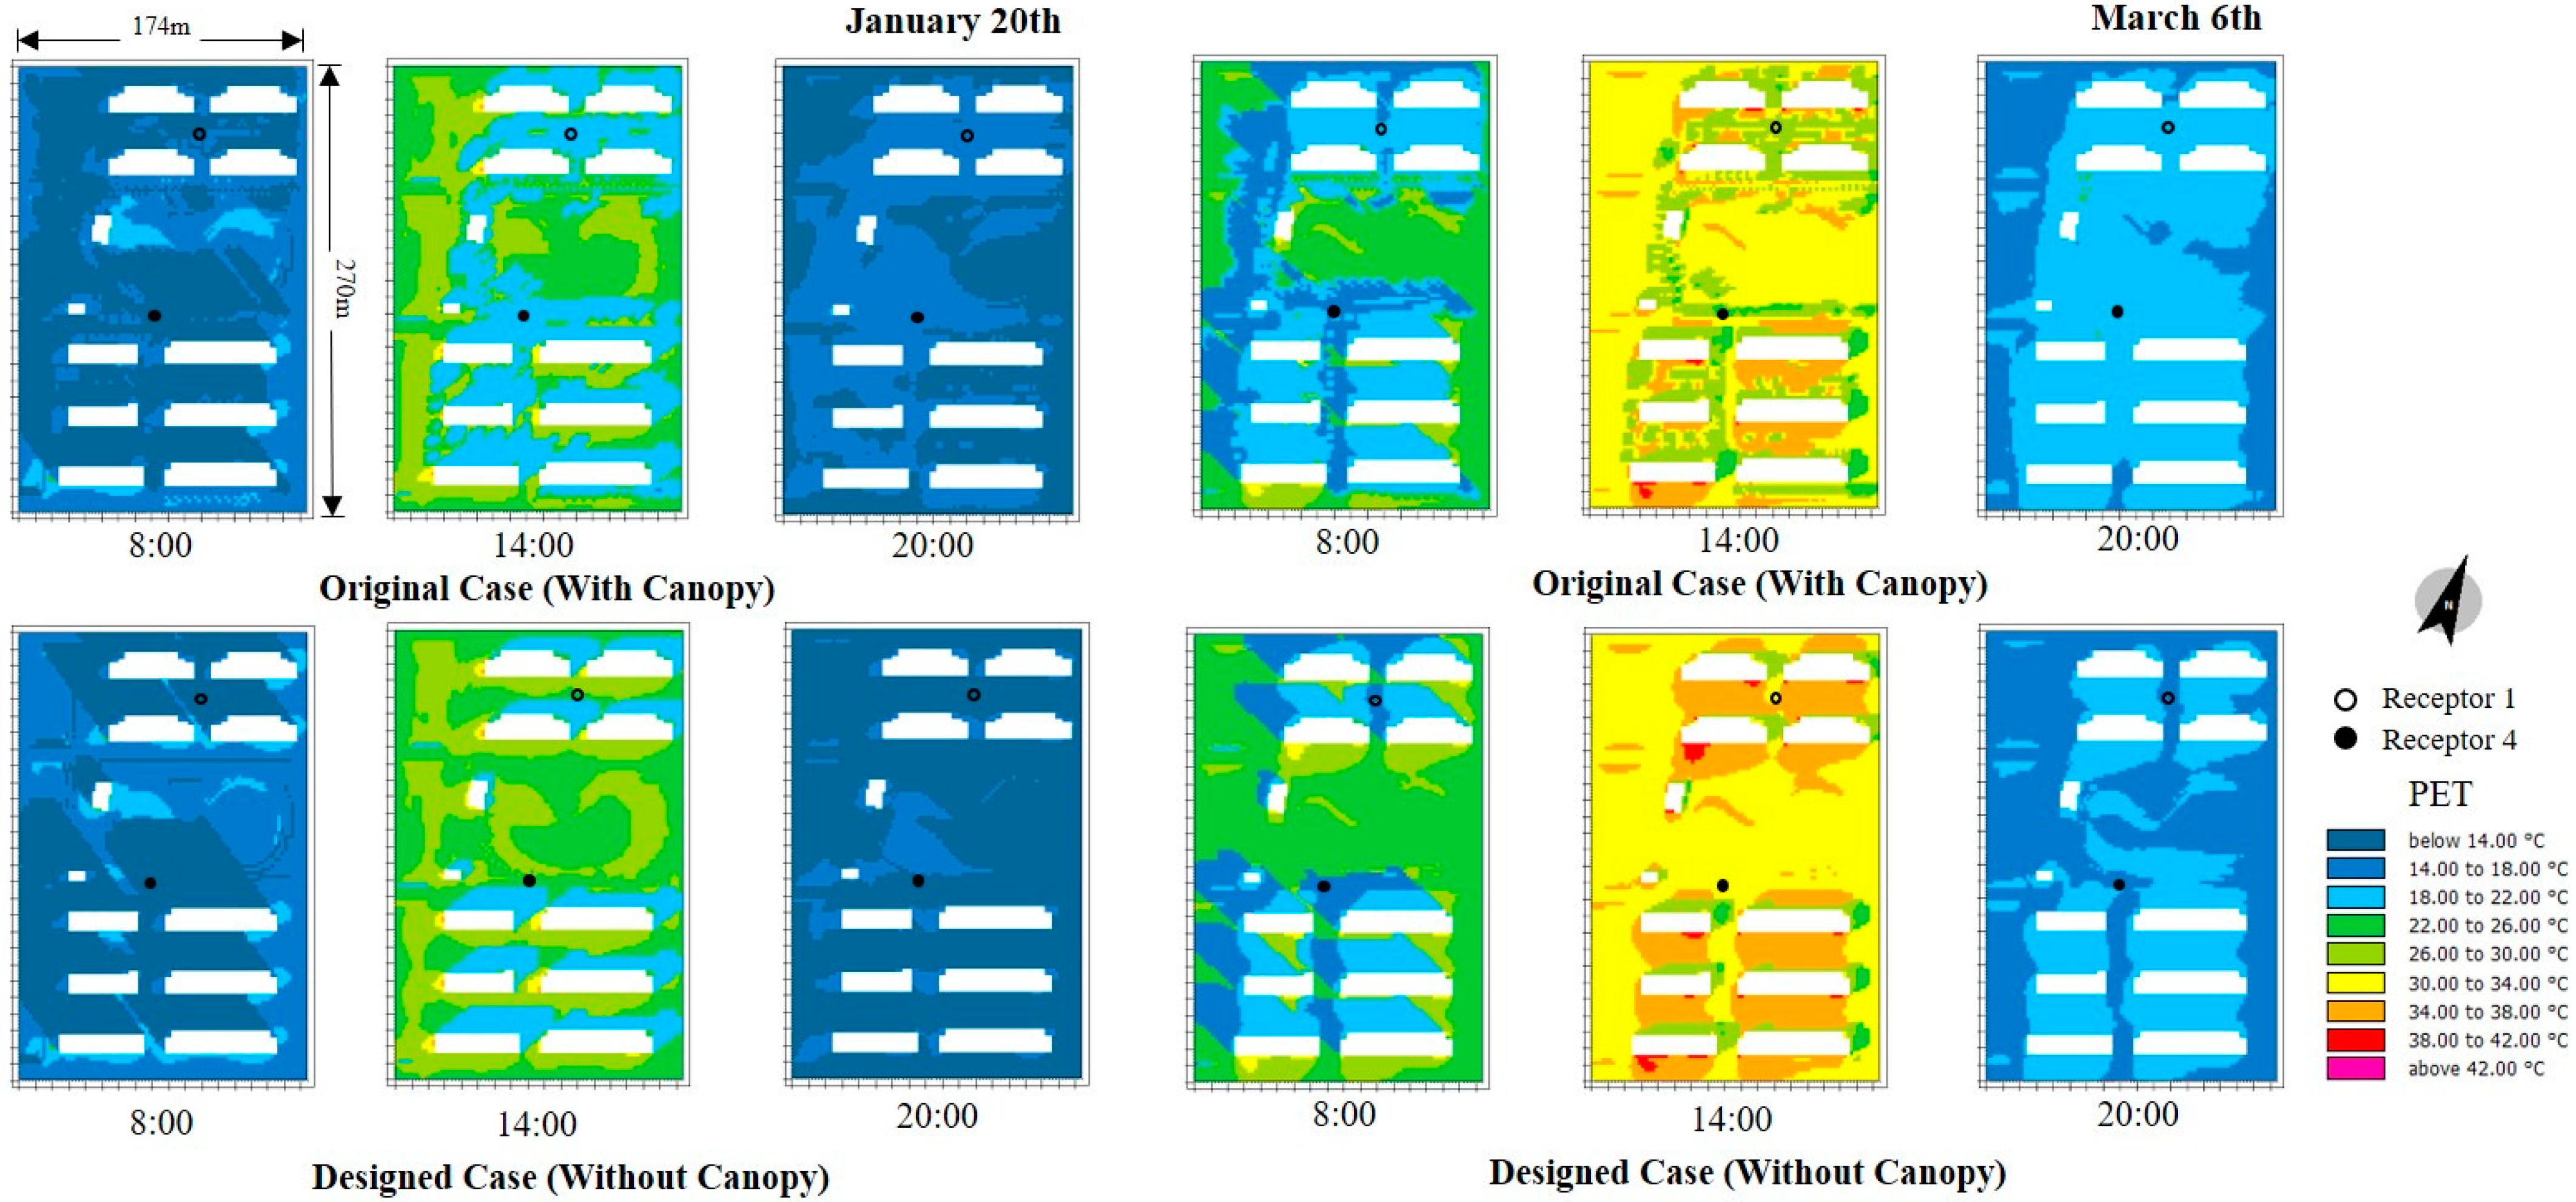
3.4. The Impact of Vegetation Canopy on Near-Surface PET

In order to consider subjective thermal perceptions across various PET values, the current study employed the thermal sensation classification defined by Lin [44]. This classification is derived from an outdoor field study involving 1644 interviews conducted in Taiwan, which shares a comparable subtropical monsoon climate with Shanghai.
Figure 11 shows the spatial distribution of PET at pedestrian height in different cases, calculated using the Bio-met thermal comfort module of ENVI-met. At 8:00 and 14:00, low PET values were observed in shaded areas, such as the shady side of the buildings and beneath the vegetation canopy. Conversely, high PET values were found in open and unshaded areas, including grasslands, water bodies, and roads. By 20:00, high PET values appeared near buildings and under the vegetation canopy, while open areas away from the buildings and vegetation canopy exhibited low PET. Shading had a significant effect on the spatial variation of PET values, with solar radiation being a crucial factor influencing human thermal comfort during the winter.
Figure 12 shows the variation of PET at receptors 1 and 4 when affected by the shading effect from 8:00 to 20:00. Comparing the thermal sensation of receptors 1 and 4 in the designed case (without vegetation canopy, which is only affected by the shading effect of the building), the thermal sensation of receptor 4 is closer to “Neutral”, which is the comfort feeling. Thus, we can conclude that the shading effect of buildings makes people uncomfortable in the winter. However, the wind shield effect of the buildings will benefit thermal comfort, leading to a higher PET in the original case (with vegetation canopy) from 12:00 to 16:00 on a typical cold day like January 20. In the original case, receptor 1 is influenced by both buildings and vegetation canopies, whereas receptor 4 is solely affected by the presence of vegetation canopies. The shading effect of the vegetation canopy led to a reduction in solar radiation at pedestrian height, resulting in a decrease in PET and an increase in cold discomfort. It can be found that the PET is lower in the original case (with vegetation canopy) than the designed case (without vegetation canopy) from 10:00 to 16:00 (Figure 12). 20 January was a typical sunny but cold and windy winter day. 6 March was a cold early spring day with sunny weather and a slightly lower wind speed than 20 January, which represented better thermal comfort. Specifically, PET decreased significantly by about 5.5 °C on January 20, leading to an increase in cold discomfort (the thermal sensation changed from “Slight cool” to “Cool”). The shading effect of the vegetation canopy reduced the “Neutral” thermal sensation from seven hours (10:00–16:00) to one hour (10:00) on 20 January. Unlike on 20 January, the vegetation canopy consistently improved thermal comfort throughout the day on 6 March. The number of cold and uncomfortable hours decreased during the morning and evening, and the “Neutral” thermal sensation at receptor 1 increased from one hour (17:00) to eight hours (10:00–16:00) during the daytime.
Furthermore, the current study calculated the changes in spatial and temporal percentage of each thermal sensation scale from the case with vegetation canopy to the case without vegetation canopy to quantify the impact of the vegetation canopy on the thermal environment (Figure 13 and Figure 14). As shown in Figure 13a, on 20 January, the percentage of the “Very cold” sensation area decreased from 60.79% to 52.72% at 8:00 in the morning, while at 14:00 in the afternoon, the “Neutral” sensation area increased from 28.33% to 39.06%. At 20:00 in the evening, the “Very cold” sensation area increased from 48.65% to 88.81%. As shown in Figure 13b, on 6 March, the sum of “Cold” and “Cool” sensation areas decreased from 60.07% to 37.56% at 8:00 in the morning. At 14:00 in the afternoon, the sum of “Slightly warm” and “Warm” sensation areas increased from 70.60% to 89.41%. At 20:00 in the evening, the area of “Cold” sensation increased from 31.17% to 58.80%. Figure 14 shows the percentage of time from 8:00 to 20:00 for different thermal sensations at receptors 1 and 4. On 20 January, the sum of “Very cold”, “Cold” and “Cool” sensation time decreased from 100% to 65.38%. On 6 March, the sum of “Cold”, “Cool” and “Slightly cold” sensation time decreased from 69.23% to 38.46%. On the whole, when there is no vegetation canopy, the area and time spent experiencing the cold discomfort will be reduced in the daytime. However, it may increase “Slightly cold” discomfort in the evening (20:00).

4. Discussion

4.1. The Impact of Vegetation Canopy on Outdoor Thermal Environment

The vegetation canopy plays a significant role in mitigating heat and lowering temperatures during the daytime [18,45,46], and its cooling capacity relies on two main processes: shading and transpiration [46,47]. In the current study, the effect of vegetation canopy on the thermal environment was evaluated by calculating the temperature difference between the original case with vegetation canopy and the designed case without vegetation canopy at pedestrian height. As shown in Figure 8a, the vegetation canopy effectively lowered the air temperature between 13:00 and 15:00 at both receptors on the two typical days. However, after sunset, the transpiration rate of vegetation typically decreases to just 5–15% of the daytime rate, leading to a significant reduction in cooling capacity [47]. Additionally, warmed air during the daytime becomes trapped within and below the tree crowns, resulting in reduced turbulent exchange with air above the canopy [48]. As a result, the vegetation canopy acts as a thermal insulation layer for the atmosphere, leading to cooling effects during the daytime and non-effect or warming effects in the evening.
Bernatzky [49] found that green spaces in urban areas can increase the relative air humidity by 5–10%. The humidifying effect of green spaces mainly stems from the influence of the vegetation canopy [50], with plant leaves’ transpiration being the primary reason for this effect [51]. As a result, the highest humidifying effect of the vegetation canopy was observed at midday in the densely covered receptor 1 (Figure 8b). The wind fields have a significant effect on the humidifying effect of green spaces [52]. The background wind speed of 20 January (3.12 m · s 1 ) is significantly higher than that of 6 March (2.26 m · s 1 ). The higher wind speed facilitates rapid water vapor diffusion from beneath the canopy, resulting in a lower daily average humidifying effect on 20 January than on 6 March.
Vegetation increases the roughness of the surface and imposes a drag effect on airflow. Because of the porous nature of vegetation, it produces much smaller pressure differences than solid buildings [8,53]. The wind speed is significantly accelerated around the edges and roofs of buildings, while trees cause smoother changes due to their porous properties. As shown in Figure 8c, the daily average wind speed at the two receptors decreased by 0.56 m · s 1 and 0.16 m · s 1 on 20 January, representing a decrease of 18.05% and 5.25%, respectively. On 6 March, the average wind speed decrease was 0.20 m · s 1 and 0.04 m · s 1 , representing a decrease of 8.95% and 1.94%, respectively. The wind shield effect of the vegetation canopy was more obvious under the higher background wind conditions.
A vegetation canopy can reduce incoming short-wave solar radiation by reflection and absorption [8]. Typically, only 10% of visible and 30% of infrared radiation would transmit through the vegetation canopy [54]. In the current study, receptors 1 and 4, when located below the vegetation canopy, both had different degrees of reduction of solar radiation during the daytime. The shading effect of the vegetation canopy was most pronounced at noon, when it could block more than 90% of solar radiation.

4.2. Implications for Improving Outdoor Thermal Comfort in Cold Winter

Vegetation plays a critical role in the urban thermal environment for its cooling effect, humidifying effect, wind shield effect, and shading effect. According to studies conducted in the hot summer, vegetation canopy plays a positive role in improving thermal comfort [15,55,56]. Yoshida [55] measured physiological responses in a human subject test and found that the human thermal load under a tree canopy was closer to neutral than in sunlit spaces. Sabrin [56] assessed summertime thermal comfort for a humid subtropical climate and found that PET at pedestrian level was reduced by vegetation canopy effectively. Based on the current study, vegetation has a cooling effect in the daytime and a non-effect or warming effect in the evening. Besides, the humidifying effect and shading effect will also increase the cold discomfort during winter in hot summer and cold winter regions. Solar radiation is one of the most important sources of heat in winter [57,58,59], which is identified as the most influential factor affecting outdoor thermal comfort, especially in winter. In the study, the spatial distribution of PET was highly similar to that of solar radiation. The thermal sensation in the shaded areas of buildings and vegetation, where there is lower solar radiation, is decreased by 1–2 classes compared with others.
For optimal thermal comfort both in winter and summer, we suggest replacing evergreen broad-leaved trees with deciduous broad-leaved trees in the outdoor environment in hot summer and cold winter regions. On the one hand, deciduous broadleaves can perform functions such as shading and cooling in the summer. On the other hand, deciduous broadleaves will improve the daytime thermal sensation in winter and cold spring. The proposal was validated by the designed case (without vegetation canopy) in the current study. Although the lack of vegetation canopy results in “Slightly warm” in the midday of a cold spring, Huang [60] found that respondents preferred “Slightly warm” in the cold season based on the field measurement and questionnaire survey. The “Slightly cold” evenings of winter can be improved by proper clothing. As a whole, the area and time experiencing the cold discomfort of daytime will be obviously reduced in the designed case, which will be more important for the thermal comfort in hot summer and cold winter regions in the cold winter and spring.

4.3. Limitations and Future Perspectives

In the current study, we use the simple plant model of ENVI-met 5.1.1 for constructing the vegetation canopy. While the ten-layer Leaf Area Density (LAD) provides satisfactory simulation results, the simple plant model lacks the ability to differentiate the shape and volume of the canopy and trunk, which does not fully capture the airflow in and around the canopy. However, we are aware that ENVI-met offers a 3D plant database in newer versions, which allows for the construction of more detailed and accurate 3D canopy models. By utilizing this advanced feature in future studies, we can enhance the modeling accuracy and improve the representation of physical heat transfer processes, leading to more precise and comprehensive results. In the future, when analyzing the impact of the vegetation canopy on the thermal environment in ideal cases, it is essential to consider and account for the influences of other elements present in the scene, such as buildings and water bodies. By simplifying the scene and eliminating interference factors, we can establish quantitative relations to facilitate more in-depth and quantitative research. The influence of vegetation canopy on the thermal environment of outdoor open spaces in summer will also be investigated in the future.

5. Conclusions

In the current study, the impact of vegetation canopy on the outdoor thermal environment in cold winter and spring was investigated, which would provide references for improving the thermal comfort in similar hot summer and cold winter regions. Utilizing the ENVI-met microclimate simulation model, microclimate parameters such as T a , RH, U, SR, and PET were simulated based on on-site observations of a campus.
The impact of vegetation canopy was quantitatively examined in the simulations of two scenarios established for simulation: an original case with vegetation canopy and a designed case without vegetation canopy. The vegetation canopy acts as a thermal insulation layer for the atmosphere, leading to a cooling effect during the daytime and a non-effect or warming effect in the evening. The humidifying effect of the vegetation canopy is more noticeable under lower background wind conditions. The vegetation canopy also decreases wind speed throughout the day, with a more significant wind shield effect observed under higher background wind conditions. Moreover, the vegetation canopy can effectively reduce solar radiation by up to 90% at noon. Solar radiation is the most important factor influencing thermal comfort in the cold winter and spring months. During the daytime, the vegetation canopy’s shading effect blocks the incoming solar radiation at the near-surface level, resulting in a reduction in PET and an increase in cold discomfort.
Finally, we proposed a suggestion for optimal thermal comfort in hot summer and cold winter regions: replacing evergreen broad-leaved trees with deciduous broad-leaved trees in the outdoor environment. Deciduous broad-leaved trees not only have the effects of shading and cooling in the summer but also improve the daytime thermal sensation in the cold winter and spring.
Future studies should improve the 3D canopy models for better vegetation parameterizations and more comprehensive physical heat transfer descriptions. Besides, the influence of the vegetation canopy on the thermal environment in summer will also be investigated.

Author Contributions

Conceptualization, R.L.; Methodology, H.C. and R.L.; Software, H.C. and Y.Z.; Validation, H.C.; Investigation, H.C. and Y.Z.; Data curation, Y.Z.; Writing—original draft, H.C.; Writing—review and editing, R.L.; Supervision, R.L.; Project administration, R.L.; Funding acquisition, R.L. All authors have read and agreed to the published version of the manuscript.

Funding

This research was funded by the National Natural Science Foundation of China, grant number 42101331.

Institutional Review Board Statement

Not applicable.

Informed Consent Statement

Not applicable.

Data Availability Statement

The data presented in this study are available on request from the corresponding author.

Acknowledgments

The authors would like to thank the editors and anonymous reviewers for their constructive comments.

Conflicts of Interest

The authors declare no conflict of interest.

References

  1. Department of Economic and Social Affairs, United Nations. World Urbanization Prospects: The 2018 Revision; United Nations: New York, NY, USA, 2019; p. 79. [Google Scholar]
  2. Grafakos, S.; Trigg, K.; Landauer, M.; Chelleri, L.; Dhakal, S. Analytical framework to evaluate the level of integration of climate adaptation and mitigation in cities. Clim. Chang. 2019, 154, 87–106. [Google Scholar] [CrossRef]
  3. Hoornweg, D.; Bhada, P.; Freire, M.; Trejos, C.; Sugar, L. Cities and Climate Change: An Urgent Agenda; The World Bank: Washington, DC, USA, 2010. [Google Scholar]
  4. Doan, Q.V.; Chen, F.; Kusaka, H.; Dipankar, A.; Khan, A.; Hamdi, R.; Roth, M.; Niyogi, D. Increased risk of extreme precipitation over an urban agglomeration with future global warming. Earth’s Future 2022, 10, e2021EF002563. [Google Scholar] [CrossRef]
  5. Narumi, D.; Levinson, R.; Shimoda, Y. Effect of urban heat island and global warming countermeasures on heat release and carbon dioxide emissions from a detached house. Atmosphere 2021, 12, 572. [Google Scholar] [CrossRef]
  6. Wijesiri, B.; Liu, A.; Goonetilleke, A. Impact of global warming on urban stormwater quality: From the perspective of an alternative water resource. J. Clean. Prod. 2020, 262, 121330. [Google Scholar] [CrossRef]
  7. Maas, J.; van Dillen, S.M.E.; Verheij, R.A.; Groenewegen, P.P. Social contacts as a possible mechanism behind the relation between green space and health. Health Place 2009, 15, 586–595. [Google Scholar] [CrossRef]
  8. Lai, D.; Liu, W.; Gan, T.; Liu, K.; Chen, Q. A review of mitigating strategies to improve the thermal environment and thermal comfort in urban outdoor spaces. Sci. Total Environ. 2019, 661, 337–353. [Google Scholar] [CrossRef]
  9. Huang, H.; Deng, X.; Yang, H.; Li, S. Spatial evolution of the effects of urban heat island on residents’ health. Teh. Vjesn. 2020, 27, 1427–1435. [Google Scholar]
  10. Chen, Y.H.; Li, X.B.; Shi, P.J.; He, C.Y. Study on spatial pattern of urban heat environment in Shanghai city. Sci. Geogr. Sin. 2002, 22, 317–323. [Google Scholar]
  11. Voogt, J.A.; Oke, T.R. Thermal remote sensing of urban climates. Remote Sens. Environ. 2003, 86, 370–384. [Google Scholar] [CrossRef]
  12. Shuai, L.; Feng, L.; Yang, S.Q. Numerical simulation of the effects of planting mode on thermal comfort of urban microenvironment. Chin. J. Ecol. 2022, 41, 1611–1618. [Google Scholar]
  13. Wu, Z.; Chen, L. Thermal comfort assessment and urban thermal environment research: Review and prospective. Chin. J. Ecol. 2016, 35, 1364. [Google Scholar]
  14. Liu, X.; Chen, E. Thermal environment of urban area and the improvement of its micro-thermal environment. Chin. J. Environ. Sci. 1997, 18, 54–58. [Google Scholar]
  15. Milošević, D.D.; Bajšanski, I.V.; Savić, S.M. Influence of changing trees locations on thermal comfort on street parking lot and footways. Urban Urban Gree 2017, 23, 113–124. [Google Scholar] [CrossRef]
  16. Liu, Y.; Lin, W.; Guo, J.; Wei, Q.; Shamseldin, A.Y. The influence of morphological characteristics of green patch on its surrounding thermal environment. Ecol. Eng. 2019, 140, 105594. [Google Scholar] [CrossRef]
  17. Yang, Y.; Gatto, E.; Gao, Z.; Buccolieri, R.; Morakinyo, T.E.; Lan, H. The “plant evaluation model” for the assessment of the impact of vegetation on outdoor microclimate in the urban environment. Build Environ. 2019, 159, 106151. [Google Scholar] [CrossRef]
  18. Wu, Z.; Man, W.; Ren, Y. Influence of tree coverage and micro-topography on the thermal environment within and beyond a green space. Agr. Forest Meteorol. 2022, 316, 108846. [Google Scholar] [CrossRef]
  19. Liu, R.; Liu, S.; Yang, X.; Lu, H.; Pan, X.; Xu, Z.; Ma, Y.; Xu, T. Wind dynamics over a highly heterogeneous oasis area: An experimental and numerical study. J. Geophys. Res. Atmos. 2018, 123, 8418–8440. [Google Scholar] [CrossRef]
  20. Taleghani, M.; Tenpierik, M.; van den Dobbelsteen, A.; Sailor, D.J. Heat in courtyards: A validated and calibrated parametric study of heat mitigation strategies for urban courtyards in the Netherlands. Sol. Energy 2014, 103, 108–124. [Google Scholar] [CrossRef]
  21. Zhang, J.; Khoshbakht, M.; Liu, J.; Gou, Z.; Xiong, J.; Jiang, M. A clustering review of vegetation-indicating parameters in urban thermal environment studies towards various factors. J. Therm. Biol. 2022, 110, 103340. [Google Scholar] [CrossRef]
  22. Amani-Beni, M.; Zhang, B.; Xie, G.; Xu, J. Impact of urban park’s tree, grass and waterbody on microclimate in hot summer days: A case study of Olympic Park in Beijing, China. Urban Urban Gree 2018, 32, 1–6. [Google Scholar] [CrossRef]
  23. Gatto, E.; Buccolieri, R.; Aarrevaara, E.; Ippolito, F.; Emmanuel, R.; Perronace, L.; Santiago, J.L. Impact of Urban Vegetation on Outdoor Thermal Comfort: Comparison between a Mediterranean City (Lecce, Italy) and a Northern European City (Lahti, Finland). Forests 2020, 11, 228. [Google Scholar] [CrossRef]
  24. Xu, M.; Hong, B.; Mi, J.; Yan, S. Outdoor thermal comfort in an urban park during winter in cold regions of China. Sustain. Cities Soc. 2018, 43, 208–220. [Google Scholar] [CrossRef]
  25. Afshar, N.K.; Karimian, Z.; Doostan, R.; Nokhandan, M.H. Influence of Planting Designs on Winter Thermal Comfort in an Urban Park. J. Environ. Eng. Landsc. 2018, 26, 232–240. [Google Scholar] [CrossRef]
  26. Gachkar, D.; Taghvaei, S.H.; Norouzian-Maleki, S. Outdoor thermal comfort enhancement using various vegetation species and materials (case study: Delgosha Garden, Iran). Sustain. Cities Soc. 2021, 75, 103309. [Google Scholar] [CrossRef]
  27. GB50176 CH; Code for Thermal Design of Civil Building. Ministry of Housing and Urban-Rural Development of the People’s Republic of China: Beijing, China, 2016.
  28. Chen, Y.; Jiang, Y.D.; Chen, X.Y. People’s Republic of China Meteorological Industry Standard “Division of Climatic Season” (QX/T 152-2012); China Meteorological Press: Beijing, China, 2012. [Google Scholar]
  29. Box, G.E.; Pierce, D.A. Distribution of residual autocorrelations in autoregressive-integrated moving average time series models. J. Am. Stat. Assoc. 1970, 65, 1509–1526. [Google Scholar] [CrossRef]
  30. Bruse, M.; Fleer, H. Simulating surface–plant–air interactions inside urban environments with a three dimensional numerical model. Environ. Modell. Softw. 1998, 13, 373–384. [Google Scholar] [CrossRef]
  31. Salata, F.; Golasi, I.; de Lieto Vollaro, R.; de Lieto Vollaro, A. Urban microclimate and outdoor thermal comfort. A proper procedure to fit ENVI-met simulation outputs to experimental data. Sustain. Cities Soc. 2016, 26, 318–343. [Google Scholar] [CrossRef]
  32. Ouyang, W.; Sinsel, T.; Simon, H.; Morakinyo, T.E.; Liu, H.; Ng, E. Evaluating the thermal-radiative performance of ENVI-met model for green infrastructure typologies: Experience from a subtropical climate. Build. Environ. 2022, 207, 108427. [Google Scholar] [CrossRef]
  33. Lalic, B.; Mihailovic, D.T. An empirical relation describing leaf-area density inside the forest for environmental modeling. J. Appl. Meteorol. Clim. 2004, 43, 641–645. [Google Scholar] [CrossRef]
  34. Fengxian Meteorological Service. Available online: http://sh.cma.gov.cn/fx/ (accessed on 15 August 2023).
  35. Zhai, P.M. Some gross errors and biases in China’s historical radiosonde data. Acta Meteor. Sin. 1997, 55, 563–572. [Google Scholar]
  36. ASHRAE Standard 55-66; Thermal Comfort Conditions. American Society of Heating, Refrigerating and Air-Conditioning Engineers: New York, NY, USA, 1966.
  37. American National Standards Institute. Thermal Environmental Conditions for Human Occupancy; American Society of Heating, Refrigerating and Air-Conditioning Engineers: Peachtree Corners, GA, USA, 2004; Volume 55. [Google Scholar]
  38. Shooshtarian, S.; Lam, C.K.C.; Kenawy, I. Outdoor thermal comfort assessment: A review on thermal comfort research in Australia. Build Environ 2020, 177, 106917. [Google Scholar] [CrossRef]
  39. Höppe, P. The physiological equivalent temperature—A universal index for the biometeorological assessment of the thermal environment. Int. J. Biometeorol. 1999, 43, 71–75. [Google Scholar] [CrossRef] [PubMed]
  40. Lu, Y.; Wang, F.; Wan, X.; Song, G.; Shi, W.; Zhang, C. Clothing resultant thermal insulation determined on a movable thermal manikin. Part I: Effects of wind and body movement on total insulation. Int. J. Biometeorol. 2015, 59, 1475–1486. [Google Scholar] [CrossRef] [PubMed]
  41. Huang, J. Prediction of air temperature for thermal comfort of people in outdoor environments. Int. J. Biometeorol. 2007, 51, 375–382. [Google Scholar] [CrossRef] [PubMed]
  42. Willmott, C.J. On the validation of models. Phys. Geogr. 1981, 2, 184–194. [Google Scholar] [CrossRef]
  43. Willmott, C.J. Some comments on the evaluation of model performance. Bull. Am. Meteorol. Soc. 1982, 63, 1309–1313. [Google Scholar] [CrossRef]
  44. Lin, T.; Matzarakis, A.; Hwang, R. Shading effect on long-term outdoor thermal comfort. Build Environ. 2010, 45, 213–221. [Google Scholar] [CrossRef]
  45. Smardon, R.C. Perception and aesthetics of the urban environment: Review of the role of vegetation. Landsc. Urban Plan 1988, 15, 85–106. [Google Scholar] [CrossRef]
  46. Bowler, D.E.; Buyung-Ali, L.; Knight, T.M.; Pullin, A.S. Urban greening to cool towns and cities: A systematic review of the empirical evidence. Landsc. Urban Plan 2010, 97, 147–155. [Google Scholar] [CrossRef]
  47. Caird, M.A.; Richards, J.H.; Donovan, L.A. Nighttime stomatal conductance and transpiration in C3 and C4 plants. Plant Physiol. 2007, 143, 4–10. [Google Scholar] [CrossRef]
  48. Zölch, T.; Rahman, M.A.; Pfleiderer, E.; Wagner, G.; Pauleit, S. Designing public squares with green infrastructure to optimize human thermal comfort. Build. Environ. 2019, 149, 640–654. [Google Scholar] [CrossRef]
  49. Bernatzky, A. The contribution of tress and green spaces to a town climate. Energy Build. 1982, 5, 1–10. [Google Scholar] [CrossRef]
  50. Yılmaz, S.; Toy, S.; Irmak, M.A.; Yilmaz, H. Determination of climatic differences in three different land uses in the city of Erzurum, Turkey. Build. Environ. 2007, 42, 1604–1612. [Google Scholar] [CrossRef]
  51. Lin, Y.; Han, X.; Wu, X.; Hao, X.Y.; Wang, J.; Liang, F.; Liang, J.; Wang, Z.H. Ecological field characteristic of green land based on urban green space structure. Acta Ecol. Sin. 2006, 26, 3339–3346. [Google Scholar]
  52. Koh, I.; Kim, S.; Lee, D. Effects of bibosoop plantation on wind speed, humidity, and evaporation in a traditional agricultural landscape of Korea: Field measurements and modeling. Agric. Ecosyst. Environ. 2010, 135, 294–303. [Google Scholar] [CrossRef]
  53. Oke, T.R.; Mills, G.; Christen, A.; Voogt, J.A. Urban Climates; Cambridge University Press: Cambridge, MA, USA, 2017. [Google Scholar]
  54. Brown, R.D.; Gillespie, T.J. Microclimatic Landscape Design: Creating Thermal Comfort and Energy Efficiency; Wiley: New York, NY, USA, 1995; Volume 1. [Google Scholar]
  55. Yoshida, A.; Hisabayashi, T.; Kashihara, K.; Kinoshita, S.; Hashida, S. Evaluation of effect of tree canopy on thermal environment, thermal sensation, and mental state. Urban Clim. 2015, 14, 240–250. [Google Scholar] [CrossRef]
  56. Sabrin, S.; Karimi, M.; Nazari, R.; Pratt, J.; Bryk, J. Effects of Different Urban-Vegetation Morphology on the Canopy-level Thermal Comfort and the Cooling Benefits of Shade Trees: Case-study in Philadelphia. Sustain. Cities Soc. 2021, 66, 102684. [Google Scholar] [CrossRef]
  57. Yang, R.; Zhang, H.; You, S.; Zheng, W.; Zheng, X.; Ye, T. Study on the thermal comfort index of solar radiation conditions in winter. Build. Environ. 2020, 167, 106456. [Google Scholar] [CrossRef]
  58. Huang, Z.; Gou, Z.; Cheng, B. An investigation of outdoor thermal environments with different ground surfaces in the hot summer-cold winter climate region. J. Build. Eng. 2020, 27, 100994. [Google Scholar] [CrossRef]
  59. Liu, G.; Wang, Z.; Li, C.; Hu, S.; Chen, X.; Liang, P. Heat exchange character and thermal comfort of young people in the building with solar radiation in winter. Build. Environ. 2020, 179, 106937. [Google Scholar] [CrossRef]
  60. Huang, Z.; Cheng, B.; Gou, Z.; Zhang, F. Outdoor thermal comfort and adaptive behaviors in a university campus in China’s hot summer-cold winter climate region. Build. Environ. 2019, 165, 106414. [Google Scholar] [CrossRef]
Figure 1. (a) The location of Fengxian meteorological station and Shanghai Normal University Fengxian Campus; (b) remote sensing image from Tianditu (https://map.tianditu.gov.cn/ (accessed on 23 August 2023)) of Shanghai Normal University Fengxian Campus and study area.
Sustainability 15 12818 g001
Figure 2. (ae) The photographs obtained from on-site observations illustrate the positions and surroundings of the five observation sites; (f) remote sensing image from Tianditu (https://map.tianditu.gov.cn/ (accessed on 23 August 2023)) of the current study.
Sustainability 15 12818 g002
Figure 3. The construction flowchart of ENVI-met model.
Sustainability 15 12818 g003
Figure 4. (a) The locations of buildings and receptors; (b) the DEM model for the ENVI-met simulation.
Sustainability 15 12818 g004
Figure 5. (a) The original case with vegetation canopy; (b) the designed case without vegetation canopy.
Sustainability 15 12818 g005
Figure 6. Hourly T a and RH data from the Fengxian meteorological station on (a) 20 January and (b) 6 March 2023.
Sustainability 15 12818 g006
Figure 7. Results of the difference in (a) air temperature, (b) relative humidity, and (c) wind speed at pedestrian height between the original case and the designed case.
Sustainability 15 12818 g007
Figure 8. Variations of the difference in (a) air temperature, (b) relative humidity, and (c) wind speed on receptors 1 and 4 of the original case and the designed case.
Sustainability 15 12818 g008
Figure 9. Results of the difference in sum solar radiation at pedestrian height between the original case and the designed case.
Sustainability 15 12818 g009
Figure 10. Variation of the difference in sum solar radiation at receptors 1 and 4 of the original case and the designed case.
Sustainability 15 12818 g010
Figure 11. PET at pedestrian height in original case and designed case.
Sustainability 15 12818 g011
Figure 12. The variation of PET values at receptors 1 and 4 on (a) 20 January and (b) 6 March 2023.
Sustainability 15 12818 g012
Figure 13. The percentage of area in different thermal sensations at pedestrian height between the original case (with vegetation canopy) and the designed case (without vegetation canopy) on (a) 20 January, and (b) 6 March 2023.
Sustainability 15 12818 g013
Figure 14. The percentage of time from 8:00 to 20:00 in different thermal sensations at receptors 1 and 4 between the original case (with vegetation canopy) and the designed case (without vegetation canopy).
Sustainability 15 12818 g014
Table 1. The details of the five observation sites.
Observation Sites LocationVegetation Shading ConditionBuilding Shading ConditionUnderlying Surface
1North avenueWithPartly withImpervious
2RiversideWithoutWithoutImpervious
3North lakesideWithoutWithoutGrassland
4South lakesidePartly withWithoutGrassland
5South lawnWithoutPartly withGrassland
Table 2. The details of ten simulation cases.
DateCase NameThe Resolution in the
Vertical Direction
With Tree Canopy or Not
20 January 2023D0120_R3m_Tree3 mYes
D0120_R2m_Tree2 mYes
D0120_R1m_Tree1 mYes
D0120_R05m_Tree0.5 mYes
D0120_R1m_NoTree1 mNo
6 March 2023D0306_R3m_Tree3 mYes
D0306_R2m_Tree2 mYes
D0306_R1m_Tree1 mYes
D0306_R05m_Tree0.5 mYes
D0306_R1m_NoTree1 mNo
Table 3. Surface and building parameters for ENVI-met modeling.
Surface TypeParameterItemValue
SoilLoamy Soilz0 Roughness Length (m)0.015
Albedo0.000
Emissivity0.900
WaterDeep Waterz0 Roughness Length (m)0.010
Albedo0.000
Emissivity0.900
Impervious SurfaceAsphalt Roadz0 Roughness Length (m)0.010
Albedo0.200
Emissivity0.900
BuildingDefault ConcreteDefault Thickness (m)0.010
Absorption0.500
Transmission0.000
Reflection0.500
Emissivity0.900
Specific Heat ( J · m 3 · K 1   ×   10 6 )850.000
Thermal Conductivity ( W · m 1 · K 1 )1.600
Density ( kg · m 3 )2220.000
Table 4. The parameters of main plants in the study area.
Plant TypeLeaf TypePlant Height (m) LAD   ( m 2 · m 3 ) in the Vertical
GrassGrass0.2000.300, 0.300, 0.300, 0.300, 0.300,
0.300, 0.300, 0.300, 0.300, 0.300
Buxus sinicaDeciduous0.5002.500, 2.500, 2.500, 2.500, 2.500,
2.500, 2.500, 2.500, 2.500, 2.500
Photinia serratifoliaDeciduous10.0000.000, 0.000, 0.100, 0.600, 1.750,
1.600, 1.550, 1.050, 0.450, 0.100
Camphora officinarumDeciduous10.0000.000, 0.000, 0.005, 0.095, 0.250,
1.450, 1.250, 1.250, 0.950, 0.250
CedrusConifer15.0001.450, 1.650, 1.250, 1.050, 0.750,
0.750, 0.400, 0.200, 0.150, 0.050
Table 5. The parameters of boundary conditions on 20 January and 6 March 2023.
DateParameterValue
20 January 2023Simulation Time (h)16
Air Temperature (°C) and Humidity (%)Figure 6a
Humidity in 2500 m ( g · kg 1 )1.60
Wind speed ( m · s 1 )3.12
Wind direction (°)40
Roughness Length (m)0.010
Low clouds (0–8)0
Medium clouds (0–8)0
High clouds (0–8)0
6 March 2023Simulation Time (h)16
Air Temperature (°C) and Humidity (%)Figure 6b
Humidity in 2500 m ( g · kg 1 )2.40
Windspeed ( m · s 1 )2.26
Wind direction (°)0
Roughness Length (m)0.010
Low clouds (0–8)0
Medium clouds (0–8)0
High clouds (0–8)0
Table 6. The settings of individual thermal comfort parameters in Bio-met.
Parameter TypeItemValue/Name
Body parametersAge of person (y)20
GenderFemale
Weight (kg)50
Height (m)1.6
Body positionstanding
Walking speed ( m · s 1 )1.21
Clothing parametersInsulation Outdoor (clo)2.00 (Date: 20 January)
1.50 (Date: 6 March)
Insulation Indoor (clo)0.9
Table 7. The results of vertical grid sensitivity test.
Grid Size
(Vertical)
T a RH
R2RMSE (°C)MBE (°C)R2RMSE (%)MBE (%)
3 m0.921.24−0.350.517.59−1.27
2 m0.921.30−0.440.467.87−1.24
1 m0.931.17−0.200.517.61−0.18
0.5 m0.941.120.210.478.501.67
Disclaimer/Publisher’s Note: The statements, opinions and data contained in all publications are solely those of the individual author(s) and contributor(s) and not of MDPI and/or the editor(s). MDPI and/or the editor(s) disclaim responsibility for any injury to people or property resulting from any ideas, methods, instructions or products referred to in the content.

