Article

The New Geography of Manufacturing in China: The Internet and Manufacturing Agglomeration

School of Economics, Huazhong University of Science and Technology, Wuhan 430074, China
*
Author to whom correspondence should be addressed.
Sustainability 2023, 15(17), 12820; https://doi.org/10.3390/su151712820
Submission received: 20 June 2023 / Revised: 18 August 2023 / Accepted: 22 August 2023 / Published: 24 August 2023

Abstract

:
The Internet has profoundly affected the spatial structure of cities, but few relevant studies have investigated it from the perspective of manufacturing agglomeration. Using panel data of prefecture-level cities in China covering the period 2003–2019, this paper studies how the Internet affects manufacturing agglomeration. The results show that there is a U-shaped relationship between the Internet and manufacturing agglomeration, and the underlying channel can be the enhancement of market potential. Human capital can enhance the role of the Internet in promoting manufacturing agglomeration. The findings can contribute to a better understanding of the relationship between the Internet and urban spatial structure in developing countries.

1. Introduction

Since the 1990s, the Internet has experienced rapid development, leading to a significant boost in the flexibility of enterprises and residents [1]. Enterprises located in remote areas can communicate with companies in any city worldwide via the Internet. Residents can consume and work where they prefer through e-commerce and online jobs. This has therefore stimulated widespread academic attention in exploring the spatial impact of the Internet, while the findings remain mixed and even contradictory. Many scholars argue that the Internet would diminish the importance of geography to economic activity, proposing a series of conjectures like the death of the city, the death of distance, and the end of geography [2,3,4]. Numerous empirical studies confirm that the Internet has facilitated the decentralization of economic activity [5,6,7], supporting these conjectures to some extent. However, it can be observed that the rapid development of the Internet since the beginning of the new millennium has been accompanied by the emergence of new agglomeration economies, such as Silicon Valley in the United States [8], and Taobao villages in Zhejiang and Guangdong, China [9]. Some empirical studies also confirm that the Internet promotes the concentration of economic activities. This hence calls for further exploration of the spatial impact of the Internet.
The spatial organization of economic activity evolves in response to technological change [10], and such evolution is particularly evident in the spatial distribution of manufacturing. For instance, the concentration of the handicraft industry in America lasted until the early 20th century. However, in the middle of the 20th century, this concentration gradually disappeared due to the increased power of mechanization and the accessibility of fuel [11]. In the digital age, the emergence of Internet technologies, like e-commerce and the Internet of Things (IoT), has significantly transformed the business patterns and production organization within the manufacturing industry [12]. While these advancements have the potential to reshape the spatial organization of manufacturing, existing effort on this question remains rather scant. Some studies, based on data samples predating 2010, suggest that the Internet has contributed to the dispersion of manufacturing [6,13]. However, given the globally significant advancements in Internet technology in the last 10 years [5], these studies may not fully capture the current effects of the Internet on manufacturing agglomeration. In addition, the rapid development of the Internet has led to new socio-economic impacts, such as network effects [14] (Network effects mean that the network value or the network user welfare depends on the number of network users [15]. For example, when only one user uses the Internet, there are insufficient users to form a network, resulting in the low welfare of the Internet user and Internet value). Recent literature confirms the network effects of the Internet in terms of productivity [14,16]. These studies show that the Internet has an increasing marginal effect on productivity in the context of rapid adoption rate and the pervasiveness of Internet-based technologies. By far, there is no consensus on the role of the Internet in spatial organization, which therefore necessitates an in-depth analysis of the relationship and the underlying mechanisms. Several specific questions remain to be answered. How does the Internet affect the spatial distribution of manufacturing? Further, does the Internet have a non-linear effect on manufacturing agglomeration? These questions have been relatively neglected in the literature.
To this end, we use the panel data of prefecture-level cities from 2003 to 2019 as a research sample. Employing a panel two-way fixed effects (FE) model and an instrumental variable (IV) approach, we examine the causal links between the Internet and manufacturing agglomeration. We find that the Internet first leads to manufacturing dispersion and then promotes manufacturing agglomeration, while a U-shaped relationship is formed between the Internet and manufacturing agglomeration.
In light of the existing literature, the sources of the Internet’s force on agglomeration include, but are not limited to, the communication cost reduction effect, the information-matching effect, and the innovation effect. Firstly, the communication cost reduction effect of the Internet generates a centrifugal force of agglomeration. With the Internet enabling online communication to replace face-to-face interaction, the lower cost of remote communication reduces the importance of geographical proximity [5,6]. Additionally, Internet technology expands the scope of knowledge spillovers by encoding and transmitting knowledge online, which enhances the flexibility of firms and individuals in selecting locations [5]. Secondly, the information-matching effect of the Internet creates both centrifugal and centripetal forces of agglomeration. On the one hand, the Internet facilitates firms to identify market entry opportunities by improving the information matching of the industrial chain [17,18,19], thus enhancing the centripetal force of agglomeration. On the other hand, the Internet allows for better alignment of supply and demand on online platforms by improving the matching of product market information [20], thereby diminishing the importance of geography agglomeration and leading to dispersion. Thirdly, the innovation effect of the Internet acts as a centripetal force for agglomeration. The Internet gives rise to new industries and provides new entry opportunities for enterprises [10,21,22], thus attracting firms to concentrate. In addition, Internet-driven innovations generate tacit knowledge that cannot be easily transferred online [10,23]. Instead, they rely on face-to-face communication, fostering agglomeration centripetal forces [10,23]. The above explanations provide much insight, but most of the relevant research assumes that the centripetal and centrifugal forces formed by the Internet develop linearly. A recent working paper by Glaeser (2020) [24] also points out that early technological changes are mainly dispersion forces, whereas those in recent years have largely been agglomeration forces. Wang et al. (2022) [10] argue that the Internet exhibits a decreasing marginal impact on communication costs, creating a decreasing centrifugal force, and that the Internet has a linear impact on innovation, creating a linear centripetal force, which results in a U-shaped relationship between the Internet and urban hierarchy. Overall, the explanation of the non-linear relationship between the Internet and agglomeration is insufficient.
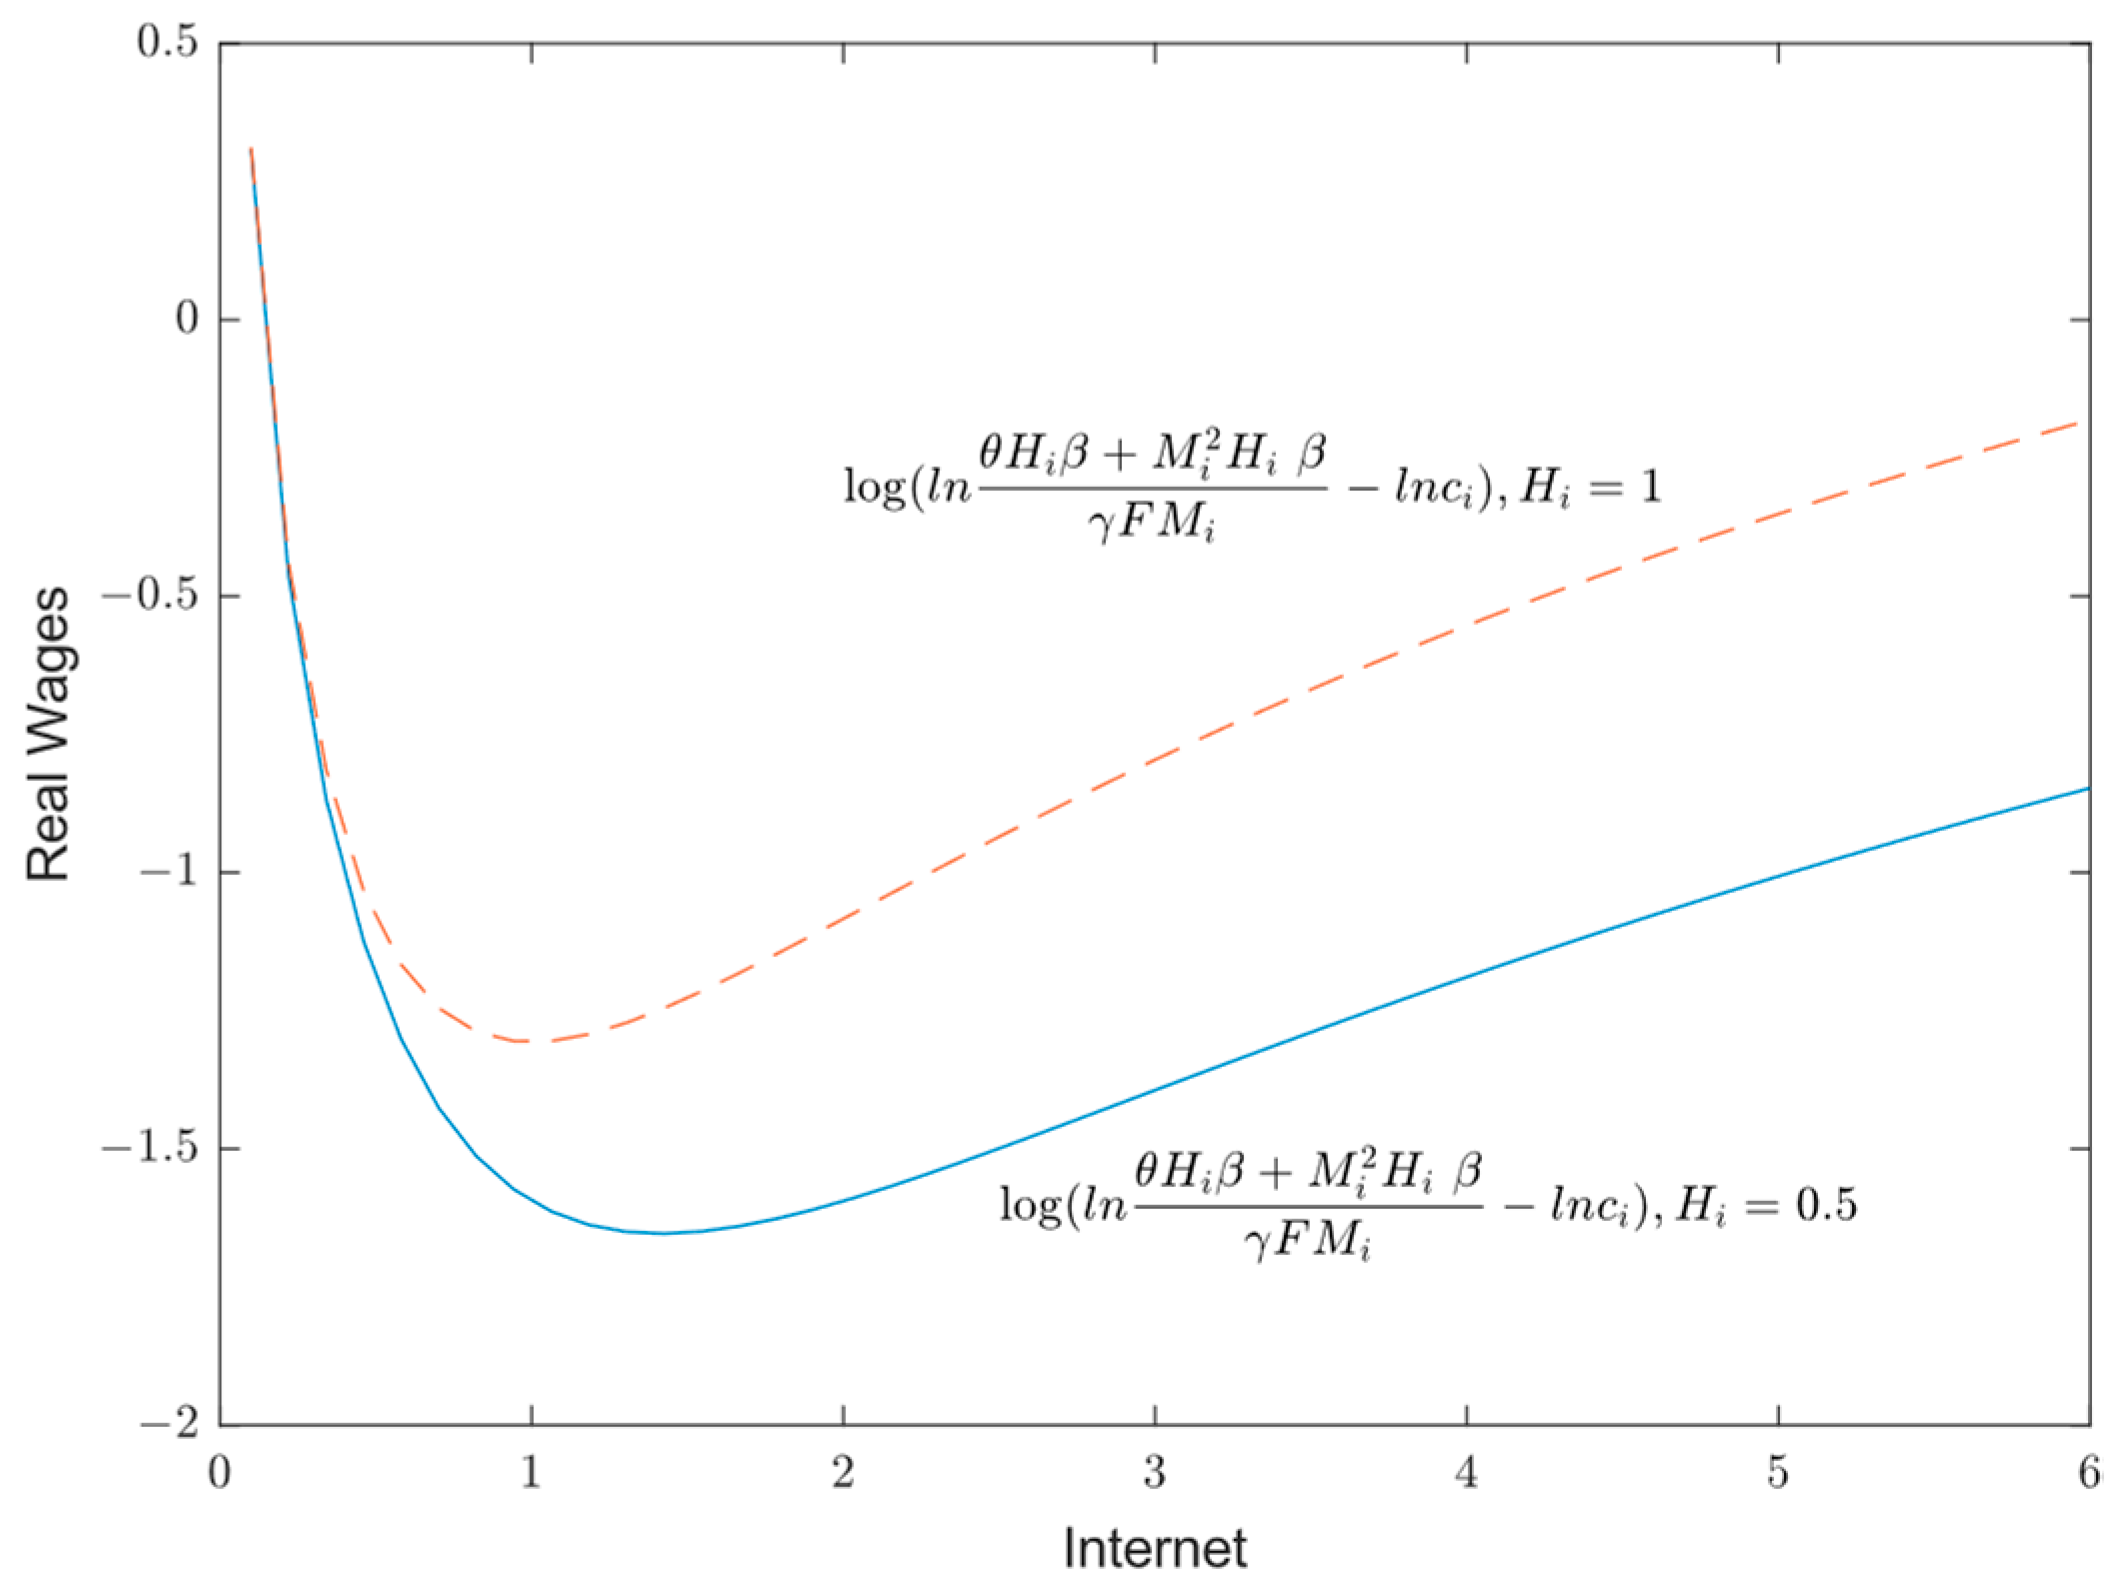
To fill this research gap, we use the theoretical framework of new economic geography to construct a partial equilibrium model to explore the non-linear mechanism of the Internet’s effect on manufacturing agglomeration. Based on related studies [14,16,25], we assume that there is a marginal increasing effect of the Internet on the productivity of manufacturing firms, which creates an incremental centripetal force. We also assume that there is a linear effect of the Internet on firm costs, which creates a linear centrifugal force. The tug-of-war between the two forces results in a U-shaped relationship between the Internet and manufacturing agglomeration. Further, we incorporate human capital and market potential into the theoretical model, given the close association of the Internet with human capital and market potential. The mechanism analysis in this paper shows that the complementarity between human capital and the Internet reinforces the centripetal force of the Internet on manufacturing agglomeration. The Internet can influence manufacturing agglomeration through the market potential channel.
Compared with the previous literature, the contribution of this paper is mainly threefold. First, we provide new evidence that the Internet affects the spatial layout from the perspective of manufacturing agglomeration, while most of the existing literature focuses on the role of the Internet on the overall spatial structure [1,10,20,26]. However, these studies ignore the industry heterogeneity of the Internet’s impact on agglomeration. The effect of the Internet on different industries depends largely on industry characteristics, including different factor structures and the level of market responsiveness required [21].
Second, this paper deepens the understanding of the Internet’s impact on manufacturing agglomeration. The previous literature has paid more attention to the linear effect of the Internet on manufacturing agglomeration [6,27]. However, the current rapid diffusion and penetration of Internet technology have triggered network effects, making its non-linear impact on economic activities more pronounced [14]. By focusing on the non-linear role of the Internet, our findings can reflect the U-shaped relationship between Internet development and manufacturing agglomeration, thus providing a more comprehensive understanding of how the Internet affects manufacturing agglomeration.
Third, this paper provides a new analytical framework based on the new economic geography theory. The existing literature offers many explanations, but few studies approach the issue from the theoretical framework of new economic geography [28]. Instead, we incorporate human capital, market potential, and the Internet into the theoretical framework of new economic geography, taking into account the complementarity between human capital and the Internet [29], as well as the impact of the Internet on market potential [19]. This provides a new analytical framework for exploring how the Internet affects manufacturing agglomeration.
The remainder of this paper is organized as follows. Section 2 presents the theory model and research hypothesis. Section 3 introduces research methods, variable descriptions, and data. Section 4 presents the empirical results. The final section offers the conclusion and policy implications.

2. Theory Model and Research Hypothesis

2.1. Set-Up

Our model shows the role of the Internet in manufacturing agglomeration, which is extended to the empirical model in our study. Following Krugman (1991) [30] and Forslid and Ottaviano (2003) [31], we assume that there are two regions, south and north (denoted as 1 and 2, respectively), and two sectors, agriculture and manufacturing, in the economy. The factors consist of skilled and unskilled labor, denoted as H and L, respectively. H i and L i are the number of skilled workers and unskilled workers in region i , respectively. We set that H i + H j = H , L i + L j = L , and L i = L j . The unskilled worker market is a perfectly competitive market, and they cannot move freely between regions, while skilled workers can be thought of as human capital who move freely between regions. The goods of both sectors are traded. Trade in agricultural goods is frictionless while trade in the manufacturing sector is inhibited by iceberg trade costs. Specifically, it is costless to ship manufactured goods to local consumers, but to sell one unit in the other region, a manufacturing firm must ship τ ( τ > 1 ) units. As usual, τ captures all the costs of selling to distant markets, including transport costs and transaction costs.

2.2. Consumer

The economy contains agricultural and industrial goods. The combination of the quantities consumed for products determines the representative consumer utility in region   i . The utility function is given by
U i = X i μ A i 1 μ
where μ is a constant, X i is the consumption of the manufactured goods, and A i is the consumption of agricultural products. The consumption of the manufactures X i is given by
X i = s N d i s σ 1 / σ d s σ / σ 1 ,   ρ = σ 1 / σ , σ > 1
where σ is the elasticity of substitution between manufactured goods. σ and ρ 1 indicate complete substitution between manufactured goods. σ 1 and ρ 0 indicate no substitution between manufactured goods. N is the mass of varieties of manufactured goods in the two regions, with n 1 + n 2 = N , where n 1 and n 2 are the varieties of manufactured goods in the south and north. d s is the consumption of variety s of goods. We transform Equation (2) into Equation (3):
X i = s n i d i i s σ 1 / σ d s + s n j d j i s σ 1 / σ d s σ 1 / σ ,   i , j = 1,2
where d i i s is the demand of region i for variety s of manufactured goods in region   i , and d j i s is the demand of region i for variety s of manufactured goods in region j .
The first condition for maximization gives the demand of local residents in region i :
d j i = P j i s σ P i 1 σ μ I i
where p j i is the price of a variety produced in j and sold in i , I i is the income of the consumer, and P i is the local CES price index associated with (2), given by
P i = s n i P i i s 1 σ d s + s n j P j i 1 σ d s 1 / 1 σ
We transform Equation (5) into Equation (6):
G i = 1 P i
G i is defined as convenience in consumer purchasing. According to Equations (5) and (6), a greater variety of industrial products and a smaller price difference between regions for these products lead to the diversification of consumption choices and lower costs in obtaining these goods, which result in a higher level of convenience of consumer purchasing.

2.3. Manufacturing Sector

Following the simplification suggested by Krugman (1991) [30], firms in sector M are monopolistically competitive and only require skilled labor. Each firm produces only one differentiated good. In addition, following Ricci (1999) [32], we set that the manufacturing sector in region i has an exogenous productivity β i = β . The higher the productivity of the manufacturing sector, the lower the production cost of the firm. In the absence of the Internet, the skilled labor required by firms in region i to produce x i s units of product is
h i s = F i + x i s / β i
where F i is the firm’s fixed input of skilled labor, and F i = F . x i s / β i is the variable input of skilled labor.
When a firm uses the Internet, both the firm’s fixed inputs and variable inputs change. First, the use of the Internet increases the fixed inputs of the firm. The use of the Internet involves a series of transformations, including equipment upgrading, technology development, and organizational transformation [33]. However, these transformations may face obstacles such as mismatched production processes, a lack of human capital, and underdeveloped application scenarios [25]. In order to make the Internet work in production, firms need to invest in human and physical resources, which leads to an increase in fixed costs for manufacturers. Therefore, referring to Galliano (2008) [34], we assume that when the level of the Internet in region i is M i , the fixed cost of the Internet use for firms is
F i = γ M i F ,   γ M i > 1
Second, the Internet has the potential to reduce variable costs and increase productivity. By reducing transaction costs, optimizing resource allocation, and fostering innovation, the Internet plays a crucial role in enhancing enterprise productivity [35]. Additionally, the Internet technology can be seen as a network good that benefits from a growing user base. As more firms adopt the Internet, the frequency and number of exchanges using this technology increase. This exchange of information, knowledge, and ideas can lead to spatial spillovers, driving innovation and ultimately boosting firm productivity [20]. The Internet’s network effects further amplify the innovation benefits of knowledge spillovers within a region [14,16]. Therefore, as the level of Internet penetration increases, the role of the Internet in productivity growth is likely to enhance. In fact, studies by Wu et al. (2022) [14] in China and Cariolle and Goff (2023) [16] in 109 developing countries confirm the existence of a U-shaped relationship between the Internet and productivity. Thus, for simplicity, we set the productivity of a firm when it uses the Internet to be
β i = β M i 2
In addition, the existing literature highlights the critical role of human capital in enhancing the Internet’s impact on productivity. From a technology absorptive capacity perspective, since human capital determines the firm’s ability to absorb technology [25], the complementarity between human capital and the Internet is key to the Internet’s ability to increase productivity [34]. Moreover, human capital is actually a combination of skills, knowledge and experience, which triggers a certain range of knowledge spillovers. The Internet has the potential to reduce the cost of disseminating knowledge and information, accelerate the speed of knowledge and information dissemination, and expand the scope of knowledge spillovers [20]. Together, these factors can collectively enhance the knowledge spillover effect of human capital. Following Cariolle and Goff (2023) [16] and Cambini and Sabatino (2023) [36], we set that human capital in region i will amplify the network effects of the Internet:
β i = M i 2 H i β + θ H i β
where θ H i β denotes that the human capital enhances productivity, and M i 2 H i β denotes that the complementarity between human capital and the Internet amplifies the network effects, resulting in an increasing marginal effect of Internet development on the productivity of firms.
Based on Equations (8), (9), and (11), we obtain the total cost function of the firm:
T C i s = w i F i + x i s / β i
where w i is the wage of skilled labor in region i .
According to Equations (3) and (11), the firm’s profit function can be written as
π i s = p i i s d i i s + p i j s d i j s w i d i i s + τ i d i j s / β i w i F i
Solving the first-order condition of profit maximization, we can obtain Equation (13):
p i i s = σ w i / β i σ 1 ,   p i j s = τ i j σ w i / β i σ 1
Substituting Equations (6) and (13) into Equation (4), the output of the firm is expressed as Equation (14):
x i s = σ w i β i σ 1 σ k = 1 2 μ I k G k 1 δ τ i k 1 δ
According to the definition of market potential by Hanson (2005) [37], we let M P i = k = 1 2 μ I k G k 1 δ τ i k 1 δ . M P i denotes the market potential of the firm.
In the monopolistic competition market, all manufacturing firms have zero excess profits, so we can derive output based on the following condition:
x i s = σ 1 β i F i
Substituting Equation (15) into the cost function Equation (11), we can obtain
T C i s = σ F i
H i represents the total quantity of skilled labor in region i , and σ F i is the amount of input labor required for each firm to produce. On this basis, the number of clustered firms can be derived as
n i = H i / σ F i
According to Forslid and Ottaviano (2003) [31], firms are essentially a combination of factors. Equation (15) indicates that agglomeration depends on the movement of skilled labor.
By combining Equations (14) and (15), we can obtain the equation for skilled labor wages:
w i = σ σ 1 σ β i σ 1 M P i / F i σ 1

2.4. Equilibrium

According to Krugman (1991) [30], the equilibrium of agglomeration depends on the real wages of skilled labor. Equilibrium is reached when the real wages for skilled labor are equal in both the northern and southern regions. With the ongoing process of industrialization, the contradiction between the limited carrying capacity of land and the unlimited expansion of the agglomeration economy becomes prominent. On the one hand, skilled workers, as the primary production force, prefer diversified consumption and high wage brought about by large-scale agglomeration. On the other hand, they have to bear the congestion costs brought about by competition for production space [38]. The equilibrium depends on the skilled workers’ tradeoff between these two factors. Following Helpman (1995) [38] and Pi and Li (2021) [39], we set the congestion costs as an exogenous factor, and the real wage equation is shown in Equation (19):
ω i = w i c i
where c i is the cost of congestion in region i . Following Krugman (1991) [30], we assume that the two regions are in a symmetric state, and the equilibrium condition is expressed as
ω = ω i = ω j = σ σ 1 σ β i σ 1 M P i / c i F i σ 1
Substituting Equations (8) and (10) into Equation (20) and taking the logarithm, we can obtain Equation (21):
l n ω = σ 1 l n σ 1 σ l n σ + l n θ H i β + M i 2 H i β γ F M i l n c i + l n M P i
The real wage ( l n ω ) determines manufacturing agglomeration by driving labor mobility. Referring to the previous studies, we set β = 1 , θ = 1 , γ = 1 , and F = 1 . We first examine the effect of the Internet on real wages by focusing on l n θ H i β + M i 2 H i β γ F M i l n c i . This formula shows the U-shaped relationship between the Internet and real wages, as illustrated in Figure 1. Holding that the level of human capital remains constant, the Internet exerts a centripetal force on manufacturing agglomeration primarily through the productivity gains derived from its network effects. This leads to increased profits for firms and higher real wages for skilled labor, thereby promoting manufacturing agglomeration. The centrifugal force of the Internet on manufacturing agglomeration primarily arises from the Internet usage costs and congestion costs. These factors reduce firms’ profits and the real wages of skilled labor, subsequently inhibiting manufacturing agglomeration. If the centripetal force of agglomeration created by the Internet is weaker than the centrifugal force, the Internet leads to manufacturing decentralization. Conversely, if the centripetal force is stronger than the centrifugal force, the Internet drives manufacturing concentration. Therefore, we propose the following:
Hypothesis 1:
The Internet first leads to manufacturing dispersion and then promotes manufacturing agglomeration, i.e., there is a U-shaped relationship between the Internet and manufacturing agglomeration.
Further, comparing the two curves for H i = 0.5 and H i = 1 in Figure 1, we find that the inflection point of the Internet on manufacturing agglomeration shifts to the left when the level of human capital increases. The complementarity between human capital and the Internet amplifies the network effects, which strengthens the centripetal force of the Internet on manufacturing agglomeration. Hence, we propose that:
Hypothesis 2:
Human capital strengthens the centripetal force of the Internet on manufacturing agglomeration.
From expression (21), we can see that the market potential will increase the real wage holding other parameters constant. An increase in the real wage, caused by increasing market potential, leads to manufacturing agglomeration. Many studies have proved that the market potential promotes manufacturing agglomeration [40,41].
The Internet enhances market potential by reducing transaction costs [19]. Specifically, the Internet attracts consumers and manufacturers to concentrate on digital platforms, which leads to a better matching of supply and demand [27]. For example, suppliers in remote areas can match their consumers on the platform, and consumers in remote areas can buy goods from the central area on the platform, which greatly weakens the transaction cost generated by geographical distance and enhances the market potential. Based on China’s actual circumstances, studies show that e-commerce eliminates entry costs to the market, increases inter-city trade, and improves welfare gains [42]. Hence, we propose that:
Hypothesis 3:
The Internet affects manufacturing agglomeration through the market potential channel.

3. Research Methods, Variable Description, and Data

3.1. Regression Model and Variables

Following previous studies [16,43,44], we incorporate the quadratic term for the Internet in our regression model to examine the potential U-shaped relationship between the Internet and manufacturing agglomeration. The formula is
a g g i t = α i + β 1 B P i t + β 2 B P 2 i t + β 3 c o n t r o l i t + μ t + ϵ i t
where a g g i t is the centralization index for city i in year t . Referring to related studies [45,46], we use two indicators, scale agglomeration (agg1) and specialization agglomeration (agg2), to measure manufacturing agglomeration to fully reflect the characteristics of agglomeration. Specifically, specialization agglomeration is measured by the location entropy of manufacturing, and scale agglomeration is measured by the share of manufacturing employment in total employment. α i is the individual fixed effect. μ t is the year fixed effect.
B P i t denotes the level of the Internet in year t of city i . We use the broadband penetration rate (fixed broadband subscriptions per 100 people) to measure the level of the Internet, which is mostly used in the existing studies [14,47]. B P 2 i t is the quadratic term of B P i t , which is the core explanatory variable in the model. β 2 captures the non-linear effect of the Internet on agglomeration, which is the estimated coefficient of our main concern.
c o n t r o l i t represents the control variables included in the model. Following previous studies [46,47,48], we select human capital (HC), population size (pop), foreign direct investment I (fdi), local government intervention (gov), industrial structure (struc), environmental regulation (ER), and transportation infrastructure (tpr) as control variables. The definition and data source of control variables are shown in Table 1.
To further clarify the mechanism of the Internet’s effect on manufacturing agglomeration, we examine the moderating role of human capital by adding an interaction term to the model (22), as shown in model (23).
a g g i t = α i + θ 1 B P i t + θ 2 B P 2 i t + θ 3 B P i t × H C i t + θ 4 B P 2 i t × H C i t + θ 5 c o n t r o l i t + μ t + ϵ i t
Following related studies [49,50], we focus on the estimated coefficient ( θ 4 ) of the interaction term ( B P 2 i t × H C i t ) in this model. If this coefficient is significant, it indicates that human capital moderates the non-linear relationship between the Internet and manufacturing agglomeration.
Furthermore, we construct a mediating-effect model to verify whether the Internet affects manufacturing agglomeration through the market potential channel. Referring to previous studies [44], we construct the model as follows:
M P i t = α i + θ 1 B P i t + θ 2 c o n t r o l i t + μ t + ϵ i t
a g g i t = α i + β 1 B P i t + β 2 B P 2 i t + β 3 c o n t r o l i t + μ t + ϵ i t
a g g i t = α i + δ 1 B P i t + δ 2 B P 2 i t + δ 3 M P i t + δ 4 c o n t r o l i t + μ t + ϵ i t
where MP is the market potential, which is computed following Hanson (2005) [37]. M P i = j Y j / d i j = Y i / d i i + j i Y j / d i j , where Y i / d i i measures the local product demand, Y i is the GDP of city i , and d i i is the internal distance of city i , which is calculated as d i i = 2 3 a r e a i / π , and a r e a i is the land area of the city’s administrative area. j i Y j / d i j measures the demand for local products in other areas, Y j is the GDP of city j , and d i j is the geographical distance between city i and city j .
Based on models (24)–(26), stepwise regression was used to verify the mechanism. The first step is to regress the mechanism variable MP on B P as shown in model (24). If the coefficient θ 1 is significantly positive, it indicates that the Internet significantly affects market potential. The second step is to regress agg1 or agg2 on BP2 as shown in model (25), which is the same as that in model (22). The coefficient β 2 in model (25), which we focus on, captures the total effect of the Internet on manufacturing agglomeration. The third step is to regress agg1 or agg2 on BP2 and MP as shown in model (26). If the coefficient δ 3 of MP is significant, it proves the market potential influences manufacturing agglomeration. If the coefficients of our interest in the stepwise regression are significant, this indicates that the Internet affects manufacturing agglomeration through the market potential channel. The variable descriptions and statistical descriptions are shown in Table 1 and Table 2.

3.2. Two-Stage Least Squares (2SLS) with Instrumental Variable

The concern with the regression model above is that it may have endogeneity issues. Manufacturing agglomeration could affect Internet development, likely via growth in Internet demand and economies of scale. In addition, omitted variables may affect both Internet penetration and manufacturing agglomeration, resulting in potential endogeneity. To alleviate the estimation bias caused by endogeneity, we construct instrumental variables (IVs) for a robustness test based on China’s Internet development history and characteristics.

3.2.1. Selection of Instrumental Variables: Fiber Optic Capacity in 2000 and the Number of Telephones in 2000

From the Seventh Five-Year Plan period (1986–1990) to the Ninth Five-Year Plan period (1996–2000), China built “eight horizontal and eight vertical” fiber optic cable trunk networks, which were essentially completed by 2000. During the construction process, China selected 64 cities to serve as the main nodes for its Internet infrastructure. These 64 nodes then form the basic “eight horizontal and eight vertical” trunk networks, effectively covering a significant portion of cities throughout the country. Subsequently, the development of the Internet in China was based on this layout, which provided a strong foundation for nationwide connectivity and expansion. When selecting network nodes, China’s central government prioritizes the geographic location of these nodes rather than considering factors such as economic development and economic concentration. For example, the optical fiber capacity of Xuzhou and Wuhan, 498 and 492 cores, is much higher than that of Shanghai and Hangzhou, 392 cores and 292 cores, respectively, while the economic density of Wuhan and Xuzhou is much lower than that of Shanghai and Hangzhou.
In addition, in the early stage of China’s Internet development, the Internet was mostly accessed by ADSL relying on telephone lines, which means that the number of fixed telephones in 2000 may be one of the constraints for the development of the Internet. Meanwhile, the number of fixed telephones in 2000 is relatively exogenous because it is not directly related to manufacturing agglomeration. Therefore, the eight horizontal and eight vertical networks planned by China’s central government and the number of fixed telephones determine the development of the Internet in cities.
In summary, the initial fiber optic capacity of a city, brought about by the plans of China’s central government, and the initial number of fixed telephone lines not only determine the development of the city’s Internet but are also unrelated to the economic agglomeration. Given the availability of data, we select optic fiber capacity in 2000 and the number of fixed phones in 2000 as instrumental variables.

3.2.2. Two-Stage Least Squares Approach

To address these endogeneity concerns in the regression model estimation, we use the two-stage least squares approach adopted by Czernich (2011) [51]. This approach consists of two estimation stages. In the first stage, based on non-linear least squares estimation, we compute from this equation the fitted values of Internet penetration that are determined by exogenous factors. In the second stage, we substitute the fitted values of the Internet for the original values in Equation (22) to explore the effect of the Internet on manufacturing agglomeration.
Following Czernich (2011) [51], we assume that the maximum reach of broadband Internet γ i (i.e., the ultimate “ceiling” of Internet penetration) is given by the spread of the fiber optic capacity and fixed telephones that existed in 2000:
γ i = β 0 + β 1 f c 2000 i + β 2 t e l e p h o n e 2000 i
where f c 2000 i is the estimated optic fiber capacity of city i in 2000, and t e l e p h o n e 2000 i is the number of fixed phones per 100 people in city i in 2000. Specifically, the larger the optic fiber capacity of a node city, the more likely the Internet will develop to a higher level, while the non-node cities with smaller optic fiber capacity are to some extent dependent on the spillover from the node city. Hence, as the distance between a non-node city and a node city increases, the level of Internet development in the non-node city tends to decrease. Due to data availability, we can only obtain the optic fiber capacity of node cities in 2000. We calculate the optic fiber capacity of node cities as f c 2000 k = f c 0 + i 63 f c 2000 i / d i s t a n c e k i , where f c 0 is the optic fiber capacity of node cities, and the optic fiber capacity of non-node cities as f c 2000 k = i 64 f c 2000 i / d i s t a n c e k i , where d i s t a n c e k i is the distance from city k to node city i , and f c 2000 i is the optic fiber capacity of node city i .
Comin et al. (2006) [52] and Czernich (2011) [51] argue that the diffusion of a new technology is best described through a logistic curve. Following Czernich (2011) [51], broadband Internet, as a new technology, has diffusion dynamics that can be well described by a logistic curve:
B P i t = γ i 1 + e x p β t τ + ϵ i t
where B P i t is the broadband Internet penetration rate in the population, γ i is the Internet saturation level, β is the diffusion speed, and τ is the inflection point, the year with the highest diffusion speed.
Inserting Equation (27) into Equation (28), we obtain a non-linear first-stage estimation. From the first-stage estimation, we can get the predicted values of the Internet (BP) B P ^ , while squaring B P ^ to get B P 2 ^ , which is regarded as the predicted values of BP2. We use B P ^ and B P 2 ^ to replace BP and BP2 in Equation (22) to obtain the second-stage estimation equation.
a g g i t = α i + β 1 B P ^ i t + β 2 B P 2 ^ i t + β 3 c o n t r o l i t + μ t + ϵ i t
The other variables in the second-stage model of 2SLS regression are the same as in the regression model, as shown in Equation (22).

4. Empirical Results

4.1. Baseline Results

We first estimate Equation (22) using a two-way fixed effects (FE) model to test the U-shaped relationship between the Internet and manufacturing agglomeration. Columns (1) and (2) in Table 3 show that the quadratic coefficient of the Internet is significantly positive ( β ^ = 0.838 , p < 0.01; β ^ = 0.638 ; p < 0.01) and the primary coefficient of the Internet is significantly negative ( β ^ = 0.599 ; p < 0.01; β ^ = 0.672 ; p < 0.01) when the explained variables are scale agglomeration and specialized agglomeration, respectively, confirming that the Internet and manufacturing agglomeration have a U-shaped relationship. According to Hypothesis 1, the Internet leads to manufacturing dispersion when Internet penetration is low. On the one hand, low Internet penetration limits the number of firms utilizing the Internet, posing challenges in creating network effects. This results in congestion costs and high Internet usage costs outweighing the benefits, discouraging firms from establishing in such regions. On the other hand, the Internet offers convenience for firms even in remote areas. It facilitates knowledge spillovers and transactions regardless of their location, which diminishes the significance of geography and drives some firms to relocate in order to avoid congestion costs [19]. However, as Internet usage grows, so do its network effects. This results in increased profits, in terms of productivity and market potential, that surpass usage costs and congestion costs. Regions with higher Internet penetration tend to attract more firms to locate. Hence, there is a U-shaped relationship between the Internet and manufacturing agglomeration. The baseline results verify Hypothesis 1.
Considering manufacturing agglomeration has a path dependency, we use the system-generalized method of moments (GMM) to solve endogenous issues, to some extent. The premise of the GMM is that there is no second-order and higher-order autocorrelation in the residual sequence of the difference equation, and the instrumental variables are strictly exogenous. Therefore, we conduct a sequence correlation test and a Sargan test. The AR (2) test and Sargan test in columns (3) and (4) of Table 3 show that there is no second-order sequential autocorrelation and overidentification, which indicates the instrumental variables are valid. The coefficients of the primary and quadratic terms of the Internet using the GMM are significantly negative and positive, similar to the results of the FE model, revealing a U-shaped relationship between the Internet and manufacturing agglomeration.

4.2. Robustness Test

4.2.1. U-Shape Test

However, such evidence in Table 3 is not sufficient for the existence of a U shape, as the quadratic term may be statistically significant within a monotone interval. Following previous studies [53], we first find out the extreme point of the U-shape curve and then estimate the slopes of the left and right sides of the extreme points. The results are shown in Table 4. When the dependent variable is scale agglomeration (agg1), the interval of the U-curve is [0.0058, 0.8206], and the extreme point is 0.324. The slopes are −0.5898 in the interval [0.0058, 0.324] and 0.7758 in the interval [0.324, 0.8206], both significant at the 1% confidence level. When the dependent variable is specialized agglomeration (agg2), the interval of the U-shaped curve is [0.0058, 0.8206], and the extreme value point is 0.518. The slopes are −0.664 in the interval [0.0058, 0.518] and 0.375 in the interval [0.518, 0.8206], both significant at the 1% confidence level. This test indicates that the U-shaped relationship between the Internet and agglomeration does exist. Figure 2 visualizes such a U-shape.

4.2.2. Endogenous Issues

The endogeneity problem mainly arises from omitted variables, measurement errors, and reverse causality. First, omitted variables can cause endogeneity issues when these unobservable variables affect both the Internet and manufacturing agglomeration. Second, broadband Internet penetration may not capture the multidimensional nature of Internet development, which may result in measurement errors and potential endogeneity issues. Third, manufacturing agglomeration may also affect the development of the Internet, thus causing endogenous issues.
The issue of omitted variables has been of wide interest. Altonji et al. (2005) [54] illustrate that after controlling for variables, the effect of omitted variables on the accuracy of estimation can be inferred from the sensitivity of the estimated coefficients. However, Oster (2019) [55] points out that it is not only the coefficient sensitivity that is of concern but also the change in explanatory power after controlling for variables. Otser (2019) [55] constructed the δ statistic, the value of which indicates that the importance of unobservable variables needs to be significantly greater than observable variables in order to overturn the results.
We apply the method proposed by Otser (2019) [55] to compute the statistic δ , which is used to test whether the coefficient of the Internet quadratic term tends to be 0 when controlling for all observable and unobservable variables. Obviously, the choice of the goodness of fit is also important when assuming that all variables associated with the core explanatory variables are controlled for. In line with the current practice in economics top journals, we choose what they recommend, an estimate of Rmax of 1.3 times the R-squared from the model that includes the observable control variables. As Oster (2019) [55] suggests, we report the δ value that causes the coefficients of the core explanatory variables to converge to 0. When the δ value is less than or equal to 1, it indicates that the unobservable variables are equally as important as the observable variables and the null hypothesis cannot be rejected. When the δ value is greater than 1, it indicates that the unobservable variables are less important than the observable variables and the null hypothesis can be rejected, implying that the relative importance of the uncontrolled unobservable variables is lower and the resulting bias in the estimated coefficients is acceptable.
As shown in Table 5, the smallest values of δ are 1.51 and 1.14, respectively, indicating that unobservable variables would need to be 1.52 times and 1.14 times as important as the included control variables to accept the null. This analysis provides further evidence that our results are robust to endogeneity with respect to the omitted variables.
With the ongoing increase in digitization, there may be a measurement error in measuring the Internet level using only the Internet penetration rate. Therefore, we use the Internet penetration rate, the number of cell phones per 100 people, the number of fixed phones per 100 people, and the telecommunication service revenue to calculate a comprehensive index of Internet development using principal component analysis. We use this comprehensive index to replace Internet penetration, and the regression results are shown in Table 6. Columns (1) and (2) of Table 6 show that the quadratic term of the Internet composite index (netpca2) is positively related to manufacturing agglomeration, indicating that there is a U-shaped relationship between them. Hence, the results suggest that the measurement error does not significantly affect the conclusions of this paper.
The non-linear regression of the first-stage estimation in column (1) of Table 7 shows that the coefficients of all five parameters are significant with a goodness of fit of 0.708, indicating that the logistic curve can well describe the diffusion of the Internet. The second-stage regression results in columns (2) and (3) of Table 7 show that the primary term of the Internet is significantly negative at the 1% significance level, and the quadratic term of the Internet is significantly positive at the 1% significance level, confirming the conclusion that there is a U-shaped relationship between the Internet and manufacturing agglomeration.
Although the correlation of instrumental variables with endogenous variables has been ensured, we have not yet identified the exogeneity of instrumental variables. This implies that further investigation is needed to determine whether the instrumental variables are plausible. Angrist and Pischke (2009) [56] suggest that if instrumental variables satisfy the exogeneity requirement, they primarily affect the explained variables through endogenous factors. In order to assess the exogeneity of the instrumental variables, we follow the approach suggested by Lu et al. (2021) [57]. We include the instrumental variables in Equation (22). After controlling for the impact of the Internet on manufacturing agglomeration, if the effects of the two instrumental variables, namely fiber optic capacity in 2000 and the number of telephones in 2000, on manufacturing agglomeration are insignificant, it means that these instrumental variables satisfy the exogeneity requirement. To match the panel data sample, we construct the instrumental variables and time trend interaction terms, which are added to Equation (22). As shown in columns (1) and (2) of Table 8, the coefficients of the interaction terms ( f c 2000 × y e a r , t e l e p h o n e 2000 × y e a r ) are insignificant, indicating that the instrument variables satisfy the exogeneity requirement.

4.3. The Role of Human Capital

The impact of the Internet on manufacturing agglomeration may vary with the stock of human capital, so we re-estimate it by adding the interaction term between human capital and the Internet based on Equation (23). Columns (1) and (2) of Table 9 show that the interaction term between human capital and the quadratic term of the Internet is significantly positive at the 1% level (0.2, p = 0.00; 0.06, p = 0.00). Combining this result with Figure 3, which visually illustrates the marginal effects of the quadratic term of the Internet on manufacturing agglomeration under different levels of human capital, we can see that as human capital increases, the marginal effect of the quadratic term of the Internet on manufacturing agglomeration increases.
Considering the U-shaped relationship between the Internet and manufacturing agglomeration, the effect of human capital on this relationship can be described as follows: as the level of human capital increases, the increasing positive marginal effects of the Internet on manufacturing agglomeration will be amplified by human capital. This implies that human capital amplifies the network effects of the Internet, which supports Hypothesis 2. This is mainly attributed to the complementarity between human capital and the Internet.

4.4. Mediation Effects of Market Potential

The Internet can reduce transaction costs and transport costs and increase the variety of goods for manufacturing firms, thus affecting the potential market. The results are shown in Table 10. Column (1) shows that the effect of the Internet (BP) on the potential market is significantly positive at the 1% confidence level, implying that the Internet significantly amplifies market potential. Column (2) shows that the coefficient of the quadratic term of the Internet (BP2) is 0.838 without controlling for market potential, which is significantly positive at the 1% significance level. Column (3) shows that the coefficient of MP is significantly positive at the 1% significance level, which indicates that the market potential has a significant positive effect on manufacturing agglomeration. Similarly, Column (5) shows that the coefficient of MP is significantly positive at the 1% significance level, which proves that the market potential promotes manufacturing agglomeration. Therefore, the results indicate that the Internet affects manufacturing agglomeration through market potential, which verifies Hypothesis 3.
Furthermore, we replace B P and B P 2 with B P ^ and B P 2 ^ in the mediating-effect models to run the regression, which can reduce the estimation bias by avoiding the reverse causal effect of market potential on the Internet. As shown in column (1) of Table 11, the coefficient of B P ^ is significantly positive at the 1% level, indicating that the Internet has a positive effect on market potential, similar to the results in column (1) of Table 10. The results in columns (3) and (5) show that the coefficient of the MP is significantly positive at the 1% significance level, which means that the market potential promotes manufacturing agglomeration. Thus, this again confirms that the Internet affects manufacturing agglomeration through the market potential channel.

5. Conclusions and Policy Implications

Using panel data of Chinese prefecture-level cities from 2003 to 2019, we explore the impact of the Internet on manufacturing agglomeration. This paper finds that the Internet first leads to manufacturing fragmentation and then promotes manufacturing agglomeration. On this basis, we further explore the mechanism of the Internet’s impact on manufacturing agglomeration. We find that the Internet influences manufacturing agglomeration through the market potential channel. Moreover, there exists a complementary role of human capital with the Internet, which reinforces the U-shaped influence of the Internet on manufacturing agglomeration.
On average, the Internet is closely linked to manufacturing agglomeration. Wang et al. (2022) [10] examine the impact of the Internet on agglomeration using panel data of 139 countries. The findings show that the Internet first leads to fragmentation and then promotes agglomeration, revealing a U-shaped relationship between the Internet and agglomeration. Although this paper samples panel data of 281 prefecture-level cities in China, our findings confirm those of Wang et al. (2022) [10]. This non-linear effect of the Internet on spatial structure may hold for both developing and developed countries.
Based on data samples from before 2010, Hong and Fu (2011) [13] and Zhang et al. (2022) [6] suggest that the Internet has contributed to the decentralization of manufacturing. However, since 2010, the Internet in China has experienced rapid development. The average download rate of broadband networks has increased by nearly 40 times, and the scale of 4G base stations has accounted for more than half of the global total [58]. Consequently, the low level of the Internet before 2010 led to manufacturing fragmentation. This finding supports our conclusion that the Internet contributes to manufacturing fragmentation when it is at a low level. In addition, when the level of the Internet exceeds a certain level, the network effect of the Internet strengthens its centripetal force on agglomeration, which leads to an incremental marginal effect on manufacturing agglomeration. Related literature confirms the network effect of the Internet from the perspective of productivity [16]. This paper confirms the network effect from the perspective of agglomeration, adding new evidence for the network effect of the Internet.
The mechanism analysis finds that human capital strengthens the centripetal force of the Internet on agglomeration. Many studies suggest that the complementarity between the Internet and human capital promotes firm entry and new construction [21]. The findings of this paper provide new macro evidence on the complementarity between human capital and the Internet. We also find that the Internet promotes agglomeration through market potential, which is consistent with findings in the related literature [44].
Obviously, the Internet does not linearly link to the spatial structure of cities. China, one of the developing countries with the fastest Internet development in the world, is a good reference for the impact of the Internet on manufacturing agglomeration. First, developing countries should pay attention to the impact of the Internet on the spatial layout of cities when planning or laying out industries. Particularly in the context of the prevailing global regional imbalance in the world, the Internet may decentralize the crowded big cities temporarily in the short term, but the sustained development of the Internet may make the factors flow back to the big cities, strengthening the agglomeration of big cities again. Second, the moderating role of human capital also gives a lot of inspiration. Human capital will reinforce the role of the Internet in promoting agglomeration. Big cities tend to have a higher stock of human capital, so the inter-city imbalance may be further amplified by the Internet and human capital differences. Although the expansion in big cities follows the economic laws and allows factors to be utilized more efficiently, the gap between big and small cities can exacerbate inequality and cause various economic and social problems. Therefore, the use of the Internet to regulate the size difference between big and small cities should be considered in future policy making.
This study strides in the direction of a more robust research agenda, but much work remains to be done. First, the subsequent research can subdivide the manufacturing industry and study the heterogeneity of the Internet on the spatial distribution of industries with different characteristics, so as to understand the impact of the Internet on the spatial layout of manufacturing industries in a more in-depth manner. Second, this paper only performed a preliminary investigation into the mechanism of the Internet affecting manufacturing agglomeration, and the following research can be based on a new economic geography model for more expansion. Third, with the rapid development of intelligent manufacturing, the study of the impact of intelligent manufacturing on the spatial layout of manufacturing is a problem worthy of attention.

Author Contributions

Conceptualization, Y.S.; Methodology, Y.S.; Software, S.M. and H.F.; Validation, H.F.; Formal analysis, Y.S.; Investigation, S.M.; Resources, S.M.; Data curation, S.M.; Writing—original draft, S.M.; Writing—review & editing, S.M. and H.F.; Visualization, H.F. All authors have read and agreed to the published version of the manuscript.

Funding

This research was funded by National Social Science Foundation of China (No. 20BJY012).

Institutional Review Board Statement

Not applicable.

Informed Consent Statement

Not applicable.

Data Availability Statement

The sample data are mianly sourced from the corresponding years of the SYCC. All data can be obtained by email from the corresponding author.

Conflicts of Interest

The authors declare no conflict of interest.

References

  1. Wu, S.; Sun, B.; Zhang, T. The dynamic impact of the Internet on intra-urban employment distribution in Chinese cities. Acta Geogr. Sin. 2022, 77, 1446–1460. [Google Scholar]
  2. Cairncross, F. The death of distance. Economist 1995, 336, S5. [Google Scholar]
  3. Drucker, P. From capitalism to knowledge society. Knowl. Econ. 1998, 15–34. [Google Scholar]
  4. Gottmann, J.; O’Brien, R. Global Financial Integration: The End of Geography. Royal Geogr. Soc. 1993, 159, 101. [Google Scholar] [CrossRef]
  5. Tranos, E.; Ioannides, Y.M. ICT and cities revisited. Telemat. Inf. Inform. 2020, 55, 101439. [Google Scholar] [CrossRef]
  6. Zhang, T.; Sun, B.; Li, W.; Zhou, H. Information communication technology and manufacturing decentralisation in China. Pap. Reg. Sci. 2022, 101, 619–637. [Google Scholar] [CrossRef]
  7. Ioannides, Y.M.; Overman, H.G.; Rossi-Hansberg, E.; Schmidheiny, K. The effect of information and communication technologies on urban structure. Econ. Policy 2008, 23, 201–242. [Google Scholar] [CrossRef]
  8. Audirac, I. Information Technology and Urban Form: Challenges to Smart Growth. Int. Reg. Sci. Rev. 2005, 28, 119–145. [Google Scholar] [CrossRef]
  9. Qi, J.; Zheng, X.; Cao, P.; Zhu, L. The effect of e-commerce agribusiness clusters on farmers’ migration decisions in China. Agribusiness 2019, 35, 20–35. [Google Scholar] [CrossRef]
  10. Wang, Y.; Yu, Z.; Sun, B. Equalization or polarization? The effect of the Internet on National Urban Hierarchies across the world, 2000–2018. Cities 2022, 131, 103989. [Google Scholar] [CrossRef]
  11. Kotkin, J. The New Geography: How the Digital Revolution Is Reshaping the American Landscape; Random House Publishing Group: Westminster, UK, 2002. [Google Scholar]
  12. Langley, D.J.; van Doorn, J.; Ng, I.C.L.; Stieglitz, S.; Lazovik, A.; Boonstra, A. The Internet of Everything: Smart things and their impact on business models. J. Bus. Res. 2021, 122, 853–863. [Google Scholar] [CrossRef]
  13. Hong, J.; Fu, S. Information and Communication Technologies and the Geographical Concentration of Manufacturing Industries: Evidence from China. Urban Stud. 2011, 48, 2339–2354. [Google Scholar] [CrossRef]
  14. Wu, S.; Wang, P.; Sun, B. Can the Internet narrow regional economic disparities? Reg. Stud. 2022, 56, 324–337. [Google Scholar] [CrossRef]
  15. Katz, M.L.; Shapiro, C. Network Externalities, Competition, and Compatibility. Am. Econ. Rev. 1985, 75, 424–440. [Google Scholar]
  16. Cariolle, J.; le Goff, M. Spatial Internet Spillovers in Manufacturing. J. Dev. Stud. 2023, 59, 1163–1186. [Google Scholar] [CrossRef]
  17. Haefner, L.; Sternberg, R. Spatial implications of digitization: State of the field and research agenda. Geogr. Compass 2020, 14, e12544. [Google Scholar] [CrossRef]
  18. Yousefi, Z.; Dadashpoor, H. How Do ICTs Affect Urban Spatial Structure? A Systematic Literature Review. J. Urban. Technol. 2020, 27, 47–65. [Google Scholar] [CrossRef]
  19. Qiu, L.J.; Zhong, S.B.; Sun, B.W. Blessing or curse? The effect of broadband Internet on China’s inter-city income inequality. Econ. Anal. Policy 2021, 72, 626–650. [Google Scholar] [CrossRef]
  20. Wang, Y.; Sun, B.; Wu, S.; Li, W.; Zhang, T. Can the internet reshape the national city size distribution? Cross-country evidence. Pap. Reg. Sci. 2021, 100, 1254. [Google Scholar] [CrossRef]
  21. Chen, Y.; Ma, L.; Orazem, P.F. The heterogeneous role of broadband access on establishment entry and exit by sector and urban and rural markets. Telecommun. Policy 2023, 47, 102504. [Google Scholar] [CrossRef]
  22. Wang, Q.; Xu, W.J.; Huang, Y.H.; Yang, J.D. The Effect of Fast Internet on Employment: Evidence from a Large Broadband Expansion Program in China. China World Econ. 2022, 30, 100–134. [Google Scholar] [CrossRef]
  23. Leamer, E.E.; Storper, M. The Economic Geography of the Internet Age. J. Int. Bus. Stud. 2001, 32, 641–665. [Google Scholar] [CrossRef]
  24. Glaeser, E.L. Urbanization and its Discontents. In National Bureau of Economic Research Working Paper Series; National Bureau of Economic: Cambridge, MA, USA, 2020; No. 26839. [Google Scholar]
  25. Horvath, D.; Szabo, R.Z. Driving forces and barriers of Industry 4.0: Do multinational and small and medium-sized companies have equal opportunities? Technol. Forecast. Soc. Chang. 2019, 146, 119–132. [Google Scholar] [CrossRef]
  26. Wang, Y.; Wei, Y.D.; Sun, B. New economy and national city size distribution. Habitat. Int. 2022, 127, 102632. [Google Scholar] [CrossRef]
  27. Wang, M.; Zhang, M.; Chen, H.; Yu, D. How Does Digital Economy Promote the Geographical Agglomeration of Manufacturing Industry? Sustainability 2023, 15, 1727. [Google Scholar] [CrossRef]
  28. An, T.; Yang, C. How the Internet Is Reshaping China’s Economic Geography: Micro Mechanism and Macro Effects. Econ. Res. J. 2020, 55, 4–19. [Google Scholar]
  29. McCoy, D.; Lyons, S.; Morgenroth, E.; Palcic, D.; Allen, L. The impact of broadband and other infrastructure on the location of new business establishments. J. Reg. Sci. 2018, 58, 509–534. [Google Scholar] [CrossRef]
  30. Krugman, P. Increasing Returns and Economic Geography. J. Political Econ. 1991, 99, 483–499. [Google Scholar] [CrossRef]
  31. Forslid, R.; Ottaviano, G. An analytically solvable core-periphery model. J. Econ. Geogr. 2003, 3, 229–240. [Google Scholar] [CrossRef]
  32. Antonio Ricci, L. Economic geography and comparative advantage: Agglomeration versus specialization. Eur. Econ. Rev. 1999, 43, 357–377. [Google Scholar] [CrossRef]
  33. Khalifa, A.B. Inter- and Intra-firm Diffusion of Technology: The Example of Software, Hardware, and Network Communications Empirical Evidence for Tunisian Manufacturing Firms. J. Knowl. Econ. 2022, 13, 236–263. [Google Scholar] [CrossRef]
  34. Galliano, D.; Roux, P. Organisational motives and spatial effects in Internet adoption and intensity of use: Evidence from French industrial firms. Ann. Reg. Sci. 2008, 42, 425–448. [Google Scholar] [CrossRef]
  35. Li, D.K.; Chen, Y.F.; Miao, J.F. Does ICT create a new driving force for manufacturing?—Evidence from Chinese manufacturing firms. Telecommun. Policy 2022, 46, 102229. [Google Scholar] [CrossRef]
  36. Cambini, C.; Sabatino, L. Digital highways and firm turnover. J. Econ. Manag. Strat. 2023. [Google Scholar] [CrossRef]
  37. Hanson, G.H. Market potential, increasing returns and geographic concentration. J. Int. Econ. 2005, 67, 1–24. [Google Scholar] [CrossRef]
  38. Helpman, E. The Size of Regions. In IDEAS Working Paper Series from RePEc; Federal Reserve Bank of St. Louis: St. Louis, MO, USA, 1995. [Google Scholar]
  39. Pi, Y.; Li, C. Local Infrastructure, Interregional Infrastructure and Urban Size Distribution Structure. World Econ. Paper 2021, 87–102. [Google Scholar]
  40. Rokicki, B.; Cieslik, A. Rethinking regional wage determinants: Regional market potential versus trade partners’ potential. Spat. Econ. Anal. 2023, 18, 126–142. [Google Scholar] [CrossRef]
  41. Cristobal Campoamor, A.; Rodriguez-Crespo, E. Rekindling New Economic Geography in Times of COVID-19: Labor Mobility Responses to Health Shocks in Central and North America. Int. Reg. Sci. Rev. 2022, 46, 523–551. [Google Scholar] [CrossRef]
  42. Fan, J.; Tang, L.; Zhu, W.; Zou, B. The Alibaba effect: Spatial consumption inequality and the welfare gains from e-commerce. J. Int. Econ. 2018, 114, 203–220. [Google Scholar] [CrossRef]
  43. Zhang, N.; Yu, K.; Chen, Z. How does urbanization affect carbon dioxide emissions? A cross-country panel data analysis. Energ. Policy 2017, 107, 678–687. [Google Scholar] [CrossRef]
  44. Ma, Y.; Yao, C. Openness and government size: Revisiting the relationship using a large cross-country panel. Int. Rev. Econ. Financ. 2022, 79, 448–465. [Google Scholar] [CrossRef]
  45. Wheaton, W.C.; Lewis, M.J. Urban wages and labor market agglomeration. J. Urban. Econ. 2002, 51, 542–562. [Google Scholar] [CrossRef]
  46. Elche, D.; Consoli, D.; Sánchez-Barrioluengo, M. From brawn to brains: Manufacturing-KIBS interdependency. Reg. Stud. 2021, 55, 1282–1298. [Google Scholar] [CrossRef]
  47. Di Giacinto, V.; Micucci, G.; Tosoni, A. The agglomeration of knowledge-intensive business services firms. Ann. Reg. Sci. 2020, 65, 557–590. [Google Scholar] [CrossRef]
  48. Zhu, Y.; Li, Y.; Wang, Y.; Li, L. The Impact of Water and Soil Scarcity and Pollution on Industrial Agglomeration: Evidence from China. Sustainability 2021, 13, 5428. [Google Scholar] [CrossRef]
  49. Han, Z.; Yu, C.; Li, Y.; Shi, J.; Liu, Y. Customer concentration and supplier financial performance: An inverted U-shaped relationship. Ind. Mark. Manag. 2023, 113, 138–152. [Google Scholar] [CrossRef]
  50. Meng, F.; Liu, Y.; Zhang, X.; Liu, L. General knowledge-sharing and patient engagement in online health communities: An inverted U-shaped relationship. J. Knowl. Manag. 2023. [Google Scholar] [CrossRef]
  51. Czernich, N.; Falck, O.; Kretschmer, T.; Woessmann, L. Broadband Infrastructure and Economic Growth. Econ. J. 2011, 121, 505–532. [Google Scholar] [CrossRef]
  52. Comín, D.; Hobijn, B.; Rovito, E. Five Facts You Need to Know About Technology Diffusion. In National Bureau of Economic Research Working Paper Series; National Bureau of Economic: Cambridge, MA, USA, 2006; No. 11928. [Google Scholar]
  53. Lind, J.T.; Mehlum, H. With or Without U? The Appropriate Test for a U-Shaped Relationship. Oxf. B Econ. Stat. 2010, 72, 109–118. [Google Scholar] [CrossRef]
  54. Altonji, J.G.; Elder, T.E.; Taber, C.R. Selection on observed and unobserved variables: Assessing the effectiveness of Catholic schools. J. Political Econ. 2005, 113, 151–184. [Google Scholar] [CrossRef]
  55. Oster, E. Unobservable Selection and Coefficient Stability: Theory and Evidence. J. Bus. Econ. Stat. 2019, 37, 187–204. [Google Scholar] [CrossRef]
  56. Angrist, J.; Pischke, J. Mostly Harmless Econometrics: An Empiricist’s Companion; Princeton University Press: Princeton, NJ, USA, 2009. [Google Scholar]
  57. Lu, R.; Song, Q.; Xia, T.; Lv, D.; Reve, T.; Jian, Z. Unpacking the U-shaped relationship between related variety and firm sales: Evidence from Japan. Pap. Reg. Sci. 2021, 100, 1136. [Google Scholar] [CrossRef]
  58. Li, Y.; Zhang, J.; Lyu, Y. Does telecommunications infrastructure promote entrepreneurship in developing countries? Evidence from a quasi-natural experiment in China. Struct. Change Econ. D 2023, 66, 106–119. [Google Scholar] [CrossRef]
Figure 1. U-shaped relationship between Internet and real wages.
Sustainability 15 12820 g001
Figure 2. U-shape of Internet penetration and manufacturing agglomeration.
Sustainability 15 12820 g002
Figure 3. Marginal effects of quadratic term of Internet on manufacturing agglomeration under different levels of human capital. Note: This figure is derived from the estimation in columns (1) and (2) of Table 9, which corresponds to the marginal effects of quadratic term of Internet on manufacturing agglomeration under different levels of human capital, with other variables at means.
Sustainability 15 12820 g003
Table 1. Variables description.
Variable DefinitionData Source
agg1Manufacturing employment/Local employmentChina City Statistical Yearbook (CCSY)
agg2Share of manufacturing employment/Share of national manufacturing employmentCCSY
BPNumber of broadband households/Resident population × 100CCSY
HCNumber of university students/Average annual population × 100CCSY
MPThe weighted average of regional GDPCCSY, Google Map
strucTertiary industry share/Secondary industry shareCCSY
popResident populationCCSY
tprRoad area per capitaCCSY
fdiActual foreign investmentCCSY
govGovernment expenditure/GDPCCSY
ERPM2.5 densityAtmospheric Composition Analysis Group at Dalhousie University
Table 2. Descriptive statistics.
VariableObsMeanSDMinMax
agg147770.360.5730.001485.3
agg247770.860.4760.0213.06
BP47770.150.1530.005760.821
HC47775.214.0720.56426.6
MP47770.080.0500.005170.319
struc47770.010.0220.0002661.47
pop47770.040.0270.004740.156
tpr47770.850.6400.03924.22
fdi47770.000.0000.0003950.00137
gov47772.731.7020.97211.6
ER47773.670.4711.7714.71
Table 3. Baseline results.
FEGMM
(1)(2)(3)(4)
Variablesagg1agg2agg1agg2
BP−0.599 ***−0.672 ***−0.426 ***−0.362 ***
(0.123)(0.106)(0.013)(0.026)
BP20.838 ***0.638 ***0.530 ***0.432 ***
(0.135)(0.117)(0.017)(0.032)
HC0.015 ***−0.019 ***0.003 ***−0.003 ***
(0.004)(0.003)(0.000)(0.000)
gov−0.001−0.022 ***0.001 ***−0.010 ***
(0.004)(0.004)(0.000)(0.000)
pop1.275 **−0.474−3.946 ***−1.215 ***
(0.624)(0.540)(0.041)(0.147)
FDI−34.38037.9673.39955.173 ***
(36.545)(31.619)(4.944)(10.548)
struc−0.117−0.068−0.033−0.123
(0.144)(0.124)(0.045)(0.093)
ER−0.125 ***−0.122 ***−0.016 ***−0.005
(0.025)(0.021)(0.001)(0.003)
tpr0.325 ***0.034 **0.108 ***0.003
(0.019)(0.016)(0.002)(0.004)
Constant0.484 ***1.566 ***0.225 ***0.227 ***
(0.107)(0.093)(0.006)(0.017)
Observations4777477742154215
R-squared0.8810.871
City FEYESYESYESYES
Year FEYESYESYESYES
AR (1) p-value 0.00380.0000
AR (2) p-value 0.33120.5171
Sargan p-value 1.00001.0000
Notes: “agg1” in columns (1) and (3) denotes the dependent variable is scale agglomeration. “agg2” in columns (2) and (4) denotes the dependent variable is specialized agglomeration. *** and ** represent 1% and 5% significance levels, respectively. Robust standard errors in parentheses.
Table 4. Robustness of U-shape.
agg1agg2
Lower BoundUpper BoundLower BoundUpper Bound
Interval0.00580.82060.00580.8206
Slope−0.58980.7758−0.664880.37547
t-value−2.38812.7856−4.076992.054102
P > t0.00850.00270.00000.020012
Notes: “agg1” denotes the dependent variable is scale agglomeration. “agg2” denotes the dependent variable is specialized agglomeration.
Table 5. Omitting variable test.
VariablesCriteriaResultsValid
agg1abs(delta) > 1delta = 1.51YES
agg2abs(delta) > 1delta = 1.14YES
Notes: “delta” denotes the value of δ statistic. “agg1” denotes the dependent variable is scale agglomeration. “agg2” denotes the dependent variable is specialized agglomeration.
Table 6. Robustness of measure error.
(1)(2)
Variablesagg1agg2
netpca20.002 *0.004 ***
(0.001)(0.001)
netpca−0.024 **−0.051 ***
(0.011)(0.009)
Constant0.395 ***1.374 ***
(0.102)(0.088)
Control VariablesYESYES
City FEYESYES
Year FEYESYES
Observations47774777
R-squared0.8800.871
Notes: “netpc2” denotes the Internet composite index. “netpca2” denotes the quadratic term of Internet composite index. ***, **, and * represent 1%, 5%, and 10% significance levels, respectively. Robust standard errors in parentheses.
Table 7. Results of 2SLS with IV.
(1)(2)(3)
VariablesBPagg1agg2
Second-stage estimation
B P ^ −0.600 ***-0.863 ***
(0.143)(0.128)
B P 2 ^ 0.896 ***0.411 ***
(0.0630)(0.0567)
First-stage estimation
β 0 7.364 **
(3.219)
f c 2000 0.215 ***
(0.0133)
t e l e p h o n e 2000 3.041 ***
(0.0535)
β 0.0919 ***
(0.00236)
τ 2016.73 ***
(16.232)
Constant 0.562 ***1.419 ***
(0.0980)(0.0882)
Control VariablesYESYESYES
City FEYESYESYES
Year FEYESYESYES
Observations477747774777
R-squared0.7080.8910.871
Notes: Results in column (1) are based on Equation (28). Results in columns (2) and (3) are based on Equation (29). “agg1” denotes the dependent variable is scale agglomeration. “agg2” denotes the dependent variable is specialized agglomeration. *** p < 0.01, ** p < 0.05. Robust standard errors in parentheses.
Table 8. Test of IV plausibility.
(1)(2)
Variablesagg1agg2
BP−0.607 ***−0.688 ***
(0.132)(0.113)
BP20.852 ***0.644 ***
(0.144)(0.124)
f c 2000 × y e a r −0.0370.050
(0.074)(0.064)
t e l e p h o n e 2000 × y e a r −0.0030.001
(0.021)(0.018)
Constant0.704 *1.450 ***
(0.369)(0.316)
Control VariablesYESYES
City FEYESYES
Year FEYESYES
Observations47774777
R-squared0.8790.872
Notes: “ f c 2000 × y e a r ” denotes the interaction term of fiber optic capacity in 2000 and time trend. “ t e l e p h o n e 2000 × y e a r ” denotes the interaction term of the number of telephones in 2000 and time trend. *** and * represent 1% and 10% significance levels, respectively. Robust standard errors in parentheses.
Table 9. The role of human capital.
(1)(2)
Variablesagg1agg2
BP0.262 *−0.240 *
(0.147)(0.127)
BP2−0.2430.246
(0.177)(0.153)
HC0.0360 ***−0.00370
(0.00505)(0.00435)
B P × H C −0.167 ***−0.0800 ***
(0.0176)(0.0152)
B P 2 × H C 0.201 ***0.0621 ***
(0.0234)(0.0202)
Constant0.184 *1.198 ***
(0.104)(0.0897)
Control VariablesYESYES
City FEYESYES
Year FEYESYES
Observations47774777
R-squared0.8860.878
Notes: “agg1” denotes the dependent variable is scale agglomeration. “agg2” denotes the dependent variable is specialized agglomeration. *** and * represent 1% and 10% significance levels, respectively. Robust standard errors in parentheses.
Table 10. Mediated effect of market potential.
(1)(2)(3)(4)(5)
VariablesMPagg1agg1agg2agg2
BP0.014 ***−0.599 ***−0.540 ***−0.672 ***−0.605 ***
(0.003)(0.123)(0.122)(0.106)(0.104)
BP2 0.838 ***0.729 ***0.638 ***0.514 ***
(0.135)(0.134)(0.117)(0.115)
MP 2.314 *** 2.649 ***
(0.224) (0.192)
Constant0.149 ***0.484 ***0.1171.566 ***1.145 ***
(0.007)(0.107)(0.112)(0.093)(0.096)
Control variablesYESYESYESYESYES
City FEYESYESYESYESYES
Year FEYESYESYESYESYES
Observations47774777477747774777
R-squared0.9330.8810.8840.8710.876
Notes: “agg1” denotes the dependent variable is scale agglomeration. “agg2” denotes the dependent variable is specialized agglomeration. *** represents 1% significance level. Robust standard errors in parentheses.
Table 11. Mediated effect using IV.
(1)(2)(3)(4)(5)
VariablesMPagg1agg1agg2agg2
B P ^ 0.055 ***−0.600 ***−0.724 ***−0.863 ***−1.033 ***
(0.005)(0.143)(0.142)(0.128)(0.126)
B P 2 ^ 0.896 ***0.903 ***0.411 ***0.421 ***
(0.063)(0.062)(0.057)(0.055)
MP 2.012 *** 2.774 ***
(0.217) (0.193)
Constant0.146 ***0.573 ***0.282 ***1.569 ***1.167 ***
(0.007)(0.102)(0.106)(0.092)(0.094)
Control variablesYESYESYESYESYES
City FEYESYESYESYESYES
Year FEYESYESYESYESYES
Observations47774777477747774777
R-squared0.9340.8910.8940.8720.877
Notes: “agg1” denotes the dependent variable is scale agglomeration. “agg2” denotes the dependent variable is specialized agglomeration. *** represents 1% significance level. Robust standard errors in parentheses.
Disclaimer/Publisher’s Note: The statements, opinions and data contained in all publications are solely those of the individual author(s) and contributor(s) and not of MDPI and/or the editor(s). MDPI and/or the editor(s) disclaim responsibility for any injury to people or property resulting from any ideas, methods, instructions or products referred to in the content.

