Abstract
In the context of China’s commitment to the “double carbon” goal, promoting agricultural carbon emission reduction is currently an important research topic. Assessing the carbon sequestration level of crops has a positive impact on enhancing agricultural carbon sinks and reducing carbon emissions. The carbon budget for agricultural planting on the arid oasis of Jinchang, northwest China, is quantitatively calculated from 2018 to 2020. The average value of total carbon absorption by crops in Jinchang was greater than the average value of total carbon emissions in the past three years. In 2020, the total carbon absorption was the highest (1,744,725 t CO2-eq), and the carbon emission was 102,641 t CO2-eq. The crops had a strong carbon absorption function. Among the investigated crops, the largest average annual carbon sequestration was found in corn, which accounted for 45% of the total carbon sequestration in the city. Among the carbon emission pathways, chemical fertilizer and agricultural film were the main carbon sources, accounting for more than 40% of total carbon emissions. The carbon budget analysis in the region clearly showed that the structure of agricultural cropping and the planting area proportion of crops significantly affected the carbon balance of the whole agricultural region and that increasing the proportion of the area planted with corn was beneficial in enhancing regional carbon sequestration.
1. Introduction
Since the Industrial Revolution, the rapid and continuous growth of greenhouse gas (GHG) emissions, such as CO2, CH4, N2O, and other GHGs caused by human production activities, has had serious negative impacts on the global climate system and human life [1]. Seven consecutive years after the Paris Agreement in 2015, the level of carbon emissions continued to increase, and degradation timelines for the 1.5 °C and 2 °C environmental achievements have become ever more rigorous [2]. Considering the increase in extreme events around the world, such as floods, glacier melting, droughts, rising sea levels, fires, and increased temperature levels, there is not much time to mitigate these negative impacts, and emergency action has become a major challenge for humanity in the 21st century [3]. Therefore, controlling and reducing GHG emissions and protecting environmental quality must be taken seriously to realize the sustainable development of human society.
About 9 gigatons (Gt) of carbon are released annually into the atmosphere via human activities [4]. Atmospheric GHG emissions, which have increased at a rate of more than 2.8 Pg C a−1, have reached unprecedented levels (400 ppm) [5,6]. Total GHG emissions are expected to rise by about 50% between 2000 and 2030, with further impacts on the weather and climate [7,8]. Agricultural carbon emissions account for 10–22% of total global emissions [9]. China is the biggest emitter of GHGs in the world, with carbon dioxide emissions of 31.18% in 2019 [10]. China has the largest agricultural production in the world, and the contribution from agricultural carbon emissions cannot be ignored, accounting for 17% of China’s total emissions [11]. Although China is facing considerable challenges in reducing carbon emissions, the Chinese government still firmly announced that it would adopt more vigorous policies and measures, strive to peak CO2 emissions before 2030, and achieve carbon neutrality before 2060 to mitigate and adapt to climate change in September 2020 [12]. Therefore, reducing agricultural carbon emissions (ACE) will have more significant effects for China than for other countries and is of great significance for achieving China’s carbon-neutral goal.
Agriculture is both a source and a sink of GHGs [7,13,14,15,16]. The farmland ecosystem is the most active carbon pool, serving as a carbon source and sink and making significant contributions to the global carbon cycle [13,14]. Li et al. [13] systematically reviewed the methods suitable for estimating carbon flux in farmland ecosystems (such as the static chamber/gas chromatography method, emission factor method, and life-cycle method), mainstream carbon cycle measurement models, and the factors affecting farmland carbon sources and sinks, including the natural environment and human involvement, from research papers on the carbon sources and sinks of farmland ecosystems published in the past 30 years.
GHG emissions in agriculture are primarily from soil management (e.g., fertilization, irrigation, drainage, cultivation, and tillage), rice cultivation, enteric fermentation, and manure management [16,17,18]. In 2020, the U.S. Environmental Protection Agency (EPA) reported that agriculture sector emissions totaled 635.1 million metric tons (MMTCO2e) in 2020, equal to 11% of total U.S. GHG emissions, and 316.2 MMTCO2e of GHG emissions (50%) were from soil management, which is associated with agricultural practices that increase nitrogen availability, disturb soils, and increase oxidation (e.g., fertilization, irrigation, drainage, cultivation, tillage, shifts in land use, and deposition of livestock manure on soils) [16]. GHG emissions from agricultural production, often estimated by carbon emissions, account for 17% of the total emissions in China but only account for 7% in the U.S. and 11% globally [19,20]. Between 1997 and 2016, the amount of agricultural carbon emissions (AACEs) in China generally increased from 311.9183 million tons in 1997 to 373.9123 million tons in 2016, a growth of 19.8% with an average annual growth rate of 0.959%. The contribution of agricultural inputs to the AACEs gradually increased from 22% in 1997 to 28.38% in 2016, an increase of about 19%. This increase is related to the increasing dependence of agricultural output on agricultural input. The amount and intensity of carbon emissions varied greatly among provinces [19]. Hu et al. [20] reported agricultural GHG emissions in 2000–2020 in mainland China and showed that Hunan was the largest emitter among all provinces in most years, contributing approximately 7% (growing from 6.8% in 2000 to 7.5% in 2020) of the national total agricultural GHG emissions. Other principal regional emission sources included Henan, Sichuan, and Shandong, each accounting for 5–8% of the national total. They found agricultural GHG emissions to have an 8.8–22.0% coefficient of variation (CV) across provincial GHG emissions and a CV of 2.7% at the national level. A study of the spatial pattern of China’s agricultural carbon emission performance from 2009 to 2019 showed that it had increased 1.5%, following a spatial pattern of eastern (1.041) > western (1.020) > central (0.974) [11]. China’s vast territory and diverse climate have led to large differences in agricultural types and production methods among regions. Different agricultural practices can generate different levels of carbon emissions; thus, agricultural carbon emissions also show large regional differences [11,21,22]. Therefore, these studies fully demonstrate that analyzing agricultural carbon emissions at the provincial and smaller regional levels is necessary to formulate scientific carbon reduction strategies and reduce overall carbon emissions in China’s agriculture.
Carbon sequestration is considered a primary ecosystem service obtained from agroecosystems [23]. Agricultural sinks remove CO2 through photosynthesis and store carbon in plants and soil [16]. Therefore, carbon fluxes in agroecosystems involve carbon emissions and carbon sequestration [23]. The study of spatiotemporal changes in GHG emissions and soil organic carbon sequestration for major cropping systems across China and their drivers over 2001–2020 showed that N2O emissions were relatively high in southeastern China and relatively low in northwestern China. Spatially, southern China is a carbon source due to the large areas of paddy lands, whereas northern China is mainly a carbon sink, except for some agropastoral areas in the Inner Mongolian Plateau. The total N2O emissions, CH4 emissions, and soil organic carbon (SOC) sequestration were approximately 23.7, 182.0, and 177.6 Tg CO2-eq/year in croplands across China, and the national average net GHG emissions (NGEs) per unit area ranged from −8705 to 8431 kg CO2-eq ha−1 year−1 across the major cropping systems [24]. This indicates that the main crop planting systems in different regions of China are closely related to the net carbon emissions of their respective regions. Kuyah et al. [25] conducted a review to quantify the contribution of grain legumes and dryland cereals to carbon sequestration across the drylands of Africa and South Asia based on 437 publications and 1319 observations in studies conducted across 32 countries. Cropping systems with grain legumes showed the greatest increase in SOC concentrations, while cereals (and pigeon pea) gave the largest amount of aboveground carbon stock (>2 Mg C ha−1). The estimated carbon stock in the postharvest residues of these crops was 1.51 ± 0.05 Mg C ha−1 in Africa and 2.29 ± 0.10 Mg C ha−1 in South Asia. These crops produced more aboveground carbon, and significantly increased SOC when grown in an intercropping system [25]. Research progress on carbon sources and sinks in farmland ecosystems has shown that natural and human factors that affect carbon sources and sinks in farmland ecosystems have great heterogeneity and complexity due to differences in management practices and natural conditions, with the former being more important [13]. Hu et al. [6] conducted a systematic review of the research progress and prospects of ecosystem carbon sequestration under climate change (1992–2022) and found that agricultural research often focuses on the effects of farming tillage and organic matter addition on organic carbon sequestration in farmlands and assesses the use of remote sensing techniques and crop models. Their results showed that agriculture is often linked to “nitrogen” and “forest” and that research on crop carbon sequestration in farmland ecosystems is obviously insufficient. Minimizing carbon costs and maximizing ecosystem services through carbon sequestration of farm products are research gaps in the current scenario [23].
At present, the study of agricultural carbon emissions mainly focuses on large-scale regions, such as provinces in China. Due to the large differences in natural conditions, agricultural production conditions, and the types of crops planted in different regions of China, different regions of China are quite different, and their carbon emission characteristics in agricultural production systems are also significantly different [11,12,19,22,24,26]. Therefore, conducting carbon emission analysis on China’s provincial and sub-regional agricultural systems is conducive to formulating scientific agricultural carbon reduction policies and effective incentive mechanisms for agricultural carbon reduction and achieving China’s “double carbon” goal.
Jinchang (JC), a prefecture-level city in Gansu Province, is located in the middle of the Hexi Corridor. It is an important node city on the ancient Silk Road and one of the main cities in the Hexi Corridor. Since ancient times, natural conditions have been harsh. The average annual evaporation in the region is 18 times that of precipitation. It is also a region with a relatively fragile natural ecological environment in Western China [27]. Agriculture in this area plays an important role in ensuring the lives of local residents. Carbon emissions from agriculture in the oasis city have not yet been reported. The objective of this study is to analyze and estimate the carbon emissions, carbon sequestration, and carbon footprints of oasis agricultural production on a small regional scale to provide a scientific reference for the adjustment and formulation of local effective carbon mitigation policies for oasis agricultural production.
2. Materials and Methods
2.1. Study Area
JC (a county-level city) established in 1981 is located in the eastern section of the Hexi Corridor in Gansu Province, northwest China, between 101°04′35″–102°43′40″ E and 37°47′10″–39°00′30″ N. The city, with a total land area of 889,600 hm2 and an average altitude of 1800 m, contains a county (Yongchang County, 587,700 hm2) and a district (Jinchuan District, 301,900 hm2). Its total population was 438,000 at the end of 2020 [27]. This city is characterized by a temperate continental arid climate with sufficient sunshine, less precipitation, and dry and windy conditions. The annual average temperature in the urban area is 9.5 °C, and the relative humidity is 42%. The annual rainfall in the city was between 140 and 350 mm, and evaporation was 2381.8 mm. The water resources mainly come from the glaciers and snow on Qilian Mountain. The main crops planted in the city are corn, wheat, oil crops, and vegetables [27].
2.2. Data and Methods
2.2.1. Agricultural Carbon Emission Calculation
Data for the calculation of carbon emissions were derived from the Jinchang Statistical Yearbook in 2020, 2019, and 2018, which involves chemical fertilizers (net amount), agricultural plastic film, irrigation, tillage, the total power of agricultural machinery, the effective irrigation area, and the sowing area [27,28]. The carbon emissions (C-eq) from agricultural production were calculated using the following equation [29]:
where ET is the total carbon emissions from agricultural practices (t); Ef, Epf, Ei, Ept, and Em are the carbon emissions from the application of fertilizer, agricultural plastic film, irrigation, mobile operations (plowing, planting, and harvest), and machinery, respectively (t); AN, AP, AK, Acf, and Apf are the amounts of chemical fertilizers (nitrogen, phosphorus, potassium, and compound fertilizers) and agricultural plastic film, respectively (kg); FN, FP, FK, Fcf, and Fpf are the carbon emission factors of chemical fertilizers (nitrogen, phosphorus, potassium, and compound fertilizers) and agricultural plastic film, with values of 1.74, 0.2, 0.15, 0.38, and 5.18 kg·kg−1, respectively; Si and Ssa are the effective irrigation area and the area sown with crops (hm2); Fi, Fplow, Fplant, and Fharvest are the carbon emission factors of irrigation, plowing, planting, and harvest, with values of 25.00, 7.8, 6.79, and 16.47 kg/hm2, respectively; Wm is the total power of agricultural machinery (kW), and Fm is the carbon emission factor of agricultural machinery, with a value of 0.18 kg/kW [29].
ET = Ef + Epf + Ei + Ept + Em
= [(AN × FN + AP × FP + AK × FK + Acf × Fcf) + (Apf × Fpf)] × 0.001 + [(Si × Fi) + Ssa × (Fplow + Fplant + Fharvest) + (Wm × Fm)] × 0.001
= [(AN × FN + AP × FP + AK × FK + Acf × Fcf) + (Apf × Fpf)] × 0.001 + [(Si × Fi) + Ssa × (Fplow + Fplant + Fharvest) + (Wm × Fm)] × 0.001
2.2.2. Calculation of Carbon Sequestration
According to the main crops grown locally, given in the Statistical Yearbook of Jinchang, the carbon absorption (C-eq) by crop was calculated as follows [29]:
where Wcrop is the sum of carbon absorption from all crops (t); Wi is the carbon absorption by the i-type crops (t); Ci is the carbon conversion coefficient (%); Ki is the yield of the i-type crops (t); Hi is the economic coefficient of i-type crops; and Vi is the moisture coefficient of i-type crops. The carbon conversion coefficient, economic coefficient, and rate of water content of the different crops are listed in Table 1 [29,30].

Table 1.
Carbon conversion coefficients, rates of water content, and economic coefficients of different crops.
2.2.3. Calculation of Other Carbon Indicators
The other carbon indicators were calculated as follows:
where NEP is the carbon uptake per unit of sown area (t/hm2); CEF is the carbon footprint (hm2) [29]; and Is is the index of sustainability [31].
Net C change (t) = Wcrop − ET
NEP = Wcrop/Ssa
Carbon emission intensity = ET/Ssa
CEF = ET/NEP
Is = (ET − Wcrop)/Wcrop
3. Results and Discussion
3.1. Analysis of Agricultural Production Conditions
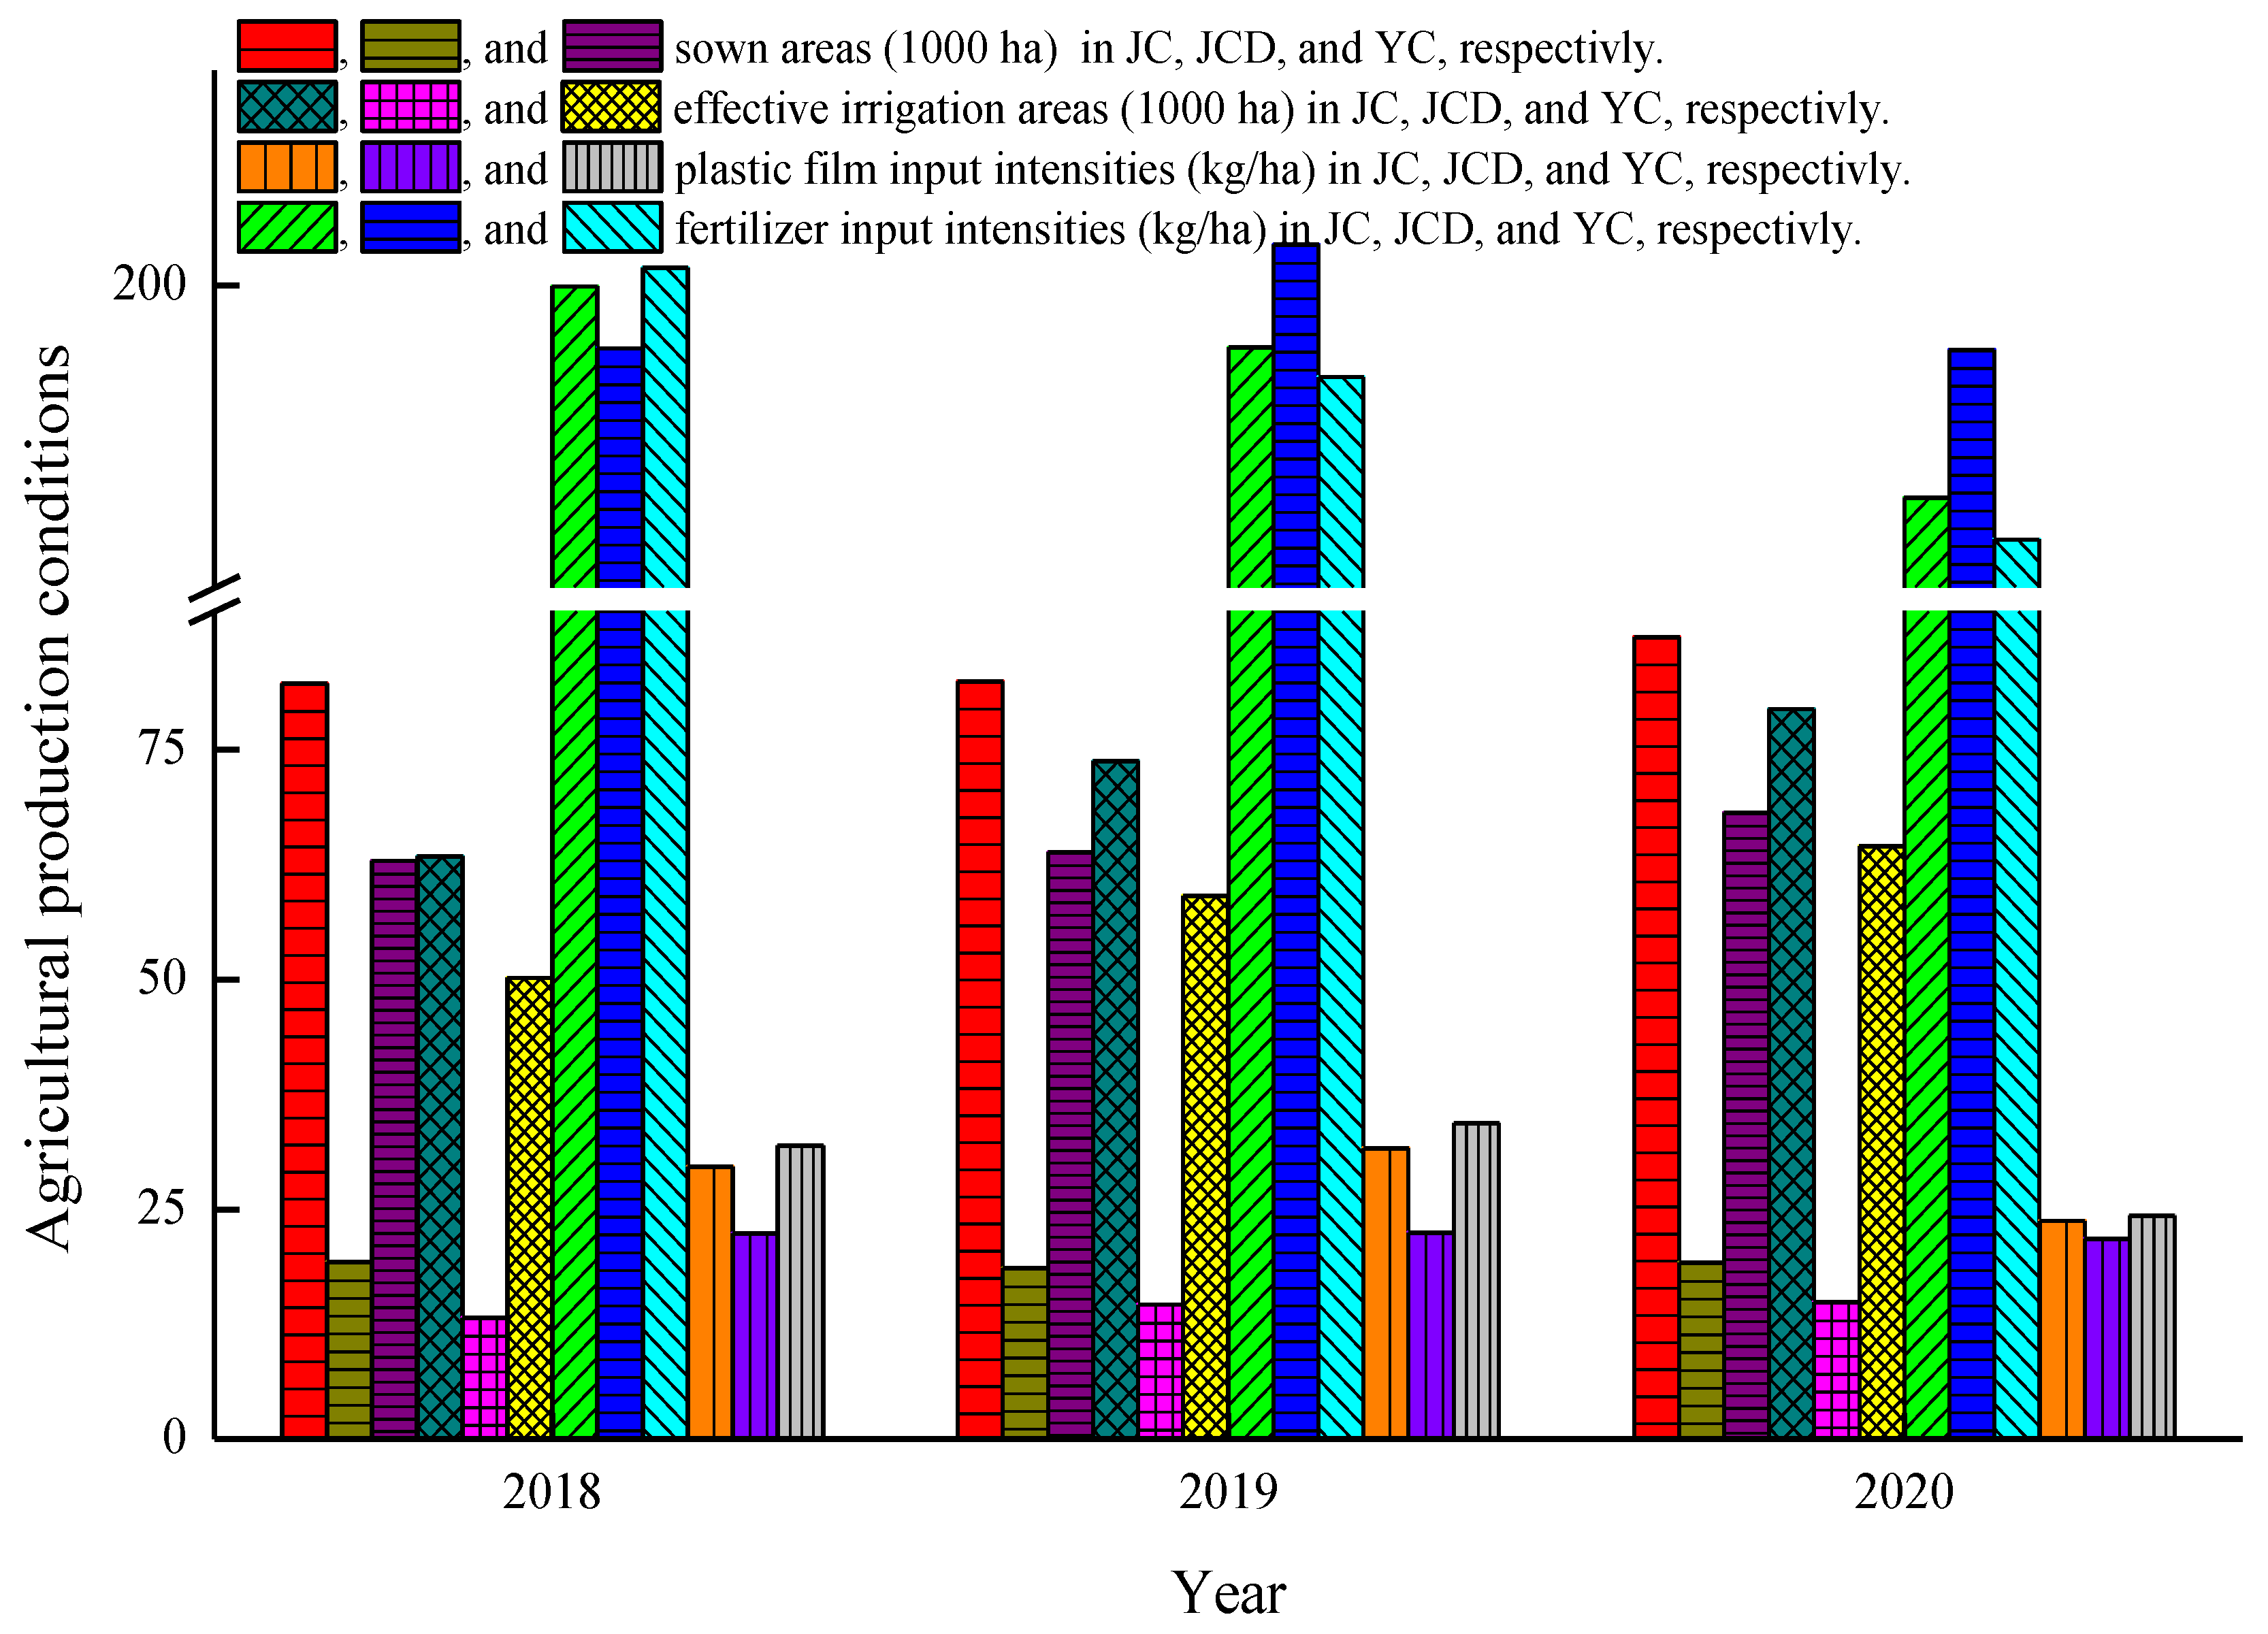
JC has a total sown area of 82,180 hm2 in 2018 and 87,210 hm2 in 2020, and the increase in the area was not very obvious. The sown area of crops in Yongchang County (YC) accounted for 76–80% in JC, which was more than three times that in Jinchuan District (JCD). The effective irrigation area of the whole region in JC was 79,380 hm2 in 2020. The percentage of effective irrigation areas in YC was up to 80% of the whole region. The effective irrigation area in YC increased by 29%, while the irrigation area in JCD increased by only 12% in 2020 compared with 2018 (Figure 1).

Figure 1.
Conditions of agricultural production in Jinchang (JC), Jinchuan District (JCD), and Yongchang County (YC) from 2018 to 2020.
The fertilizer input intensity (i.e., the ratio of fertilizer application total amount to the sown area) gradually decreased in 2018–2020, with an annual average value of 189.41 kg/hm2. Over the same period, the fertilizer input intensities in JCD and YC were 196.71 and 187.38 kg/hm2, respectively. The annual average values of agricultural plastic film input intensity (i.e., the ratio between the total amount of agricultural plastic film and the sown area) in JC, JCD, and YC were 28.34, 22.20, and 30.17 kg/hm2, respectively (Figure 1).
3.2. Variation in Carbon Emissions in Agricultural Production
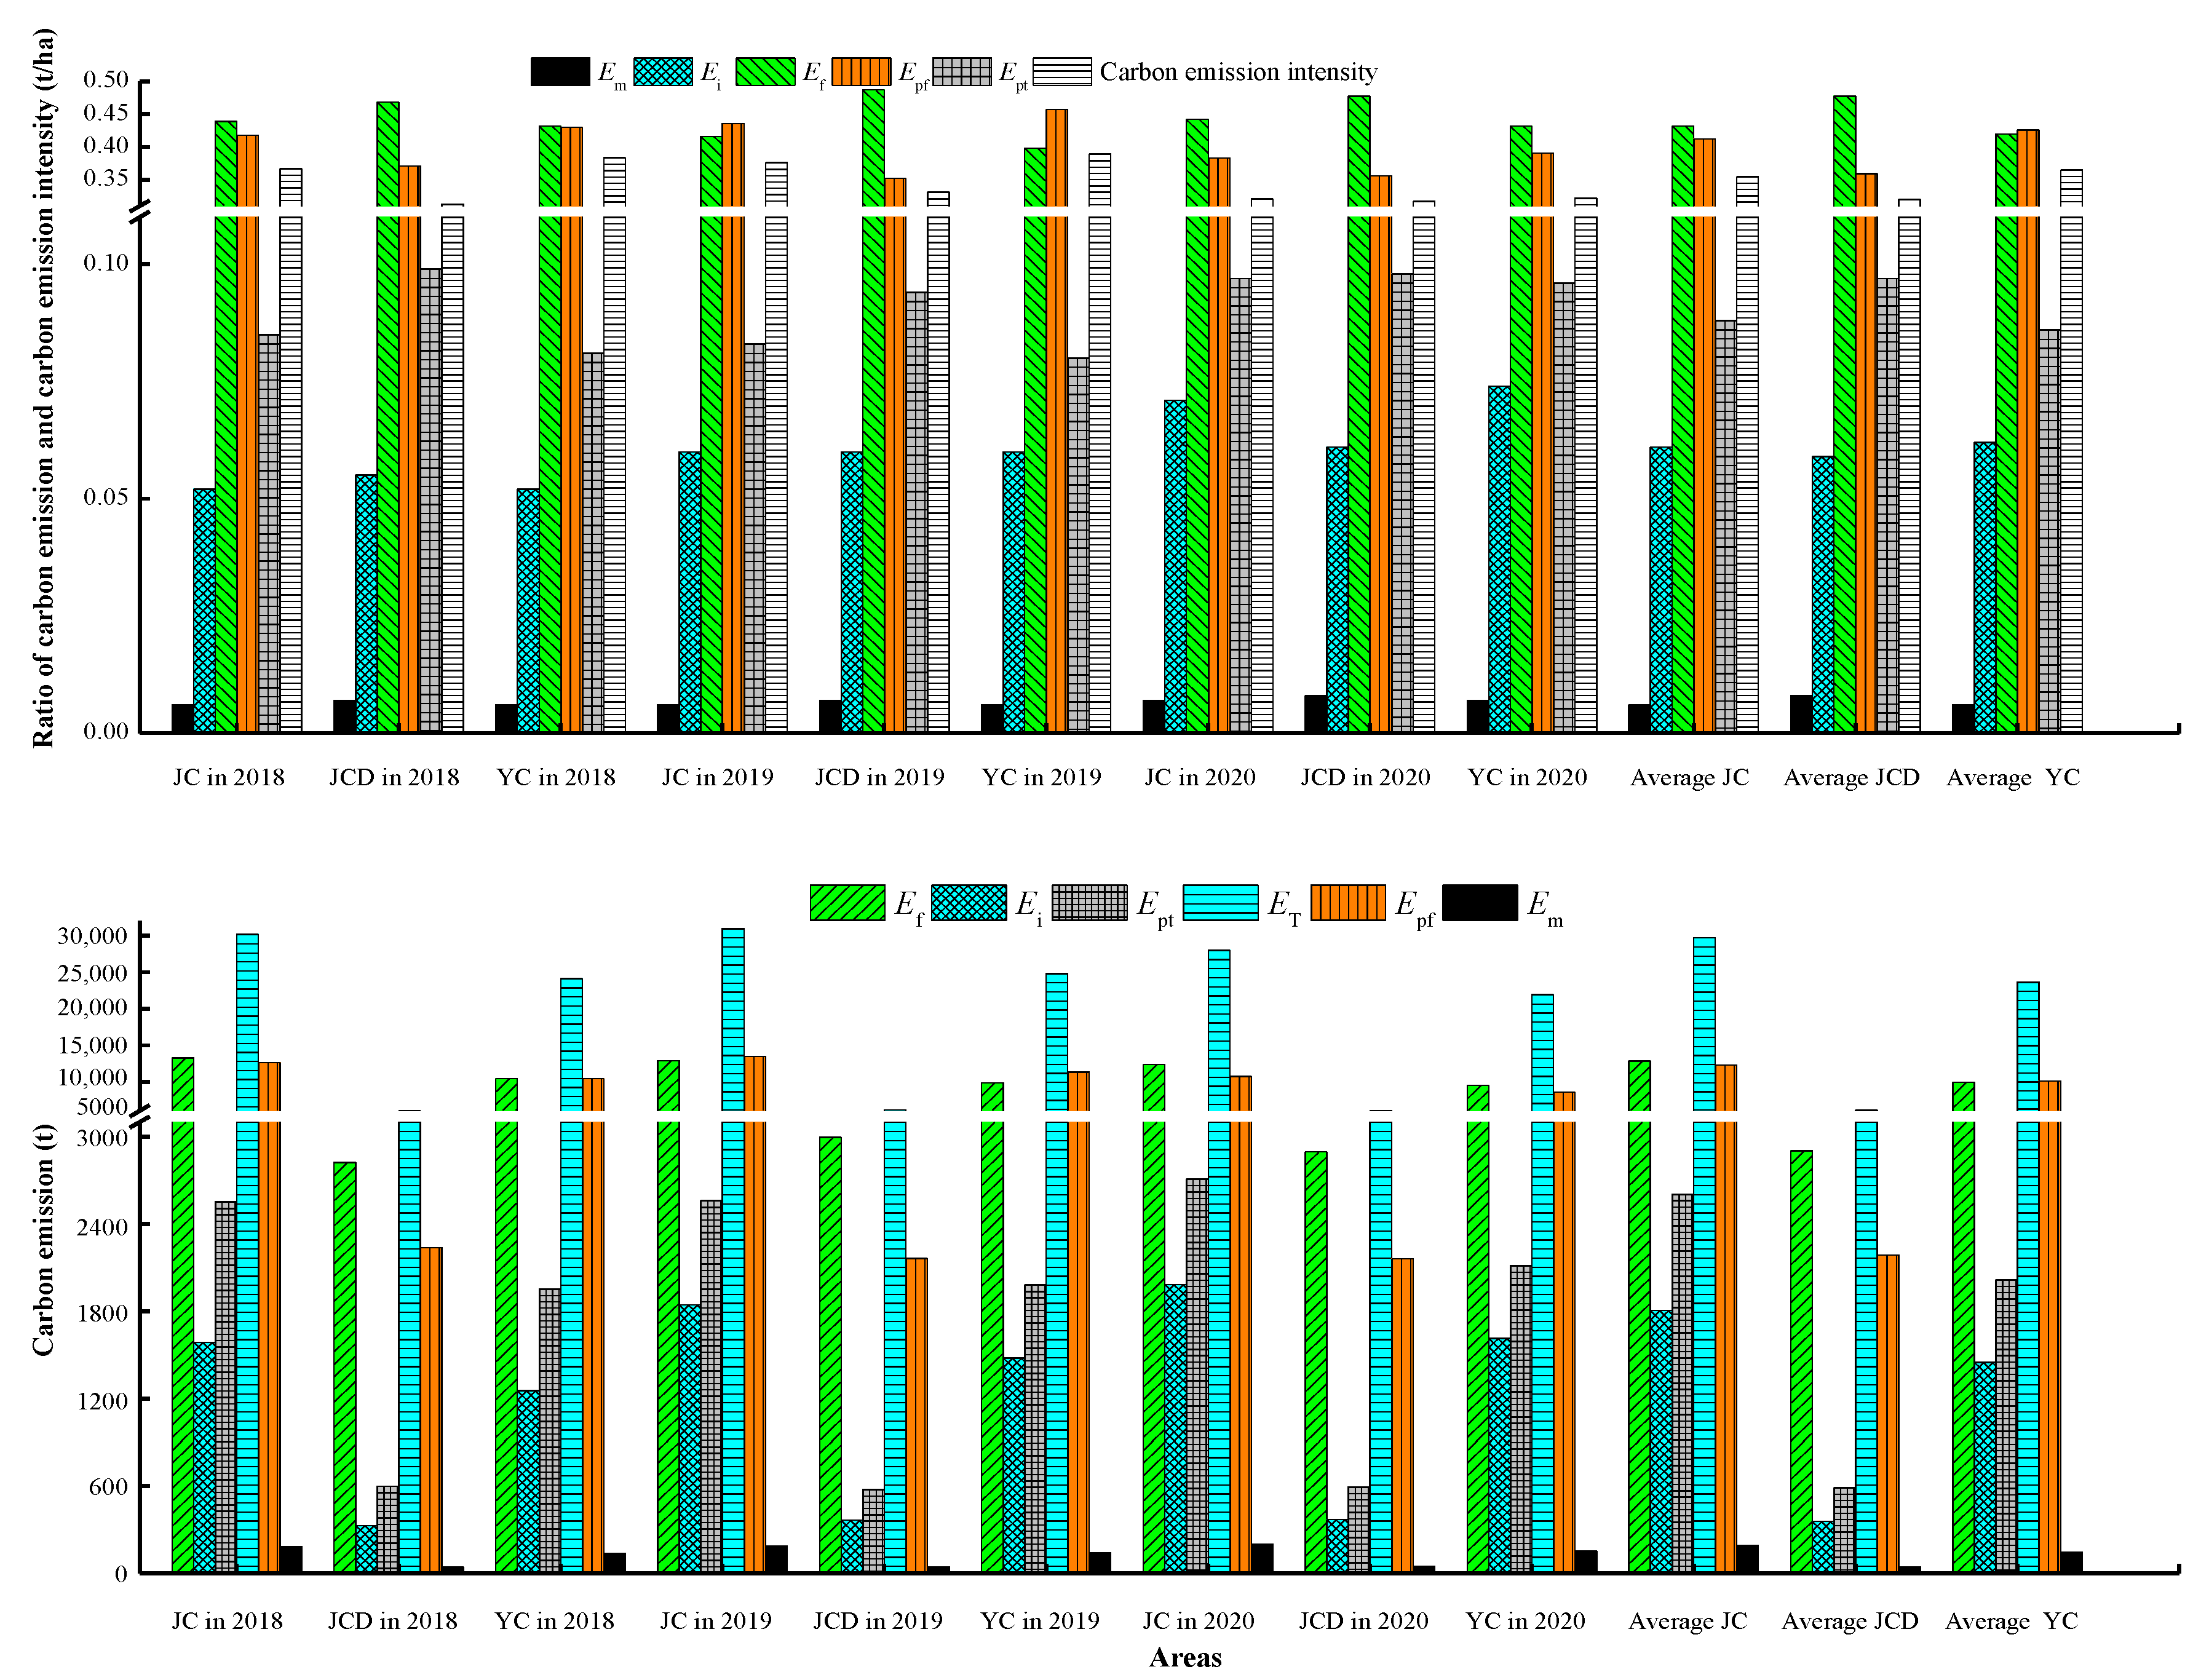
The total carbon emissions (ET) in the agricultural production of JC remained stable and decreased slightly in 2020. It peaked at 30,963.20 t in 2019 (Figure 2), with an annual average of 29,712.64 t. The annual averages for YC and JCD were 23,628.04 t and 6084.58 t, respectively. The carbon emissions from YC accounted for about 80% of the total carbon emissions from the whole region, and they were about 3.9 times higher than those from JCD. The annual average carbon emissions from YC had a direct relationship to its irrigation area of agricultural crops. The average irrigation area of the whole JC in three years was 72,160 hm2, while the average effective irrigation area in YC was 57,910 hectares and occupied 80% of the whole region.

Figure 2.
Carbon emission, ratio, and carbon emission intensity from different sources in Jinchang (JC), Jinchuan District (JCD), and Yongchang County (YC).
The change in carbon emission intensity was similar to the profile observed for total carbon emissions. In 2019, the maximum carbon emission intensity values were 0.376, 0.331, and 0.389 t/hm2, and the annual average carbon emission intensities were 0.355, 0.320, and 0.365 t/hm2 in JC, JCD, and YC, respectively. In 2020, the carbon emission intensities in the three areas were nearly the same.
Analysis of the proportions of various carbon emissions sources in total in JC showed that the proportions of carbon emissions from fertilizer and agricultural plastic film were almost equal and fluctuated between 35 and 50%. In the next three years, the proportions of Ept fluctuated between 8 and 10%. The ratios of irrigation carbon emissions (Ei) fluctuated between 5 and 7%. The proportion of Em fluctuated between 0.5 and 0.8%. The average proportions of fertilizer and agricultural plastic film were 48 and 36% in JCD and 42% and 43% in YC. There is no obvious difference in the order of carbon emission proportions in the above areas.
Li et al. [29] found that the carbon emissions in agriculture planting on the Qinghai–Tibet Plateau (QTP) of China were mainly from chemical fertilizers and agricultural plastic film, which accounted for 57% and 24% of total carbon emissions, and the sum of both was higher than 80%, which is similar to this study. However, carbon emissions per unit of cultivated area from chemical fertilizers ranged from 166.28 kg/hm2 in 1990 to 357.80 kg/hm2 in 2015, which was higher than that in JC. Chen et al. [32] carried out a survey on whether farmers’ agricultural production was a carbon source or carbon emission in the Shaanxi Province of China. Their results showed that chemical fertilizers were among the key carbon sources in raw material production systems. Tian et al. [26] reported that fertilizer application is one of the main contributors to the carbon footprint of the main grains in China, and the difference in GHG emissions in China was mainly caused by the difference in fertilizer application. The difference in fertilizer application per unit crop yield significantly impacts the GHG emissions of grain production in China, especially for maize. In other words, the difference in GHG emissions in China is mainly caused by differences in fertilizer application. The intensity of agricultural carbon emission sources in the provinces of western China was relatively higher than that in the provinces of central and eastern China [19].
In 1950, the global population was approximately 2.5 billion, and by mid-November 2022, this number had reached 8 billion. It is predicted that, in the next 30 years, the world population will increase from 8 billion at present to 9.7 billion in 2050 [33]. With the continuous growth of the world population, the rapid deterioration of soil and water resources, and the pressure of the greenhouse effect, ensuring food security and a healthy diet is a huge pressure and a severe test faced by global agriculture. Fertilizers have become an important component of our global food supply chain and are necessary to sustain our growing population [34]. The FAO reported that in 2021, world agriculture will use 109 million tons of nitrogen, 46 million tons of phosphorus, and 40 million tons of potassium fertilizers. In the two most recent decades, the mean annual growth rate was 2.5 million tons per year, compared with 3.7 million tons per year between 1961 and 1990. The global use of inorganic fertilizers per area of cropland rose from 82 to 112 kg per hectare of cropland from 2000 to 2021. At the same time, fertilizer use per person remained roughly constant at around 25 kg per capita. Inorganic fertilizer agricultural use almost doubled to 7.6 million tons in Africa between 2000 and 2021. The large decrease in the agricultural use of inorganic fertilizers in China started in 2015, while use in the U.S. and the European Union remained rather stable, counteracting growth in Latin America, the Caribbean, and the rest of Asia [35]. Menegat et al. [36] conducted a study of GHG emissions from global production and use of nitrogen synthetic fertilizers in agriculture, and they found that the synthetic N fertilizer supply chain was responsible for estimated emissions of 1.13 GtCO2e in 2018, representing 10.6% of agricultural emissions and 2.1% of global GHG emissions. Synthetic N fertilizer production accounted for 38.8% of total synthetic N fertilizer-associated emissions, while field emissions accounted for 58.6%, and transportation accounted for the remaining 2.6%. Reducing the overall production and use of synthetic nitrogen fertilizers will greatly reduce carbon emissions. Undoubtedly, if the goal of controlling global warming within 1.5 °C of preindustrial levels is to be achieved, the emissions of synthetic nitrogen fertilizers need to be reduced.
Despite the benefits that chemical fertilizers provide, improper fertilizer use can harm terrestrial, marine, and freshwater ecosystems by causing soil nutrient depletion (due to unbalanced fertilization), soil acidification, eutrophication, nutrient run-off, reduced biological diversity, and significantly increased GHG emissions from agricultural practices [7,34]. Guo et al. [37] conducted a global meta-analysis of crop yield and agricultural GHG emissions under nitrogen fertilizer application and found that a suitable N fertilization rate was 180, 150, 130, and 200 kg ha−1 for wheat, maize, rice, and vegetables or industrial crops, respectively, to maximize crop yield and maintain the accepted global warming potential (GWP) and GHG intensity (GHGI). In 2020, based on the irrigation area, the intensity of nitrogen fertilizer use in China was 265 kg ha−1 [38]. According to the above-recommended value of N fertilization for crops, the carbon reduction potential of Chinese fertilizers is enormous.
The use of plastic mulch in agriculture is beneficial for ensuring food production safety and improving water resource productivity. On a global scale, approximately 20 million hectares of farmland are covered with plastic film, with upland and paddy fields accounting for 80% and 20% of the total, respectively [39]. Between 2000 and 2020, the average annual growth rate of plastic film usage in China was 3.2%. Based on the irrigation area of arable land in China, the percentage of plastic film coverage increased from 19% in 2000 to 25% in 2020 [38]. To evaluate the effects of soil mulching methods on rice production, GHG emissions, and water use efficiency, Gao et al. [39] conducted a meta-analysis and found that plastic mulching (PM), straw mulching (SM), and no mulching reduced CH4 emissions (68.8, 61.4, and 57.2%), increased NzO emissions (84.8, 89.1, and 96.6%), reduced global warming potentials (50.7, 47.5, and 46.8%), and improved water use efficiency (50.2, 40.9, and 34.0%) compared with continuous flooding irrigation. However, PM increased the rice yield (1.6%), while SM and NM decreased the yield (4.3 and 9.2%, respectively) [39]. Yu et al. [40] conducted a meta-analysis of the effects of film mulching cultivation on soil organic carbon and soil GHG fluxes. They found that PM significantly promoted crop yield by 48.6%, did not affect SOC, reduced CH4 emissions from paddy fields by 64.2% and CH4 uptake in uplands by 16.1%, and increased soil N2O emissions by 23.9%. The effect of mulching on SOC and GHG fluxes varied among agricultural systems. Compared with the NM field, the use of PM significantly increased SOC and decreased CH4 uptake in rainfed uplands but reduced SOC in irrigated uplands.
3.3. Calculation of Carbon Sequestration
3.3.1. Changes in Total Carbon Sequestration and Its Intensity
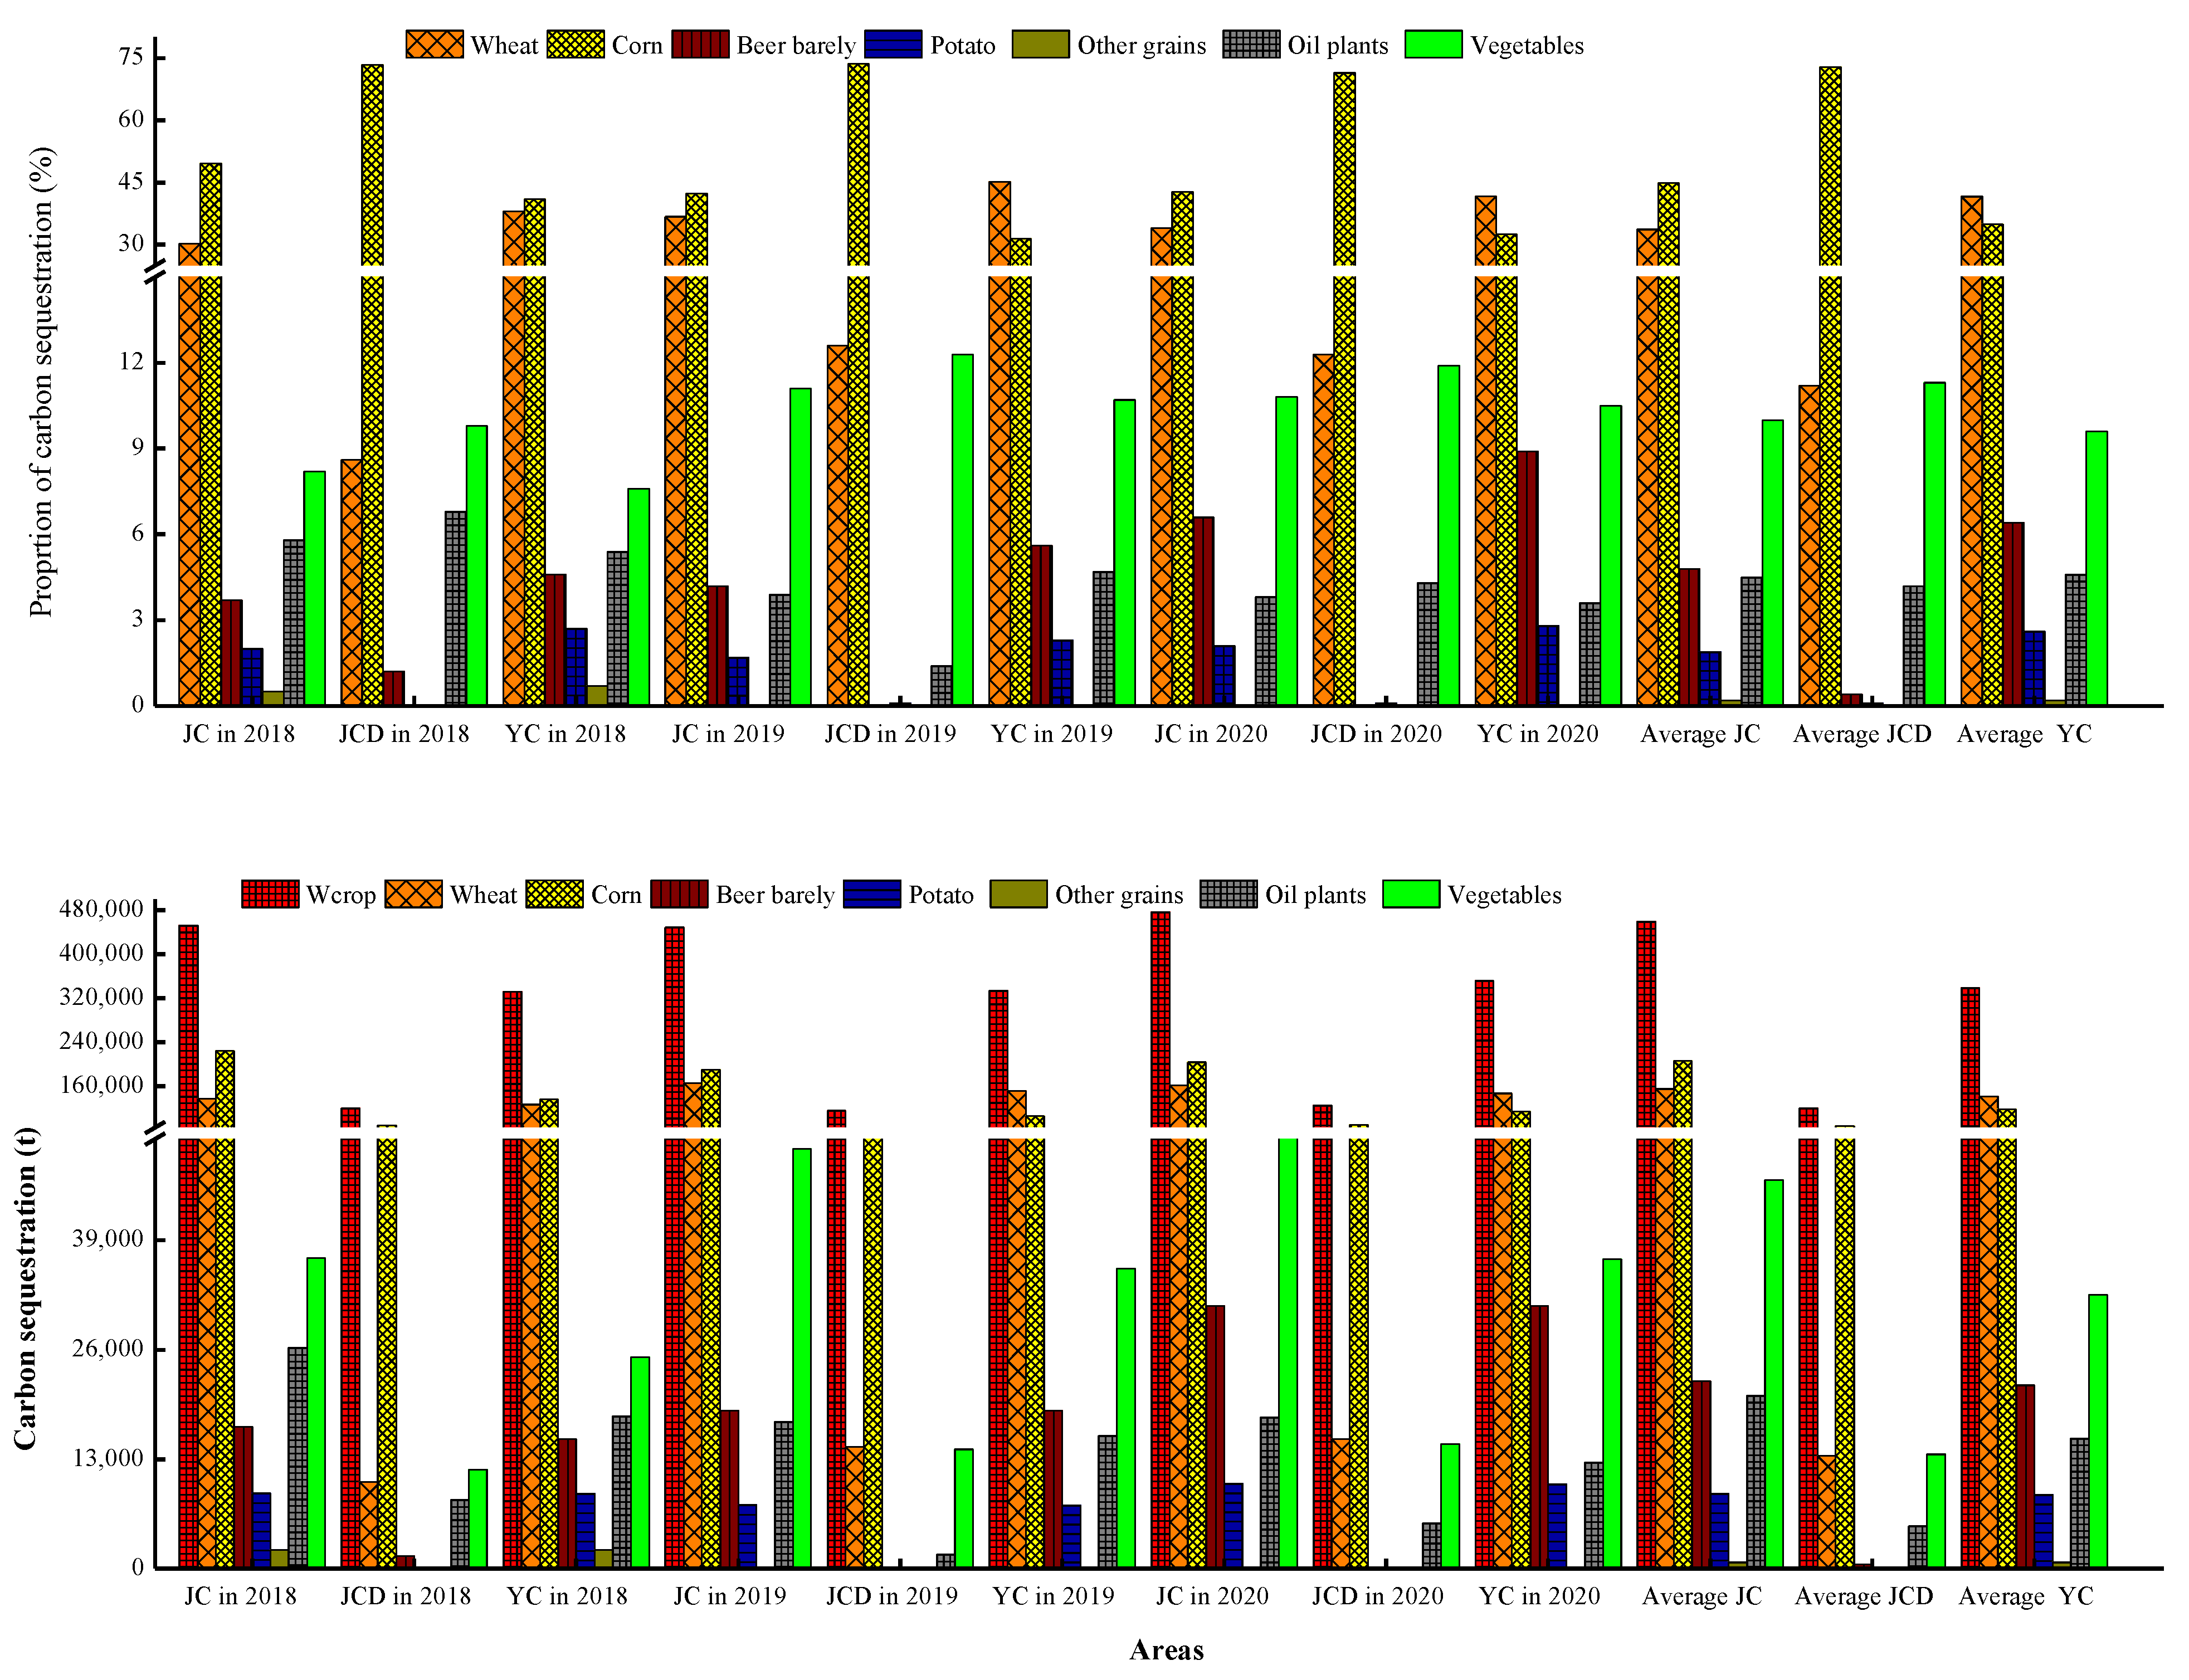
According to the crop species and sown area provided by statistical yearbooks combined with the local crop planting characteristics, the main food and economy crops, such as wheat, corn, malting barley, potatoes, oil-bearing crops, and vegetables, were selected for the calculation of carbon sequestration (Figure 3). The total carbon sequestration in the whole city in 2018 and 2019 remained stable and increased to 475,834.21 t in 2020. The changes in total carbon sequestration in JCD and YC were similar to the profile observed for the whole city. The maximum values in 2020 for JCD and YC were 124,835.90 and 350,998.31 t, respectively. The annual average values of total carbon sequestration in JC, JCD, and YC were 458,722.94, 119,806.36, and 338,916.58 t, respectively. The average value of total carbon sequestration in YC was 2.8 times that in JCD, which accounted for 73.9% of the average total carbon sequestration in the whole city.
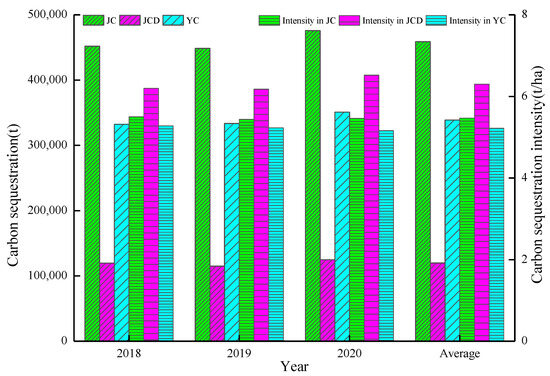
Figure 3.
Total carbon sequestration and its intensity in Jinchang (JC), Jinchuan District (JCD), and Yongchang County (YC).
The carbon sequestration intensity (the ratio of the total carbon sequestration amount to the sown area of crops) is shown in Figure 3. The carbon sequestration intensity remained stable in the whole city between 2018 and 2020, with an average value of 5.47 t/hm2. The carbon sequestration intensity in JCD was higher than that in YC. The carbon sequestration intensity in YC slightly decreased, with an annual average value of 5.22 t/hm2.
3.3.2. Variation of Carbon Sequestration and Its Intensity in Different Crops
The results of carbon sequestration by various crops are shown in Figure 4. The total carbon sequestration by wheat in the whole city increased to 165,142.92 t in 2019 and remained stable in 2020, with an annual average of 154,522.23 t. A similar changing trend in wheat was also observed in YC. The annual average value of carbon sequestration by wheat in YC was 141,143.25 t, which accounted for 91% of the average of the whole region of JC and was 10.55 times that in JCD. The carbon sequestration of wheat in JCD increased gradually, with an annual average value of 13,378.98 t.
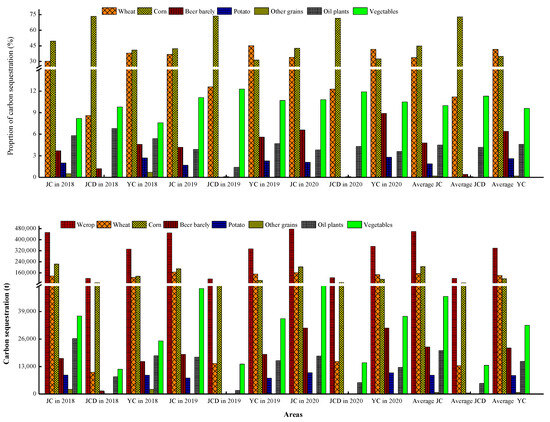
Figure 4.
Carbon sequestration by different crops in Jinchang (JC), Jinchuan District (JCD), and Yongchang County (YC).
The total carbon sequestration of corn in the whole city was V-shaped, with a maximum (224,019.92 t) in 2018 and an annual average value of 205,630.65 t. A similar changing trend was also observed in YC. The average value of carbon sequestration in corn in YC was 118,405.19 t. This accounted for 58% of the whole region and was 1.36-fold greater than that in JCD. The carbon sequestration of corn in JCD remained stable, with an annual average value of 87,225.46 t.
The carbon sequestration by beer barley in JC increased gradually, with a maximum value of 31,210.62 t in 2020 and an annual average value of 22,274.86 t, mainly due to the contribution of carbon sequestration by beer barley from YC. The annual average carbon sequestration by beer barley in YC was 21,773.80 t, which accounted for 98% of that in the whole region. The carbon sequestration by beer barley in JCD decreased rapidly to its lowest value (7.76 t) in 2020.
The total carbon sequestration by potatoes in the whole city was V-shaped from 2018 to 2020 and reached a maximum (10,110.23 t) in 2020, which is mainly attributed to the contribution of YC. The carbon sequestration of potatoes in YC reached its maximum (10,000.05 t) in 2020, with an annual average value of 8810.23 t.
The carbon sequestration by oil crops in the whole city was highest (26,237.84 t) in 2018 and decreased gradually, which was caused by the yearly decrease in carbon sequestration by oil crops in YC. The annual average value of carbon sequestration by oil crops was 15,497.27 t in YC and accounted for 75% of JC.
The carbon sequestration by vegetables in the whole region increased gradually, with a maximum of 51,590.21 t in 2020 and an annual average value of 46,109.76 t. Similar changing trends in carbon sequestration by vegetables were also observed in JCD and YC. The annual average value (32,537.33 t) of carbon sequestration by vegetables in YC accounted for 71% of all areas.
The average proportions of carbon sequestration by each crop in the total carbon sequestration of crops in the above areas were analyzed over the three years, and the results showed that the annual average carbon sequestration by corn had the highest proportion (45%), followed by wheat (34%), vegetables (10%), and other crops were all less than 10%. In the three years, the sum of the annual average proportions of carbon sequestration from corn, wheat, and vegetables in the above areas was more than 85%.
The intensity of carbon sequestration by each crop could be calculated according to the corresponding sown area of each crop. The average intensities of carbon sequestration in JC for wheat, corn, beer, barley, potatoes, oil crops, and vegetables were 6.67, 8.56, 4.23, 1.44, 6.15, and 3.59 t/hm2, respectively. There was no obvious difference between JCD and YC. The average annual carbon absorption intensity of all crops in the entire region was 5.50 t/hm2. These values are higher than the carbon sequestration per unit area in QTP [29]. Corn had the highest intensity of carbon sequestration among the above crops, which suggests that large-scale planting of corn may improve local carbon sequestration. The quantification of the combined GHG budgets for pea and maize revealed that CO2 uptake offsets N2O and CH4 emissions; both crops acted as GHG sinks during the cropping season, and the (absolute) net CO2 uptake of pea and maize was 514 and 1944 g CO2 m−2, respectively [15]. Kuyah et al. [25] demonstrated that grain legumes and dryland cereals improved carbon sequestration across Africa and South Asia. Plants can be divided into C3 and C4 plants depending on their different photosynthetic pathways. Usually, C3 plants exhibit lower photosynthetic efficiency than most C4 plants [41]. Corn, as a C4 plant, has a strong growth ability, high carbon dioxide utilization efficiency, and low water demand. C4 plants contain carbon concentrating mechanisms (CCM) that elevate the CO2 concentration around RuBisCO, thereby eliminating photorespiration. Such a mechanism is absent in C3 plants, which include major crop plants. Therefore, introducing a concentrating mechanism (CCM) into C3 plants is a viable strategy for improving the C3 photosynthesis rate and mitigating carbon [4].
3.4. Analysis of Carbon Indicators
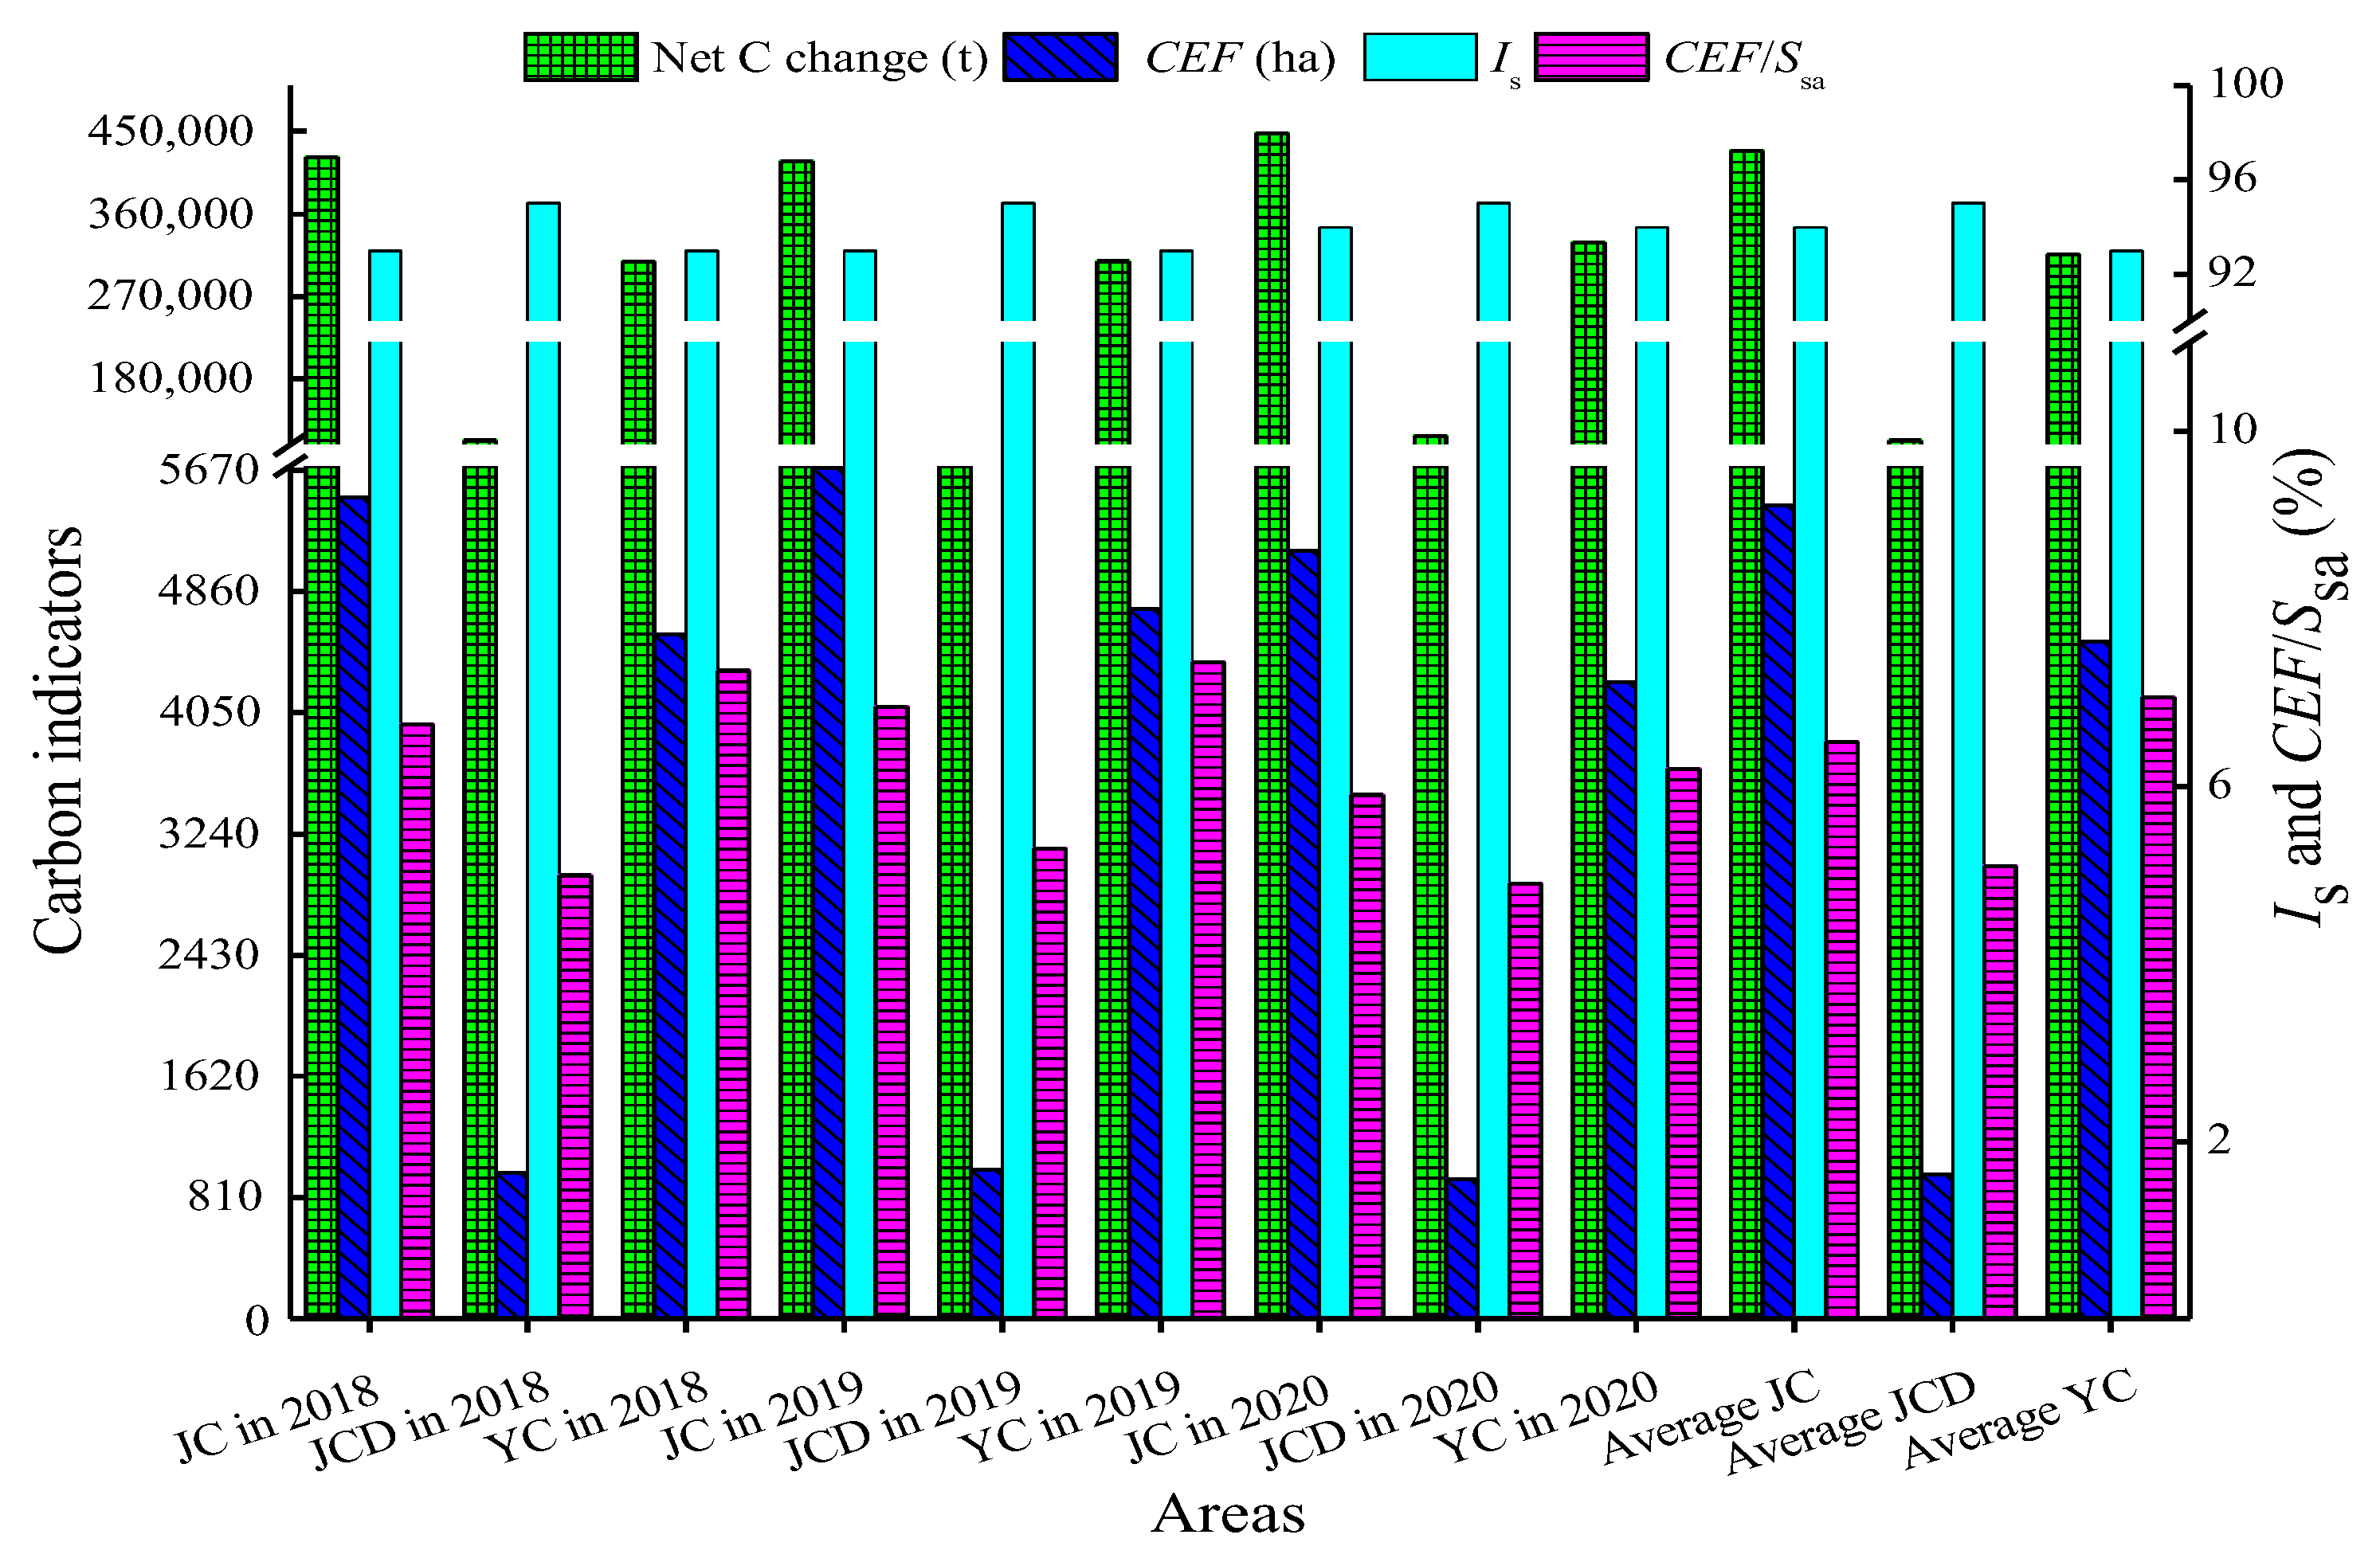
The total carbon sequestration from all crops was higher than the total carbon emissions in JC in the three years evaluated, and the net C change was V-shaped. The maximum value appeared in 2020 (447,841.35 t). The net C change in JCD was similar to that in JC, with an annual average value of 113,727.78 t. There was no obvious difference in the net C change between 2018 and 2019 for YC. The average value (315,288.54 t) of the net C change in YC accounted for 73% of the whole region (JC) over the three years. According to the calculation of the sustainable index (Is), the annual averages of the Is of JC, JCD, and YC were 94, 95, and 93%, respectively (Figure 5).
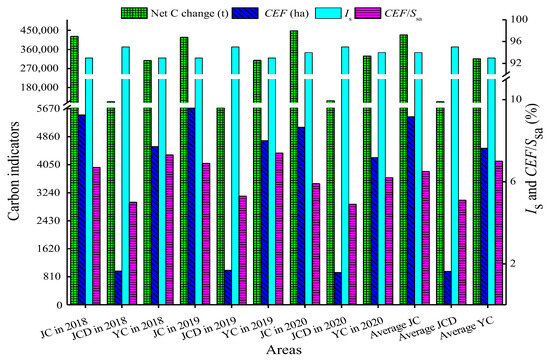
Figure 5.
Carbon indicators of Jinchang (JC), Jinchuan District (JCD), and Yongchang County (YC) from 2018 to 2020.
The CEF calculation showed that it increased and then decreased in JC, reached a maximum (5687.90 hm2) in 2019, and had an average value of 5436.08 hm2. A similar trend was observed for the CEF in YC. The CEF average was 4522.21 hm2 and was 4.7-fold greater than for JCD. There was no obvious change in the CEF in JCD. The average value of CEF stabilized at ~966.59 hm2/yr. In the three years, the proportions of CEF to the sown areas of crops in JC, JCD, and YC were 6.5, 5.1, and 7.0%, respectively (Figure 5).
Although carbon emissions from fertilizer and agricultural plastic film occupy a large proportion of the total carbon emissions from agricultural production, the Ministry of Agriculture and Rural Affairs of China has organized local governments to launch the Zero Growth for Fertilizer and Pesticide Usage action in 2015. The JC government has also been making active efforts to control and reduce the use of chemical fertilizers and pesticides in agriculture. The consumption amounts of fertilizer in JC have decreased yearly, and the amount of fertilizer application per mu (1 mu = 666.667 m2) in the whole city decreased from 0.12 t/mu in 2015 to 0.09 t/mu in 2019 [28,42]. Furthermore, the JC government has actively carried out recycling work for waste agricultural plastic film in recent years, implemented the Demonstration County Project of Waste Agricultural Plastic Film Reutilization, and built nine recycling and processing enterprises and seventeen agricultural film recycling outlets. The recovery percentage of agricultural plastic film waste reached 84.1% in the city [43]. Dong et al. [44] conducted a study establishing five plastic mulching management scenarios, i.e., plastic mulching disposed of in nature, substituting biodegradable plastic, recycling, incineration, landfilling, and maize cultivation in rural areas of northern China. Their results were as follows: the use of biodegradable mulching (BM) instead of traditional polyethylene mulching (PEM) reduced carbon emissions by 22.6%; the increment of soil carbon flux caused in the application stage was more significant than that in the post-use stage; and the incineration of post-use mulch had a relatively significant photochemical oxidant formation effect. Hence, they suggested that plastic cover collection, transportation, and treatment systems could be integrated into local urban solid waste management systems to reduce the environmental impact and economic costs of PEM management after use in rural areas [44]. To achieve a true “win-win” strategy of crop production and GHG emission reduction, agricultural film covering technology still needs further in-depth research and innovation.
In addition, conservation tillage is one of the measures for agricultural carbon emission reduction that should be tried in agricultural production in the future. No-tillage and less tillage can not only increase carbon sequestration in soil and decrease carbon emissions, but they can also reduce soil tillage intensity and improve crop water use efficiency. Furthermore, no-tillage was also beneficial in decreasing the use of plastic film [45]. Zhao et al. [46] reported that no-tillage reduced the amount of plastic film input by more than 50%, which was replaced annually. Yang et al. [9] carried out a field experiment of maize/pea intercropping in an oasis area. They found that no-tillage improved crop production and carbon mitigation, and that different planting methods of crops also had a great impact on the carbon emissions of farmland ecosystems. Straw return, less tillage, plastic film mulching, and drip irrigation recovery were recommended to decrease C losses [45]. Straw return can improve crop yield as well as SOC, but it may increase the possibility of N2O and CH4 emissions. Liu et al. [47] assessed the effects of straw return on the yield, SOC, and N2O of three major grain crops and the CH4 of rice in China through a meta-analysis. The analytical results indicated that, on average, straw return increased the yield of rice, wheat, and maize by 5.04, 8.09, and 8.71%, respectively. Straw return increased maize N2O emissions by 14.69% but did not significantly affect wheat N2O emissions. Notably, straw return reduced rice N2O emissions by 11.43% but increased CH4 emissions by 72.01%. The optimal management strategy varied among the three crops. These findings provide a basic reference for balancing the yield increase, carbon sequestration, and emission reduction of China’s three major grain crops under straw return conditions, thereby contributing to optimizing straw management in China.
When the planting area of crops is relatively stable, the structure of agricultural cropping and the planting area proportion of crops affect the carbon sequestration intensity value. The sown area of crops in YC was 3.4 times that in JCD, and the total agricultural output value of YC was 3.1 times that in JCD. During the three years, the average proportion of sown areas planted with wheat and corn in JCD accounted for 11% and 54%, respectively. The proportion of sown areas planted for the two crops in YC accounted for 32% and 21%, respectively. The planting area proportion of corn in JCD was significantly higher than that in YC; thus, the carbon sequestration intensity in JCD was higher than that in YC. Carbon sequestration from crop biomass is one of the key carbon sinks in agroecosystems [32]. Wang et al. also confirmed that planting different crop systems had a significant impact on carbon flux in corresponding regions. Paddy rice systems are mainly carbon sources, whereas maize and wheat systems are mainly carbon sinks [24]. The average net GHG emissions (NGEs) per unit area were 189, −970, −468, −3999, −8705, 8431, and 7397 kg CO2-eq ha−1 year−1 for spring maize, spring wheat, summer maize, winter wheat, winter wheat–summer maize, single rice, and double rice, respectively, and the cropland in China was a carbon source with NGEs equal to 28.4 Tg CO2-eq/year. Compared with single wheat or single maize systems, the rotation of winter wheat and summer maize could sequester more GHG emissions [24].
There are many factors that affect a change in carbon sources (carbon sequestration) in agricultural production. Therefore, it is necessary to identify the main factors that reduce carbon emissions in agricultural production, research the influence of soil on carbon emissions, and improve the structure of agricultural cropping conducive to the development of low-carbon agriculture.
4. Conclusions
To clarify the carbon budget characteristics of agricultural production in arid oasis areas, carbon emissions and carbon sequestration analyses were conducted for the typical city of JC in northwest China. The total carbon sequestrations in crops were obviously larger than the total carbon emissions from agricultural production. The annual averages of total carbon sequestration and total carbon emissions were 458,722.9 t C-eq/1,681,984.1 t CO2-eq and 29,712.6 t C-eq/108,946.3 t CO2-eq, respectively. Their ratios in JC, JCD, and YC were 15:1, 20:1, and 14:1, respectively. The JCD agricultural system had a large carbon sequestration function.
The carbon emissions from agricultural production in the three years in JC were as follows: fertilizer (43.2%) ≈ agricultural plastic film (41.3%) > cultivation (8.8%) ≈ irrigation (6.1%) > agricultural machinery (0.7%). The average proportion value of the carbon sequestration by different crops in the whole region was as follows: corn (45%) > wheat (34%) > vegetables (10%) > beer barley (5%) ≈ oil crops (4%) > potato (2%). For the contributions of the districts, the proportions of total carbon sequestration and emissions for YC in the whole region were 80% and 74%, respectively. The annual average Is values for JCD and YC were 95% and 93%, respectively. The CEF of YC accounted for 70% of the total CEF of JC. The carbon sequestration levels of different crops vary greatly, and the type and proportion of crops affect the carbon budget of the planting area.
The carbon sequestration ability of the agricultural production system would be improved by reducing the amount of chemical fertilizer, enhancing the amount of organic manure, decreasing the quantity of agricultural plastic film under the premise of ensuring agricultural inputs, adopting the technologies of no-tillage and less-tillage, optimizing the structure of agricultural cropping, and increasing the proportion of planting area for crops with high carbon sequestration intensity, such as corn.
Author Contributions
G.C., H.L., Z.Y., J.W. and K.L. contributed to the conception of the study, collected data, and wrote the manuscript. T.G. helped perform the analysis and provided constructive insight. All authors have read and agreed to the published version of the manuscript.
Funding
This work was supported by the Lanzhou Science and Technology Plan Project (2022-5-44), Innovation Fund for University Teachers from Educational Department of Gansu Province (No. 2023B-148), the Key Research and Development Program of Gansu Province (20YF3FA037) and Shanxi Province (2020ZDLSF06-06).
Data Availability Statement
The datasets used and analyzed during the current study are available from the corresponding author upon reasonable request.
Conflicts of Interest
The authors declare no conflict of interest.
References
- Matuštík, J.; Kočí, V. What is a footprint? A conceptual analysis of environmental footprint indicators. J. Clean. Prod. 2021, 285, 124833. [Google Scholar] [CrossRef]
- Zhang, X.; Shi, X.; Khan, Y.; Hassan, T.; Marie, M. Carbon Neutrality Challenge: Analyse the Role of Energy Productivity, Renewable Energy, and Collaboration in Climate Mitigation Technology in OECD Economies. Sustainability 2023, 15, 3447. [Google Scholar] [CrossRef]
- Khan, Y.; Oubaih, H.; Elgourrami, F.Z. The effect of renewable energy sources on carbon dioxide emissions: Evaluating the role of governance, and ICT in Morocco. Renew. Energy 2022, 190, 752–763. [Google Scholar] [CrossRef]
- Nayak, N.; Mehrotra, R.; Mehrotra, S. Carbon biosequestration strategies: A review. Carbon Capture Sci. Technol. 2022, 4, 100065. [Google Scholar] [CrossRef]
- Zeebe, R.E.; Ridgwell, A.; Zachos, J.C. Anthropogenic carbon release rate unprecedented during the past 66 million years. Nat. Geosci. 2016, 9, 325–329. [Google Scholar] [CrossRef]
- Hu, Y.B.; Zhang, Q.; Hu, S.J.; Xiao, G.J.; Chen, X.Y.; Wang, J.S.; Qi, Y.; Zhang, L.; Han, L.Y. Research progress and prospects of ecosystem carbon sequestration under climate change (1992–2022). Ecol. Indic. 2022, 145, 109656. [Google Scholar] [CrossRef]
- Chataut, G.; Bhatta, B.; Joshi, D.; Subedi, K.; Kafle, K. Greenhouse gases emission from agricultural soil: A review. J. Agric. Food. Res. 2023, 11, 100533. [Google Scholar] [CrossRef]
- Verge, X.P.C.; De, K.C.; Desjardins, R.L. Agricultural production, greenhouse gas emissions and mitigation potential. Agric. Meteorol. 2007, 142, 255–269. [Google Scholar] [CrossRef]
- Yang, H.W.; Hu, F.L.; Yin, W.; Chai, Q.; Zhao, C.; Yu, A.Z.; Fan, Z.L.; Fan, H.; Ren, X.L. Integration of tillage and planting density improves crop production and carbon mitigation of maize/pea intercropping in the oasis irrigation area of northwestern China. Field Crops Res. 2021, 272, 108281. [Google Scholar] [CrossRef]
- The World Bank. CO2 Emissions (Kt). Washington, DC, USA. 2019. Available online: https://data.worldbank.org/indicator/EN.ATM.CO2E.KT?amp%3Bmost_recent_value_desc=true&%3Bstart=1990&end=2019&start=1990 (accessed on 16 September 2022).
- Liu, M.C.; Yang, L. Spatial pattern of China’s agricultural carbon emission performance. Ecol. Indic. 2021, 133, 108345. [Google Scholar] [CrossRef]
- Chen, M.P.; Cui, Y.R.; Jiang, S.; Forsell, N. Toward carbon neutrality before 2060: Trajectory and technical mitigation potential of non-CO2 greenhouse gas emissions from Chinese agriculture. J. Clean. Prod. 2022, 368, 133186. [Google Scholar] [CrossRef]
- Li, M.; Peng, J.Y.; Lu, Z.X.; Zhu, P.Y. Research progress on carbon sources and sinks of farmland ecosystems. Res. Environ. Sustain. 2022, 11, 100099. [Google Scholar] [CrossRef]
- IPCC (Intergovernmental Panel on Climate Change). Climate Change 2022: Mitigation of Climate Change; Shukla, P.R., Skea, J., Slade, R., Al Khourdajie, A., van Diemen, R., McCollum, D., Pathak, M., Some, S., Vyas, P., Fradera, R., et al., Eds.; Cambridge University Press: Cambridge, UK; New York, NY, USA, 2022; Available online: https://www.ipcc.ch/report/ar6/wg3/downloads/report/IPCC_AR6_WGIII_SummaryForPolicymakers.pdf (accessed on 25 November 2022).
- Maier, R.; Hörtnag, L.; Buchmann, N. Greenhouse gas fluxes (CO2, N2O and CH4) of pea and maize during two cropping seasons: Drivers, budgets, and emission factors for nitrous oxide. Sci. Total Environ. 2022, 849, 157541. [Google Scholar] [CrossRef]
- Congressional Research Service (CRS). Greenhouse Gas Emissions and Sinks in U.S. Agriculture. 2022. Available online: https://sgp.fas.org/crs/misc/IF11404.pdf (accessed on 22 November 2022).
- IPCC. Climate Change 2014: Impacts, Adaptation, and Vulnerability. Part A: Global and Sectoral Aspects Contribution of Working Group II to the Fifth Assessment Report of the Intergovernmental Panel on Climate Change; Cambridge University Press: Cambridge, UK; New York, NY, USA, 2014. [Google Scholar]
- Snyder, C.S.; Bruulsema, T.W.; Jensen, T.L.; Fixen, P.E. Review of greenhouse gas emissions from crop production systems and fertilizer management effects. Agric. Ecol. Environ. 2009, 133, 247–266. [Google Scholar] [CrossRef]
- Huang, X.; Xu, X.; Wang, Q.; Zhang, L.; Gao, X.; Chen, L. Assessment of agricultural carbon emissions and their spatiotemporal changes in China, 1997–2016. Int. J. Environ. Res. Public Health 2019, 16, 3105. [Google Scholar] [CrossRef]
- Hu, Y.C.; Su, M.R.; Jiao, L.M. Peak and fall of China’s agricultural GHG emissions. J. Clean. Prod. 2023, 389, 136035. [Google Scholar] [CrossRef]
- Guan, X.; Zhang, J.; Wu, X.; Cheng, L. The shadow prices of carbon emissions in China’s planting industry. Sustainability 2018, 10, 753. [Google Scholar] [CrossRef]
- Lv, Y.; Liu, J.; Cheng, J.; Andreoni, V. The persistent and transient total factor carbon emission performance and its economic determinants: Evidence from China’s province-level panel data. J. Clean. Prod. 2021, 316, 128198. [Google Scholar] [CrossRef]
- Gangopadhyay, S.; Banerjee, R.; Batabyal, S.; Das, N.; Mondal, A.; Pal Chandra, S.; Mandal, S. Carbon sequestration and greenhouse gas emissions for different rice cultivation practices. Sustain. Prod. Consum. 2022, 34, 90–104. [Google Scholar] [CrossRef]
- Wang, Y.C.; Tao, F.L.; Yin, L.C.; Chen, Y. Spatiotemporal changes in greenhouse gas emissions and soil organic carbon sequestration for major cropping systems across China and their drivers over the past two decades. Sci. Total Environ. 2022, 833, 155087. [Google Scholar] [CrossRef]
- Kuyah, S.; Muoni, T.; Bayala, J.; Chopin, P.; Dahlin, A.S.; Hughes, K.; Jonsson, M.; Kumar, S.; Sileshi, G.W.; Dimobe, K.; et al. Grain legumes and dryland cereals contribute to carbon sequestration in the drylands of Africa and South Asia. Agric. Ecol. Environ. 2023, 355, 108583. [Google Scholar] [CrossRef]
- Tian, P.P.; Li, D.; Lu, H.W.; Feng, S.S.; Nie, Q.W. Trends, distribution, and impact factors of carbon footprints of main grains production in China. J. Clean. Prod. 2021, 278, 123347. [Google Scholar] [CrossRef]
- Statistics Department of Jinchang. Jinchang Statistical Yearbook (Chinese Edition). Jinchang. 2020. Available online: http://tjj.jcs.gov.cn/zfxxgk/fdzdgknr/tjxx/tjnj/art/2022/art_bbade7946cba4ca5b8e8da1c6f8e59a2.html (accessed on 26 July 2022).
- Statistics Department of Jinchang. Jinchang Statistical Yearbook (Chinese Edition). Jinchang. 2018–2019. Available online: http://tjj.jcs.gov.cn/zfxxgk/fdzdgknr/tjxx/tjnj/ (accessed on 26 July 2022).
- Li, M.Q.; Liu, S.L.; Sun, Y.X.; Liu, Y.X. Agriculture and animal husbandry increased carbon footprint on the Qinghai-Tibet Plateau during past three decades. J. Clean. Prod. 2021, 278, 123963. [Google Scholar] [CrossRef]
- Bao, Q.J.; Pan, Y.D.; Zhang, H.Y.; Liu, X.N.; Zhang, D.J.; Zhao, F. Effect of reducing fertilizer application on dry matter accumulation, yield and fertilizer utilization efficiency of beer barely. J. Agric. Sci. Technol. 2020, 22, 149–158. [Google Scholar]
- Lal, R. Carbon emission from farm operations. Environ. Int. 2004, 30, 981–990. [Google Scholar] [CrossRef] [PubMed]
- Chen, R.; Zhang, R.Y.; Han, H.Y.; Jiang, Z.D. Is farmers’ agricultural production a carbon sink or source?—Variable system boundary and household survey data. J. Clean. Prod. 2020, 266, 122108. [Google Scholar] [CrossRef]
- United Nations. Global Issues Population. Peace, Dignity and Equality on a Healthy Planet. Available online: https://www.un.org/zh/global-issues/population (accessed on 2 August 2023).
- Walling, E.; Vaneeckhaute, C. Greenhouse gas emissions from inorganic and organic fertilizer production and use: A review of emission factors and their variability. J. Environ. Manag. 2020, 276, 111211. [Google Scholar] [CrossRef]
- The Food and Agriculture Organization of the United Nation (FAO). Inorganic Fertilizers 2000–2021. In FAOSTAT Analytical Brief 68; FAO: Rome, Italy, 2021; Available online: https://www.fao.org/3/cc6823en/cc6823en.pdf (accessed on 2 August 2023).
- Menegat, S.; Ledo, A.; Tirado, R. Greenhouse gas emissions from global production and use of nitrogen synthetic fertilizers in agriculture. Sci. Rep. 2022, 12, 14490. [Google Scholar] [CrossRef] [PubMed]
- Guo, C.; Liu, X.F.; He, X.F. A global meta-analysis of crop yield and agricultural greenhouse gas emissions under nitrogen fertilizer application. Sci. Total Environ. 2022, 831, 154982. [Google Scholar] [CrossRef]
- Rural Socio Economic Survey Department of the National Bureau of Statistics. China Rural Statistical Yearbook; China Statistical Press: Beijing, China, 2022. [Google Scholar]
- Gao, H.H.; Liu, Q.; Yan, C.R.; Wu, Q.; Gong, D.Z.; He, W.Q.; Liu, H.J.; Wang, J.L.; Mei, X.R. Mitigation of greenhouse gas emissions and improved yield by plastic mulching in rice production. Sci. Total Environ. 2023, 880, 162984. [Google Scholar] [CrossRef]
- Yu, Y.X.; Zhang, Y.X.; Xiao, M.; Zhao, C.Y.; Yao, H.Y. A meta-analysis of film mulching cultivation effects on soil organic carbon and soil greenhouse gas fluxes. CATENA 2021, 206, 105483. [Google Scholar] [CrossRef]
- Tan, T.L.; Zulkifli, N.A.; Zaman, A.S.K.; Jusoh, M.B.; Yaapar, M.N.; Rashid, S.A. Impact of photoluminescent carbon quantum dots on photosynthesis efficiency of rice and corn crops. Plant Physiol. Biochem. 2021, 162, 737–751. [Google Scholar] [CrossRef]
- Li, F. Jinchang City Continuously Improve the Efficiency of Comprehensive Utilization of Agricultural Resources. Jinchang Daily, 13 October 2020. Available online: https://wap.cnki.net/touch/web//Newspaper/list/JCBR20201013(accessed on 16 August 2022).
- Zhang, K.L. Jinchang City Continuously Improve the Quality of Cultivated Land in Order to Ensure Food Security. 4 March 2022. Available online: http://gs.people.com.cn/n2/2022/0304/c397687-35159535.html (accessed on 16 August 2022).
- Dong, H.T.; Yang, G.; Zhang, Y.M.; Yang, Y.Y.; Wang, D.W.; Zhou, C.B. Recycling, disposal, or biodegradable-alternative of polyethylene plastic film for agricultural mulching? A life cycle analysis of their environmental impacts. J. Clean. Prod. 2022, 380, 134950. [Google Scholar] [CrossRef]
- Ming, G.H.; Hu, H.C.; Tian, F.Q.; Khan, A.M.Y.; Zhang, Q. Carbon budget for a plastic-film mulched and drip-irrigated cotton field in an oasis of Northwest China. Agric. For. Meteorol. 2021, 306, 108447. [Google Scholar] [CrossRef]
- Zhao, C.; Chai, Q.; Cao, W.D.; Whalen, J.K.; Zhao, L.X.; Cai, L.J. No-tillage reduces competition and enhances compensatory growth of maize (Zea mays L.) intercropped with pea (Pisum sativum L.). Field Crops Res. 2019, 243, 107611. [Google Scholar] [CrossRef]
- Liu, D.T.; Song, C.C.; Xin, Z.H.; Fang, C.; Liu, Z.H.; Xu, Y.P. Agricultural management strategies for balancing yield increase, carbon sequestration, and emission reduction after straw return for three major grain crops in China: A meta-analysis. J. Environ. Manag. 2023, 340, 117965. [Google Scholar] [CrossRef] [PubMed]

Disclaimer/Publisher’s Note: The statements, opinions and data contained in all publications are solely those of the individual author(s) and contributor(s) and not of MDPI and/or the editor(s). MDPI and/or the editor(s) disclaim responsibility for any injury to people or property resulting from any ideas, methods, instructions or products referred to in the content. |
© 2023 by the authors. Licensee MDPI, Basel, Switzerland. This article is an open access article distributed under the terms and conditions of the Creative Commons Attribution (CC BY) license (https://creativecommons.org/licenses/by/4.0/).