Article

IoT- and GIS-Based Environmental Impact Assessment of Construction and Demolition Waste Dump Yards

by
Hariharasudhan Chandrasekaran
1,*,
Suresh Ellappa Subramani
2,
Pachaivannan Partheeban
1 and
Madhavan Sridhar
1
1
Department of Civil Engineering, Chennai Institute of Technology, Chennai 600069, India
2
Department of Civil Engineering, National Institute of Technical Teachers Training and Research, Taramani, Chennai 600132, India
*
Author to whom correspondence should be addressed.
Sustainability 2023, 15(17), 13013; https://doi.org/10.3390/su151713013
Submission received: 5 July 2023 / Revised: 16 August 2023 / Accepted: 17 August 2023 / Published: 29 August 2023

Abstract

:
Globally, construction and demolition wastes (C&DW) are rapidly increasing, occupying 3 billion square yards of land for landfill. In India, C&D debris reaches 150 million tons per year, leading to environmental damage and resource wastage due to poor waste management practices. This study focuses on environmental impact analysis of air and water quality for selected construction and demolition waste dump yards for Chennai metropolitan city in India for two recycling units with 15 legal dumping yards. The Internet of Things (IoT) and Geographic Information System (GIS) is used to monitor and analyze environmental effect due to C&D waste dump yard. The highest concentrations of CO and CO2 in one dump site were observed at one point, with values of 7.49 ppm and 1656.06 ppm, respectively, and at another point with the lowest values of 2.3 ppm and 619.76 ppm. TDS values ranged from 269.2 mg/L to 1347.66 mg/L, and pH values ranged from 6.4 to 11.8, indicating pollution levels in drinking water. The findings suggest that improved waste management practices are urgently needed, including better regulation and enforcement of waste disposal laws, the establishment of recycling facilities with proper air and water pollution control measures, and public education campaigns for responsible waste disposal.

1. Introduction

Construction and demolition waste (C&DW) has become a pressing global issue, with significant environmental and health impacts [1]. In India alone, C&D debris reaches up to 150 million tons per year, leading to environmental damage and resource wastage due to poor waste management practices. However, these debris can be effectively recycled and reused, a crucial step that is often overlooked [2,3]. This study focuses on the use of geographic information systems (GIS) to minimize C&D waste by analyzing the impact of C&DW on air and water quality. GIS is a powerful tool for data analysis, management, and visualization in various fields, including environmental research and urban planning [4]. It allows for the integration of spatial data with other forms of data, enabling a comprehensive understanding of complex systems and phenomena. The objectives of this research are to investigate the environmental impact of C&DW on air and water quality and assess the spatial variation in air and water quality parameters around C&DW recycling units, using IoT and GIS as key tools. Assessing the sustainability of air and water quality near construction and demolition waste dump yards in India involves evaluating various factors related to environmental impact, health risks, and regulatory compliance.
Air pollution is a major concern for public health and the environment, with significant impacts on human health and ecosystems [5,6,7,8]. Studies have established a clear connection between inadequate air quality and a range of health issues, such as respiratory and cardiovascular illnesses [9,10,11]. The World Health Organization (WHO) estimates that air pollution is responsible for approximately 7 million premature deaths annually [12]. In addition to its impacts on human health, air pollution also has adverse effects on the environment, including climate change, biodiversity loss, and ecosystem degradation [13]. Real-time air quality monitoring is crucial for understanding the extent of air pollution and its effects on human health and the environment. GIS technology, combined with other data such as air pollutant measurements and meteorological data, can provide visual representations of air quality in different regions, offering precise and reliable information on pollution levels at various times of the day [14]. This can aid in identifying sources of air pollution and evaluating the effectiveness of pollution control measures.
The integration of GIS and Internet of Things (IoT) technology has the potential to revolutionize waste management systems by providing real-time data and insights to inform decision making and policy development [15]. This project aims to contribute to the development of effective waste management strategies and the protection of air and water quality resources. The study will provide valuable insights into the spatial distribution of waste and the impact of C&DW on air and water quality, which can inform targeted interventions and policies for improved waste management. The four-phase approach involving data collection, GIS analysis, mapping, and statistical analysis will be utilized in this study to ensure a systematic and thorough analysis of the data. The study will assess the spatial variation in air and water quality parameters around C&DW recycling units. The results of this study will provide valuable information to Chennai Corporation and other stakeholders, including businesses and academic institutions, to effectively manage C&D waste. The outlined research possesses a wider range of relevance that extends beyond a singular case. Our efforts are tailored to provide flexible techniques and valuable insights that can be easily implemented in various urban settings, thereby rendering it significant and beneficial for cities other than the one mentioned.
Efficient waste management strategies are critical to minimize the environmental impact of C&DW. This includes proper disposal, recycling, and reuse of construction and demolition materials. Recycling and reusing C&DW can significantly reduce the amount of waste that ends up in landfills, saving space and reducing the associated environmental risks. Moreover, recycling C&DW can also conserve natural resources, reduce greenhouse gas emissions, and promote a circular economy. Effective construction and demolition (C&D) waste management is crucial to prevent environmental degradation and public health hazards. Inappropriate disposal of C&D waste can lead to the contamination of air and water resources, negatively impacting human health and ecological systems. By incorporating direct reuse practices, we can further reduce the need for the disposal and transportation of C&DW, thus minimizing the overall environmental impact. Starting from the very fine particles suitable for concrete production, decorative and structural concrete and constructing granular fills present sustainable alternatives to traditional materials [16]. Furthermore, incorporating recycled crushed concrete aggregate into concrete production not only lessens the demand for natural aggregates but also curtails the amount of concrete waste ending up in landfills [17]. In line with the overarching goal of our IoT and GIS-based environmental impact assessment, this project aims to provide data-driven information by monitoring and evaluating air and water quality parameters. These collected data serve to inform targeted interventions and policies for improved waste management and protection of environmental resources.

1.1. Research Related to Air Quality around Dump Yard

Building demolition is a common activity in urban areas, but it can have significant impacts on air quality. In recent years, there has been growing interest in the characterization of particle emissions and their impact on indoor and outdoor air quality. Several studies have investigated the characteristics of particle emissions from building demolition, including particle size distribution, composition, and morphology. For example, Ref. [18] found that particle emissions from building demolition were dominated by coarse particles, with a peak diameter of around 3–4 μm. Table 1 describes the literature reviews for the air quality performed by different researchers. In addition to particle emissions, volatile organic compounds (VOCs) can also be released during building demolition, which can have negative impacts on air quality. Ref. [19] investigated the emission characteristics of PM2.5 and VOCs from building demolition and found that VOC emissions were dominated by aromatic compounds, which are known to have adverse health effects. Many researchers also focused on the hierarchy of construction and demolition waste management [20,21]. A review focused on integrated management strategies for construction and demolition waste, with a specific focus on resource recovery and circular construction [22].
The dispersion of dust released from building demolition is also an important factor that can affect air quality in the surrounding area. Several studies have used numerical models to simulate the dispersion of dust, taking into account factors such as wind speed and building geometry. For instance, Ref. [32] used a numerical model to investigate the dispersion of dust released from building demolition in a semi-confined urban street canyon and found that the canyon acted as a barrier to the dispersion of dust. Some authors [33,34] have attempted to assess the sustainability of C&D waste and to discuss the challenges faced in sustainable construction and demolition waste management in Somaliland, highlighting how regulatory barriers can lead to technical and environmental obstacles. Indoor air quality can also be affected by building demolition, as dust and particles can enter buildings through ventilation systems and open windows. Ref. [35] investigated the impact of building demolition on indoor and outdoor PM2.5 levels in a high-rise building and found that indoor PM2.5 levels increased significantly during the demolition period.
The health risks associated with particle emissions from building demolition have also been studied in several papers [36,37,38]. Refs. [39,40] have assessed the health risks associated with airborne particles emitted from building demolition using a health risk assessment model and found that the non-carcinogenic health risks exceeded the acceptable level for both adults and children. Similarly, Ref. [8] found that PM2.5 and PM10 emissions from building demolition posed a significant health risk to nearby residents. In conclusion, recent literature highlights the significant impacts of building demolition on air quality. Particles and VOCs released during demolition can have negative impacts on both indoor and outdoor air quality, and the dispersion of dust can also affect air quality in the surrounding area. Furthermore, building demolition can pose significant health risks to nearby residents, underscoring the need for effective mitigation measures to minimize these impacts.

1.2. Research Related to Water Quality around Dump Yard

Construction and demolition activities can have significant impacts on water quality, as the release of pollutants during these activities can lead to the contamination of water sources [41]. A variety of pollutants, including heavy metals and other chemicals, can be released during the demolition of buildings and construction sites, which can negatively affect water quality and aquatic ecosystems [42]. In recent years, there has been a growing concern about the effects of water quality due to building demolition, leading to increased research in this area. Several studies have investigated the environmental impacts of construction site demolition on water quality in urban areas. Ref. [43] assessed water quality at a construction demolition site in urban areas, while Ref. [44] investigated pollution characteristics and the risk assessment of heavy metals in river water affected by construction and demolition waste. The latter study found that construction and demolition waste can lead to an increase in heavy metal concentrations in water, which can pose risks to human health and the environment. Table 2 describes the literature reviews for the water quality performed by different researchers.
The effects of construction and demolition waste on water quality have also been studied in other contexts. For example, Ref. [2] investigated the impact of construction and demolition waste on water quality in a mining area, while Ref. [52] studied the impact in a rapidly urbanizing area in China. Both studies found that construction and demolition waste can have significant impacts on water quality, including increased heavy metal concentrations and other pollutants. In addition to heavy metals, other pollutants associated with construction and demolition activities have been investigated in relation to their effects on water quality. Ref. [53] investigated the pollution of heavy metals in water environments affected by construction and demolition waste, while Ref. [49] assessed the ecological risk of a river affected by construction and demolition waste. The latter study found that construction and demolition activities can have negative impacts on aquatic ecosystems, including impacts on the composition and diversity of aquatic species.
Overall, the literature suggests that construction and demolition activities can have significant impacts on water quality, with heavy metals and other pollutants being of particular concern. Future research in this area could focus on identifying effective mitigation strategies for minimizing the impacts of construction and demolition waste on water quality, as well as understanding the long-term effects of these activities on aquatic ecosystems and human health.

1.3. Research Related to Application of IoT Sensor in Quality Assessment

The emergence of the Internet of Things (IoT) has led to a rapid increase in the number of devices and sensors that are interconnected, leading to an explosion in the amount of data that can be collected and analyzed. One of the most promising applications of IoT technology is in the field of quality assessment, where it has the potential to revolutionize the way in which data are collected and analyzed to identify and address issues in various industries. Several recent journal papers have investigated the use of IoT sensors in quality assessment. For instance, Ref. [54] proposed an IoT-based system for real-time quality assessment in the construction industry. The system utilized various sensors to monitor different parameters such as temperature, humidity, and vibration, enabling early detection of defects and potential hazards.
Similarly, Ref. [15] developed an IoT-based quality assessment system for the automotive industry. The system monitored various aspects of the manufacturing process, such as the temperature and pressure of different components, to ensure the quality of the final product. Another area of focus has been the use of machine learning in conjunction with IoT technology to enhance the accuracy and efficiency of quality assessment. Ref. [28] proposed a system that combined IoT sensors with machine learning algorithms to provide real-time quality assessment in the food industry. The potential of IoT technology has also been explored in areas such as power distribution, smart grid, smart agriculture, air pollution, industrial processes, and healthcare. In all of these areas, the integration of IoT sensors has the potential to provide real-time data that can be analyzed to improve quality assessment and ensure the safety and reliability of various systems [55,56].
Overall, the recent journal papers reviewed in this literature review highlight the potential of IoT sensors in quality assessment and the importance of integrating IoT technology with machine learning algorithms to enhance accuracy and efficiency. As the field continues to develop, it is expected that the use of IoT technology in quality assessment will become increasingly common, leading to significant improvements in the reliability and safety of various systems.

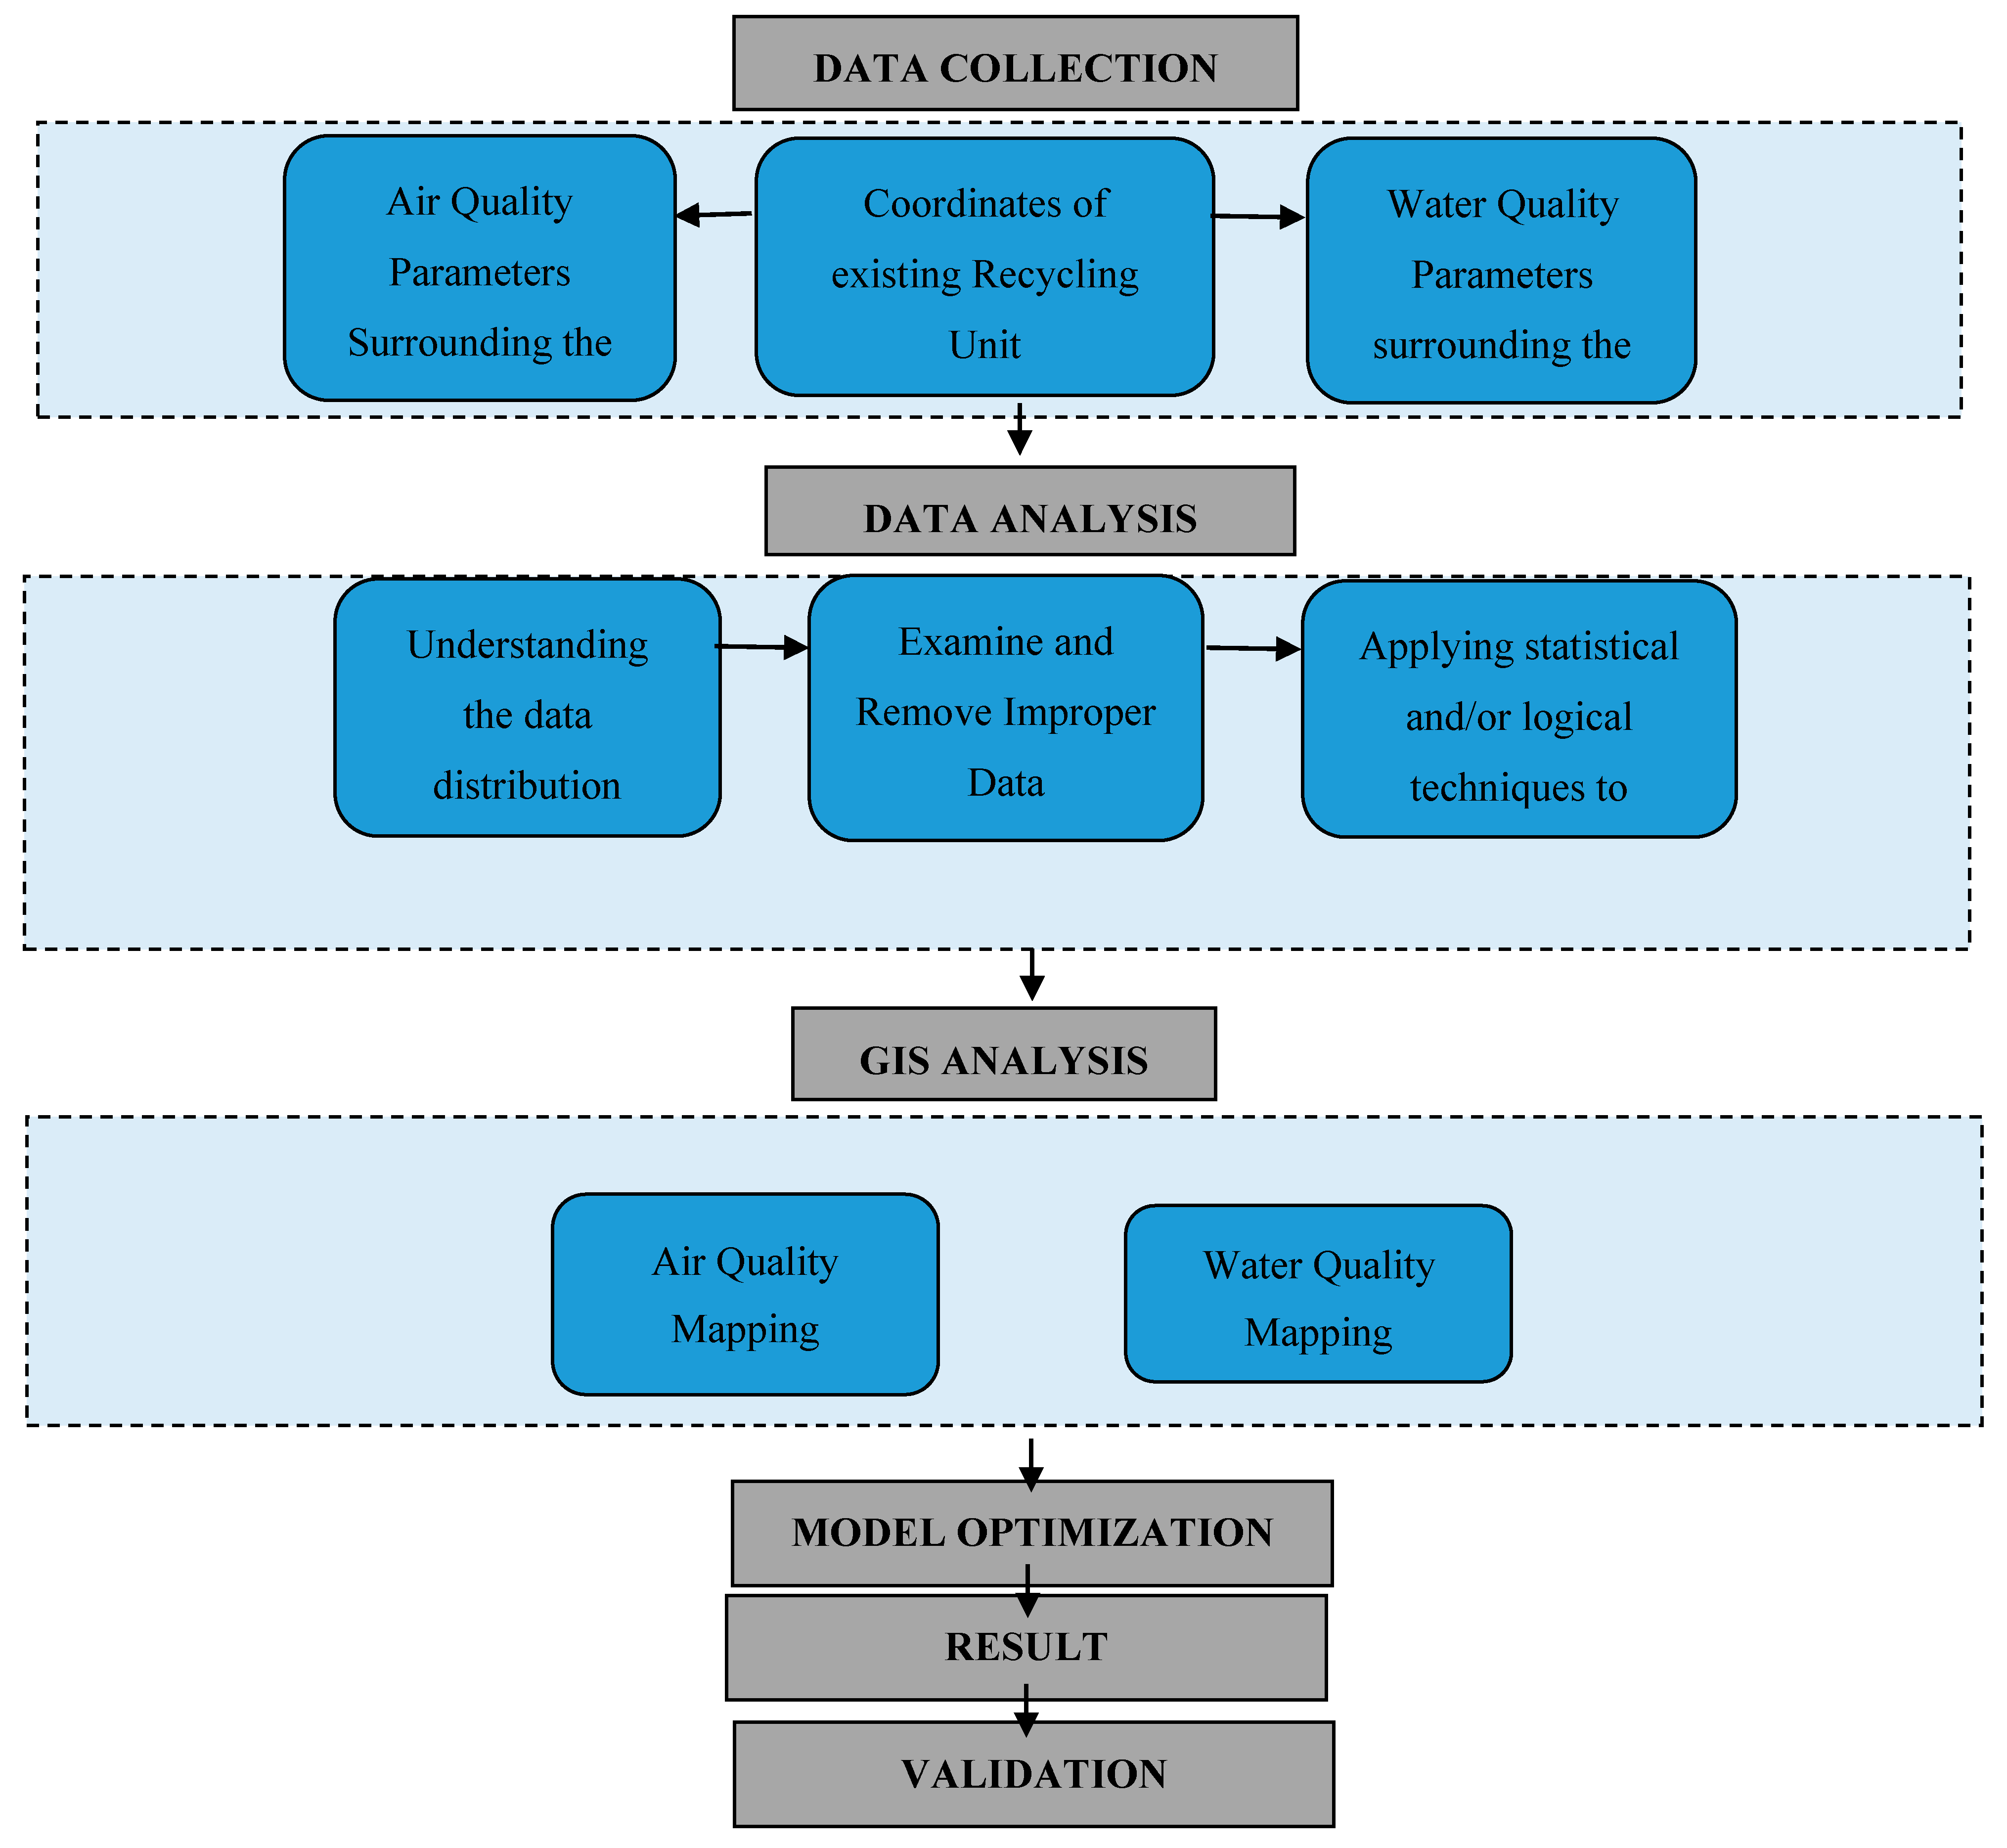
2. Materials and Methods

Geospatial technology has become a critical tool for data analysis, management, and visualization in various fields, including environmental research, urban planning, and disaster management [52]. Geospatial technology enables the integration of spatial data with other forms of data, providing a comprehensive understanding of complex systems. In the context of debris transportation and waste management, Geospatial technology can provide valuable insights into the spatial distribution of waste and optimal routing of collection trucks.
This study utilized a four-phase approach with GIS software to analyze the spatial variation in air and water quality parameters around C&DW recycling units. The first phase involved data collection using IoT and updating to ensure accuracy and relevance. The second phase focused on creating maps using QGIS software for the visualization and manipulation of spatial data, allowing for the identification of potential hotspots and optimal routing of collection trucks. The third phase involved GIS analysis. Finally, statistical analysis was conducted using hypothesis testing to assess the reliability and accuracy of the findings. Overall, the utilization of GIS software and the four-phase approach allowed for a comprehensive analysis of the waste management system and the identification of potential areas for improvement, providing valuable insights into the spatial distribution of air and water quality parameters around hotspots, and Figure 1 represents the detailed methodology flow chart of the research.
The methodology involves six steps: data collection (coordinates of dumping sites and air and water quality parameters), data analysis (distribution, outlier removal, and statistical techniques), GIS analysis (economic and environmental factors), model optimization (developing optimization model), results presentation (findings and environmental impacts), and validation (comparison and stakeholder feedback). Data are collected from various sources, analyzed, and used in GIS analysis to develop an optimization model. Results are presented and validated through comparison and stakeholder feedback.

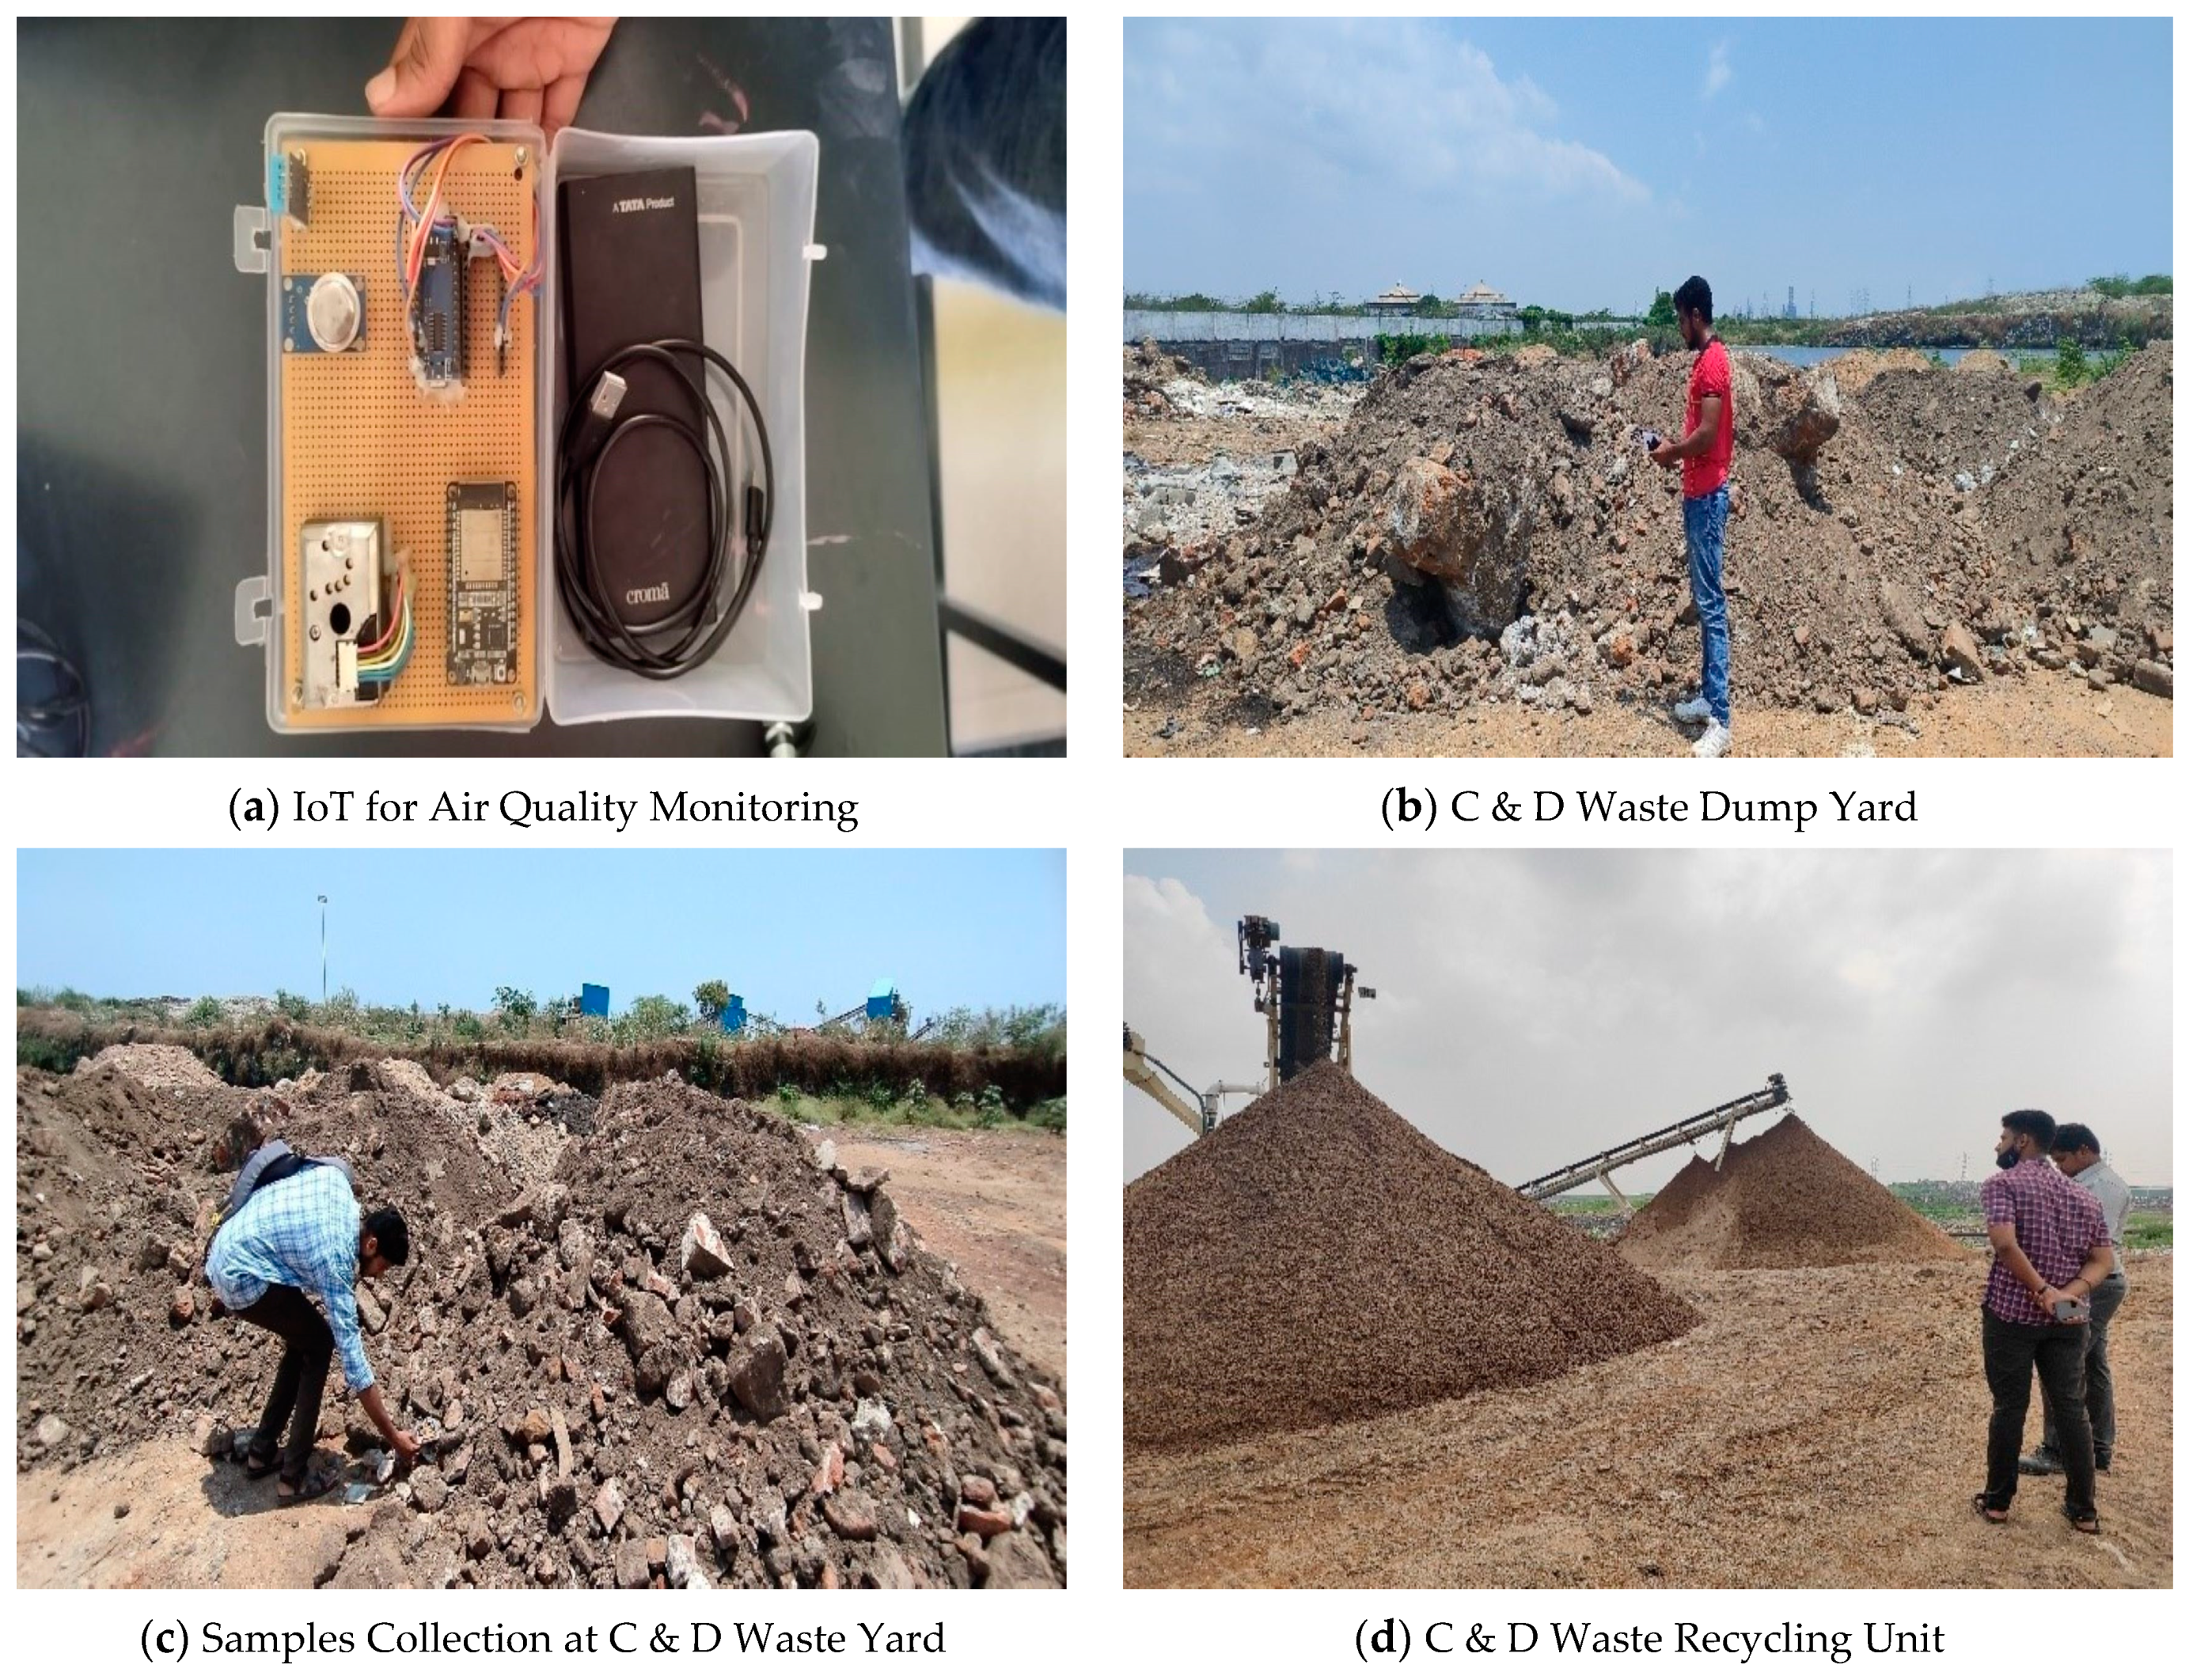
2.1. Study Area Details

The study focused on Chennai as the study area due to its rapid urban expansion, resulting in increased construction and demolition waste. The city has designated 15 locations for debris disposal, with one in each zone, to manage the waste effectively. Two recycling facilities have been established in Perungudi (12.951708 N, 80.22743 E) and Kodungaiyur (13.133518 N, 80.264139 E), to which all construction waste will be directed. Prior to recycling, the debris undergoes a meticulous process that includes magnetic separation and thorough manual inspection, ensuring they are free from hazardous materials, thereby mitigating any potential disasters. The magnetic separator effectively isolates all steel and other magnetic materials, while glass and wood components are meticulously removed. Only concrete rubble remains, which is carefully broken down into small stones using crushers and then transformed into aggregates through recycling. Debris from Zones 1–8 will be sent to Kodungaiyur, while debris from Zones 9–15 will be directed to Perungudi. Figure 2a represents the Kodungaiyur, and Figure 2b represents the Perungudi recycling unit with the measurement points, which is the study area of this research. These facilities have a combined capacity of 1200 tons. Despite these efforts, the general public often dumps debris in unoccupied plots and water bodies, causing contamination, as they are unaware of the designated disposal zones, according to the corporation.
To comprehensively understand the potential spread of contaminations in the study area, specific local climatic conditions play a critical role. Chennai’s climate is characterized by warm temperatures, with average highs ranging from 30 °C to 37 °C (86 °F to 98.6 °F) throughout the year [57]. The region experiences high humidity levels, averaging around 70% to 80% annually. Furthermore, Chennai is known for its distinct monsoon seasons [58]. The heavy rainfall during the monsoons can lead to the transport of contaminants from construction and demolition waste to nearby water bodies or low-lying areas, possibly causing water pollution. Moreover, wind direction and speed are crucial factors influencing contamination dispersal. The prevailing wind patterns in Chennai are predominantly from the northeast during the pre-monsoon and monsoon seasons, with average wind speeds of 10 to 15 km/h (6 to 9 mph). During the post-monsoon season, the wind direction shifts to be predominantly from the northwest, with slightly higher average wind speeds of 15 to 20 km/h (9 to 12 mph). These winds can carry dust and airborne contaminants from construction sites or open waste dumps, posing risks to nearby communities and air quality [59].

2.2. Processing Steps for Recycling

The raw debris gathered from illegal dumping areas and demolition sites undergoes transportation to recycling plants, where it is loaded directly into a hopper. From there, it is directed to a primary crusher equipped with fixed and movable plates. The debris undergoes crushing in a 1:5 ratio, resulting in smaller debris particles. Subsequently, the crushed debris is conveyed to a magnetic separator, which effectively separates any magnetic items from the concrete rubble. The concrete rubble is then processed further. Afterward, the debris moves through a secondary hopper, housing two crushers that reduce 500 mm particles to 100 mm and further crush 100 mm particles to 20 mm. The processed material is then subjected to a vibrator and screener machine, generating three output products with different aggregate sizes, including 20 mm, 12 mm, 8 mm, and smaller particles. Additionally, powered sand is mixed with water separately, producing two output products: M sand with a particle size of 0.4 mm and plaster sand with a particle size of 0.25 mm. To regulate the product type, a vertical shaft impactor (VSI) with a rotary drum is utilized, revolving at 1000 rpm. Adjusting the rpm facilitates control over the product type; higher rpm increases sand production, while lower rpm yields coarser aggregate products. The machine has a capacity of 100 tonnes per hour. It is noteworthy that while Perungudi boasts a larger capacity, the erection machinery used differs from that employed in Kodungaiyur. Nonetheless, both facilities adhere to the same processing procedures.

2.3. Data Collection

The methodology for this study involves both primary and secondary data collection methods. Primary data are collected through field surveys, observations, measurements, and interviews with stakeholders involved in the waste management process. Gas-detecting sensors such as MQ-131, MQ-135, and MQ-7 are used to detect CO2, NO2, SO2, and CO gases, while temperature/humidity sensors are used for measuring temperature and humidity levels; the image of this integrated IoT sensor is presented in Figure 3a. Water samples near dumping sites and recycling units are also collected for analysis in a laboratory to determine pollutant concentrations and their impact on water quality. The test stands were positioned in open environments to assess the impact. For the temperature/humidity sensors, advanced data loggers were employed to record temperature and humidity levels continuously throughout the data collection period. Water samples were collected from specific points near the dumping sites and recycling units, and strict protocols were followed during sampling to avoid cross-contamination. The water samples were analyzed in a laboratory using established scientific methods to determine pollutant concentrations accurately. Additionally, the impact of environmental factors, such as air temperature and sunlight exposure, on water quality measurements was considered and accounted for in the data analysis. The collection of data has been represented in Figure 3b–d. This primary data will be used to create a GIS-based model for optimizing transportation routes and waste management processes.
Secondary data are collected from published reports, scientific journals, and online databases related to waste management practices, environmental science, engineering, air and water quality, and GIS technologies. These secondary data are used to supplement the primary data and provide additional insights into the environmental impact of construction demolition waste on air and water quality. The use of GIS technologies is crucial in this study as it allows for accurate geospatial data representation and analysis. By utilizing a multi-source database and GIS tools, the study aims to bridge the gap between management and science, reduce expenses and labor, and evaluate the direct use value of ecosystem services in GIS-based methods.

2.4. Data Analysis

The integration of Internet of Things (IoT) technology in monitoring solid waste, water quality, and air quality has the potential to revolutionize the approach to construction and demolition waste (C&DW) management. IoT technology allows for data collection from different levels of dump yards, enabling the monitoring of waste accumulation at various layers for effective waste management. Additionally, IoT enables the creation of 3D models of landfills, facilitating the identification of areas with high debris accumulation for targeted interventions. Real-time data collection and transmission through IoT sensors are more efficient compared to manual methods, allowing for timely response to C&DW issues. Water and air quality maps generated using open-source QGIS software provide a graphical representation of pollutant levels, aiding in comprehensive environmental assessments, particularly for pollution originating from recycling sites. These technological advancements have the potential to greatly improve waste management practices and environmental monitoring in the study area.
QGIS, also known as Quantum GIS, is a free and open-source geographic information system (GIS) software used for analyzing, visualizing, and managing geospatial data. It is an excellent tool for our project as it provides the fastest and shortest route analysis, which can be helpful in optimizing the routing of collection trucks from dumping sites to recycling units. It also allows us to represent the spatial variation in air and water quality parameters around C&DW recycling sites, which is essential for assessing the environmental impact of C&DW. One of the salient features of QGIS is its user-friendly interface, which makes it easy to use for beginners and experts alike. Another feature is its cross-platform compatibility, which means it can be used on various operating systems, including Windows, Linux, and MacOS. Additionally, QGIS has an extensive range of plugins and tools that can be used for various GIS-related tasks, including spatial analysis, data visualization, and data editing.
As open-source software, QGIS is free to download, use, and modify, making it accessible to anyone who needs it, regardless of their budget. This feature makes it an excellent choice for small organizations or individuals who cannot afford expensive proprietary GIS software. QGIS is an excellent tool for our project as it provides a cost-effective solution for analyzing geospatial data and optimizing waste management systems. Its user-friendly interface and cross-platform compatibility make it easy to use, while its open-source nature makes it accessible to anyone who needs it.

3. Results and Discussions

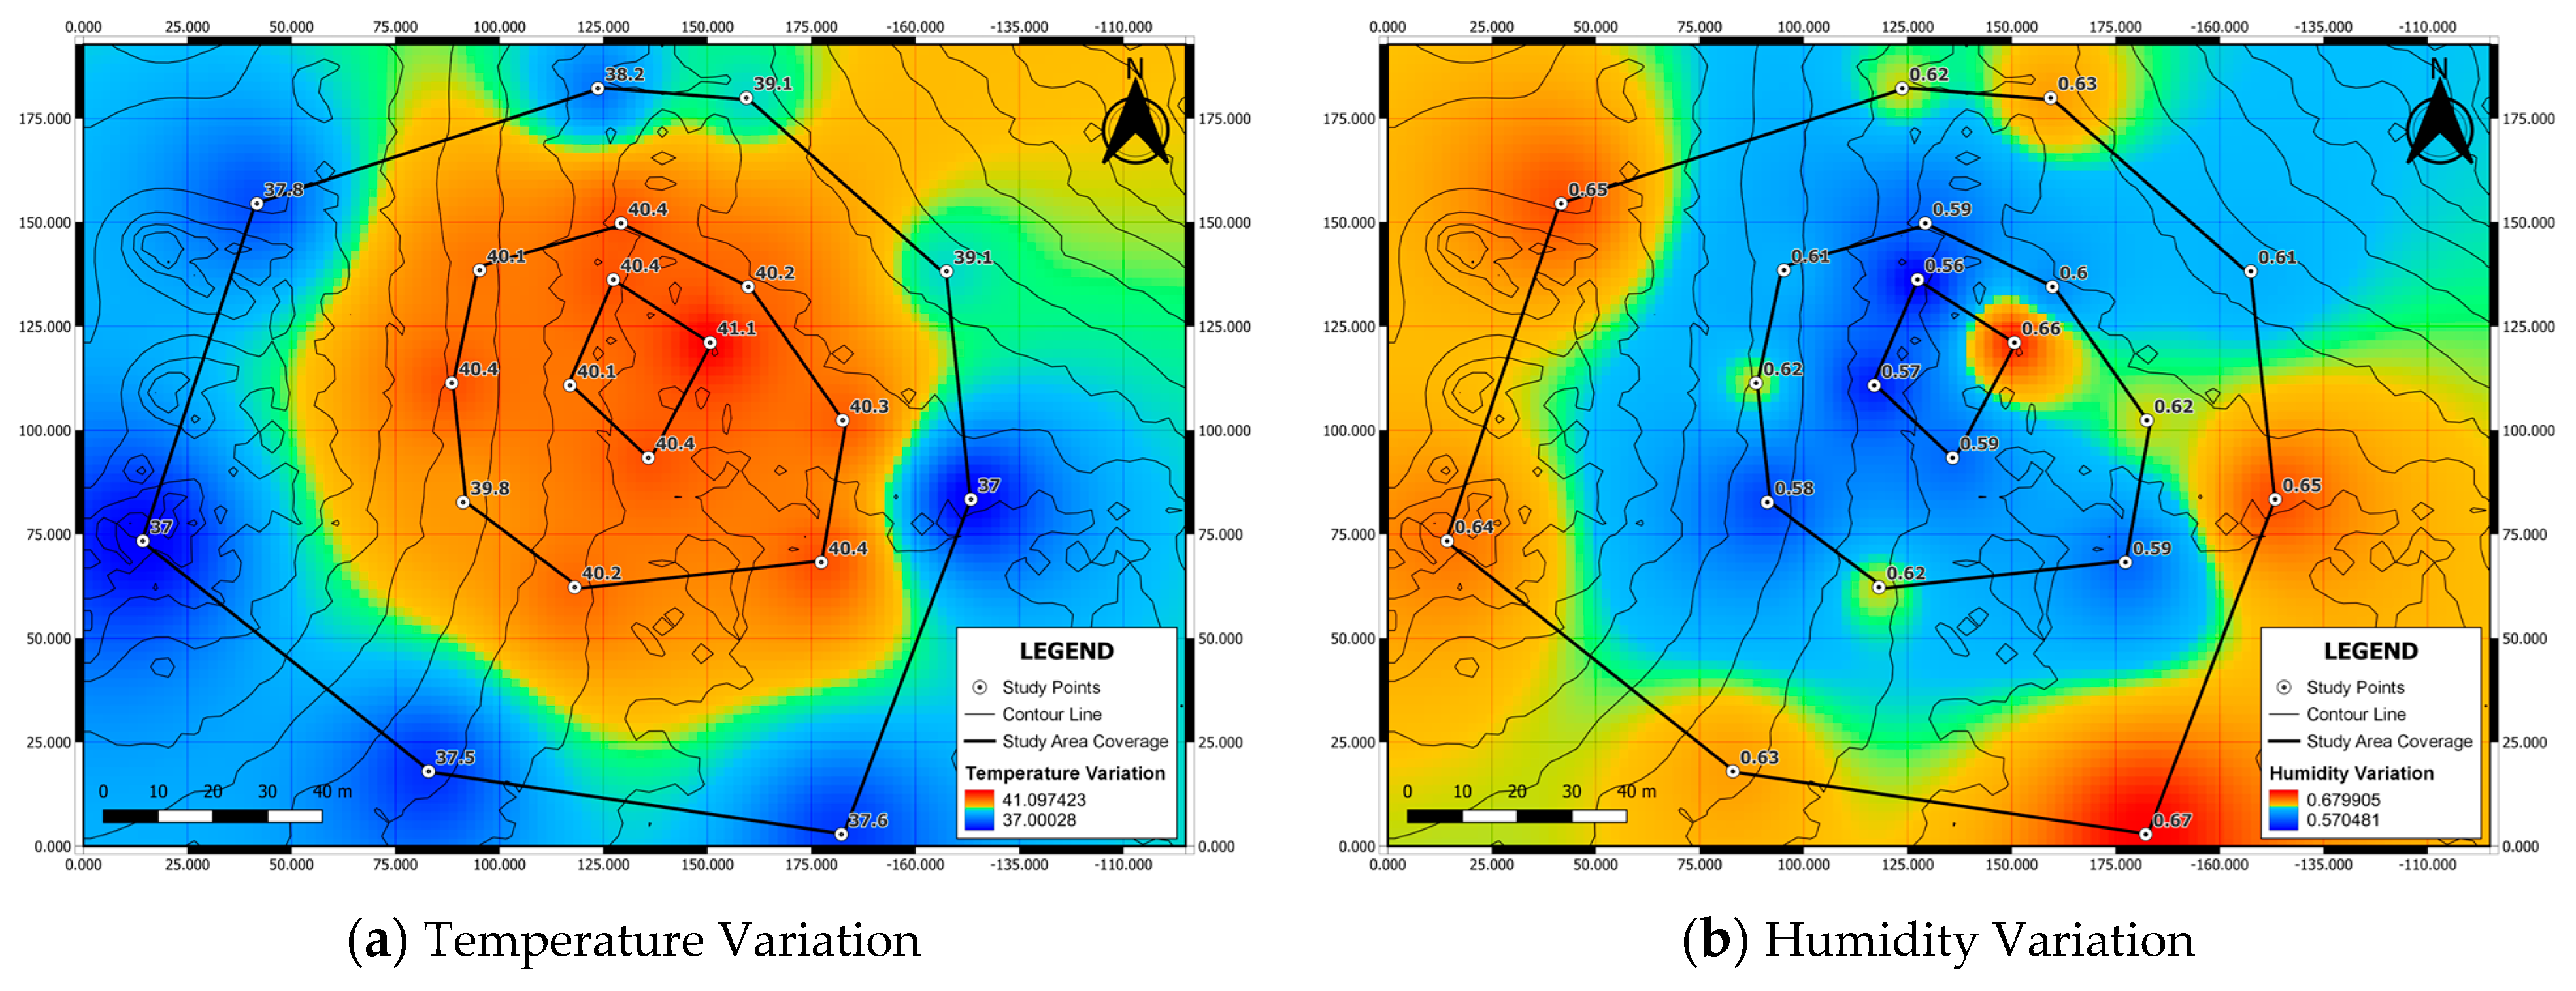
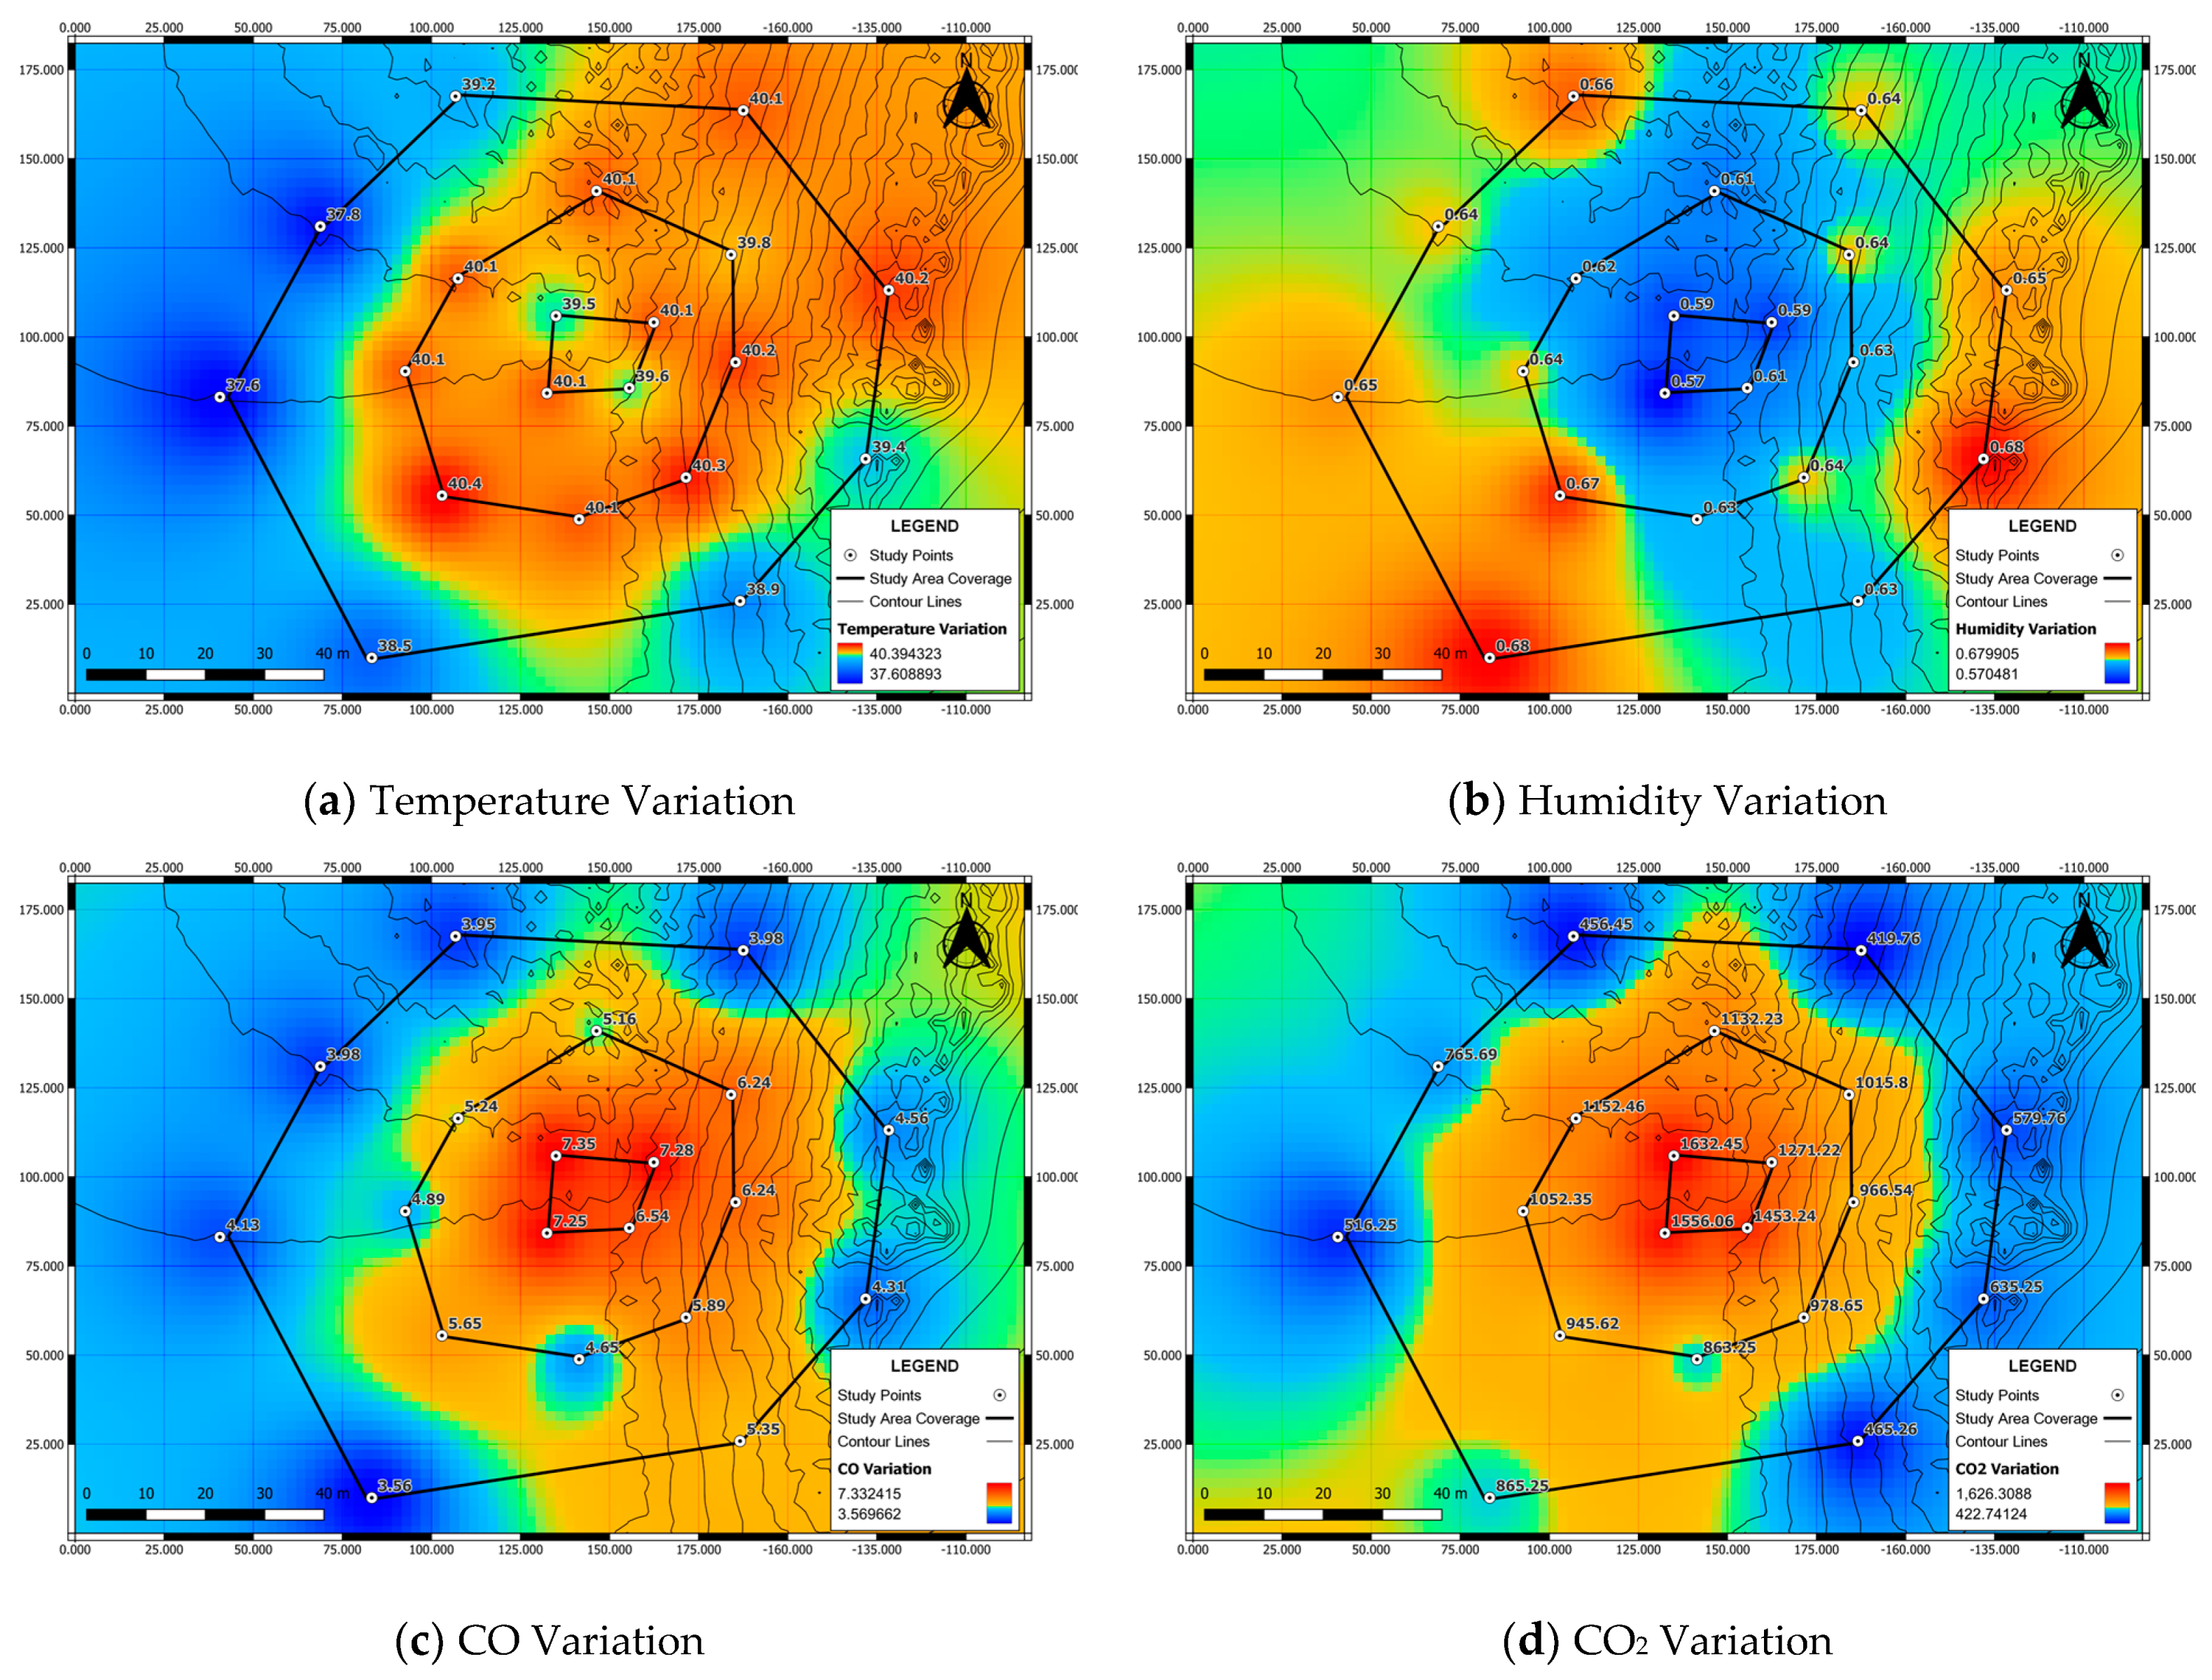
3.1. Spatial Variation in Air Quality Data

Construction and demolition (C&D) waste generated in Chennai, particularly in Kodungaiyur and Perungudi neighborhoods, contributes significantly to air pollution. The recycling processes of C&D waste, such as crushing, grinding, and sorting, can release harmful pollutants into the air, including dust particles that can cause respiratory problems. The presented maps are focused on critical values, with the additional inclusion of interpolated data for unsampled sites. Utilizing interpolation techniques, values were estimated based on available data points, ensuring a comprehensive representation of the entire study area, even in locations where direct measurements were not obtained. By incorporating interpolated values, the maps enhance spatial coverage and dataset completeness, providing valuable insights into the environmental impact of construction demolition waste across the study area. Burning of waste, sometimes carried out to dispose of difficult-to-recycle materials, can also release toxic chemicals and pollutants. Accumulation of C&D waste in illegal dumpsites can attract disease-carrying insects and rodents, further degrading air quality. Improved waste management practices are needed, including better regulation and enforcement of waste disposal laws, the establishment of recycling facilities with proper air pollution control measures, and public education campaigns for responsible waste disposal. Addressing these issues is crucial to mitigate the impact of C&D waste on air pollution and air quality in the Chennai region.

3.1.1. Around Kodungaiyur

Air quality data were collected from different locations near a debris recycling plant in Kodungaiyur. The data presented in Table 3 were collected from a total of 20 sampling points in the vicinity of a recycling plant. The first four points were located very near the plant, the next eight points were located around 10 m away, and the remaining eight points were located around 20 m away. The table contains several numerical parameters, including latitude and longitude coordinates, temperature, humidity, and concentrations of various chemicals in the air, such as carbon monoxide (CO), carbon dioxide (CO2), ammonia (NH4), toluene, and acetone.
The temperature at the sampling points ranged from 37 °C to 41.1 °C, with the highest temperatures being observed at the points closest to the recycling plant, which is represented in Figure 4a. The humidity levels varied between 0.56% and 0.67%, shown in Figure 4b, with the lowest humidity being recorded at point 2P7, located around 20 m away from the plant. The concentrations of CO, CO2, NH4, toluene, and acetone in the air were measured in parts per million (ppm). The highest concentrations of CO and CO2 were observed at point 1P2, located very near the recycling plant, with values of 7.49 ppm and 1656.06 ppm, respectively. The lowest concentrations of both gases were observed at point 3P1, located around 20 m away from the plant, with values of 2.3 ppm and 619.76 ppm, respectively, as shown in Figure 4c,d.
Figure 4e represents the concentration of NH4 ranging from 23.75 ppm to 54.77 ppm, with the highest value being observed at point 1P2 and the lowest value being observed at point 3P3, located around 20 m away from the plant. The concentration of toluene ranged from 23.75 ppm to 46.58 ppm, also presented in Figure 4f, with the highest value being observed at point 2P6, located around 10 m away from the plant, and the lowest value being observed at point 3P3. The concentration of acetone ranged from 17.63 ppm to 40.11 ppm, with the highest value being observed at point 1P2 and the lowest value being observed at point 2P5, located around 10 m away from the plant; this is presented in Figure 4g. The obtained values of various air quality parameters, such as temperature, humidity, and concentrations of pollutants including CO, CO2, NH4, Toluene, and Acetone, were compared to the permissible values in the environment [60]. According to the National Ambient Air Quality Standards (NAAQS) for India, the prescribed standard level for CO is 4 ppm. In our measurements, the CO levels ranged from 1.02 ppm to 7.49 ppm. For NO2, the NAAQS standard is 80 μg/m³, and our measurements recorded NH4 levels ranging from 419.76 μg/m³ to 1656.06 μg/m³. As for SO2, the prescribed standard is also 80 μg/m³, and our measurements ranged from 23.75 μg/m³ to 55.65 μg/m³. Toluene and Acetone levels were within the range of 1.52 μg/m³ to 8.31 μg/m³ and 17.63 μg/m³ to 40.11 μg/m³, respectively. By referencing these obtained values to the permissible limits, we can assess the level of air pollution in the study area and determine whether it complies with the prescribed standards to safeguard the well-being of the local population and the environment.
Overall, the data presented, provide valuable insights into the air quality in the vicinity of the recycling plant. The highest temperatures and chemical concentrations were observed at the points closest to the plant, while the lowest values were observed at the points furthest away. These findings suggest that the recycling plant may be a significant source of air pollution in the area and that measures should be taken to mitigate its impact on the environment and human health.

3.1.2. Around Perungudi

Table 4 provided in this research paper presents the results of air quality measurements at various distances from a recycling plant in Perungudi. The table contains three distinct sections, with each section representing a different distance from the recycling plant. The first section contains data for the four points closest to the recycling plant, with the subsequent sections containing data for points taken at distances of 10 m and 20 m away from the recycling plant, respectively. The table provides numeric values for several parameters, including latitude and longitude coordinates, temperature, humidity, and concentrations of various air pollutants such as CO, CO2, NH4, Toluene, and Acetone. The first column of the table provides the point name, with each point denoted by a unique identifier (P1, P2, P3, etc.). The second and third columns of the table provide the latitude and longitude coordinates of each measurement point, respectively.
The temperature and humidity values are provided in degrees Celsius and percentage, respectively, and their spatial distribution is represented in Figure 5a and Figure 5b, respectively. The temperature values for all points range between 38.5 °C and 40.4 °C, with an average temperature of 39.5 °C for the points closest to the recycling plant, 40.1 °C for points 10 m away, and 39.6 °C for points 20 m away. The humidity values for all points range between 0.57% and 0.68%, with an average humidity of 0.59% for points closest to the recycling plant, 0.62% for points 10 m away, and 0.65% for points 20 m away.
The table also provides concentrations of various air pollutants, including CO, CO2, NH4, Toluene, and Acetone. The concentrations of these pollutants are measured in parts per million (ppm) and milligrams per cubic meter (mg/m3). The CO concentrations for all points range between 3.56 ppm and 7.35 ppm, with an average of 6.36 ppm for points closest to the recycling plant, 5.24 ppm for points 10 m away, and 4.21 ppm for points 20 m away, shown in Figure 5c. The CO2 concentrations range between 419.76 mg/m3 and 1632.45 mg/m3, with an average of 1293.99 mg/m3 for points closest to the recycling plant, 974.89 mg/m3 for points 10 m away, and 583.55 mg/m3 for points 20 m away, which is represented in Figure 5d.
Figure 5e shows the NH4 concentrations range between 33.24 mg/m3 and 55.65 mg/m3, with an average of 48.78 mg/m3 for points closest to the recycling plant, 41.28 mg/m3 for points 10 m away, and 37.47 mg/m3 for points 20 m away. The Toluene concentrations range between 2.69 mg/m3 and 8.31 mg/m3, with an average of 6.19 mg/m3 for points closest to the recycling plant, 5.50 mg/m3 for points 10 m away, and 4.04 mg/m3 for points 20 m away, which is represented in Figure 5f. Finally, the Figure 5g shows the Acetone concentrations range between 23.56 mg/m3 and 39.65 mg/m3, with an average of 32.34 mg/m3 for points closest to the recycling plant, 30.33 mg/m3 for points 10 m away, and 26.76 mg/m3 for points 20 m away.
The obtained values of various air quality parameters, such as temperature (ranging from 37.6 °C to 40.4 °C) and humidity (ranging from 0.57 to 0.68), were compared to the permissible values set by the National Ambient Air Quality Standards (NAAQS) for India [61]. According to NAAQS, the prescribed standard level for CO is 4 ppm. In our measurements, the CO levels ranged from 3.56 ppm to 7.35 ppm. For NO2, the NAAQS standard is 80 μg/m³, and our measurements recorded NH4 levels ranging from 1000.77 μg/m³ to 1656.06 μg/m³. As for SO2, the prescribed standard is also 80 μg/m³, and our measurements ranged from 23.75 μg/m³ to 55.65 μg/m³. Toluene and Acetone levels were within the range of 2.69 μg/m³ to 8.31 μg/m³ and 17.63 μg/m³ to 39.65 μg/m³, respectively. By referencing these obtained values to the permissible limits, we can assess the compliance of the study area with NAAQS guidelines and evaluate potential environmental impacts and health implications associated with the observed air quality measurements.

3.2. Spatial Variation of Water Quality Data

Construction and demolition waste (C&DW) can contribute to water quality degradation through leaching. Leachate is a liquid that forms as water percolates through the waste, dissolving and carrying with it various pollutants and contaminants present in the waste. In the case of C&DW, these can include heavy metals, asbestos, plastics, oils, and chemicals from paints and other construction materials. Leachate from C&DW can infiltrate groundwater, streams, rivers, and other water bodies, polluting and degrading their quality. This can harm aquatic life and make water unsuitable for consumption and recreation. Additionally, leachate from C&DW can contaminate soil, potentially causing long-term environmental damage. To prevent leachate from C&DW from polluting water resources, proper waste management practices need to be implemented. This includes sorting waste at the source and ensuring that hazardous materials are not mixed with other waste. The waste should be stored in leak-proof containers and disposed of in designated landfills that have measures to prevent leachate from contaminating groundwater. By managing C&DW appropriately, we can prevent water quality degradation and protect our environment.

3.2.1. Around Kodungaiyur

Water quality data from four different locations in a specific area revealed significant spatial variation. Table 5 presents data on the horizontal variation in water quality around Kodungaiyur, a neighborhood in Chennai, India. The table includes four data points with latitude, longitude, and various water quality parameters such as temperature, TDS, DO, pH, and turbidity. The values for each parameter vary among the data points, indicating spatial variability in water quality. Parameters such as total dissolved solids (TDS), dissolved oxygen (DO), pH, and turbidity showed wide ranges, indicating variations in salinity, oxygen levels, acidity/alkalinity, and water clarity. Factors such as anthropogenic activities, natural processes, and hydrological factors likely contribute to the observed variations. Regular monitoring and implementation of appropriate measures are crucial for maintaining and improving water quality. This study provides valuable insights for developing effective water quality management strategies in the area.
The study found notable differences in water quality parameters, including temperature, TDS, DO, pH, and turbidity, among the four locations in the study area, which is presented in Figure 6. Temperature variation, which has been described in Figure 6a, ranges from 28 to 31 degrees Celsius. Figure 6b shows the TDS values variation ranging from 269.2 to 1347.66, indicating varying salinity levels. DO values showed negative values in one location, suggesting hypoxic or anoxic conditions, which is represented in Figure 6c. pH values ranged from 6.4 to 11, indicating acidic to alkaline water, shown in Figure 6d. Turbidity values, which are shown in Figure 6e, ranged from 0 to 335.53, indicating differences in water clarity. These findings highlight the need for regular monitoring and targeted management strategies to address the spatial variation in water quality and maintain the health of the local water resources.
The obtained values of various water quality parameters, including total dissolved solids (TDS), dissolved oxygen (DO), pH, and turbidity, were compared to the permissible values in the environment. According to established water quality standards, the acceptable range for TDS is typically below 500 ppm, and our measurements at locations 1, 2, 3, and 4 were 1347.66 ppm, 1347.66 ppm, 921.81 ppm, and 269.2 ppm, respectively. For DO, the standard range should be above 4 mg/L, but at location 1, we recorded a value of −29.69%, which indicates an anomaly or measurement error. At location 2, the DO value was 12.23%, which seems unusually high. The optimal pH range is usually between 6.5 and 8.5, and our measurements at locations 1, 2, 3, and 4 were 9.8, 9.8, 11, and 6.4, respectively. Lastly, turbidity should ideally be below 5 NTU, but at location 2, we recorded a value of 335.53 NTU, which indicates high water cloudiness. These results suggest potential concerns regarding water quality in the study area and warrant further investigation to address any environmental or human health implications.

3.2.2. Around Perungudi

Table 6 presents data on water quality collected from 8 different locations around the Perungudi Recycling Unit, focusing on parameters such as temperature, total dissolved solids (TDS), dissolved oxygen (DO), pH, and turbidity. Analysis of the data reveals spatial variability, with temperature presented in Figure 7a, ranging from 25 °C to 34.63 °C, and TDS from 349.51 mg/L to 1347.66 mg/L, which is shown in Figure 7b. In Figure 7c, variation in DO from −18.41 mg/L to 29.21 mg/L is presented, and Figure 7d,e present the variation range of pH from 6.51 to 11.8 and turbidity from 105.26 NTU to 425.63 NTU, respectively. High TDS and turbidity values at location 2 and location 1, respectively, indicate potential pollutant concentration. The low DO value at location 3 suggests poor water quality, while high pH values at all locations except location 5 suggest the presence of basic pollutants. The findings, presented in Table 6 and Figure 7, provide crucial information for developing pollution control strategies around the Perungudi Recycling Unit, highlighting the need for regular water quality monitoring in areas with construction and demolition waste debris to protect the environment and public health.
The obtained values of various water quality parameters, including temperature, total dissolved solids (TDS), dissolved oxygen (DO), pH, and turbidity, were compared to the permissible values in the environment. According to established water quality standards, the acceptable range for temperature varies based on the location and season, and our measurements at locations 1 to 8 ranged from 25 °C to 34.63 °C. The TDS levels recorded at locations 1 to 8 were in the range of 349.51 ppm to 1347.66 ppm, which exceeds the permissible limit of 500 ppm. For DO, the standard range should be above 4 mg/L, and while locations 1, 2, and 7 were within this range, locations 3, 4, and 6 recorded higher DO levels. The optimal pH range is usually between 6.5 and 8.5, and our measurements at locations 1 to 8 were slightly above this range, with values ranging from 6.51 to 11.8. Lastly, turbidity should ideally be below 5 NTU, and our measurements at locations 1 to 8 ranged from 105.26 NTU to 425.63 NTU, with some locations exceeding the permissible limit. These results suggest potential concerns regarding water quality in the study area, and further investigations are necessary to address any environmental or human health implications.

4. Conclusions

Evaluating the potential health risks associated with air pollution near the dump yard is important as the quantity of C&D waste is huge. Assessing the exposure levels of nearby residents, workers, and sensitive populations (such as children, the elderly, and individuals with respiratory conditions) to pollutants is necessary. Estimating the potential health impacts, including respiratory diseases, cardiovascular issues, and other related health effects, is necessary. Another important parameter is to assess the potential risks to human health from contaminated water sources. It is also important to identify the pathways of exposure, such as drinking water, recreational activities, or agricultural irrigation and determine the health risks associated with contaminants found in water samples. Regulatory Compliance: a. The compliance of the construction and demolition waste dump yard with relevant environmental regulations, such as waste management rules, air pollution control norms, and water quality standards, should be evaluated. b. The permits and licenses obtained by the dump yard operator should be reviewed, and their adherence to operating conditions should be assessed. c. Any violations or non-compliance issues should be identified, and the appropriate regulatory actions required should be determined.
Based on the air quality data presented, it is clear that the recycling plants in both Kodungaiyur and Perungudi neighborhoods are contributing significantly to air pollution. The data show that the highest temperatures and chemical concentrations were observed at the points closest to the plant, while the lowest values were observed at the points furthest away. For instance, in Kodungaiyur, the concentration of CO and CO2 were highest at point 1P2, located very near the recycling plant, with values of 7.49 ppm and 1656.06 ppm, respectively. The lowest concentrations of both gases were observed at point 3P1, located around 20 m away from the plant, with values of 2.3 ppm and 619.76 ppm, respectively. Similarly, in Perungudi, the average temperature and humidity values were highest for points closest to the recycling plant, while the concentrations of CO, CO2, NH4, Toluene, and Acetone were highest for points nearest to the plant. The findings of this study suggest that improved waste management practices are urgently needed, including better regulation and enforcement of waste disposal laws, the establishment of recycling facilities with proper air pollution control measures, and public education campaigns for responsible waste disposal.
In summary, the water quality data collected from the Perungudi Recycling Unit and Kodungaiyur area in Chennai, India, indicate a significant spatial variation in water quality parameters such as temperature, TDS, DO, pH, and turbidity. The TDS values ranged from 269.2 mg/L to 1347.66 mg/L, while pH values ranged from 6.4 to 11.8, indicating the water’s acidity or alkalinity. The DO values varied from negative values to 29.21 mg/L, and turbidity values ranged from 0 NTU to 425.63 NTU, indicating water clarity or cloudiness. The results suggest that factors, including natural and human activities, affect water quality in the study area, highlighting the importance of regular monitoring and appropriate management strategies to maintain and improve water quality.

Author Contributions

H.C. contributed to literature collection, problem identification, data collection and analysis, model development, and manuscript preparation. S.E.S. was involved in problem identification, data collection, and manuscript preparation. P.P. contributed to problem identification, data collection, data analysis, and the interpretation of results. M.S. contributed to data collection, analysis, and manuscript preparation. All authors have read and agreed to the published version of the manuscript.

Funding

This research received no external funding.

Institutional Review Board Statement

Not applicable.

Informed Consent Statement

Not applicable.

Data Availability Statement

Data will be made available on request.

Conflicts of Interest

The authors declare no conflict of interest.

References

  1. Suthar, G.; Babu, P. Municipal Solid Waste Management: Curren Approaches, Gaps and Solutions. Open Access Int. J. Sci. Eng. 2017, 2, 302–313. [Google Scholar]
  2. Xu, J.; Liu, Y.; Simi, A.; Zhang, J. Recycling and Reuse of Construction and Demolition Waste: From the Perspective of National Natural Science Foundation-Supported Research and Research-Driven Application. Case Stud. Constr. Mater. 2022, 16, e00876. [Google Scholar] [CrossRef]
  3. Sobotka, A.; Sagan, J. Decision Support System in Management of Concrete Demolition Waste. Autom. Constr. 2021, 128, 103734. [Google Scholar] [CrossRef]
  4. Ramadan, M.S.; Effat, H.A. Geospatial Modeling for a Sustainable Urban Development Zoning Map Using AHP in Ismailia Governorate, Egypt. Egypt. J. Remote Sens. Space Sci. 2021, 24, 191–202. [Google Scholar] [CrossRef]
  5. Peter, A.E.; Shiva Nagendra, S.M.; Nambi, I.M. Environmental Burden by an Open Dumpsite in Urban India. Waste Manag. 2019, 85, 151–163. [Google Scholar] [CrossRef]
  6. Chung, K.F.; Zhang, J.; Zhong, N. Outdoor Air Pollution and Respiratory Health in Asia. Respirology 2011, 16, 1023–1026. [Google Scholar] [CrossRef]
  7. Suman. Air Quality Indices: A Review of Methods to Interpret Air Quality Status. Mater. Today Proc. 2019, 34, 863–868. [Google Scholar] [CrossRef]
  8. Chen, J.; Yu, X.; Sun, F.; Lun, X.; Fu, Y.; Jia, G.; Zhang, Z.; Liu, X.; Mo, L.; Bi, H. The Concentrations and Reduction of Airborne Particulate Matter (PM10, PM2.5, PM1) at Shelterbelt Site in Beijing. Atmosphere 2015, 6, 650–676. [Google Scholar] [CrossRef]
  9. Van Hee, V.C.; Adar, S.D.; Szpiro, A.A.; Barr, R.G.; Bluemke, D.A.; Diez Roux, A.V.; Gill, E.A.; Sheppard, L.; Kaufman, J.D. Exposure to Traffic and Left Ventricular Mass and Function the Multi-Ethnic Study of Atherosclerosis. Am. J. Respir. Crit. Care Med. 2009, 179, 827–834. [Google Scholar] [CrossRef]
  10. Ghorani-Azam, A.; Riahi-Zanjani, B.; Balali-Mood, M. Effects of Air Pollution on Human Health and Practical Measures for Prevention in Iran. J. Res. Med. Sci. 2016, 21, 65. [Google Scholar] [CrossRef]
  11. Dhimal, M.; Chirico, F.; Bista, B.; Sharma, S.; Chalise, B.; Dhimal, M.L.; Ilesanmi, O.S.; Trucillo, P.; Sofia, D. Impact of Air Pollution on Global Burden of Disease in 2019. Processes 2021, 9, 1719. [Google Scholar] [CrossRef]
  12. Organización Mundial de la Salud (OMS). WHO Global Air Quality Guidelines. Coast. Estuar. Process. 2021, pp. 1–360. Available online: https://apps.who.int/iris/handle/10665/345329 (accessed on 4 July 2023).
  13. Scheller, J.H.; Mastepanov, M.; Christensen, T.R. Toward UAV-Based Methane Emission Mapping of Arctic Terrestrial Ecosystems. Sci. Total Environ. 2022, 819, 153161. [Google Scholar] [CrossRef] [PubMed]
  14. Akbari, M.; Zahmatkesh, H.; Eftekhari, M. A GIS-Based System for Real-Time Air Pollution Monitoring and Alerting Based on Ogc Sensors Web Enablement Standards. Pollution 2021, 7, 25–41. [Google Scholar] [CrossRef]
  15. Lin, Y.-P.; Mukhtar, H.; Huang, K.-T.; Petway, J.R.; Lin, C.-M.; Chou, C.-F.; Liao, S.-W. Real-Time Identification of Irrigation Water Pollution Sources and Pathways with a Wireless Sensor Network and Blockchain Framework. Sensors 2020, 20, 3634. [Google Scholar] [CrossRef] [PubMed]
  16. Kawalec, J.; Kwiecien, S.; Pilipenko, A.; Rybak, J. Application of Crushed Concrete in Geotechnical Engineering—Selected Issues. IOP Conf. Ser. Earth Environ. Sci. 2017, 95, 022057. [Google Scholar] [CrossRef]
  17. Kongar-Syuryun, C.; Tyulyaeva, Y.; Khairutdinov, A.M.; Kowalik, T. Industrial Waste in Concrete Mixtures for Construction of Underground Structures and Minerals Extraction. IOP Conf. Ser. Mater. Sci. Eng. 2020, 869, 032004. [Google Scholar] [CrossRef]
  18. Jońca, J.; Pawnuk, M.; Bezyk, Y.; Arsen, A.; Sówka, I. Drone-Assisted Monitoring of Atmospheric Pollution—A Comprehensive Review. Sustainability 2022, 14, 1516. [Google Scholar] [CrossRef]
  19. Nair, A.T.; Senthilnathan, J.; Nagendra, S.M.S. Emerging Perspectives on VOC Emissions from Landfill Sites: Impact on Tropospheric Chemistry and Local Air Quality. Process Saf. Environ. Prot. 2019, 121, 143–154. [Google Scholar] [CrossRef]
  20. Kabirifar, K.; Mojtahedi, M.; Changxin Wang, C.; Tam, V.W.Y. Effective Construction and Demolition Waste Management Assessment through Waste Management Hierarchy; a Case of Australian Large Construction Companies. J. Clean. Prod. 2021, 312, 127790. [Google Scholar] [CrossRef]
  21. Kabirifar, K.; Mojtahedi, M.; Wang, C.; Tam, V.W.Y. Construction and Demolition Waste Management Contributing Factors Coupled with Reduce, Reuse, and Recycle Strategies for Effective Waste Management: A Review. J. Clean. Prod. 2020, 525, 121265. [Google Scholar] [CrossRef]
  22. Ghaffar, S.H.; Burman, M.; Braimah, N. Pathways to Circular Construction: An Integrated Management of Construction and Demolition Waste for Resource Recovery. J. Clean. Prod. 2020, 244, 118710. [Google Scholar] [CrossRef]
  23. Sate, A. Studies on the Status of Air Pollution Level from Dumpsites in Jimeta, Adamawa State, Nigeria. Niger. J. Eng. Sci. Technol. Res. 2021, 7, 103–111. [Google Scholar]
  24. Enigella, S.R.; Shahnasser, H. Real Time Air Quality Monitoring. In Proceedings of the 2018 10th International Conference on Knowledge and Smart Technology (KST), Chiang Mai, Thailand, 31 January–3 February 2018; pp. 182–185. [Google Scholar] [CrossRef]
  25. Li, X.; Peng, L.; Hu, Y.; Shao, J.; Chi, T. Deep Learning Architecture for Air Quality Predictions. Environ. Sci. Pollut. Res. 2016, 23, 22408–22417. [Google Scholar] [CrossRef]
  26. Bui, T.-C.; Le, V.-D.; Cha, S.-K. A Deep Learning Approach for Forecasting Air Pollution in South Korea Using LSTM. arXiv 2018, arXiv:1804.07891. [Google Scholar]
  27. Reddy, V.; Yedavalli, P.; Mohanty, S. Deep Air: Forecasting Air Pollution in Beijing, China. Environ. Sci. 2018. Available online: https://www.ischool.berkeley.edu/sites/default/files/sproject_attachments/deep-air-forecasting_final.pdf (accessed on 4 July 2023).
  28. Duangsuwan, S.; Prapruetdee, P.; Subongkod, M.; Klubsuwan, K. 3D AQI Mapping Data Assessment of Low-Altitude Drone Real-Time Air Pollution Monitoring. Drones 2022, 6, 191. [Google Scholar] [CrossRef]
  29. Wyard, C.; Beaumont, B.; Grippa, T.; Hallot, E. UAV-Based Landfill Land Cover Mapping: Optimizing Data Acquisition and Open-Source Processing Protocols. Drones 2022, 6, 123. [Google Scholar] [CrossRef]
  30. Pochwała, S.; Gardecki, A.; Lewandowski, P.; Somogyi, V.; Anweiler, S. Developing of Low-Cost Air Pollution Sensor—Measurements with the Unmanned Aerial Vehicles in Poland. Sensors 2020, 20, 3582. [Google Scholar] [CrossRef] [PubMed]
  31. Järvi, L.; Kurppa, M.; Kuuluvainen, H.; Rönkkö, T.; Karttunen, S.; Balling, A.; Timonen, H.; Niemi, J.V.; Pirjola, L. Determinants of Spatial Variability of Air Pollutant Concentrations in a Street Canyon Network Measured Using a Mobile Laboratory and a Drone. Sci. Total Environ. 2023, 856, 158974. [Google Scholar] [CrossRef]
  32. Al-Alola, S.S.; Alkadi, I.I.; Alogayell, H.M.; Mohamed, S.A.; Ismail, I.Y. Air Quality Estimation Using Remote Sensing and GIS-Spatial Technologies along Al-Shamal Train Pathway, Al-Qurayyat City in Saudi Arabia. Environ. Sustain. Indic. 2022, 15, 100184. [Google Scholar] [CrossRef]
  33. Iodice, S.; Garbarino, E.; Cerreta, M.; Tonini, D. Sustainability Assessment of Construction and Demolition Waste Management Applied to an Italian Case. Waste Manag. 2021, 128, 83–98. [Google Scholar] [CrossRef]
  34. Negash, Y.T.; Hassan, A.M.; Tseng, M.L.; Wu, K.J.; Ali, M.H. Sustainable Construction and Demolition Waste Management in Somaliland: Regulatory Barriers Lead to Technical and Environmental Barriers. J. Clean. Prod. 2021, 297, 126717. [Google Scholar] [CrossRef]
  35. Sun, X.; Luo, X.S.; Xu, J.; Zhao, Z.; Chen, Y.; Wu, L.; Chen, Q.; Zhang, D. Spatio-Temporal Variations and Factors of a Provincial PM 2.5 Pollution in Eastern China during 2013–2017 by Geostatistics. Sci. Rep. 2019, 9, 3613. [Google Scholar] [CrossRef] [PubMed]
  36. Normohammadi, M.; Kakooei, H.; Omidi, L.; Yari, S.; Alimi, R. Risk Assessment of Exposure to Silica Dust in Building Demolition Sites. Saf. Health Work 2016, 7, 251–255. [Google Scholar] [CrossRef]
  37. Cheng, C.W.; Sheu, G.T.; Chou, J.S.; Wang, P.H.; Cheng, Y.C.; Lai, C.Y. Fine Particulate Matter PM2.5 Generated by Building Demolition Increases the Malignancy of Breast Cancer MDA-MB-231 Cells. Chemosphere 2021, 265, 129028. [Google Scholar] [CrossRef] [PubMed]
  38. Azarmi, F.; Kumar, P. Ambient Exposure to Coarse and Fine Particle Emissions from Building Demolition. Atmos. Environ. 2016, 137, 62–79. [Google Scholar] [CrossRef]
  39. Demetriou, D.; Mavromatidis, P.; Robert, P.M.; Papadopoulos, H.; Petrou, M.F.; Nicolaides, D. Real-Time Construction Demolition Waste Detection Using State-of-the-Art Deep Learning Methods; Single–Stage vs. Two-Stage Detectors. Waste Manag. 2023, 167, 194–203. [Google Scholar] [CrossRef] [PubMed]
  40. Caragnano, G.; Ciccia, S.; Bertone, F.; Varavallo, G.; Terzo, O.; Capello, D.; Brajon, A. Unmanned Aerial Vehicle Platform Based on Low-Power Components and Environmental Sensors: Technical Description and Data Analysis on Real-Time Monitoring of Air Pollutants. In Proceedings of the 2020 IEEE 7th International Workshop on Metrology for AeroSpace (MetroAeroSpace), Pisa, Italy, 22–24 June 2020; 550–554. [Google Scholar] [CrossRef]
  41. Venugopal, T.; Giridharan, L.; Jayaprakash, M.; Periakali, P. Environmental Impact Assessment and Seasonal Variation Study of the Groundwater in the Vicinity of River Adyar, Chennai, India. Environ. Monit. Assess. 2009, 149, 81–97. [Google Scholar] [CrossRef]
  42. Seror, N.; Portnov, B.A. Identifying Areas under Potential Risk of Illegal Construction and Demolition Waste Dumping Using GIS Tools. Waste Manag. 2018, 75, 22–29. [Google Scholar] [CrossRef]
  43. Townsend, T.G.; Jang, Y.; Thurn, L.G. Simulation of Construction and Demolition Waste Leachate. J. Environ. Eng. 1999, 125, 1071–1081. [Google Scholar] [CrossRef]
  44. Tasaki, T.; Kawahata, T.; Osako, M.; Matsui, Y.; Takagishi, S.; Morita, A.; Akishima, S. A GIS-Based Zoning of Illegal Dumping Potential for Efficient Surveillance. Waste Manag. 2007, 27, 256–267. [Google Scholar] [CrossRef]
  45. Tinnevelt, G.H.; Lushchikova, O.; Augustijn, D.; Lochs, M.; Geertsma, R.W.; Rijkeboer, M.; Kools, H.; Dubelaar, G.; Veen, A.; Buydens, L.M.C.; et al. Water Quality Monitoring Based on Chemometric Analysis of High-Resolution Phytoplankton Data Measured with Flow Cytometry. Environ. Int. 2022, 170, 107587. [Google Scholar] [CrossRef]
  46. Islam, M.S.; Nakagawa, K.; Abdullah-Al-mamun, M.; Khan, A.S.; Goni, M.A.; Berndtsson, R. Spatial Distribution and Source Identification of Water Quality Parameters of an Industrial Seaport Riverbank Area in Bangladesh. Water 2022, 14, 1356. [Google Scholar] [CrossRef]
  47. Lyons, K.J.; Ikonen, J.; Hokajärvi, A.M.; Räsänen, T.; Pitkänen, T.; Kauppinen, A.; Kujala, K.; Rossi, P.M.; Miettinen, I.T. Monitoring Groundwater Quality with Real-Time Data, Stable Water Isotopes, and Microbial Community Analysis: A Comparison with Conventional Methods. Sci. Total Environ. 2023, 864, 161199. [Google Scholar] [CrossRef]
  48. Yadav, K.K.; Gupta, N.; Kumar, V.; Choudhary, P.; Khan, S.A. GIS-Based Evaluation of Groundwater Geochemistry and Statistical Determination of the Fate of Contaminants in Shallow Aquifers from Different Functional Areas of Agra City, India: Levels and Spatial Distributions. RSC Adv. 2018, 8, 15876–15889. [Google Scholar] [CrossRef] [PubMed]
  49. Chen, M.; Lu, G.; Wu, J.; Yang, C.; Niu, X.; Tao, X.; Shi, Z.; Yi, X.; Dang, Z. Migration and Fate of Metallic Elements in a Waste Mud Impoundment and Affected River Downstream: A Case Study in Dabaoshan Mine, South China. Ecotoxicol. Environ. Saf. 2018, 164, 474–483. [Google Scholar] [CrossRef]
  50. Prasanna, K.; Annadurai, R. Study on Ground Water Quality in and around Perungudi Solid Waste Dumping Site in Chennai. Rasayan J. Chem. 2016, 9, 287–293. [Google Scholar]
  51. Yao, X.; Cao, Y.; Zheng, G.; Devlin, A.T.; Yu, B.; Hou, X.; Tang, S.; Xu, L.; Lu, Y. Use of Life Cycle Assessment and Water Quality Analysis to Evaluate the Environmental Impacts of the Bioremediation of Polluted Water. Sci. Total Environ. 2021, 761, 143260. [Google Scholar] [CrossRef] [PubMed]
  52. Su, S.; Li, S.; Ju, J.; Wang, Q.; Xu, Z. A Building Information Modeling-Based Tool for Estimating Building Demolition Waste and Evaluating Its Environmental Impacts. Waste Manag. 2021, 134, 159–169. [Google Scholar] [CrossRef] [PubMed]
  53. Joseph, L.; Jun, B.M.; Flora, J.R.V.; Park, C.M.; Yoon, Y. Removal of Heavy Metals from Water Sources in the Developing World Using Low-Cost Materials: A Review. Chemosphere 2019, 229, 142–159. [Google Scholar] [CrossRef]
  54. Diviacco, P.; Iurcev, M.; Carbajales, R.J.; Potleca, N.; Viola, A.; Burca, M.; Busato, A. Monitoring Air Quality in Urban Areas Using a Vehicle Sensor Network (VSN) Crowdsensing Paradigm. Remote Sens. 2022, 14, 5576. [Google Scholar] [CrossRef]
  55. Wang, H.; Pan, X.; Zhang, S. Spatial Autocorrelation, Influencing Factors and Temporal Distribution of the Construction and Demolition Waste Disposal Industry. Waste Manag. 2021, 127, 158–167. [Google Scholar] [CrossRef] [PubMed]
  56. Cynthia, J.; Saroja, M.N.; Sultana, P.; Senthil, J. IoT-Based Real Time Air Pollution Monitoring System. Int. J. Grid High Perform. Comput. 2019, 11, 28–41. [Google Scholar] [CrossRef]
  57. García Sánchez, F.; Govindarajulu, D. Integrating Blue-Green Infrastructure in Urban Planning for Climate Adaptation: Lessons from Chennai and Kochi, India. Land Use policy 2023, 124, 106455. [Google Scholar] [CrossRef]
  58. Lincoln, S.; Chowdhury, P.; Posen, P.E.; Robin, R.S.; Ramachandran, P.; Ajith, N.; Harrod, O.; Hoehn, D.; Harrod, R.; Townhill, B.L. Interaction of Climate Change and Marine Pollution in Southern India: Implications for Coastal Zone Management Practices and Policies. Sci. Total Environ. 2023, 902, 110518. [Google Scholar] [CrossRef]
  59. Mishra, P.; Begum, M.; Gera, A.; Kumar, B.C.; Deviram, G.; Pradhan, U.K.; Vashi, A.; Bandyopadhyay, D.; Naik, S.; Panda, U.S.; et al. Factors Responsible for the Sudden Outburst of Noctiluca Scintillans in the Chennai Coastal Waters, Southeast Coast of India—A Case Study. Oceanologia 2022, 64, 781–788. [Google Scholar] [CrossRef]
  60. Purohit, P.; Amann, M.; Kiesewetter, G.; Rafaj, P.; Chaturvedi, V.; Dholakia, H.H.; Koti, P.N.; Klimont, Z.; Borken-Kleefeld, J.; Gomez-Sanabria, A.; et al. Mitigation Pathways towards National Ambient Air Quality Standards in India. Environ. Int. 2019, 133, 105147. [Google Scholar] [CrossRef]
  61. Ammasi Krishnan, M.; Jawahar, K.; Perumal, V.; Devaraj, T.; Thanarasu, A.; Kubendran, D.; Sivanesan, S. Effects of Ambient Air Pollution on Respiratory and Eye Illness in Population Living in Kodungaiyur, Chennai. Atmos. Environ. 2019, 203, 166–171. [Google Scholar] [CrossRef]
Figure 1. Methodology Flow chart.
Sustainability 15 13013 g001
Figure 2. Study Area Identification.
Sustainability 15 13013 g002
Figure 3. Data Collecting Sensor and Data collection method.
Sustainability 15 13013 g003
Figure 4. Various Air quality variation maps around Kodungaiyur.
Sustainability 15 13013 g004aSustainability 15 13013 g004b
Figure 5. Various Air quality variation maps around Perungudi.
Sustainability 15 13013 g005aSustainability 15 13013 g005b
Figure 6. Various Water quality variation maps around Kodungaiyur.
Sustainability 15 13013 g006
Figure 7. Various Water quality variation maps around Perungudi.
Sustainability 15 13013 g007
Table 1. Research Related to Air Quality.
TitleAuthorYearLocationMethod/
Technique
TechnologyParameterRange
Studies on the status of air pollution level from dumpsites in Jimeta, Adamawa State, NigeraBurmama, B.R., and Hong, A.H. Ref. [23]2021Jimeta, Adamawa State, NigeraNilAir monitoring device CROWNCON [Tetra 3]CO0.013–0.093 ppm
NO232.0–37.0 ppm
SO20.015–23.0 ppm
Real time air quality monitoringEnigella S.R., and Shahnasser, H. Ref. [24] 2017San FranciscoNilR programming, Gas sensor, AQICDAQI59 (moderate)
Deep learning Architecture for air quality predictionsPeng, X., Li. L. Hu, Y.J., Shao, J. and Chi, T. Ref. [25]2016Beijing city, ChinaDeep learning, TEOM methodStacked autoencoder model and Thermo fisher 1405 F detectorPM 2.572.37–92.47 ppm
Deep learning approach for forecasting air pollution is south Korea using LSTMBui, T.C., Le, V.D., and Cha, S.K. Ref. [26]2018South KoreaDeep LearningLong short-term memory (LSTM)AQI (PM 2.5)100–150
Deep air: Forecasting air pollution in Beijing, ChinaReddy, R., Yedavalli, P., and Mohanty, S. Ref. [27]2017Beijing city, ChinaDeep LearningLSTM, Persistent model baselineRSME R20.749–0.513
3D AQI mapping data, Assessment of Low-Altitude drone: Real time air pollution monitoringDuangsuwan, S., Prapruetdee, P. and Subanytod, M. Ref. [28] 2022ThailandDronesBack propagation neural network (BPNN), Convolutional Neural Network (CNN)PM 2.518–90 ug/m3
UAV based landfill land cover mapping: Optimizing data Acquistion and open-source processing protocolWyard, C., Beaumont, B., Grippa, T., and Hallot, E. Ref. [29]2022Hallembuge (Wallonia, Belgium) NilDrones, Low-cost green–blue sensorsNilNil
Developing of low-cost air pollution sensor: Measurement with the unmanned aerial vehicle in PolandPochwala, S., Gardecki, A., Lewandowski, P., Somogyi, V., and Anweilder, S. Ref. [30]2020PolandUAV, wireless transmission, cloudPM 57003PM 2.5 & PM 10, PM 1.00–1000 ug/m3
Determinants of spatial variability air pollutant concentrations in a street canyon network measured using a mobile laboratory and a droneJarvi, L., et al.
Ref. [31]
2022Helsinki, FinlandSpatial variability of air pollutantsUAV, mobile droneLDSA73.3 +/− 23.7
O319.1 +/− 7.7
Table 2. Research Related to Water Quality.
TitleAuthorYearLocationMethod/TechniqueTechnologySourceParametersRange
Water Quality Monitoring based on Chemometric Analysis of High-Resolution Phytoplankton Data measured with flow CytometryTinnevelt, G.H., et al. Ref. [45]2022Meuse River, the NetherlandsWith the help of PhytoplanktonCytosense flow Cytometer, SIVEGOMRiver WaterNitrate (No3)540 nm
Spatial Distribution and Source Identification of Water Quality Parameters of an Industrial Seaport Riverbank Area in BangladeshIslam, M.S., Nakagawa, K.,Abdullah-al-Mamun, M., Khan, A.S., Goni, M.A., Ref. [46]2022Pasur river, BangladeshMultivariate Statistical methodGeospatial AnalysisRiver waterTSS363.2–1482.7 mg/L
Fe108.2–709.93 mg/L
Mn0.19 to 1.41 mg/L
Monitoring Groundwater quality with real time data, stable water isotopes and microbial community analysis: A comparison with conventional methodsLynos, K.J., et al., Ref. [47]2022FinlandReal-time online monitoring, Periodic analysis of water isotopesNilGroundwaterPh5.48–6.46
DO5.8–12.65
Turbidity0.01–0.19
GIS- based evaluation of groundwater geo-chemistry & statistical determination of the fate of contaminants in shallow aquifers from different functional areas of Agra cityYadav, K.K., Gupta, N., and Kumar, V. Ref. [48]2018Agra city, IndiaARC-GISNilGroundwaterPh6.99–7.86
Turbidity2.11–23.43 NTU
Migration and fate of metallic elements in a waste mud impoundment and affected river downstreamChen, M., et al. Ref. [49]2018Dabaoshan Mine, South ChinaNilYSI556 MPS, Hanna HI93703-11, Hanna HI8733, PHREEQCPolluted River waterPh2.8–6.19
Temperature23–26.8 °C
DO2.73–6.20
Study on Ground water quality in and around Perungudi solid waste dumping site in ChennaiPrasanna, K., Annadurai, R., Ref. [50]2016Perungudi, Chennai, IndiaNilAtomic Absorption Spectrometer (AAS)GroundwaterPh5.5–8.5
Turbidity3.5 NTU
TSS300 mg/L
TDS1010 mg/L
Real Time Identification of Irrigation water pollution sources and Pathways with a wireless sensor network & blockchain FrameworkLin, L.P., Mukhtar H., Huang, K.T., Petway, J.R., Lin, C.M., Chou, C.F., Liao, S.W., Ref. [15]2020Taoyuan City, Taiwan, ChinaBackward pollution source Tracing (BPST)IOT, Blockchain Technology, WSN and GIS, Modern water OVA 7000Irrigation waterCu0.596–0.209 ppm
Use of life cycle assessment and water quality analysis to evaluate the environmental impacts of the Bio-remediation of polluted waterYao, X., et al. Ref. [51]2020Yangtze river, East China SeaLCA and water quality Analysis (chemical analysis)NilRiverConstruction Wetlands24.1%
CEFB40.6%
EFB35.3%
Table 3. Horizontal Variation in Air Quality around Kodungaiyur.
S. NoLatitudeLongitudeTemperatureHumidityCOCO2NH4TolueneAcetone
1P113.13372180.26408940.40.567.451532.4553.467.3635.45
1P213.13361580.26425241.10.667.491656.0654.778.3140.11
1P313.13342180.26414840.40.596.561000.7753.464.4531.75
1P413.13354380.26401640.10.576.11271.2243.195.9939.08
2P113.13373780.26386440.10.616.31152.3239.836.6725.81
2P213.13381680.26410240.40.595.11054.6543.195.9929.08
2P313.13370980.26431640.20.66.2965.2533.584.9824.65
2P413.13348480.26447540.30.625.5842.0534.835.6725.81
2P513.13324580.26443940.40.596.1842.0532.584.6529.63
2P613.13320380.26402440.20.624.9863.2546.585.6717.63
2P713.13334680.26383639.80.583.6945.6236.583.631.25
2P813.13354780.26381740.40.624.8984.3539.394.5829.54
3P113.13404380.26406338.20.622.3619.7635.543.9819.56
3P213.13402780.26431339.10.632.7419.7626.292.5229.45
3P313.13373580.2646539.10.612.7579.7623.754.2517.56
3P413.13335180.264691370.651.02419.7625.491.5227.56
3P513.13278780.26447337.60.672.1679.7638.253.5825.65
3P613.13289380.26377837.50.632.3765.5436.453.2424.56
3P713.13328180.263297370.641.02419.7628.351.5223.68
3P813.13384980.26348937.80.652.8865.4429.673.7827.56
Table 4. Horizontal Variation in Air Quality around Perungudi.
S. NoLatitudeLongitudeTemperatureHumidityCOCO2NH4TolueneAcetone
1P112.95177780.22739139.50.597.351632.4552.368.1235.45
1P212.95165780.22737740.10.577.251556.0653.458.3139.65
1P312.95166580.22750539.60.616.541453.2455.657.5630.56
1P412.95176780.22754340.10.597.281271.2249.656.5235.54
2P112.95183580.22723940.10.625.241152.4648.566.6733.24
2P212.95197180.22745440.10.615.161132.2343.196.0232.56
2P312.95187280.22766339.80.646.241015.845.655.9829.87
2P412.95170580.2276740.20.636.24966.5439.455.6728.54
2P512.95152680.22759340.30.645.89978.6537.564.6529.63
2P612.95146180.22742740.10.634.65863.2545.686.0225.65
2P712.95149880.22721440.40.675.65945.6242.354.6530.54
2P812.95169180.22715740.10.644.891052.3541.256.5229.89
3P112.95211880.22723539.20.663.95456.4539.654.5628.65
3P212.95209680.22768240.10.643.98419.7638.565.6227.45
3P312.95181780.22790840.20.654.56579.7635.625.3226.54
3P412.95155580.22787239.40.684.31635.2545.653.5424.54
3P512.95133480.22767738.90.635.35465.2638.252.6924.56
3P612.95124680.22710538.50.683.56865.2537.563.5623.56
3P712.95165180.22686937.60.654.13516.2535.242.9828.65
3P812.95191680.22702537.80.643.98765.6933.244.2528.65
Table 5. Horizontal Variation in Water Quality around Kodungaiyur.
S. NoLatitudeLongitudeTemperatureTDSDOPhTurbidity
113.13293280.263117291347.66−29.699.80
213.13253680.26309730.91347.6612.239.8335.53
313.13212280.26269328.8921.810110
413.13186880.26275130.2269.2−17.26.4117.22
Table 6. Horizontal Variation of Water Quality around Perungudi.
S. NoLatitudeLongitudeTemperatureTDSDOPhTurbidity
112.94957580.23291428.941045.6536.51425.63
212.94978780.233589251347.668.059.83335.53
312.94895580.23393629.251250.5518.419.5235.654
412.94898280.23421934.63915.6513.759.3117.22
512.94917480.23428628.25456.51011.8105.26
612.94917780.234166341058.2429.2111153.24
712.94936980.23443828.81986.35811.8132.56
812.94951580.23424729.19349.51011.8256.35
Disclaimer/Publisher’s Note: The statements, opinions and data contained in all publications are solely those of the individual author(s) and contributor(s) and not of MDPI and/or the editor(s). MDPI and/or the editor(s) disclaim responsibility for any injury to people or property resulting from any ideas, methods, instructions or products referred to in the content.

