Abstract
Agricultural tractor emissions have a notable influence on total emissions and climate change. This is especially important when developing an agricultural machinery emission inventory since tractors are the most widely used agricultural machinery. However, as with other agricultural machinery, there is a significant lack of data concerning tractors. This study combined two large-scale datasets to develop a Tier 2 tractor emission inventory for the Republic of Croatia. The first dataset, which was collected via a large-scale survey with 8895 respondents, includes data on fuel consumption by machine and engine type. The second dataset, which is official data of the Ministry of the Interior, includes data on machinery age. Since there is no direct link between datasets, data on fuel consumption were calculated for each of 21 Croatian counties and were then linked to the corresponding municipalities’ tractor age and power rating of the vehicle fleet. The result was used to calculate tractor emissions by with a Tier 2 approach using the method listed in the 2019 EMEP/EEA emissions guidebook. The calculations were made for five exhaust emission components: carbon dioxide (CO2), carbon monoxide (CO), hydrocarbon (HC), nitrogen oxide (NOX) and particulate matter (PM). The continental counties had the highest emissions for all emission types, especially the Osječko-baranjska and Vukovarsko-srijemska counties. The Tier 2 emission inventory was compared to data calculated using the Tier 1 method on a county level. There were notable differences between the inventories for HC and PM emissions, which is mainly due to Tier 2 approach having different emission factors depending on vehicle age. The end result was compared to the already existing Tier 1 emission inventory on a county level.
1. Introduction
Tractors are extensively used in the agricultural sector, with most work in the field being carried out using tractors. A majority of agricultural tractors release emissions into the air because of their use of fossil fuels, which are usually divided into greenhouse gas emissions and air pollutant emissions. Greenhouse gas emissions greatly contribute to climate change [1] by emitting radiant energy, thus keeping heat in the atmosphere [2]. Air pollutant emissions are substances that have a negative impact on health. Exposure to high levels of air pollutants primarily leads to problems with respiratory and cardiovascular systems [3,4], but can also lead to genetic disorders and negative structural changes in the brain during prenatal exposure [5,6]. Most air pollutant emissions are generated through human activities [7]. Global emissions are rising and accelerating climate change [8], which makes reducing emissions one of the main global goals. An important step to reducing emissions and achieving climate neutrality was the Paris Agreement. The intention of the Paris Agreement is to keep the increase in global temperature to well below 2 °C compared to preindustrial levels. In order to achieve this, greenhouse gas emissions must be lowered by 40% by 2030 compared with 1990 [9], which was confirmed by the Glasgow Climate Pact [10]. The European Union further increased emission reduction to 55% to keep the increase in global temperature below 1.5 °C [11,12]. However, it is possible that residual emissions will require offsets from carbon dioxide removal technologies to make agriculture climate neutral [13], as higher agricultural activity is often tied with larger emission levels on a national scale [14].
The first major step in identifying and reducing emissions is developing an emission inventory. It enables the definition and listing of emissions by source emitter, activity, spatial or temporal distribution, emission type, etc., making it a valuable and reliable tool in developing new policies [15,16] and procedures aimed at reducing emissions. With detailed data, new policies can be implemented at the local level to increase the immediate impact on the local community [17]. Moreover, existing policies can be tested and improved [18], as direct agricultural subsidies can encourage agricultural-related carbon emissions [19], but subsidies directly aimed at reducing emissions can be beneficial to reducing emissions in the agricultural sector [20]. New procedures, such as new standards or better measuring devices, reduce overall emission inventory uncertainty and improve its accuracy [21,22].
Since development of an emission inventory is usually carried out periodically and on a large scale, it is a long-term process that entails constant data collection from a multitude of sources. Consequently, there is a lack of data in some emission inventory areas. Such is the case for nonroad mobile machinery (NRMM). The main reason for this lack of data is that NRMM is not perceived as large a pollutant group as road vehicles. One of the results are more liberal emission limits for NRMM compared to road vehicles worldwide [23], including the EU [24], compared to more rigorous emission limits for road vehicles [25]. Moreover, there is less research concerning NRMM, as well as less data collection from official bodies. Since official data collection is a fundamental step in developing an NRMM emission inventory, there should be an institution that is appointed to collect the data [26]. Resulting inventory could be used to track emission reduction technology impact on a national scale, pace of NRMM replacement and spatial impact of NRMM emissions. Furthermore, the results should be presented in an easily accessible and understandable format. One example of such result format is the Environmental Protection Agency in the USA, which offers NRMM emission data disaggregated by federal states [27]. In the United Kingdom, data on NRMM emissions is available spatially in a visually engaging way [18].
Reducing NRMM emissions is also a crucial task in the context of achieving climate neutrality. For example, although there are no official data concerning NRMM emissions on the EU level, a review of Directive 97/68/EC states that 2% of total EU greenhouse gas emissions in 2010 came from NRMM [28]. Concerning pollutant emissions, a report from 2017 stated that NRMM was responsible for 15% of total NOX emissions and 5% of PM emissions [26]. The first step in achieving emission decrease would be to switch out old machinery with newer models [29], or to retrofit old machinery with new emission reduction technology. Emission reduction technologies, such as diesel particle filters, NOX adsorbers, selective catalytic reduction, oxidation catalysts and gasoline particle filters, offer solutions aimed at reducing emissions from agricultural tractors [30]. Considering fugitive dust emissions, the light scattering device could be a cost-friendly way of achieving lower dust emissions during fieldwork [31]. Hybrid technologies and electricity as new propulsion technologies are necessary for achieving climate neutrality in the agricultural sector [32,33]. However, this brings additional cost, which can be over 10,000 USD per engine for larger engines with over 450 kW of engine power [34].
Agricultural machinery is a significant area of NRMM research, as well as of NRMM emissions. Since tractors are used in almost all stages of agricultural fieldwork, they represent the major share of agricultural NRMM. An emission inventory would improve the current understanding of agricultural tractor emissions and their influence on total national emissions, as well as on local population. It would also serve as a basis to formulate and update long-term policies aimed at reducing their emissions [35,36]. The Beijing region in China is a good example of policy influence on emission reduction. From 2006 to 2016, emissions of carbon monoxide (CO), hydrocarbons (HC), nitrogen oxides (NOX), particulate matter (PM) and the total emissions from agricultural machinery decreased by 63.11%, 62.93%, 72.07%, 74.67% and 68.66%, respectively, as a result of policies aimed at emission reduction [37]. In future, China could offset its agricultural emissions by 2060 [38]. Emissions from agricultural work are also temporal in nature, with air quality often being poorer during a heavy agricultural work season [39,40].
A difficulty concerning tractors, as well as agricultural machinery as a group, is a lack of research concerning its activity data and emissions during fieldwork. Tractors can work on different crops, land type, terrain, with different load profiles, etc., which makes it difficult to determine their emission factors with adequate accuracy. Gathering these data is important to lower overall emission uncertainty and for the emission inventory to represent the real situation in the field [41], as the measurement results in the field can vary to as high as 20 times [42]. Emission differences can also be large as a result of terrain. Vineyards are typically on a rougher terrain compared to arable land, and machinery working in vineyards can emit up to 80% more emissions for the same area compared to machinery working on arable land [43].
Various methods of determining agricultural machinery emissions can be used based on available data. The EMEP/EEA Air Pollutant Emission Inventory Guidebook lists three methods [44]. If only basic machinery data are available, i.e., fuel consumption, then the Tier 1 method is used by providing emission factors for basic categories, such as agricultural machinery category. The Tier 2 method is used where activity data are collected on a more detailed basis, based on equipment type and emission reduction technology level. The emission reduction technology levels are divided according to the EU NRMM emission legislation, and the EMEP/EEA Air Pollutant Emission Inventory Guidebook does not prescribe the technological solutions by which these emission limits are achieved. The most detailed is the Tier 3 method, which is used when detailed data are available on the equipment level, e.g., machinery age, annual hours of use, national specific emission factors and engine size. The basic principle is to use as much available data as possible, especially if the considered category is a key emission source. The 2019 EEA EMEP/EEA Air Pollutant Emission Inventory Guidebook states that construction and agriculture sectors are the largest emitters of NOX and PM emissions [44]. The same sectors are the largest emitters in Switzerland, with the largest proportions in NOX and PM emissions [45]. Agricultural and construction machinery are also the largest NOX and PM emitters in China [46].
Because it is challenging to obtain even the most basic data, most countries do not have an NRMM emission inventory, which includes agricultural tractors. Even the existing inventories are mostly developed by using data on machinery sales or machinery imports. In Denmark, the Association of Danish Agricultural Machinery Dealers provides annual sales data, but there are no available activity data [47]. In Germany, agricultural machinery emissions are reported by the Federal German Environment Agency using vehicle stock data. However, for activity data, resale platforms are used [29]. In Switzerland, data is extrapolated based on previous data on fuel sales for agricultural machinery, which are available up to 2004 [45]. A similar situation is present in the Netherlands, where only vehicle sales data are collected, but no activity data are available [48]. Finland and Sweden, which collect agricultural machinery data annually, have much more detailed agricultural machinery emission inventories based on the Tier 3 method. Finland uses the TYKO calculation model with data on engine power, vehicle age, annual hours of work and average load factor. However, these data are not collected on a national level but only partially collected [49]. Sweden also provides detailed emission data on real-world emissions during fieldwork [50]. However, as in Finland, data are not collected on a national level but extrapolated from partially collected data [51]. Another issue concerning agricultural tractors is their historical data. Due to their replacement years often being 30 years or even more [52], there are often even less or no basic data concerning older agricultural tractors.
In order to develop a reliable emission inventory for tractors, data should be collected through a large-scale survey if collecting data on a national level is not possible. A questionnaire with data on machinery type, land type, fuel consumption, fuel type and vehicle age would collect enough data for a Tier 2 emission inventory without requiring detailed data from the respondents. Questionnaires also provide data about fuel consumption during fieldwork, which is beneficial for the emission inventory accuracy [40,53]. The main problem with this approach is that conducting such a survey on an annual basis is difficult without government bodies due to funding demands [54]. The Netherlands [55] and Sweden [56] conduct such surveys, which enable them to develop Tier 3 emission inventories.
There are no official data on tractor emissions in Croatia. Since there is no continuous data collection on any data except the number of registered tractors, it is difficult to develop an initial emission inventory with a satisfactory level of accuracy. A Tier 1 emission inventory for agricultural machinery was developed based on large-scale survey data, with data for 2016 [57]. In this research, tractors were identified as the largest emitters among agricultural machinery. Although data in this research included data on fuel consumption and spatial data, there were no data on vehicle age, which is necessary to develop an inventory using the Tier 2 method. However, since tractors in Croatia need to be registered, there is a large dataset with a list of all registered tractors in Croatia. This list is managed by the Croatian Ministry of the Interior. This paper aims to develop a Tier 2 emission inventory for agricultural tractors in Croatia by combining two large datasets: one with data on fuel consumption and the other with data on vehicle age. Both datasets contain spatial data on the machinery’s county, which means that the emission inventory is spatially distributed by county. Such a method enables the development of an emission inventory with a satisfying level of accuracy without having to use just one dataset, or multiple datasets that need to have a unique identifier for every entry. Tractor emissions calculated in this paper are also compared to tractor emissions calculated using the Tier 1 method for each county.
2. Materials and Methods
2.1. Data Collection and Database Comparison
Since there is no database with both data on fuel consumption and vehicle age, which is needed to develop a Tier 2 emission inventory, two different databases where combined. As there are no official data on fuel consumption of agricultural tractors in Croatia, a previous study was used for fuel consumption data [57]. In this study, data were collected via a questionnaire in collaboration with the Croatian Bureau of Statistics (CBS), and it included 8895 respondents. The respondents filled in data on machinery type, type of fuel used, quantity of fuel used and agricultural land area. In order to ensure high quality of data on fuel consumption, several plausibility control steps were taken. This was enabled by combining survey data with the existing CBS data on agricultural land area and respondent location for each survey respondent. By comparing individual fuel consumption per hectare of arable land with the county average, outliers and illogical inputs could be removed from the final data. Furthermore, a manual plausibility control was conducted for every record of consumption. If consumption differed an order of magnitude, or was more different from the average, the input was removed from the final data. The top and bottom 5% of fuel consumption were also controlled for each county. In order to gather the most reliable data possible, another plausibility control was introduced. A question requiring data on total fuel bills for 2016 was included in the survey. Since in Croatia legal agricultural and marine entities are allowed to use so-called “blue diesel” fuel but must keep all the bills and use the fuel exclusively for business, survey responses regarding fuel consumption could be compared to responses regarding “blue diesel” bills. “Blue diesel” has the same properties as regular diesel fuel (according to EN 540) but is exempted from certain tax duties, which makes it approximately 40% cheaper [57]. The first database contains data on the number of agricultural tractors, spatial data, fuel type (diesel or gasoline) and fuel consumption.
The second database contains data on the number of agricultural tractors, their vehicle age and their spatial data, i.e., county name. This database is operated by the Croatian Ministry of the Interior and contains data on each registered agricultural tractor. Since there is no common unique identifier that could pair the data from the two databases, data were aggregated on a county level. Croatia is divided into twenty-one counties that have large variations in size and population, as well as primary activity due to geographical conditions/differences. The main agricultural activity is present in the continental counties.
2.2. Data Processing and Database Integration
The EMEP/EEA Tier 2 method uses different emission factors based on the technology type of agricultural machinery, i.e., based on machinery age. The main emission categories are divided by stages as they appear in regulations of the European Union. The temporal distribution is different depending on machinery engine power rating and is the same both for diesel and gasoline engines, as shown in Figure 1.
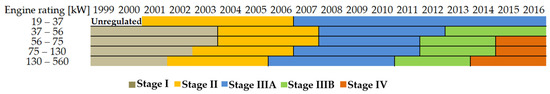
Figure 1.
Temporal distribution of agricultural tractors’ emission regulation [58].
The first database contains data on fuel consumption by county and by fuel type. In terms of determining tractor emissions using the EMEP/EEA Tier 2 method, data on vehicle age were missing. Since there are no data on vehicle age in this database, data from the second database were used. In the second database, although there were no data on fuel consumption, there were data on engine power rating, county and vehicle age for each tractor. These data were aggregated on a county level and for each technology type, as defined in the EMEP/EEA Tier 2 method: pre-1981, 1981–1990, 1991–Stage I, Stage I, Stage II, Stage IIIA, Stage IIIB and Stage IV. They were also aggregated by engine power class, as shown in Figure 1. This way, in the second database, there were data on a number of tractors in each county for every power class and every technology type, which were then combined with data from the first database, i.e., data on fuel consumption for all tractors in every county.
By combining data from the two databases, fuel consumption by vehicle age, power category, fuel type and county could be assessed. Fuel consumption for each category was determined according to the following formula:
where FCi,j,k,m is the fuel consumption; TFCi,m is total fuel consumption on a county level; Ni,j is the number of agricultural tractors of the same power class on a county level; NTi is the total number of agricultural tractors on a county level; NCi,j,k is the number of agricultural tractors of the same power class and technology type on a county level; i is county number (i = 1, … , 21); j is power category (j = 1, … , 5); k is technology level (k = 1, … , 8); and m is fuel type (m = 1, 2).
FCi,j,k,m = TFCi,m × (Ni,j/NTi) × (NCi,j,k/Ni,j),
This enabled the disaggregation of fuel consumption from the first database, which contains only data on fuel consumption on a county level, by engine power class and technology level for each county. After disaggregating the data, emissions could be determined and presented spatially by county for different power categories, fuel type and technology level using the Tier 2 method.
2.3. Calculating Agricultural Tractor Emissions
Total emissions from agricultural machinery were calculated for carbon dioxide (CO2), carbon monoxide (CO), hydrocarbon (HC), nitrogen oxide (NOX) and particulate matter (PM) emissions using the method listed in the 2019 EMEP/EEA emissions guidebook. The Tier 2 method was used, since data disaggregation by using two databases enabled data on fuel consumption by power class and technology type [44]:
where Ei,j,k,m,n is the emission of the pollutant for each fuel type from a machinery category in a county; FCi.j,k,m is the fuel consumption for each fuel from a machine category in a county; EFm,n is the emission factor for a specific pollutant for each fuel type; i is county number (i = 1, …, 21); j is power category (j = 1, … , 5); k is technology level (k = 1, … , 8); m is fuel type (m = 1, 2); and n is pollutant type (j = 1, … , 5). Emission factors were obtained from the EMEP/EEA emissions guidebook and are shown in Table 1 and Table 2 [44].
Ei,j,k,m,n = Σ (FCi,j,k,m × EFm,n),

Table 1.
Emission factors of gasoline fuel for agricultural machinery for Tier 2 method.
Table 2.
Emission factors of diesel fuel for agricultural machinery for Tier 2 method.
Spatial visualisation of emissions was conducted for 21 counties in Croatia, which enables the identification of areas of more considerable atmospheric impact of agricultural machinery, i.e., tractors. An additional spatial visualisation was made by comparing emissions calculated using the Tier 2 method to ones calculated using the Tier 1 method.
3. Results
3.1. Number of Agricultural Tractors and Fuel Consumption
The number of agricultural tractors per technology level and per county are shown in Table 3, while the distribution of technology levels by engine power category is shown in Figure 2. Furthermore, data on the percentage of tractors with technology level older than Stage I per county are shown. Zagrebačka county had the largest number of agricultural tractors, with 13,776 tractors, followed by Koprivničko-križevačka county, with 11,274 tractors. All counties, with the exception of Dubrovačko-neretvanska county and Grad Zagreb, have at least 70% of tractors with a technology level older than Stage I. A spatial display of total number of agricultural tractors and of percentage of tractors with a technology level older than Stage I is shown in Figure 3a,b, respectively.
Table 3.
The number of agricultural machines by technology level per county.
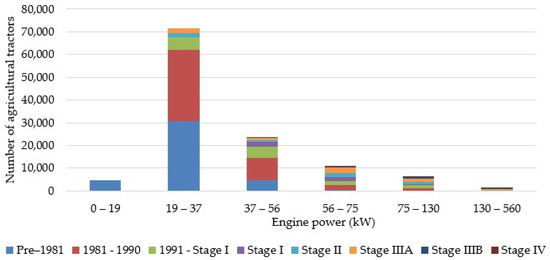
Figure 2.
Distribution of technology levels by engine power category.
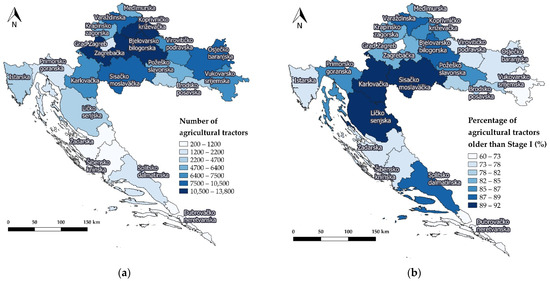
Figure 3.
Spatial distribution of the total number of agricultural tractors (a) and percentage of agricultural tractors older than Stage I (b).
A similar distribution is present when agricultural tractors are aggregated by engine power categories. Tractors with a technology level of Stage I or older make up for more than 50% of each power category for tractors with up to 75 kW of engine power. Most of the agricultural tractors were in the 19–37 kW engine category, with 72,655 tractors, or 60.7% of all tractors. The category with 130–560 kW of engine power had the least agricultural tractors, with 1234 tractors, or 1%.
Concerning fuel consumption, Osječko-baranjska county had the largest fuel consumption, with 23,505 tonnes of fuel and a total of 10,197 agricultural tractors, followed by Vukovarsko-srijemska county with 15,167 tonnes of fuel and a total of 6448 agricultural tractors. Such a result is to be expected because these two counties are in the lowland area where the largest part of agricultural production in the Republic of Croatia takes place. Counties with the largest number of agricultural tractors, Zagrebačka and Korpivničko-križevačka counties, had significantly lower fuel consumptions of 6787 tonnes and 10,149 tonnes, respectively. Osječko-baranjska county had the largest fuel consumption and less tractors than Zagrebačka and Korpivničko-križevačka counties. It also had a similar percentage of tractors across engine power categories, as shown in Table A1 in the appendix. This indicates that, in general, agricultural tractors in Osječko-baranjska county have higher work hours per agricultural tractor. Almost all of the used fuel is diesel fuel, with 124,215 tonnes out of the total 124,390 tonnes of fuel used by agricultural tractors. Total fuel consumption and total number of agricultural tractors are shown in Table 4. Total fuel consumption is also shown spatially in Figure 4a.
Table 4.
The number of agricultural tractors and diesel and gasoline fuel consumption per county.
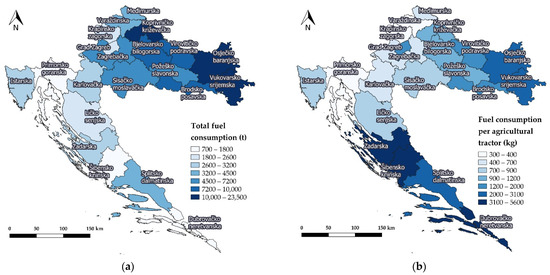
Figure 4.
Spatial distribution of the total fuel consumption (a) and fuel consumption per agricultural tractor (b).
Fuel consumption per agricultural tractor is shown in Figure 4b. Šibensko-kninska, Dubrovačko-neretvanska and Zadarska county had the largest fuel consumption per agricultural tractor with 5568, 5550 and 4010 kg of fuel per agricultural tractor, respectively. This could be due to terrain type in the coastal area of the country, which is a rougher terrain with more steep slopes compared to the continental part of the country. Furthermore, boats in mariculture also use blue diesel fuel. This fuel could be falsely represented as blue diesel used in the agricultural sector, which lowers data accuracy. Varaždinska and Krapinsko-zagorska counties had the smallest fuel consumption per agricultural tractor with 349 and 357 kg of fuel per agricultural tractor, respectively.
3.2. Emissions from Agricultural Tractors
After determining fuel consumption of agricultural tractors, Equations (1) and (2) were used to calculate CO2, CO, HC, NOX, and PM emissions. The emissions were calculated for each fuel type, engine power class and technology level before being aggregated on a county level. Figure 4, Figure 5, Figure 6, Figure 7 and Figure 8 show a spatial distribution of total emissions and Tier 1 and Tier 2 differences for all emission types by county. The Tier 1 and Tier 2 differences are shown with the Tier 1 method as a baseline. For example, the difference for HC emissions for Šibensko-kninska county is 5%, which means that HC emissions for Šibensko-kninska county calculated using the Tier 2 method are 5% higher compared to those calculated using the Tier 1 method. A negative percentage indicates lower emissions for Tier 2 compared to Tier 1. The numbers used to prepare those figures are provided in Appendix A in Table A2 and Table A3. Results in the form of bar charts are presented in Appendix A in Figure A1, which shows distribution of total CO2, CO, HC, NOX and PM emissions by county, and Figure A2, which shows weighted average of Tier 1 and Tier 2 differences for CO2, CO, HC, NOX and PM by county.
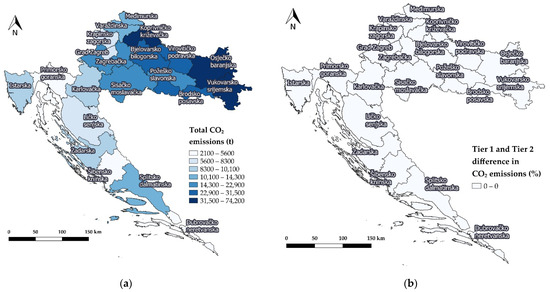
Figure 5.
Spatial distribution of total carbon dioxide (CO2) emissions (a) and spatial distribution of Tier 1 and Tier 2 differences for CO2 emissions (b).
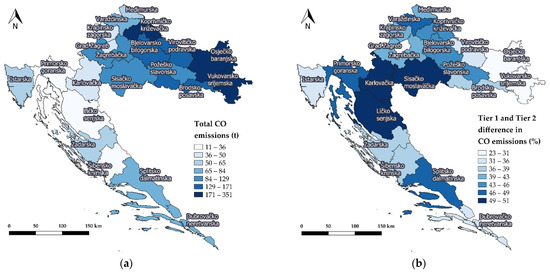
Figure 6.
Spatial distribution of total carbon monoxide (CO) emissions (a) and spatial distribution of Tier 1 and Tier 2 differences for CO emissions (b).
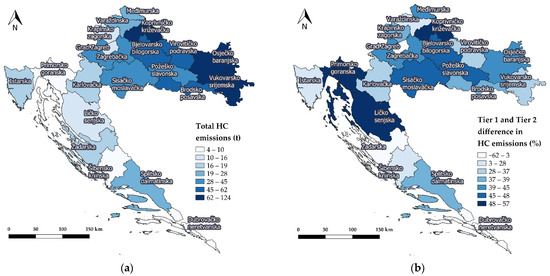
Figure 7.
Spatial distribution of total hydrocarbon (HC) emissions (a) and spatial distribution of Tier 1 and Tier 2 differences for HC emissions (b).
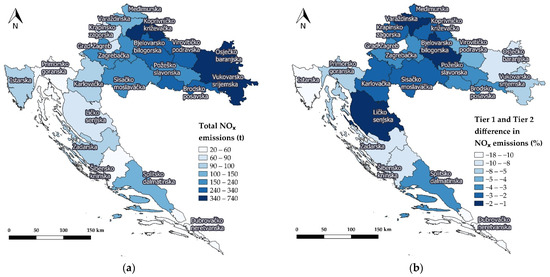
Figure 8.
Spatial distribution of total nitrogen oxide (NOX) emissions (a) and spatial distribution of Tier 1 and Tier 2 differences for NOX emissions (b).
Figure 5a,b show the spatial distribution of total CO2 emissions and Tier 1 and Tier 2 differences for CO2, respectively. Osječko-baranjska county had the most significant total CO2 emissions, with 74.2 kt, followed by Vukovarsko-srijemska county, with 47.9 kt of CO2 emissions. Concerning Tier 1 and tier 2 differences for CO2, all the counties have minimal differences compared to the Tier 1 results, with the largest difference of −0.17% in Grad Zagreb. The main reason for this is that CO2 emission factors are the same for all technology levels, i.e., the emission factor is almost the same as the one for the Tier 1 method. The spatial distribution of total CO emissions and the spatial distribution for Tier 1 and Tier 2 differences for emissions CO are shown in Figure 6a,b, respectively. Osječko-baranjska county had the most significant total CO emissions, with 351 t, followed by Vukovarsko-srijemska county, with 215 t of CO2 emissions. Ličko-senjska and Sisačko-moslavačka counties had the largest differences between Tier 1 and Tier 2 CO emissions, with differences of 51% and 50%, respectively. Vukovarsko-srijemska county had the lowest difference of 23%. It can be seen that Tier 1 and Tier 2 differences in CO emissions are pronounced with as much as 51% difference, compared to no differences in CO2 emissions. Similarly, the differences are visible in all other emission types.
Figure 7a,b show the spatial distribution of total HC emissions and the spatial distribution for Tier 1 and Tier 2 differences for HC emissions, respectively. Osječko-baranjska and Vukovarsko-srijemska counties had the most significant total of HC emissions, with 124 t and 75 t, respectively. When considering Tier 1 and Tier 2 differences for HC emissions, Dubrovačko-neretvanska county had the highest difference of −62%, followed by Primorsko-goranska county with a difference of 57%. Much lower Tier 2 HC emissions compared to Tier 1 are mainly due to Dubrovačko-neretvanska county having a large proportion of newer agricultural tractors, i.e., technology level of Stage II or better.
The spatial distribution of total NOX emissions and the spatial distribution for Tier 1 and Tier 2 differences for NOX are shown in Figure 8a,b, respectively. Osječko-baranjska county had the most significant total of NOX emissions, with 740 t. Contrary to CO2, CO and HC emissions, NOX emissions differences between Tier 1 and Tier 2 are negative for all counties, which indicates lower Tier 2 values across the whole of Croatia.
Figure 9a,b show the spatial distribution of total PM emissions and the spatial distribution for Tier 1 and Tier 2 differences for PM, respectively. Osječko-baranjska county had the highest total PM emissions, with 157 t. When considering Tier 1 and Tier 2 differences for PM emissions, Karlovačka and Sisačko-moslavačka counties had the largest difference of 125%. As with the NOX emissions, these differences of more than 100% indicate a large difference in PM emission factors for different technology levels, which are shown in Table 1 and Table 2. Since most agricultural tractors in Croatia in 2016 were on the pre-Stage I technology level, it follows that the total PM emissions were significantly higher for Tier 2 compared to Tier 1.
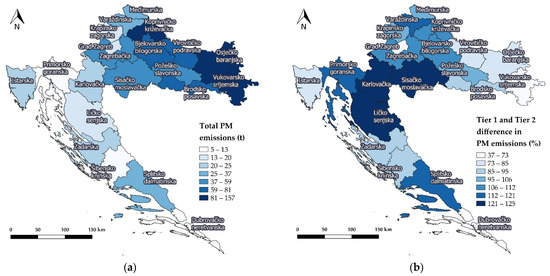
Figure 9.
Spatial distribution of total particulate matter (PM) emissions (a) and spatial distribution of Tier 1 and Tier 2 differences for PM emissions (b).
The spatial distribution for all emission types shows that the continental part of Croatia has much higher emissions for all emission types compared to the coastal counties. The continental part of Croatia is the main region of agricultural activities in Croatia. This is consistent with the Tier 1 emission inventory developed for all agricultural machinery [57]. Tier 1 and Tier 2 differences have higher variations by emission type and by county. Different emission factors for Tier 1 and Tier 2 methods have the largest influence on total differences by emission type and county. A clear example of this can be seen in NOX and PM emission factors in Table 1 and Table 2, where the differences between the same emission types for different technology levels vary greatly. If Stage IV and pre-Stage I emission factors are compared, there is a clear sharp reduction concerning all emission types. For example, the Stage IV emission limit presents a 98.3% reduction compared to the pre-1981 limit for PM in diesel engines.
Whereas the results show higher Tier 1 CO, HC and PM emissions compared to emissions calculated using the Tier 2 method, NOX emissions provide an interesting example of how Tier 2 emissions could be higher if calculated using the Tier 2 method. This is mainly due to a large impact of newer emission reduction technology and a sharp reduction in emission limits in newer tractors. Since most of tractors in all counties in Croatia are equipped with pre-Stage I emission reduction technology, the Tier 1 method results in lower NOX emissions compared to the Tier 2 method. This is mainly due to NOX emission factors being drastically lower for newer agricultural tractors with emissions levels from Stage II, which can be observed in Table 1 and Table 2. A great example of the influence of emission reduction technology can also be seen in Dubrovačko-neretvanska county. When CO emissions are considered, this county had the highest difference of −62%, whereas other counties had a positive difference. As already mentioned, much lower Tier 2 HC emissions compared to Tier 1 are mainly due to Dubrovačko-neretvanska county having a large proportion of newer agricultural tractors, i.e., technology level of Stage II or better.
These examples show how data on vehicle age hold important information that can greatly influence the final emission inventory. This is why emission control technology and activity data are important information when researching agricultural emissions and the best policy solutions for emission reductions; further gathering of data would be necessary in order to conduct an analysis of this issue. In addition, various variables impacting the overall emissions inventory, e.g., more detailed activity data or data on terrain type, require further research in order to fully understand and contextualise existing results.
As there was no unified database necessary for developing a Tier 2 emission inventory, using two databases was a way to incorporate data on vehicle age without having to conduct a new large-scale survey, which would be costly and time consuming. Since scarcity of data for agricultural machinery is a problem in other countries, such as Germany [59] or Denmark [47], an approach that would enable combining different datasets would be beneficial to other countries and other NRMM sectors as well. In this way, more accurate emission inventories can be developed if the right databases and criteria for data inclusion are used. More accurate emission inventories offer a better understanding of the main emission sources, which enables decision makers to develop optimal emission reduction policies.
In Croatia, there is a comprehensive list of agricultural tractors, since all agricultural tractors must be registered by law. However, a list of agricultural tractors alone is not enough for developing a high-quality emission inventory or for the temporal tracking of emissions. As mentioned in the introduction, other countries, e.g., Switzerland, Finland, Germany, the Netherlands, Denmark, etc., also have a lack of data concerning agricultural machinery data, and their emission inventories contain many assumptions that raise uncertainty regarding the overall emission inventory. Since agricultural machinery represents a large proportion of overall NRMM emissions, it is necessary to improve the current data collection systems, especially when considering Europe’s aim to become climate-neutral by 2050. National statistical bureaus are key institutions due to their knowledge on conducting large-scale data collection research.
If possible, data collection should be structured in such a way that a designated institution has the infrastructure and the funds to conduct annual data gathering. This leads not only to accurate emission inventories for a given year, but, equally importantly, to temporal and spatial emission tracking. Combined with the tracking of policy instruments, it could provide for a more rapid emission reduction process. A basic but effective approach would be to encourage additional emission reduction technologies in new machinery or to retrofit older machinery with newer emission reduction technology, such as NOX adsorbers, oxidation catalysts and diesel particle filters [30]. Another way of reducing emissions is by using hybrid, electric and hydrogen propulsions, which are compatible with renewable energy sources and can be indispensable in achieving climate neutrality in the agricultural sector [32,33].
4. Conclusions and Recommendations
Although agricultural tractors represent a large proportion of total agricultural machinery emissions, there is still lack of data and of a more structured approach towards their emission tracking and reduction. Data collection, handling and interpretation have a basic role in emission reduction. In this paper, a Tier 2 spatial emission inventory for agricultural tractors in Croatia was developed using two different databases. After determining the necessary data needed to develop a Tier 2 inventory, agricultural tractor emissions were calculated using the EEA Tier 2 method. Osječko-baranjska county had the most emissions for all the calculated emission types, followed by Vukovarsko-srijemska and Koprivničko-križevačka county. This is mainly due to the largest number of tractors and the largest fuel consumption being in these counties. Zadarska and Šibensko-kninska counties had the largest fuel consumption per tractor although their total fuel consumption amounted to only 3051 and 1331 tons of fuel, respectively. This is most likely due to terrain configuration, as this part of Croatia has rocky terrain with steep hills.
Observed differences between Tier 1 and Tier 2 emission inventories vary by county and by emission type. For CO2 emissions, there were no differences due to Tier 1 and Tier 2 having the same emission factors for all tractor equipment levels. Differences for CO and NOX emissions varied from 23% to 51% for CO emissions and from −18% to −1% for NOX emissions. The negative percentages for NOX emissions, meaning that emissions calculated using the Tier 2 method are larger compared to those calculated using the Tier 1 method, are due to large differences in NOX emissions factors in different technology levels. The largest emission differences were found for HC and PM emissions, where differences varied from −62% to 57% for HC emissions and from 37% to 125% for PM emissions. As previously stated in Section 3.2, these differences are present mainly due to a combination of a different age profile of agricultural tractors for different counties and a major difference between the emission factors for the same emission type.
Without a designated institution responsible for data collection and emission tracking, it is hardly possible to ensure continuity of results. Knowing the emission reduction or increase trend could be more important than knowing the amount of emissions there were in a given year, because only temporal tracking of emissions can be a basis for emission reduction policy evaluation. If possible, data that would enable a year-by-year Tier 3 inventory, which takes into account load factors, hours of work, agricultural equipment type, etc., should be collected. Annual questionnaires that would target key agricultural stakeholders could be enough to develop such an inventory. Similar action should be taken into account in other NRMM sectors, such as in construction, inland water or household sectors.
Author Contributions
Conceptualisation, Z.L. and G.Š.; methodology, Š.L. and P.I.; investigation, Š.L.; resources, Š.L.; writing—original draft preparation, Š.L.; writing—review and editing, P.I.; supervision, Z.L. All authors have read and agreed to the published version of the manuscript.
Funding
This research was funded by the European Commission, European Structural and Investments Funds 2014–2020, grant number KK.01.1.107.0038 and by the research project of the Energy Institute Hrvoje Požar, “Development of an integrated solution for strategic long-term climate and energy policy planning and development of joint climate and energy plans”.
Institutional Review Board Statement
Not applicable.
Informed Consent Statement
Not applicable.
Data Availability Statement
Restrictions apply to the availability of these data. Data were obtained from the Croatian Bureau of Statistics and are available at https://dzs.gov.hr/ (accessed on 5 June 2022) with the permission of the Croatian Bureau of Statistics, and from Ministry of the Interior, which are available at https://mup.gov.hr/ (accessed on 5 June 2022).
Conflicts of Interest
The authors declare no conflict of interest.
Appendix A
Table A1.
Number of agricultural tractors by county and by power category.
Table A1.
Number of agricultural tractors by county and by power category.
| County | Number of Agricultural Tractors per Engine Power 1 Category | |||||
|---|---|---|---|---|---|---|
| 0–19 | 19–37 | 37–56 | 56–75 | 75–130 | 130–560 | |
| Bjelovarsko-bilogorska | 253 | 6025 | 2773 | 1151 | 654 | 89 |
| Brodsko-posavska | 84 | 2512 | 935 | 468 | 274 | 83 |
| Dubrovačko-neretvanska | 27 | 166 | 28 | 25 | 12 | 3 |
| Grad Zagreb | 114 | 669 | 186 | 192 | 92 | 22 |
| Istarska | 221 | 2210 | 594 | 391 | 95 | 32 |
| Karlovačka | 364 | 5454 | 841 | 322 | 84 | 23 |
| Koprivničko-križevačka | 469 | 6354 | 2649 | 1149 | 572 | 81 |
| Krapinsko-zagorska | 290 | 4613 | 1008 | 371 | 69 | 4 |
| Ličko-senjska | 79 | 1957 | 222 | 77 | 22 | 2 |
| Međimurska | 230 | 3728 | 756 | 504 | 259 | 47 |
| Osječko-baranjska | 141 | 4553 | 2362 | 1451 | 1354 | 336 |
| Požeško-slavonska | 89 | 3203 | 914 | 459 | 217 | 50 |
| Primorsko-goranska | 383 | 1101 | 161 | 76 | 22 | 8 |
| Sisačko-moslavačka | 313 | 5768 | 1620 | 584 | 329 | 68 |
| Splitsko-dalmatinska | 132 | 899 | 182 | 66 | 24 | 11 |
| Šibensko-kninska | 24 | 160 | 25 | 18 | 6 | 6 |
| Varaždinska | 507 | 7625 | 1596 | 491 | 195 | 17 |
| Virovitičko-podravska | 113 | 3772 | 1232 | 719 | 484 | 89 |
| Vukovarsko-srijemska | 107 | 2458 | 1748 | 1105 | 867 | 163 |
| Zadarska | 62 | 529 | 91 | 51 | 19 | 9 |
| Zagrebačka | 517 | 8899 | 2644 | 1146 | 479 | 91 |
| Total | 4519 | 72,655 | 22,567 | 10,816 | 6129 | 1234 |
1 Engine power ratings are expressed in kilowatts.
Table A2.
Total emissions of agricultural tractors by county and emission type.
Table A2.
Total emissions of agricultural tractors by county and emission type.
| County | Emissions (t, kt for CO2) | ||||
|---|---|---|---|---|---|
| CO2 | CO | HC | NOX | PM | |
| Bjelovarsko-bilogorska | 31,361 | 171 | 62 | 336 | 81 |
| Brodsko-posavska | 26,114 | 135 | 47 | 275 | 60 |
| Dubrovačko-neretvanska | 4579 | 68 | 7 | 40 | 8 |
| Grad Zagreb | 6805 | 40 | 11 | 64 | 14 |
| Istarska | 9839 | 51 | 17 | 95 | 21 |
| Karlovačka | 8713 | 48 | 18 | 93 | 24 |
| Koprivničko-križevačka | 32,069 | 172 | 63 | 341 | 82 |
| Krapinsko-zagorska | 7188 | 36 | 13 | 76 | 17 |
| Ličko-senjska | 5734 | 33 | 12 | 62 | 16 |
| Međimurska | 10,238 | 56 | 19 | 108 | 25 |
| Osječko-baranjska | 74,228 | 351 | 124 | 740 | 157 |
| Požeško-slavonska | 16,641 | 93 | 32 | 176 | 42 |
| Primorsko-goranska | 2055 | 11 | 4 | 21 | 5 |
| Sisačko-moslavačka | 21,601 | 126 | 45 | 229 | 59 |
| Splitsko-dalmatinska | 12,478 | 77 | 25 | 132 | 33 |
| Šibensko-kninska | 4206 | 27 | 8 | 41 | 10 |
| Varaždinska | 11,536 | 74 | 23 | 124 | 30 |
| Virovitičko-podravska | 28,514 | 140 | 50 | 296 | 63 |
| Vukovarsko-srijemska | 47,896 | 215 | 75 | 481 | 93 |
| Zadarska | 9632 | 60 | 17 | 96 | 22 |
| Zagrebačka | 21,443 | 116 | 41 | 226 | 54 |
| Total | 392,871 | 2100 | 713 | 4053 | 915 |
Table A3.
Difference in Tier 1 and Tier 2 emission inventories by county and emission type.
Table A3.
Difference in Tier 1 and Tier 2 emission inventories by county and emission type.
| County | Difference in Tier 1 and Tier 2 Emission Inventories (%) | ||||
|---|---|---|---|---|---|
| CO2 | CO | HC | NOX | PM | |
| Bjelovarsko-bilogorska | 0 | 45 | 48 | −2 | 112 |
| Brodsko-posavska | 0 | 36 | 38 | −3 | 90 |
| Dubrovačko-neretvanska | 0 | 36 | −62 | −18 | 37 |
| Grad Zagreb | 0 | 27 | −5 | −14 | 63 |
| Istarska | 0 | 31 | 22 | −11 | 80 |
| Karlovačka | 0 | 50 | 34 | −2 | 125 |
| Koprivničko-križevačka | 0 | 44 | 51 | −2 | 111 |
| Krapinsko-zagorska | 0 | 39 | 39 | −3 | 99 |
| Ličko-senjska | 0 | 51 | 50 | −1 | 124 |
| Međimurska | 0 | 42 | 42 | −3 | 102 |
| Osječko-baranjska | 0 | 28 | 40 | −9 | 75 |
| Požeško-slavonska | 0 | 43 | 46 | −3 | 106 |
| Primorsko-goranska | 0 | 46 | 57 | −6 | 120 |
| Sisačko-moslavačka | 0 | 50 | 47 | −2 | 125 |
| Splitsko-dalmatinska | 0 | 49 | 38 | −3 | 118 |
| Šibensko-kninska | 0 | 38 | 5 | −10 | 90 |
| Varaždinska | 0 | 38 | 5 | −1 | 90 |
| Virovitičko-podravska | 0 | 47 | 24 | −5 | 113 |
| Vukovarsko-srijemska | 0 | 33 | 35 | −8 | 82 |
| Zadarska | 0 | 23 | 30 | −8 | 60 |
| Zagrebačka | 0 | 37 | −5 | −3 | 86 |
| Average | 0 | 42 | 44 | −6 | 107 |
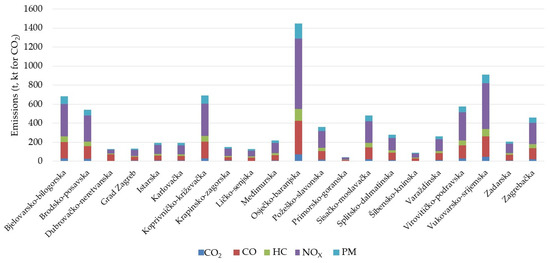
Figure A1.
Distribution of total carbon dioxide (CO2), carbon monoxide (CO), hydrocarbon (HC), nitrogen oxide (NOX) and particulate matter (PM) emissions by county.
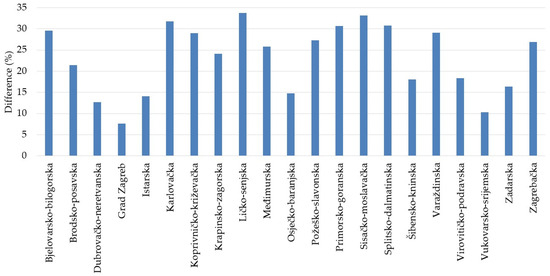
Figure A2.
Weighted average of Tier 1 and Tier 2 differences for CO2, CO, HC, NOX and PM by county.
References
- Jain, P.C. Greenhouse Effect and Climate Change: Scientific Basis and Overview. Renew. Energy 1993, 3, 403–420. [Google Scholar] [CrossRef]
- Ramanathan, V.; Feng, Y. Air Pollution, Greenhouse Gases and Climate Change: Global and Regional Perspectives. Atmos. Environ. 2009, 43, 37–50. [Google Scholar] [CrossRef]
- Ye, S.H.; Zhou, W.; Song, J.; Peng, B.C.; Yuan, D.; Lu, Y.M.; Qi, P.P. Toxicity and Health Effects of Vehicle Emissions in Shanghai. Atmos. Environ. 2000, 34, 419–429. [Google Scholar] [CrossRef]
- UN Environment. Emissions Gap Report 2022. Available online: http://www.unep.org/resources/emissions-gap-report-2022 (accessed on 15 November 2022).
- Zhu, Y.; Pan, Z.; Jing, D.; Liang, H.; Cheng, J.; Li, D.; Zhou, X.; Lin, F.; Liu, H.; Pan, P.; et al. Association of Air Pollution, Genetic Risk, and Lifestyle with Incident Adult-Onset Asthma: A Prospective Cohort Study. Ecotoxicol. Environ. Saf. 2023, 257, 114922. [Google Scholar] [CrossRef] [PubMed]
- Bos, B.; Barratt, B.; Batalle, D.; Gale-Grant, O.; Hughes, E.J.; Beevers, S.; Cordero-Grande, L.; Price, A.N.; Hutter, J.; Hajnal, J.V.; et al. Prenatal Exposure to Air Pollution Is Associated with Structural Changes in the Neonatal Brain. Environ. Int. 2023, 174, 107921. [Google Scholar] [CrossRef]
- Manisalidis, I.; Stavropoulou, E.; Stavropoulos, A.; Bezirtzoglou, E. Environmental and Health Impacts of Air Pollution: A Review. Front. Public Health 2020, 8, 14. [Google Scholar] [CrossRef]
- International Energy Agency. CO2 Emissions in 2022—Analysis; International Energy Agency: Paris, France, 2023. [Google Scholar]
- Salman, M.; Long, X.; Wang, G.; Zha, D. Paris Climate Agreement and Global Environmental Efficiency: New Evidence from Fuzzy Regression Discontinuity Design. Energy Policy 2022, 168, 113128. [Google Scholar] [CrossRef]
- Sgrigna, G.; Relvas, H.; Miranda, A.I.; Calfapietra, C. Particulate Matter in an Urban–Industrial Environment: Comparing Data of Dispersion Modeling with Tree Leaves Deposition. Sustainability 2022, 14, 793. [Google Scholar] [CrossRef]
- European Commission State of the Union: Commission Raises Climate Ambition. Available online: https://ec.europa.eu/commission/presscorner/detail/en/IP_20_1599 (accessed on 18 October 2020).
- Zuazua Ruiz, A.; Martín Martín, J.M.; Prados-Castillo, J.F. The European Union Facing Climate Change: A Window of Opportunity for Technological Development and Entrepreneurship. Sustain. Technol. Entrep. 2023, 2, 100035. [Google Scholar] [CrossRef]
- Rosa, L.; Gabrielli, P. Achieving Net-Zero Emissions in Agriculture: A Review. Environ. Res. Lett. 2023, 18, 063002. [Google Scholar] [CrossRef]
- Satrovic, E.; Abul, S.J.; Al-Kandari, A. Modeling the Dynamic Linkages between Agriculture, Electricity Consumption, Income and Pollutant Emissions for Southeastern Europe. Pol. J. Environ. Stud. 2022, 31, 4259–4267. [Google Scholar] [CrossRef] [PubMed]
- Piscitello, A.; Bianco, C.; Casasso, A.; Sethi, R. Non-Exhaust Traffic Emissions: Sources, Characterization, and Mitigation Measures. Sci. Total Environ. 2021, 766, 144440. [Google Scholar] [CrossRef]
- Madden, S.M.; Ryan, A.; Walsh, P. Exploratory Study on Modelling Agricultural Carbon Emissions in Ireland. Agriculture 2022, 12, 34. [Google Scholar] [CrossRef]
- Sun, J.; Zhai, N.; Miao, J.; Sun, H. Can Green Finance Effectively Promote the Carbon Emission Reduction in “Local-Neighborhood” Areas?—Empirical Evidence from China. Agriculture 2022, 12, 1550. [Google Scholar] [CrossRef]
- Desouza, C.D.; Marsh, D.J.; Beevers, S.D.; Molden, N.; Green, D.C. A Spatial and Fleet Disaggregated Approach to Calculating the NOX Emissions Inventory for Non-Road Mobile Machinery in London. Atmos. Environ. X 2021, 12, 100125. [Google Scholar] [CrossRef]
- Balogh, J.M. The Impacts of Agricultural Subsidies of Common Agricultural Policy on Agricultural Emissions: The Case of the European Union. Agric. Econ. 2023, 69, 140–150. [Google Scholar] [CrossRef]
- Majewski, S.; Mentel, G.; Dylewski, M.; Salahodjaev, R. Renewable Energy, Agriculture and CO2 Emissions: Empirical Evidence From the Middle-Income Countries. Front. Energy Res. 2022, 10, 921166. [Google Scholar] [CrossRef]
- Castellani, B.; Morini, E.; Filipponi, M.; Nicolini, A.; Palombo, M.; Cotana, F.; Rossi, F. Comparative Analysis of Monitoring Devices for Particulate Content in Exhaust Gases. Sustainability 2014, 6, 4287–4307. [Google Scholar] [CrossRef]
- Hörtenhuber, S.J.; Größbacher, V.; Schanz, L.; Zollitsch, W.J. Implementing IPCC 2019 Guidelines into a National Inventory: Impacts of Key Changes in Austrian Cattle and Pig Farming. Sustainability 2023, 15, 4814. [Google Scholar] [CrossRef]
- Hagan, R.; Markey, E.; Clancy, J.; Keating, M.; Donnelly, A.; O’Connor, D.J.; Morrison, L.; McGillicuddy, E.J. Non-Road Mobile Machinery Emissions and Regulations: A Review. Air 2023, 1, 14–36. [Google Scholar] [CrossRef]
- Walus, K.J.; Wargula, L.; Krawiec, P.; Adamiec, J.M. Legal Regulations of Restrictions of Air Pollution Made by Non-Road Mobile Machinery-the Case Study for Europe: A Review. Environ. Sci. Pollut. Res. 2018, 25, 3243–3259. [Google Scholar] [CrossRef]
- Szymlet, N.; Lijewski, P.; Fuć, P.; Sokolnicka, B.; Siedlecki, M. Comparative Analysis of Passenger Car and Non-Road Machinery Specific Emission in Real Operating Conditions. In Proceedings of the 2018 International Interdisciplinary Ph.D. Workshop (IIPhDW), Swinoujscie, Poland, 9–12 May 2018; pp. 226–230. [Google Scholar]
- Poulsen, T.S. Market Analysis for Non-Road Mobile Machinery Sector; Scandinavian GPP Alliance: Copenhagen, Denmark, 2017; p. 40. [Google Scholar]
- US EPA 2017 National Emissions Inventory (NEI) Data. Available online: https://gispub.epa.gov/neireport/2017/ (accessed on 24 September 2021).
- Impact Assessment Accompanying the Document “Review of Directive 97/68/EC on Emissions from Engines in Non-Road Mobile Machinery in View of Establishing a New Legislative Instrument” 2010. Available online: https://eur-lex.europa.eu/legal-content/en/ALL/?uri=CELEX%3A52014SC0282 (accessed on 18 July 2023).
- Helms, H.; Jamet, M.; Heidt, C. Renewable Fuel Alternatives for Mobile Machinery; Institut für Energie-und Umweltforschung: Heidelberg, Germany, 2017. [Google Scholar]
- Johnson, T.; Joshi, A. Review of Vehicle Engine Efficiency and Emissions. SAE Int. J. Engines 2018, 11, 1307–1330. [Google Scholar] [CrossRef]
- Liu, Y.; Shao, L.; Wang, W.; Chen, J.; Zhang, H.; Yang, Y.; Hu, B. Study on Fugitive Dust Control Technologies of Agricultural Harvesting Machinery. Agriculture 2022, 12, 1038. [Google Scholar] [CrossRef]
- Streimikiene, D.; Baležentis, T.; Baležentienė, L. Comparative Assessment of Road Transport Technologies. Renew. Sustain. Energy Rev. 2013, 20, 611–618. [Google Scholar] [CrossRef]
- Zeiner, M.; Landgraf, M.; Knabl, D.; Antony, B.; Barrena Cárdenas, V.; Koczwara, C. Assessment and Recommendations for a Fossil Free Future for Track Work Machinery. Sustainability 2021, 13, 11444. [Google Scholar] [CrossRef]
- Dallmann, T. Costs of Emission Reduction Technologies for Diesel Engines Used in Non-Road Vehicles and Equipment; International Council on Clean Transportation: Washington, DC, USA, 2018; p. 24. [Google Scholar]
- Bie, P.; Ji, L.; Cui, H.; Li, G.; Liu, S.; Yuan, Y.; He, K.; Liu, H. A Review and Evaluation of Nonroad Diesel Mobile Machinery Emission Control in China. J. Environ. Sci. 2022, 123, 30–40. [Google Scholar] [CrossRef]
- Dallmann, T.; Shao, Z.; Menon, A.; Bandivadekar, A. Non-Road Engine Technology Pathways and Emissions Projections for the Indian Agricultural and Construction Sectors; SAE International: Warrendale, PA, USA, 2017. [Google Scholar]
- Hou, X.; Tian, J.; Song, C.; Wang, J.; Zhao, J.; Zhang, X. Emission Inventory Research of Typical Agricultural Machinery in Beijing, China. Atmos. Environ. 2019, 216, 116903. [Google Scholar] [CrossRef]
- Zhao, M.; Shi, R.; Du, R.; Yao, L. The Pathway to China’s Carbon-Neutral Agriculture: Measures, Potential and Future Strategies. Chin. Political Sci. Rev. 2023, 8, 304–324. [Google Scholar] [CrossRef]
- Zhang, J.; Liu, L.; Zhao, Y.; Li, H.; Lian, Y.; Zhang, Z.; Huang, C.; Du, X. Development of a High-Resolution Emission Inventory of Agricultural Machinery with a Novel Methodology: A Case Study for Yangtze River Delta Region. Environ. Pollut. 2020, 266, 115075. [Google Scholar] [CrossRef]
- Lang, J.; Tian, J.; Zhou, Y.; Li, K.; Chen, D.; Huang, Q.; Xing, X.; Zhang, Y.; Cheng, S. A High Temporal-Spatial Resolution Air Pollutant Emission Inventory for Agricultural Machinery in China. J. Clean. Prod. 2018, 183, 1110–1121. [Google Scholar] [CrossRef]
- Ji, J.; Zhang, H.; Peng, D.; Fu, M.; He, C.; Yi, F.; Yin, H.; Ding, Y. Estimation of Typical Agricultural Machinery Emissions in China: Real-World Emission Factors and Inventories. Chemosphere 2022, 307, 136052. [Google Scholar] [CrossRef] [PubMed]
- Wang, F.; Li, Z.; Zhang, K.; Di, B.; Hu, B. An Overview of Non-Road Equipment Emissions in China. Atmos. Environ. 2016, 132, 283–289. [Google Scholar] [CrossRef]
- Lončarević, Š.; Ilinčić, P.; Šagi, G.; Lulić, Z. Energy Consumption and Emissions of Agricultural Machinery for Different Arable Landtypes. In Proceedings of the IX International Scientific Congress Agricultural Machinery 2021, Poznan, Poland, 23 June 2021; p. 79. [Google Scholar]
- EEA. EMEP/EEA Air Pollutant Emission Inventory Guidebook 2019; EEA: Copenhagen, Denmark, 2019. [Google Scholar]
- Notter, B.; Wüthrich, P.; Heldstab, J. An Emissions Inventory for Non-Road Mobile Machinery (NRMM) in Switzerland. J. Earth Sci. Geotech. Eng. 2016, 6, 273–292. [Google Scholar]
- Shao, Z. The Updated China IV Non-Road Emission Standards; The International Council on Clean Transportation: Washington, DC, USA, 2021. [Google Scholar]
- Winther, M. Danish Emission Inventories for Road Transport and Other Mobile Sources. Inventories until the Year 2018; Aarhus University, DCE—Danish Centre for Environment and Energy: Roskilde, Denmark, 2020; p. 132. [Google Scholar]
- Ruyssenaars, P.; Coenen, P.; Rienstra, J.; Zijlema, P.; Arets, E.; Baas, K.; Dröge, R.; Geilenkirchen, G.; ’t Hoen, M.; Honig, E.; et al. Greenhouse Gas Emissions in the Netherlands 1990–2019; Rijksinstituut voor Volksgezondheid en Milieu: Utrecht, The Netherlands, 2021. [Google Scholar]
- VTT Technical Research Centre of Finland TYKO Calculation Model for Working Machines. Available online: http://lipasto.vtt.fi/en/tyko/index.htm (accessed on 28 March 2020).
- Jerksjö, M.; Fridell, E.; Wisell, T. Non-Road Mobile Machinery Model—Updates 2015; IVL Swedish Environmental Research Institute: Stockholm, Sweden, 2015; p. 50. [Google Scholar]
- Al-Hanbali, H.; Genberg Safont, J.; Josefsson Ortiz, C.; Guban, P.; Eklund, V.; Kellner, M.; Yaramenka, K.; Kindbom, K.; Helbig, T.; Danielsson, H.; et al. Informative Inventory Report Sweden 2021; Swedish Environmental Protection Agency: Stockholm, Sweden, 2021; p. 331.
- Bacenetti, J. How Does Annual Utilisation Can Affect the Environmental Impact of Tractors? A Life-Cycle Assessment Comparing Hypothetical Scenarios for Farmers and Agricultural Contractors in Northern Italy. Biosyst. Eng. 2022, 213, 63–75. [Google Scholar] [CrossRef]
- Lijewski, P.; Merkisz, J.; Fuć, P.; Ziółkowski, A.; Rymaniak, Ł.; Kusiak, W. Fuel Consumption and Exhaust Emissions in the Process of Mechanized Timber Extraction and Transport. Eur. J. For. Res. 2017, 136, 153–160. [Google Scholar] [CrossRef]
- Ai, Y.; Ge, Y.; Ran, Z.; Li, X.; Xu, Z.; Chen, Y.; Miao, X.; Xu, X.; Mao, H.; Shi, Z.; et al. Quantifying Air Pollutant Emission from Agricultural Machinery Using Surveys-A Case Study in Anhui, China. Atmosphere 2021, 12, 440. [Google Scholar] [CrossRef]
- Statistics Netherlands Emissions in The Netherlands by Mobile Sources. Available online: https://opendata.cbs.nl/statline/portal.html?_la=en&_catalog=CBS&tableId=84735ENG&_theme=1128 (accessed on 24 April 2021).
- Statistic Sweden Emissions of Air Pollutants from Off-Road Vehicles and Other Machinery by Subsector (2018). Available online: http://www.statistikdatabasen.scb.se/pxweb/en/ssd/START__MI__MI0108/MI0108ArbMask/ (accessed on 10 April 2020).
- Lončarević, Š.; Ilinčić, P.; Lulić, Z.; Kozarac, D. Developing a Spatial Emission Inventory of Agricultural Machinery in Croatia by Using Large-Scale Survey Data. Agriculture 2022, 12, 1962. [Google Scholar] [CrossRef]
- Regulation (EU) 2016/1628 of the European Parliament and of the Council—Of 14 September 2016—On Requirements Relating to Gaseous and Particulate Pollutant Emission Limits and Type-Approval for Internal Combustion Engines for Non-Road Mobile Machinery, Amending Regulations (EU) No 1024/ 2012 and (EU) No 167/2013, and Amending and Repealing Directive 97/68/EC. Off. J. Eur. Union 2016, L252, 53–117.
- Helms, H.; Heidt, C.; Lehmphul, K. Erarbeitung eines Konzepts zur Minderung der Umweltbelastung aus NRMM (Non Road Mobile Machinery) unter Berücksichtigung aktueller Emissionsfaktoren und Emissionsverminderungsoptionen für den Bestand; Umweltbundesamt: Dessau-Roßlau, Germany, 2014. [Google Scholar]
Disclaimer/Publisher’s Note: The statements, opinions and data contained in all publications are solely those of the individual author(s) and contributor(s) and not of MDPI and/or the editor(s). MDPI and/or the editor(s) disclaim responsibility for any injury to people or property resulting from any ideas, methods, instructions or products referred to in the content. |
© 2023 by the authors. Licensee MDPI, Basel, Switzerland. This article is an open access article distributed under the terms and conditions of the Creative Commons Attribution (CC BY) license (https://creativecommons.org/licenses/by/4.0/).