Article

Effects of Geometric Parameters and Heat-Transfer Fluid Injection Direction on Enhanced Phase-Change Energy Storage in Vertical Shell-and-Tube System

School of Environmental and Municipal Engineering, North China University of Water Resources and Electric Power, Zhengzhou 450046, China
*
Author to whom correspondence should be addressed.
Sustainability 2023, 15(17), 13062; https://doi.org/10.3390/su151713062
Submission received: 1 August 2023 / Revised: 24 August 2023 / Accepted: 28 August 2023 / Published: 30 August 2023

Abstract

:
Internationally, energy-storage technologies have facilitated the large-scale utilization of renewable energy, reducing reliance on conventional power generation and enhancing energy efficiency. In the pursuit of strengthening the efficiency of phase-change energy-storage systems, the focus lies on further enhancing the efficiency of vertical shell-and-tube energy-storage systems. This study investigates the influence of two different heat-transfer fluid (HTF) injection directions on the melting of phase-change materials (PCM) in a vertical shell-and-tube latent heat storage (LHS) system. The melting behavior of PCM is analyzed under both pure conduction and natural convection conditions. The research findings reveal that during the initial melting stage, both HTF injection methods primarily rely on thermal conduction, resulting in no significant changes in PCM melting. However, in the later stages of natural convection, bottom HTF injection exhibits superior heat-transfer efficiency compared to top injection. Under a constant volume of phase-change material, both pipe length and pipe thickness affect the PCM melting process. As the pipe length increases within the range of 1.6 m to 0.2 m, the PCM melting time also increases. The results show that the melting time of the PCM is reduced by almost 15,000 s when the tube length H exceeds 800 mm, regardless of whether the heat-transfer fluid is injected at the top or bottom. In this paper, we also obtained results that the three composites containing 10% expanded graphite save 5.3%, 10.2%, and 14.3% of melting time, respectively, compared to pure paraffin when H = 200 mm and top injection are considered. For bottom injection, the three composites saved 7.7%, 12.5%, and 17.2% of melting time, respectively. This further emphasizes the more significant effect of priming in improving melting time.

1. Introduction

The human need for energy is growing along with science and technology advancement. According to figures from 69 nations, the amount of energy consumption has dramatically increased in developing nations including China, India, Brazil, Thailand, and South Africa [1]. However, there will also be an increase in energy consumption along with the rise in energy demand. For instance, waste heat production increases in industrial applications. Solar, wind, and other renewable energy sources are rarely utilized well in areas where they are very abundant. It will result in significant energy loss and waste. Therefore, on the one hand, we should actively promote the development of solar, wind, and other renewable energy sources. On the other hand, it is essential to industrial waste heat utilization and overall energy utilization efficiency. In terms of energy recovery, energy storage plays an important role when there is a need to fill the gap between energy supply and demand. Energy storage has emerged as a key energy-saving technology that is currently being researched.
Energy-storage technology has become a current research hotspot in the field of energy storage. Within existing research, energy-storage technology can be split into new energy storage and thermal energy storage. First, the new energy-storage technology is an energy-storage technology that uses output power and a balanced power supply. Second, sensible heat storage [2], latent heat storage [3], and thermochemical heat storage are the most common thermal energy-storage methods. Based on the available research, thermal energy storage offers several significant advantages over other forms of energy storage. These benefits include high energy conversion efficiency, substantial storage capacity, flexible regulation capabilities, and utilization of renewable energy sources. Moreover, thermal energy storage is often closely integrated with renewable energy sources, such as solar energy and wind energy. This symbiotic relationship improves the stability and reliability of renewable energy utilization and facilitates a smooth transition to clean energy. Thermal energy storage also has a long cycle life and good cycle stability, which can provide reliable energy supply support.
Because latent heat storage technology has a high heat storage capacity in a limited operating temperature range, it stands out in a series of current energy-storage technologies. Furthermore, thermal energy storage boasts a high energy-storage density, making it capable of holding significant amounts of energy in a compact space. As a result, it has recently gained popularity as a technology. Latent Thermal Energy-Storage Systems (LHTES) is one of these types of TES systems. According to current research, Latent LHTES generally exhibit a higher thermal storage capacity compared to sensible heat-sensitive materials. Based on latent heat storage systems, there are two main aspects of research. The first step is to improve the uniformity of heat transfer between the HTF and PCM. On the one hand, the pipeline’s layout and size are optimized to ensure that the HTF can flow more evenly through the PCM and improve the heat-transfer efficiency; On the other hand, by introducing auxiliary heat-transfer structures, like spiral or waveform pipes, the turbulent convection between HTF and PCM can be enhanced, resulting in a more uniform heat-transfer. The second consists of increasing the thermal conductivity of the PCM using additives and porous media with high thermal conductivity. Compounding different types of phase-change materials is the primary way to increase PCM’s thermal conductivity, thus improving the heat-transfer performance of phase-change composite materials and widening the range of PCM applications [4]. Latent heat energy storage can be divided into two types according to the form, one is direct contact energy storage and hydrothermal direct mixed energy storage, and the other is the energy-storage method that does not require direct contact, such as shell and capsule energy storage. The shell-and-tube heat storage device is unique among PCM containers due to its high efficiency and simple structure. It is believed to be a potential heat storage system that can achieve high energy density and efficient charging with minimal volume. In the existing research on shell-and-tube energy storage, shell-and-tube structures are mostly studied in vertical and horizontal structures. Before this, Dhaidan et al. [5] reviewed the analytical, numerical, and experimental methods used to study the melting/curing process of PCM in containers with different geometric shapes. Kang et al. [6] investigated indirect-contact M-TES containers with different tube bundle layouts and fin structures by means of numerical simulation. Francis Agyenim et al. [7] compared the performance of multi-tube and single-tube shell systems through experimental studies. Some scholars have also done a small amount of research on PCM placed in shell-and-tube horizontal structures. In recent years, Guo et al. [8] investigated the melting and solidification rates of PCM in ICM-TES vessels. It is proposed that adding EG to pure PCM can improve the melting and solidification performance of ICM-TES vessels. A numerical investigation has been performed on the laminar natural convection from a two-dimensional heated circular cylinder confined in a square enclosure filled with a phase-change material, namely lauric acid [9].Vertical shell-and-tube systems have been extensively studied by most scholars. Based on experimental and numerical results, Md Tabrez Alam et al. [4] investigated the effects of embedded metal foam at different positions relative to pure PCM (n-eicosane) on the discharging (solidification) characteristics. Agyenim and Hewitt [10] evaluated the experimental heat-transfer characteristics of longitudinal finned shell tubes using unit RT58 phase-change materials. The analysis results show that the HTF inlet temperature increased by 20%, the heat-transfer coefficient increased by 45%, and the melting time was reduced by 16%. The PCM melting in the vertical shell-and-tube LHS system can be divided into two types depending on the injection direction of the HTF: HTF entering from the top [11,12,13] and HTF entering from the bottom [14,15,16,17]. Trp et al. [12] studied the effects of operating conditions and geometric parameters on horizontal thermal energy-storage devices. Joybari et al. [11] compared the melting and solidification properties of single-tube and multi-tube heat exchangers through experiments based on vertical shell-and-tube structures. Yang et al. [13] studied the effect of adding annular fins to a vertical shell-and-tube heat reservoir with top HTF injection on the melting rate of PCM. To put it differently, Shahsavar et al. [17] employed the same method to examine the effect of adding fins on the melting of PCM injected with HTF at the bottom. The results show that the melting time is reduced by 23.9% due to the addition of fins. When comparing the melting of PCM with two different HTF injection directions, different scholars have given different research results. Longeon et al. [16] selected paraffin RT35 as PCM and tested the effect of two different injection directions of HTF on the melting rate of PCM in vertical heat reservoir through experiments. Their observation was that the melting time of HTF injected at the top was shorter than that of that injected at the bottom. However, Han et al. [14] and Kurnia et al. [15] found that the PCM melting time of bottom-injected HTF was faster than that of top-injected. Therefore, the influence of the injection direction of HTF on the melting time of PCM still needs to be further studied. According to the analysis above, research significance of vertical shell-and-tube heat storage is higher than that of horizontal shell-and-tube heat storage. It is necessary to conduct more research on the geometric parameters of vertical shell-and-tube heat storage, optimize the heat-transfer medium, and enhance the heat-transfer mode. The objective of this research is to improve the heat-transfer efficiency of melting and solidification, resulting in broader research prospects and significant implications.
The influence of inner and outer pipe diameter size and pipe length has been extensively studied through experimental testing and numerical simulation. The results show that the pipe diameter and pipe length of the shell play a crucial role in the energy-storage system. Ismail and Goncalves [18] pointed out that the melting time of PCM could be reduced by reducing the ratio of inner and outer tube radii. The influence of the tube radius on the thermal performance of the vertical heat reservoir was tested experimentally by Sedegh et al. [19], and the results showed that the charge and discharge times decreased with the increase of the diameter of the tube. Changda Nie et al. [20] investigated the effect of thickness-to-height ratio and nanoparticle concentration on the properties of phase-change materials. In summary, previous studies have focused on comparing the impact of single tubes, multi-tubes, and different HTF injection directions on the melting rate of PCM in vertical heat reservoirs. However, these studies have not investigated the influence of geometric parameters, such as pipe diameter and length, and their proportional relationship, on the melting rate of PCM under different HTF injection directions. Therefore, this paper presents a numerical investigation of the vertical shell-and-tube phase-change energy-storage device, taking into account the orientation of HTF injection, pipe length, and PCM thickness while maintaining a constant volume. The simulation results examine the impact of pipe geometry parameters on the phase-change rate. Additionally, the study explores the effect of altering the thermal conductivity of PCM by incorporating expanded graphite with varying mesh numbers on the melting rate in different injection directions. The energy-storage system’s heat-transfer efficiency and energy-storage density can be improved by these results, which can also promote the effective use of renewable energy. Second, it provides a benchmark for the optimized design of the shell-tube phase-change energy-storage module, which improves the stability and reliability of the energy-storage system. Such optimization holds immense promise in delivering heightened efficiency, dependability, and sustainability in engineering applications, thus spearheading advancements and groundbreaking innovations in the realm of energy.

2. Numerical Simulation

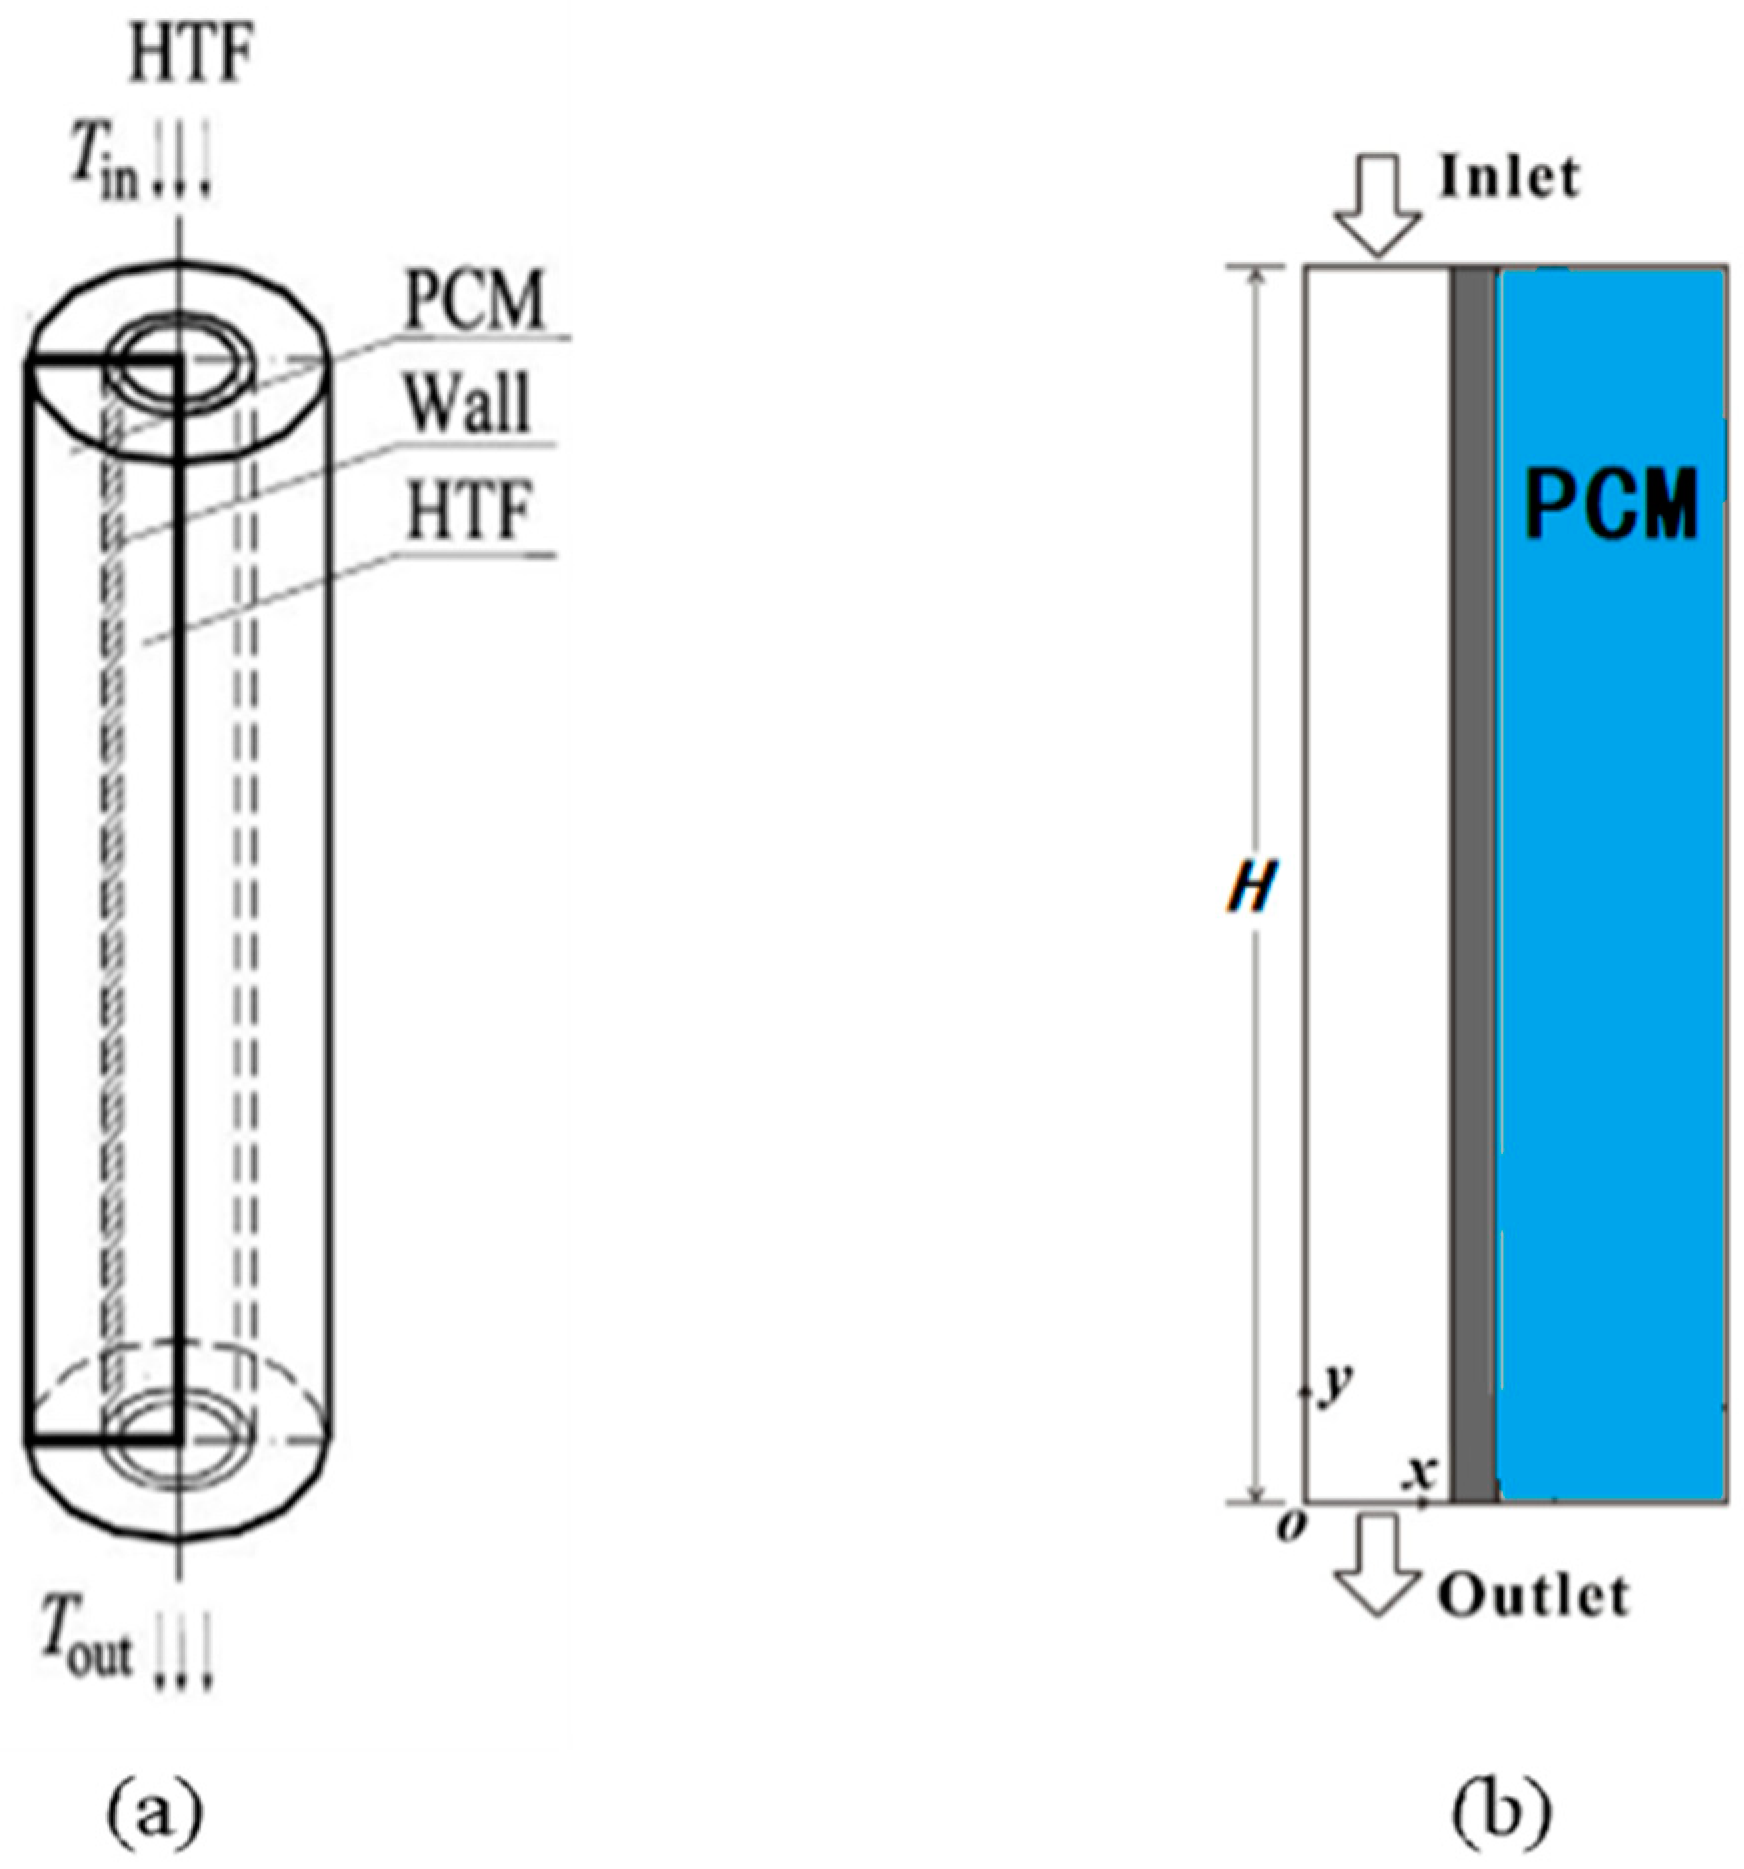
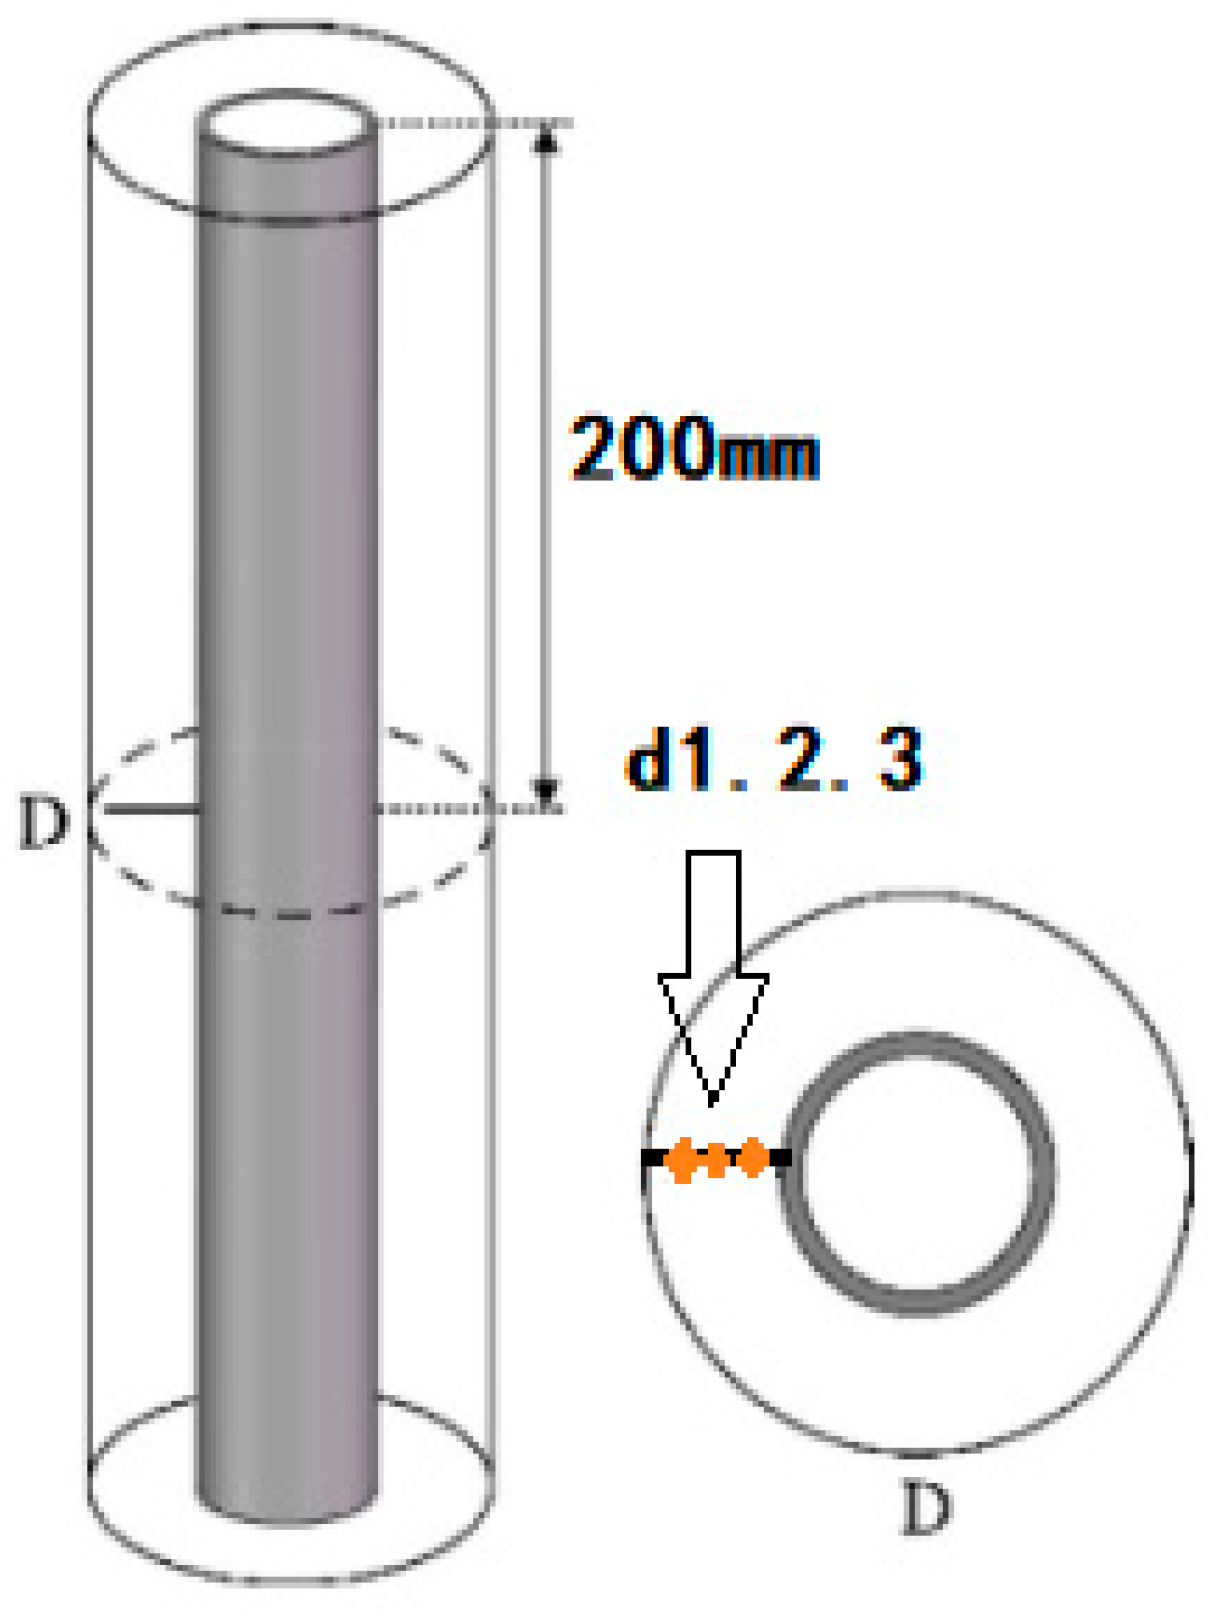
2.1. Physical Models and Computational Domains

As illustrated in Figure 1a, a numerical model of a vertical shell-and-tube latent heat storage unit is designed in this research. The numerical model is physically validated by comparing the prediction to the experimental results. A container and an HTF tube comprise the shell-and-tube latent heat storage system, and HTF flows through the HTF tube by forced convection. The shell space between the container and the tube is filled with PCM. The heated fluid heats the PCM throughout the charging process, and when the PCM melts, the heat is stored. The PCM solidifies during discharge, and the stored heat is transferred to the cool fluid. The heat-transfer mechanism between the HTF tube and the surrounding PCM occurs in a boundary layer around each tube in the container. As a result, the shell-and-tube energy storage unit explored in this study has an external boundary adiabatic boundary condition, which can represent the evaluated thermal storage system. The model is primarily made up of two concentric cylinders with lengths (H) of 400 mm, one large with a radius (R0) of 22 mm with the tube wall in direct contact with PCM, and one tiny with a radius (R1) of 7.5 mm. HTF is injected into the cylinder, and a 2.5 mm thick fluid-structure coupling surface outside the cylinder is in direct contact with PCM. As demonstrated in Figure 1b, PCM chose paraffin RT35 as an energy-storage material and filled the annular space. HTF is an incompressible Newtonian fluid with laminar flow. Water is utilized as a heat-transfer fluid, and it enters the tube from the top at a constant speed and temperature, with an inlet temperature of 52 °C. Hot water is continuously introduced into the tube at a constant velocity of 0.1 m·s−1 to induce a laminar flow, with a Reynolds number below 2300 based on the tube’s diameter. The latent heat storage unit commences with a uniform initial temperature, wherein the PCM may exist in a molten solid state or a solidified liquid state. Both the PCM and the LHTES commence at 22 °C. As the hot water, acting as the HTF, traverses the tube, convective heat transfer occurs between the HTF and the inner wall. Through the fluid-solid coupling interface, thermal energy is transferred and stored within the PCM occupying the annular space. Two distinct injection modes were considered, one involving the top injection of hot water (Figure 2a), and the other involving the bottom injection (Figure 2b). The model’s inherent axisymmetric nature allows for the analysis of only half of the two-dimensional computational domain (Figure 2c) to reduce computational expenses while facilitating a comprehensive investigation of flow and heat-transfer phenomena and fostering an improved understanding of the shell-and-tube phase-change energy-storage system’s performance. And the LHS unit structure is shown in Figure 3.

2.2. Governing Equation

For HTF, fluid flow and convective heat transfer are controlled by the following equations [21]:
u = 0
ρ H T F u t + ρ H T F ( u ) = p + μ H T F 2 u
ρ H T F c p H T F T t + ρ H T F c p H T F u T = ( k H T F T )
The interface between HTF and the pipe wall is conjugate, and conjugate heat transfer needs to be considered:
T H T F = T t u b e , k H T F T H T F n = k t u b e T t u b e n
Here, ρHTF, cpHTF, and kHTF are density, specific heat, and thermal conductivity, respectively. T is the temperature, and t stands for time. The subscripts HTF and tube stand for HTF and tube, respectively.
During phase transition, solid phase-change materials gradually melt over time. It is also assumed that the thermophysical properties of PCM and injected HTF remain unchanged during the natural convection of the molten phase. In addition to the density of PCM in the liquid phase, fluid motion in the liquid phase is assumed to be Boussinesq free convection. The heat transfer during the melting process is governed by the energy equation, and for the sake of simplicity, the volume expansion resulting from the melting of paraffin is neglected. Additionally, the local natural convection within the molten PCM is characterized by the continuity equation and the momentum equation. The transient phase transition heat transfer in conjunction with local natural convection is represented by the following equation:
u = 0
ρ f u t + ρ f ( u ) u = P + μ f 2 u + ρ f g β ( T f T m ) + A u
ρ f c p f T f t + ρ f c p f u T f = ( k f T f ) ρ f L f l t
where A in the above equation is introduced as the damping coefficient, which is used to damp the velocity of the solidified phase, given by the following formula from [21]:
A = C ( 1 f l ) S + f l 3
where C and S are the coefficients defined by Fluent, it is recommended to be very large (1 × 10¹⁵) and very small (1 × 10⁻¹⁰), respectively. fl is the melting fraction in PCM, which is determined by the representative temperature of the paste region:
f l = { 0 a t T < T s o l i d u s s o l i d T T l i q u i d u s T l i q u i d u s T s o l i d u s a t T s o l i d u s < T < T l i q u i d u s m u s h y 1 a t T > T s o l i d u s l i q u i d a t a t a t T < T s o l i d u s T s o l i d u s < T < T l i q u i d u s T > T s o l i d u s s o l i d m u s h y l i q u i d
This numerical simulation employs paraffin RT35 as the chosen energy-storage medium. The thermal properties and parameters of paraffin RT35 are detailed in Table 1.

2.3. Initial and Boundary Conditions

In the numerical simulation of the PCM melting process, we initialize the PCM at 295 K, while the HTF (water) entering the system is set to 325 K. The thermal fluid velocity at the inlet is maintained at 0.1 m·s−1, with the boundary conditions set as velocity inlet and pressure outlet at the inlet and outlet of the pipeline, respectively. The central axis of the energy storage unit depicted in Figure 1a serves as the axis boundary of the model. To align with practical scenarios, we consider the shell surface to be adiabatic, meaning no heat exchange occurs with the environment. Moreover, the interface between the thermal fluid and the phase-change material is regarded as the coupled thermal boundary. It promotes conjugate heat transfer and realizes heat exchange between the two. With the above setup, we can effectively simulate the PCM melting process in numerical simulations, taking into account the crucial phenomena of heat transfer and interface exchange between HTF and PCM. These well-defined settings serve as a foundation for subsequent model validation, ensuring the accuracy and reliability of the calculated results.

2.4. Numerical Process

For the shell-and-tube Latent Heat Thermal Energy-Storage structure, we employ the commercially available software ANSYS-Fluent 2022 R1 for conducting numerical calculations. Hexahedral elements are utilized to discretize both the HTF and PCM domains. To address the heat-transfer problem during the PCM melting process, we have developed a finite-volume method (FVM-Based) to accurately solve the equations governing the phenomenon. In our numerical modeling, we duly account for the phase transformation heat storage phenomenon that occurs during the PCM melting process, leading to significant phase state changes within the system. Consequently, it is imperative to account for the natural convection effect induced by gravity. To accomplish this, we define the acceleration of gravity in the y-direction as −9.81 m·s−2 within the Fluent software. In the model, we consider the liquid phase of PCM as a Newtonian incompressible fluid and assume a laminar flow regime. To configure the appropriate options, access the relevant model and select the suitable model type. Since the density varies linearly with the liquid phase temperature, we employ the Boussinesq hypothesis to approximate the buoyancy effects arising from natural convection during the melting process. For numerical computations, we utilize a pressure correction algorithm to handle the pressure correction equation, while the momentum and energy equations are solved using a second-order upwind difference scheme. To ensure continuity and convergence of the momentum and energy equations, we carefully define the under-relaxation factors for various equations as follows: For the momentum equation, the under-relaxation factor is set to 0.4, for the pressure correction equation it is set to 0.5, for the energy equation it is set to 0.8, and for the liquid fraction equation, it is set to 0.7. These well-chosen under-relaxation factors play a critical role in achieving stable and accurate numerical solutions during the simulation. Furthermore, we define the residual values for the continuity, momentum, and energy equations as 10−6, 10−6, and 10−9, respectively. These residual values serve as convergence criteria, ensuring that the solutions for these equations reach a high level of accuracy and stability during the numerical calculations.

2.5. Grid Independence Verification and Time Step Determination

To verify the independence of grid division in the numerical simulation, three grids with different cell numbers, namely 98,545, 113,693, and 132,545, were adopted in this paper, and temperature data were collected at the monitoring point d2. By drawing the temperature curve in Figure 4a and conducting a comparative analysis, it is found that there is little difference in temperature change under the three grids. Therefore, it is concluded that when the number of grids is greater than or equal to 98,545, the accuracy of the calculation results has nothing to do with the grid division. Considering the requirement of computing resource allocation and accuracy, this paper selects the partition with a grid number of 113,693 for further model verification. Furthermore, the variation of the melting fraction over time was examined at four different time steps: 0.50 s, 0.10 s, 0.05 s, and 0.02 s, as depicted in Figure 4b. After evaluating both the accuracy of the calculation results and the computational cost, a time step of 0.05 s was selected to maintain the solution’s stability. For the numerical simulation, a mesh size of 0.3 mm (x) × 0.3 mm (y) was utilized. This mesh configuration ensures an appropriate level of resolution for the problem at hand. To ensure the convergence of the results, the maximum number of iterations was set to 20. This ensures that the simulation reaches a stable solution within a reasonable computational time frame.

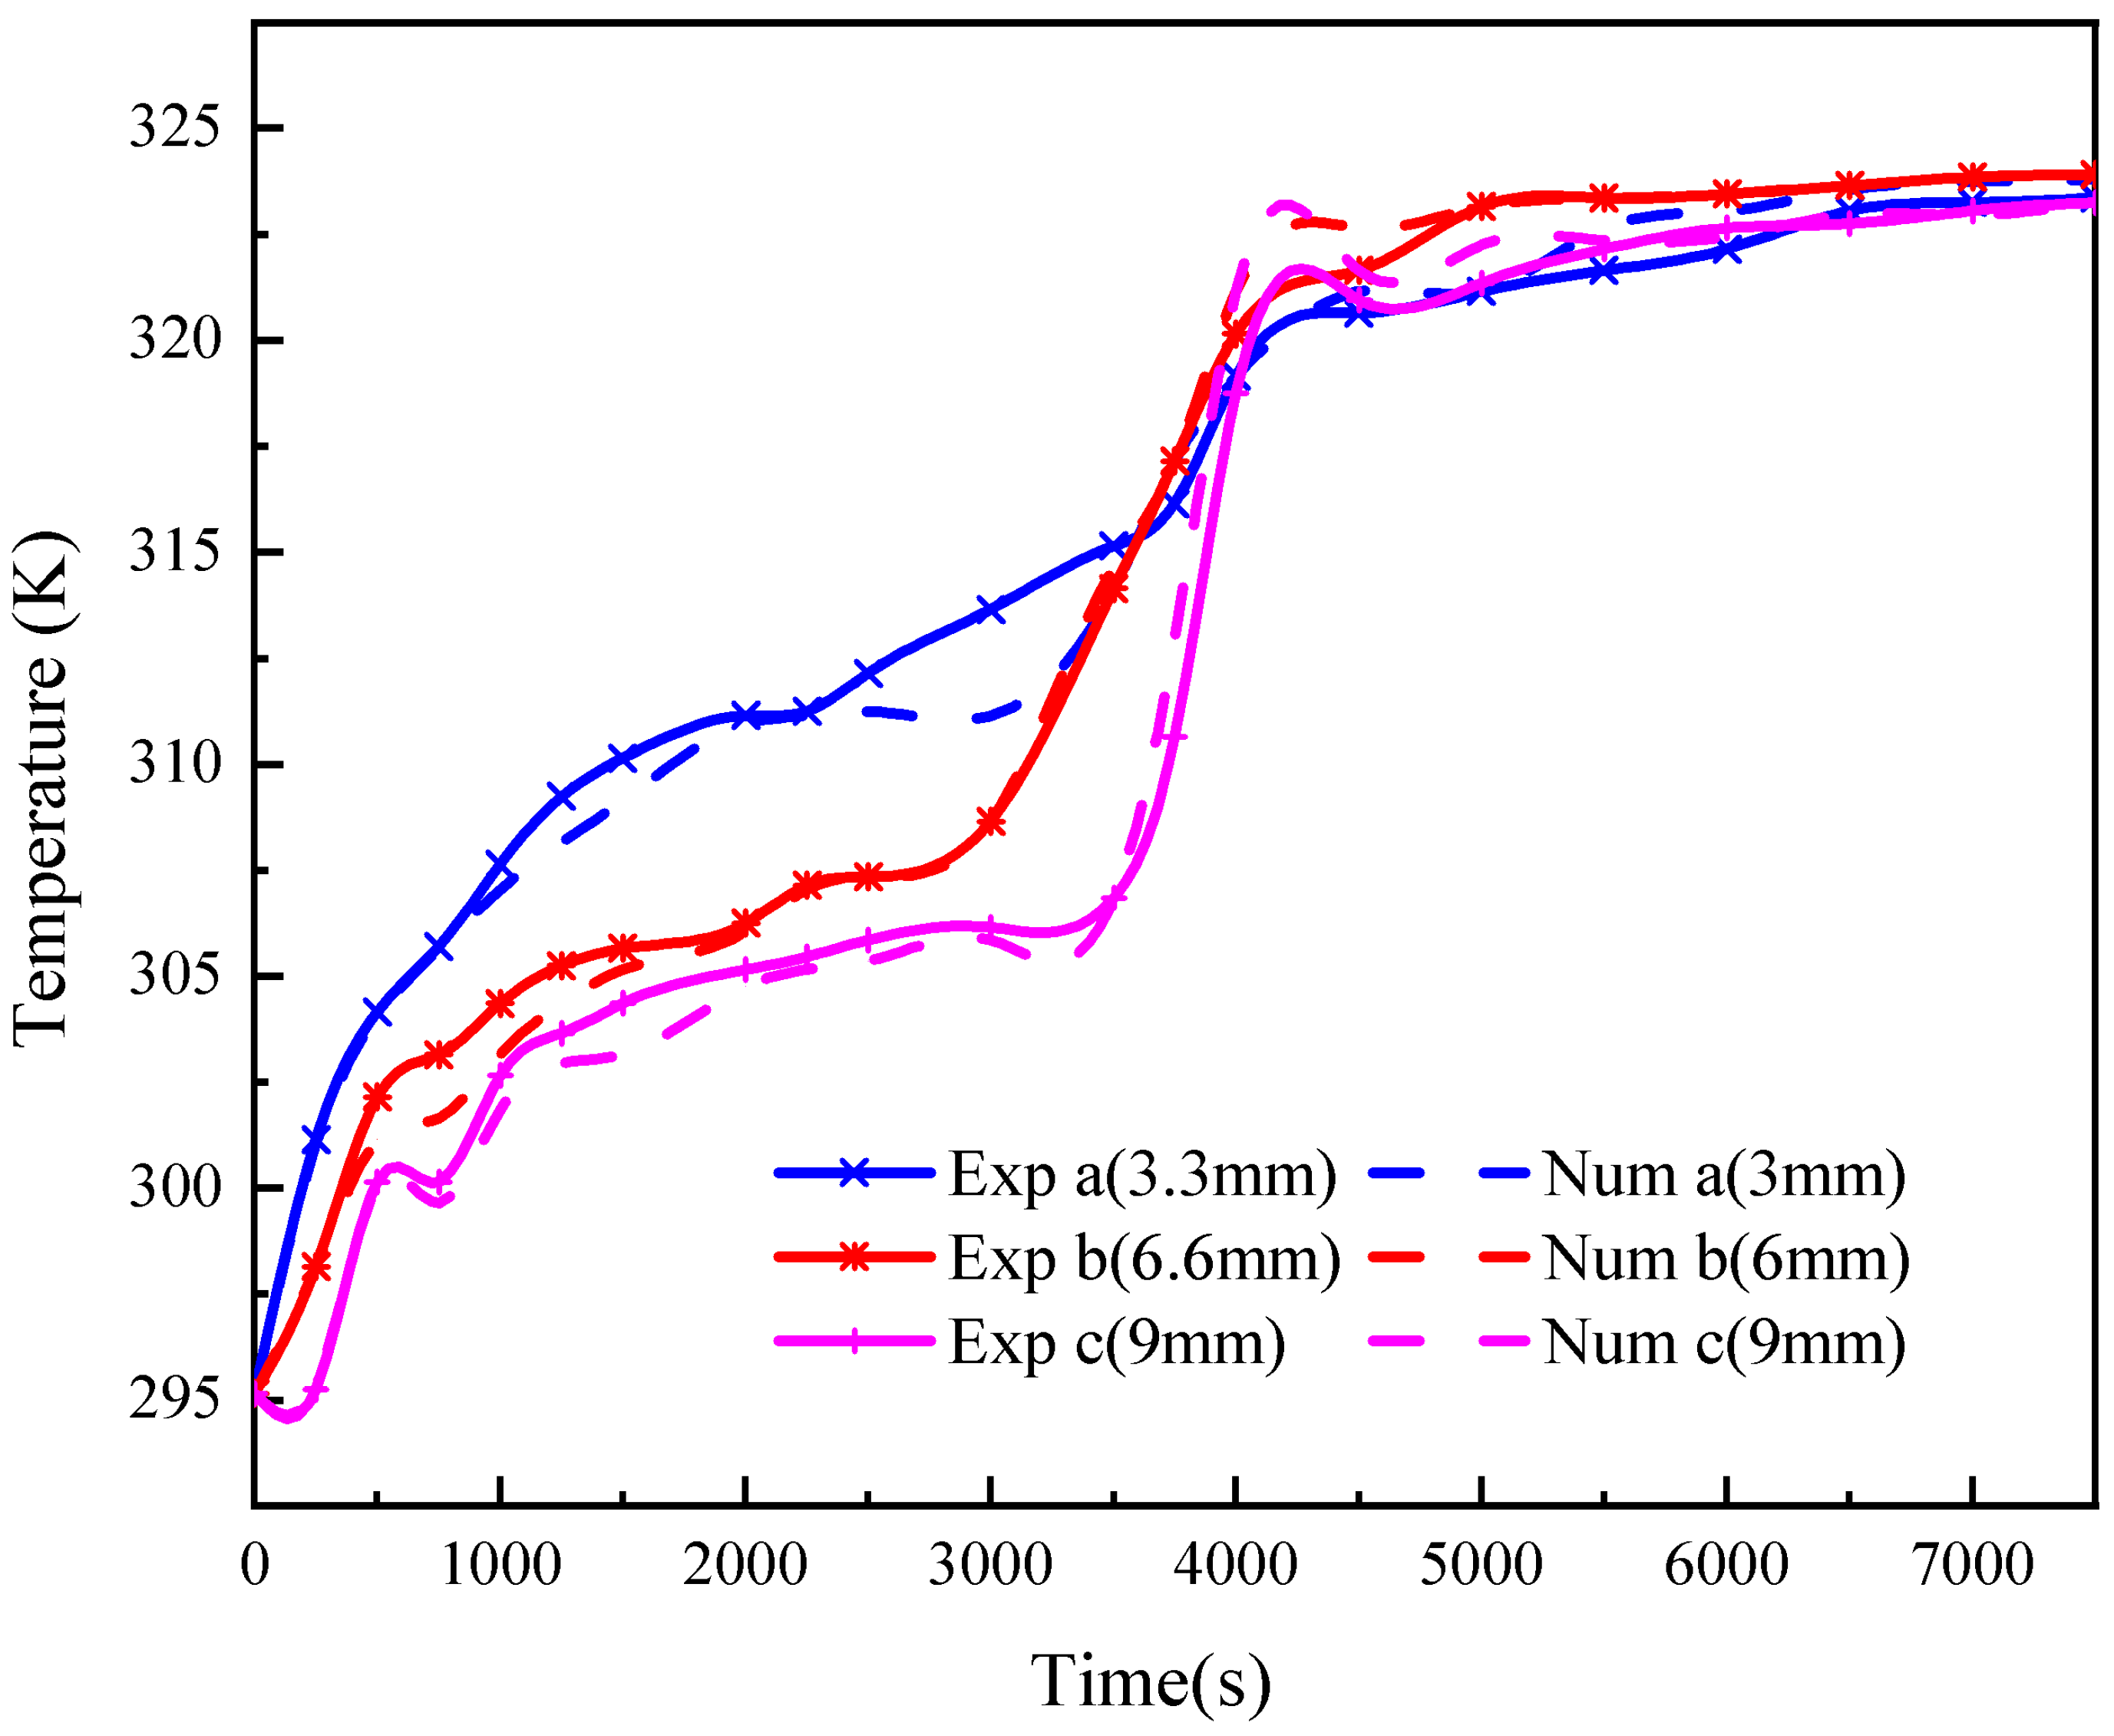
2.6. Verification of Experiments and Simulations

To verify the accuracy of the numerical simulation, the numerical model in this paper is compared with the experimental results in the literature [16]. The experiment studied a vertical concentric cylinder shown in Figure 2a, which contains the use of paraffin RT35 as an organic phase-change material (PCM), with water being used as a heat-transfer fluid (HTF), injected from the top. To monitor temperature changes in the PCM, specific locations on section D were chosen as fixed points [16], and thermocouples were installed at these positions. These thermocouples were installed at radial distances of 3.2 mm, 6.6 mm, and 9.3 mm from the inner tube, as illustrated in Figure 3. The placement of these thermocouples allows for accurate measurement and recording of temperature variations within the PCM during the thermal energy-storage process. During the charging process with top injection of HTF, the temperature changes at various radial positions were recorded and plotted in Figure 5. The figure presents a comparison of the experimental data with the results obtained from numerical simulations. Based on the representation of the experimental results as solid lines and the numerical results as dashed lines in Figure 5, a clear observation can be made. The comparison of the experimental curve and the numerical simulation curve during the charging process reveals a striking similarity between the two. This similarity strongly indicates that the numerical simulation effectively captures the observed phenomena.

3. Results and Discussion

To investigate the impact of different pipe diameters and lengths on the melting rate of PCM while maintaining the same PCM volume, we imposed certain specifications. Specifically, we set the pipe diameter radius (R1) of the HTF to a constant value of 7.5 mm. The volume of PCM within the pipe was kept constant throughout the study. However, the thickness D (where D = R0 − R1 − 2.5) of the PCM varied with changes in its height H. By maintaining a fixed PCM volume and adjusting the PCM’s height and thickness, we aimed to isolate and assess the effects of different pipe dimensions on the PCM’s melting rate, allowing for a comprehensive analysis of the system’s performance under various conditions. Table 2 lists the detailed geometric parameters of each shell-and-tube LHS unit studied.

3.1. Effect of HTF Injection Direction on PCM Melting

In the charging process of the phase-change energy storage unit with HTF on top, the melting heat transfer may involve a local natural convection phenomenon. Local natural convection can enhance the heat-transfer effect of PCM and promote the evolution of solid–liquid interface. However, there has been controversy in previous studies about the effect of local natural convection on the melting of PCM in top-injected HTF. Certain studies [16] disregard or refute the impact of local natural convection on the PCM melting process, while others [22] thoroughly acknowledge its role and emphasize that local natural convection is equally significant in both top-injected and bottom-injected HTF cases for PCM melting. Figure 6 shows the influence of natural convection or not on the melting fraction of PCM. The figure clearly illustrates that the presence of natural convection significantly enhances the melting efficiency of PCM. The completion of the entire melting process takes only 7521 s with the consideration of natural convection, which is approximately half the time taken in the absence of natural convection (13,500 s). This substantial difference in melting times emphasizes the crucial role that natural convection plays in expediting the melting process.

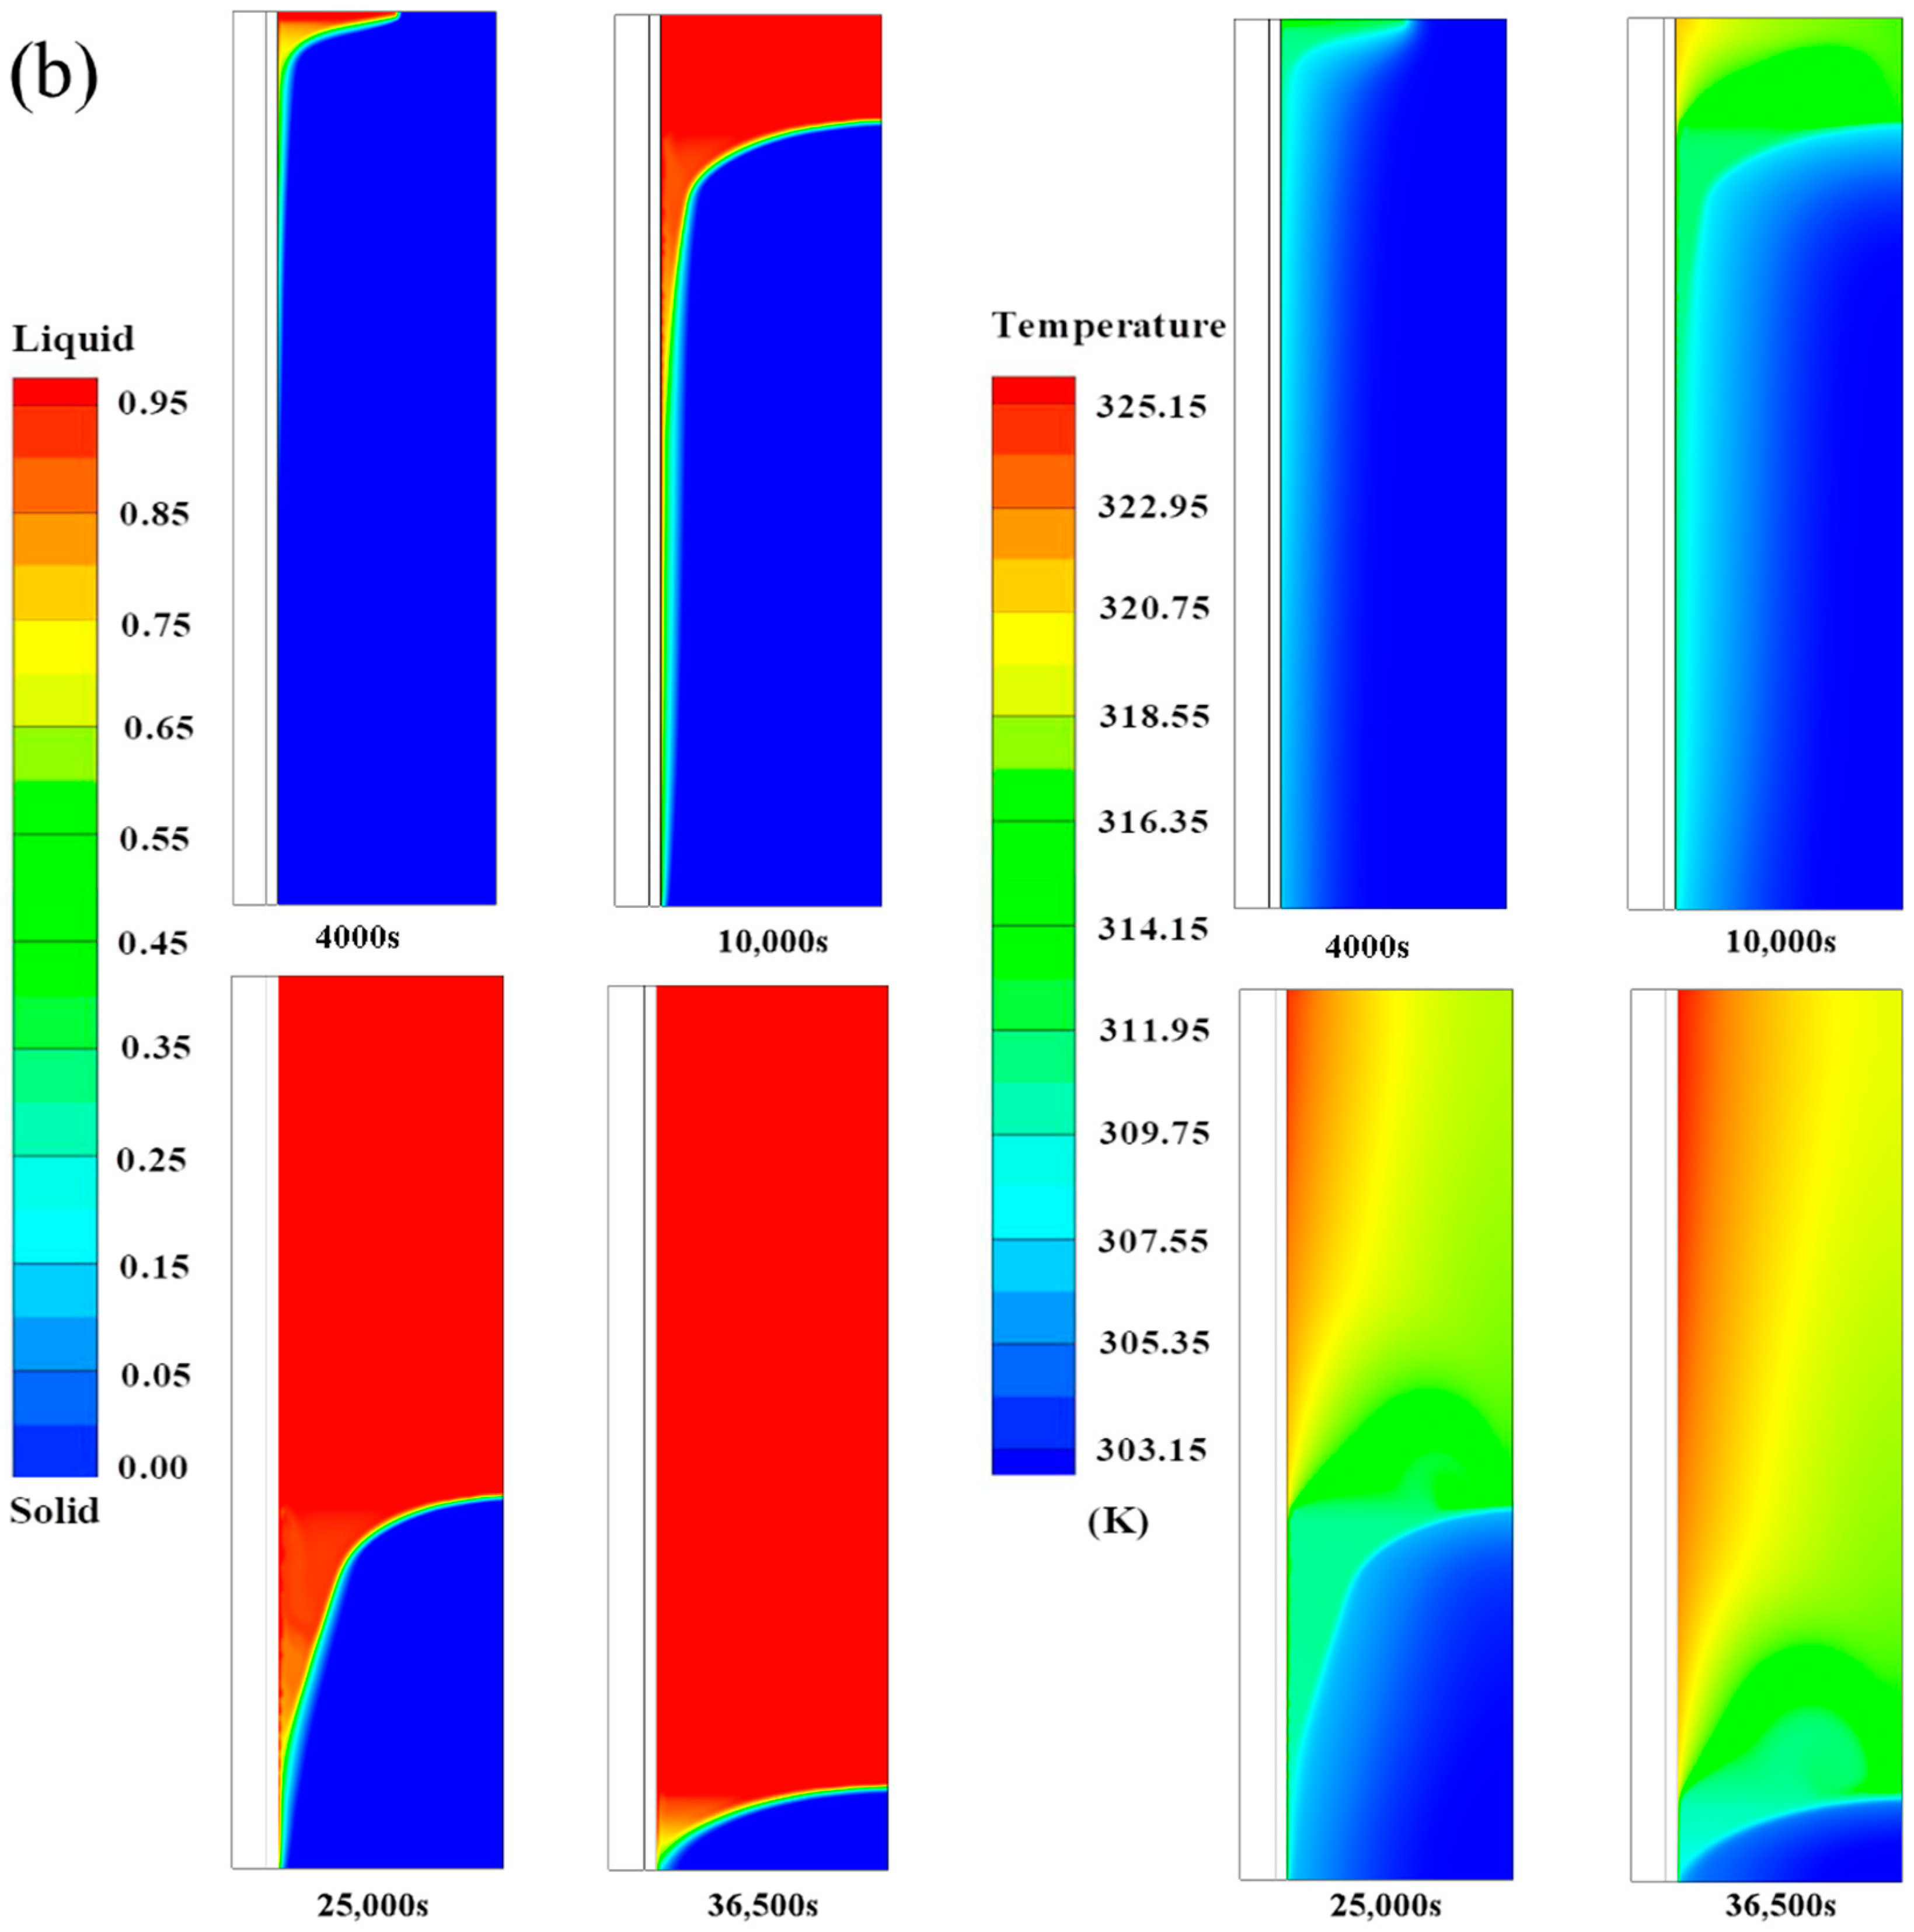
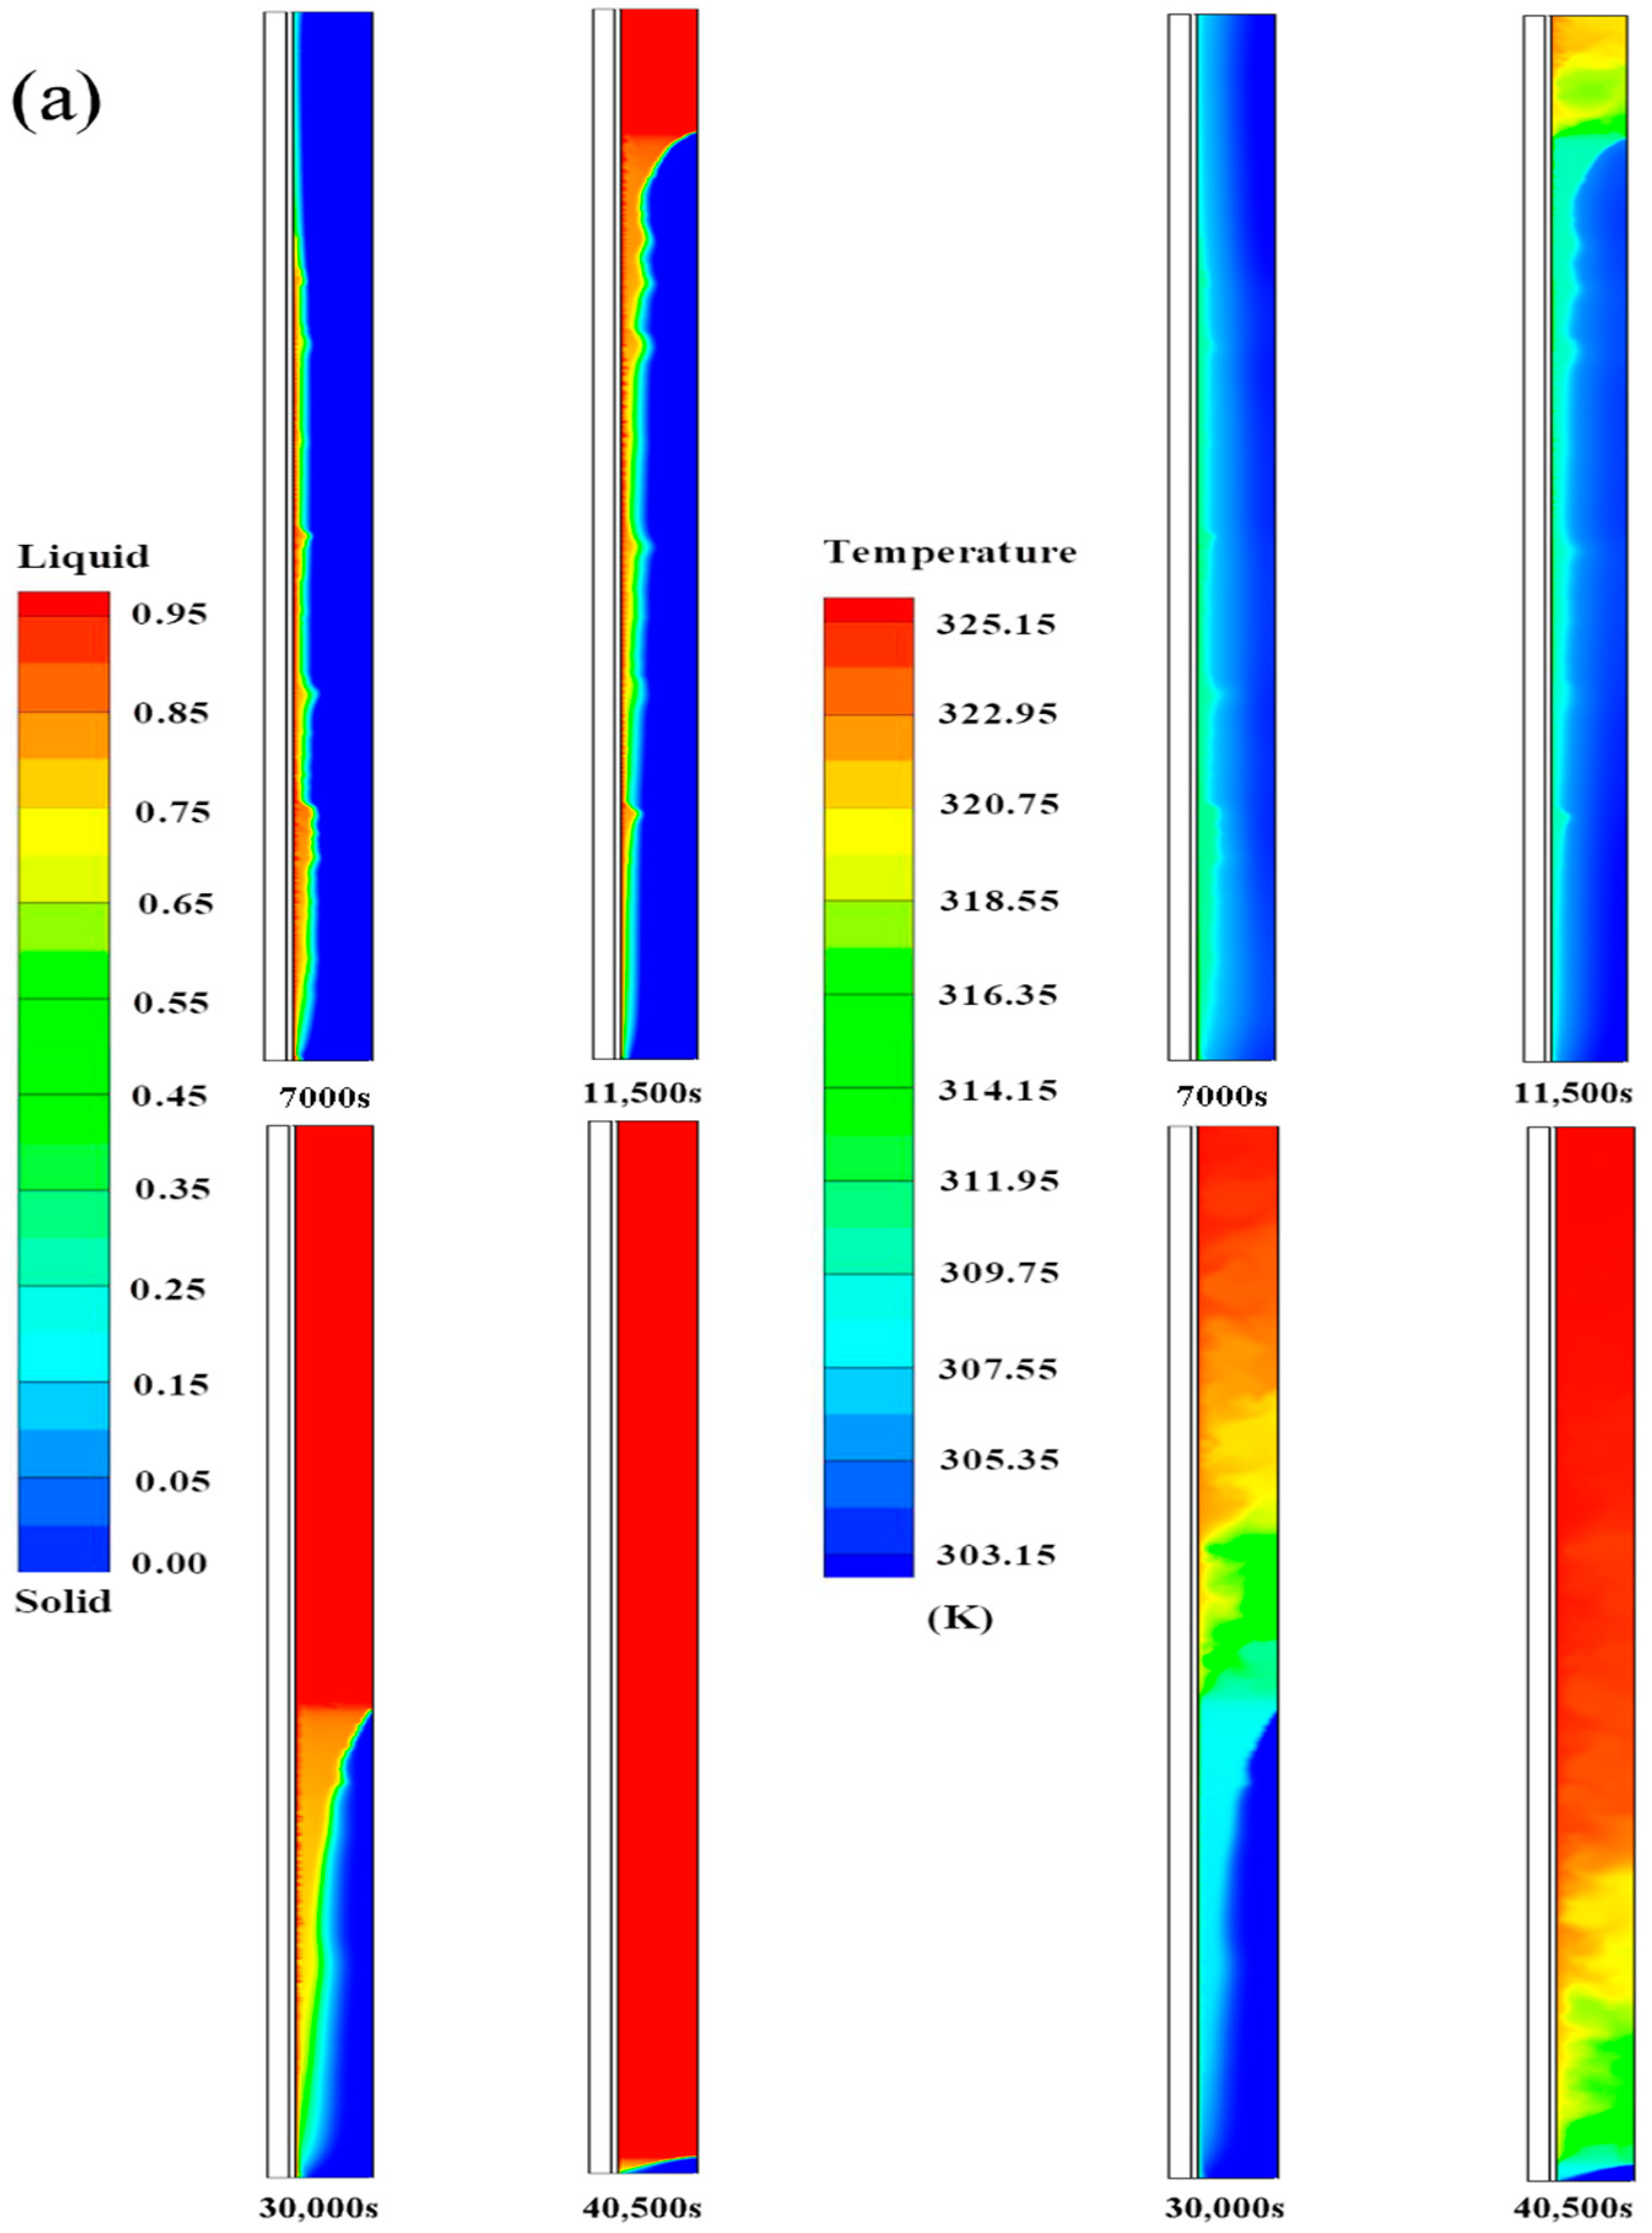
3.1.1. Evolution of Solid–Liquid Interface and Isotherm of PCM Injected at the Top of HTF

In the 12 top-injection scenarios, regardless of the tube wall’s thickness and length, a thin layer of melted PCM forms at the junction of the HTF tube wall and PCM during the initial stage of melting. This phenomenon is attributed to the dominant heat conduction at the early melting stage, as depicted in Figure 6. Before melting, the movement of PCM down the cylinder follows a regular pattern due to the presence of natural convection. After the initial pure heat conduction process, PCM melting initiates and continues if there is sufficient PCM. As the melting time progresses, the influence of natural convection becomes evident, leading to noticeable PCM melting above the shell. In addition, the temperature cloud map in Figure 7 shows a higher temperature gradient in the upper region. The hot PCM is located at the top and the cold PCM is located at the bottom, forming a temperature thermosphere in the center. As the PCM continues to heat and melt, the thermosphere exhibits a certain regular downward movement. The velocity vector diagram reveals that natural convection in the molten PCM primarily influences the region near the melting front but not the already melted portion (upper half of the PCM region). The top portion of PCM heats up the fastest, as it is in proximity to the injection port. In the context of latent heat storage systems, the melting front propagates relatively slowly in the vertical direction, resulting in a low melting rate and extended melting time. To address this issue and enhance the efficiency of PCM melting, one approach involves increasing the radial propagation speed of the melting front. This can be achieved by introducing radial fins near the bottom of the storage system to augment the radial channel of heat conduction, which is shorter than the vertical direction and aids in expediting the melting process. Implementing such improvement measures can lead to more efficient energy storage and release in the latent heat storage system.
In this study, under conditions of equal volume, PCM exhibits the fastest melting rate when the operating height H is maximized. The average temperature variations of PCM for 12 different scenarios with top HTF injection are shown in Figure 8. From the curves, it can be observed that at the initial stage of PCM melting, the slope is relatively small, indicating a slow change in temperature over time. This slow temperature rise is attributed to the limited heat received by PCM as HTF has not fully entered the HTF pipeline at the beginning. As the HTF gradually fills the system, the PCM temperature rises, eventually reaching its melting point and initiating the melting process. As the melting time increases, the temperature rises accordingly. During the late stages of melting, the average temperature of PCM approaches the inlet temperature of HTF, resulting in a decreasing rate of temperature change over time. Among the 12 scenarios with top HTF injection, when H exceeds 800 mm, the slopes of the average PCM temperature curves over time are greater than those of the other scenarios. Hence, under constant volume conditions, a longer tube length (H > 800 mm) results in more pronounced variations in the average PCM temperature over time. Therefore, the less time it takes to melt it, and the melting time is shortened by nearly 15,000 s.

3.1.2. Evolution of Solid–Liquid Interface and Isotherm of PCM Injected at the Bottom of HTF

The changes in the solid–liquid interface and isotherm of each PCM under the 12 different processes, with HTF injected at the bottom, are depicted in Figure 9. The PCM melting process under the bottom injection of HTF can be described as follows: Initially, a thin layer of PCM melts vertically from the bottom to the top of the inner tube, facilitated by the presence of natural convection, which enhances heat exchange between PCM and HTF. Subsequently, as the HTF reaches the top of the PCM, the melting process begins for the top portion of the PCM. Finally, due to the effect of natural circulation, the remaining PCM gradually melts from the top downwards, ultimately completing the PCM melting process. This approach minimizes energy waste and efficiently utilizes heat energy. In the initial analysis, when the PCM first melted for 4500 s, a thin melting layer of PCM formed at the interface between HTF and PCM. This melt layer exhibits similar characteristics to the top-injected melt layer shown in Figure 7b, being thicker on the inlet side of the HTF. This is due to the relatively small thermal resistance and large temperature difference between the injected HTF and the initial PCM at the initial stage. It is important to note that regardless of the HTF injection direction, it has no significant impact on the shape and thickness of the melt layer. This is because, at the early stage of melting, the formation of the melt layer is primarily governed by conduction as the dominant heat-transfer mode.
In the intermediate stage of melting, a greater amount of solid PCM was observed on the surface of the shell. Comparatively, when HTF is injected from the top, PCM injected from the bottom exhibits a lower temperature in the melting zone, as evident in Figure 7a and Figure 9a. These findings are consistent with experimental results [23]. During the convective heat-transfer stage, PCM’s temperature is lower when HTF is injected from the top compared to bottom injection. This is attributed to the flow direction of HTF in relation to the molten PCM near the tube side. When HTF is injected from the top, it flows in the opposite direction to the molten PCM near the tube side, whereas bottom-injection results in HTF flowing in the same direction as the molten PCM near the tube side. Consequently, the heat flux is greater in the case of top injection. In the final stage of PCM melting, the temperature difference between the melted part and the incomplete part diminishes, as depicted in Figure 9b. The decrease in temperature difference leads to a weakening of the driving force of natural convection. Therefore, it can be understood that HTF injected from the bottom can facilitate the melting of solid PCM in the final stage. This is because the thermal resistance on the HTF side increases, causing the temperature of the HTF to decrease along the flow direction. As a result, a smaller melt zone is formed in the bottom region, as observed in Figure 9. In such cases, HTF injected at the bottom aids in completing the final melting process of PCM. The average temperature of PCM under the 12 working conditions, with HTF injected from the bottom, changes with the melting time, as shown in Figure 10.

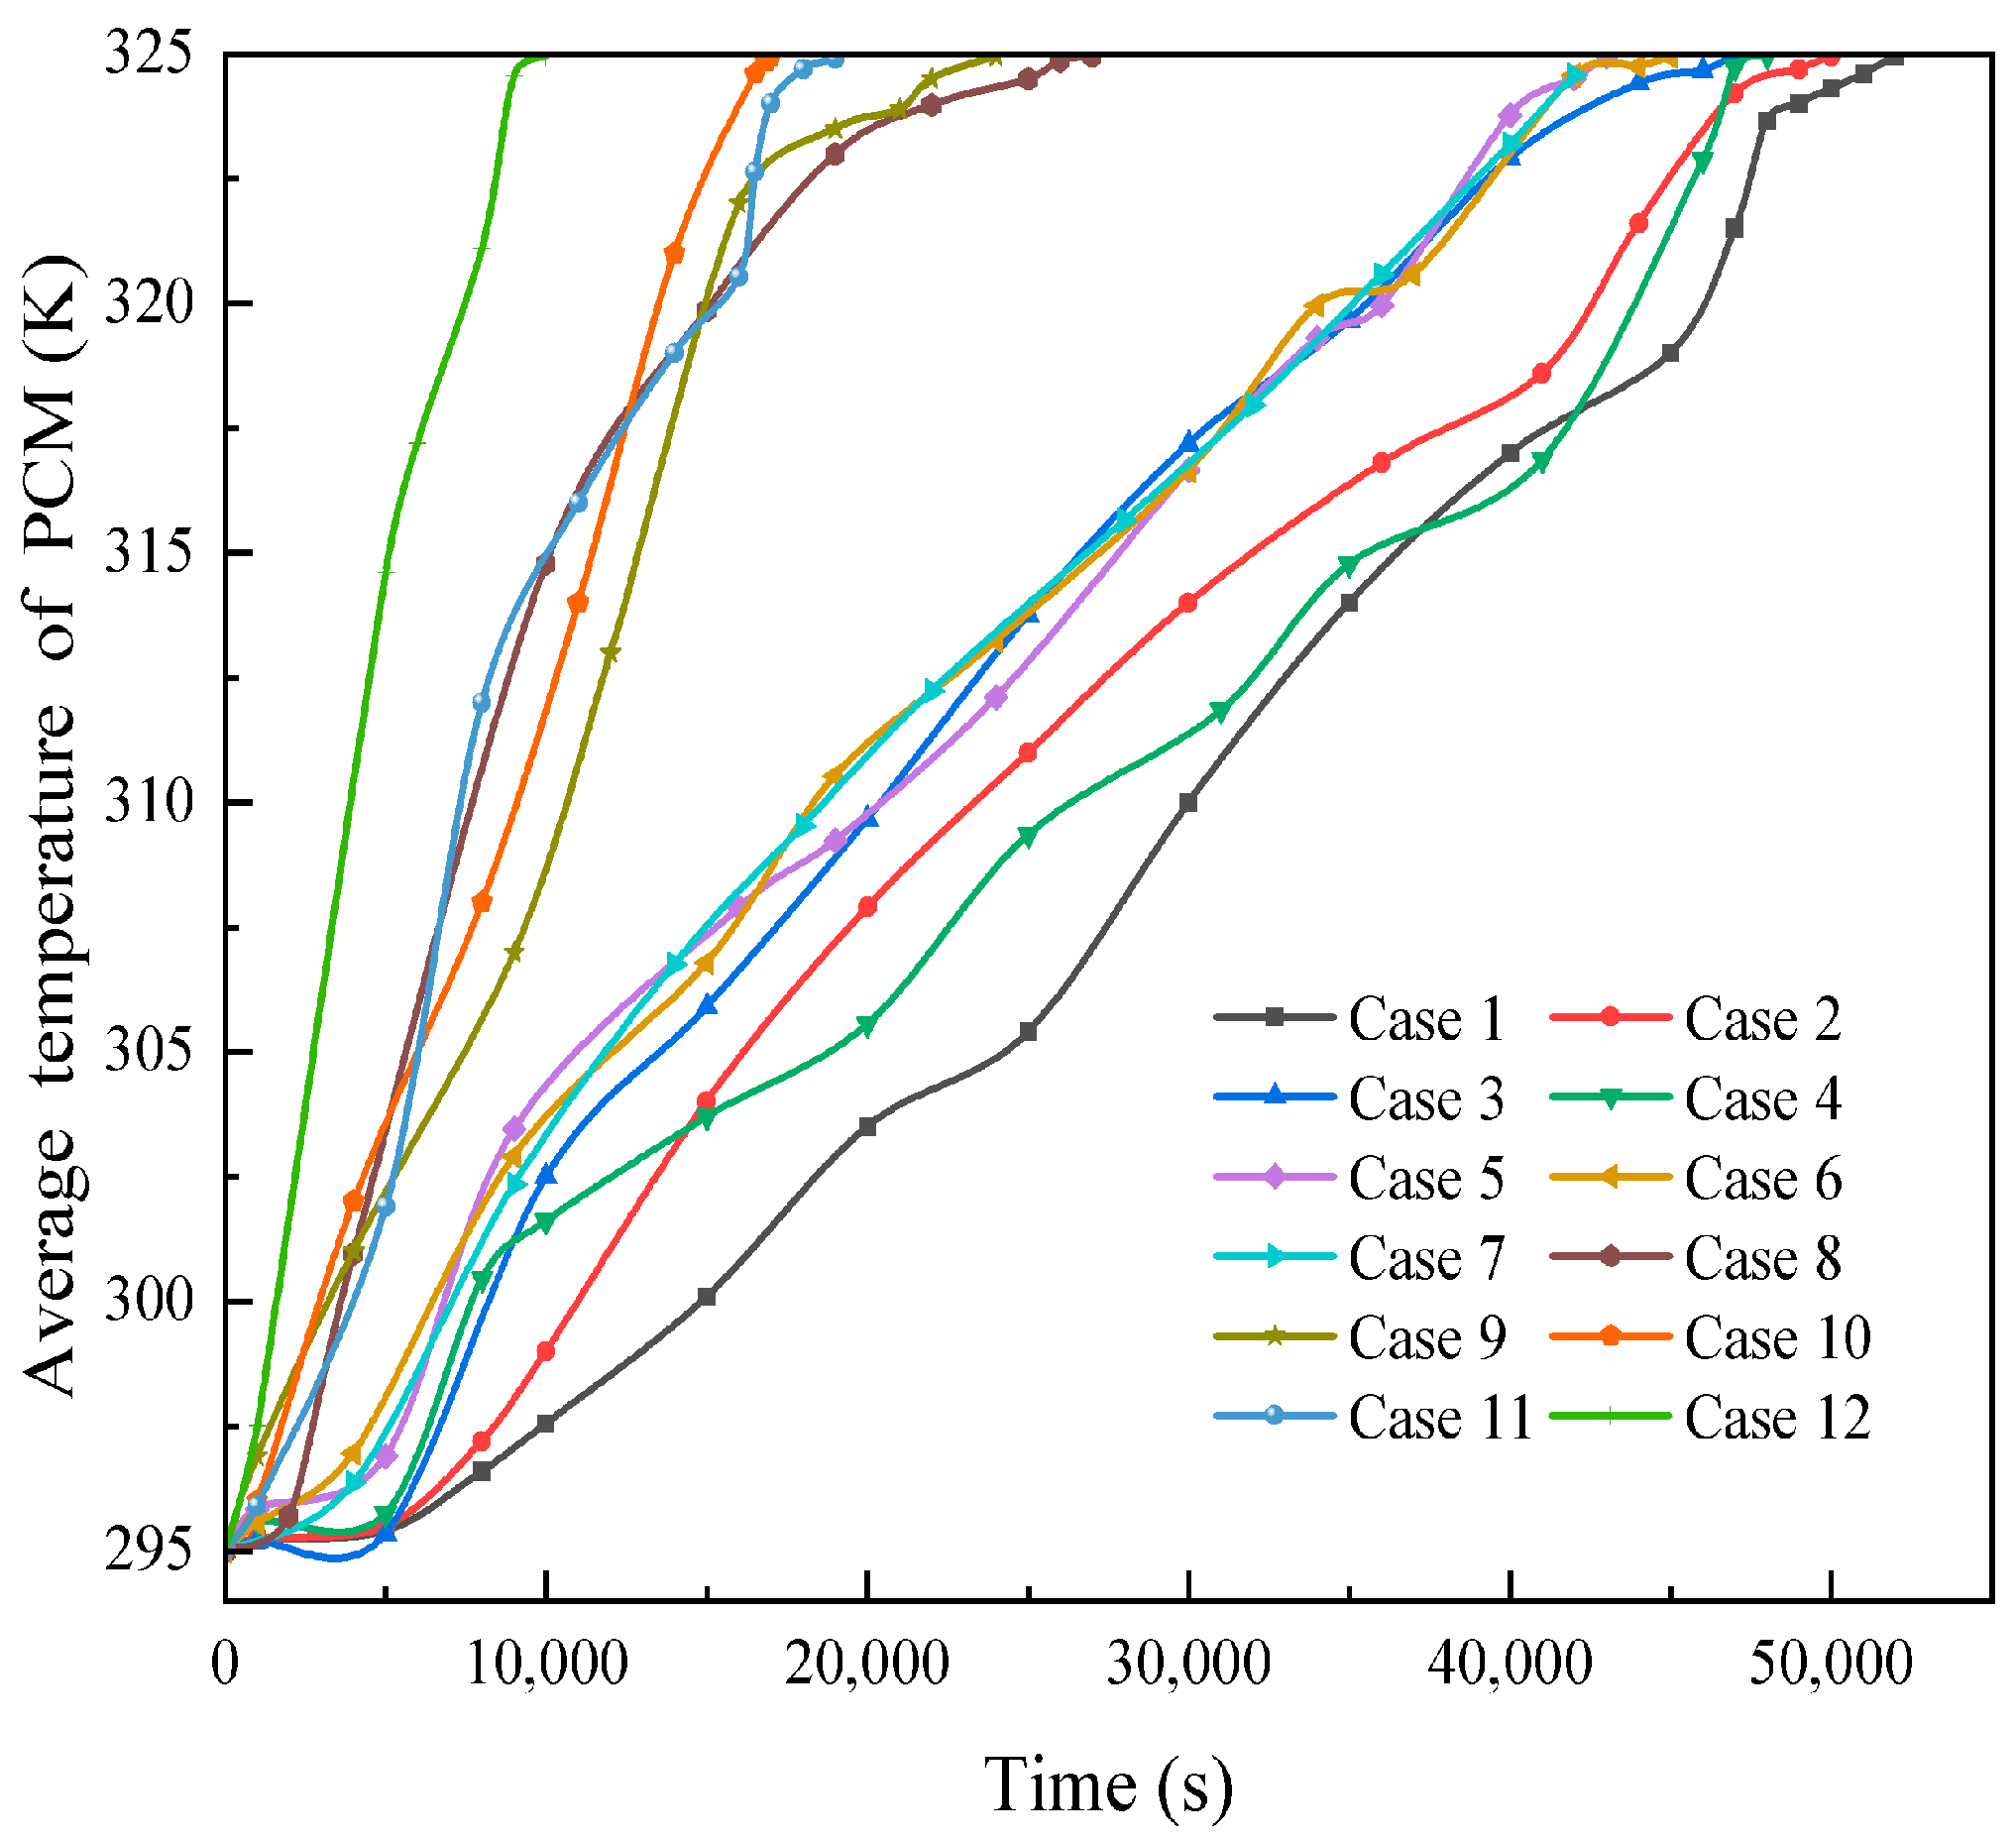
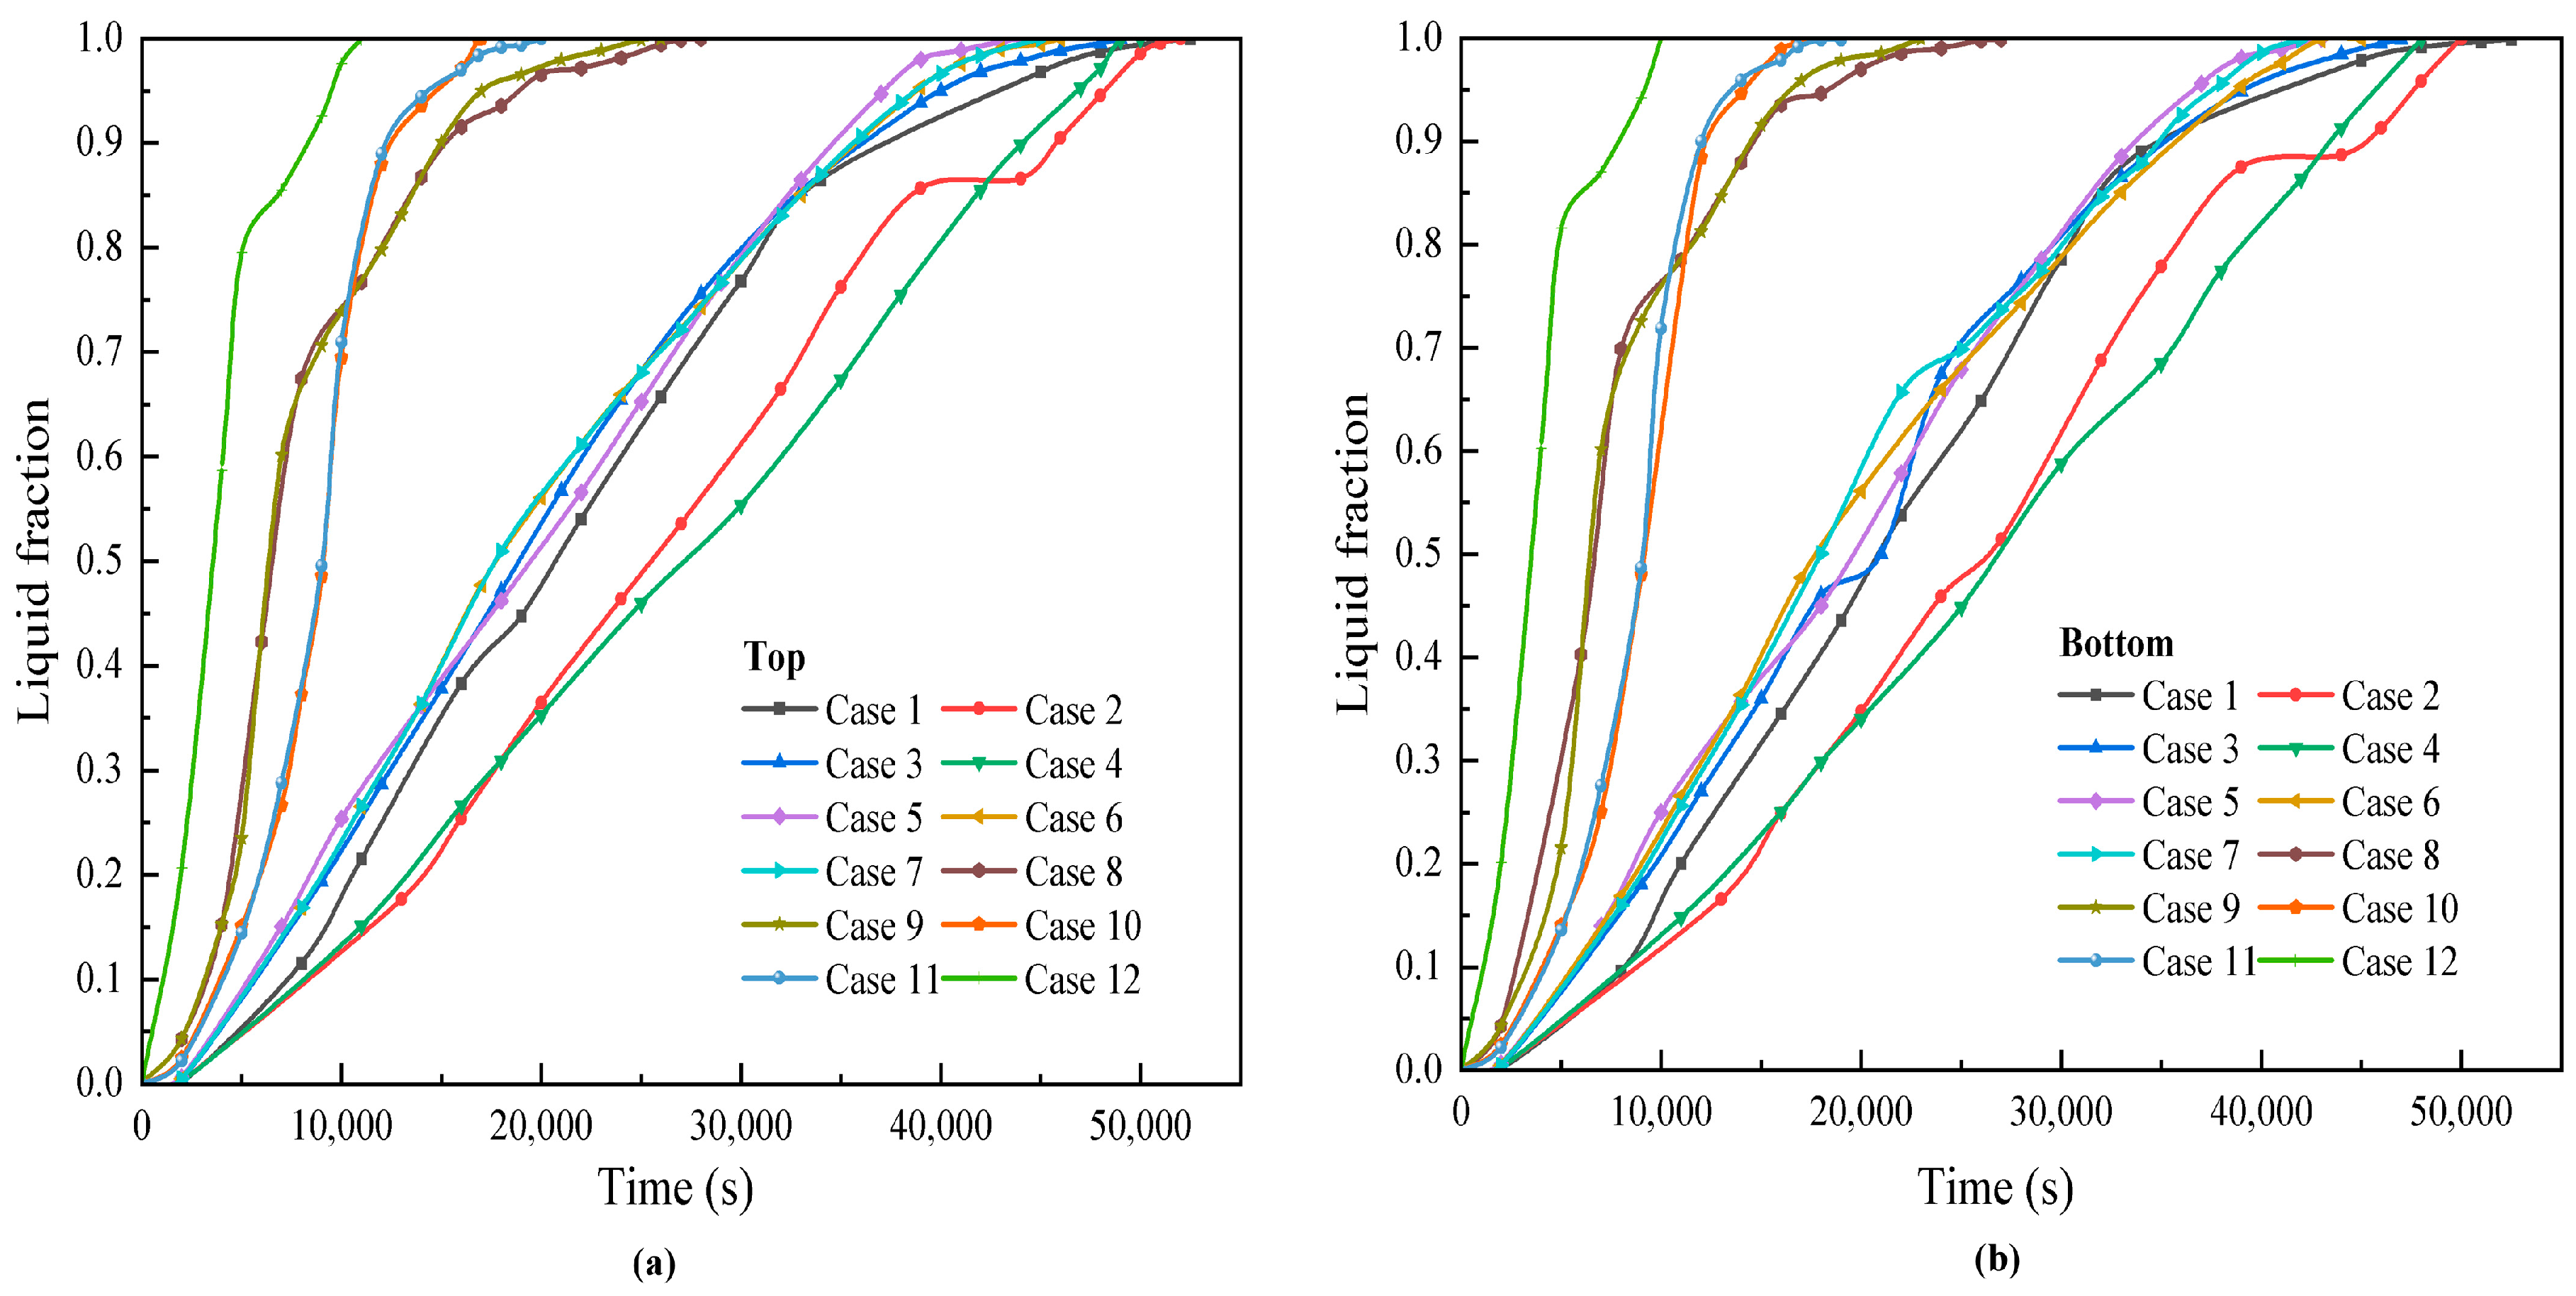
3.1.3. Change in PCM Melting Rate

Figure 11 illustrates the variation of PCM melt fraction under 12 operating conditions with two different HTF injection directions. As H increases, the melting rate of PCM accelerates. During the initial melting phase, heat conduction plays a dominant role, and changing the HTF injection direction does not significantly affect PCM melting. However, as melting time progresses and natural convection comes into play, the PCM melt fraction undergoes a noticeable change. In-depth analysis of four working conditions (H = 1600 mm, 800 mm, 400 mm, and 200 mm) in Figure 12 reveals that after a certain melting time, an intersection occurs between bottom and top-injection cases. This indicates that the bottom-injection melt fraction starts to exceed the top-injection case, signifying that at the end, bottom injection completes melting first. This observation can be attributed to the following factors: (1) In the case of bottom injection, the upper part of the LHS unit’s PCM is completely melted, with shorter distances between the solid PCM. Additionally, the HTF inlet sprayed from the bottom enhances heat-transfer efficiency from HTF to PCM. (2) For PCM systems with bottom injection, the melting process starts from the bottom due to the higher bottom temperature. As a result of gravity, the molten part moves upward. Initially, the melting rate of PCM slows down due to high resistance (most PCM remains in the solid state). However, as melting time increases, the melting fraction gradually rises, and natural convection intensifies along the pipe, resulting in faster charging. In contrast, for vertically oriented PCM systems with the top injection of HTF, full melting takes slightly longer. This is because higher temperatures are obtained in the top portion, leading to the prevention of enhanced heat transfer by the effect of natural convection.
The experiment’s results [24] indicate that HTF injected at the top of PCM melts faster than when injected at the bottom. This observation can be attributed to the following reasons: (1) Non-flat solid–liquid interface: When observing the solid–liquid interface at the surface of the shell in the experiment to represent PCM melting, there may be some inaccuracies. Figure 7 and Figure 9 demonstrate that, at the beginning of melting, the solid PCM under bottom injection is higher than that under top injection, which aligns with the experimental phenomenon. Moreover, the experiment does not directly observe that the solid PCM under bottom injection is thinner than the solid PCM under top injection. As a result, the observed solid–liquid interface at the shell wall in the experiment may not fully reflect the actual situation of PCM melting. (2) Difficulty in distinguishing complete and incomplete melting regions: In the experiment, the time of complete melting of solid PCM is typically recorded. However, accurately distinguishing between the complete liquid paste zone and the incomplete liquid paste zone at the time of recording can be challenging. Consequently, the inaccurate timing of the end of the experimental record is also an important contributing factor to this result.
In the preceding analysis, the complete melting times of shell-and-tube type phase-change material under the same volume but with different injection directions of HTF are presented in Table 3. It can be observed from the table that, due to the constant volume of PCM, increasing the height of the tube body results in a corresponding decrease in the thickness of PCM. This change intensifies the natural convection within the tube and enhances the melting of PCM. Taking H = 1600 mm, 800 mm, 400 mm, and 200 mm as examples, during the late melting stage of PCM, there will be an intersection of the melting curves for top and bottom injection. This indicates that the complete melting time for bottom injection is faster than that for top injection, and the complete melting time for bottom injection is 9%, 4.6%, 0.9%, and 0.4% faster than that for top injection, respectively.

3.2. PCM Performance Improvement

As an organic phase-change material, the thermal conductivity of paraffin wax is merely 0.2 W/m·K, which is significantly lower than that of inorganic phase-change materials. This poses a major challenge to the heat storage efficiency of this model. To address this issue, several researchers have investigated the thermal and physical properties of composite phase-change materials comprising paraffin wax and various porous media, such as graphene, silicon carbide, and expanded graphite. The findings have led to the effective preparation of high-stability phase-change composites using paraffin wax and porous materials. Notably, the latent heat of the composite is nearly proportional to the volume ratio. Moreover, the porous material does not affect the melting point of paraffin wax (308 K) but significantly enhances the thermal conductivity of the phase-change material, therefore accelerating its melting process. Table 4 illustrates three groups of composite materials, each prepared by mixing 10% paraffin wax with three different expanded graphite materials of various mesh numbers, along with their corresponding thermal conductivities.
Figure 13 depicts the variations in the liquid phase rate over time for the phase-change material with a tube length of 200 mm under different injection conditions after incorporating expanded graphite with varying mesh numbers. Regardless of whether it is top injection or bottom injection, under all three conditions, the material can be fully melted within 50,000 s. Moreover, when 10% expanded graphite with 100 mesh is added, the melting speed is the fastest compared to pure paraffin. Specifically, it took 45,112 s for full melting under top injection, and 43,387 s under bottom injection. Additionally, from a horizontal perspective, after adding expanded graphite in both top and bottom-injection scenarios, the time for the heat storage material to reach 50% melting is less than 10,000 s, with the fastest time being 4985 s. This indicates that the addition of expanded graphite significantly reduces the time for the material to reach 50% melting, nearly 10% of the original time when using pure paraffin. Furthermore, in the late melting stage, expanded graphite effectively addresses the issue of the slow melting rate observed in top-injection conditions.
For H = 200 mm, in the case of top injection, three types of composite materials with different mesh numbers of 10% expanded graphite result in time savings of 5.3%, 10.2%, and 14.3% compared to pure paraffin melting. On the other hand, in the case of bottom injection, the time savings are 7.7%, 12.5%, and 17.2%, respectively. These results demonstrate that the enhancement in melting time is more pronounced when using bottom injection. Detailed melting times are presented in Table 5.

4. Conclusions

In this research, we developed a comprehensive two-dimensional vertical shell-and-tube latent heat storage (LHS) device model, employing paraffin RT35 as the chosen PCM. Extensively exploring the variations in tube length and PCM thickness, we thoroughly investigated the impact of two distinct HTF injection directions on the PCM’s melting time, keeping the PCM volume constant. Furthermore, we conducted a meticulous analysis of the optimization effect of PCM melting time when utilizing expanded graphite composites with different mesh numbers under various injection directions. The numerical findings reveal the following key observations:
(1)
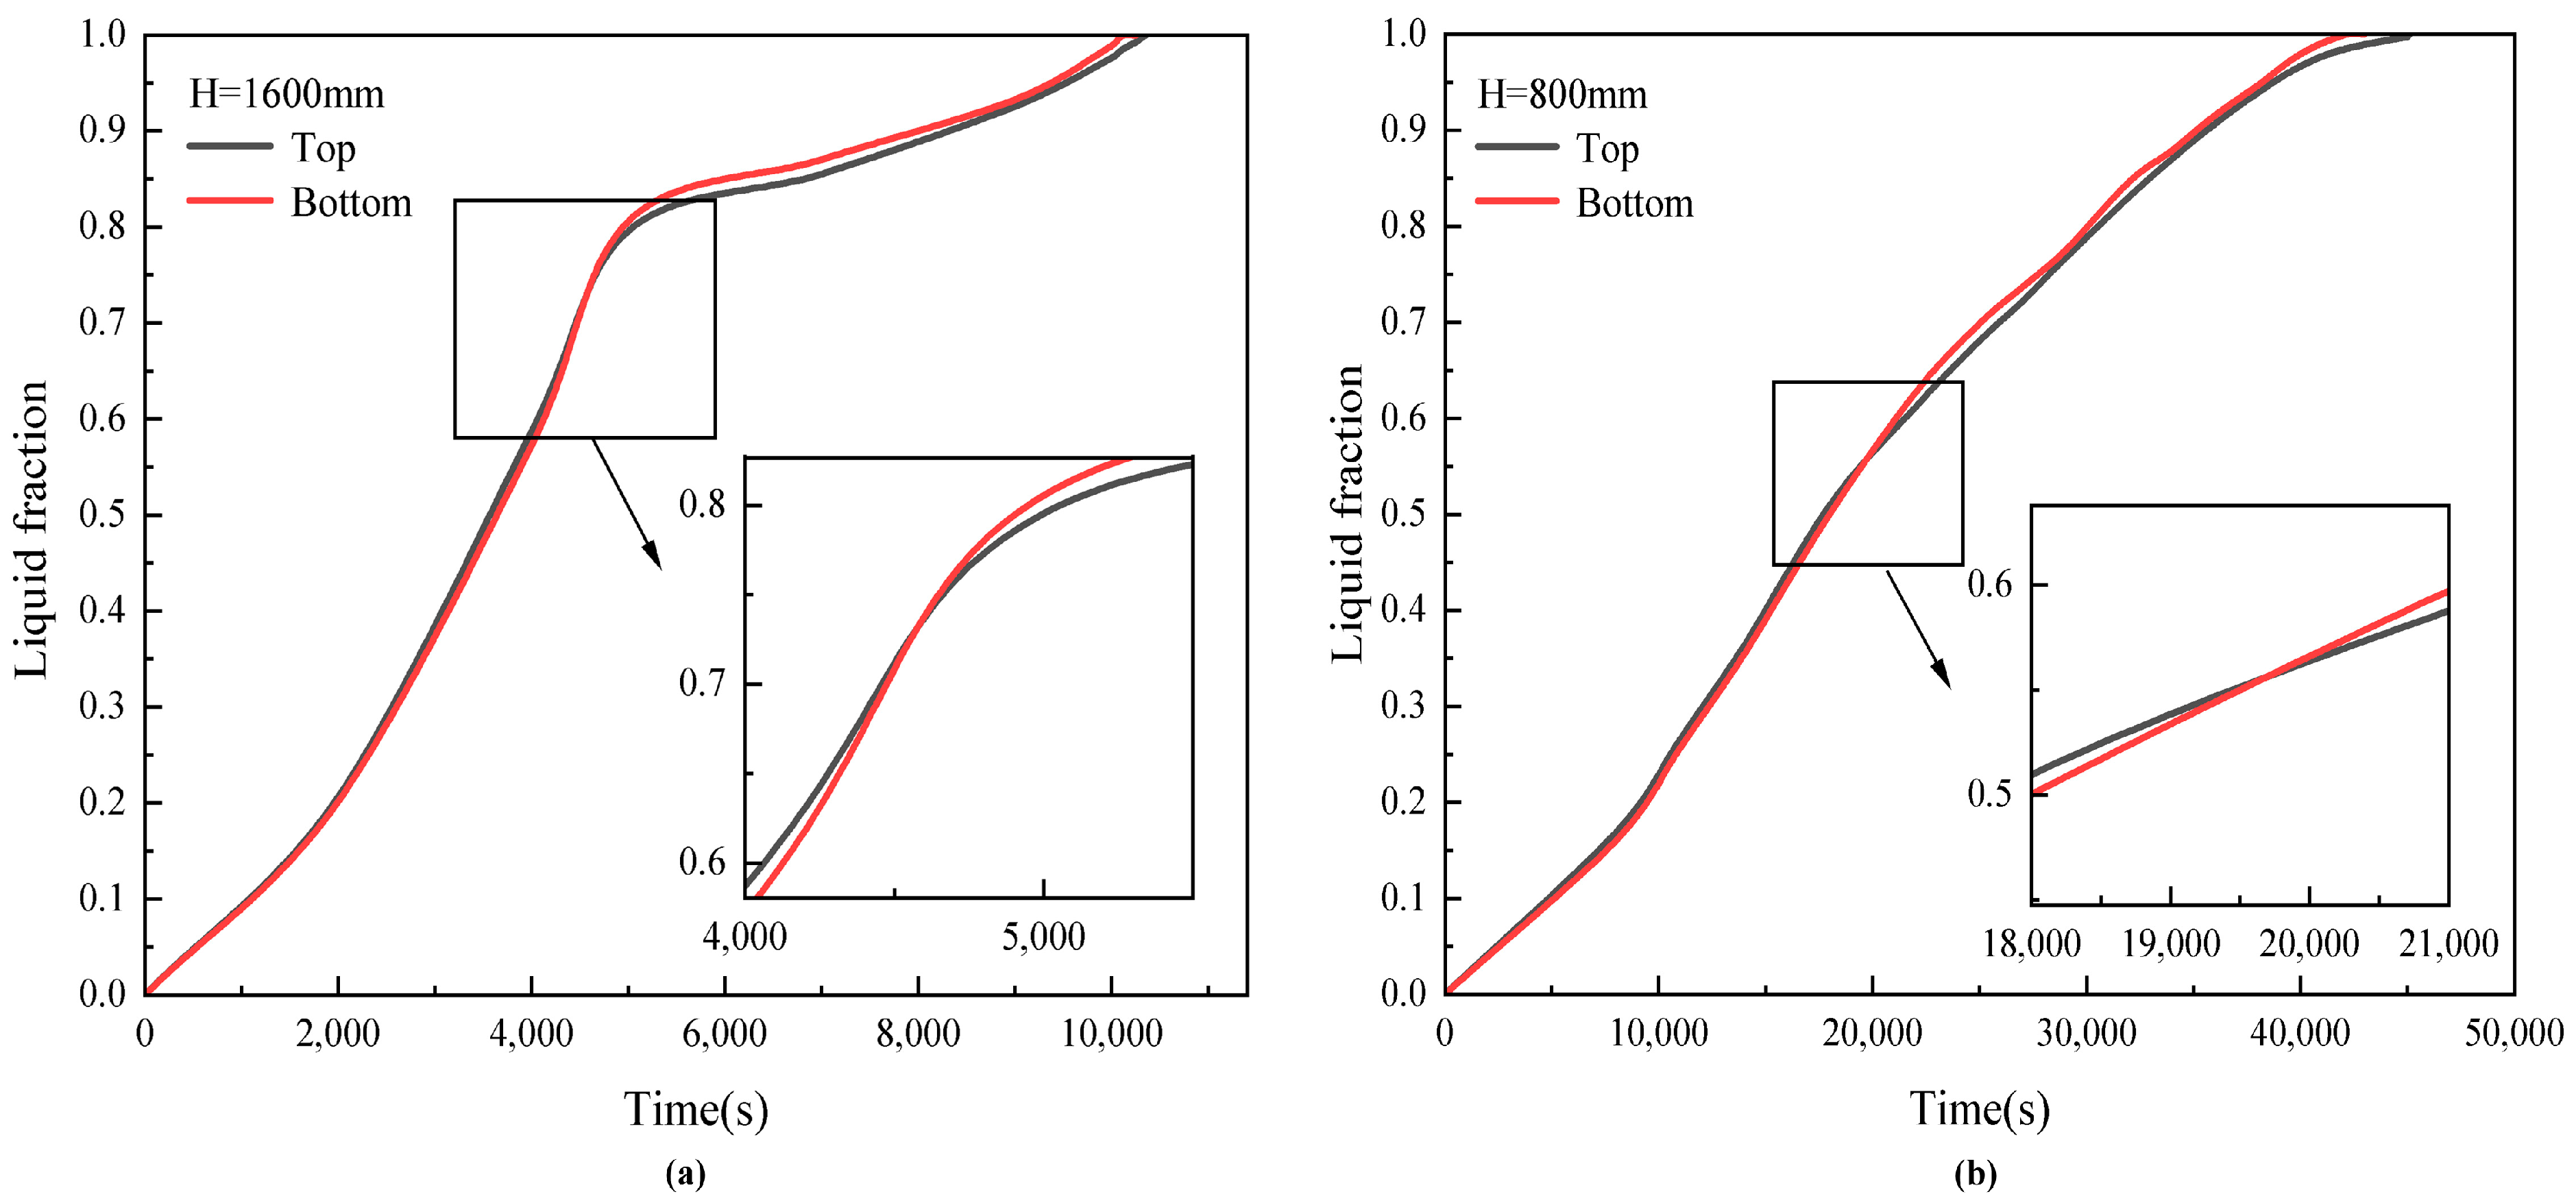
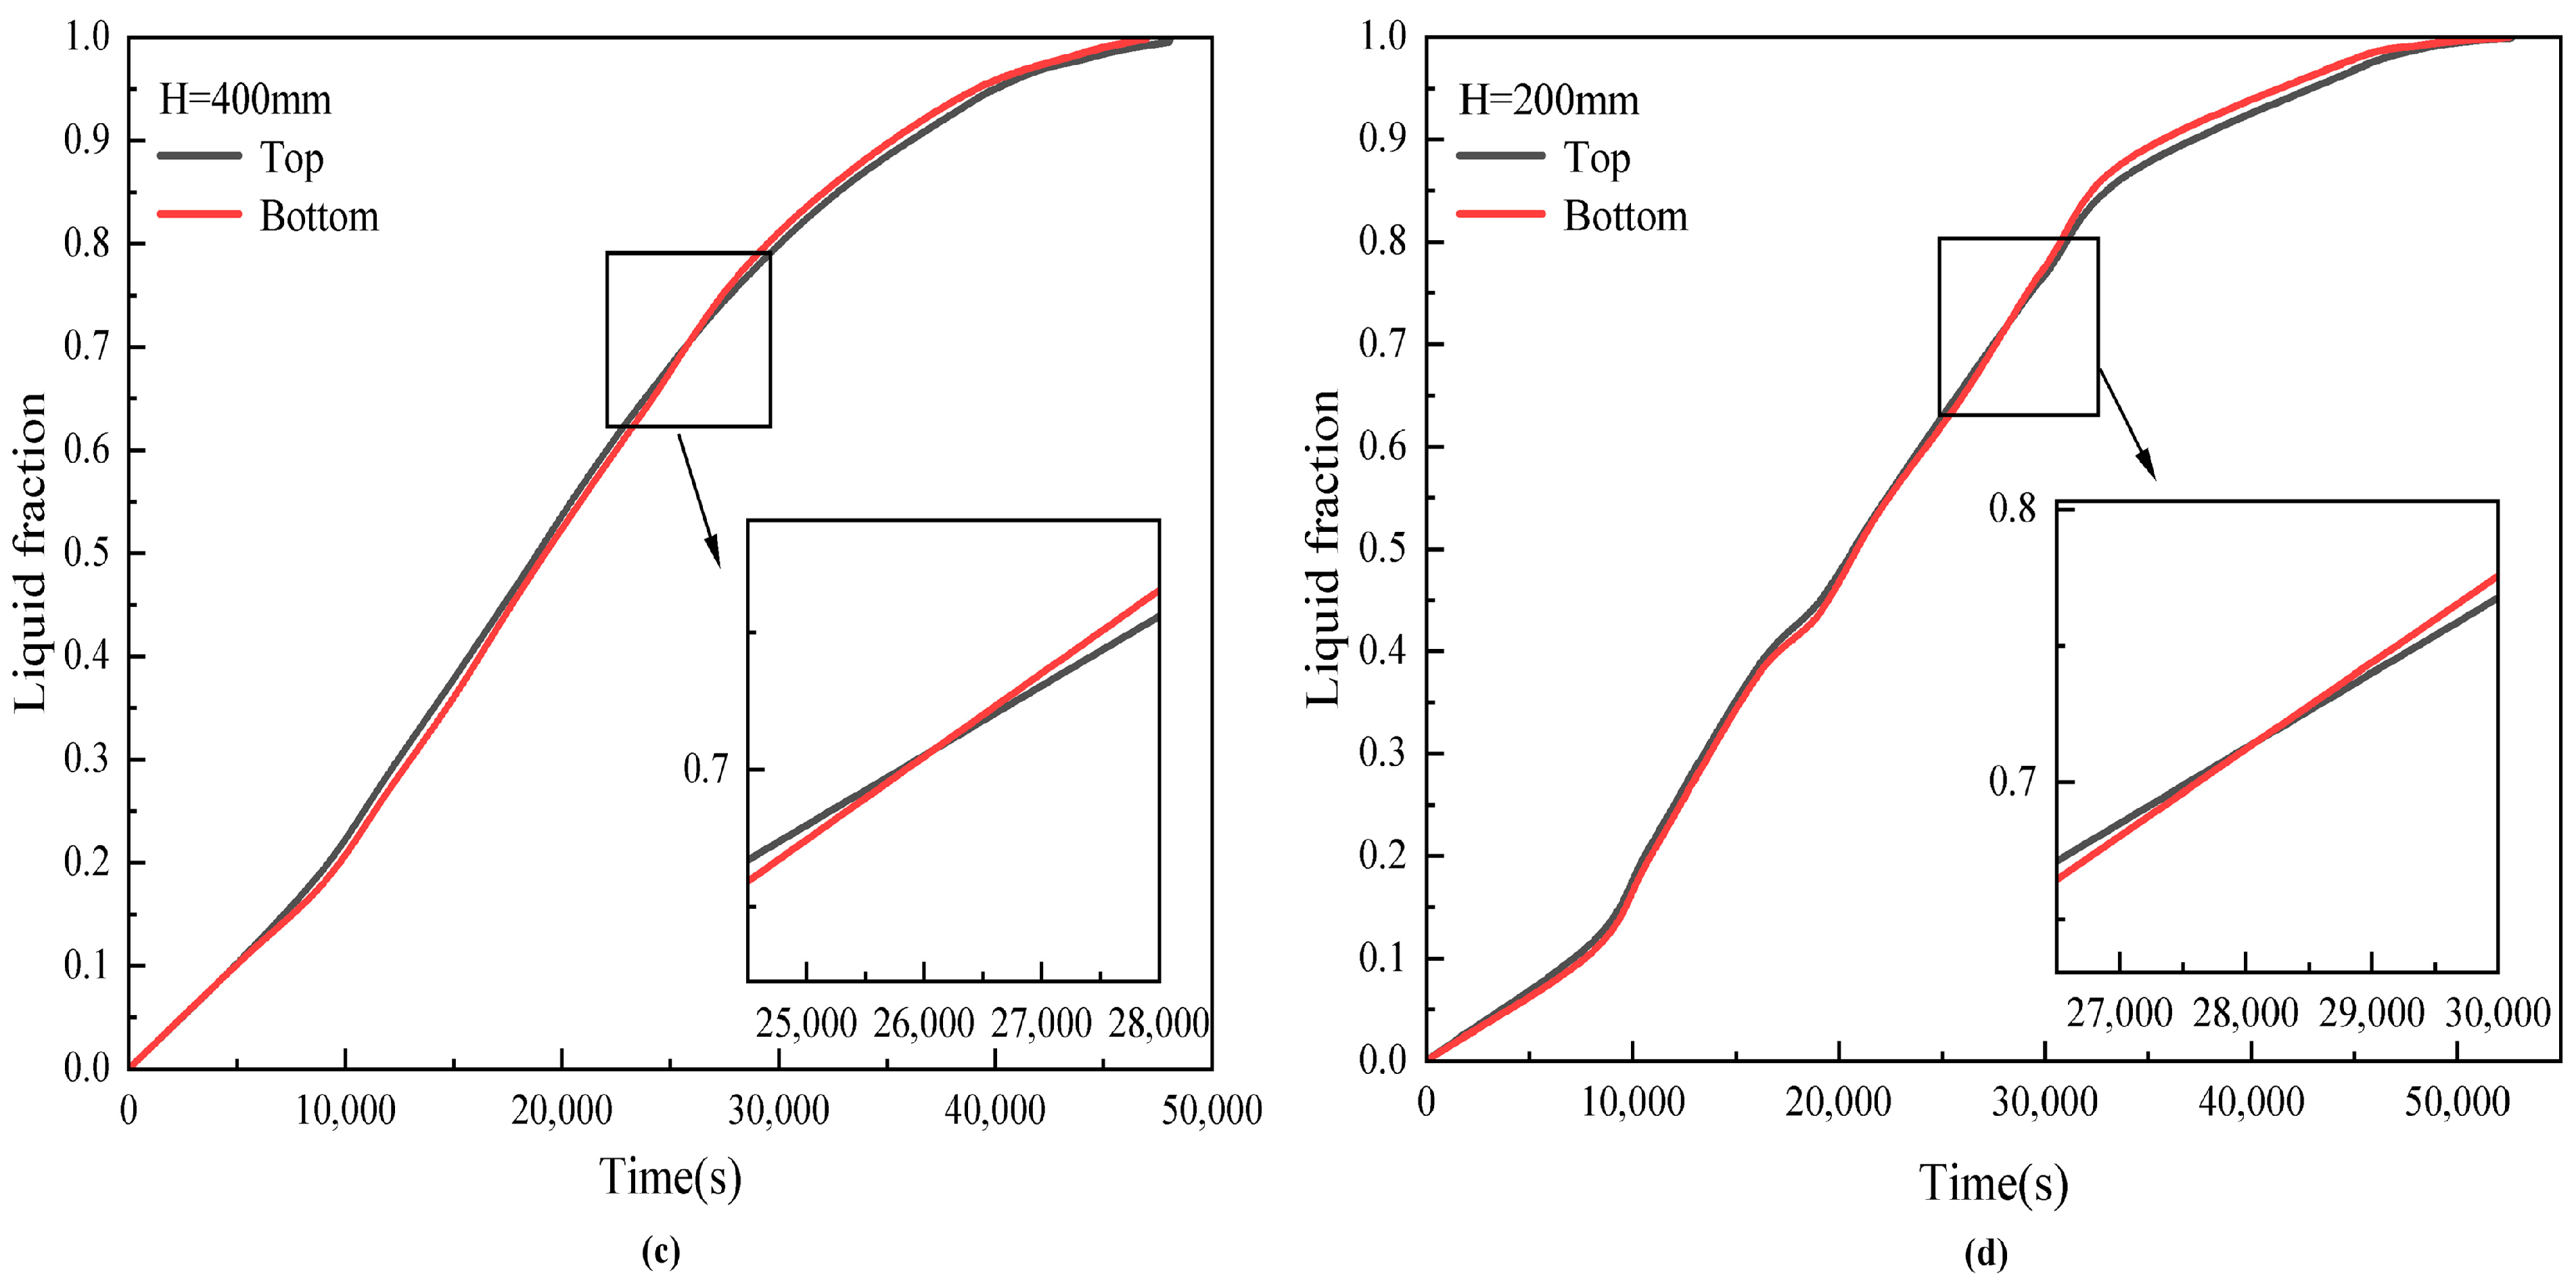
During the initial phase of PCM melting, its predominant heat-transfer mechanism is conduction, thus the HTF injection direction has negligible impact on the melting rate. Nonetheless, as time progresses, natural convection starts to manifest, leading to noteworthy changes in the PCM’s melting rate.
(2)
In the range of tube length H between 1.6 m and 0.2 m, and PCM thickness D between 19.7 mm and 49 mm, an increase in tube length H results in a corresponding decrease in PCM thickness D. Consequently, this promotes more robust natural convection within the PCM. As a result, the melting time of PCM increases in tandem with the tube length H, demonstrating a positive correlation. Moreover, under the bottom-injection condition, the melting time of PCM is generally faster than that of the top injection.
(3)
Regardless of whether the heat-transfer fluid is injected at the top or bottom, when the tube length H exceeds 800 mm, the melting efficiency of the PCM undergoes a significant change, leading to a reduction in melting time of nearly 15,000 s.
(4)
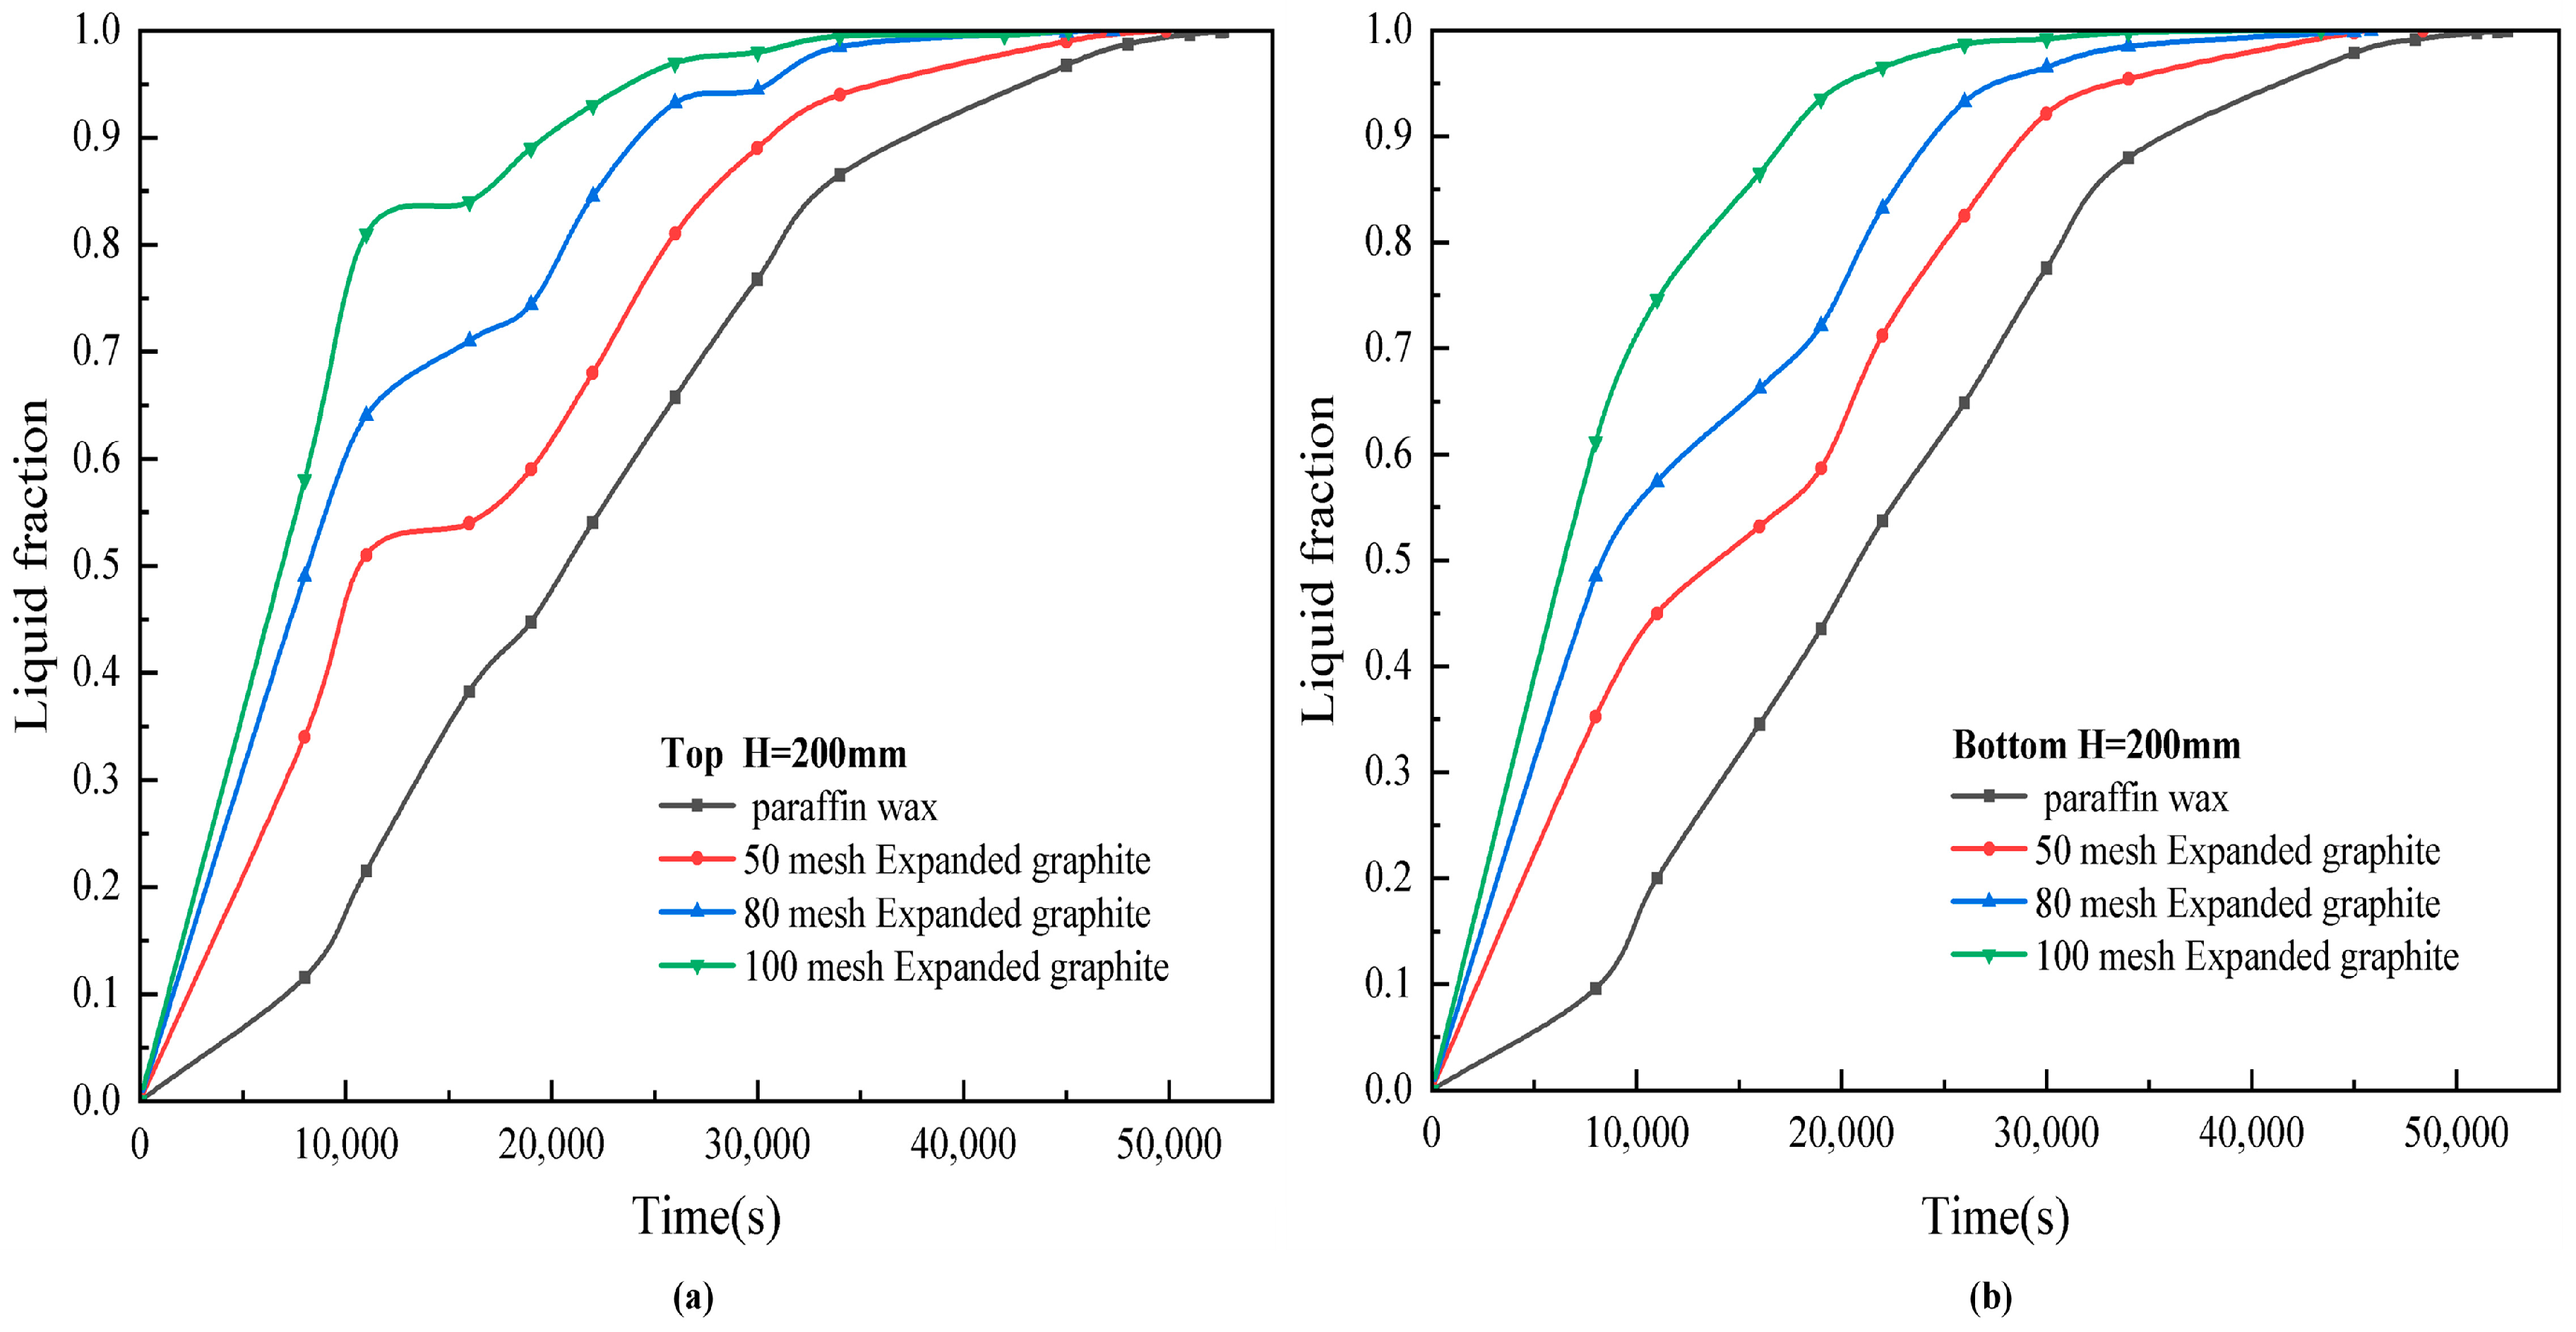
For instance, when considering H = 200 mm and top injection, the three types of composite materials containing 10% expanded graphite with different mesh numbers can save 5.3%, 10.2%, and 14.3% of the melting time, respectively, compared to pure paraffin wax. On the other hand, in the case of bottom injection, these three composite materials save 7.7%, 12.5%, and 17.2% of the melting time, respectively, further emphasizing the more significant effect of improving the melting time with bottom injection.

Author Contributions

Conceptualization, W.Z. and S.L.; methodology, W.Z.; software, W.Z.; validation, Z.G., Z.K. and R.T.; formal analysis, W.Z.; investigation, Z.G.; resources, W.Z.; data curation, R.T.; writing—original draft preparation, W.Z.; writing—review and editing, W.Z.; visualization, S.L.; supervision, Z.G.; project administration, Z.K.; funding acquisition, W.Z. All authors have read and agreed to the published version of the manuscript.

Funding

This work is finically supported by the Academic Degrees & Graduate Education Reform Project of Henan Province (No. 2021SJGLX012Y, No. 2021SJGLX155).

Data Availability Statement

Data is not available due to privacy or ethical restrictions.

Conflicts of Interest

The authors declare no conflict of interest. The funders had no role in the design of the study; in the collection, analyses, or interpretation of data; in the writing of the manuscript, or in the decision to publish the results.

References

  1. Chandran Govindaraju, V.G.R.; Tang, C.F. The dynamic links between CO2 emissions, economic growth and coal consumption in China and India. Appl. Energy 2013, 104, 310–318. [Google Scholar] [CrossRef]
  2. Zhao, D.L.; Li, Y.; Dai, Y.J.; Wang, R.Z. Optimal study of a solar air heating system with pebble bed energy storage. Energy Convers. Manag. 2011, 52, 2392–2400. [Google Scholar] [CrossRef]
  3. Cárdenas-Ramírez, C.; Jaramillo, F.; Gómez, M. Systematic review of encapsulation and shape-stabilization of phase change materials. J. Energy Storage 2020, 30, 101495. [Google Scholar] [CrossRef]
  4. Alam, M.T.; Raj, A.; Singh, L.K.; Gupta, A.K. Configurational assessment of solidification performance in a triplex-tube heat exchanger filled with composite phase change material. Appl. Therm. Eng. 2023, 230, 120814. [Google Scholar] [CrossRef]
  5. Dhaidan, N.S.; Khodadadi, J.M. Melting and convection of phase change materials in different shape containers: A review. Renew. Sustain. Energy Rev. 2015, 43, 449–477. [Google Scholar] [CrossRef]
  6. Kang, Z.; Zhou, W.; Qiu, K.; Wang, C.; Qin, Z.; Zhang, B.; Yao, Q. Numerical Simulation of an Indirect Contact Mobilized Thermal Energy Storage Container with Different Tube Bundle Layout and Fin Structure. Sustainability 2023, 15, 5511. [Google Scholar] [CrossRef]
  7. Agyenim, F.; Eames, P.; Smyth, M. Heat transfer enhancement in medium temperature thermal energy storage system using a multitube heat transfer array. Renew. Energy 2010, 35, 198–207. [Google Scholar] [CrossRef]
  8. Guo, S.; Zhao, J.; Wang, W.; Yan, J.; Jin, G.; Zhang, Z.; Gu, J.; Niu, Y. Numerical study of the improvement of an indirect contact mobilized thermal energy storage container. Appl. Energy 2016, 161, 476–486. [Google Scholar] [CrossRef]
  9. Memon, A.; Mishra, G.; Gupta, A.K. Buoyancy-driven melting and heat transfer around a horizontal cylinder in square enclosure filled with phase change material. Appl. Therm. Eng. 2020, 181, 115990. [Google Scholar] [CrossRef]
  10. Agyenim, F.; Hewitt, N. The development of a finned phase change material (PCM) storage system to take advantage of off-peak electricity tariff for improvement in cost of heat pump operation. Energy Build. 2010, 42, 1552–1560. [Google Scholar] [CrossRef]
  11. Joybari, M.M.; Seddegh, S.; Wang, X.; Haghighat, F. Experimental investigation of multiple tube heat transfer enhancement in a vertical cylindrical latent heat thermal energy storage system. Renew. Energy 2019, 140, 234–244. [Google Scholar] [CrossRef]
  12. Trp, A.; Lenic, K.; Frankovic, B. Analysis of the influence of operating conditions and geometric parameters on heat transfer in water-paraffin shell-and-tube latent thermal energy storage unit. Appl. Therm. Eng. 2006, 26, 1830–1839. [Google Scholar] [CrossRef]
  13. Yang, X.; Yu, J.; Xiao, T.; Hu, Z.; He, Y.-L. Design and operating evaluation of a finned shell-and-tube thermal energy storage unit filled with metal foam. Appl. Energy 2020, 261, 114385. [Google Scholar] [CrossRef]
  14. Han, G.-S.; Ding, H.-S.; Huang, Y.; Tong, L.-G.; Ding, Y.-L. A comparative study on the performances of different shell-and-tube type latent heat thermal energy storage units including the effects of natural convection. Int. Commun. Heat Mass Transf. 2017, 88, 228–235. [Google Scholar] [CrossRef]
  15. Kurnia, J.C.; Sasmito, A.P. Numerical investigation of heat transfer performance of a rotating latent heat thermal energy storage. Appl. Energy 2018, 227, 542–554. [Google Scholar] [CrossRef]
  16. Longeon, M.; Soupart, A.; Fourmigué, J.-F.; Bruch, A.; Marty, P. Experimental and numerical study of annular PCM storage in the presence of natural convection. Appl. Energy 2013, 112, 175–184. [Google Scholar] [CrossRef]
  17. Shahsavar, A.; Goodarzi, A.; Mohammed, H.I.; Shirneshan, A.; Talebizadehsardari, P. Thermal performance evaluation of non-uniform fin array in a finned double-pipe latent heat storage system. Energy 2020, 193, 116800. [Google Scholar] [CrossRef]
  18. Ismail, K.; Goncalves, M. Thermal performance of a PCM storage unit. Energy Convers. Manag. 1999, 40, 115–138. [Google Scholar] [CrossRef]
  19. Seddegh, S.; Wang, X.; Joybari, M.M.; Haghighat, F. Investigation of the effect of geometric and operating parameters on thermal behavior of vertical shell-and-tube latent heat energy storage systems. Energy 2017, 137, 69–82. [Google Scholar] [CrossRef]
  20. Nie, C.; Liu, J.; Deng, S. Effect of geometric parameter and nanoparticles on PCM melting in a vertical shell-tube system. Appl. Therm. Eng. 2021, 184, 116290. [Google Scholar] [CrossRef]
  21. Yang, X.; Lu, Z.; Bai, Q.; Zhang, Q.; Jin, L.; Yan, J. Thermal performance of a shell-and-tube latent heat thermal energy storage unit: Role of annular fins. Appl. Energy 2017, 202, 558–570. [Google Scholar] [CrossRef]
  22. Ettouney, H.; El-Dessouky, H.; Al-Kandari, E. Heat transfer characteristics during melting and solidification of phase change energy storage process. Ind. Eng. Chem. Res. 2004, 43, 5350–5357. [Google Scholar] [CrossRef]
  23. Martinelli, M.; Bentivoglio, F.; Caron-Soupart, A.; Couturier, R.; Fourmigue, J.-F.; Marty, P. Experimental study of a phase change thermal energy storage with copper foam. Appl. Therm. Eng. 2016, 101, 247–261. [Google Scholar] [CrossRef]
  24. Lacroix, M. Study of the heat transfer behavior of a latent heat thermal energy storage unit with a finned tube. Int. J. Heat Mass Transf. 1993, 36, 2083–2092. [Google Scholar] [CrossRef]
  25. Shudong, S. Microstructure adjustment of expanded graphite and its influence on thermal performance of composite paraffin/expanded graphite phasse-change material. Funct. Mater. 2018, 49, 1064–1070. (In Chinese) [Google Scholar]
Figure 1. (a) Shell-and-tube heat storage unit and (b) two-dimensional diagram.
Sustainability 15 13062 g001
Figure 2. Schematic diagram of vertical shell-and-tube LHS unit. (a) is the diagram of HTF top injection, (b) is the HTF bottom-injection diagram, (c) is the model computation domain.
Sustainability 15 13062 g002
Figure 3. LHS unit D section and the position of three thermocouples in the D section.
Sustainability 15 13062 g003
Figure 4. Grid independence verification and time step independence analysis when (a) is the grid independence verification and (b) is the time step determination.
Sustainability 15 13062 g004
Figure 5. Comparison of experimental and numerical results of HTF injection at the top.
Sustainability 15 13062 g005
Figure 6. Comparison of liquefaction rates with or without natural convection.
Sustainability 15 13062 g006
Figure 7. Time evolution cloud map of PCM melting fraction and temperature distribution for top injection when (a) H = 800 mm and (b) H = 200 mm.
Sustainability 15 13062 g007aSustainability 15 13062 g007b
Figure 8. Average temperature curve of top injection PCM with time.
Sustainability 15 13062 g008
Figure 9. Time evolution cloud map of PCM melting fraction and temperature distribution for bottom injection when (a) H = 800 mm and (b) H = 200 mm.
Sustainability 15 13062 g009aSustainability 15 13062 g009b
Figure 10. Average temperature curve of bottom-injection PCM with time.
Sustainability 15 13062 g010
Figure 11. Changes in time melting fraction of PCM under different injection directions in 12 working conditions when (a) is the top injection and (b) is the bottom injection.
Sustainability 15 13062 g011
Figure 12. Changes in melting fraction of PCM filling in different injection directions when (a) H = 1600 mm, (b) H = 800 mm, (c) H = 400 mm, and (d) H = 200 mm.
Sustainability 15 13062 g012aSustainability 15 13062 g012b
Figure 13. Variation of PCM liquid faction rate at different mesh sizes of expanded graphite at H = 200 mm when (a) is the top injection and (b) is the bottom injection.
Sustainability 15 13062 g013
Table 1. Thermophysical properties of PCM (Paraffin RT35) [16].
ParametersPCM
Density (kg·m−3)880 (s), 760 (l)
Specific heat (J·kg−1·K−1)1800 (s), 2400 (l)
Latent heat (kJ·kg–1)157
Melting temperature (K)308.0
Viscosity (m2·s–1)3.3 × 10⁻⁶
Thermal conductivity (W·m–1·K–1)0.2
Table 2. Detailed geometric parameters of shell-and-tube LHS units.
CaseR1R0HD = R0 − R1 − 2.5
17.5 mm29.7 mm1600 mm19.7 mm
27.5 mm30.7 mm1400 mm20.7 mm
37.5 mm32.0 mm1200 mm22.0 mm
47.5 mm33.7 mm1000 mm23.7 mm
57.5 mm34.7 mm900 mm24.7 mm
67.5 mm36.0 mm800 mm26.0 mm
77.5 mm37.5 mm700 mm27.5 mm
87.5 mm39.5 mm600 mm29.5 mm
97.5 mm42.0 mm500 mm32.0 mm
107.5 mm45.4 mm400 mm35.4 mm
117.5 mm50.5 mm300 mm40.5 mm
127.5 mm59.0 mm200 mm49.0 mm
Table 3. Full melting time of 12 operating conditions.
CaseTime to Reach Complete Melting (s)
TopBottom
152,64052,400
251,25050,952
348,26047,824
449,32148,685
544,11543,082
646,13745,582
745,12443,010
827,32527,240
925,27423,120
1016,88516,544
1119,52119,412
1211,32510,250
Table 4. Thermal conductivity of the composite after adding expanded graphite to paraffin [25].
Added MaterialsMesh Thermal   Conductivity   after   Compounding   ( W / m · k )
Expanded graphite500.82
800.95
1001.46
Table 5. Effects of different mesh numbers of expanded graphite on complete melting time.
CaseTime to Reach Complete Melting (s)
TopBottom
paraffin wax52,640Time saving (%)52,400Time saving (%)
50 mesh 49,8505.3%48,3657.7%
80 mesh 47,27010.2%45,85012.5%
100 mesh 45,11214.3%43,38717.2%
Disclaimer/Publisher’s Note: The statements, opinions and data contained in all publications are solely those of the individual author(s) and contributor(s) and not of MDPI and/or the editor(s). MDPI and/or the editor(s) disclaim responsibility for any injury to people or property resulting from any ideas, methods, instructions or products referred to in the content.

