Article

Architecture Optimization of a Single-Chamber Air-Cathode MFC by Increasing the Number of Cathode Electrodes

by
Theofilos Kamperidis
1,
Asimina Tremouli
1,* and
Gerasimos Lyberatos
1,2
1
School of Chemical Engineering, National Technical University of Athens, 15780 Athens, Greece
2
Institute of Chemical Engineering Sciences (ICE-HT), Stadiou Str., Platani, 26504 Patras, Greece
*
Author to whom correspondence should be addressed.
Sustainability 2023, 15(17), 13107; https://doi.org/10.3390/su151713107
Submission received: 30 June 2023 / Revised: 18 August 2023 / Accepted: 29 August 2023 / Published: 31 August 2023

Abstract

:
The aim of this study was the optimization of a single-chamber microbial fuel cell (MFC) architecture, by increasing the number of cathode electrodes. An air cathode single chamber MFC with a modifiable lid and bottom was operated with 4 and 6 Gore-Tex MnO2 cathode electrodes. The anode consisted of graphite granules. It was found that the increase from 4 (total cathodic surface area of 160 cm2) to 6 (total cathodic surface area of 240 cm2) electrodes resulted in an increase of the maximum current and the maximum power output of the cell by approximately 72% and 129%, respectively. Additionally, by increasing the cathodic surface area the internal resistance (Rint) of the unit decreased by approximately 19%. The organic removal from the substrate was not affected by the addition of the new electrodes while it was high across all cases studied (chemical oxygen demand (COD) removal > 89%). The average coulombic efficiency (CE) during the 4-electrode operation was 14.3%, while the corresponding efficiency for 6-electrode operation was 18.5%.

1. Introduction

The technology of Microbial Fuel Cells utilizes wastewater treatment as an electron source for electricity production, catalyzed by electrochemically active bacteria [1]. The MFC technology has been effectively used to treat a wide range of synthetic and real wastewater while producing electricity, refs. [2,3,4,5].
The major challenge that the MFC technology faces is the low energy output that each individual unit produces. To overcome this limitation various approaches have been investigated. The direct increase in the MFC size (scale–up) has been reported to reduce the production of high power densities, although effective wastewater treatment is achieved [6]. The stacking of multiple MFCs in arrays has been tested in many works in an effort to efficiently increase the power output [7,8,9,10,11,12,13]. In order to increase the voltage or current output of multiple MFCs, the cells are externally connected in series or parallel respectively [3]. Another option is to change the external load of the MFC with an electrical circuit to maximize energy harvesting [14]. Creating power management systems allows the voltage output of the MFCs to be matched with the required voltage of a small device such as a sensor or LED light [14]. MFCs have also been used in combination with other processes, such as anaerobic digestion [15,16] or dark fermentation [17,18] in order to maximize energy recovery through wastewater treatment. Another application of the MFC technology is the usage as a biosensor, based on glucose oxidation (catalytic biosensor), offering both sensor capabilities and power supply for biobased devices [19].
In this view, the MFC architecture and material selection for each unit, are crucial factors for maximizing the MFC performance and the cost-effectiveness of these systems. For example, in MFCs, the use of expensive ion exchange membranes, such as cation and anion exchange membranes can be avoided by utilizing as separators different materials, such as cation and anion exchange membranes, such as Gore-Tex cloth (PTFE) [4], fine fire clay [20,21], terracotta [9], mullite [22], polyester cloth [23] and glass fiber [24] among others [25].
In this context, the anode electrode should be biocompatible, porous and conductive, at a low cost in order to maximize the efficiency of the process [26]. A cost-effective solution for anode electrodes is graphite granules. Increasing the packing density of the anode electrode has been reported to increase the wastewater treatment efficiency and the power output of MFCs [6]. Graphite granules present good conductivity, high specific surface, biocompatibility and can fill anode compartments effectively, maximizing the volume usage and forming a packed bed around the cathode electrodes to facilitate the ion transfer [4]. Graphite granules require the addition of a current collector to improve the electron transfer to the cathode, examples of materials used in combination with graphite granules are titan mesh [3] and graphite rod [27].
Additionally, the MFC cathode contributes significantly to power generation and has been the focus of research in order to optimize the single-chamber MFC design [28,29]. Cathode electrodes in single chamber MFCs require catalysis in order to reduce atmospheric oxygen. Platinum (Pt), activated carbon (AC) and manganese dioxide (MnO2) are common catalyst examples used in MFCs [3]. However, Pt is an expensive material and many cheaper yet effective alternatives have been examined in the literature [30]. MnO2 has been tested as a cost-effective substitute and it has been reported to produce comparative results or even surpass in some cases the Pt performance [4,31]. MnO2 is usually combined with conductive materials (graphene, conductive polymers) so as to improve its electrocatalytic characteristics [30]. Similarly, AC is utilized as a cheap substitute for Pt, often modified, through doping in order to improve its characteristics [32].
It has been reported that the increase in the cathode surface area enhances the MFC performance [33,34]. Papillon et al., 2021, examined the cathode surface area using a single chamber MFC (0.85 L) with a stainless-steel anode and manually fabricated cathodes with Pt (0.5 mg/L) while acetate was used as the substrate [34]. The cathode surface area was initially doubled (31.7 cm2 to 63.3 cm2), resulting in a 23% power increase (650 μw to 801 μW) and subsequently tripled versus the initial surface cathode (31.7 cm2 to 95 cm2), resulting in 30% power increase (801 μW to 1039 μW) [34]. The internal resistance of the single chamber MFC decreased (127 Ω, 111 Ω and 90 Ω) as the surface increased [34]. Cheng and Logan 2011, reported that the higher the cathode surface area, the greater the power output in the case of synthetic solutions with high conductivity and substrate concentration [33]. In the study presented by Cheng and Logan [33], a single chamber MFC (0.25 L) was used, having a graphite brush with titanium as anode and a Pt-based cathode. The system was fed with an acetate synthetic solution (1 g COD/L). By increasing the surface of the cathode area from 24 cm2 to 96 cm2, an increase was observed in the power output (15 W/m3 to 78 W/m3) [33]. Walter et al., 2019, tested single-chamber MFCs with undiluted human urine as the electron donor [35]. The anode consisted of a carbon fiber veil and stainless steel mesh and the cathode was AC/PTFE pressed on a stainless steel mesh [35]. The cathode electrode was submerged at different heights (1/4, 2/4, ¾) in the urine resulting in different power outputs (1984 μW, 2396 μW, 3000 μW) based on the exposed cathode surface to the air and to the anolyte [35]. By completely submerging the cathode electrode in the urine, the power output decreased by 89% [35]. In many cases, the cathode surface of the single chamber MFCs is subjected to biofouling, by the wastewaters treated, which results in a reduction of the effective cathode area and decreases the power output of the MFC [36].
The aim of this work is, therefore, to optimize the architecture of a single chamber air cathode MFC by increasing the number of air cathode electrodes from 4 to 6, using the same anode configuration. For this scope, an air-cathode single-chamber MFC was constructed with “plug and play” characteristics, in order to easily replace or add new electrodes in the MFC unit. Different lids were manufactured in order to fit different numbers of cathode electrodes. The cathode assemblies were tubular and run through the anode chamber. Gore-Tex cloth was coated with catalytic paste containing MnO2 and used as the cathode electrodes (tubes), while graphite granules were used as the anode. The system was operated in batch mode, and the increase of cathode tubes from 4 to 6 was assessed using glucose as substrate. The anode was kept the same throughout the cathode changes. This work showcases the capabilities of an air-cathode single-chamber MFC, constructed using a specific selection and combination of materials while increasing the number of cathode electrodes, as well as the sturdiness of the anode during the changes to the MFC composition.

2. Materials and Methods

2.1. MFC Construction and Operation

For this study, an MFC (effective volume: 0.3 m3) consisting of a single cylindrical Plexiglas chamber shown in Figure 1, was constructed. The height of the cell is 13 cm whereas the “active height” (anode chamber) is 9 cm. The internal diameter of the unit is 14 cm with a 2 mm wall thickness (Figure 1c). Two circular lids made of Ertalon® formed the top and the bottom of the chamber. Different lids were constructed in order to fit 4 and 6 tubes (cathode electrodes), respectively (Figure 1a,b). The tubes run through the chamber and have “plug and play” characteristics.
For the cathode electrodes, a Plexiglas–Gore-Tex—MnO2 assembly was selected. The cathode’s construction was previously described [27]. Specifically, Plexiglas tubes with a 2 cm diameter and 2 mm thickness were used. The tubes were perforated with 2 mm diameter holes, to offer a surface area for ion transport from the anode to the cathode. Moreover, Gore-Tex cloth was used as the separator and the support for the electrocatalytic paste (3 g of MnO2-EMD Tosoh Hellas per cathode resulting in 0.075 g/cm2 loading) (Figure 2) [16]. The total surface area of each Plexiglas Gore-Tex electrode was 40 cm2, and the total cathode surface area with 4 electrodes was 160 cm2, while with 6 electrodes was 240 cm2. The cathode tubes are open to the atmosphere, and no special aeration is employed. Copper wire was used in the cathode for electron transfer. The anode electrode graphite granules (250 g—type 00514, Le Carbone, Brussels, Belgium), with diameters ranging between 1.5 and 5 mm, were used with a graphite rod embedded in them. An external resistance of 100 Ω was connected to the cell, except when electrochemical experiments were conducted. The unit was placed inside a temperature-controlled room set at 27 °C. The anode-to-cathode ratio (m2/m2) with four cathode electrodes was 10.6, and with six cathode electrodes, it was 7.
The cell was operated in batch mode, replacing the anode solution with a fresh one after the COD consumption and the current output decline. The exact composition of the anolyte may be found in [37]. Glucose (1 g COD/L) was used as the substrate. The MFC was initially operated with 4 cathode electrodes for three batch cycles. In the sequel, the lid was replaced with the top lid fitting 6 tubes and 2 more tubes were added to the system. The anode configuration was the same. In all cases, the anolyte volume was 300 m3. Given the oxidation of glucose in the anode and the reduction of oxygen in the cathode, the reactions taking place are [38]:
C 6 H 12 O 6   +   6 H 2 O     6 CO 2   +   24 H +   +   24 e ,   E a n o d e 0 = 0.43   V
6 O 2   +   24 H +   +   24 e     12 H 2 O ,   E c a t h o d e 0 = 0.82   V

2.2. Analytical Methods and Calculations

The voltage of the MFC was recorded in 2 min intervals by a Keysight LXI Data Acquisition system. The measurements of pH and conductivity were conducted using digital instruments WTW INOLAB PH720 and WTW INOLAB, respectively. The soluble COD was measured according to [39].
The coulombic efficiency (CE) and the electricity yield (Eyield) were calculated according to Equations (3) and (4), respectively. In particular, CE is defined as the fraction of the charge produced to the total charge contained in the substrate and is calculated by the equation:
C E = M O 2 0 t I d t F · b · V · Δ C O D
where M O 2 : molecular weight of oxygen (32 g/mol)
I: current generated during the operation cycle (A),
F: Faraday constant (46,985 C/mol),
b: number of electrons exchanged per mol of oxygen (4),
V: working volume of the MFC (300 mL),
ΔCOD: consumed COD (CInitial − CFinal, g COD/L) during a batch cycle.
The electricity yield (mJ/g COD/L) per g/L of initial COD concentration was calculated by the equation, for each batch cycle:
E y i e l d = 0 t P d t C O D g l u c o s e
where P: power generated (in W),
CODglucose: initial COD concentration (in g COD/L).

2.3. Linear Sweep Voltammetry (LSV) and Electrochemical Impedance Spectroscopy (EIS) for the Electrochemical Characterization of the MFC Performance

LSV experiments were carried out using a Potentiostat–Galvanostat (PGSTAT128N—AUTOLAB). The electrochemical experiments were conducted at the beginning of each operation cycle, after the feeding of the MFC. Before the electrochemical experiments, the cell achieved open-circuit voltage (OCV), by removing the external resistance. LSV was conducted from OCV to short circuit with a negative step (0.005 mV/s), in order to estimate the maximum power output of the cell. The internal resistance of the MFC was initially calculated using the power density peak method [38].
To further determine the internal resistances of the MFC with both 4 and 6 cathodes, electrochemical impedance spectroscopy (EIS) experiments were conducted on the 2nd and the 5th operation cycles. The experiments were conducted at the start of the operation cycle, after the feeding of the MFC and at OCV, over the frequency range of 2–10 mHz, using a stimulus with an amplitude equal to 10 mV. The equivalent circuit used in the EIS data fitting was similar to [16] and depicted in Figure 3. A two-electrode set-up was used, with the anode as the working electrode, the cathode as the counter, and the reference.
The LSV and EIS experiments were conducted after the MFC had completed one operation cycle with the corresponding configuration (4 and 6 cathode electrodes, respectively). This was done to assure that the measurements were conducted after the MFC performance stabilized, because of the changes in the compartment and the cathode electrodes.

3. Results

3.1. MFC Operation with 4 and 6 Cathode Electrodes

The aim of this work was to investigate the effect of the number of cathode electrodes on MFC performance. The current output and COD concentration during operation are presented in Figure 4.
During the operation with 4 cathode electrodes, the MFC cell achieved a repeatable maximum current output of 1.8 ± 0.1 mA (Figure 4). The average COD removal efficiency for the corresponding operation cycles was 94% (Table 1). The CE was approximately 14% during the three batch cycles, whereas the Eyield of the MFC during the operation with 4 cathode electrodes varied (18 mJ/gCOD/L—1st cycle, 10 mJ/gCOD/L—2nd cycle, 12 mJ/gCOD/L—3rd cycle).
Following the operation of the cell with the 4 cathode electrodes, the lid and bottom of the MFC were replaced by new ones in order to fit 6 cathode electrodes in the unit while keeping the same anode configuration. The MFC operation with 6 cathode electrodes produced a current output of 2.6 mA initially, followed by repeatable peaks at 3.1 ± 0.1 mA (Figure 4). The COD removal efficiency averaged 91% ± 4% (Table 1). During the 6-cathode electrode operation, the MFC achieved CE 28% in the 4th cycle (Table 1), while the CE value ranged from 13% to 18% in the subsequent cycles (Table 1). The maximum Eyield was equal to 20 mJ/gCOD/L (4th and 6th operation cycle, Figure 4). The minimum Eyield was observed during the 5th and 7th operation cycle and was 13 mJ/gCOD/L and 12 mJ/gCOD/L, respectively. It is worth mentioning that the 4th cycle of the first operation with the 6 electrodes set-up showed a different behavior than cycles 5, 6, and 7, which present a repeatable behavior. This result is attributed to the intervention made to the system while switching the lids and adding the cathode electrodes. The system after 162 h of operation (duration of the 4th cycle) recovered, and three repeatable batch cycles were observed.
The pH of the MFC effluent presented a small increase when compared to the initial pH of the synthetic glucose wastewater (pH 8 vs. pH 7, respectively). The conductivity of the MFC effluent was similar to the initial feedstock value (~11.5 mS/cm).
Overall, the highest current output (3.2 mA) was achieved with the 6 electrodes. Additionally, the CE during the 6-electrode operation was higher (CE 18%), when compared to the maximum CE during 4 electrodes (CE 15%). In both cases, similar trends were presented by the respective CEs, the maximum value was measured during the 4th cycle equal to 28%.

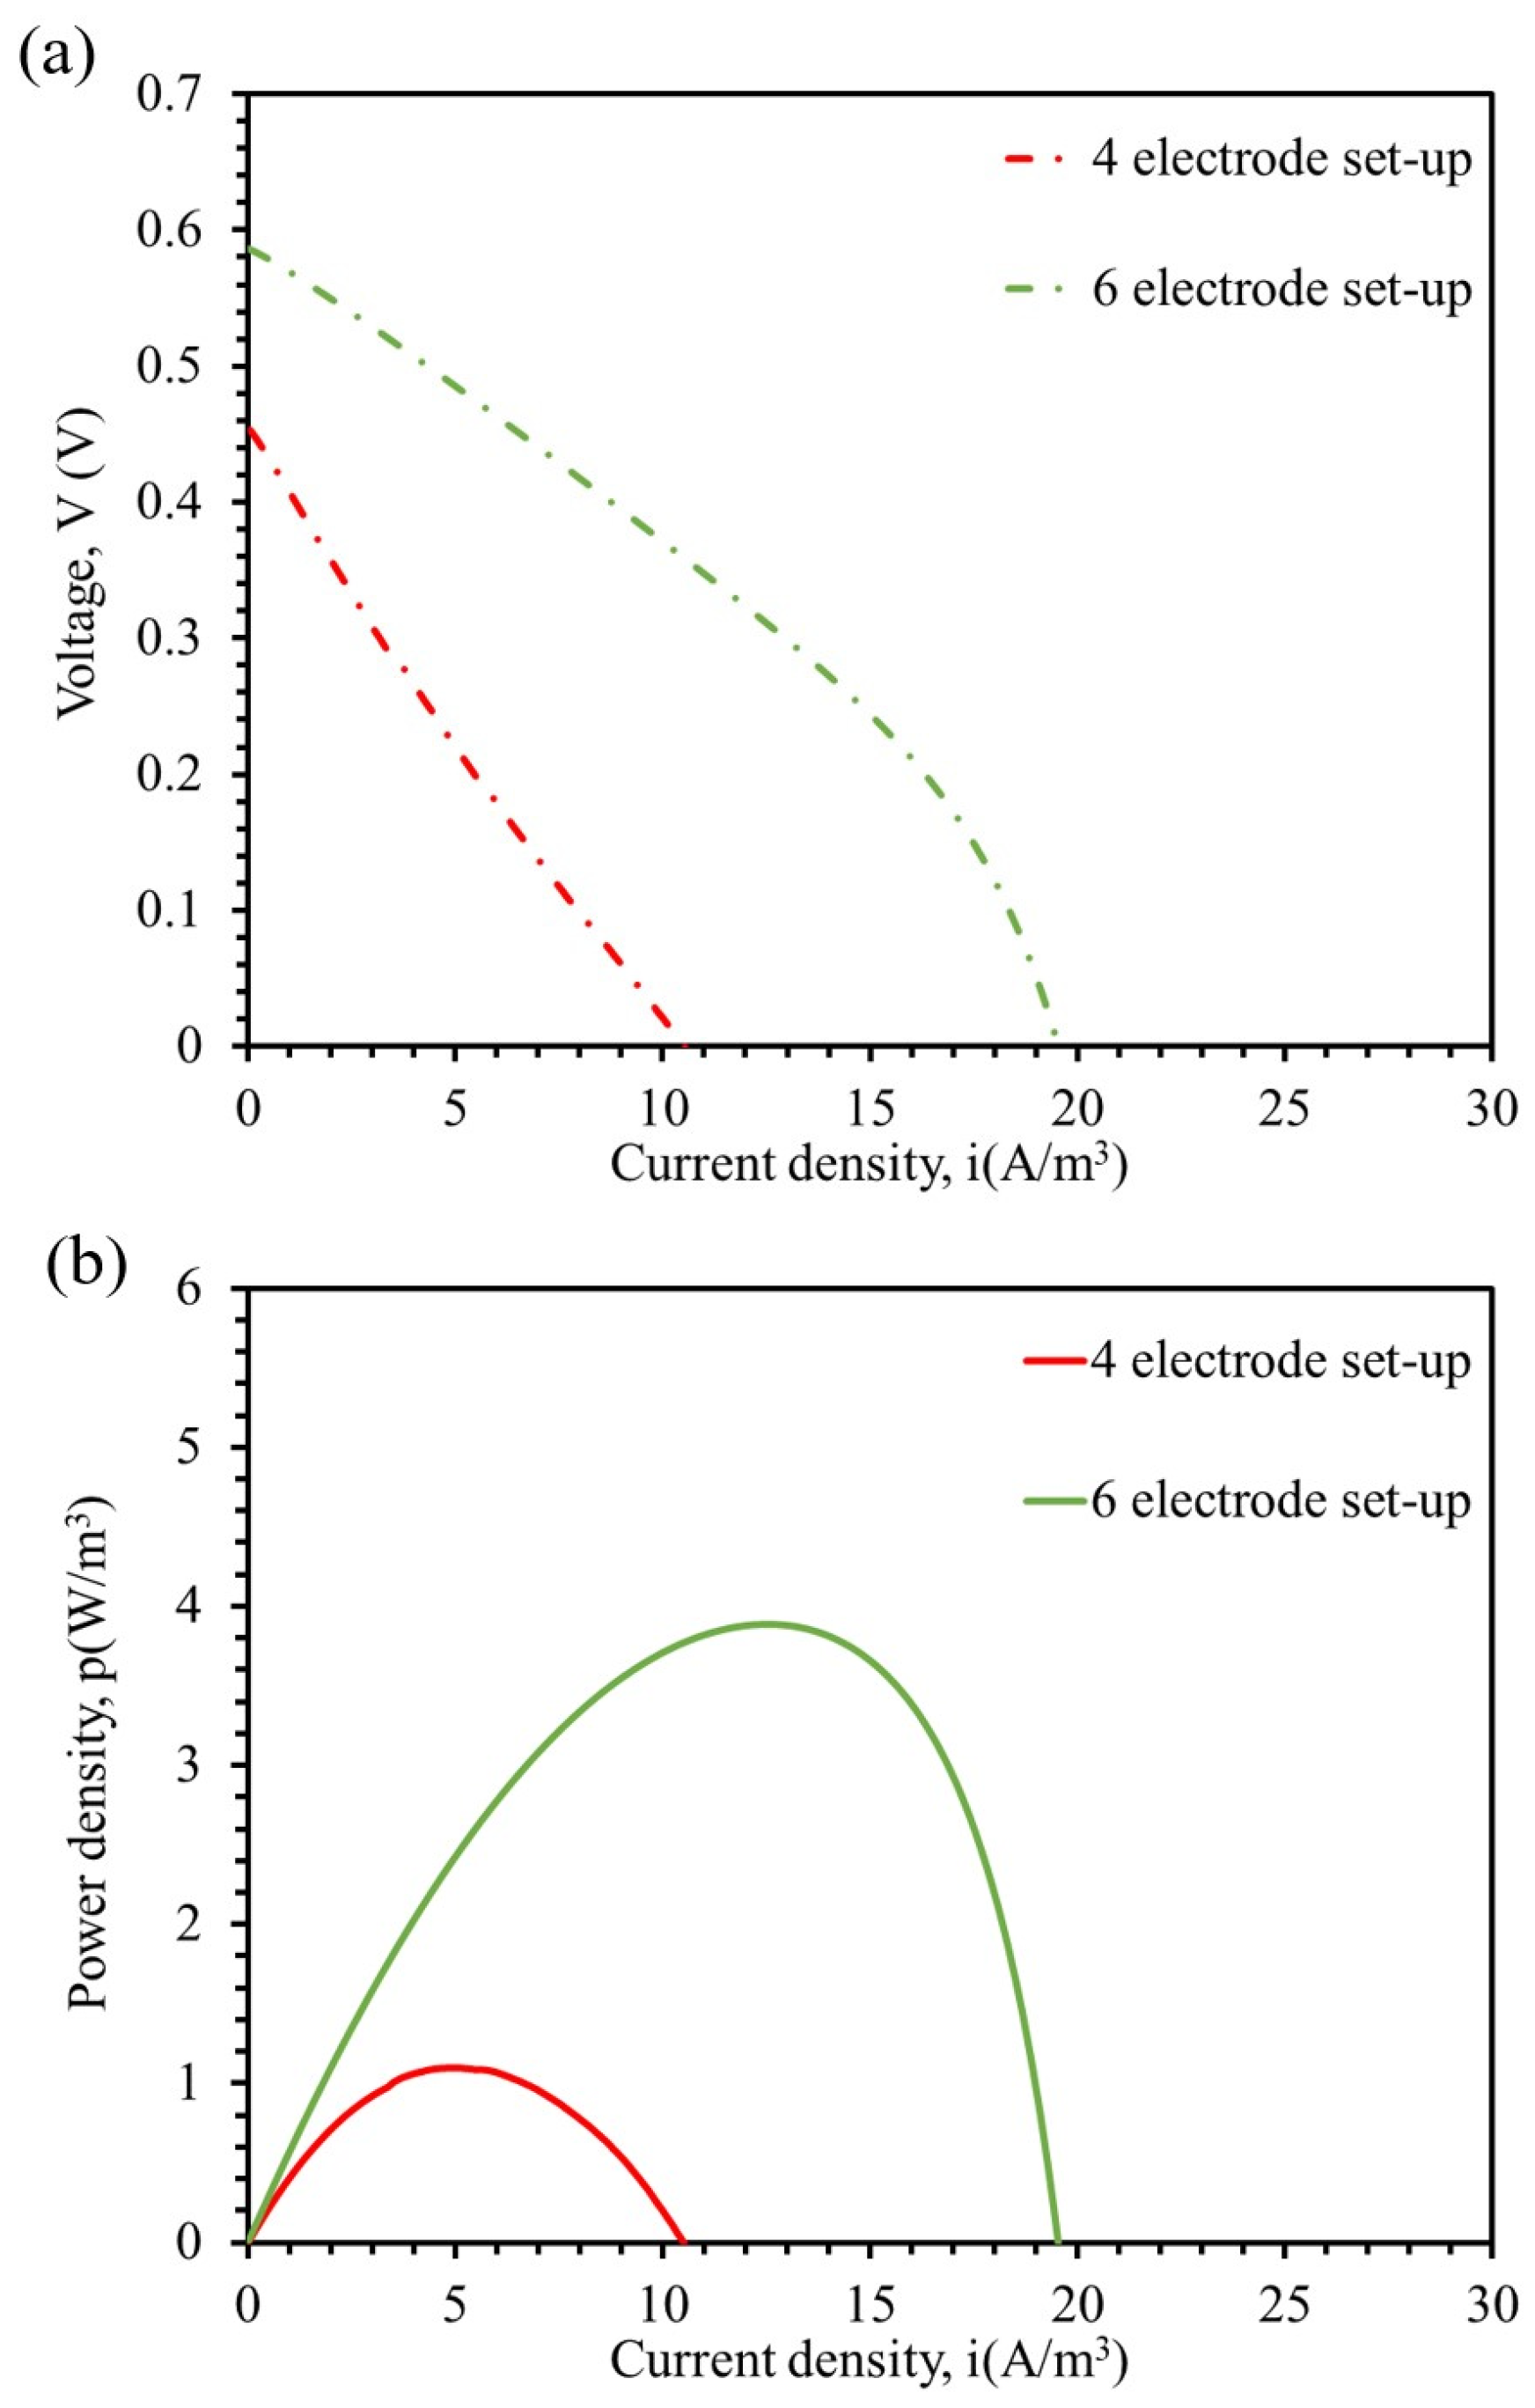
3.2. Effect of the Number of Cathode Electrodes on Polarization and Power Output of the MFC Unit

To determine the power output of the MFC during the operation with synthetic glucose wastewater (1 g COD/L), LSV experiments were carried out. Figure 5 presents the MFC voltage (V) (Figure 5a), and the power density (p) (Figure 5b) versus current density (i), for the MFC operation using different numbers of cathode electrodes. The current density and the power output are normalized per volume of the liquid (volumetric power output/density)
As shown in Figure 5a the open circuit voltage (OCV) was equal to 0.44 V for the 4-electrode set-up and 0.59 V for the 6-electrode set-up, respectively. In addition, the maximum power density during the operation with 4 cathode electrodes peaked at 1.1 W/m3 (2nd cycle), while increasing the number of electrodes led to an increase of the maximum power density to 3.9 W/m3 (5th cycle) (Figure 5b). Using the power density peak method, the internal resistance of the MFC was estimated equal to 124 Ω during the 4-electrode set-up and 82 Ω during the 6-electrode set-up. Moreover, the almost constant slope of the polarization curves (Figure 5a) indicates the very significant contribution of ohmic losses (ohmic overpotential) in both cases. In Table 2, the main results of the LSV experiments are summarized.
The above results showed that with a 50% increase in the cathode surface area, the volumetric power density of the MFC unit was tripled. By normalizing the power output to the cathode surface the respective maximum power density was 21 mW/m2 for the 4-electrode set-up and 49 mW/m2. The internal resistance reduction (124 Ω to 82 Ω) justifies the better performance of the 6-electrode set-up, as has been noted in previous works [33,37,40]. In [33], an increase in the cathode surface equal to 100% (24 cm2 to 48 cm2) resulted in approximately double the power [33]. In the work presented by Houghton et al., 2016, the cathode surface in single-chamber air cathode MFCs was doubled, resulting in 118% increased power [40]. Papillon et al., 2021 [34] doubled the cathode surface area in a single-chamber MFC, resulting in a 23% power output increase. The results produced in this work were in accordance with similar studies found in literature, as the cathode surface increase resulted in a power output boost.

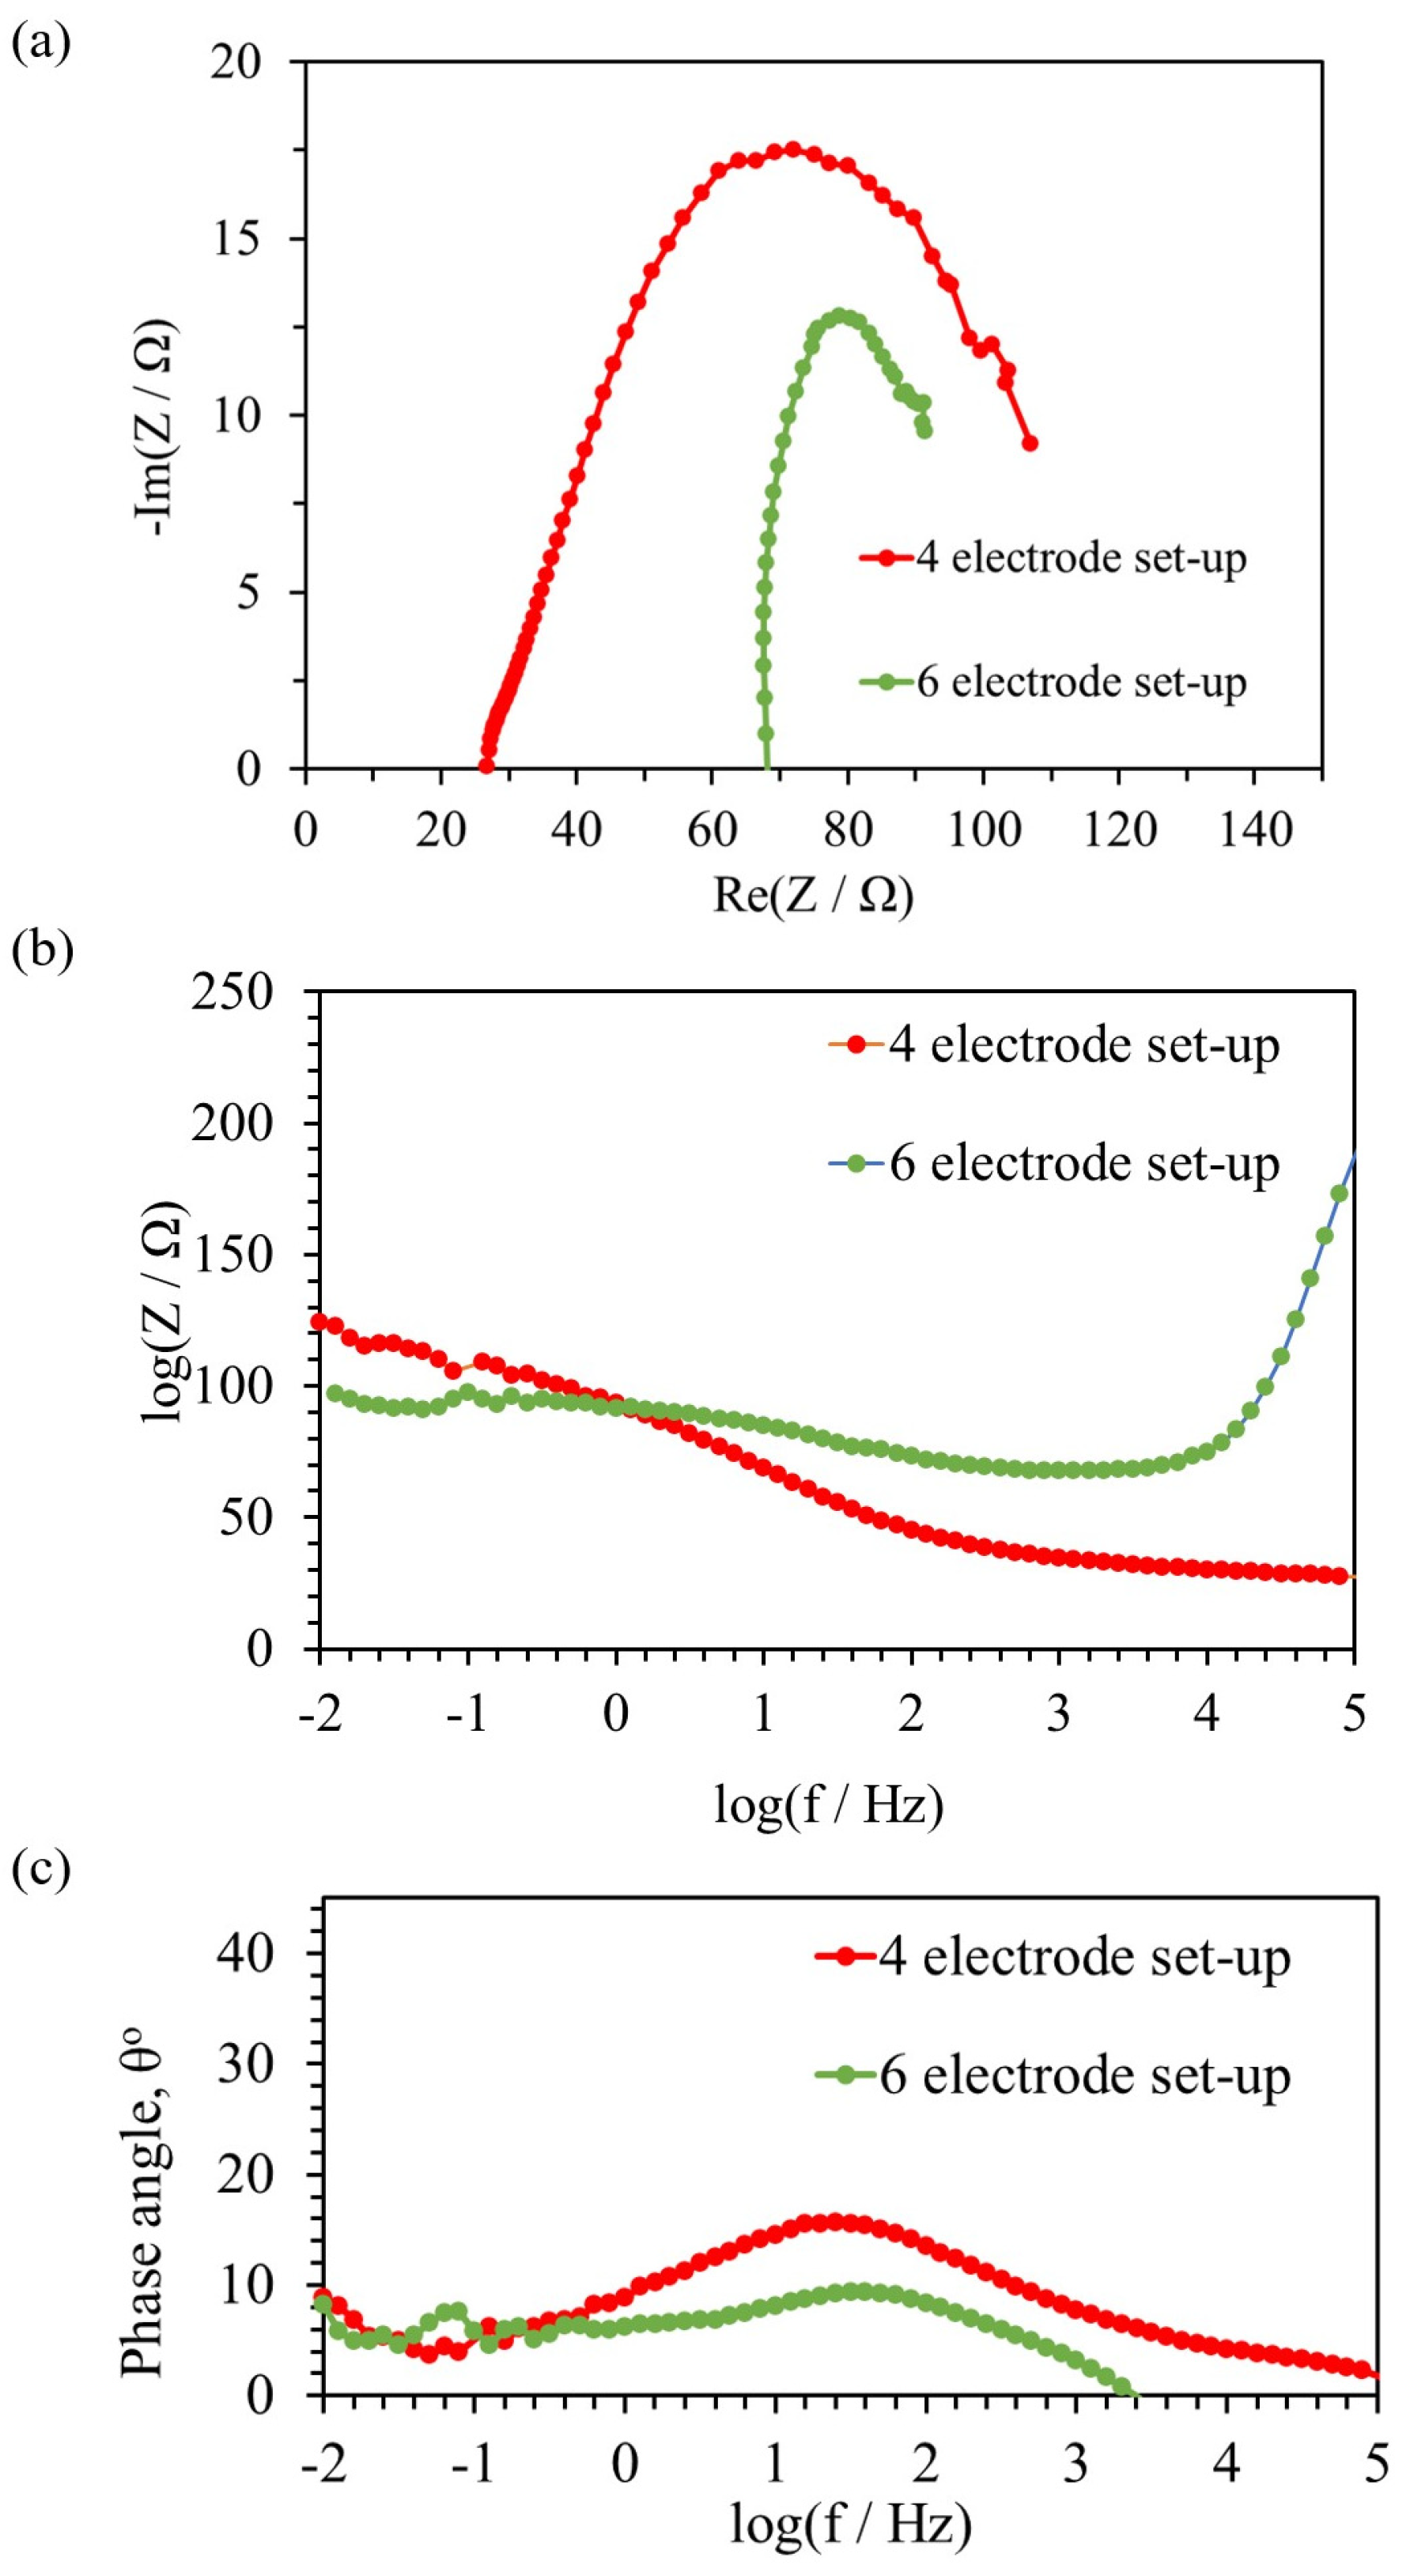
3.3. Electrochemical Impedance Spectroscopy

To further estimate the internal resistance of the MFC during the two different configurations, EIS experiments were conducted at the 2nd operation cycle and the 5th cycle, respectively. In Figure 6a–c, the results are presented in the form of Nyquist plot (Figure 6a), Bode plot (Figure 6b), and phase angle vs. log f plot (Figure 6c).
At the beginning of each batch cycle, the external resistance of the unit was removed, and the OCV was measured. The 4-electrode set-up achieved 0.45 V OCV, while the 6-electrode set-up 0.59 V OCV. Afterwards, the EIS experiments were carried out.
The internal resistance of the MFC was determined by the Nyquist plot (Figure 6a), at the point where the arc intersects with the x-axis at low frequencies and at high frequencies through extrapolation of the curve, as it has been showcased by [41,42]. As shown in Figure 6a, the polarization resistance of the 4-electrode set-up is higher than the 6-electrode set-up, in lower frequencies (~10 Hz). On the other hand, in higher frequencies (~2 MHz) the resistance of the 4-electrode set-up is lower than the respective 6-electrode set-up (Figure 6a,b). The low frequency intersect corresponds to the electrolyte/solution resistance (RS), which for the 4-electrode operation was equal to 27 Ω and the respective value for the 6-electrode operation was 68 Ω. A single loop arc was observed for each configuration and the shape of the arc indicated uneven current distribution, caused by the electrode surface morphology (Figure 2 and Figure 6a). The difference in the diameter of the two arcs showcases the better operation of the 6-electrode configuration [42]. The diameter of the Nyquist plot semicircles is associated with the interfacial charge-transfer resistance [43], which was reduced in this case by increasing the electrode number. Despite the difference in the impedance characteristics, the MFC achieved similar CEs and COD removal efficiency during the cycles that the EIS experiments were conducted (2nd and 5th, Table 1).
By fitting the EIS data, the corresponding values of equivalent circuit components are presented in Table 3. The increase of the cathode electrode number from 4 to 6 led to an increase of the RS (27 Ω to 68 Ω, Table 3) but reduced the charge-transfer resistance of the MFC (94 Ω to 24 Ω, Table 3), contributing this way to the increase in the current output from 1.8 mA to 3.1 mA (Figure 4) [42]. The RS decrease in the 6-electrode set-up is possibly caused by the increase in the number of cathode electrodes and the repositioning of the graphite granules into a more packed formation, directly impacting the electrolyte placement [42]. The charge-transfer resistance was reduced (from 94 Ω to 24 Ω) and the charge-transfer capacitance increased (from 4.8 × 10⁻³ F to 5.1 × 10⁻³ F), with the switch from 4 to 6 cathode electrodes. The transfer of the electrons from the anode solution to the anode electrode was described in the equivalent circuit by the charge-transfer resistance and by the charge-transfer capacitance [42]. By increasing the cathode electrode number from 4 (160 cm2) to 6 (240 cm2) the anode-to-cathode ratio decreased from 10.6 to 7, and the interface between the anode and the cathode increased. This resulted in a decrease of the interfacial charge-transfer resistance as indicated by the different diameters in the Nyquist plot, as well as the fitted values for the charge-transfer resistance for 4 (94 Ω) and 6 (24 Ω) cathode electrodes. The biofilm resistance (RBF) was similar in both cases (4 Ω, 3 Ω, Table 3) and the biofilm capacitance as well (0.3 × 10⁻⁴ F, 0.4 × 10⁻⁴ F). The increase in the cathode electrode number resulted in a decreased charge-transfer resistance, which improved the power output of the single chamber MFC.

4. Conclusions

The aim of this work was to optimize the architecture of a single-chamber air-cathode MFC by increasing the number of its cathode electrodes. The anode chamber was cylindrical and filled with graphite granules, while the cathode electrode assembly was comprised of Gore-Tex cloth pasted with MnO2 catalyst. An increase of the maximum current and the maximum power output of the cell by approximately 72% and 129%, was accomplished when the electrodes increased from 4 (total cathodic surface area of 160 cm2) to 6 (total cathodic surface area of 240 cm2) electrodes, respectively. As regards the synthetic wastewater treatment, the high COD removal efficiency was achieved (>89%) during the operation of the unit both with 4 and 6 cathode electrodes. This work shows that by a simple modification to the MFC single-chamber architecture, the performance of the system in terms of power generation was drastically boosted. Further optimization of the present MFC design is needed, in order to fully exploit its capabilities in terms of power output, while treating wastewater. To this end, keeping the same material selection, some critical factors would be the identification of the optimal ratio of anode to cathode surface area as well as improving the electrode connections to minimize electron losses at these points.

Author Contributions

Conceptualization, A.T. and G.L.; Data curation, A.T., T.K. and G.L.; Formal analysis, A.T., T.K. and G.L.; Funding acquisition, A.T.; Investigation, A.T., T.K. and G.L.; Methodology, A.T., T.K. and G.L.; Project administration, A.T. and G.L.; Resources, A.T. and G.L.; Supervision, A.T. and G.L.; Validation, A.T., T.K. and G.L.; Visualization, A.T., T.K. and G.L.; Writing—original draft, A.T. and T.K.; Writing—review & editing, A.T., T.K. and G.L. All authors have read and agreed to the published version of the manuscript.

Funding

This project has received funding from the Hellenic Foundation for Research and Innovation (HFRI) and the General Secretariat for Research and Technology (GSRT), under grant agreement No [862].

Data Availability Statement

The datasets generated and analysed during the current study are available from the corresponding author on reasonable request.

Conflicts of Interest

The authors declare no conflict of interest.

References

  1. Kim, K.-Y.; Rossi, R.; Regan, J.M.; Logan, B.E. Enumeration of exoelectrogens in microbial fuel cell effluents fed acetate or wastewater substrates. Biochem. Eng. J. 2020, 165, 107816. [Google Scholar] [CrossRef]
  2. Ida, T.K.; Mandal, B. Microbial fuel cell design, application and performance: A review. Mater. Today Proc. 2022, 76, 88–94. [Google Scholar] [CrossRef]
  3. Janicek, A.; Fan, Y.; Liu, H. Design of microbial fuel cells for practical application: A review and analysis of scale-up studies. Biofuels 2014, 5, 79–92. [Google Scholar] [CrossRef]
  4. Boas, J.V.; Oliveira, V.B.; Simões, M.; Pinto, A.M. Review on microbial fuel cells applications, developments and costs. J. Environ. Manag. 2022, 307, 114525. [Google Scholar] [CrossRef]
  5. Sarma, R.; Tamuly, A.; Kakati, B.K. Recent developments in electricity generation by Microbial Fuel Cell using different substrates. Mater. Today Proc. 2021, 49, 457–463. [Google Scholar] [CrossRef]
  6. Bird, H.; Heidrich, E.S.; Leicester, D.D.; Theodosiou, P. Pilot-scale Microbial Fuel Cells (MFCs): A meta-analysis study to inform full-scale design principles for optimum wastewater treatment. J. Clean. Prod. 2022, 346, 131227. [Google Scholar] [CrossRef]
  7. Mateo, S.; Cañizares, P.; Rodrigo, M.A.; Fernández-Morales, F.J. Reproducibility and robustness of microbial fuel cells technology. J. Power Sources 2019, 412, 640–647. [Google Scholar] [CrossRef]
  8. Santoro, C.; Flores-Cadengo, C.; Soavi, F.; Kodali, M.; Merino-Jimenez, I.; Gajda, I.; Greenman, J.; Ieropoulos, I.; Atanassov, P. Ceramic Microbial Fuel Cells Stack: Power generation in standard and supercapacitive mode. Sci. Rep. 2018, 8, 3281. [Google Scholar] [CrossRef] [PubMed]
  9. Tremouli, A.; Greenman, J.; Ieropoulos, I. Investigation of ceramic MFC stacks for urine energy extraction. Bioelectrochemistry 2018, 123, 19–25. [Google Scholar] [CrossRef]
  10. Kim, B.; Choi, S.; Jang, J.K.; Chang, I.S. Self-recoverable voltage reversal in stacked microbial fuel cells due to biofilm capacitance. Bioresour. Technol. 2017, 245, 1286–1289. [Google Scholar] [CrossRef]
  11. Ledezma, P.; Greenman, J.; Ieropoulos, I. MFC-cascade stacks maximise COD reduction and avoid voltage reversal under adverse conditions. Bioresour. Technol. 2013, 134, 158–165. [Google Scholar] [CrossRef]
  12. Walter, X.A.; You, J.; Winfield, J.; Bajarunas, U.; Greenman, J.; Ieropoulos, I.A. From the lab to the field: Self-stratifying microbial fuel cells stacks directly powering lights. Appl. Energy 2020, 277, 115514. [Google Scholar] [CrossRef]
  13. Mehravanfar, H.; Mahdavi, M.A.; Gheshlaghi, R. Economic optimization of stacked microbial fuel cells to maximize power generation and treatment of wastewater with minimal operating costs. Int. J. Hydrogen Energy 2019, 44, 20355–20367. [Google Scholar] [CrossRef]
  14. Prasad, J.; Tripathi, R.K. Review on improving microbial fuel cell power management systems for consumer applications. Energy Rep. 2022, 8, 10418–10433. [Google Scholar] [CrossRef]
  15. Kim, T.; An, J.; Jang, J.K.; Chang, I.S. Coupling of anaerobic digester and microbial fuel cell for COD removal and ammonia recovery. Bioresour. Technol. 2015, 195, 217–222. [Google Scholar] [CrossRef] [PubMed]
  16. Tremouli, A.; Kamperidis, T.; Pandis, P.K.; Argirusis, C.; Lyberatos, G. Exploitation of Digestate from Thermophilic and Mesophilic Anaerobic Digesters Fed with Fermentable Food Waste Using the MFC Technology. Waste Biomass Valoriz. 2021, 12, 5361–5370. [Google Scholar] [CrossRef]
  17. Bundhoo, Z.M.A. Coupling dark fermentation with biochemical or bioelectrochemical systems for enhanced bio-energy production: A review. Int. J. Hydrogen Energy 2017, 42, 26667–26686. [Google Scholar] [CrossRef]
  18. Zonfa, T.; Kamperidis, T.; Falzarano, M.; Lyberatos, G.; Polettini, A.; Pomi, R.; Rossi, A.; Tremouli, A. Two-Stage Process for Energy Valorization of Cheese Whey through Bio-Electrochemical Hydrogen Production Coupled with Microbial Fuel Cell. Fermentation 2023, 9, 306. [Google Scholar] [CrossRef]
  19. Ramanavicius, S.; Ramanavicius, A. Charge Transfer and Biocompatibility Aspects in Conducting Polymer-Based Enzymatic Biosensors and Biofuel Cells. Nanomaterials 2021, 11, 371. [Google Scholar] [CrossRef]
  20. Jimenez, I.M.; Greenman, J.; Ieropoulos, I. Electricity and catholyte production from ceramic MFCs treating urine. Int. J. Hydrogen Energy 2017, 42, 1791–1799. [Google Scholar] [CrossRef]
  21. Jimenez, I.M.; Brinson, P.; Greenman, J.; Ieropoulos, I. Electronic faucet powered by low cost ceramic microbial fuel cells treating urine. J. Power Sources 2021, 506, 230004. [Google Scholar] [CrossRef]
  22. Me, M.H.; Abu Bakar, M. Tubular ceramic performance as separator for microbial fuel cell: A review. Int. J. Hydrogen Energy 2020, 45, 22340–22348. [Google Scholar] [CrossRef]
  23. Kim, T.; Kang, S.; Sung, J.H.; Kang, Y.K.; Kim, Y.H.; Jang, J.K. Characterization of Polyester Cloth as an Alternative Separator to Nafion Membrane in Microbial Fuel Cells for Bioelectricity Generation Using Swine Wastewater. J. Microbiol. Biotechnol. 2016, 26, 2171–2178. [Google Scholar] [CrossRef]
  24. Zhang, X.; Liang, P.; Shi, J.; Wei, J.; Huang, X. Using a glass fiber separator in a single-chamber air-cathode microbial fuel cell shortens start-up time and improves anode performance at ambient and mesophilic temperatures. Bioresour. Technol. 2013, 130, 529–535. [Google Scholar] [CrossRef] [PubMed]
  25. Koók, L.; Dörgő, G.; Bakonyi, P.; Rózsenberszki, T.; Nemestóthy, N.; Bélafi-Bakó, K.; Abonyi, J. Directions of membrane separator development for microbial fuel cells: A retrospective analysis using frequent itemset mining and descriptive statistical approach. J. Power Sources 2020, 478, 229014. [Google Scholar] [CrossRef]
  26. Hirsch, L.O.; Dubrovin, I.A.; Gandu, B.; Emanuel, E.; Kjellerup, B.V.; Ugur, G.E.; Schechter, A.; Cahan, R. Anode amendment with kaolin and activated carbon increases electricity generation in a microbial fuel cell. Bioelectrochemistry 2023, 153, 108486. [Google Scholar] [CrossRef]
  27. Kamperidis, T.; Pandis, P.K.; Argirusis, C.; Lyberatos, G.; Tremouli, A. Effect of Food Waste Condensate Concentration on the Performance of Microbial Fuel Cells with Different Cathode Assemblies. Sustainability 2022, 14, 2625. [Google Scholar] [CrossRef]
  28. Yousefi, V.; Mohebbi-Kalhori, D.; Samimi, A. Ceramic-based microbial fuel cells (MFCs): A review. Int. J. Hydrogen Energy 2017, 42, 1672–1690. [Google Scholar] [CrossRef]
  29. Santoro, C.; Arbizzani, C.; Erable, B.; Ieropoulos, I. Microbial fuel cells: From fundamentals to applications. A review. J. Power Sources 2017, 356, 225–244. [Google Scholar] [CrossRef] [PubMed]
  30. Liu, Y.; Guo, S.; Wang, J.; Li, C. Fundamental development and research of cathodic compartment in microbial fuel cells: A review. J. Environ. Chem. Eng. 2022, 10, 3. [Google Scholar] [CrossRef]
  31. Li, X.; Hu, B.; Suib, S.; Lei, Y.; Li, B. Electricity generation in continuous flow microbial fuel cells (MFCs) with manganese dioxide (MnO2) cathodes. Biochem. Eng. J. 2011, 54, 10–15. [Google Scholar] [CrossRef]
  32. Lv, K.; Zhang, H.; Chen, S. Nitrogen and phosphorus co-doped carbon modified activated carbon as an efficient oxygen reduction catalyst for microbial fuel cells. RSC Adv. 2018, 8, 848–855. [Google Scholar] [CrossRef] [PubMed]
  33. Cheng, S.; Logan, B.E. Increasing power generation for scaling up single-chamber air cathode microbial fuel cells. Bioresour. Technol. 2011, 102, 4468–4473. [Google Scholar] [CrossRef]
  34. Papillon, J.; Ondel, O.; Maire, É. Scale up of single-chamber microbial fuel cells with stainless steel 3D anode: Effect of electrode surface areas and electrode spacing. Bioresour. Technol. Rep. 2021, 13, 100632. [Google Scholar] [CrossRef]
  35. Walter, X.A.; Santoro, C.; Greenman, J.; Ieropoulos, I. Self-stratifying microbial fuel cell: The importance of the cathode electrode immersion height. Int. J. Hydrogen Energy 2019, 44, 4524–4532. [Google Scholar] [CrossRef] [PubMed]
  36. Kolajo, O.O.; Pandit, C.; Thapa, B.S.; Pandit, S.; Mathuriya, A.S.; Gupta, P.K.; Jadhav, D.A.; Lahiri, D.; Nag, M.; Upadhye, V.J. Impact of cathode biofouling in microbial fuel cells and mitigation techniques. Biocatal. Agric. Biotechnol. 2022, 43, 102408. [Google Scholar] [CrossRef]
  37. Tremouli, A.; Martinos, M.; Bebelis, S.; Lyberatos, G. Performance assessment of a four-air cathode single-chamber microbial fuel cell under conditions of synthetic and municipal wastewater treatments. J. Appl. Electrochem. 2016, 46, 515–525. [Google Scholar] [CrossRef]
  38. Logan, B.E. Microbial Fuel Cells; John Wiley & Sons: Hoboken, NJ, USA, 2008. [Google Scholar] [CrossRef]
  39. APHA/AWWA/WEF. Standard Methods for the Examination of Water and Wastewater; American Public Health Association: Baltimore, MD, USA, 2012; pp. 36–37. ISBN 978-0875532356. [Google Scholar]
  40. Houghton, J.; Santoro, C.; Soavi, F.; Serov, A.; Ieropoulos, I.; Arbizzani, C.; Atanassov, P. Supercapacitive microbial fuel cell: Characterization and analysis for improved charge storage/delivery performance. Bioresour. Technol. 2016, 218, 552–560. [Google Scholar] [CrossRef]
  41. Tremouli, A.; Antonopoulou, G.; Bebelis, S.; Lyberatos, G. Operation and characterization of a microbial fuel cell fed with pretreated cheese whey at different organic loads. Bioresour. Technol. 2013, 131, 380–389. [Google Scholar] [CrossRef]
  42. Sekar, N.; Ramasamy, R.P. Electrochemical Impedance Spectroscopy for Microbial Fuel Cell Characterization. J. Microb. Biochem. Technol. 2013, 6, 1–14. [Google Scholar] [CrossRef]
  43. Minakshi, M.; Mitchell, D.R.G.; Munnangi, A.R.; Barlow, A.J.; Fichtner, M. New insights into the electrochemistry of magnesium molybdate hierarchical architectures for high performance sodium devices. Nanoscale 2018, 10, 13277–13288. [Google Scholar] [CrossRef] [PubMed]
Figure 1. Photos of (a) the top lid of the MFC fitting 6 electrodes, (b) the top lid of the MFC fitting 4 electrodes (c) the internal view of the MFC.
Sustainability 15 13107 g001
Figure 2. Photo of the GORE-TEX cloth and Plexiglas tubes while assembling.
Sustainability 15 13107 g002
Figure 3. Equivalent circuit used to fit EIS data. Where RS (Ω) is the electrolyte resistance, RBF (Ω) the biofilm resistance, RCT (Ω) the charge-transfer resistance, CBF (F) the biofilm capacitance and CCT (F) the charge-transfer capacitance.
Sustainability 15 13107 g003
Figure 4. Current output and COD concentration versus time, during batch operation of MFC with 4 and 6 cathode electrodes, respectively. Black arrows indicate when the EIS and LSV experiments were conducted. Red arrows indicate the MFC operation with different number of cathode electrodes.
Sustainability 15 13107 g004
Figure 5. MFC voltage versus current density (a) and power density versus current density (b) for the different cathode configurations (4 Gore-Tex and 6 Gore-Tex cathode electrodes, with MnO2 oxygen reduction catalyst).
Sustainability 15 13107 g005
Figure 6. Bode plot [log(|Z|) vs. log f] (a), Nyquist plot (b) and phase angle (θ, degrees) vs. log f plot (c) for the MFC operating with 4 cathodes (orange) and 6 cathodes (blue).
Sustainability 15 13107 g006
Table 1. The values of the main parameters during the operation of the MFC with 4 and 6 cathode electrodes.
Cycle #Imax (mA)Δt (h)COD Removal (%)CE (%)Eyield (mJ/g COD/L)
12.06792%13%17.7
21.97196%15%9.50
32.64493%14%12.2
42.616289%28%20.4
53.27489%15%13.2
63.211395%18%20.0
73.06989%13%11.7
Δt: duration of each cycle. #: number of cycles.
Table 2. Results of LSV experiments after the MFC achieved OCV with a 1 g COD/L synthetic glucose feedstock.
Electrodes #Open Circuit Voltage (V)Volumetric Power Density (W/m3)Internal Resistance (Ω)
40.441.1124
60.593.982
#: number of electrodes.
Table 3. Results of EIS experiments after the MFC achieved OCV with a 1 g COD/L synthetic glucose feedstock.
Electrodes #OCV (V)RS (Ω)RCT (Ω)RBF (Ω)CBF (F)CCT (F)
40.4527944.00.3 × 10−44.8 × 10⁻³
60.5968243.00.4 × 10−45.1 × 10⁻³
#: number of electrodes.
Disclaimer/Publisher’s Note: The statements, opinions and data contained in all publications are solely those of the individual author(s) and contributor(s) and not of MDPI and/or the editor(s). MDPI and/or the editor(s) disclaim responsibility for any injury to people or property resulting from any ideas, methods, instructions or products referred to in the content.

