Article

An Empirical Study of a Passive Exterior Window for an Office Building in the Context of Ultra-Low Energy

1
School of Civil Architecture and Environment, Hubei University of Technology, Wuhan 430068, China
2
College of Design and Engineering, National University of Singapore, Singapore 117566, Singapore
3
Central-South Architectural Design Institute Co., Ltd., Wuhan 430061, China
*
Author to whom correspondence should be addressed.
Sustainability 2023, 15(17), 13210; https://doi.org/10.3390/su151713210
Submission received: 1 August 2023 / Revised: 28 August 2023 / Accepted: 31 August 2023 / Published: 3 September 2023
(This article belongs to the Special Issue Sustainable Building Environment)

Abstract

:
As the energy crisis continues to intensify and with increasing awareness of global climate change, the issue of high energy consumption and emissions in buildings is garnering more attention. Windows have significant research value and importance as pivotal components in the development of ultra-low-energy buildings. This study presents a proposal for a passive exterior window considering the climatic conditions prevalent in the hot summer and cold winter zone of China. Firstly, an experimental platform was established outside a standard office to conduct tests and analyze the indoor thermal environment for four different scenarios in the summer and winter by comparing a passive room (PR) and non-passive room (NPR), respectively. The human apparent temperature was calculated based on the collected thermal environment data and subsequently evaluated. Lastly, the indoor environmental temperature (IET), window surface temperature (WST), and apparent temperature (AT) data were subjected to non-linear fitting regression analysis using Origin software. The primary aim of this analysis was to examine the impact of the passive exterior window on the indoor thermal environment and establish the feasibility of implementing such a window in the hot summer and cold winter zone of China. The results showed that: (1) in the summer, the IET and WST in the PR exhibited reductions of 0.8 °C and 0.6 °C, respectively, under ventilated conditions compared to the NPR; (2) in the winter, the IET and WST of the PR remained lower compared to those of the NPR (however, the temperature differential between the IET and WST in the PR amounted to 6.8 °C and 7.7 °C, respectively, while the corresponding disparity in the NPR was 8.1 °C and 9.3 °C); and (3) regarding the AT, during summer ventilation, the PR exhibited a substantial reduction of up to 3.5 °C in comparison to the NPR. Moreover, in the context of winter, the time for indoor human thermal perception to reach a comfortable level was extended by 0.5 h. Future investigations will delve into the influence of passive exterior windows on building energy consumption, and this research can provide a practical reference for energy-efficient design and retrofitting of exterior windows in the region.

1. Introduction

Amid the escalating global energy crisis and climate warming [1], the continuous rise in building energy consumption and carbon dioxide emissions has significantly impacted the global energy consumption and climate environment, rendering it an urgent problem that requires immediate attention and solutions [2]. Currently, China relies heavily on fossil fuels for its primary energy supply, leading to a steady rise in CO2 emissions. As China seeks to achieve its “3060” dual-carbon goal, the demand for energy-efficient buildings is increasing. In response, China is working to promote the development of low-energy buildings and has initiated research and development in the field of ultra-low-energy buildings. Various energy-efficient technologies, renewable energy sources, and innovative programs are exploring viable ways to curb building energy consumption [3,4,5,6]. Nowadays, a reduction in energy consumption and the improvement of indoor comfort in public buildings have emerged as critical research topics for both society and practitioners [7,8].
Buildings account for 40% of the total energy demand, with 80% of it sourced from fossil fuels [2]. Given this context, passive exterior windows have garnered significant attention in both research and practical applications as a pivotal element in enhancing building energy efficiency. Passive exterior windows have emerged as a crucial avenue for achieving energy conservation and heightened comfort, facilitating the infusion of natural light, warmth, and airflow through the building envelope to diminish reliance on artificial lighting, air conditioning, and heating. With the ongoing evolution of technology, substantial strides have been made in the design and effectiveness of windows. The evolution of traditional windows has traversed a trajectory encompassing rudimentary glazing and frames, advancing toward intricate multi-layer insulated glazing [9,10,11] and incorporating ingenious smart regulation technologies [12]. These innovations have not only elevated the thermal insulation capabilities of windows but have also endowed them with the flexibility to cater to varying requisites across distinct seasons and climatic contexts. Despite the multitude of research endeavors that have contributed to these advancements, the intricate interplay between design principles and the practical efficacy of passive exterior windows continues to pose a complex challenge, demanding a more profound and comprehensive exploration.
China’s extensive geographical expanse has fostered a diverse array of climatic zones, each exerting distinct influences on architectural practices. In the hot summer and cold winter belt situated in the middle and lower reaches of the Yangtze River, the rapid economic growth coincides with an increased pursuit of elevated living standards. Within this context, this region emerges as a reservoir of substantial energy-saving potential. Concurrently, the emergence of ultra-low-energy buildings as a pivotal industry trend aims at curtailing building energy consumption while enhancing energy efficiency, in alignment with the imperatives of sustainable development and environmental preservation. Consequently, further research is imperative to drive the diffusion and advancement of ultra-low-energy building paradigms.
Hence, within the global energy crisis and the overarching framework of ultra-low-energy buildings, delving into the utilization of passive exterior windows in the hot summer and cold winter zone of China assumes paramount significance. This endeavor promises to furnish invaluable direction and benchmarks for forthcoming building designs and retrofit initiatives. In terms of enhancing building efficiency and fostering indoor comfort, this inquiry bears immense practical relevance.

2. Literature Review

2.1. Energy Efficiency of External Windows

Numerous factors contribute to building energy consumption, with the envelope emerging as the foremost contributor, encompassing exterior walls, roofs, and windows. Diverse building envelopes exhibit distinct sensitivities to energy consumption; among them, external windows, as the vulnerable link within the envelope, display subpar insulation capabilities. Despite their relatively modest surface area, comprising about 10% of the envelope, windows account for a staggering 60% of a building’s energy loss [13]. In the quest to curtail building energy consumption, the significance of windows is paramount, consequently engendering considerable research interest. This scholarly exploration addressed pivotal dimensions of window design [14], heat transfer coefficients [15], solar heat gain [16], and window-to-wall ratios [17], thereby charting a more nuanced trajectory for window studies. Regarding the influence of external windows on building energy consumption, researchers have delved into multifarious dimensions. Elghamry et al. [17] concentrated on the interplay of window shape, design, size, location, and orientation in relation to building energy consumption and indoor comfort. Banihashemi et al. [9] undertook an analysis of parameters for double-glazed windows across diverse climatic conditions, aiming to enhance thermal insulation and overall building energy efficiency through a meticulous exploration of window materials. In a similar vein, Kahsay et al. [18] embarked on the optimization of external window configurations in high-rise structures via simulations, aiming to minimize energy consumption. In the hot summer and cold winter zone of China characterized by intense summer heat, humid winters, and elevated air moisture levels, fluctuations in cooling and heating requisites further amplify seasonal demands, resulting in suboptimal indoor comfort. He et al. [19] and associates sought to enhance the energy efficiency of a typical high-rise residence by retrofitting the window system of an existing building. Peng et al. [20] conducted a thorough study involving computer simulations to scrutinize the annual energy consumption of an office building in Nanjing, unveiling facets of the building envelope and exterior window performance while proposing effective energy-saving measures. In addition, both He [10] and Wang et al. [11] modeled a double-layer curtain wall, meticulously scrutinizing its energy consumption across diverse scenarios in the hot summer and cold winter zone of China.
Evidently, the enhancement of windows’ thermal performance [21] and the meticulous design and selection of suitable window systems [14] stand as two viable approaches to bolstering the efficacy of windows in mitigating building energy consumption. In the hot summer and cold winter zone of China, there exists significant potential to further optimize window-related strategies within the building envelope.

2.2. Passive Exterior Windows

Exterior windows of buildings are explored from various angles to enhance the energy efficiency, indoor comfort, and environmental sustainability of buildings. By adopting a rational and effective approach, architects can discover more options and innovative solutions to optimize the performance of building exterior windows. The exploration of windows’ dynamics also offers concrete insights for advancing the realm of ultra-low-energy buildings, fostering the inception of novel and innovative initiatives. As a pivotal facet within the scope of ultra-low-energy constructions, the incorporation of passive windows emerges as a potent means to substantially curtail energy exchange through the building facade, efficiently bridging the gap between indoor and outdoor temperatures. This, in turn, precipitates a marked enhancement in the building’s thermal insulation during summer and heat retention throughout winter, effectively diminishing the dependence on air conditioning systems and heating while concurrently slashing overall energy consumption.
Energy consumption is systematically reduced through meticulous optimization of the building envelope and astute harnessing of natural resources. The adept integration of passive design strategies aligns seamlessly with varying climatic conditions and environmental attributes, endowing structures with the capacity to sustainably manage energy utilization across divergent regions and seasonal variations. Measurements have demonstrated that passive design can achieve energy savings of over 50% in primary energy consumption [22]. Wang et al. [23] meticulously scrutinized climate data compiled from various meteorological stations across China to discern and dissect the most propitious passive design strategies for widespread implementation. Chen et al. [24] embarked on a comprehensive on-site investigation of passive office buildings located within China’s colder climes, meticulously observing their performance across distinct seasons and subsequently proposing an innovative metric for gauging the amalgamated energy consumption and indoor thermal well-being. Gou et al. [25] undertook a methodical optimization of novel residential structures in Shanghai, employing passive design principles to both elevate interior thermal comfort and concurrently curtail overall energy expenditure. Gong et al. [26] adroitly employed orthogonal and tabular methodologies to optimize a suite of seven passive design measures encompassing variables such as window-to-wall ratios, window orientations, glazing options, and wall thicknesses across representative Chinese cities. Their study delved into the intricate dynamics of minimizing building energy consumption while retaining architectural integrity. Lin et al. [27] proposed a new building envelope and façade design concept to investigate the passive strategy of daytime radiant coolers and thermochromic smart windows to evaluate their energy-saving performance. Wang et al. [28] applied a passive radiant cooling technology to windows and used a solution process to fabricate scalable smart windows for dynamic radiant cooling to adapt to different climate zones.
Therefore, there is a strong need to optimize the design of windows in the envelope. Passive design strategies are widely used to maximize the use of natural lighting and natural ventilation to reduce the dependence on mechanical equipment and traditional energy sources, thus improving indoor comfort.

2.3. The Importance of Exterior Windows for Interior Comfort

Functioning as a crucial intermediary connecting the indoor realm with the external environment, windows necessitate a holistic evaluation of their influence on the indoor thermal milieu and human well-being. A favorable indoor environment plays a pivotal role in safeguarding our physical and mental well-being, bolstering productivity, nurturing creativity, and fostering innovation. Buildings lacking windows may indeed save energy, but their thermal comfort and ambience as well as the resulting cognitive performance of occupants may suffer as a consequence [29,30].
From the perspective of subjective human factors, individuals possess the potential to exert a positive impact on both building energy consumption and the indoor environment through their window-opening behavior, particularly in non-air-conditioned structures [31,32,33]. Adequate ventilation plays a crucial role in keeping indoor air fresh and improving air quality, contributing to a more comfortable indoor thermal environment [34,35]. Yao et al. [36] investigated the window-opening behavior of residents across 19 residential structures. Through the detection of window states and the analysis of eight outdoor environmental factors such as temperature and relative humidity, they explored the primary variables impacting indoor comfort using multiple regression. Concerning the windows themselves, Zhang et al. [37] executed a multi-objective optimization of an office building’s window system, leading to a noteworthy enhancement in indoor comfort. Abdullah et al. [38] addressed indoor air quality and thermal comfort challenges in office buildings by utilizing an efficient window design that enabled natural ventilation.
Presently, a significant portion of research on indoor comfort primarily relies on the Predicted Mean Vote (PMV) and Predicted Percentage Dissatisfied (PPD) metrics from Fanger’s comfort equation [39,40]. The crucial role of AT in the realm of indoor environments cannot be underestimated [41], as it exerts a substantial influence on human comfort, well-being, and behavioral dynamics. Consequently, the current study employed variations in the indoor thermal environment to calculate AT, offering a visual assessment of the indoor comfort landscape.
In summary, the exploration of external windows within the building envelope has yielded valuable insights. Window studies often involve design or simulation approaches, whereas the assessment of passive exterior windows necessitates real-world scenario evaluations. For this reason, this study combined the climatic characteristics of Wuhan, in the hot summer and cold winter zone in China, to explore the feasibility of passive exterior windows in use by actually testing the indoor thermal environment and calculating the AT through a passive exterior window experimental platform constructed for existing office buildings. The findings presented in this research contribute valuable insights for guiding the passive design and retrofitting of office buildings in the hot summer and cold winter zone of China. Simultaneously, it presents practical technologies and strategies to foster the advancement of ultra-low-energy buildings, thereby steering the construction industry toward a more sustainable trajectory.

3. Materials and Methods

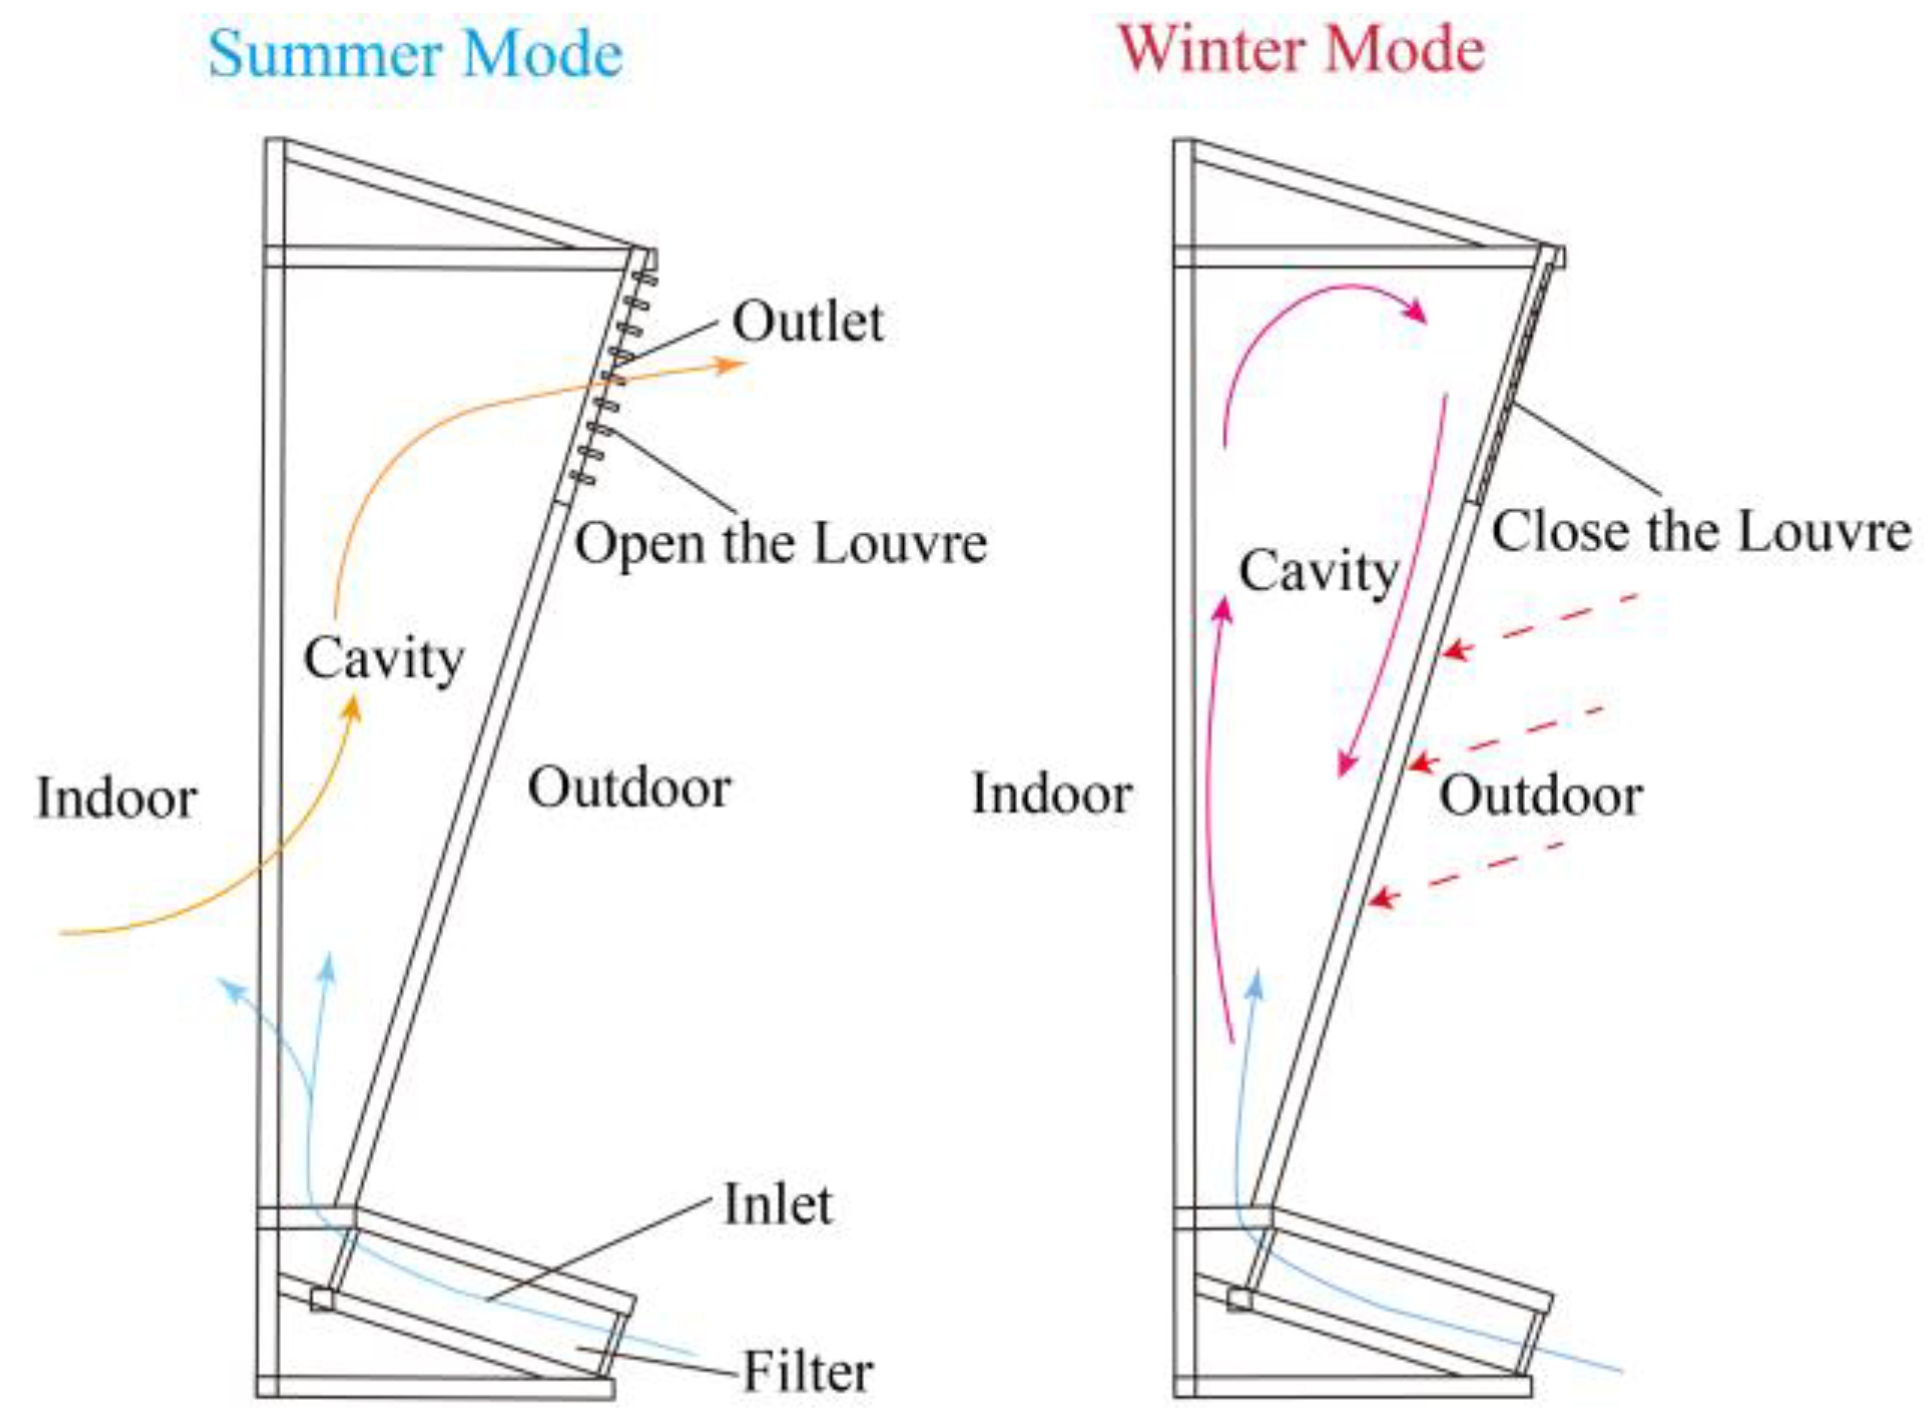
3.1. Experimental Principal Model

This research focuses on the climate-adaptive passive exterior window, which was designed to accommodate the varying characteristics of different seasons and time periods. The inclination angle of the components is aligned with the local solar altitude angle (73°32′), effectively reducing direct solar radiation and minimizing its impact on the indoor environment. The working mechanism of this passive exterior window is depicted in Figure 1. The main frame of the component is composed of 304 stainless steel, while the external installation is composed of a 3 mm PMMA acrylic (organic glass) sheet with low reflectivity and high transparency, which can effectively ensure the lighting and solar radiation in the room [42]. It incorporates adjustable breathing components that regulate window ventilation, enhancing the indoor thermal environment and resulting in energy savings.
The passive exterior window is a system designed to regulate the indoor thermal environment of a building using airflow variation and thermal chimneys. Its functionality can be adjusted to suit different scenarios during the summer and winter seasons, allowing for optimal performance and comfort. Figure 2 shows the usage pattern of the passive window in different seasons.
In summer daytime, the building’s existing windows can be closed to prevent heat from entering the interior. Simultaneously, the movable louvers of the passive exterior window can be opened, facilitating the intake of outdoor air through the inlet and its subsequent exhaust through the upper louvers. During summer nights, the existing windows can be opened to allow for natural ventilation. The narrow passage created by the inlet generates a venturi effect, which accelerates the airflow and enhances convection between the indoor and outdoor air. This promotes efficient heat exchange and effectively cools the interior. Consequently, the reliance on air conditioning can be reduced, resulting in a lower cooling load and improved energy efficiency.
During winter daytime, when the movable louvers and existing windows are closed, the interior space of the passive exterior window becomes sealed, forming an insulating layer. Sunlight directly entering the window cavity heats up the air inside, preventing heat loss from the interior. This utilization of solar heat gain contributes to energy efficiency and regulation of the indoor environment. Considering the prolonged time spent indoors, maintaining good indoor air quality is important. Appropriate measures can be implemented [43], such as installing an air purifier filter at the inlet of the passive exterior window to remove pollutants. By utilizing the airflow within the cavity and the differential airflow between the interior and the outdoor environment, a negative pressure zone is created. This negative pressure facilitates the expulsion of polluted air through the movable louvers, effectively purifying the indoor air.
Comfort and energy saving can also be achieved through reasonable operational efforts during the transition period (spring and fall) in the hot summer and cold winter zone of China. During the daytime in spring, the building’s original windows can be opened to utilize natural airflow to remove hot air from the room, while the air intake can draw in fresh, cool air. Windows can be closed at night or when temperatures drop to keep the room warm. Fall temperatures gradually decrease and transition into winter, similar to the spring controls. The transition period allows flexibility in the opening and closing times of the original windows according to weather forecasts and temperature changes in order to balance indoor and outdoor temperature changes and maintain a comfortable indoor temperature to avoid overheating or overcooling. Reasonable operation of windows and utilization of airflow according to different temperature changes can achieve the goals of energy saving and comfort.

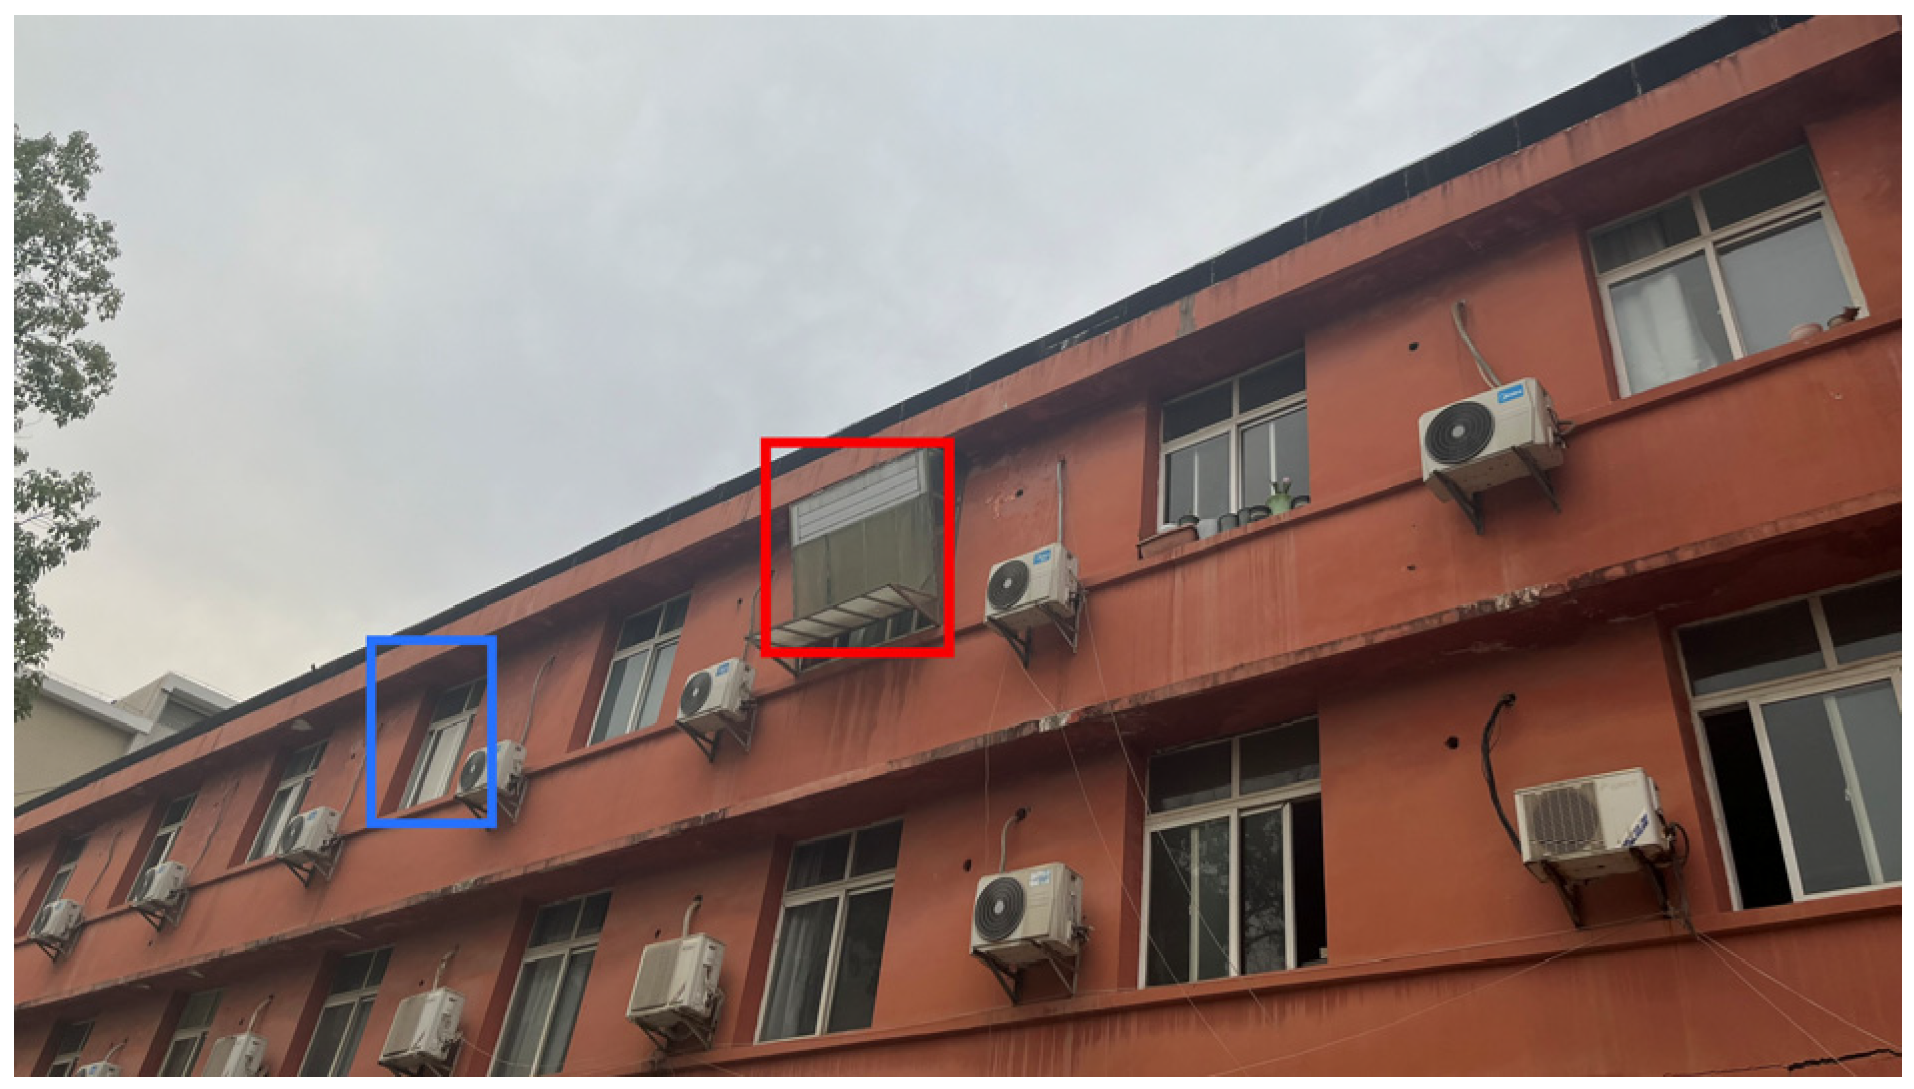
3.2. Experimental Platform and Testing Instructions

The experimental platform for the passive exterior window was established outside an office room located on the third floor of an office building in Wuhan (Figure 3). This specific room was selected as the designated renovation space for implementing the passive exterior window. Another office room of identical dimensions was chosen as the comparison room. Both experimental rooms measured 6.0 × 3.0 × 3.0 m and faced the south, providing single-sided daylighting. The windows in both rooms consisted of two single-layer glass panes, with a total area of 2.57 square meters and a window-to-wall ratio of 0.29.
After completing the setup of the experimental platform, the two experimental rooms were tested separately. Various parameters such as the IET, WST, and internal wall surface temperature were measured and analyzed based on relevant standards. The purpose was to investigate the impact of the passive exterior window on the indoor thermal environment and AT during summer and winter. The placement and description of measurement points in the rooms are provided in Figure 4 and Table 1. To account for potential spatial variations, three sets of measurement points were strategically positioned within the room. Subsequent to test completion, preliminary data analysis indicated that the disparities among the metrics from the three datasets were not substantial. Consequently, representative data were chosen for in-depth analysis in this study.

3.3. Test Scenarios and Outdoor Climate Conditions

Seasonal characteristics in the hot summer and cold winter zone of China mainly show significant temperature and precipitation changes. Summer is hot and rainy, fall is warm and cool, winter is cold and dry, and precipitation increases in spring when the temperature rises. Summer and winter day weather changes are large, so the building must meet the summer heat protection while taking into account the winter heat preservation. In the transition period (spring and fall), climate change is smoother and human comfort is higher. As windows are affected by climatic conditions, they perform differently. In order to more comprehensively, realistically, accurately, and scientifically assess the impact of passive exterior windows on the indoor environment when they are actually used and to synthesize the changes in different situations, we provide more valuable data and guidance for the research and design of windows. Therefore, we chose to test in summer and winter when the weather changes were more obvious and did not test in spring and fall. Therefore, we set up two scenarios in summer and winter and tested them for two days, respectively.
This study addressed four different scenarios as follows. Scenario 1 (S1) involved comparing rooms with PR and NPR during summer with open windows (28 July 2018). In Scenario 2 (S2), PR and NPR had their windows closed during summer (29 July 2018). Moving on to winter scenarios, Scenario 3 (S3) focused on PR and NPR with closed windows and air conditioning set to 20 °C (2 January 2022). Lastly, in Scenario 4 (S4), PR and NPR had their windows closed (3 January 2022). The summer model illustrates the operation of S1 and S2, while the winter model demonstrates the operation of S3 and S4 in Figure 2. By conducting a comparative analysis of the measured data across these four scenarios, a more accurate assessment of the impact of passive windows on the indoor thermal environment could be achieved.
The focus of this study was an office building setting. Considering the typical operation of office spaces, the period from 8:00 to 18:00 constituted the peak hours of daily activities. Within this timeframe, employee engagement, meetings, and work tasks were prevalent. This specific time frame ensured comprehensive coverage of employees’ work hours, thereby offering a more accurate depiction of the influence of the passive exterior window on indoor conditions and the occupants within the office space. Choosing office hours for testing contributes to the assessment of indoor comfort during real working scenarios, presenting valuable insights for enhancing indoor environments within office buildings.
Taking into account the influence of outdoor conditions on the indoor environment, Figure 5 demonstrates the variations in outdoor temperature and solar radiation intensity across different scenarios. Referring to Figure 5, in S1, the outdoor temperature ranged from 29.1 to 34.5 °C, with an average temperature of 31.5 °C. The average relative humidity (RH) was 68%, and the peak solar irradiance reached 1063.1 W/m2. In S2, the outdoor temperature ranged from 31.4 to 36.6 °C, with an average temperature of 34.5 °C. The average RH was 73%, and the peak solar irradiance was 1033.2 W/m2. Moving on to S3, the outdoor temperature ranged from 1.3 to 13.1 °C, with an average temperature of 6.5 °C. The average RH was 72%, and the peak solar irradiance was 929.4 W/m2. Lastly, in S4, the outdoor temperature ranged from 1.9 to 14.6 °C, with an average temperature of 8.4 °C. The average RH was 65%, and the peak solar irradiance was 930.5 W/m2.

4. Analysis of Text and Regression Results

4.1. Analysis of Indoor Environmental Testing Results

4.1.1. Summer Scenarios

Referring to Figure 6 and Table 2, in S1 and S2, the average IET was consistently lower in the PR than in the NPR, with a difference of 0.8 °C. The maximum IET values were also lower in the PR, with a difference of 0.9 °C and 1.2 °C, respectively. The average WST in the PR was lower than in the NPR by 0.6 °C and 0.2 °C in S1 and S2, respectively. In addition, the maximum WST values were lower in the PR, with a difference of 1.0 °C and 0.8 °C compared to the NPR. In the ventilation scenario (S1), the average wind speed in the PR was 0.4 m/s higher compared to the NPR, with a maximum indoor wind speed (IWS) of 2.8 m/s. Both the average and maximum RH were higher in the PR than in the NPR. These results indicate that during the summer daytime, regardless of ventilation, the PR had lower overall indoor temperatures compared to the NPR. This helped to effectively mitigate the increasing trend of indoor temperatures. Moreover, the passive exterior window improved the indoor air exchange during ventilation scenarios.
In Table 2, it is evident that in S1 and S2, the IET displayed temperature differences of 3.8 °C and 2.4 °C for the PR and 4.0 °C and 3.1 °C for the NPR, respectively. Notably, NPR’s IET was 0.2 °C higher than PR in S1 and 0.7 °C higher in S2. In terms of the WST, the variations were 4.5 °C and 4.1 °C for PR and 4.8 °C and 5.1 °C for NPR in the respective scenarios. Particularly, in S2, NPR’s WST surpassed PR by 0.3 °C and 1.0 °C, respectively. Although these differences are subtle, they underscore the influence of passive exterior windows. These windows not only stabilized IET but also shaded the original windows of the building, reducing the WST and promoting stability in the indoor thermal environment.

4.1.2. Winter Scenarios

Table 3 and Figure 7 reveal that in winter, when outdoor temperatures were low and solar radiation was weak, the IET and WST of the NPR were higher than those of the PR by 0.1–1.8 °C. Specifically, in S3 and S4, the average the IET of the NPR was higher than that of the PR by 1.8 °C and 0.1 °C, respectively. However, it is worth noting that the temperature differences within the PR were 5.9 °C and 6.8 °C, whereas within the NPR, they were 8.1 °C and 7.4 °C, respectively. As a result of direct solar radiation, the WST of the NPR was slightly higher, with a difference of 0.1 °C compared to the PR. When comparing the temperature differences at the WST, it is evident that the temperature differences within the PR were 7.7 °C and 7.0 °C, while within the NPR, they were 8.9 °C and 9.3 °C. Both the average and maximum relative humidity values in the PR were lower than those in the NPR. Therefore, although the IET and WST in the PR were lower than those in the NPR, the temperature difference was smaller and more stable within the PR.
The indoor surface temperature directly influences WST, RH, AT, and other factors that greatly impact people’s living and working environments. Table 4 presents the average temperatures of the walls and ceiling on both sides of the indoor space throughout the day. Notably, in various scenarios, the PR exhibited wall surface temperatures that were 0.1 °C to 1.0 °C higher than the NPR. This observation indicates that the passive exterior window possesses a certain thermal resistance effect, contributing to the stability of the IET.

4.2. AT Calculation and Evaluation Analysis

4.2.1. AT Calculation Method

The comparative analysis of the measured data, which considered the impact of PR and NPR on the indoor environment mainly from an overall perspective, hardly reflected the human perception of the surrounding environment indoors. In order to further analyze the subjective comfort of people in the indoor environment, a quantitative analysis of comfort was carried out. In this regard, the formula for the AT was used to calculate the perceived temperature of the surroundings based on the measured room temperature, RH, and other data, and was analyzed specifically.
Due to the combined influence of factors such as temperature, humidity, and wind speed, the AT is also known as the Temperature–Humidity–Wind Index (TWH). By calculating and analyzing the perceived temperature based on the measured data from the rooms, a comparison could be made between the PR and NPR in terms of thermal conditions. A commonly used formula proposed by Robert G. Steadman can be used to calculate the AT [41]:
AT = 1.07 T + 0.2e − 0.65 V − 2.7
e = R H 100 × 6.105 × e x p 17.27 T 237.7 + T
where AT represents the human perceived temperature in degrees Celsius (°C), T represents the ambient temperature in degrees Celsius (°C), e represents the water vapor pressure in Pascals (hPa), V represents the wind speed in meters per second (m/s), and RH represents the relative humidity in percentage (%).
Based on this, Chen et al. [44] improved the Gene Expression Programming (GEP) algorithm and incorporated multiple environmental variables to establish a mathematical model for the human perceived temperature. Through comparative analysis of the model data and test data, they optimized the general formula for the AT, as shown in Equations (3) and (4):
AT = T − 0.2798 TV + 2 V + V2, 30 ≤ RH ≤ 50
AT = 1.0695 T − 0.2798 TV + 2 V + V2 + 0.0695(RH − 50) − 0.5315, 50 ≤ RH ≤ 80
By conducting actual measurements to obtain relevant indoor thermal environment data, the calculated changes in human thermal sensation can be determined using the provided formulas. This allows for the calculation of the AT during the summer and winter daytime in indoor environments.

4.2.2. AT Analysis

Utilizing Equations (3) and (4) with the measured data, AT values for various scenarios in summer and winter were calculated; these are presented in Table 5. In summer, the average AT in the PR was consistently lower than that in the NPR by 3.5 °C and 0.8 °C in S1 and S2, respectively. In terms of peak values, the PR exhibited a decrease of 1.0 °C and 1.1 °C compared to the NPR in S1 and S2, respectively. Regarding the mean change observed during S3 in winter, the AT of PR showed a decrease of 0.1 °C and 0.5 °C, respectively, in comparison to NPR. During the peak change, both rooms maintained the same conditions in S3, while PR exhibited a 0.4 °C increase compared to NPR in S4. The AT of PR was lower than that of NPR in wintertime, but the difference was not significant. This showed that the effect of the passive exterior window on the AT in summer was better than that in winter.
As shown in Table 5, during the summer season, the AT difference between PR and NPR was 14.5 °C and 10.9 °C in S1 and 2.1 °C and 2.9 °C in S2, respectively. For the winter season, the AT difference between the two rooms was 5.7 °C and 4.7 °C in S3 and 5.6 °C and 5.1 °C in S4, respectively. Upon observing Figure 8, it becomes evident through comparison that during summer, the AT change for PR demonstrated enhanced stability compared with NPR and was specifically noticeable in S2. However, in S1, the stability of PR was less pronounced. This phenomenon was largely attributed to the fact that during S1, doors and windows were open, and wind speed had a more significant impact on the AT. In contrast, during the winter season, the stability of NPR surpassed that of PR. The fluctuation in the AT in both rooms was higher, which was attributed to the influence of the outdoor temperature and RH.

4.2.3. AT Evaluation

To provide a comprehensive assessment of the indoor AT, its performance was evaluated and analyzed across various scenarios in the summer and winter while following the temperature range defined by Matzarakis et al. [45]. This analysis offered further insights into the effectiveness of the passive exterior window in regulating the indoor thermal environment (Table 6).
During summer, the indoor thermal sensation typically ranges from 22.9 °C to 39.0 °C with varying levels of human perception, including comfortable, slightly warm, warm, and hot. In Figure 8, it is evident that the overall thermal sensation in the PR was lower compared to the NPR. In S1, the thermal sensation in the PR was primarily perceived as slightly warm, while in the NPR, it was perceived as warm. In S2, both rooms were perceived as hot in terms of thermal comfort. During summer, the passive exterior window contributed to a certain improvement in the thermal sensation within the rooms. However, it is important to note that the human thermal perception still fell within the warm or hot range, which may result in discomfort for office occupants.
By observing Figure 8, it becomes apparent that when the AT surpassed 18 °C, individuals generally felt comfortable. As a result, this threshold was established. During winter, the AT in all scenarios remained above 13 °C. In S3, both the PR and NPR maintained an AT above 18 °C for 2.5 h and 2 h, respectively. In S4, these durations increased to 5 h for the PR and 4.5 h for the NPR. Consequently, it can be concluded that the PR provided an additional 0.5 h of thermal comfort compared to the NPR.

4.3. Non-Linear Fitting Regression Analysis

Upon analyzing the test data, it became evident that the dataset did not follow a linear pattern. It showed a clear tendency to bend, similar to the shape of a parabola. In order to more accurately predict and describe the trend in the data as well as to reveal the potential characteristics and patterns between the data, the fitting accuracy and predictive ability of the model were improved. Therefore, it was chosen to select the least-squares parabola fitting function (y = A + Bx + Cx2) to fit the regression of non-linear data for the IET, WST, and AT. The number of iterations for each of the following non-linear fitted regressions was 5. This choice aided in uncovering the underlying characteristics and patterns within the data, thereby providing further insights into the effectiveness of the passive exterior window in influencing the indoor thermal environment.

4.3.1. IET Non-Linear Fitting Regression

Based on the data presented in Table 7 and Table 8, the R2 values for the PR in the four scenarios were 0.848, 0.826, 0.918, and 0.651, respectively. Similarly, the R2 values for the NPR in the four scenarios were 0.639, 0.919, 0.953, and 0.701, respectively. These high R2 values indicated a strong fit of the regression analysis, aligning with the predictive judgment of the parabola-fitting function. Table 9 demonstrates the analysis of variance for the IET fitted regressions.
When examining Figure 9, it becomes apparent that the fitting curves for the PR in S1 and S2 were consistently lower compared to the NPR curves. Furthermore, the PR curve in S1 exhibited a higher level of convergence, while the NPR curve in S2 demonstrated a greater convergence. It can be concluded that the passive exterior window was particularly effective in reducing the indoor thermal environment, especially in summer ventilation scenarios. However, in S3 and S4, despite the lower environmental temperature and higher convergence of the NPR, the passive exterior window’s impact on the indoor environment during winter was not ideal.

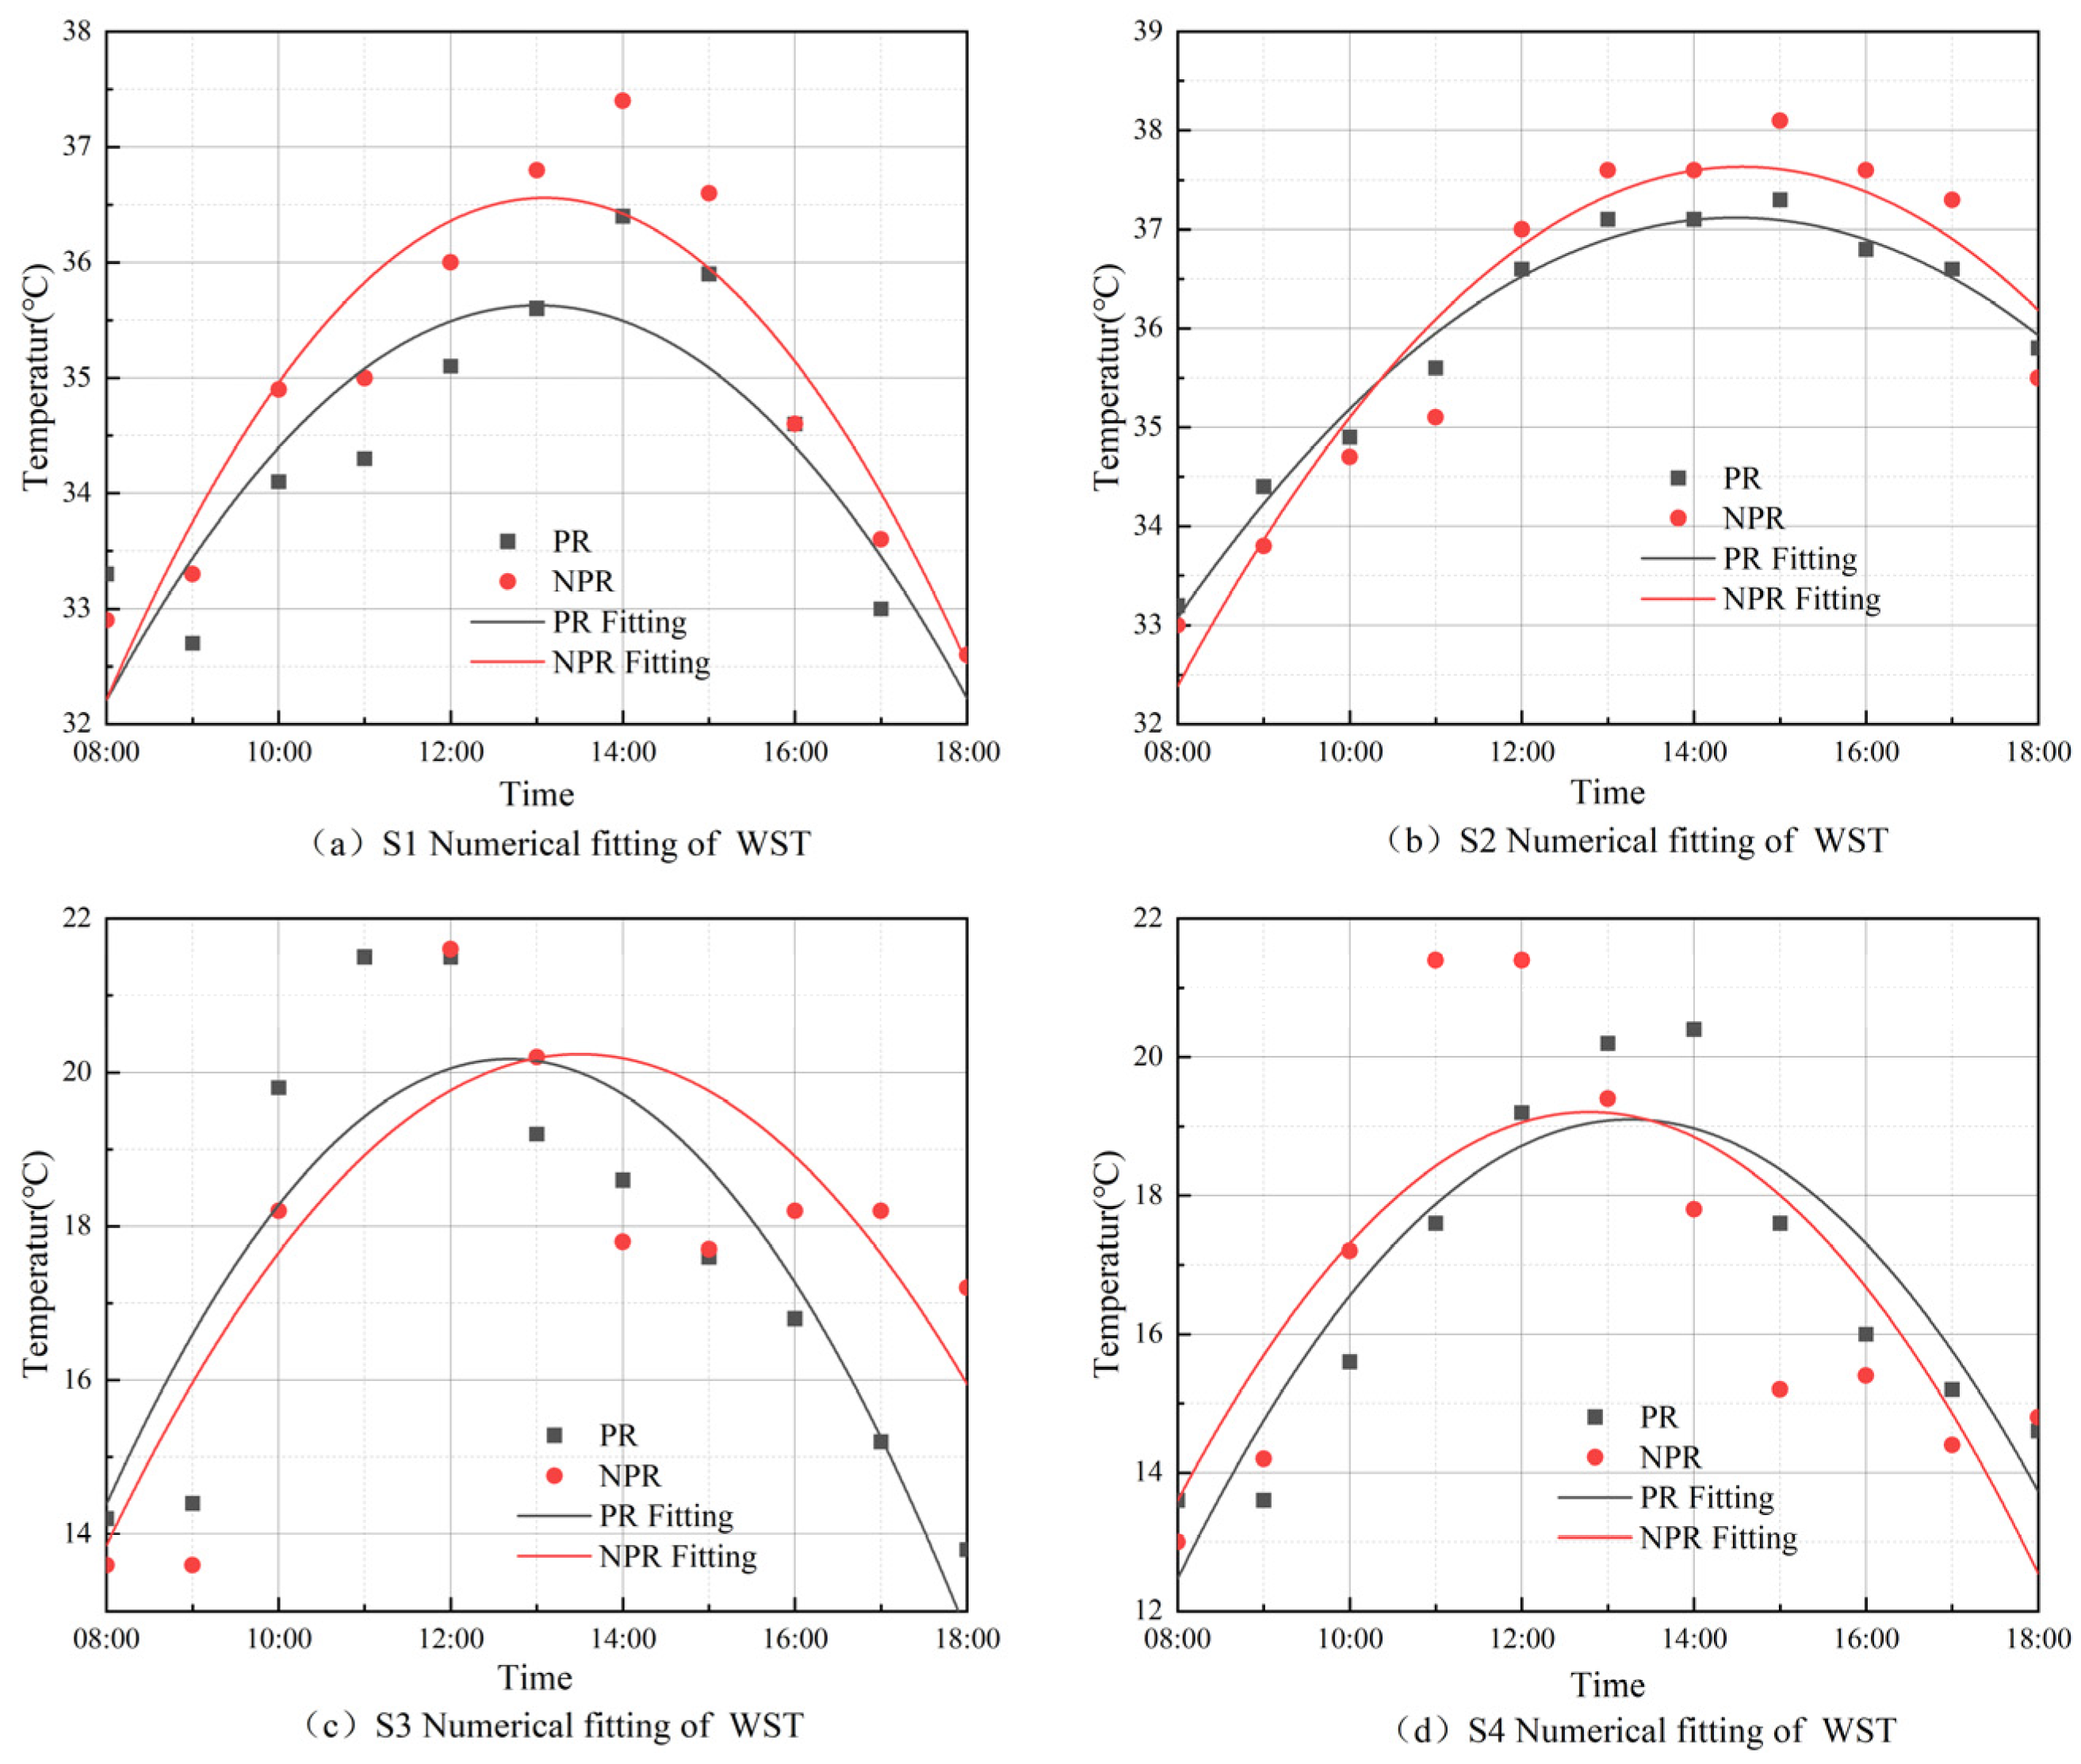
4.3.2. WST Non-Linear Fitting Regression

The variation in WST can effectively demonstrate the impact of different scenarios with minimal interference factors. It is primarily influenced by solar radiation and can promptly respond to the effects in various situations. Referring to Table 10 and Table 11, the R2 values of the fitted curves for the PR in the four scenarios were 0.784, 0.984, 0.773, and 0.829, respectively. The R2 values for the NPR were 0.877, 0.937, 0.556, and 0.616, indicating a satisfactory fit of the regression models. Table 12 demonstrates the analysis of variance for the WST fitted regressions.
As shown in Figure 10, the fitted curves for PR in S1 and S2 were lower than NPR and showed better convergence in terms of R-squared values. The peak of the fitted curve for the WST in S1 occurred around 13:00, while in S2, it occurred around 14:00. Therefore, the passive exterior window in summer could effectively improve and cool down the WST, especially when the window was open for ventilation. In S3 and S4, the fitted curves were similar, but in S3, the PR fitted curve reached a higher temperature than NPR before the peak and decreased below NPR after the peak, while in S4, the PR was opposite to NPR in terms of the results before and after the peak. It can be observed that NPR heated up faster than PR after being exposed to solar radiation, but NPR cooled down faster than PR after the peak. Therefore, in winter, the passive exterior window attenuated some of the solar radiation to reduce the WST, but it also provided insulation to stabilize the WST.

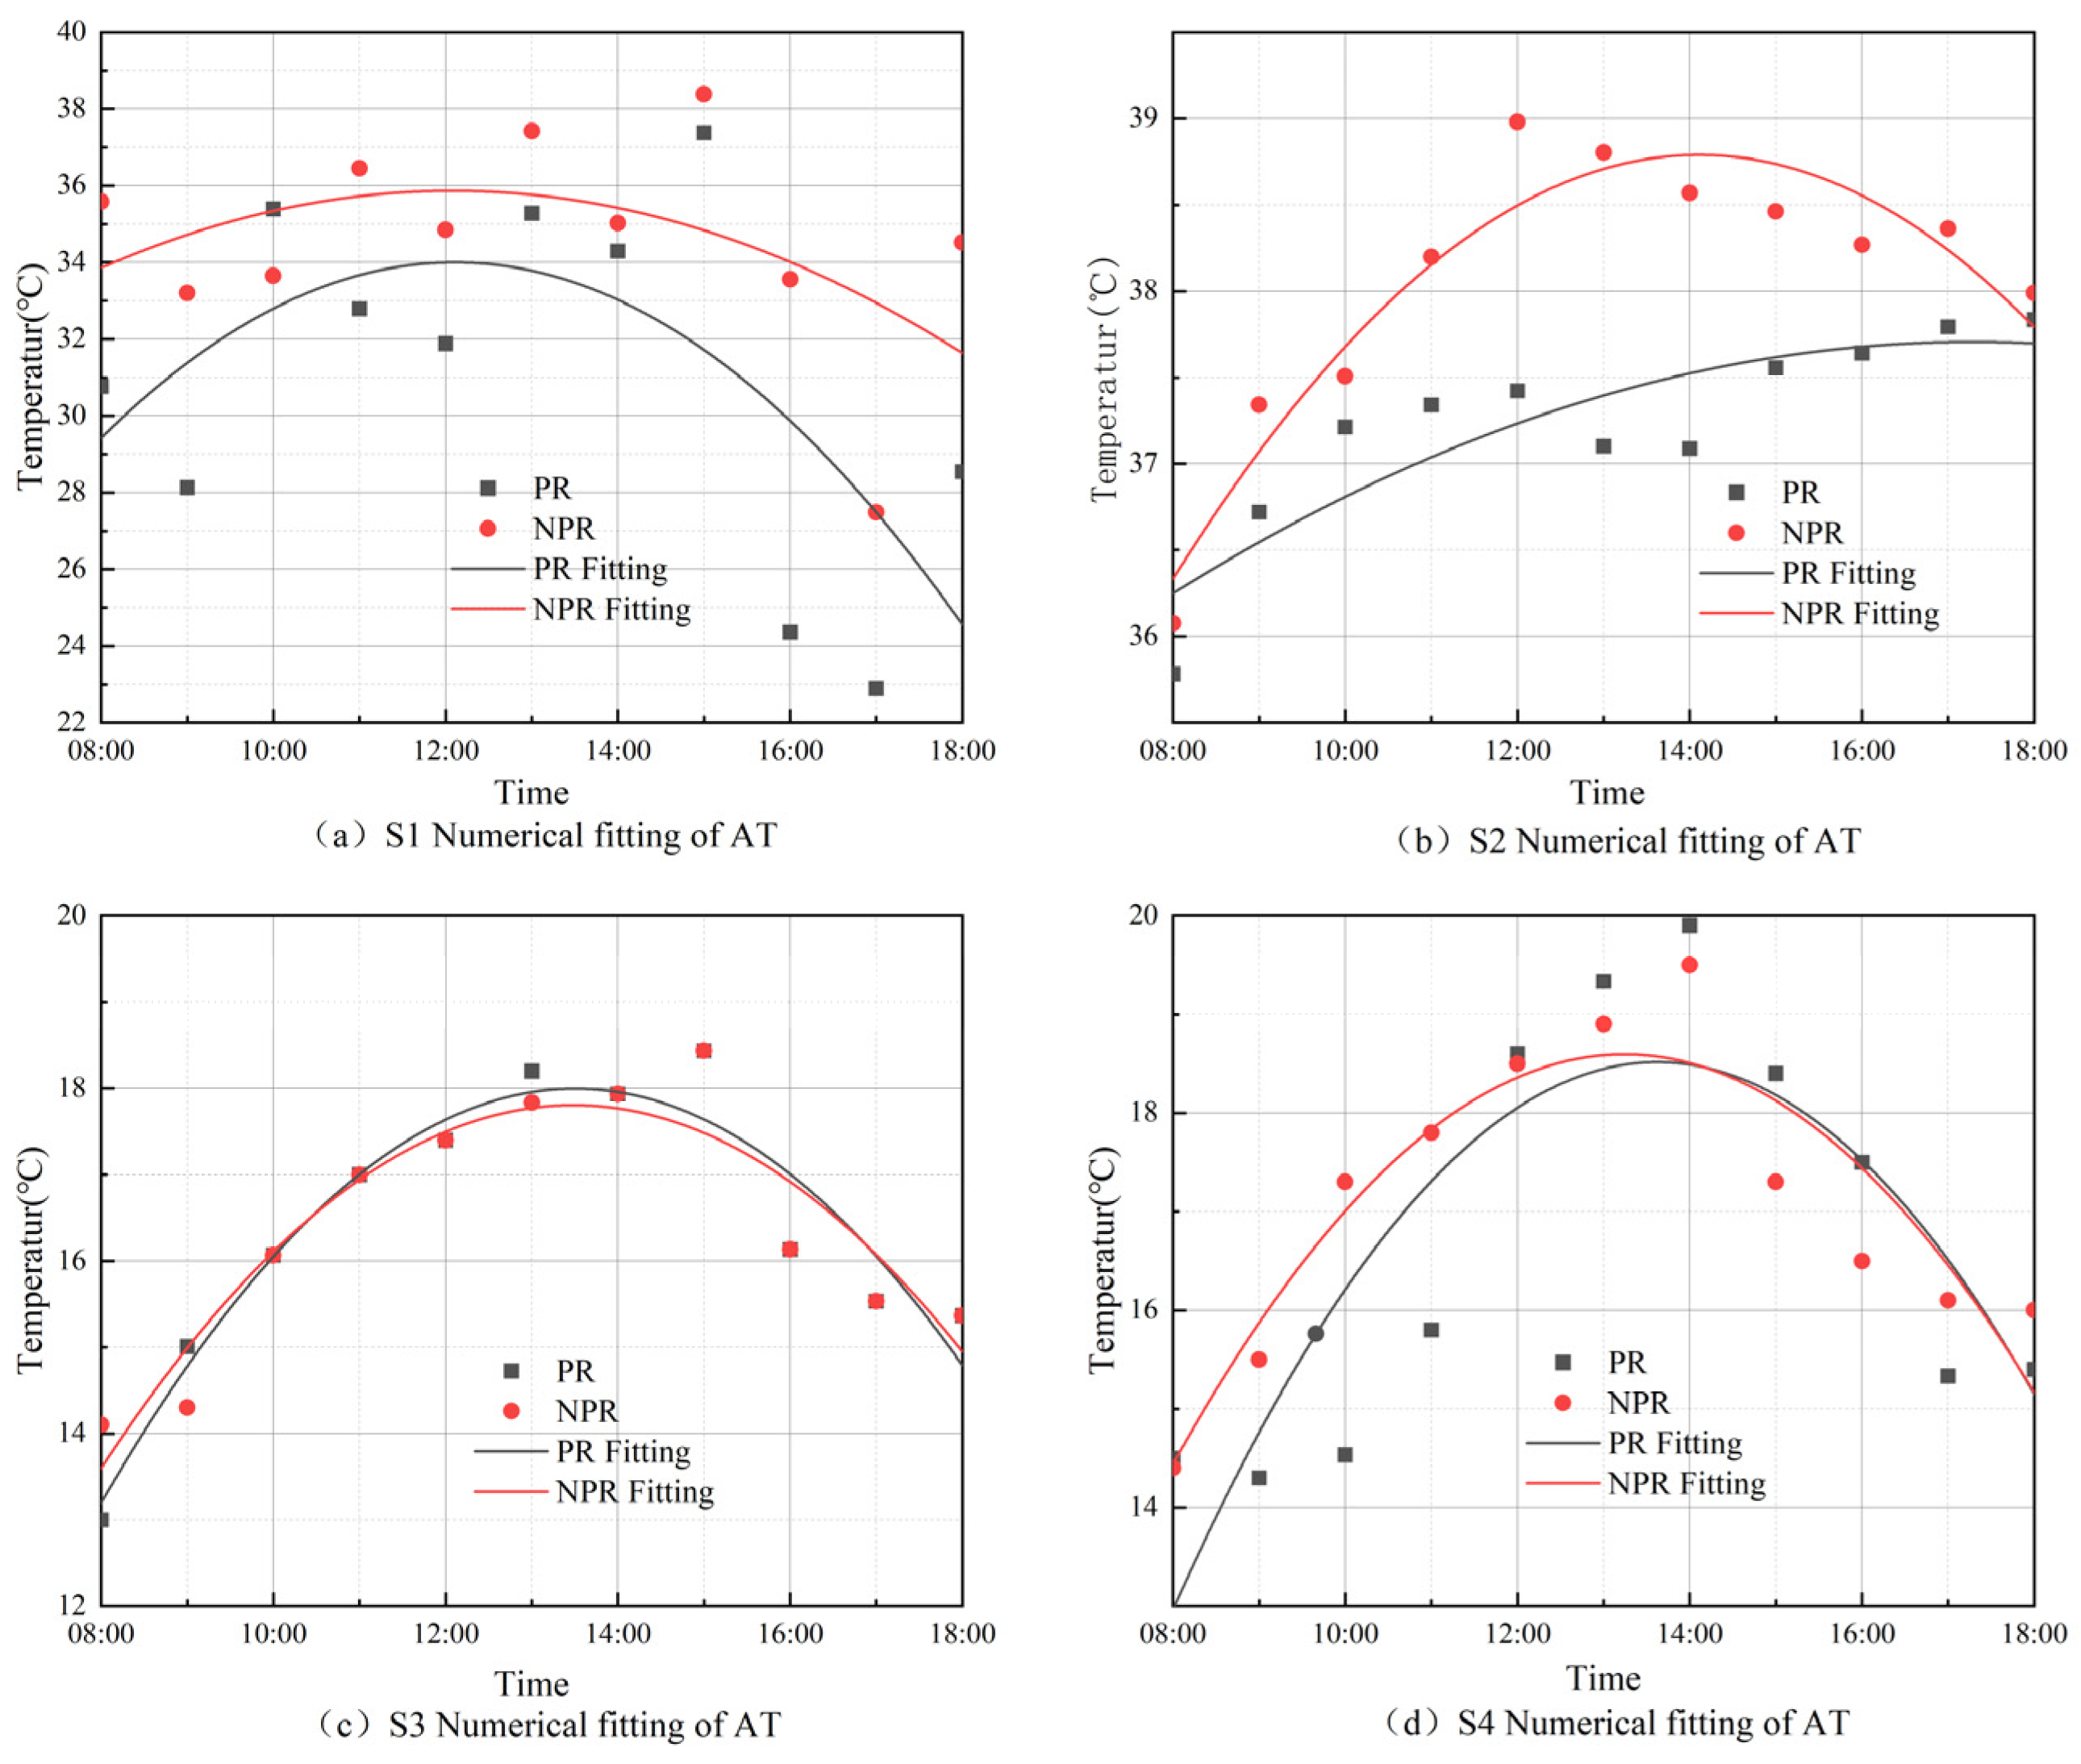
4.3.3. AT Non-Linear Fitting Regression

In Figure 8, it can be observed that the AT did not show a regular pattern of increase or decrease as seen in the IET and WST. Non-linear regression analysis was performed on the AT data near the window using the parabola-fitting function. Table 13 and Table 14 show that the R2 values for PR in the four scenarios were 0.763, 0.711, 0.913, and 0.719, respectively; and the goodness-of-fit values for the NPR were 0.617, 0.846, 0.868, and 0.844, respectively, indicating that this fitted regression had a high goodness of fit and a good effect, which was in line with the prediction decision of adopting the parabola-fitted function. Table 15 demonstrates the analysis of variance for the AT fitted regressions.
Figure 11 shows the linear relationship fit for different scenarios. In the summer scenarios of S1 and S2, when comparing the overall fitted curves, PR exhibited a better convergence compared to NPR. Specifically, in S1, PR showed the highest convergence, with overall values lower than the lowest level. In S2, PR demonstrated a relatively more divergent pattern. Based on the analysis of the difference in the AT fitted curves, the gap was greater in S1 (ventilated scenario) compared to S2 (non-ventilated scenario). This indicated that the passive exterior window had a positive effect on improving the indoor environment. In S3 (winter scenario), the PR and NP fitted curves remained consistent. As the solar radiation gradually increased, after a certain period of time, the AT temperature of PR was higher than NPR. In S4, the PR fitted curve was more convergent and was lower than NPR before the peak and slightly higher than NPR around one hour after the peak. It can be observed that the passive exterior window had an improving effect on the AT over a certain period of time in winter.

5. Discussion

5.1. Impact of Different Elements

In this study, a passive exterior window was specifically designed to suit the climate characteristics in the hot summer and cold winter zone of China. Extensive testing was conducted to analyze the window’s influence on the indoor environment, with a particular focus on calculating and evaluating the changes in the AT. Additionally, the relevant data underwent non-linear regression analysis, enabling a comprehensive exploration of the development trend for different temperatures. The study introduced an innovative window design methodology tailored to specific climatic conditions. Its primary objective was to leverage natural elements to optimize window functionality, enhance indoor comfort, and attain energy efficiency and environmental sustainability goals. While past studies have extensively analyzed the influence of windows on indoor environments and energy conservation, the effects of climatic conditions on windows and indoor settings exhibit regional variations, making them essential aspects that required thorough examination in our research.
First of all, among the many influences on the indoor environment of public buildings, temperature has a veto on the satisfaction with indoor environment [46]. In the experimental test data, the average value of the IET of PR decreased by 0.8 °C in summer and was higher by 0.1–1.8 °C in winter. The temperature level significantly influences people’s use of cooling and heating systems. Efficient windows should result in reduced heat gain in the interior during summer and minimized heat loss in the winter [47], and passive exterior windows are designed with this objective in mind. In summer, the external heat easily transfers to the interior through windows, resulting in increased indoor temperatures and higher demand for air conditioning. Conversely, in winter, the indoor heat is lost to the outside through the window surface, leading to a drop in indoor temperatures and an increased heating load. However, the passive exterior window, along with the building’s original windows, forms a cavity that acts as insulation during summer and provides thermal retention during winter.
Furthermore, the WST was influenced by solar radiation. In summer, the WST of the passive room was 0.2–0.6 °C lower than that of the NPR. During winter, when solar radiation was weaker, the passive external window provided shading to the internal window, resulting in a 0.1 °C lower WST in the PR compared to the NPR while also contributing to temperature stability. Windows allow solar radiation to enter buildings, which can lead to increased energy consumption in the summer and winter. When designing windows, it is crucial to focus on controlling the impact of direct sunlight to effectively reduce the overall energy consumption. The passive external window platform can be adjusted based on the solar altitude angle in different regions, making it geographically adaptable. Therefore, it has the potential to be extended for use in various types of buildings.
Human thermal comfort is directly influenced by the AT; when people feel warm or cool, it contributes to a comfortable and pleasant experience. Conversely, discomfort and fatigue can arise when the thermal conditions are not favorable, impacting human emotions and behavior. The passive exterior window, to some extent, has a positive effect on improving human thermal perception. The decrease in AT was more significant in the ventilated case during summer, showing a 3.5 °C reduction in the PR compared to the NPR. Windows have a direct and indirect influence on the AT through factors such as heat radiation, temperature transfer, ventilation conditions, and humidity regulation. The passive exterior window can provide effective shading, improve temperature transfer, and improve usability by removing heat from the room when the window is opened.

5.2. Comparison of Related Studies

Previous studies of a similar or related nature tended to be theoretical and simulation-based. In contrast, this study has regional adaptability; because the study focused on the hot summer and cold winter zone of China under specific conditions, the results were more targeted and regionally adaptable to the region’s passive exterior window energy-saving design and retrofitting to provide practical significance and reference. At the same time, taking into account the actual building environment through study of a standard office and the building of an experimental platform with an unreconstructed office for experimental testing, the results of the study were closer to the actual building environment, increasing the reliability of the study. This study not only considered the overall temperature of the indoor environment but also analyzed parameters such as the WST, calculated the AT, and evaluated it. These elements make the study more comprehensive and can allow a more detailed understanding of the performance of the passive exterior window.
This study may have differences with other similar studies. First of all, differences in the study population and thermal regions may have led to differences in the results of the study. Climatic conditions in different regions, external window constructions and profiles, building room types, and other reasons may have had an impact on the results. Secondly, due to the differences in experimental conditions, there may have been differences in the experimental conditions, design, equipment, and testing methods, leading to different results. Future studies will adopt more advanced techniques and methods for data collection and analysis. In this study, non-linear fitted regression analyses were conducted by considering the actual built environment and multiple indicator factors to provide more accurate and comprehensive findings.
Although this research study proposed a solution for windows based on climatic conditions, there were some limitations. The impact of windows on the indoor temperature directly influences energy consumption, with window and wall temperatures being influenced by factors such as materials and heat transfer coefficients [13,15,16]. Additionally, human comfort is subject to various factors, including age, metabolism, and subjective awareness [39,40]. This study primarily focused on temperature changes but lacked a comprehensive consideration of energy consumption, component parameters, and other factors influencing human comfort. In future research, it will be crucial to conduct a more comprehensive analysis of the impact of passive windows on buildings by taking other relevant factors into account.

6. Conclusions

Based on our results, we drew the following conclusions:
  • Regarding the IET, in summer, the PR exhibited a significantly lower temperature than the NPR, achieving a peak reduction of 1.2 °C and an average indoor temperature reduction of 0.8 °C. Additionally, the maximum indoor wind speed reached 2.8 m/s during the same period. In winter, the average indoor temperature in NPR was 0.1–1.8 °C higher than that in PR. However, the maximum temperature difference was 8.1 °C in NPR, whereas it was 6.8 °C in PR. It is evident that the passive exterior window could effectively suppress the increase of indoor temperature in summer by facilitating heat dissipation through the exterior window, resulting in a cooling effect. Moreover, it exhibited a stabilizing effect on the interior room temperature during winter;
  • Regarding the WST, in summer, the PR exhibited a maximum reduction of 0.6 °C in WST under ventilated conditions and a 0.2 °C reduction under unventilated conditions. Meanwhile, wall surface temperatures in the room also experienced partial reductions. During winter, the mean value of the WST in the NPR was slightly higher (by 0.1 °C) compared to the PR. The temperature difference between the WST of the PR was 7.7 °C, while it was 9.3 °C for the NPR. Additionally, other wall surface temperatures of the passive room were higher by 0.1–1.0 °C compared to those of the NPR. It is evident that the passive exterior window provided a certain level of thermal resistance to the WST and the interior wall surface temperature, effectively ensuring the stability of the interior temperature;
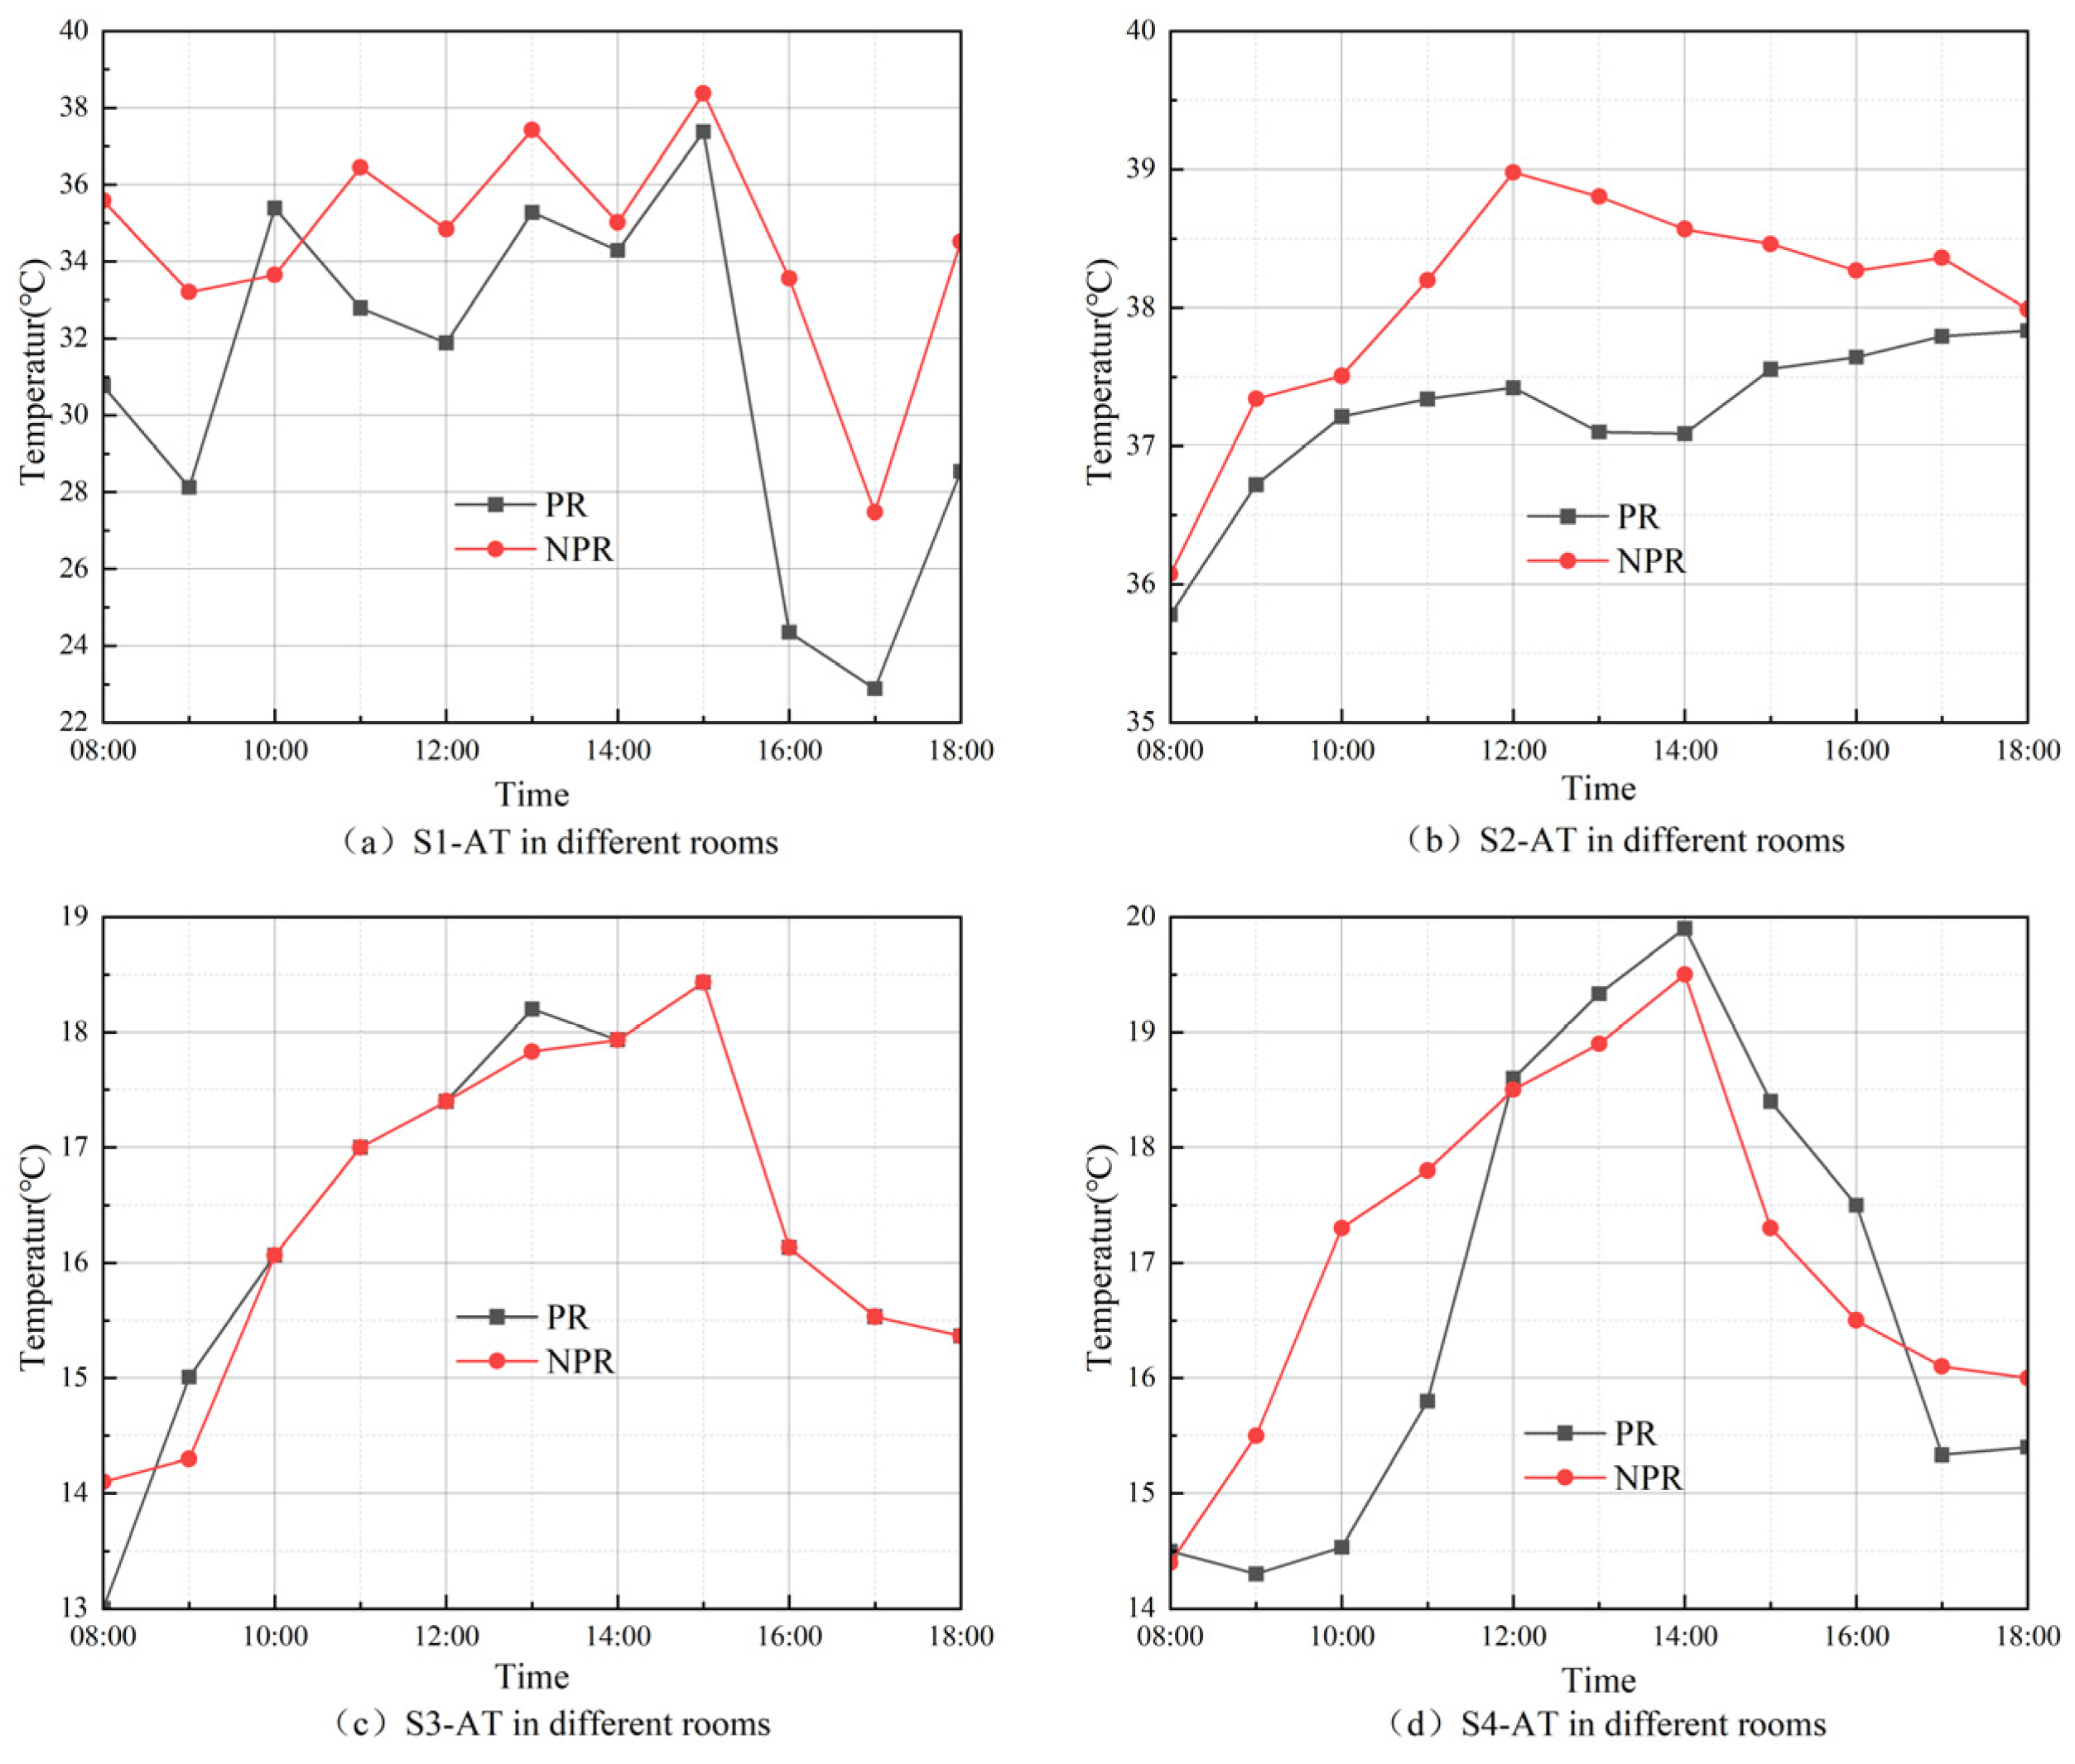
  • The results of the AT calculation and fitting revealed the following. During summer, the AT in the PR could be reduced by up to 3.5 °C when the window was opened for ventilation, with the human thermal perception primarily described as “slightly warm”. In the scenario in which the window remained closed, the AT could still be reduced by 0.9 °C, but the human heat sensation was described as “hot”. During winter, the AT in the PR was lower than in the NPR, but the time for human thermal perception to reach comfort was extended by 0.5 h. The analysis indicated that the impact of passive exterior windows on the AT was more pronounced in summer compared to winter. Nonetheless, in terms of stability, the AT of PR showcased a superior performance to that of NPR only in non-ventilated conditions during summer. However, the desired level of stability in the AT was not consistently achieved in other scenarios.
Testing the passive exterior window platforms and analyzing the AT data revealed a significant impact on the indoor thermal environment and changes in the AT during the summer. This suggested a potential reduction in cooling energy consumption. In winter, the window demonstrated a stabilizing effect on the indoor thermal environment, although it had a minimal impact on the AT. This indicated their potential for use in the hot summer and cold winter zone of China. The primary focus of this article was to analyze the impact of the passive exterior window on the IET and AT through the construction of a platform. However, it did not encompass a comprehensive investigation into building energy consumption. In light of the ongoing global energy crisis and China’s emphasis on ultra-low-energy buildings, future research should concentrate on studying the building energy consumption aspects of the passive exterior window. By conducting a more thorough analysis, this future research will provide valuable references and insights for building design and retrofitting, ultimately contributing to the realization of the Sustainable Development Goals.

Author Contributions

Conceptualization, H.Y., H.Z. and X.H.; methodology, H.Y., H.Z. and X.H.; software, H.Y. and X.H.; validation, H.Y., H.Z., X.H., N.G., Z.K. and J.Y.; data curation, H.Y., X.H., N.G., Z.K. and J.Y.; writing—original draft preparation, H.Y., H.Z. and X.H.; writing—review and editing, H.Y., H.Z. and X.H.; visualization, H.Y.; supervision, H.Z.; funding acquisition, H.Z. All authors have read and agreed to the published version of the manuscript.

Funding

This research was funded by the National Natural Science Foundation of China (grant number 51508169), the Hubei Provincial Central Leading Local Science and Technology Development Special Project (grant number: 2018ZYYD037), and the Local Cooperative Project of China Scholarship Council (grant number 202008420322).

Institutional Review Board Statement

Not applicable.

Informed Consent Statement

Not applicable.

Data Availability Statement

The data underlying this article are available in the article.

Acknowledgments

We are grateful to the Hubei University of Technology for providing the experimental platform for this study, which was also supported by the research project “Ultra-low energy consumption public building design and renovation in Hubei province of China”.

Conflicts of Interest

The authors declare no conflict of interest.

References

  1. Sebastian, C. Peter Reduction of CO2 to Chemicals and Fuels: A Solution to Global Warming and Energy Crisis. ACS Energy Lett. 2018, 3, 1557–1561. [Google Scholar] [CrossRef]
  2. Cdb, P. 2022 Global Status Report For Buildings And Construction. 2022. Available online: https://globalabc.org/our-work/tracking-progress-global-status-report (accessed on 1 June 2023).
  3. Xu, P.; Shen, Y.; Chen, L.; Mao, J.; Chang, E.; Ji, Y. Assessment of Energy-Saving Technologies Retrofitted to Existing Public Buildings in China. Energy Effic. 2016, 9, 67–94. [Google Scholar] [CrossRef]
  4. Li, D.; Li, L.; He, J. A Review of Renewable Energy Applications in Buildings in the Hot-Summer and Warm-Winter Region of China. Renew. Sustain. Energy Rev. 2016, 57, 327–336. [Google Scholar] [CrossRef]
  5. Zhao, X.; Gao, C.-P. Research on Energy-Saving Design Method of Green Building Based on BIM Technology. Sci. Program. 2022, 2022, 2108781. [Google Scholar] [CrossRef]
  6. Yuan, X.; Wang, X.; Zuo, J. Renewable Energy in Buildings in China—A Review. Renew. Sustain. Energy Rev. 2013, 24, 1–8. [Google Scholar] [CrossRef]
  7. Zhou, S.; Zhao, J. Optimum Combinations of Building Envelop Energy-Saving Technologies for Office Buildings in Different Climatic Regions of China. Energy Build. 2013, 57, 103–109. [Google Scholar] [CrossRef]
  8. Sakellaris, I.; Saraga, D.; Mandin, C.; Roda, C.; Fossati, S.; De Kluizenaar, Y.; Carrer, P.; Dimitroulopoulou, S.; Mihucz, V.; Szigeti, T.; et al. Perceived Indoor Environment and Occupants’ Comfort in European “Modern” Office Buildings: The OFFICAIR Study. Int. J. Environ. Res. Public Health 2016, 13, 444. [Google Scholar] [CrossRef]
  9. Banihashemi, S.; Golizadeh, H.; Reza Hosseini, M.; Shakouri, M. Climatic, Parametric and Non-Parametric Analysis of Energy Performance of Double-Glazed Windows in Different Climates. Int. J. Sustain. Built Environ. 2015, 4, 307–322. [Google Scholar] [CrossRef]
  10. He, G.; Shu, L.; Zhang, S. Double Skin Facades in the Hot Summer and Cold Winter Zone in China: Cavity Open or Closed? Build. Simul. 2011, 4, 283–291. [Google Scholar] [CrossRef]
  11. Wang, Y.; Chen, Y.; Zhou, J. Dynamic Modeling of the Ventilated Double Skin Façade in Hot Summer and Cold Winter Zone in China. Build. Environ. 2016, 106, 365–377. [Google Scholar] [CrossRef]
  12. Javad, K.; Navid, G. Thermal Comfort Investigation of Stratified Indoor Environment in Displacement Ventilation: Climate-Adaptive Building with Smart Windows. Sustain. Cities Soc. 2019, 46, 101354. [Google Scholar] [CrossRef]
  13. Bülow-Hübe, H. Energy Efficient Window Systems. Effects on Energy Use and Daylight in Buildings. 2001. Available online: https://www.ebd.lth.se/fileadmin/energi_byggnadsdesign/images/Publikationer/Rapport_TABK-01-1022_Helena.pdf (accessed on 1 June 2023).
  14. Haglund, K.L. Decision-Making Methodology & Selection Tools for High-Performance Window Systems in U.S. Climates. In Proceedings of the 2nd Building Enclosure Science & Technology Conference, Portland, OR, USA, 12–14 April 2010. [Google Scholar]
  15. Sun, C.; Giles, H.; Lian, Z. The Dynamic Impact of Window Characteristics on Shading Factor and Energy Consumption. Sol. Energy 2014, 102, 1–13. [Google Scholar] [CrossRef]
  16. Lee, J.W.; Jung, H.J.; Park, J.Y.; Lee, J.B.; Yoon, Y. Optimization of Building Window System in Asian Regions by Analyzing Solar Heat Gain and Daylighting Elements. Renew. Energy 2013, 50, 522–531. [Google Scholar] [CrossRef]
  17. Elghamry, R.; Hassan, H. Impact of Window Parameters on the Building Envelope on the Thermal Comfort, Energy Consumption and Cost and Environment. Int. J. Vent. 2020, 19, 233–259. [Google Scholar] [CrossRef]
  18. Kahsay, M.T.; Bitsuamlak, G.T.; Tariku, F. Thermal Zoning and Window Optimization Framework for High-Rise Buildings. Appl. Energy 2021, 292, 116894. [Google Scholar] [CrossRef]
  19. He, Q.; Ng, S.T.; Hossain, M.U.; Skitmore, M. Skitmore Energy-Efficient Window Retrofit for High-Rise Residential Buildings in Different Climatic Zones of China. Sustainability 2019, 11, 6473. [Google Scholar] [CrossRef]
  20. Peng, C.; Wang, L.; Zhang, X. DeST-Based Dynamic Simulation and Energy Efficiency Retrofit Analysis of Commercial Buildings in the Hot Summer/Cold Winter Zone of China: A Case in Nanjing. Energy Build. 2014, 78, 123–131. [Google Scholar] [CrossRef]
  21. Huang, J.; Lv, H.; Gao, T.; Feng, W.; Chen, Y.; Zhou, T. Thermal Properties Optimization of Envelope in Energy-Saving Renovation of Existing Public Buildings. Energy Build. 2014, 75, 504–510. [Google Scholar] [CrossRef]
  22. Sadineni, S.B.; Madala, S.; Boehm, R.F. Passive Building Energy Savings: A Review of Building Envelope Components. Renew. Sustain. Energy Rev. 2011, 15, 3617–3631. [Google Scholar] [CrossRef]
  23. Wang, S.; Liu, Y.; Cao, Q.; Li, H.; Yu, Y.; Yang, L. Applicability of Passive Design Strategies in China Promoted under Global Warming in Past Half Century. Build. Environ. 2021, 195, 107777. [Google Scholar] [CrossRef]
  24. Chen, Y.; Yang, J.; Berardi, U.; Cui, G.; Li, R.; Li, N. Assessments of Multiple Operation Strategies in a Passive Office Building in Cold Region of China. Energy Build. 2022, 254, 111561. [Google Scholar] [CrossRef]
  25. Gou, S.; Nik, V.M.; Scartezzini, J.-L.; Zhao, Q.; Li, Z. Passive Design Optimization of Newly-Built Residential Buildings in Shanghai for Improving Indoor Thermal Comfort While Reducing Building Energy Demand. Energy Build. 2018, 169, 484–506. [Google Scholar] [CrossRef]
  26. Gong, X.; Akashi, Y.; Sumiyoshi, D. Optimization of Passive Design Measures for Residential Buildings in Different Chinese Areas. Build. Environ. 2012, 58, 46–57. [Google Scholar] [CrossRef]
  27. Lin, K.; Chao, L.; Lee, H.H.; Xin, R.; Liu, S.; Ho, T.C.; Huang, B.; Yu, K.M.; Tso, C.Y. Potential Building Energy Savings by Passive Strategies Combining Daytime Radiative Coolers and Thermochromic Smart Windows. Case Stud. Therm. Eng. 2021, 28, 101517. [Google Scholar] [CrossRef]
  28. Wang, S.; Jiang, T.; Meng, Y.; Yang, R.; Tan, G.; Long, Y. Scalable Thermochromic Smart Windows with Passive Radiative Cooling Regulation. Science 2021, 374, 1501–1504. [Google Scholar] [CrossRef]
  29. Ko, W.H.; Schiavon, S.; Zhang, H.; Graham, L.T.; Brager, G.; Mauss, I.; Lin, Y.-W. The Impact of a View from a Window on Thermal Comfort, Emotion, and Cognitive Performance. Build. Environ. 2020, 175, 106779. [Google Scholar] [CrossRef]
  30. Yeom, S.; Kim, H.; Hong, T.; Park, H.S.; Lee, D.-E. An Integrated Psychological Score for Occupants Based on Their Perception and Emotional Response According to the Windows’ Outdoor View Size. Build. Environ. 2020, 180, 107019. [Google Scholar] [CrossRef]
  31. Wang, L.; Greenberg, S. Window Operation and Impacts on Building Energy Consumption. Energy Build. 2015, 92, 313–321. [Google Scholar] [CrossRef]
  32. Han, M.; May, R.; Zhang, X.; Wang, X.; Pan, S.; Da, Y.; Jin, Y. A Novel Reinforcement Learning Method for Improving Occupant Comfort via Window Opening and Closing. Sustain. Cities Soc. 2020, 61, 102247. [Google Scholar] [CrossRef]
  33. Porritt, S.M.; Cropper, P.C.; Shao, L.; Goodier, C.I. Ranking of Interventions to Reduce Dwelling Overheating during Heat Waves. Energy Build. 2012, 55, 16–27. [Google Scholar] [CrossRef]
  34. Lei, Z.; Liu, C.; Wang, L.; Li, N. Effect of Natural Ventilation on Indoor Air Quality and Thermal Comfort in Dormitory during Winter. Build. Environ. 2017, 125, 240–247. [Google Scholar] [CrossRef]
  35. Wu, J. Thermal Comfort and Occupant Behaviour in Office Buildings in South-East China. Ph.D. Thesis, University of Nottingham, Nottingham, UK, 2015. Available online: https://eprints.nottingham.ac.uk/id/eprint/29435 (accessed on 1 June 2023).
  36. Yao, M.; Zhao, B. Window Opening Behavior of Occupants in Residential Buildings in Beijing. Build. Environ. 2017, 124, 441–449. [Google Scholar] [CrossRef]
  37. Zhang, X.; Ning, Q.; Chen, Z. Multi-Objective Optimization Design of Energy Efficiency for Office Building Window Systems Based on Indoor Thermal Comfort. Sci. Technol. Built Environ. 2023, 29, 1–14. [Google Scholar] [CrossRef]
  38. Abdullah, H.K.; Alibaba, H.Z. Window Design of Naturally Ventilated Offices in the Mediterranean Climate in Terms of CO2 and Thermal Comfort Performance. Sustainability 2020, 12, 473. [Google Scholar] [CrossRef]
  39. Cheung, T.; Schiavon, S.; Parkinson, T.; Li, P.; Brager, G. Analysis of the Accuracy on PMV—PPD Model Using the ASHRAE Global Thermal Comfort Database II. Build. Environ. 2019, 153, 205–217. [Google Scholar] [CrossRef]
  40. Omidvar, A.; Kim, J. Modification of Sweat Evaporative Heat Loss in the PMV/PPD Model to Improve Thermal Comfort Prediction in Warm Climates. Build. Environ. 2020, 176, 106868. [Google Scholar] [CrossRef]
  41. Steadman, R.G. A Universal Scale of Apparent Temperature. J. Appl. Meteorol. Climatol. 1984, 23, 1674–1687. [Google Scholar] [CrossRef]
  42. Zhang, H. Breathing Purification Energy-Saving Window. CN205591771U, 21 September 2016. [Google Scholar]
  43. Miao, Y.; Ding, Y. Indoor Environmental Quality in Existing Public Buildings in China: Measurement Results and Retrofitting Priorities. Build. Environ. 2020, 185, 107216. [Google Scholar] [CrossRef]
  44. Chen, W.-J.; Qiu, J.; Yang, J. Apparent Temperature Modeling Based on Improved GEP Algorithm. Control Eng. China 2018, 25, 136–142. [Google Scholar] [CrossRef]
  45. Matzarakis, A.; Mayer, H.; Iziomon, M.G. Applications of a Universal Thermal Index: Physiological Equivalent Temperature. Int. J. Biometeorol. 1999, 43, 76–84. [Google Scholar] [CrossRef] [PubMed]
  46. Zhang, C.; Wang, J.; Xu, X.; Zou, F.; Yu, J. Modeling and Thermal Performance Evaluation of a Switchable Triple Glazing Exhaust Air Window. Appl. Therm. Eng. 2016, 92, 8–17. [Google Scholar] [CrossRef]
  47. Hassouneh, K.; Alshboul, A.; Al-Salaymeh, A. Influence of Windows on the Energy Balance of Apartment Buildings in Amman. Energy Convers. Manag. 2010, 51, 1583–1591. [Google Scholar] [CrossRef]
Figure 1. Illustration of a passive exterior window.
Sustainability 15 13210 g001
Figure 2. Passive exterior window operation mode in different seasons.
Sustainability 15 13210 g002
Figure 3. Passive exterior window experimental platform (Red box is PR and blue box is NPR).
Sustainability 15 13210 g003
Figure 4. Location of different measurement points in the rooms.
Sustainability 15 13210 g004
Figure 5. Changes in outdoor temperature, RH, and solar radiation.
Sustainability 15 13210 g005
Figure 6. Different room data changes for S1 and S2.
Sustainability 15 13210 g006
Figure 7. Different room data changes for S3 and S4.
Sustainability 15 13210 g007
Figure 8. Graphs of AT in different scenarios.
Sustainability 15 13210 g008
Figure 9. Numerical fitting analysis of the IET for different scenarios.
Sustainability 15 13210 g009
Figure 10. Numerical fitting analysis of the WST for different scenarios.
Sustainability 15 13210 g010
Figure 11. Numerical fitting analysis of the AT for different scenarios.
Sustainability 15 13210 g011
Table 1. Description of measurement points.
Point NumberRoomsLocationTest ContentEquipmentRangeAccuracyTime/min
N1PR1.5 m from the external window at a height of 1.0 mAir temperature
Relative humidity
Wind speed
DT-8892 temperature and humidity testerT: −30.0~100 °C
RH: 0~100%
±0.1 °C
±3%
15
N2NPR
M1PR3 m from the external window at a height of 1.0 m
M2NPR
F1PR4.5 m from the external window at a height of 1.0 mTES-1340 handheld anemometerW: 0~30.0 m/s±3%
F2NPR
P1PRCavity
R1PRWall, ceiling, and window centerSurface center temperatureFour-wire pt100 temperature sensorT: −50.0~100 °C±0.1 °C15
L1
C1
W1
W3
R2NPR
L2
C2
W2
Table 2. Indoor thermal environment data for different scenarios in summer.
ScenarioIET (°C)WST (°C)RH (%)IWS (m/s)
AvgMaxMinAvgMaxMinAvgMaxAvgMax
S1PR33.935.932.134.336.431.960.366.90.72.8
NPR34.736.832.834.937.432.657.963.30.31.4
S2PR34.535.633.236.037.333.257.661.7--
NPR35.336.833.736.238.133.054.559.3--
Table 3. Indoor thermal environment data for different scenarios in winter.
ScenarioIET (°C)WST (°C)RH (%)
AvgMaxMinAvgMaxMinAvgMax
S3PR16.318.712.818.021.513.841.752.2
NPR18.120.912.818.122.513.646.056.1
S4PR17.021.114.317.120.613.639.244.5
NPR17.221.514.117.222.313.047.551.5
Table 4. Indoor wall temperature in winter.
ScenarioLeft Wall (°C)Right Wall (°C)Ceiling (°C)
S3PR17.917.817.7
NPR17.817.717.6
S4PR15.415.713.8
NPR14.714.713.6
Table 5. AT in different scenarios.
ScenarioPRNPR
Avg (°C)Max (°C)Min (°C)Avg (°C)Max (°C)Min (°C)
S131.137.422.934.638.427.5
S237.337.935.838.139.036.1
S316.418.713.016.518.714.1
S416.719.914.317.219.514.4
Table 6. AT classification.
AT (°C)Thermal Perception
<4Very cold
4~8Cold
8~13Cool
13~18Slightly cool
18~23Comfortable
23~29Slightly warm
29~35Warm
35~41Hot
>41Very hot
Table 7. Results of numerical fitting of the IET for PR.
ProjectS1S2S3S4
A13.930 ± 3.05729.794 ± 1.814−13.961 ± 3.371−17.267 ± 9.313
B75.033 ± 11.74514.778 ± 6.972111.098 ± 12.952126.155 ± 35.785
C−66.260 ± 10.779−9.533 ± 6.400−96.269 ± 11.886−109.583 ± 32.844
RRS0.3010.1060.3652.790
R20.8480.8260.9180.651
Table 8. Results of numerical fitting of the IET for NPR.
ProjectS1S2S3S4
A20.611 ± 3.98922.577 ± 1.599−23.879 ± 3.374−11.928 ± 6.783
B56.269 ± 15.32747.534 ± 6.144156.633 ± 12.966112.749 ± 26.066
C−52.565 ± 14.067−40.011 ± 5.639−137.958 ± 11.900−102.646 ± 23.924
RRS0.5120.0820.3661.480
R20.6390.9190.9530.701
Table 9. IET variance analysis for different scenarios and rooms.
ScenarioSources of VariancePRNPR
SSMSFSSMSF
S1Regression13.3726.68622.2497.2333.6167.066
Residual2.4043.001-4.0940.512-
S2Regression4.0182.00918.9737.4913.74645.556
Residual0.8470.105-0.6580.082-
S3Regression32.81616.40844.89759.05929.52980.638
Residual2.9240.365-2.9300.366-
S4Regression41.62620.8127.46127.70613.8539.359
Residual22.3172.790-11.8411.480-
Table 10. Results of numerical fitting of the WST for PR.
ProjectS1S2S3S4
A12.521 ± 4.14216.965 ± 1.200−22.278 ± 8.471−23.004 ± 6.384
B85.280 ± 15.71866.778 ± 4.611160.691 ± 32.551152.392 ± 24.530
C−78.679 ± 14.610−55.317 ± 4.232−152.056 ± 29.875−137.891 ± 22.513
RRS0.5520.0272.3081.310
R20.7840.9840.7730.829
Table 11. Results of numerical fitting of the WST for NPR.
ProjectS1S2S3S4
A7.831 ± 3.63011.757 ± 3.137−18.261 ± 11.570−20.873 ± 11.302
B105.323 ± 13.94885.338 ± 12.052136.945 ± 44.455150.487 ± 43.429
C−96.537 ± 12.801−70.355 ± 11.062−121.779 ± 40.801−141.247 ± 39.859
RRS0.4240.2004.3054.108
R20.8770.9370.5560.616
Table 12. WST variance analysis for different scenarios and rooms.
ScenarioSources of VariancePRNPR
SSMSFSSMSF
S1Regression16.0108.00514.50224.20612.10328.557
Residual4.4160.552-3.3910.424-
S2Regression16.8778.438182.19228.68514.34245.322
Residual0.3710.046-2.5320.316-
S3Regression62.90431.45213.62743.16121.5815.013
Residual18.4652.308-34.4414.305-
S4Regression50.90325.45119.41752.81826.4096.428
Residual10.4861.312-32.8694.109-
Table 13. Results of numerical fitting of the AT for PR.
ProjectS1S2S3S4
A−5.851 ± 22.28732.655 ± 1.814−10.914 ± 2.928−14.089 ± 6.895
B158.026 ± 85.63514.027 ± 6.969102.773 ± 11.251114.892 ± 26.493
C−156.657 ± 78.595−9.738 ± 6.396−91.336 ± 10.326−101.214 ± 24.316
RRS0.9070.1310.2861.546
R20.7630.71109130.719
Table 14. Results of numerical fitting of the AT for NPR.
ProjectS1S2S3S4
A18.255 ± 15.73125.678 ± 1.618−7.647 ± 3.277−7.927 ± 3.804
B69.979 ± 60.44444.608 ± 6.21590.613 ± 12.59196.145 ± 14.617
C−69.518 ± 55.475−37.944 ± 5.704−80.649 ± 11.557−87.138 ± 13.416
RRS1.0200.1460.3500.465
R20.6170.8460.8680.844
Table 15. AT variance analysis for different scenarios and rooms.
ScenarioSources of VariancePRNPR
SSMSFSSMSF
S1Regression89.54744.7742.80317.9288.9641.126
Residual127.79915.975-63.6697.959-
S2Regression2.5551.27712.0746.0663.03236.040
Residual0.8460.106-0.6730.084-
S3Regression24.36912.18444.18718.8309.41527.259
Residual2.2060.276-2.7630.345-
S4Regression31.74315.87110.38020.21810.10921.719
Residual12.2321.529-3.7240.465-
Disclaimer/Publisher’s Note: The statements, opinions and data contained in all publications are solely those of the individual author(s) and contributor(s) and not of MDPI and/or the editor(s). MDPI and/or the editor(s) disclaim responsibility for any injury to people or property resulting from any ideas, methods, instructions or products referred to in the content.

