Article

Global Value Chains Embedding and Carbon Productivity of China’s Manufacturing Industry: Direct Influence, Adjustment Effect, and Heterogeneity Analysis

1
School of Economics & Management, Huzhou University, Huzhou 313000, China
2
Economic and Social Development Research Institute, Dongbei University of Finance and Economics, Dalian 116025, China
3
School of Statistics, Dongbei University of Finance and Economics, Dalian 116025, China
4
School of Business Administration, Dongbei University of Finance and Economics, Dalian 116025, China
*
Author to whom correspondence should be addressed.
These authors contributed equally to this work.
Sustainability 2023, 15(17), 13272; https://doi.org/10.3390/su151713272
Submission received: 21 July 2023 / Revised: 23 August 2023 / Accepted: 31 August 2023 / Published: 4 September 2023

Abstract

:
In the context of the deepening division of labour in global value chains (GVC) and the goal of “double carbon”, it is important to promote China’s manufacturing industry to break away from the unfavourable situation of “big but not strong” so as to achieve low-carbon transformation and value chain upgrading. Based on the panel data of China’s manufacturing industry from 2006 to 2018, this paper adopts a threshold regression model to analyse the marginal impact of GVC embedding position on carbon productivity. It also comprehensively explores the moderating effects of R&D investment, environmental regulation, industrial structure upgrading, and industrial digitisation on the impact of GVC embedding on carbon productivity in three aspects: forward GVC participation, backward GVC participation, and GVC embedding position. The research shows that forward and backward GVC participation have negative direct effects on carbon productivity in China’s manufacturing sector, but the results of the heterogeneity analysis show that both forward and backward GVC participation are positively associated with carbon productivity in low- and medium-technology manufacturing industries. Improving the GVC embedding position will promote the improvement of carbon productivity, and the promotion effect will be increased and then decreased. Both R&D investment and industrial structure upgrading have strengthened the impact of GVC embedding. Environmental regulation weakens the inhibitory effect of backward GVC participation on carbon productivity, while industry digitisation has a negative moderating effect. Further heterogeneity analysis found that forward simple GVC participation was positively related to carbon productivity. The findings of this paper provide a theoretical and practical foundation for analysing the impact mechanism of GVC embeddedness on carbon productivity in China’s manufacturing industries. It is conducive to promoting China’s manufacturing industries to realise low-carbon transformation and climb up to the high end of the GVC, and it provides certain policy insights for the realization of the goals of “carbon peaking” and “carbon neutrality”.

1. Introduction

Since 2004, the manufacturing sector, the driving force of China’s economic development, has maintained a long-term contribution rate of over 26% to GDP [1] and has always been at the heart of China’s economic development. As economic trade between countries becomes more frequent, China has relied on its lower factor cost to actively participate in GVC activities and has rapidly developed into a major manufacturing country by its two-headed production model. However, in the GVC division of labour system dominated by developed countries, most of China’s manufacturing industries are engaged in highly polluting, low value-added processing. This trade pattern has let China become a “refuge” for the pollution-intensive industries of developed countries. In 2019, China’s total carbon emissions were 10.2 billion tonnes, of which the manufacturing industry’s CO2 emissions accounted for about 35.80% of society’s total emissions [2]. The manufacturing industry has become the second largest carbon emission sector after the electricity and heat supply sectors. In 2020, the Chinese government set a clear target of “carbon peaking” and “carbon neutrality” (hereinafter referred to as the “double carbon” target). The 20th Party Congress report reiterates that “achieving carbon neutrality involves a comprehensive and fundamental economic and social structural transformation. Based on China’s energy resource endowment, we will adhere to the principle of first establishing and then breaking, and implement carbon peaking actions in a systematic and step-by-step manner”. “We should collaborate to promote carbon reduction, pollution reduction, green expansion, and growth, and create conditions to accelerate the shift from a ‘double control’ system of energy consumption to a ‘double control’ system of carbon emissions”. This has put forward higher requirements for the low-carbon transformation of the manufacturing industry. The industrial chain and value chain will be upgraded comprehensively. The production model of China’s manufacturing industry participating in the GVC division of labour will be reshaped. Enhancing carbon productivity is a key strategy for achieving a win–win scenario for low carbon emission reduction and economic growth [3]. Carbon productivity refers to the level of GDP produced per unit of CO2. In this regard, a positive relationship between GVC embedding and carbon productivity will be conducive to the low-carbon transformation of China’s manufacturing industry.
Existing research in the literature on GVC has focused on structural measures of GVC embedding [4,5,6,7], productivity effects [8], and technological innovation effects [9]. With regard to carbon productivity, scholars have analysed the impact of factors such as consumption structure [10], technological progress [11], environmental regulation [12], energy efficiency, and industry structure [13] on carbon productivity. As the GVC division of labour continues to deepen and low-carbon emission reduction continues to advance, more and more scholars have explored the intrinsic links between GVC and carbon emissions.
Among the studies about the direct impact of GVC on carbon emissions, Li et al. [14] found that raising GVC participation can reduce carbon emissions. They discovered that GVC embedded status has an inverted U-shape relationship with the intensity of carbon emissions by including the squared term of GVC embedding position. However, when the GVC embedding position is low, the inhibitory effect of GVC participation on carbon emissions is constrained. In recent years, China’s manufacturing GVC participation has deepened, but the embedded position has been low, and it is still at the downstream stage with low added value [15]. When the division of labour status is low, there may be environmental risks of GVC embedding, resulting in a negative relationship between GVC participation and carbon productivity. The environmental risks faced by GVC embedding are inversely proportional to the level of technology in the industry [16]. However, Cai et al. [17] further divided GVC participation into forward and backward GVC participation. The study found that forward GVC participation has a U-shaped relationship with carbon emissions, while backward GVC participation significantly increases the intensity of carbon emissions. Therefore, the effect of GVC participation and GVC embedding location on the direct impact of carbon productivity is still controversial and requires further analysis.
Among the studies about the mechanism of GVC embedding on carbon emissions, Xie et al. [18] found that the degree of GVC embedding positively contributes to carbon productivity through R&D investment, low-end lock-in, and environmental regulation. On this basis, Sun and Du [19] innovatively introduced an interaction term for the structural upgrading effect. The study found that both the degree of GVC embeddedness and position can have an impact on carbon productivity through industrial structural upgrading. These articles have two drawbacks. First, the correlation analysis is only based on a single dimension of GVC participation or GVC embedding position, and they fail to comprehensively explore the differential impacts on carbon productivity under the same mechanism of action. Second, neither paper made the digital economy a key component of the framework for analysis. In recent years, the digital economy has flourished and has become an accelerator of China’s high-quality economic growth. According to the China Digital Economy Development Report, the scale of the country’s digital economy reached RMB 45.50 trillion in 2021, accounting for 39.80% of GDP. Industrial digitisation’s contribution to the digital economy reached 81.80%, accounting for 32.50% of GDP. The digital economy not only facilitates the upgrading of the GVC division of labour but also mitigates the contribution of GVC participation to the implied carbon emissions of trade [20]. The digital economy is also conducive to enhancing the technological progress effect and industrial upgrading effect of GVC embedding [21,22]. Therefore, it is necessary to include the digital economy in the analytical framework to explore the impact of the embedding of GVC on carbon productivity.
The analysis of the heterogeneity of GVC embeddedness on carbon emissions focuses on the following three aspects. First, the effect of GVC on carbon emissions varies across regions with different levels of economic development. Bai et al. [23] divided the sample into two groups of developed and developing economies based on the per capita income level of each region. It is found that GVC embedding has a positive but insignificant impact on the carbon intensity of industries in developed economies, but it has a considerable negative impact on industries in developing economies. Second, the effect of GVC embeddedness on carbon emissions is different in industries with different factor intensities. Li et al. [24] classified the manufacturing industries of the countries along the Belt and Road into labour-intensive, capital-intensive, and technology-intensive industries according to factor intensity. According to the study, GVC embedding is more conducive to enhancing the carbon emission efficiency of technology-intensive industries, whereas it significantly reduces the efficiency of carbon emissions in labour- and capital-intensive industries. Third, different GVC embedding methods have different effects on carbon emissions. Shi et al. [25] analysed the impact of GVC participation on the carbon emission intensity of countries along the Belt and Road based on a multi-regional input–output model. The study found that forward GVC participation could effectively reduce carbon emission intensity, while backward GVC participation was negatively related to carbon emission intensity. The impact of forward and backward GVC participation on the carbon emission intensity of developing countries was greater than that of developed countries. However, with the deepening division of labour in GVC, GVC can be further classified into simple and complex GVC based on how frequently it crosses international boundaries. The GVC division of labour is accompanied by rich flows of factors such as capital, technology, resources, and management experience. Theoretically, the more the GVC crosses borders, i.e., the deeper the involvement of complex GVC, the richer the factor resources that enterprises obtain from them, and the more conducive they are in reducing the intensity of carbon emissions. But deeper GVC embedding is also likely to lead to an increase in implied carbon from export trade [26]. Does this mean that more GVC across national borders will exacerbate the rise in carbon intensity? To this end, it is necessary to explore the effects of simple and complex GVC on carbon emissions. However, there is very little literature exploring the heterogeneous effects of GVC activity complexity on carbon productivity. Therefore, this field of study urgently needs to be expanded.
In summary, existing research in the literature on GVC embedding and carbon productivity has produced a wealth of findings; however, the following gaps still exist. Firstly, existing studies tend to examine the non-linear relationship between GVC embedding and carbon productivity using the introduction of a quadratic term [17,18,19]. When the quadratic term coefficients are statistically significant, the studies claim that there is an (inverted) U-shaped relationship between the variables. In specific studies, the economic meaning and range of values of the variables must be considered. Once the range of values of the variables is taken into account, together with the location of the turning point of the quadratic curve, it becomes clear that within the sample interval, the relationship between the variables may simply be the left or right half branch of the (inverted) U-shaped curve [21]. In other words, the relationship between the variables is still monotonic, and only the marginal impact is changing (increasing or decreasing). Secondly, existing studies struggle to fully reflect the mechanism of GVC embedding on carbon productivity [18,19]. On the one hand, the majority of the currently available literature only examines the mechanism of GVC’s impact on carbon productivity based on a single aspect of GVC participation or GVC embedding position. On the other hand, barely any research has concentrated on the moderating effect of industry digitisation on GVC’s impact on carbon productivity. Third, most of the studies only examined the effects of different GVC embedding methods (forward versus backward embedding) [17,21,25] and the impact of GVC on carbon productivity in regions with different levels of economic development [23,24]. They did not take into account the diversity of the effects of various GVC activities’ complexity on carbon productivity.
Based on the above analysis, the contributions are as follows: First, setting up a threshold regression model to investigate the variations in the marginal impact of GVC embedding position on carbon productivity in manufacturing in more detail and rigorously, as well as improve the “pseudo-(inverted) U-shaped” results that may result from the introduction of only quadratic terms. Second, a thorough examination of the moderating impact of GVC embedding on carbon productivity in three dimensions: forward GVC participation, backward GVC participation, and GVC embedding position. Third, the innovative inclusion of industry digitisation in the analytical framework explores the impact of GVC embedding on carbon productivity in the context of the digital economy. Fourth, the GVC participation is divided into forward and backward GVC participation according to the different embedding methods, simple GVC and complex GVC according to the degree of complexity, and the manufacturing industry is divided into the high-technology industry and low- and medium-technology industries according to the different technology levels to develop a three-dimensional heterogeneity analysis of GVC embedding and carbon productivity so as to form a comprehensive research result on GVC embedding and carbon productivity.
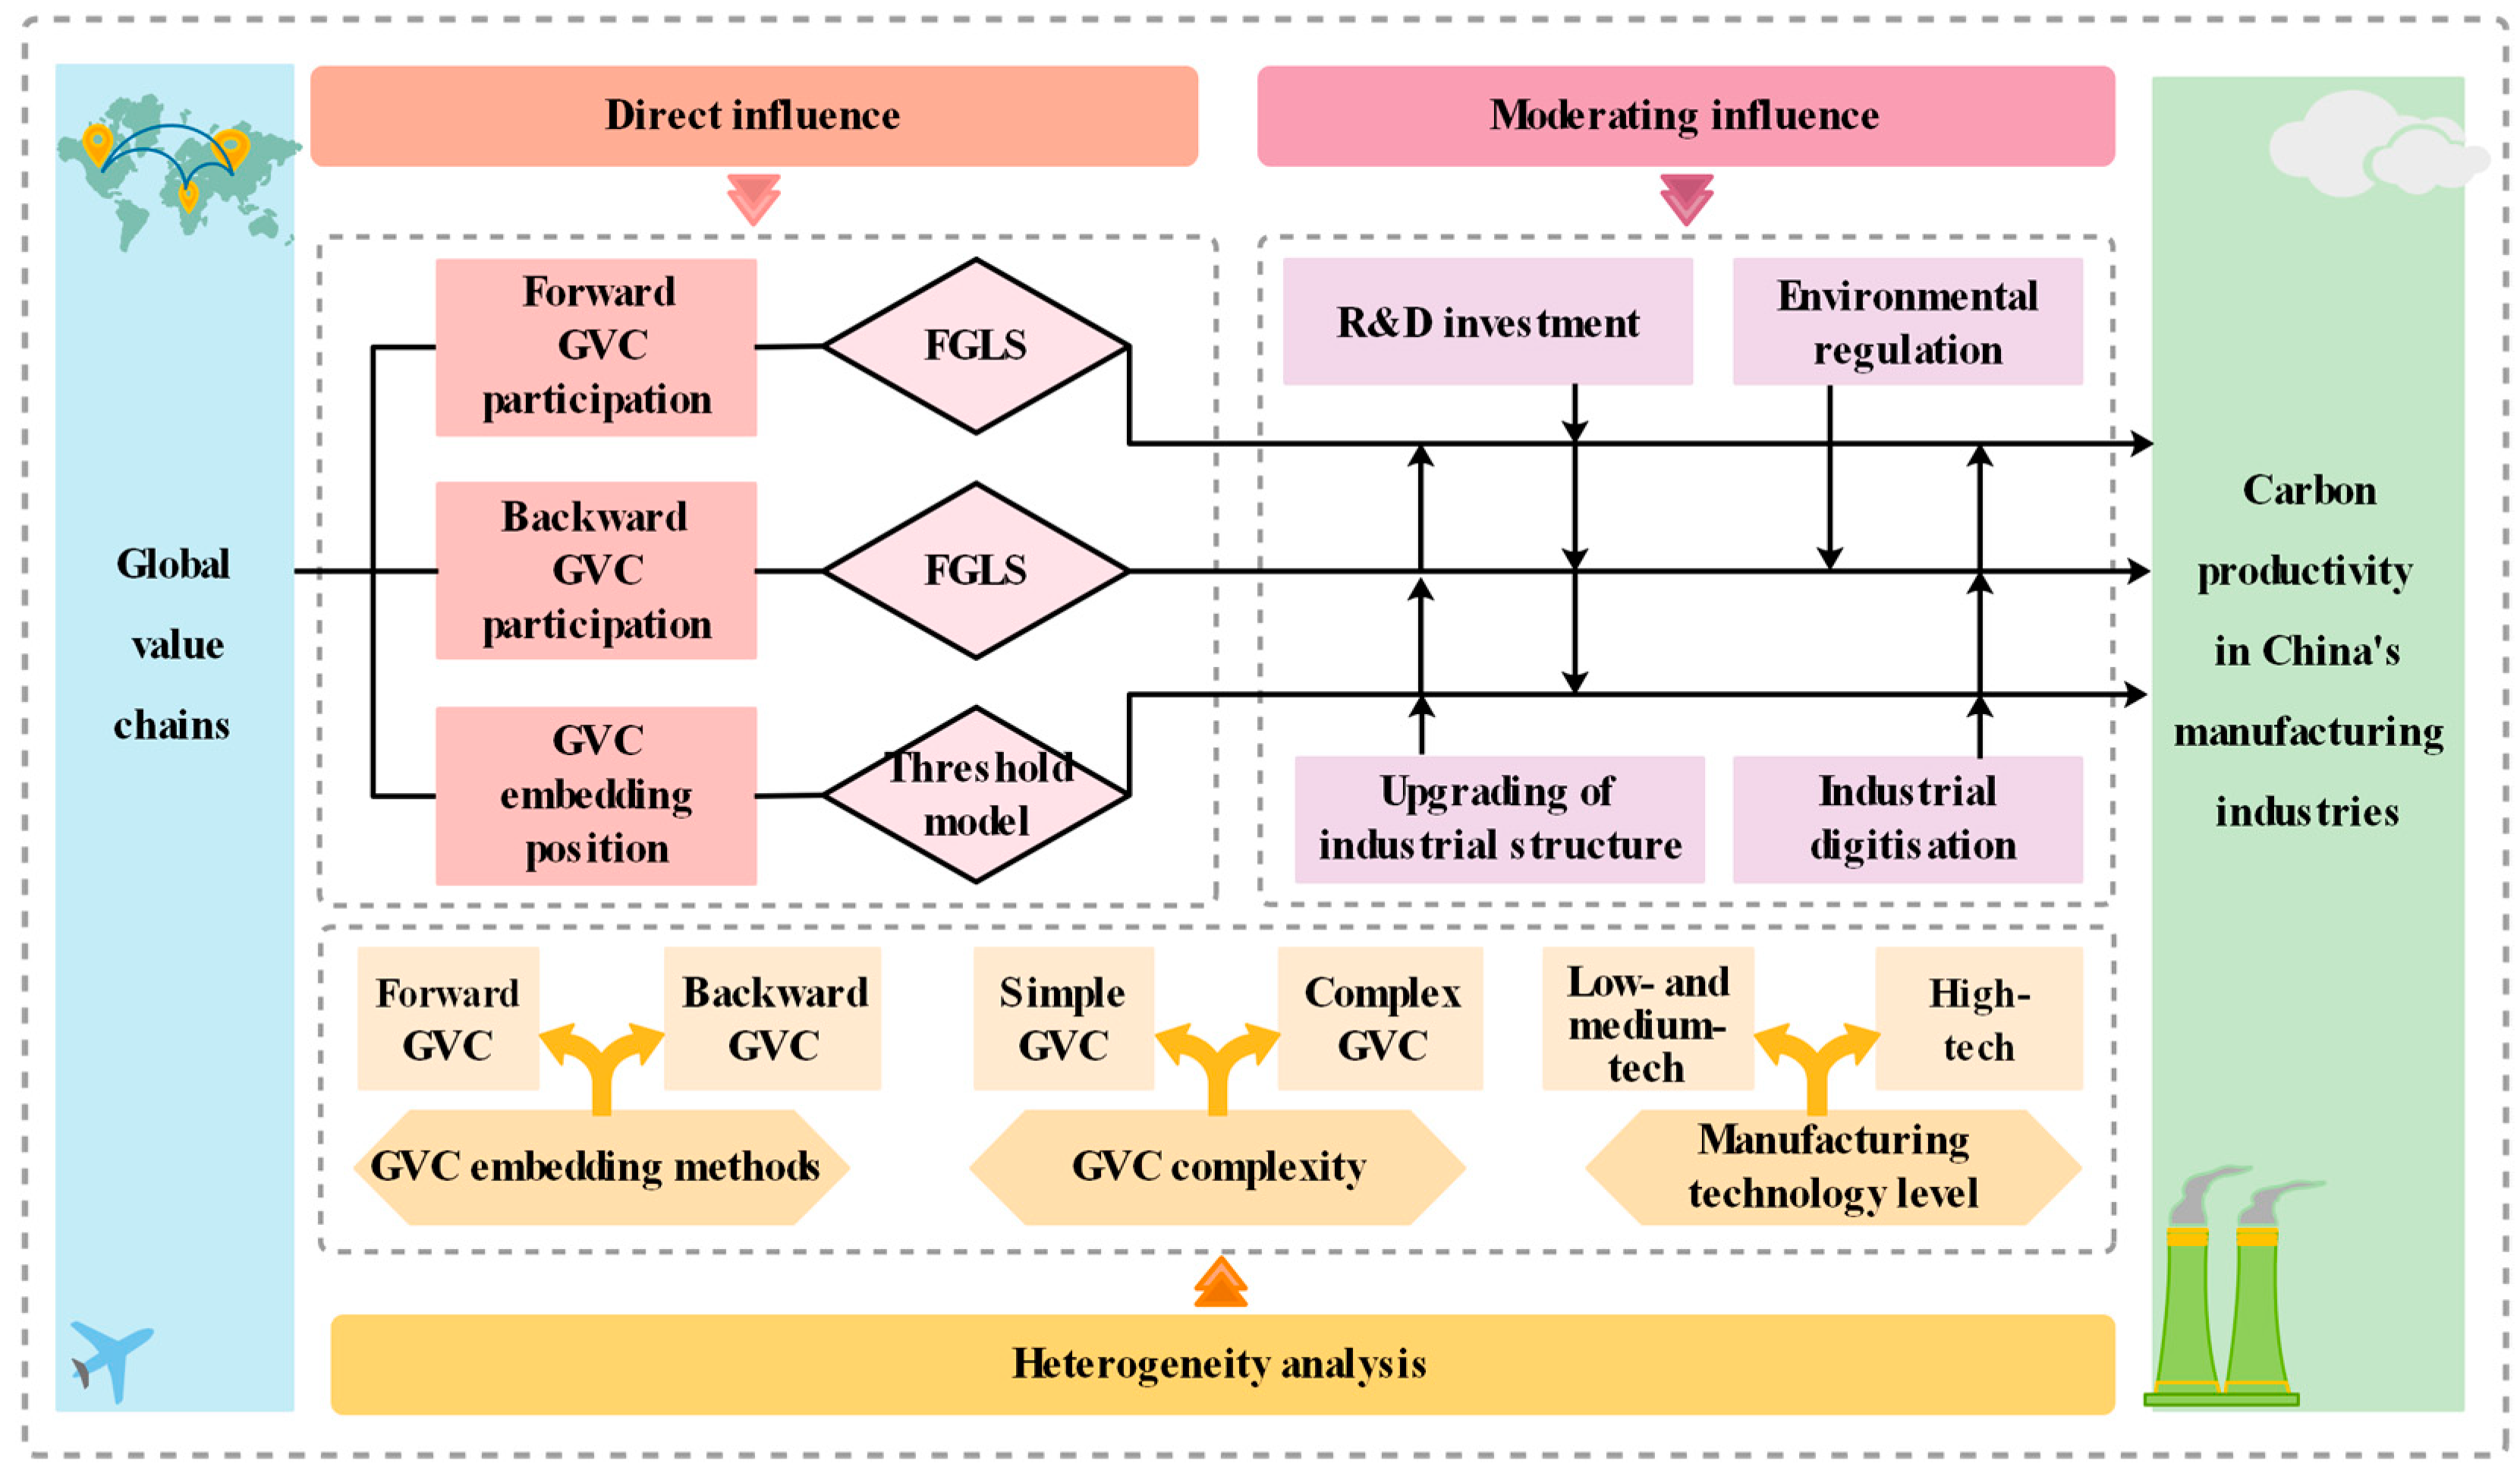
Based on this, this paper takes the GVC embeddedness and carbon productivity of China’s manufacturing industries from 2006 to 2018. First, the estimation method of FGLS is used to explore the direct linear effect of forward and backward GVC participation on carbon productivity. The panel threshold regression model is built to analyse the marginal effect of the GVC embedding position on carbon productivity. Then, the mechanism of GVC embeddedness on carbon productivity is analysed by combining the moderating effects of R&D investment, environmental regulation, industrial structure upgrading, and industrial digitisation in the three dimensions of forward GVC participation, backward GVC participation, and GVC embeddedness position. Finally, the heterogeneous impact of GVC embedding on carbon productivity is analysed in terms of the different GVC embedding methods, the different technology levels in the manufacturing industry, and the degree of participation in simple and complex GVC activities. Our research framework is presented in Figure 1.
The paper is structured as follows: Section 2 conducts the theoretical analysis and develops the research hypothesis. Section 3 describes the model and data. Section 4 conducts an empirical analysis and performs robustness tests. Section 5 explores the moderating effect of GVC embedding on carbon productivity and conducts a heterogeneity analysis. Section 6 concludes and provides policy recommendations based on the findings. Section 7 presents perspectives for future studies.

2. Theoretical Analysis and Research Hypothesis

2.1. The Direct Impact of GVC Embedding on Carbon Productivity in China’s Manufacturing Sector

GVC embedding includes GVC participation and GVC embedding position. GVC participation is determined by the proportion of value added generated by the production chain abroad in total exports. It is used to reflect the degree of a country’s participation in the international division of labour. GVC embedding position can reflect a country’s upstream or midstream/downstream production chain when participating in the international division of labour. GVC participation may be further separated into forward and backward GVC participation depending on how it is embedded. Backward GVC participation shows a nation’s reliance on intermediate goods from other nations, while forward GVC participation shows a nation’s capacity to supply intermediate products to other nations. Based on this, this article will explore the impact of forward and backward GVC participation and GVC embedding position on carbon productivity in China’s manufacturing sector, respectively.

2.1.1. Inhibitory Effects of Forward GVC Participation

The forward GVC embedding is mainly reflected in the participation of one country’s industrial sector in trade activities through the provision of intermediate goods to other countries. Developed countries export knowledge and technology to developing countries to standardise their processing, assembly, and manufacturing capabilities. Through the GVC “learning effect”, developing countries gain access to capital and advanced technology, leading to technological advancement of enterprises and, hence, higher levels of carbon productivity. However, increasing forward GVC participation in most industrial sectors in China has not yet had the effect of reducing carbon emissions [21]. The main reasons exist in the following two aspects: first, the technology blockade by developed countries. Due to the accumulation of enterprise capital and technology, developed countries and powerful multinational corporations feel that their interests are threatened and will impose a technological blockade and suppression on developing countries by increasing trade barriers and other means. In addition, developing nations’ manufacturing industries still have some shortcomings in terms of independent innovation and other areas, resulting in the concomitant conquest of developing nations by developed nations [17]. Second, the attributes of intermediate goods are dominated by high carbon emission products. Due to the relatively backward technology and production capacity, the intermediate goods provided by developing countries consume a lot of energy and cause serious environmental pollution [27], thus increasing carbon emissions. In addition, China’s manufacturing industry is still at the low end of the “smile curve”, and the value of the profits obtained is low. Thus, the incremental value added resulting from deeper forward GVC participation is much smaller than the incremental carbon emissions, which leads to lower carbon productivity. As a result, this article proposes the following hypothesis.
Hypothesis 1 (H1).
Increasing forward GVC participation would reduce the carbon productivity of China’s manufacturing sectors.

2.1.2. Inhibitory Effects of Backward GVC Participation

The inhibiting effect of backward GVC participation on carbon productivity can be reflected in three main ways: First, the ‘pollution refuge hypothesis’. With the deepening of global integration, the transfer of factor resources in GVC is becoming more frequent globally. Faced with harsh domestic environmental policies, developed countries tend to transfer their polluting industries to developing countries with less stringent environmental policies through foreign direct investment (FDI), thereby aggravating environmental pollution in developing countries. The current participation of Chinese manufacturing industries in GVC attracts FDI precisely in the high carbon emission production chain [28], making domestic carbon emission intensity high and environmental problems increasingly prominent. Second, the “capture effect” from developed countries. Most of China’s manufacturing industries that participate in GVC in a backward manner are engaged in low-tech and marginally profitable processing processes, relying on the local low-cost environment and labour resources. This trade model may suffer from the constraints of dominant multinationals, forcing firms to lock at the bottom of the ‘smile curve’ and making it difficult to increase carbon productivity levels [29]. Third, the demographic dividend is gradually disappearing. When looking for “foundry” factories, developed countries always tend to outsource lower-tech production to developing countries with lower factor costs to maximise their benefits. China’s manufacturing industry is embedded in GVC in a backward manner, mainly by low resource factors, undertaking other outsourcing projects and making a small profit from them. However, in recent years, China’s advantage of factor cost has gradually disappeared and is giving way to other developing countries, such as India. Under the pressure of competition from other countries, Chinese manufacturing enterprises can only keep lowering the prices of their production factors. As a result, the profits that enterprises can make by participating in GVC are even smaller. It is difficult to compensate for the increase in carbon emissions, which leads to a continuous reduction in carbon productivity. As a result, this article proposes the following hypothesis.
Hypothesis 2 (H2).
Backward GVC participation can hurt carbon productivity in China’s manufacturing sectors.

2.1.3. The Contribution of GVC Embedding Position to Carbon Productivity in Manufacturing

To achieve GVC upgrading in China’s manufacturing industry, it is necessary to first improve the efficiency of the transformation from input to output through the restructuring of the production process. Secondly, the production of products should tend to be more complex to make them more functional and diverse. Finally, the industry will be upgraded to a new production chain, i.e., to complete the transformation process from process, product, and function to chain upgrading [30]. At the early stage of GVC embedding, China’s manufacturing industry relied on low-cost advantages by local inexpensive production factors to undertake the downstream processing and assembly of GVC. At this stage, GVC upgrading was mainly process and product upgrading, reflecting a switch in the focus of export products from labour-intensive products to capital and technology-intensive products. However, the low-end position of enterprises in GVC did not change, which was not conducive to raising the level of carbon productivity. As GVC embedding continues to deepen, companies gradually shift to the upstream R&D and design segments where carbon emissions are relatively less intensive, i.e., to functional and chain upgrading. Increasing the GVC embedding position at this stage can significantly improve carbon productivity [18]. As a result, this article proposes the following hypothesis.
Hypothesis 3 (H3).
Upgrading the GVC embedding position can boost carbon productivity in China’s manufacturing sectors.

2.2. Moderating Effects of GVC Embedding on the Impact of Carbon Productivity in China’s Manufacturing Sectors

2.2.1. R&D Investment

R&D investment reflects a country’s commitment to R&D activities in science and technology and the importance it attaches to technological progress. Theoretically, increasing R&D investment efforts can promote technological progress [31,32], improve enterprises’ green technological innovation capabilities [33], improve the quality of intermediate products, and reduce energy consumption and pollutant emissions in the production process of intermediate products, thus playing a positive moderating role in the impact of GVC embedding on carbon productivity.
However, the contribution of R&D investment to technological progress is sometimes subject to certain constraints, leading to unsatisfactory results. To start, there is a lag in the influence of R&D investment on technological advancement [34]. In the early stages of technology research and development, there is a lot of uncertainty and a low level of capitalization. This makes it challenging for businesses to meet expectations of advancing technology and even less able to immediately achieve the carbon reduction effect brought about by green technology innovation. Secondly, constrained by the level of regional economic development, it is difficult to create positive output by increasing R&D investment. When an area has a low degree of economic growth, its level of human capital is also relatively low, and even with increasing R&D expenditure, it cannot effectively be translated into sophisticated green technology. Third, businesses that prioritise profits frequently select unclean technology [35]. In order to maximise profits in the process of embedding GVC, enterprises will make technology choices guided by economic benefits. They tend to invest R&D funds in non-clean technologies or focus only on improving production efficiency, neglecting to improve the quality of intermediate goods and production processes. Enterprises will expand their production scale due to the improvement of production efficiency, leading to an increase in carbon emissions. Therefore, R&D investment may make the GVC embedding’s dampening effect on carbon productivity worse.

2.2.2. Environmental Regulation

Environmental regulation is a tangible institution or intangible constraining force developed by a government or organisation in a country to protect the environment [36]. Environmental regulation has a moderating effect on the degree of GVC participation, affecting carbon productivity in two main ways. On the one hand, raising the environmental access threshold can force foreign investment to provide clean technology on its initiative [37]. In order to relieve domestic environmental pressures, the Chinese government will raise environmental standards. This will encourage developed countries to provide abatement technologies, which will partially offset the “pollution sanctuary effect” [38]. However, by enforcing environmental regulation policies, local businesses may be compelled to undertake green technological innovation projects, optimise the allocation of factor resources [39], support industry structural upgrading [40], and hasten the shift from pollutant-intensive to clean industries, thereby increasing carbon productivity. In addition, the effect of technological progress brought about by environmental regulations can help to solve the difficulties of China’s manufacturing industries in key technologies, thus alleviating the effect of the technological embargo imposed by developed countries.

2.2.3. Upgrading the Industrial Structure

Industrial structure upgrading refers to the process or trend of transformation of the industrial structure from a lower to a higher form, mainly in the form of a shift to tertiary or technology-intensive industries. It helps to mitigate the competitive effects triggered by GVC embedding. On the one hand, upgrading the industrial structure can force local enterprises to take the initiative to carry out technological R&D activities [41,42] to capture market share and thus avoid being eliminated in a highly competitive market environment. Technological R&D is conducive to developing high-tech industries with high value-added and low carbon emissions, thus promoting enterprises to climb to the higher end of the value chain. On the other hand, upgrading the industrial structure also helps enterprises to improve production efficiency [43], promotes the diversification of their product production, enhances their competitiveness, and helps them to broaden market channels and compete for international market shares so as to mitigate the negative impact from technological containment and market competition from other countries in the process of GVC climbing, while positively regulating the role of GVC embedding in promoting carbon productivity.
Upgrading the industrial structure can enhance the scale effect of GVC embedding. The scale effect means that firms embedded in GVC lead to higher pollution levels due to the expansion of economic production activities [26]. Upgrading the industrial structure can encourage the flow of factor resources from inefficient to efficient production sectors, from the primary industry to the secondary and tertiary industries. It is conducive to indirectly improving the production efficiency of the secondary and tertiary industries. On the other hand, it may also reduce the efficiency of resource allocation, cause distortions in supply and demand, and widen the fault lines that already exist between the three industries in terms of labour productivity. This can lead to a deviation from the rationalisation of the industrial structure [44], where factor inputs and structural outputs are not coupled most efficiently. Therefore, upgrading the industrial structure is conducive to improving the productivity of the manufacturing industry and expanding the production scale of enterprises. However, it fails to promote the upgrading of product processes and quality and instead exacerbates the scale effect of GVC embeddedness and reinforces the negative impact of GVC embeddedness on carbon productivity.

2.2.4. Digitalisation of Industry

Industrial digitisation can mitigate the negative impact of GVC embedding on carbon productivity by optimising the import learning effect of GVC embedding. Technology spillovers are often implicit in foreign investment and imported intermediate goods. The GVC import learning effect refers to the fact that developing countries actively learn from the advanced technology and management experience of other countries through their participation in GVC [45]. Data factor is not only infinitely reproducible but also has the advantages of fast dissemination and low marginal costs. Moreover, unlike traditional factors of production, data factor is not subject to the law of diminishing returns to scale and may achieve increasing marginal returns. Therefore, the data factor has become an important factor influencing the division of labour in GVC. The digital development of industries is conducive to breaking through the geographical restrictions between markets, thus building a unified domestic market and effectively promoting the diffusion of production technologies and other resources between industries, thus improving the efficiency of resource allocation between international sectors [46] and enhancing the GVC import learning effect and improving carbon productivity.
However, the digitalisation of the industry may have a crowding-out effect on technological progress, constrained by the level of economic development, thus creating a “low-end lock-in” dilemma. The term “low-end lock-in” describes the process of participating in the GVC where developed countries hold core technologies and significant patented technologies and use their core technologies to stifle knowledge creation and competitiveness enhancement of developing countries’ firms so that developing countries’ firms lose their core competitiveness and are restricted to the low end of the value creation chain [47]. The development of industrial digitisation requires a large amount of capital investment and places higher demands on the level of technology. For regions with relatively backward economic development, it is difficult to absorb and transform the spillover technologies in GVC by virtue of their technological level. As a result, businesses are constrained by developed countries at the lower end of the value chain, which is high in carbon emissions and low in profitability [48], thus weakening the promotion effect of the climbing GVC position on carbon productivity. Based on the above analysis, this article proposes the following hypothesis.
Hypothesis 4 (H4).
R&D investment, environmental regulation, industrial structure upgrading, and industrial digitisation play a moderating role in GVC’s embedded influence on the carbon productivity of China’s manufacturing sectors.

3. Data Sources and Methodology

3.1. Model Construction

Based on the above theoretical analysis, the control variables were selected by drawing on the research method of Yang et al. [49]. This article introduces its quadratic term to examine the impact of GVC embedding position on carbon productivity in China’s manufacturing industries in light of the potential non-linear relationship between GVC embedding position and carbon productivity [18,19]. The specific model is as follows:
c p i t = β 0 + β 1 ln G V C P _ f i t + β 2 Z i t + μ i + φ t + ε i t
c p i t = φ 0 + φ 1 ln G V C P _ b i t + φ 2 Z i t + μ i + φ t + ε i t
c p i t = α 0 + α 1 G V C P s i t + α 2 G V C P s i t 2 + α 3 Z i t + μ i + φ t + ε i t
where i is the industry, t is time, cp is carbon productivity, GVCP_f denotes forward GVC participation, GVCP_b denotes backward GVC participation, and GVCPs denotes the GVC embedding position. Z denotes the control variables, including energy structure (ES), expressed as a share of coal consumption in total energy consumption. Energy efficiency (EE) is expressed as a ratio of industry sales output to total energy consumption. Industry structure (IS) is expressed as a proportion of the sales value of each industry to the overall sales value of the manufacturing sector. The indicator indicates the proportion of each industry in the manufacturing sector. μ i denotes individual effects, φ i denotes time effects, and ε i t denotes other disturbance terms.

3.2. Variables Measurement

3.2.1. Measures of Forward and Backward GVC Participation

The paper decomposes the GVC-embedded value added from the dimensions of final product production and value-added and measures the forward and backward GVC participation indices, drawing on the measurement approach of Wang et al. [7]. This approach not only successfully addresses issues like duplicate counting of value added, but it also allows for further investigation of the various effects of forward and backward GVC participation on carbon productivity. Based on this, this article combines the UIBE database to collate the indexes of forward and backward GVC participation.
G V C P _ f = G V C _ P a t _ f _ s i m p l e + G V C _ P a t _ f _ c o m p l e x
In Equation (4), GVCP_f denotes the forward participation index, GVC_Pat_f_simple denotes the forward simple GVC participation index, and GVC_Pat_f_complex denotes the forward complex GVC participation index.
G V C P _ b = G V C _ P a t _ b _ s i m p l e + G V C _ P a t _ b _ c o m p l e x
In Equation (5), GVCP_b denotes the backward participation index, GVC_Pat_b_simple denotes the backward simple GVC participation index, and GVC_Pat_b_complex denotes the backward complex GVC participation index.

3.2.2. Measurement of GVC Embedding Position

Current measures of GVC location include the GVC status index [5], the upstreamness index [50], and the GVC location index [51]. The GVC status index does not reflect a country’s specific position on the GVC but only a certain “degree” of proximity to upstream and downstream. In the case of the upstream index, there are inconsistencies between the “upstream” and “downstream” accounting results. In contrast, the GVC location index uses a relative number to closely link the production location index to the production length measure. It more accurately reflects the relative position of a country’s sector in GVC production. The larger the index, the closer the country sector is to the upper reaches of the GVC. In addition, the indicator takes into account the length of production based on both forward and backward linkages, resolving the inconsistency of results in the upstream index due to the use of a single ‘upstream’ or ‘downstream’ indicator. This paper uses the GVC location index proposed by Wang et al. [51] to measure the GVC embedding position with the following equation:
G V C P s = P L v _ G V C [ P L y _ G V C ]
where GVCPs denote the GVC position index. PLv_GVC and PLy_GVC denote the average production length of forward and backward GVC activity, respectively.

3.2.3. Measuring Carbon Productivity in China’s Manufacturing Sector

Carbon productivity is the ratio of GDP to total carbon dioxide emissions for a certain period, an indicator that well reflects the dual task of low carbon emissions and economic growth and coincides with China’s current reality. Carbon productivity can be categorised into single-factor and total-factor carbon emission efficiency according to the measurement method. As the measurement of the total factor carbon emission efficiency index involves a variety of input and output factor data, there may be a correlation with the variables introduced in this paper, such as R&D investment, which affects the empirical results. Moreover, the current carbon emission reduction targets in China all use single-factor indicators. Based on this, this article measures the single-factor carbon productivity of China’s manufacturing industry. The specific formula is as follows:
c p i t = s a l e i t / C O 2 i t
where saleit indicates sales value, and CO2it indicates CO2 emissions.
Most existing studies have used the IPCC (2006) sectoral method to measure CO2 emissions. However, the emission factors used in this method are 40% higher than China’s actual emission factors, making the measured results much higher than China’s actual carbon emissions [52]. To this end, this article refers to the China Emission Accounts and Datasets (CEADs) measurement method to calculate CO2 emissions by year:
C O 2 i j = A D i j × N V C i × C C i × O i j
where CO2ij indicates CO2 emissions; ADij indicates fossil energy consumption; NVCi indicates low-level heat generation from fossil energy; CCi indicates CO2 emissions per unit of net calorific value; and Oij indicates the oxidative conversion rate of fossil energy.

3.2.4. Measures of Moderating Variables

According to the previous theoretical analysis, it can be seen that R&D investment, environmental regulation, industrial structure upgrading, and industrial digitalisation may play a moderating role in the impact of GVC on carbon productivity. Therefore, it is necessary to measure the moderating variables such as R&D investment. R&D investment (RD) is expressed as the amount of R&D investment. Environmental regulation (ER) is expressed as the ratio of annual operating costs of wastewater and waste gas treatment in the manufacturing sector as a whole to the industry’s sales value. Industrial structure upgrading (CYJG) is expressed as the share of value added in the tertiary sector in GDP. For industrial digitalization (DA), this article adopts the accounting method of the China Academy of Information and Communication Technology. The method is based on the Hicks-neutral R&D input assumption condition, and the factors of production are divided into ICT capital and non-ICT capital to solve the total factor productivity. Then, using the growth accounting account framework, the marginal contribution of digital technology to traditional industries is extracted to obtain the scale of industrial digitisation. The specific measurement method and formula for the indicator DA can be found in the 2017 White Paper on the Development of China’s Digital Economy.

3.3. Data Sources

Relevant data on GVC embedding requires the use of multi-regional input–output tables. The majority of the multiregional input–output tables utilised in previous research were sourced from the OECD and WIOD databases. The world input–output table provided in WIOD (2016) covers 56 industries in 43 countries around the world, which is broadly representative, but the relevant data in this database are only updated to 2014, which lacks timeliness. The OECD database is based on the official input–output tables of each country, which are collated to cover 36 industries in 64 countries. The database not only has comprehensive data content but is also more recently and frequently updated, and the latest data have been updated to 2018. Based on the availability and validity of data, this article selected China’s manufacturing industries panel data for the period 2006–2018 based on the OECD (2021) database and matches 23 manufacturing sub-sectors from the China Industrial Statistics Yearbook with the OECD database, excluding manufacturing industries such as furniture, stationery, education and sporting goods, and general and special equipment and instrumentation.
The UIBE database is based on the world’s major inter-country input–output tables or global inter-regional input–output tables (OECD and WIOD, etc.). It uses the structural decomposition of inputs and outputs to calculate several indicators commonly used in the field of international trade and GVC research, such as trade in value-added (TVA) and participation in GVC, which prevents a lot of duplication of effort. Therefore, this article combines the UIBE database to collate and calculate the relevant indicators embedded in GVC.
Data related to industry digitisation are from the China Academy of Information and Communication Technology, and other data are from the China Statistical Yearbook. To eliminate heteroskedasticity and dimensional differences in the independent variables due to inconsistent orders of magnitude, this article takes logarithms of the indicators related to GVC participation and R&D investment for dimensionalisation. Based on this, Table 1 gives the descriptive statistical characteristics of the main variables.

4. Analysis of the Effect of GVC Embedding on Carbon Productivity

4.1. Analysis of Baseline Regression Results

The Hausman test was used to choose a fixed effects model before the empirical study. The Wald test and Wooldridge test were also used to assess the model. The findings showed that there was within-group serial correlation, within-group contemporaneous correlation, and heteroskedasticity. In order to account for bias, the model was estimated using FGLS. The regression results are shown in Table 2.
Column (1) in Table 2 shows the regression results of forward GVC participation, and its regression coefficient on carbon productivity is −0.5140, which is significant at the 1% significance level. It shows that increasing forward GVC participation reduces carbon productivity in China’s manufacturing industries during the sample period. The possible reasons for this are that, on the one hand, the proportion of low-tech manufacturing industries participating in GVC in the forward direction is much higher than that of high-tech manufacturing industries. However, the important learning effect of GVC in low-tech industries is limited. The low-tech manufacturing industries are caught in the limited ability to absorb spillover technology, which often makes it difficult to complete the absorption and transformation of advanced technology. Enterprises may even abandon their R&D activities due to over-reliance on imported technologies from other countries. Thus, there is a crowding-out effect on local technology R&D, which is not conducive to improving product quality, and the high carbon emission attributes of intermediate goods cannot be fundamentally transformed in the short term. On the other hand, with the deepening participation of forward GVC, developed countries may impose technological blockades and suppression on China to maintain their high profits, raise trade barriers, and trigger trade frictions, which will harm China’s vested interests. Thus, with the combined effects of impaired GVC trade value added and limited carbon reduction, increasing forward GVC participation reduces the carbon productivity of China’s manufacturing sectors. As a result, H1 is proven.
Column (2) in Table 2 shows the results of the regression of backward GVC participation, which has a regression coefficient of −0.2184 on carbon productivity, and the coefficient is significant at the 1% level of significance. It indicates that increasing backward GVC participation decreases carbon productivity in China’s manufacturing sectors during the sample period. This may be due to the fact that, on the one hand, most of China’s manufacturing enterprises participating in GVC in a backward-looking manner rely on the advantage of factor cost to engage in energy-intensive and marginally profitable processing processes. This mode of production makes it easy for developing countries to be ‘captured’ by dominant multinationals, forcing China’s manufacturing sectors to be locked into the lower end of the spectrum where carbon emissions are high. In recent years, China’s advantage of factor cost has been disappearing and giving way to other countries, reducing the profitability of enterprises. On the other hand, due to China’s relatively lax environmental policies, developed countries have moved pollution-intensive industries to China, resulting in a particular “pollution sanctuary” effect. As a result, carbon emissions have continued to increase while vested profits have decreased, leading to a reduction in carbon productivity. Thus, H2 is proven.
Column (3) in Table 2 shows the results of a linear regression of the GVC embedding position on carbon productivity in manufacturing with a significantly positive sign of the coefficient (0.3309). It shows that the closer a company is to the low-energy, high-tech GVC upstream production, the stronger the learning effect obtained through GVC, which is conducive to carbon productivity. To examine the non-linear relationship between GVC embedding position and carbon productivity, this article first introduces its quadratic term into the model by referring to previous literature practices. The regression results are presented in column (4) of Table 2. The results show that the sign of the primary term coefficient (1.2673) remains significantly positive, and the sign of the squared term coefficient (−0.0488) is significantly negative at the GVC embedding position, consistent with an inverted U-shaped relationship. The inflection point of the curve is further calculated to be 12.99. However, a breakdown of the sample by inflection point reveals that, with the exception of the coke and refined petroleum products industries, which are located on the right-hand side of the curve, all other sample points are located on the left-hand side of the curve. This indicates that the Chinese manufacturing industry is still on the left-hand side of the inverted U-shaped curve in general. The specific sample value is probably to blame for the inverted U-shaped connection between the GVC embedding position and carbon productivity. The reliability of the inverted U-shaped link between carbon production and the GVC embedding position is thus still up for debate. To this end, this article constructs a panel threshold regression model to further investigate the association between GVC embedding position and carbon productivity.

4.2. Retesting the Inverted U-Shaped Relationship between GVC Embedding Position and Carbon Productivity: Threshold Regression

Considering the range of values of the GVC embedding location variable, this article further explores the non-linear relationship between GVC embedding position and carbon productivity using the threshold regression model proposed by Hansen [53], which is set as follows:
c p i t = β 0 + β 1 G V C P s i t 1 ( G V C P s δ ) + β 2 G V C P s i t 1 ( G V C P s > δ ) + β 3 Z i t + ε i t
where 1(•) represents the schematic function, which takes the value of 0 when the expression in brackets does not hold, and 1 otherwise; δ denotes the threshold value of the GVC embedding position; and Z is the aforementioned control variable.
Similar to the single threshold model, when two thresholds exist for the model, the above model can be expressed as follows:
c p i t = β 0 + β 1 G V C P s i t 1 ( G V C P s δ 1 ) + β 2 G V C P s i t 1 ( δ 1 < G V C P s δ 2 ) + β 3 G V C P s i t 1 ( G V C P s > δ 2 ) + β 4 Z i t + ε i t
where δ1 < δ2, the empirical analysis of the above model is as follows.
The paper first sets three threshold values and tests them with the GVC embedding position as the threshold variable, and the results are shown in Table 3.
The results show that in addition to the triple threshold, both the single and double threshold models pass the significance test, suggesting that there may be a non-linear relationship between the GVC embedding position and China’s manufacturing carbon productivity under a double threshold effect. To this end, two threshold estimates of 8.53 and 8.59 were obtained for the GVC embedding position by further testing for double threshold effects (see Table 4).
Figure 2 is the plot of the likelihood ratio function for the threshold. The value corresponding to the red dashed line in the figure is 7.35, which indicates the threshold value of the likelihood ratio (LR) statistic at the 5% significance level. The blue curve indicates the threshold parameter. As can be seen from the figure, since the two thresholds are significantly less than 7.35, these thresholds can be considered valid.
The results of the panel threshold regression are shown in column (5) in Table 2. The results show that when the GVC embedding position is low (GVCPs < 8.53), the regression coefficient is 1.11; when the GVC embedding position is high (8.53 ≤ GVCPs ≤ 8.59), the regression coefficient is 2.91; and when the GVC embedding position is further increased (GVCPs > 8.59), the regression coefficient becomes 1.58, and the above three regression coefficients are significant at the 1% level. This shows that the contribution of the GVC embedding position to the carbon productivity of China’s manufacturing industry gradually strengthens as the embedding position increases. When the threshold of 8.59 is crossed, the marginal impact diminishes, but the GVC embedding position is still positively related to carbon productivity. As a result, H3 is proved. The “pseudo-inverse U-shaped” relationship derived from the introduction of a quadratic term in the baseline regression is due to the change in the marginal impact of the GVC embedding position on carbon productivity. The difference between the results of the two methods can be seen in Figure 3.
Figure 3a shows the inverted U-shaped relationship resulting from the introduction of the quadratic term. The GVC embedding position is positively correlated with carbon productivity when the GVCPs have not yet crossed the O point (left side of the curve). When the GVCPs cross the O point (right side of the curve), the GVC embedding position is negatively correlated with carbon productivity. However, when combined with the range of GVCPs, most of the sample points lie to the left of the inverted U-shaped curve, i.e., increasing the GVC embedding position will significantly increase the level of carbon productivity. Figure 3b plots the change in the marginal effect from the threshold regression, which increases and then decreases. As can be seen from the slopes at points A and B, the curve to the left of point O’ tends to steepen, i.e., the marginal effect of the GVC embedding position on carbon productivity gradually increases. The slope at points C and D shows that the curve to the right of point O’ tends to flatten out, i.e., the marginal effect of GVC embedding position on carbon productivity gradually decreases, but the relationship between GVC embedding position and carbon productivity is still positive. In the past decade, China’s manufacturing production model has been continuously upgraded in the direction of intelligence, green, and services, and a modern industrial system has been initially built, with the GVC division of labour gradually moving towards the middle- and high-end. However, as China’s manufacturing sectors continue to develop, the environment they face will become more complex. In addition, China’s industrial base is relatively weak, and there are still problems with “necking” in key technologies. As a result, the positive marginal impact of the GVC embedding position on carbon productivity may be reduced.

4.3. Robustness Test

The parameter estimation method was changed. The non-parametric covariance matrix estimation method was used to test the robustness of the baseline regression results. The method effectively solves the problems of heteroscedasticity, within-group serial correlation, and within-group contemporaneous correlation in the model. The test results are shown in columns (1) to (3) in Table 5. It can be seen that the core variables remain significant despite the change in estimation method, and the sign of the coefficients is consistent with the baseline regression results, indicating that the model and conclusions of this article are relatively robust.
Replacement of core variables. Using the IPCC (2006) sectoral approach, carbon dioxide emissions were recalculated, and thus, carbon productivity (cp*) was obtained to replace the dependent variable in the original model. The test results are presented in columns (4) to (6) in Table 5, and it can be seen that the model and conclusions of this article are still relatively robust with the replacement of the dependent variable.
Instrumental variables method. To address possible endogeneity issues in the model, this article uses two-stage least squares estimation (2SLS) for regression through the instrumental variables method. The forward GVC participation variable (FO) before taking logs was used as the instrumental variable for forward GVC participation. The backward GVC engagement (BA) before taking logs was used as the instrumental variable for backward GVC participation. The lagged one-period variable of GVC embedding position (L.GVCPs) was used as its instrumental variable. To illustrate the validity of the selected instrumental variables, this article was divided into tests of non-identifiability and weak instrumental variables, etc. The results showed that the selected instrumental variables were valid. The regression results of the instrumental variables using 2SLS are then presented in Table 6. The results show that the core variables are significant, and the sign of the coefficients remains constant, indicating that the findings of this article are robust.

5. Moderating Effect of GVC Embedding on Carbon Productivity and Heterogeneity Analysis

5.1. Analysis of Moderating Effects

Based on the above analysis, forward GVC participation may be due to the low level of technology of the enterprises themselves, which cannot absorb spillover technology, and the technological embargo from developed countries, thus hindering the increase of carbon productivity. Backward GVC participation may have a negative impact on carbon productivity due to factors such as the ‘pollution sanctuary’ effect exacerbated by more lenient environmental policies and capture by developed countries due to over-reliance on traditional factors of production. The closer the GVC is embedded in the upstream production chain, the higher the level of carbon productivity. What is the role of R&D investment, environmental regulation, industrial structure upgrading, and industrial digitalisation in the impact of GVC embedding on carbon productivity? To this end, this article examines the moderating effect of industrial digitalization on the impact of GVC embedding on carbon productivity in China’s manufacturing sectors by introducing the corresponding interaction terms and constructing the following moderating effect model.
c p i t = β 0 + β 1 ln G V C P _ f i t + β 2 ln G V C P _ f i t × X i t + β 3 Z i t + μ i + φ t + ε i t
c p i t = φ 0 + φ 1 ln G V C P _ b i t + φ 2 ln G V C P _ b i t × X i t + φ 3 Z i t + μ i + φ t + ε i t
c p i t = α 0 + α 1 G V C P s i t + α 2 G V C P s i t × X i t + α 3 Z i t + μ i + φ t + ε i t
The moderating variables Xit include R&D investment (RD), environmental regulation (ER), industrial structural upgrading (CYJG), and industrial digitisation (DA). The meanings of the other variables are consistent with the previous section, and the regression results are shown in Table 7.

5.1.1. Positive Moderating Effect of R&D Investment

The regression coefficients of the interaction factors of R&D investment with forward and backward GVC participation are −0.1347 and −0.2024, and they are all significant at the 1% level of significance. The coefficients of the interaction terms are all of the same sign as the coefficients (−0.7658 and −2.7853) of their core explanatory variables (lnFO and lnBA). Thus, the moderating effect enhances the main effect, i.e., R&D investment enhances the dampening effect of forward and backward GVC participation on carbon productivity in China’s manufacturing sectors. Similarly, the regression coefficient of the interaction term between R&D investment and GVC embedding position is 0.0283, which is significantly positive at the 5% significance level and is consistent with the sign of the coefficient (0.4619) of the core explanatory variables (GVCPs). This suggests that R&D investment also reinforces the contribution of increased GVC embedding position to carbon productivity.
R&D investment can promote technological progress, improve the quality of intermediate goods, and promote carbon emission reduction. However, there is a certain lag effect in practice in converting R&D investment into technological progress. Under the drive of economic interests, enterprises may be biased to invest more R&D funds in technological R&D activities that enhance production efficiency, neglecting the improvement of product quality, thus enhancing the GVC scale effect. As a result, the incremental increase in trade value added due to technological progress by increasing R&D investment in the short term is not sufficient to offset the incremental increase in CO2 due to increased scale effects, thus strengthening the negative effect of forward and backward GVC participation on carbon productivity. However, technological progress is of paramount importance in the process of improving the GVC embedding position, and increased investment in R&D is also indispensable. Therefore, R&D investment plays a positive moderating role in the positive impact of GVC embedding position on carbon productivity.

5.1.2. Negative Regulatory Effects of Environmental Regulation

In terms of the moderating effect of environmental regulation, the interaction term between environmental regulation and forward GVC participation is not significant. The coefficient of the interaction term between environmental regulation and backward GVC participation is 0.0001, which is significantly positive at the 10% level of significance, but the coefficient (−2.7852) of the core explanatory variable (lnBA) has a negative sign, i.e., the moderating effect acts as a damper on the main effect. It indicates that environmental regulation weakens the dampening effect of backward GVC participation on carbon productivity in manufacturing. Strengthening environmental regulations will encourage developed countries to provide advanced energy-saving and emission-reducing technologies and reduce the “pollution refuge” effect of increased backward GVC participation. It will also force local enterprises to take the initiative to invest in green research and development activities, thereby increasing carbon productivity.

5.1.3. Positive Moderating Effect of Industrial Structure Upgrading

The moderating effect of industrial structure upgrading on the impact of GVC embedding is similar to that of R&D investment. The coefficients of the interaction term of industrial structure upgrading with forward and backward GVC participation are −0.1362 and −0.2881, and they are all significantly negative at the 1% significance level. The coefficient (0.0166) of the interaction term between industrial structure upgrading and GVC embedding position is significantly positive at the 1% significance level. This means that the moderating effect works in the same direction as the main effect, which indicates that industrial structure upgrading enhances the negative impact of forward and backward GVC participation on the carbon productivity of China’s manufacturing industry. It also strengthens the boosting effect of elevated GVC embedding position on carbon productivity.
The upgrading of industrial structure has led to a continuous flow of factor resources from inefficient production sectors to efficient production sectors. This is conducive to improving the productivity of enterprises. However, as China’s manufacturing industry base is relatively weak, blind industrial structure upgrading may lead to unbalanced industrial development, trigger overproduction, and reduce resource allocation efficiency. It will enhance the inhibiting effect of forward and backward GVC participation on carbon productivity. However, from the GVC embedding position, the upgrading of industrial structure can force domestic enterprises to take the initiative to carry out technological innovation activities, improve their production efficiency, and promote the diversification of intermediate goods, which will help them broaden their market channels and promote China’s manufacturing industry to climb up the value chain. The closer the position of GVC is to the upstream production chain, the more enterprises are exposed to core technology and management experience, and the stronger the learning effect of GVC, which can also reverse the industrial structure to promote more advanced. Therefore, with the combined positive impact of both industry structure upgrading and GVC embedding position enhancement, the promotion of industry structure upgrading will reinforce the positive impact of GVC embedding position enhancement on carbon productivity.

5.1.4. Negative Moderating Effect of Industrial Digitisation

In terms of the moderating effect of industrial digitisation on the impact of GVC embedding, the coefficients of the interaction term of industry digitisation with forward and backward GVC participation are 0.0693 and 0.2528, and they are all significantly positive at the 1% level of significance. The coefficient (−0.0303) of the interaction term between industry digitisation and GVC embedding position is significantly negative at the 1% level of significance. The coefficients of the interaction term and the core variables always have opposite signs, i.e., the moderating effect weakens the effect of the main effect. This indicates that industrial digitisation weakens the negative impact of forward and backward GVC participation on carbon productivity in China’s manufacturing industry. It also weakens the boosting effect of the increased GVC embedding position on carbon productivity.
A deeper digitalisation of the industry can effectively reduce the manufacturing industry’s dependence on traditional factors of production and help transform China’s production model, which is dominated by taking over the processing and assembly stages. This can effectively reduce the capture effect from developed countries and weaken the negative impact of forward and backward GVC participation on carbon productivity. However, as the development of the digital economy requires a large amount of capital, some regions may have a certain degree of crowding out effect on technological progress and hinder technological upgrading due to their backward economic development. This makes it difficult for enterprises to climb from the lower end of the value chain, which is highly polluting and marginally profitable, to the higher end of the value chain, which is low in energy consumption and high in profitability, thus weakening the role of the GVC embedded position in promoting carbon productivity. As a result, H4 is proved.

5.2. Analysis of Heterogeneity

5.2.1. Heterogeneity Analysis of Simple GVC Participation and Complex GVC Participation

According to the above analysis, both forward and backward GVC participation are negatively related to carbon productivity in China’s manufacturing sectors. However, as the division of labour in the value chain continues to deepen, GVC can be further classified into simple GVC and complex GVC based on the number of GVC crossings. Simple GVC means that the intermediate product is used by its importing country to produce a product for domestic consumption or directly for domestic consumption. The value added involved enters the national border only once. Complex GVC means that intermediate goods are used in a third country to produce exports and involve value-added crossing borders several times. To this end, this article further subdivides GVC participation into forward simple, forward complex, backward simple, and backward complex GVC participation to examine the heterogeneity of the impact of simple and complex GVC activity participation on carbon productivity in China’s manufacturing sectors. The model developed is as follows:
c p i t = γ 0 + γ 1 ln G V C _ P a t _ f _ s i m p l e i t + γ 2 ln G V C _ P a t _ f _ c o m p l e x i t + γ 3 X i t + γ 4 Z i t + μ i + φ t + ε i t
c p i t = λ 0 + λ 1 ln G V C _ P a t _ b _ s i m p l e i t + λ 2 ln G V C _ P a t _ b _ c o m p l e x i t + λ 3 X i t + λ 4 Z i t + μ i + φ t + ε i t
The meanings of the indicators are the same as in the previous section, and the specific regression results are shown in Table 8.
In terms of simple GVC activity participation, the regression coefficient (1.3081) of forward simple GVC participation in carbon productivity is significantly positive at the 1% significance level, while the regression coefficient (−0.4247) of backward simple GVC participation in carbon productivity is negative at the 1% significance level. This indicates that increasing forward simple GVC participation promotes carbon productivity level while increasing backward simple GVC participation inhibits carbon productivity level. This may be because industries involved in simple GVC activities in a forward-looking manner tend to have lower carbon intensity and stronger spillover effects, making it easier for companies to access advanced low-carbon technologies in other countries, thus promoting local green technology R&D activities and increasing carbon productivity levels. The industries involved in simple GVC activities in a backward-looking manner are mainly engaged in secondary outsourcing from emerging economies, with higher carbon intensity and relatively weak spillover effects, which are not conducive to the improvement of carbon productivity levels. Combined with the values of the regression coefficients, the boosting effect of forward simple GVC participation on carbon productivity is greater than the dampening effect of backward simple GVC participation on carbon productivity. So, simple GVC activity participation is positively related to carbon productivity in China’s manufacturing sector.
In terms of complex GVC participation, the regression coefficients of forward and backward complex GVC participation on carbon productivity are −1.7406 and −2.3931, which are both negatively correlated with carbon productivity at the 1% significance level. This indicates that increasing the level of complex GVC activity participation will inhibit the level of carbon productivity in China’s manufacturing industry. The possible reasons for this are that the products involved in complex GVC activities are mainly technology-intensive products with high technological content and involve the core technologies of the participating countries in the GVC. Given the weak industrial base of China’s manufacturing industry and the lack of independent R&D capabilities, enterprises participating in complex GVC activities in a forward-looking manner are vulnerable to technological blockade from developed countries. In addition, complex GVC production activities involve multiple value-added cross borders, and production activities that involve backward GVC participation tend to be more carbon-intensive. So, multiple value-added cross borders will exacerbate the inhibiting effect of backward GVC participation on carbon productivity, thus leading to lower carbon productivity levels.

5.2.2. Heterogeneity Analysis of Low- and Medium-Technology Sectors and High-Technology Sectors

Based on the previous analysis, it is clear that R&D investment plays a crucial role in value chain climbing and low-carbon development. Is there heterogeneity in the impact of GVC embedding on carbon productivity in industries of different technology levels? In this subsection, the overall sample is divided into two groups, low- and medium-technology industries and high-technology industries, based on the National Economic Classification Standard of GBT4574-2002. Heterogeneity characteristics of industries with different levels of technology are examined through regressions on the two data groups. The specific results are shown in Table 9.
In terms of low- and medium-technology sectors, the results in columns (1) to (2) of Table 9 reveal the regression coefficients are 0.2374 for forward GVC participation and 0.7703 for backward GVC participation. They are positively correlated with carbon productivity at the 1% significance level. A possible reason for this is that China’s low- and medium-technology industries are mainly labour- and capital-intensive industries. On the one hand, these industries can give full play to the comparative advantages of China’s factor endowments in GVC. And through the spillover effect of GVC, they can obtain a large amount of capital, advanced technology, and rich management experience. It is conducive to promoting the upgrading of China’s manufacturing industry production mode towards green and smart, thus enhancing carbon productivity. On the other hand, low- and medium-tech industries involve fewer core technologies of each country, and the technology blocking and capture effects resulting from deeper GVC participation are weaker. The result in column (3) of Table 9 shows that the GVC embedding position is positively associated with carbon productivity at the 1% significance level, which is generally consistent with the full sample findings.
In terms of high-tech industries, the result in column (4) of Table 9 shows that the regression coefficient of forward GVC participation is −8.0167, which is negatively correlated with carbon productivity at the 5% significance level. The result remains generally consistent with the full sample regression results. This may be due to the fact that enterprises participating in GVC activities in a forward-looking manner are very vulnerable to technological embargoes and suppression by developed countries and dominant transnational corporations. In high-technology industries, developed countries fear that their vested interests will be threatened. They will inevitably step up the suppression of developing countries. This will hurt developing countries’ profits and exacerbate the inhibitory effect of forward GVC participation on carbon productivity. The result in column (5) of Table 9 shows that the regression coefficient of backward GVC participation is −16.9561, which is significant at the 1% level of significance. It indicates that backward GVC participation is negatively correlated with carbon productivity in high-tech industries. This may be due to the fact that the backward GVC participation of firms in high-tech industries mainly relies on importing high-tech components from developed countries and then processing and assembling them to make a small profit. However, the trade model could easily lead to the capture of developing countries by developed countries. This forces developing countries to be locked into the lower end of the value chain, which is high in carbon emissions and low in profitability, thus discouraging the rise of carbon productivity levels. The result in column (6) of Table 9 shows that the regression coefficient of the GVC embedding position is not significant. This may be due to the fact that high-tech industries are mainly technology-intensive industries. With the GVC embedding position continuing to increase, firms move upstream towards GVC. However, due to China’s lack of independent R&D capability and technology embargo from developed countries, carbon productivity improvement is hindered. The results further illustrate the urgency of enhancing China’s manufacturing industry’s independent R&D capabilities and reducing dependence on foreign technology transfer. To achieve a low-carbon transformation of the manufacturing industry and to move up the value chain, the enhancement of independent innovation capabilities and the conquest of key technologies remain a top priority.

6. Conclusions and Policy Recommendations

This article explores the impact of GVC participation and GVC embedding position on carbon productivity in China’s manufacturing industries using panel data from 2006–2018, combining the moderating effects of industry digitisation, R&D investment, environmental regulation, and industrial structure upgrading, and further examines the heterogeneity of the impact of GVC embedding on carbon productivity. This article mainly draws the following conclusions and makes relevant recommendations.
First, in terms of the direct effect of forward and backward GVC participation on carbon productivity in China’s manufacturing industries, increasing forward and backward GVC participation will have a dampening effect on carbon productivity. At present, China’s manufacturing enterprises embedded in GVC based on the forward approach are limited by their technology level and are vulnerable to technology blockade from other countries. The intermediate products they provide to other countries are mainly energy-intensive products; thus, they have not yet achieved the carbon reduction effect. The backward approach to embedding GVC enterprises mainly relies on the processing of intermediate products from other countries to participate in trade activities. The “pollution sanctuary” effect is prominent. The trade model will easily lead to the capture of enterprises by developed countries, resulting in China’s manufacturing industry in the “low-end locking” dilemma. Therefore, the first step for China’s manufacturing industries to break through the technological blockade of other countries and break the low-end locking dilemma is still to enhance the ability of independent innovation, then promote enterprises to upgrade their processes and products, and accelerate the transformation of intermediate trade goods to green and clean products. It should give full play to the advantages of the domestic market, expand domestic market demand, and pull endogenous innovation represented by independent, collaborative, and integrated innovation. It can also promote the development of high-quality and diversified intermediate products, thereby enhancing product competitiveness, broadening domestic and international markets, and reducing the effect of technological blockade and capture.
Second, in terms of the direct effect of the GVC embedding position on carbon productivity in China’s manufacturing industries, raising the GVC embedding position can significantly increase the level of carbon productivity, and this marginal effect tends to increase and then decrease. Therefore, the GVC embedding position of the manufacturing industry should be raised, and the industries should be accelerated to the upstream end of low-pollution and high value-added. Currently, China’s manufacturing industry is actively taking advantage of low factor costs and has successfully integrated into the GVC production network, forming a global manufacturing base. Subsequently, the country’s non-core businesses and technologies should be gradually outsourced to enhance the attractiveness of the high-end segments of the manufacturing industry based on local high-end elements. The investment should be shifted to R&D design and marketing channel construction, becoming a self-designed developer and self-distributed seller, and realising the transformation of the value chain from process upgrading to product and function upgrading. When the overall capital and technology accumulation reaches a certain level, then the chain will be upgraded by its strength, thus completing the GVC upgrading process and realising the value chain climbing up to the top end.
Third, although the boosting impact of GVC embedding position on carbon productivity is strengthened by R&D investment, it cannot be effectively converted into technological progress, which leads to insufficient technological innovation capacity of enterprises, thus enhancing the inhibitory effect of forward and backward GVC participation on carbon productivity. Therefore, the allocation of technology R&D funds should be increased, and incentive policies such as funding subsidies and tax exemptions. Rewards for achievements should be implemented for green, clean, and high-tech R&D activities of enterprises so as to fully motivate enterprises to take the initiative to carry out independent R&D activities on green technologies. The utilisation rate of R&D funding to achieve an effective conversion from R&D investment to technological progress should also be improved, thereby reducing the moderating effect of R&D investment on forward and backward GVC participation in inhibiting carbon productivity.
Fourth, environmental regulation weakens the negative impact of backward GVC participation on carbon productivity. Therefore, environmental regulation policies should be strengthened to mitigate the “pollution shelter” effect caused by foreign investment and, at the same time, force domestic enterprises to upgrade their green technologies. On the one hand, green investments should be vigorously developed. The following should all be prioritized: the development of green technologies; the prioritization of investments in energy-saving, environmental protection, and green businesses; the promotion of the application and enforcement of green concepts throughout the design, production, and marketing of products; and obtaining carbon labelling green certification. On the other hand, an environmental regulation tool that integrates government and market is used through the power of the government to issue administrative directives for carbon reduction and pollution reduction. At the same time, we should give full play to the decisive role of the market in the allocation of green resources, increase public participation in environmental protection; strengthen communication between the government, enterprises, and the public; and achieve a positive interaction between the three.
Fifth, industrial structure upgrading strengthens the promotion effect of GVC embedding position on carbon productivity, but since the foundation of China’s manufacturing industry is relatively weak, blindly carrying out industrial structure upgrading may lead to unbalanced development of the industries, which makes the inhibitory effect of both forward and backward GVC participation on carbon productivity stronger. Therefore, to accelerate the optimisation and upgrading of industrial structure, on the one hand, we should identify the comparative advantages and work focus, increase reform and innovation, optimise industrial layout, coordinate the development of the three industries, and continue to grow the economy of the urban areas, the county economy, and the town and village economy. On the other hand, we should do better in industry, be stronger in agriculture, and be more active in the service industry, highlighting hydrogen energy, big data, new materials, and other emerging industries and cultivating new kinetic energy for high-quality economic development.
Sixth, industry digitisation attenuates the inhibitory effect of forward and backward GVC participation on carbon productivity in China’s manufacturing industries, but since the development of the digital economy requires a large amount of capital, blindly promoting the development of industry digitisation when the total amount of capital is certain may have some crowding-out effect on technological progress, thus attenuating the promotional effect of GVC embedding position enhancement on carbon productivity. Therefore, the digitisation of industry and digital industrialization should be further promoted, and the application of artificial intelligence, 5G, Internet, blockchain, and data mining in the manufacturing industry should be continuously strengthened so as to reduce the dependence of China’s manufacturing industry on traditional factors of production. The government should invest more in digitalisation, actively carry out research and development activities on high-end digital technologies, accelerate the diffusion of technology between industries, improve the efficiency of resource allocation, thereby promoting a more rationalised and advanced industrial structure, and actively exploit the carbon reduction effect brought about by the upgrading of the industrial structure and the digitalisation of industries in the process of CVC embedding.
Finally, heterogeneity analysis shows that the contribution of forward and backward GVC participation to carbon productivity is significant in low- and medium-tech manufacturing industries. Increasing forward simple GVC participation can raise carbon productivity levels. Complex GVC production activities are negatively correlated with carbon productivity because they involve multiple border crossings of value added and exacerbate negative impacts such as technological blockages, resulting in both forward and backward complex GVC participation being negatively correlated with carbon productivity. Therefore, the forward simple GVC participation of China’s manufacturing industries should be actively increased. The enterprises in low- and medium-technology industries should also be actively embedded in the GVC division of labour to increase their GVC participation so as to give full play to the GVC import learning effect. This can help enterprises acquire advanced technology and management experience from other countries, enhance the independent innovation capacity of enterprises, promote the progress of green technology in enterprises, and ultimately improve the efficiency of carbon production.

7. Future Study

This study explores the mechanisms by which forward and backward GVC participation, as well as GVC embedding position, affect carbon productivity in China’s manufacturing industries at both theoretical and empirical levels. To provide a different understanding and develop more comprehensive policy support for the coordinated development of global climate change governance and international trade, more explorations can be made in the following aspects.
First, due to the scarcity of input–output datasets, the study period for this work is limited to 2006–2018 in order to give a micro-understanding of the issue at the manufacturing industry level. With the update of relevant data in the future, more up-to-date or country-level macro analyses can be conducted.
Second, to measure the GVC embedded position, this research uses the GVC position index established by Wang et al. [51]. Although the procedure is reasonably mature and excellent, there are still many differences between it and the upstream and downstream locations in our real economy. There is still a need to collect and count the data of intermediate goods transactions between firms to recognise the position of firms in the production chain.
Finally, this article chooses carbon productivity as the subject of investigation so that it may fully weigh both economic benefits and environmental costs. Future research can try to study different aspects such as absolute carbon emissions, carbon total factor productivity, and so on.

Author Contributions

Conceptualization, J.C., S.Z. and X.M.; methodology, X.Z., Y.S. and Y.F.; software, Y.Y.; validation, J.C. and S.Z.; formal analysis, S.Z. and Y.Y.; investigation, X.Z., Y.S. and Y.F.; resources, J.C. and X.M.; data Curation, S.Z., X.Z. and Y.S.; writing—original draft preparation, J.C. and S.Z.; writing—review and editing, J.C., S.Z., X.M. and Y.Y.; visualization, S.Z., X.Z. and Y.S.; supervision, J.C. and X.M.; project administration, J.C. and X.M.; funding acquisition, J.C. and X.M., J.C., S.Z. and X.M. contributed equally to this work. All authors have read and agreed to the published version of the manuscript.

Funding

This research was supported by The National Social Science Fund of China, grant number [21&ZD148].

Institutional Review Board Statement

Not applicable.

Informed Consent Statement

Not applicable.

Data Availability Statement

The datasets used and/or analysed during the current study are available upon reasonable request.

Conflicts of Interest

The authors declare no conflict of interest.

References

  1. Zhang, Y.C.; Yuan, Z.H.; Ren, Q. Analysis of the current situation and paths of manufacturing transformation under the goals of carbon neutrality and carbon peaking. Trade Fair Econ. 2022, 19, 110–113. [Google Scholar] [CrossRef]
  2. Zhang, F.; Wang, S.Z.; Li, Y.H.; Yang, J.Q.; Sun, S.H. Analysis of CO2 emission and countermeasures and suggestions for emission reduction in Chinese manufacturing. Hua Kung Chin Chan. 2022, 41, 1645–1653. [Google Scholar] [CrossRef]
  3. Beinhocker, E.; Oppenheim, J.; Irons, B.; Lahti, M.; Farrell, D.; Nyquist, S.; Remes, J.; Naucler, T.; Enkvist, P. The Carbon Productivity Challenge: Curbing Climate Change and Sustaining Economic Growth. MGI 2008, 1–48. Available online: http://courseresources.mit.usf.edu/sgs/geb6930/module_2/read/carbon_productivity_challenge.pdf (accessed on 27 February 2023).
  4. Hummels, D.; Ishii, J.; Yi, K.M. The Nature and Growth of Vertical Specialization in World Trade. J. Int. Econ. 2001, 54, 75–96. [Google Scholar] [CrossRef]
  5. Koopman, R.; Powers, W.; Wang, Z.; Wei, S.J. Give Credit where Credit is Due: Tracing Value Added in Global Production Chains. In NBER Working Paper; National Bureau of Economic Research: Cambridge, MA, USA, 2010. [Google Scholar] [CrossRef]
  6. Koopman, R.; Wang, Z.; Wei, S.J. Tracing value-added and double counting in gross exports. Am. Econ. Rev. 2014, 104, 459–494. [Google Scholar] [CrossRef]
  7. Wang, Z.; Wei, S.J.; Yu, X.; Zhu, K. Measures of Participation in Global Value Chain and Global Business Cycles. In NBER Working Paper; National Bureau of Economic Research: Cambridge, MA, USA, 2017. [Google Scholar] [CrossRef]
  8. Lyu, Y.; Huang, Y.X.; Chen, Y.B. The effect of global value chain embeddedness on productivity: An analysis of its impact and mechanism. World Econ. 2017, 40, 28–51. [Google Scholar] [CrossRef]
  9. Cheng, Z.H.; Li, L.S. Global value chain embedding and green growth of China’s manufacturing industry. Stud. Sci. Sci. 2021, 39, 822–832. [Google Scholar] [CrossRef]
  10. Peng, S.J.; Zhang, W.C.; Sun, C.W. China’s production-based and consumption-based carbon emissions and their determinants. Econ. Res. J. 2015, 50, 168–182. Available online: https://www.nssd.cn/9315e255-ddb4-4241-9e35-5c41f0608e38 (accessed on 1 March 2023).
  11. Wang, X.J.; Yang, L.K.; Qian, Z.Q. Transformation of export structure, upgrading of export sophistication and carbon emission from China’s manufacturing: Under the perspective of global value chain. Ind. Econ. Rev. 2017, 8, 5–16. [Google Scholar] [CrossRef]
  12. Zhang, H.; Wei, X.P. Green paradox or forced emission-reduction: Dual effect of environmental regulation on carbon emissions. China Popul. Res. Environ. 2014, 24, 21–29. [Google Scholar] [CrossRef]
  13. Liu, C.Y.; Xu, Y.Z. A study of the drivers of carbon productivity rendition in China: A sectoral perspective. J. Chin Univ. Geosci. (Soc. Sci. Edit.) 2016, 16, 45–54. [Google Scholar] [CrossRef]
  14. Li, B.M.; Wan, S.P.; Jiang, C.T. Research on the threshold effect of carbon emission reduction from the perspective of global value chain embeddedness. Commer. Sci. Res. 2020, 27, 86–97. Available online: http://qikan.cqvip.com/Qikan/Article/Detail?id=7102030334 (accessed on 3 March 2023).
  15. Wang, T.; Zhao, J.; Jiang, W. Research on the GVC position of China’s manufacturing industry. Sci. Technol. Manag. Res. 2017, 37, 129–138. [Google Scholar] [CrossRef]
  16. Peng, X.; Li, B. The study on economic carbon emissions effect of China’s embedding in the manufacturing sector under global value chain perspective. Financ. Trade Res. 2013, 24, 18–26. [Google Scholar] [CrossRef]
  17. Cai, L.H.; Zhang, Z.; Zhu, L. Global value chain embeddedness and carbon dioxide emissions: An empirical study based on panel data of China’s industries. J. Int. Trade 2020, 448, 86–104. [Google Scholar] [CrossRef]
  18. Xie, H.Q.; Huang, L.Y.; Liu, D.D. Does GVC participation increase Chinese manufacturing’s carbon productivity? J. Int. Trade 2018, 432, 109–121. [Google Scholar] [CrossRef]
  19. Sun, H.P.; Du, X.M. The impact of global value chains’ participation degree and position on industrial carbon productivity. Chin. Popul. Res. Environ. 2020, 30, 27–37. [Google Scholar] [CrossRef]
  20. Zhang, Q.; Yu, J.P. Input digitization and climbing global value chain: Micro evidence from Chinese manufacturing enterprises. Econ. Rev. 2020, 226, 72–89. [Google Scholar] [CrossRef]
  21. Gao, P.; Yue, S.J. Does global value chain embedding reduce the embodied carbon emissions of China’s industry sectors: On the moderating effect of industrial digitization. J. Int. Trade 2022, 475, 53–67. [Google Scholar] [CrossRef]
  22. Yu, S.; Fan, X.F.; Jiang, H.W. Research on the impact of digital economy development on carbon productivity improvement. J. Stat. Inf. 2022, 37, 26–35. [Google Scholar] [CrossRef]
  23. Bai, J.H.; Yu, X.W. The impact of global value chain embedment on energy conservation and emissions reduction: Theory and empirical evidence. Financ. Trade Econ. 2022, 43, 144–159. [Google Scholar] [CrossRef]
  24. Li, Y.; Li, J.W.; Wang, W.H.; Huang, Q.B. Effect and mechanism of global value chain embedding on carbon emission efficiency: Evidence and implications from the manufacturing industries in the Belt and Road countries. Chin. Popul. Res. Environ. 2021, 31, 15–26. [Google Scholar] [CrossRef]
  25. Shi, Q.L.; Shan, Y.S.; Zhong, C.; Ye, C.; Xue, R. How would GVCs participation affect carbon intensity in the “Belt and Road Initiative” countries? Energy Econ. 2022, 111, 106075. [Google Scholar] [CrossRef]
  26. Zhao, Y.H.; Zheng, L.; Liu, S.C. Impact of participating in global value chains on carbon emissions embodied in China’s exports. J. Int. Trade 2021, 459, 142–157. [Google Scholar] [CrossRef]
  27. Liu, Y.; Zhang, J.; Geng, Y. Exports and carbon emissions from the perspective of global value chains re-examination of the inverted U-shaped relationship. J. Int. Trade 2023, 481, 90–107. [Google Scholar] [CrossRef]
  28. Fu, Y.H.; Lin, J.W. Interaction mechanism between FDI and OFDI and the improvement of economic growth quality: Analysis based on the effect of technological progress in narrow sense and resource allocation. Chin. Soft Sci. 2021, 362, 133–150. [Google Scholar] [CrossRef]
  29. Humphrey, J.; Schmitz, H. How does insertion in global value chains affect upgrading in industrial clusters? Reg. Stud. 2002, 36, 1017–1027. [Google Scholar] [CrossRef]
  30. Humphrey, J.; Schmitz, H. Governance in global value chains. IDS Bull. 2001, 32, 19–29. [Google Scholar] [CrossRef]
  31. Song, L.S.; Su, N. Government R&D funding, enterprise R&D investment and technological innovation efficiency. Econ. Manag. 2017, 31, 45–51. [Google Scholar] [CrossRef]
  32. Lindner, I.; Strulik, H. Innovation and inequality in a small world. Int. Econ. Rev. 2020, 61, 683–719. [Google Scholar] [CrossRef]
  33. Zhang, X.; Li, R.; Zhang, J.L. The diminishing marginal contribution of R&D investment on green technological progress: A case study of China’s manufacturing industry. Environ. Sci. Pollut. Res. 2023, 30, 14190–14199. [Google Scholar] [CrossRef]
  34. Fan, J.D.; Teo, T. Will China’s R&D investment improve green innovation performance? An empirical study. Environ. Sci. Pollut. Res. 2022, 29, 39331–39344. [Google Scholar] [CrossRef]
  35. Daniel, S.C. Sunk costs of R&D, trade and productivity: The molds industry case. Econ. J. 2017, 127, 1626–1664. [Google Scholar] [CrossRef]
  36. Zhao, Y.M.; Zhu, F.M.; He, L.L. Definition classification and evolution of environmental regulations. China Popul. Res. Environ. 2009, 19, 85–90. [Google Scholar] [CrossRef]
  37. Wang, B.; Wu, Y.R.; Yan, P.F. Environmental regulation and total factor productivity growth: An empirical study of the APEC economies. Econ. Res. J. 2008, 5, 19–32. [Google Scholar]
  38. Shen, K.R.; Jin, G.; Fang, X. Does environmental regulation cause pollution to transfer nearby? Econ. Res. J. 2017, 52, 44–59. [Google Scholar]
  39. Fan, D.; Fu, J.W.; Wang, W.G. How does carbon emission trading influence firm’s total factor productivity? Syst. Eng. -Theory Pract. 2022, 42, 591–603. [Google Scholar] [CrossRef]
  40. Yuan, Y.J.; Xie, R.H. Research on the effect of environmental regulation industrial restructuring: Empirical test based on provincial panel data of China. Chin. Ind. Econ. 2014, 317, 57–69. [Google Scholar] [CrossRef]
  41. Zhao, R.R.; Han, M.M.; Shen, C.M. The impact of global value chain embeddedness on industrial structure upgrading: Analysis of regional heterogeneity based on China’s provincial panel data. Commer. Res. 2023, 537, 1–10. [Google Scholar] [CrossRef]
  42. Wu, L.; Sun, L.; Qi, P.; Ren, X.; Sun, X. Energy endowment, industrial structure upgrading, and CO2 emissions in China: Revisiting resource curse in the context of carbon emissions. Res. Pol. 2021, 74, 102329. [Google Scholar] [CrossRef]
  43. Li, W.; Wang, W.; Wang, Y.; Qin, Y. Industrial structure, technological progress and CO2 emissions in China: Analysis based on the STIRPAT framework. Nat. Hazards 2017, 88, 1545–1564. [Google Scholar] [CrossRef]
  44. Gong, M.; Liu, H. China’s two-way FDI coordinated development, industrial structure evolution and environmental pollution. Intl. Trade Issues 2020, 2, 110–124. [Google Scholar] [CrossRef]
  45. Stone, S.; Mikie, M.; Agyeben, M.; Anukoonwattaka, W.; Duval, Y.; Heal, A.; Kim, S.H.; Proksch, M.; Ratna, R.S.; Saggu, A.; et al. Asia-Pacific Trade and Investment Report 2015: Supporting Participation in Value Chains; UN ESCAP: Bangkok, Thailand, 2015. [Google Scholar] [CrossRef]
  46. Ma, X.J.; Li, Y.C.; Fu, Y.; Liu, S.M. Impact of digital economy on industrial structure upgrading from the perspective of spatial effect. J. Stat. Inf. 2022, 37, 14–25. [Google Scholar]
  47. Li, Y.; Sun, H.Y.; Huang, J.C.; Huang, Q.B. Low-end lock-in of Chinese equipment manufacturing industry and the global value chain. Sustainability 2020, 12, 2981. [Google Scholar] [CrossRef]
  48. Jiang, Y.; Wang, Q.; Yang, X. Global value chain embedding, digital economy and industrial upgrading: A research based on panel data of Chinese cities. J. Lanzhou Univ. (Soc. Sci.) 2021, 49, 40–55. [Google Scholar] [CrossRef]
  49. Yang, X.; Li, X.P.; Zhou, D.C. Study on the difference and convergence of carbon productivity in Chinese manufacturing. J. Quant. Technol. Econ. 2015, 32, 3–20. [Google Scholar] [CrossRef]
  50. Fally, T. Production Staging: Measurement and Facts. Univ. Colo. -Boulder 2012, 155–168. Available online: https://www.researchgate.net/publication/266167928_Production_Staging_Measurement_and_Facts (accessed on 13 March 2023).
  51. Wang, Z.; Wei, S.J.; Yu, X.; Zhu, K. Characterizing Global Value Chains: Production Length and Upstreamness. In NBER Working Paper; National Bureau of Economic Research: Cambridge, MA, USA, 2017. [Google Scholar] [CrossRef]
  52. Shan, Y.; Huang, Q.; Guan, D.; Hubacek, K. China CO2 emission accounts 2016–2017. Sci. Data 2020, 7, 54. [Google Scholar] [CrossRef]
  53. Hansen, B.E. Threshold effect in non-dynamic panels: Estimation, testing and inference. J. Econ. 1999, 93, 345–368. [Google Scholar] [CrossRef]
Figure 1. Research framework. Source: Author’s processing.
Sustainability 15 13272 g001
Figure 2. The plot of GVC embedding position double threshold likelihood ratio function. The two graphs show the estimates corresponding to the thresholds of 8.5329 and 8.5912, respectively. Source: Author’s own processing.
Sustainability 15 13272 g002
Figure 3. Inverted U-shaped relationship versus change in marginal effects. The slopes of the curves at points A, B, C, D, O, and O’ change significantly. Source: Author’s own processing.
Sustainability 15 13272 g003
Table 1. Variable index and descriptive statistics results.
Variable NameVariable IndexObservationsMeanStdMinMdMax
Carbon productivitycp1692.024.440.010.3525.92
Forward GVC participationlnFO169−2.030.58−3.40−1.88−1.22
Backward GVC participationlnBA169−1.810.39−2.56−1.85−0.93
GVC embedding positionGVCPs1698.512.095.908.1015.97
Environmental regulationER1690.470.800.050.215.88
R&D investmentlnRD16914.481.3910.3714.7016.81
Upgrading of industrial structureCYJG16946.723.6441.8045.5052.20
Digitalisation of industryDA1699.967.201.437.9124.90
Energy structureES1690.540.510.010.422.47
Energy efficiencyEE1695.516.610.242.2825.54
Industry structureIS1697.635.290.367.5821.00
Source: Author’s own processing.
Table 2. Effect of forward and backward GVC participation and embedding position on carbon productivity.
Variable(1)(2)(3)(4)(5)
cpcpcpcpcp
lnFO−0.5140 ***----
(−6.8000)----
lnBA-−0.2184 ***---
-(−3.0100)---
GVCPs--0.3309 ***1.2673 ***-
--(17.7700)(7.5900)-
GVCPs2-- −0.0488 ***-
-- (−6.7500)-
GVCPs < 8.5329----1.1110 ***
----(2.6700)
8.5329 ≤ GVCPs ≤ 8.5912----2.9051 ***
----(6.7900)
GVCPs > 8.5912----1.5781 ***
----(4.2100)
ES0.0880 ***−0.1688 ***0.02270.2762 ***−3.1898 **
(2.9500)(−4.0400)(0.6900)(4.2900)(−2.3900)
EE0.1120 ***−0.02490.1624 ***0.2592 ***0.7743 ***
(9.7400)(−1.5300)(14.1900)(21.4700)(11.9300)
IS−0.0041−0.0315 ***0.00330.0114−0.3406 **
(−0.6500)(−3.7000)(0.8900)(1.0800)(−2.4700)
Constant4.81730.0000−4.2537 ***−8.7228 ***−9.2625 ***
(1.0100)(.)(−5.6900)(−7.6300)(−2.7500)
Observations169169169169169
Ind FE-
Year FE-
The tables in brackets are standard errors; **, *** are significant under the conditions of 5% and 1%, respectively; √ indicates yes. Source: Author’s own processing.
Table 3. Threshold effect test for GVC embedding position.
ThresholdRSSMSEFstatBootstrapProbCrit10Crit5Crit1
Single435.53112.791944.470010000.040030.516239.897976.2220
Double351.99612.256437.020010000.088035.510954.7691108.5919
Triple280.60401.798739.690010000.3910154.2105202.7095405.5639
Bootstrap 1000 times to obtain p-values and thresholds using the bootstrap method. Source: Author’s own processing.
Table 4. GVC embedding position threshold estimation result.
ModelThresholdLowerUpper
Th-18.53298.44418.5912
Th-28.59127.19328.6226
Source: Author’s own processing.
Table 5. Robustness test results.
VariableNon-Parametric Covariance Matrix Estimation MethodSubstitution of the Dependent Variable cp*
(1)(2)(3)(4)(5)(6)
lnFO−3.9282 ***--−1.3270 ***--
(−3.7900)--(−9.5300)--
lnBA-−4.7437 *--−1.8238 ***-
-(−2.0200)--(−7.1400)-
GVCPs--2.2407 **--0.4893 ***
--(2.8400)--(11.1900)
Constant−9.2718 *−9.0923−18.2215 *2.2291−1.7254−2.0811 ***
(−2.0100)(−1.6100)(−2.1700)(0.4100)(−1.4200)(−2.8500)
Observations169169169169169169
Control variables
Ind FE
Year FE
The tables in brackets are standard errors; *, **, *** are significant under the conditions of 10%, 5%, and 1%, respectively; √ indicates yes. Source: Author’s own processing.
Table 6. Regression results for instrumental variable 2SLS.
VariablePhase I ReturnPhase II Return
lnFOlnBAGVCPscpcpcp
FO3.8207 ***-----
(13.1800)-----
BA-3.7759 ***----
-(22.1500)----
L.GVCPs--0.6955 ***---
--(10.1800)---
lnFO---−11.7923 ***--
---(−4.3800)--
lnBA----−4.1167 *-
----(−1.8200)-
GVCPs-----3.5562 ***
-----(5.3900)
Constant−2.2718 ***−2.24412.1957 ***−15.5181 ***−5.7251−23.6827
(−25.2500)(−42.8100)(4.3000)(−3.8400)(−1.5700)(−5.0200)
---{16.3800}{16.3800}{16.3800}
Observations169169156169169156
R-squared---0.81870.83640.8601
Control variables
Ind FE
Year FE
The tables in brackets are standard errors; *, *** are significant under the conditions of 10% and 1%, respectively; √ indicates yes. Source: Author’s own processing.
Table 7. Moderating effects of GVC embedding on carbon productivity.
Variable(1)Variable(2)Variable(3)
cpcpcp
lnFO−0.7658 ***lnBA−2.7852 ***GVCPs0.4619 ***
(−5.3600)(−31.2100)(23.6000)
lnFO× lnRD−0.1347 ***lnBA × lnRD−0.2024 ***GVCPs × lnRD0.0283 **
(−4.5400)(−3.8200)(3.5100)
lnRD0.0940 *lnRD0.0574 *lnRD−0.1252 ***
(1.9200)(1.7800)(−7.8300)
lnFO × ER−0.0001lnBA × ER0.0001 *--
(−0.9500)(1.7000)-
ER−0.0741ER0.1490 ***ER0.2713 ***
(−0.9300)(4.3300)(30.0400)
lnFO × CYJG−0.1362 ***lnBA × CYJG−0.2881 ***GVCPs × CYJG0.0166 ***
(−7.6700)(−9.7700)(3.9100)
CYJG−0.6170 **CYJG−0.3913 ***CYJG−0.3104 ***
(−1.7200)(−19.1500)(−21.6100)
lnFO × DA0.0693 ***lnBA × DA0.2528 ***GVCPs × DA−0.0303 ***
(5.2600)(17.1500)(−15.8800)
DA0.0586DA0.3322 ***DA0.3184 ***
(0.2200)(51.3800)(69.0500)
Constant0.0000Constant9.0209 ***Constant8.6184 ***
(.)(4.0600)(9.9400)
Observations169Observations169Observations169
Control variablesControl variablesControl variables
Ind FEInd FEInd FE
Year FEYear FEYear FE
The tables in brackets are standard errors; *, **, *** are significant under the conditions of 10%, 5%, and 1%, respectively; √ indicates yes. Source: Author’s own processing.
Table 8. Impact of simple GVC and complex GVC activity participation on carbon productivity.
Variable(1)(2)
cpcp
lnGVC_Pat_f_simple1.3081 ***-
(5.1100)-
lnGVC_Pat_f_complex−1.7406 ***-
(−5.4400)-
lnGVC_Pat_b_simple-−0.4247 ***
-(−14.5000)
lnGVC_Pat_b_complex-−2.3931 ***
-(−15.6400)
Constant11.5840 ***18.4742 ***
(9.1100)(5.1000)
Observations169169
Control variables
Regulating variables
Ind FE
Year FE
The tables in brackets are standard errors; *** is significant under the conditions of 1%, respectively; √ indicates yes. Source: Author’s own processing.
Table 9. Industrial heterogeneity regression results.
VariableLow- and Medium-Technology IndustriesHigh-Technology Industries
(1)(2)(3)(4)(5)(6)
lnFO0.2374 ***--−8.0167 **--
(6.0200)--(−2.0200)--
lnBA-0.7703 ***--−16.9561 ***-
-(7.4900)--(−2.6800)-
GVCPs--0.0779 ***--0.0554
--(3.6000)--(0.0700)
Constant0.00670.8599 ***−0.6055−19.8874 **−19.3316 **−7.4104
(0.0400)(4.3000)(−1.2200)(−2.4700)(−1.9800)(−0.8100)
Observations117117117525252
Control variables
Ind FE
Year FE
The tables in brackets are standard errors; **, *** are significant under the conditions of 5% and 1%, respectively; √ indicates yes. Source: Author’s own processing.
Disclaimer/Publisher’s Note: The statements, opinions and data contained in all publications are solely those of the individual author(s) and contributor(s) and not of MDPI and/or the editor(s). MDPI and/or the editor(s) disclaim responsibility for any injury to people or property resulting from any ideas, methods, instructions or products referred to in the content.

