Article

Comparing Darcy’s Law and the Brinkman Equation for Numerical Simulations of Saltwater Intrusion

School of Engineering and Built Environment, Griffith University, Gold Coast, QLD 4222, Australia
*
Author to whom correspondence should be addressed.
Sustainability 2023, 15(18), 13287; https://doi.org/10.3390/su151813287
Submission received: 7 August 2023 / Revised: 28 August 2023 / Accepted: 31 August 2023 / Published: 5 September 2023

Abstract

:
Saltwater intrusion into coastal aquifers presents a significant global challenge to fresh groundwater resources. Numerical modelling represents a valuable tool to study this phenomenon. Darcy’s Law is widely applied to groundwater studies and is extended into the Brinkman Equation to account for kinetic dissipations due to viscous shear. However, their comparative performance and accuracy in density-driven flows remain unclear. To determine the circumstances where the Brinkman Equation is required, numerical simulations with both models were implemented in hypothetical coastal aquifer scenarios. The results revealed that the largest discrepancies between the two models occur inside the dispersion zone during the break-through period, with concentration differences of up to 2.5%. The mixing of freshwater and saltwater induces rapid density and velocity variations. Brinkman’s viscous term moderates the rate of change and decreases the intrusion length by up to 6.1 m in a 180 m intrusion case. Furthermore, higher permeability and a lower recharge rate both strengthen the viscous effects in most sandy coastal aquifers. The Brinkman Equation excels at capturing intricate flow patterns with large variations. Therefore, it is necessary to be employed for studies on freshwater–saltwater interfaces and other similar conditions including groundwater–surface water interfaces, non-isothermal flows, and complex geological conditions.

1. Introduction

Coastal catchments, although covering less than 15% of the world’s land area, accommodate 40% of the world’s population [1]. Given the urbanization of coastal cities, the availability and quality of freshwater resources play a crucial role in maintaining sustainable coastal developments. However, the pervasive issue of seawater intrusion poses a significant challenge to coastal aquifers worldwide. This phenomenon occurs when excessive saline groundwater infiltrates landward and is primarily caused by massive groundwater exploitation and varying coastal environmental conditions. Moreover, the escalating impacts of climate change, such as sea level rise and prolonged droughts, are expected to further aggravate seawater intrusion [2,3]. Consequently, freshwater bodies, including wells, coastal lakes, and reservoirs, are at risk of contamination through active interactions with saline groundwater [4].
Extensive research has been conducted since the 1950s to better understand the physical processes associated with seawater intrusion. Analytical approaches were engaged [5,6,7], mostly with simplifying assumptions and approximations, including steady conditions, sharp interfaces, the Ghyben–Herzberg Approximation [8], and the Dupuit Approximation [9]. These estimations were robust but suitable as an easy way to validate numerical models [10,11]. Laboratory-scale experiments, such as flume apparatus [12,13] and Hele-Shaw cells [14], offered the straightforward observation of propagation processes but with limited controls. Furthermore, numerical models have emerged as an effective approach for investigating groundwater dynamics, especially for density-dependent flows [15,16], as they are flexible for a wide range of applications and offer more detailed insights. Henry [17] developed steady-state solutions for a 2D seawater intrusion model that subsequently served as a benchmark for the evaluation of seawater intrusion models. Various modelling packages have been developed using different numerical techniques, including the finite element method (FEM) [13,18], finite difference method (FDM) [19,20], and spectral method [21]. The vulnerability and sustainability of groundwater facing saltwater intrusion can be predicted via the models [22], and numerical models have therefore become an increasingly important decision support tool for sustainable coastal planning and management [4,23].
In groundwater flow modelling, understanding theoretical foundations and governing equations is crucial. A large number of models for saltwater intrusion apply the fundamental equation of Darcy’s Law [24] to describe saturated groundwater flow. Darcy’s Law is an empirical law that indicates the linear relationship between the flow rate and pressure gradients. However, it overlooks kinetic energy contributions as the flow in porous media typically moves at low velocities [9]. To address this limitation, the Brinkman Equation was developed to account for the kinetic dissipation induced by viscous shear [25]. A Laplacian term analogous to that in the Navier–Stokes Equation was added to include drag force and frictional force in the system. As a result, the Brinkman Equation provides a more comprehensive framework for modelling flow in porous media [26]. This versatility allows for the simulation of porous media flow in conjunction with neighbouring free-flowing fluids [27,28]. Through incorporating the Brinkman Equation, researchers can capture the effects of both viscous shear and permeability variations, enhancing the accuracy and applicability of the models in simulating complex groundwater flow scenarios.
Researchers have made efforts toward discovering the validity and applicability of the Brinkman Equation. Tam [29] pointed out that the ratio of the spatial length scale and permeability could determine whether the viscous term could be neglected. Auriault et al. [30] used asymptotic expansions to reveal that the Brinkman term is essential with a poor separation of scales, whereas Darcy’s Law is robust for most macroscopically homogeneous porous media under a high pressure gradient. Additional research has highlighted that porosity plays an important role in influencing velocity variations [31,32]. Ehlers [27] affirmed the applicability of the Brinkman Equation for both low and high permeabilities, particularly in situations where there is a transition from porous media flow to free flow. However, it is worth noting that existing studies have not thoroughly addressed the effects of density gradients and salinity, which can also increase viscous dissipation. Despite the potential benefits the Brinkman Equation offers to coastal models, seawater intrusion studies have rarely incorporated it thus far.
The mass transfer theory for porous media is also fundamental to analysing saltwater intrusion problems. Approaches employed in this field include analytical methods [33,34], the boundary element method (BEM) [35], and the FEM [36,37]. The FEM cannot reach the accuracy of analytical solutions or the BEM, but it offers the widest application. COMSOL Multiphysics [38] is one of the finite-element modelling packages that is widely utilized for solving various partial differential equations in engineering fields [21,36,37]. It features high flexibility in combining different physics as required in complex problems like saltwater intrusion.
In the present study, the saltwater intrusion in a tidal-driven coastal aquifer was investigated using the FEM modelling tool, COMSOL Multiphysics 5.6. A numerical comparative analysis was completed to determine the situations in which the Brinkman Equation may provide more reliable results compared to Darcy’s Law in saltwater intrusion simulations. The objectives of this study include (i) comparing saltwater–freshwater interfaces and the progression of intrusion in different scenarios to evaluate the conditions that necessitate the Brinkman Equation and (ii) investigating the relevant parameters and establishing guidelines for future studies on saltwater intrusion. The significance of this work lies in its contribution to advancing our understanding of saltwater intrusion phenomena and the associated modelling approaches. Our findings offer valuable insights for both researchers and practitioners seeking to model and manage saltwater intrusion scenarios. This work bridges the gap between theoretical modelling and practical applications through offering a rigorous evaluation of techniques that are essential for informed decision-making and the sustainable management of water resources in coastal regions.

2. Materials and Methods

For comparative analysis, porous flow models of Darcy’s Law and the Brinkman Equation were developed for seawater intrusion in a coastal aquifer. Figure 1 depicts the configuration of the simulated problem, where seawater invades a confined aquifer and generates a saltwater wedge beneath the fresh groundwater. The subsurface porous media flow and solute transport were incorporated, using a finite element analysis platform for multi-physics coupling [38]. Both numerical models were validated against the analytical solutions developed by Bear and Cheng [9].

2.1. Numerical Models

Darcy [24] conducted various filter experiments and concluded the linear relationship between the seepage pace and pressure gradients. Neglecting gravitational forces, Darcy’s Law can be expressed as
p = μ κ   u ,
where u is Darcy’s fluid velocity, p is the intrinsic fluid pressure, μ is the fluid dynamic viscosity, and κ is the aquifer permeability.
Following this, Brinkman [25] attempted to define the viscous force exerted on porous media flow. Analogous to the momentum balance in the Navier–Stokes Equation of a viscous free fluid flow, a Laplace term was added to Darcy’s Law, such that
p = μ κ   u + μ ˜   2 u ,
where the coefficient μ ˜ is an effective viscosity. Brinkman did not identify the difference between μ ˜ and μ . In comparing Darcy’s Law (Equation (1)) and the Brinkman Equation (Equation (2)), the objective is to identify the situations where the additional viscous term in the Brinkman Equation becomes crucial. The second term in Equation (2) represents this additional viscous term.
Studies showed that the importance of the second term increases as the permeability ( κ ) of the porous media increases. According to Nield and Bejan [26], the Brinkman Equation can be reduced to Darcy’s Law when the hydraulic conductivity tends to zero ( K 0 ) and can be reduced to the Navier–Stokes Equation when K . In this way, it is possible to simulate the porous media flow with adjacent free fluid. Moreover, the coefficient μ ˜ in the Brinkman Equation represents an effective viscosity, which distinguishes it from the coefficient μ in Darcy’s Law. Bear and Bachmat [39] introduced the ratio μ ˜ / μ = 1 / ε τ for isotropic media using an averaging approach. Here, ε represents the porosity of the porous media, and τ represents the tortuosity. This ratio depends on the geometry of the porous media. Additionally, from Equation (2), it is evident that the variations in velocity play a significant role. The Brinkman Equation accounts for the effects of velocity variations, which makes it a suitable choice for capturing the behaviour of fluid flow in porous media.
Taking the inertial terms and gravity into consideration, the conservation of momentum for Darcy’s Law and Brinkman Equation can be written in Equations (3) and (4), respectively. The porous media fluid motion can be solved through combining each of them with Equation (5), the continuity equation [38].
u = κ μ ( p + ρ g ) ,
ρ ε ( u t + ( u ) u ε ) = p + [ μ ε ( u + ( u ) T ) 2 3 μ ε ( u ) I ] ( μ κ + Q m ε 2 ) u + ρ g ,  
t ( ρ ε ) + ( ρ u ) = Q m ,  
where ρ is the fluid density, ε is the aquifer porosity, and Q m is the mass source or sink in kg/(m3 s).
For both methods, the governing equations for salt movement were based on the advection–dispersion equation [38]. As shown in Equation (6), both the convection and dispersion of solute transport in porous media were considered:
( ε c ) t + · ( D c ) + u · c = 0 ,
D = ε τ D F + D D ,
where c is the solute concentration, D F is the fluid diffusion coefficient, and D D is the dispersion coefficient. In a 2D model, the dispersivity tensor components are [9]
D D i i = α L u i 2 | u | + α T u i 2 | u | ,  
D D i j = D D j i = ( α L + α T ) u i u j | u | ,
where α L and α T are the longitudinal and transverse dispersivity, respectively. The relation between fluid concentration and its density follows a linear scheme [38]:
ρ = ρ f + ρ s ρ f c s c f ( c c f ) ,
where ρ f and ρ s are the density of freshwater and saltwater, and c f and c s are the concentration of freshwater and saltwater, respectively.
The numerical models are computed via combining Equation (3) or Equation (4) with Equations (5)–(10). The equations reflect that, apart from the properties of the porous medium, density variations also play an important part in the results. In this study, the numerical models were established using COMSOL Multiphysics 5.6 and have the flexibility to combine the flow field and solute transport. The above partial differential equations were solved with the implicit FEM.

2.2. Analytical Solutions

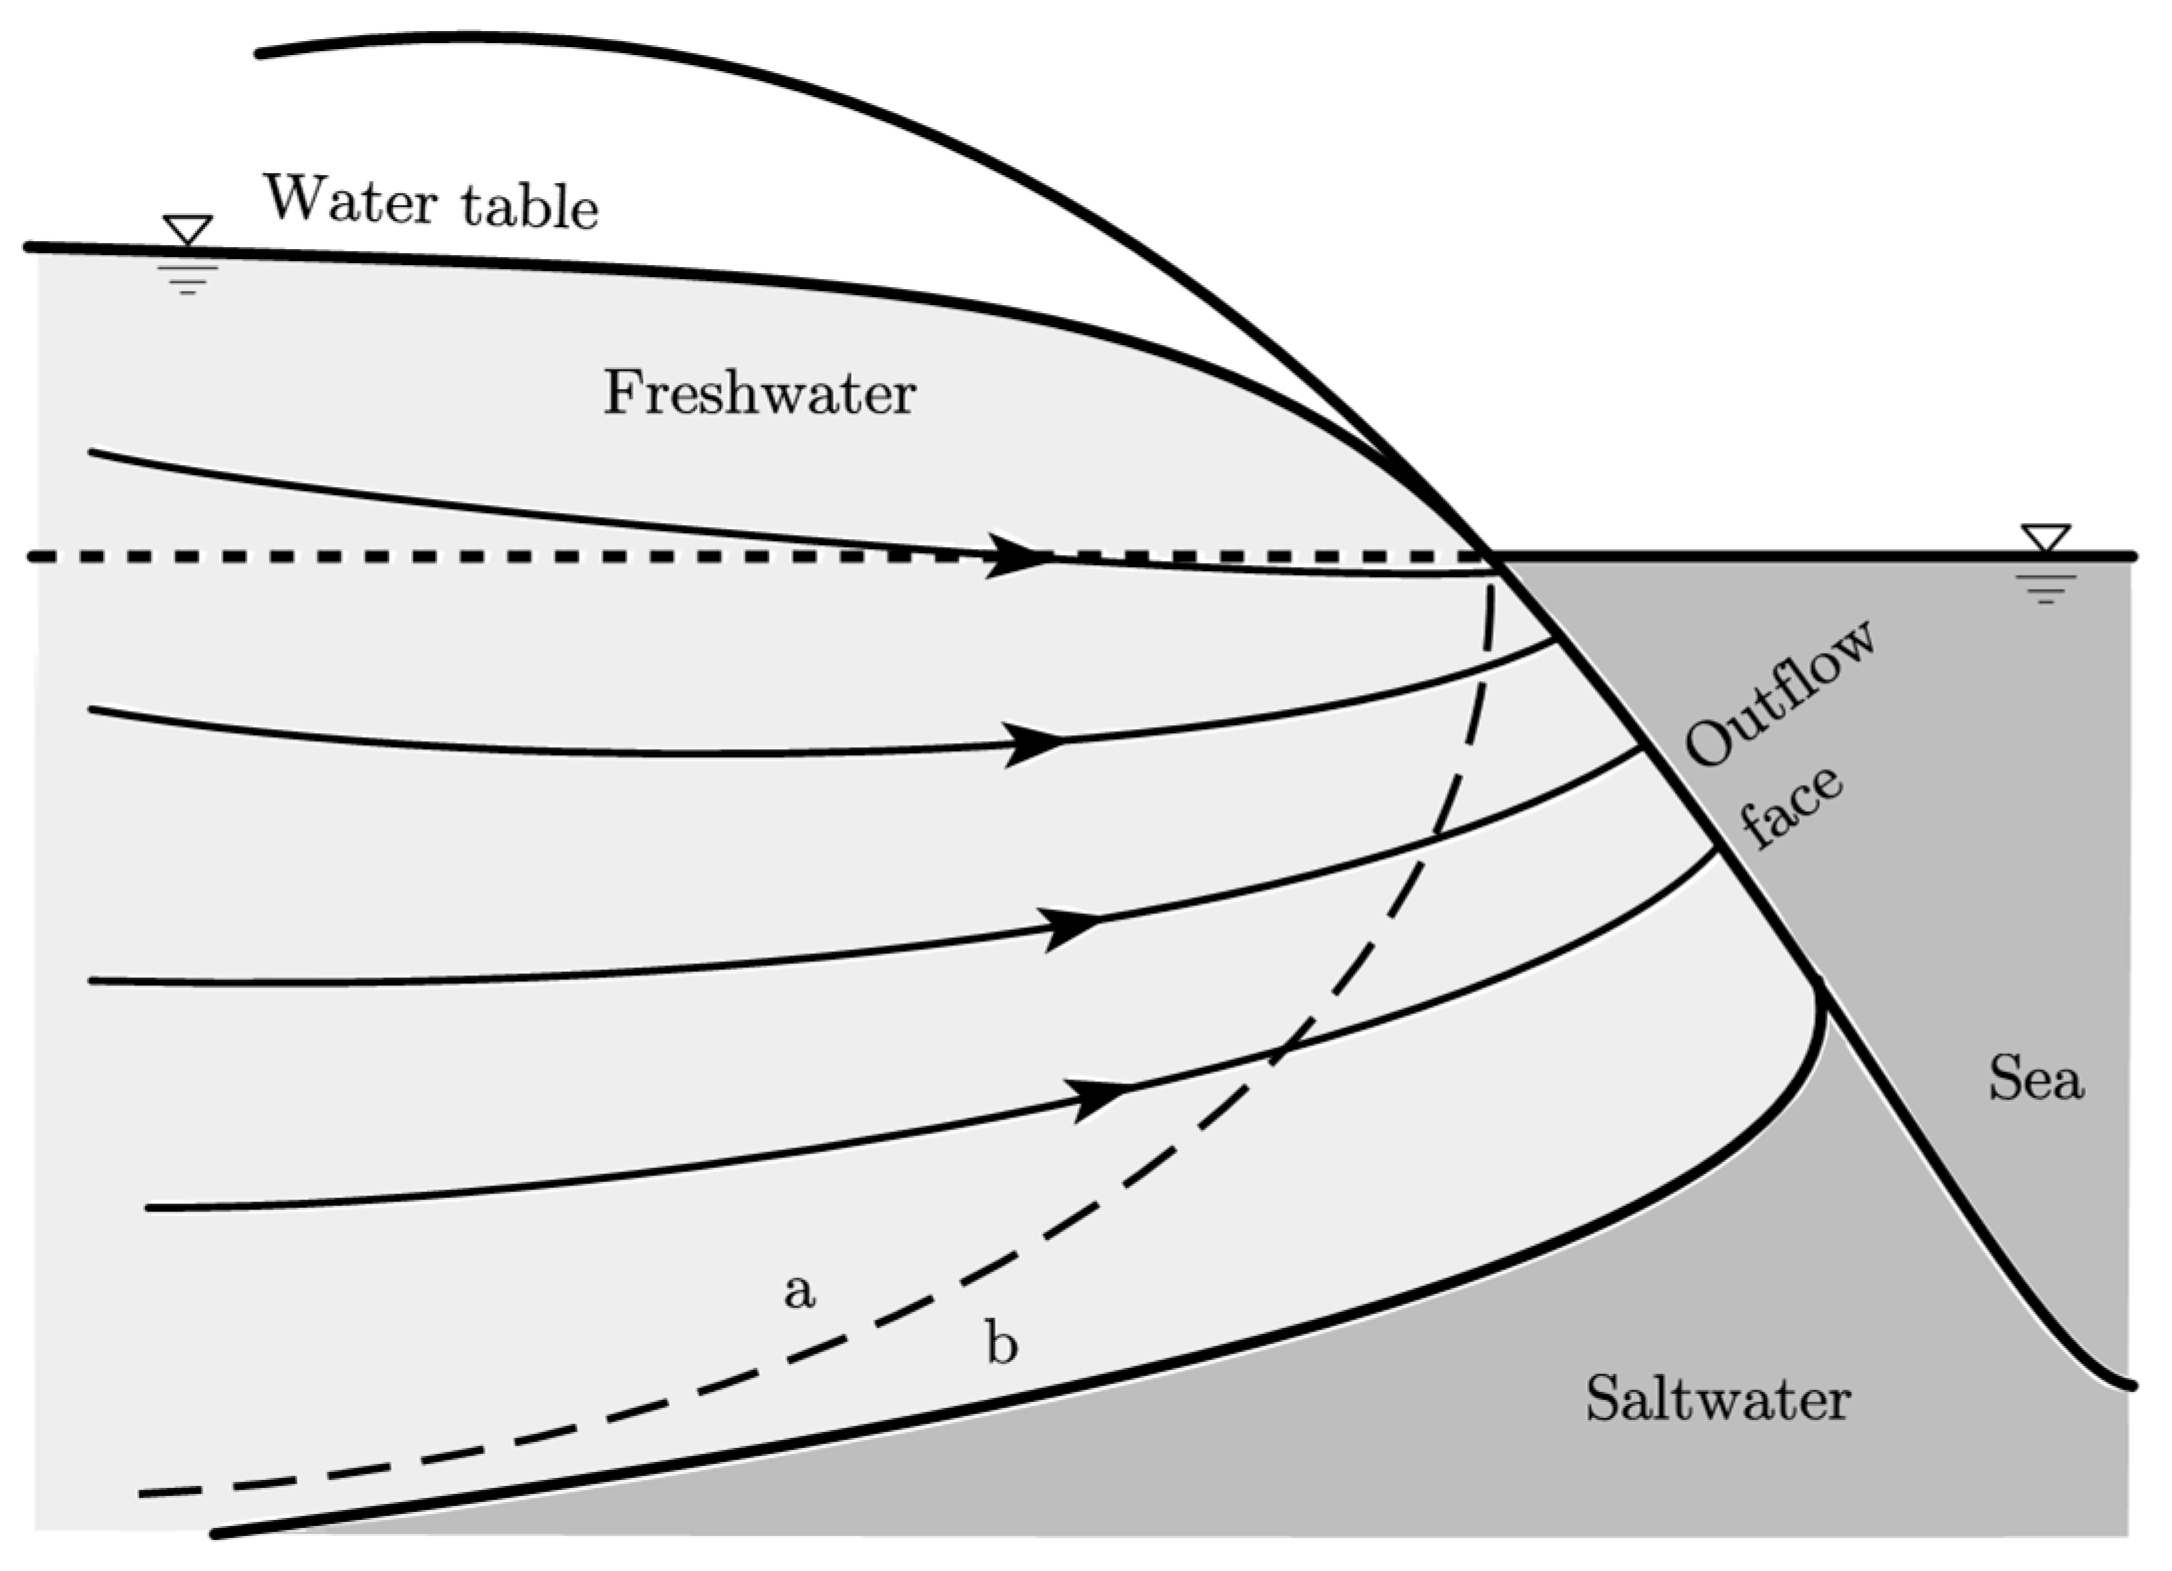
Bear and Cheng [9] introduced the analytical approach to estimating the interface between saltwater and freshwater for seawater intrusion employed in this study to validate the numerical models. As shown in Figure 1, with seawater and a constant freshwater recharge at two sides of an aquifer, they assumed that there was a steady state with a sharp interface between the freshwater and saltwater. This assumption simplifies the mixing zone, which is a transitional band with varied salinities, also called the dispersion zone. What is more, they applied the Ghyben–Herzberg Approximation and Dupuit Approximation [9], which restricts freshwater movement to the horizontal direction only. The freshwater flow path is regarded as essentially horizontal, so the equipotential lines would be vertical. In a real situation as shown in Figure 2, freshwater will flow towards the outflow face above the intrusion zone. Hence, this approximation becomes invalid approaching the sea boundary and cannot simulate the outflow face at seaside.
Following the above-described assumptions and approximations, Bear and Cheng [9] developed Equation (11) to describe the shape and location of the interface in a confined aquifer:
y 2 = L 2 2 δ Q K x ,
where y is a function of the x coordinate that represents the height of the interface from the bottom of the aquifer, creating a parabolic shape for the interface (Figure 1); Q is the mass flow rate of freshwater inflow; L is the aquifer depth; and δ = ρ f / ( ρ s ρ f ) . Note that the x coordinate starts from the sea, as shown in Figure 1.

3. Results

3.1. Numerical Model Validation

The analytical solutions were firstly used to validate the numerical models. The analytical model simulated 2D groundwater flow and salt transport in a coastal confined aquifer. Based on the Henry problem [17], the model used an abstraction of the vertical cross-section of the aquifer perpendicular to the shoreline. The density and pressure gradients drove the saltwater encroachment, and a steady state would eventually be reached with the fresh groundwater recharge from the other end.
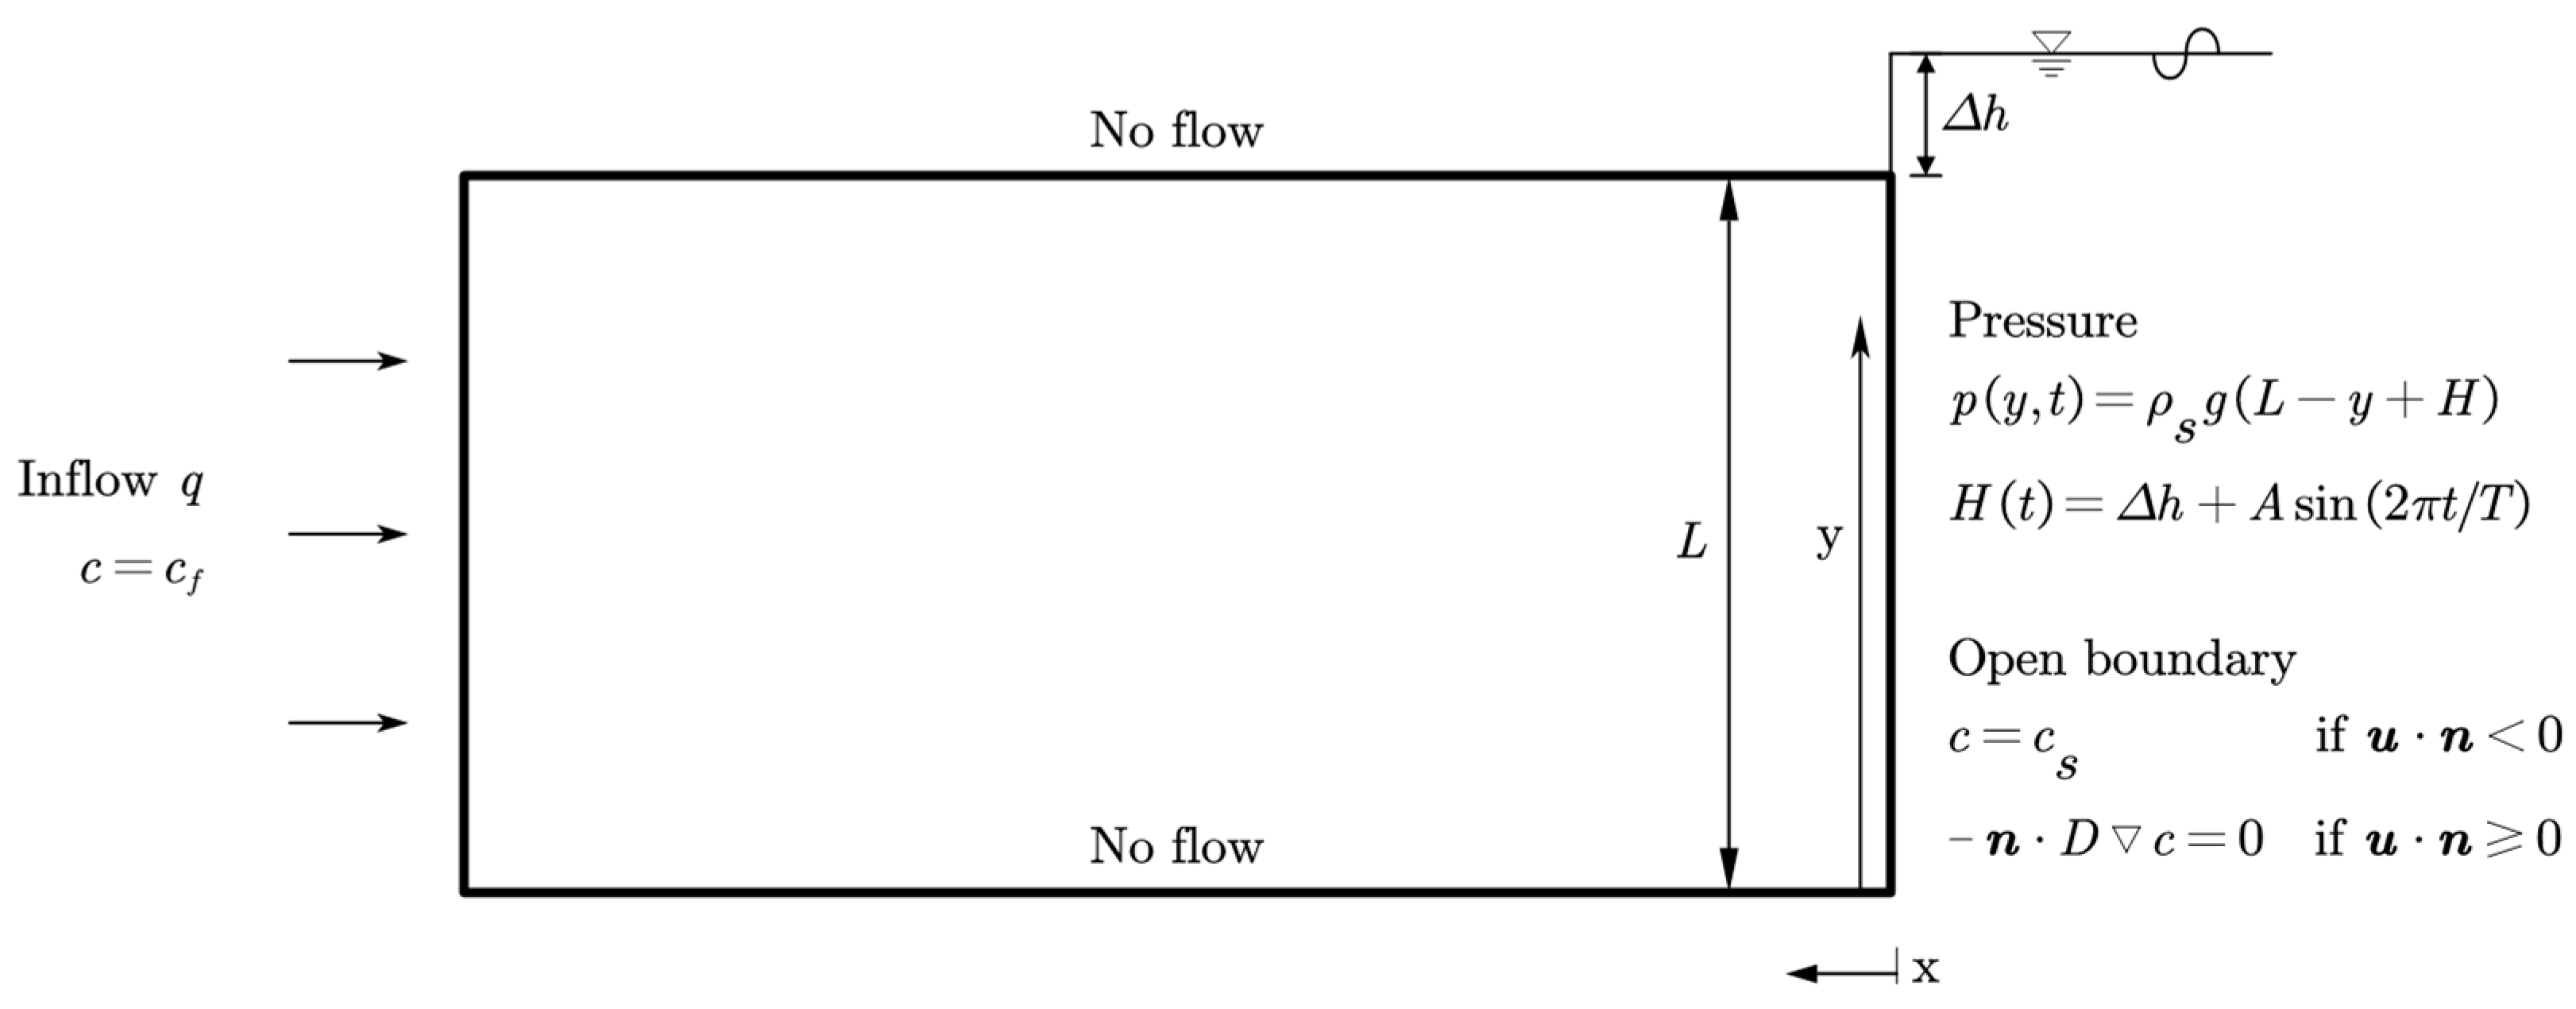
To imitate the conditions of the analytical model, the settings of the numerical models were applied as per Figure 3. We set the tidal amplitude ( A ) and tidal period ( T ) to zero to exclude sea level fluctuations. The whole domain was a rectangular section with a height of 150 m and width of 300 m. There was a constant freshwater inflow with a concentration of c f and a flow rate of q at the inland boundary. On the other side of the domain, hydrostatic pressure p ( y , t ) was exerted by the saltwater body, which hinged upon the water depth and time. For solute transport, the right boundary was set as an open boundary allowing for the outflow face. Depending on the flow’s direction, where the water was entering the domain, the exterior flow concentration was c s , and where water was flowing in the opposite direction, it acted as an outflow boundary. The top and bottom boundaries were regarded as walls with no flow or flux.
The whole domain was initially filled with freshwater under the hydrostatic pressure p 0 ( y ) , which can be described as follows:
p 0 ( y ) = ρ f g ( L y ) ,  
c 0 = c f .
The same settings were applied to both models using Darcy’s Law (Equation (3)) and the Brinkman Equation (Equation (4)). For salt transport, both models used the advection–dispersion equation (Equation (6)) as the governing equation. The employed values of the parameters are listed in Table 1. The concentration of groundwater was used as a normalized value, taking seawater as one and freshwater as zero. The whole aquifer was assumed to be homogeneous and isotropic. Chemical reactions and thermal changes were assumed to be neglected. The models were run until the interface reached a steady state, and the timesteps were set at one hour.
First, a mesh dependency test was carried out for both models. The same triangular mesh was applied for discretization, and we checked different densities from 2500 to 7500 elements. The results revealed that starting from 4300 elements, the difference in the salt wedge toe’s final location was less than 1% for both models, but the computational time increased at least 20%. Therefore, 4300-element mesh was applied to both models, with a maximum element size of 5.25 m and minimum of 0.15 m.
The eventual results are presented in Figure 4, which compares the steadystate freshwater–saltwater interfaces between the analytical solutions and numerical solutions of (a) Darcy’s Law and (b) the Brinkman Equation. The analytical model assumes a sharp interface, while the numerical models are able to simulate the dispersion zone. The range of the dispersion zone is represented by the 10%, 50%, and 90% isohalines of normalized salt concentration. The analytical interfaces corresponded best with the 50% isohalines in both numerical results.
Apart from the interfaces, these two approaches feature different assumptions, generating certain discrepancies in the results. As mentioned, the Ghyben–Herzberg Approximation in the analytical approach assumes the freshwater flow is horizontal. It restricts the interface normal to the right boundary at the seaside and affects the shape of the interface. As approaching to the sea, the validity of the interface reduces. Meanwhile, the numerical solutions are based on time-dependent models, while the analytical solutions are steady-state. The assumptions and approximations lead to the relative robustness of the analytical solutions. Despite the essential differences, both numerical models produced generally consistent results compared to the analytical models, indicating that they can be used in further studies.

3.2. Comparisons of the Two Models

The validated models were applied to multiple cases to investigate the performance of the two equations. The same model configurations and settings were adopted as illustrated in Figure 3 for all cases. The case modelled in Section 3.1 was defined as Case 1 and three additional cases based on Case 1 were conducted. As listed in Table 2, to control the variable, the value of one parameter was changed from Case 1 for each case. These parameters were selected in order to study the impacts of aquifer properties, freshwater recharge rates, and tidal fluctuations. Other parameters remained the same as in Section 3.1.

3.2.1. Aquifer Properties

The hydraulic conductivity ( K ) was increased from 43.2 m/d (medium sand) in Case 1 to 60.5 m/d (coarse sand) in Case 2. Saltwater intrusion progress was assessed in terms of the saltwater wedge toe propagation, or the intrusion length. As presented in Figure 1, intrusion length is defined by the distance between the saltwater boundary and the toe location of the 50% isohaline, as this is the closest to the analytic solutions in Section 3.1. Figure 5 presents the development of intrusion lengths, representing the propagation of saltwater wedge toes. For both cases, the model using Darcy’s Law had a faster intrusion rate and a greater intrusion length than the Brinkman model. With a larger hydraulic conductivity, the final difference of intrusion lengths increased up to 6.1 m.
With the origin of the coordinates starting from the right bottom corner of Figure 3, point P1 (40,20) was selected as a study location to further analyse the process of saltwater movement. This point is away from the boundaries and located inside the saltwater wedge in the final stage. The salt intrusion process was simulated using both Darcy’s Law (Da) and the Brinkman Equation (Bk). Figure 6a–c present the time series of salt concentrations, horizontal velocities, and vertical velocities at this point, respectively. In Figure 6a, the normalized water concentrations from Darcy’s model were 2.5% and 2.2% higher in Case 1 and Case 2, respectively. This indicates that with a saltwater density of 1024 kg/m3, there is a difference in groundwater density between the two models of up to 25.6 kg/m3. For the horizontal velocity in Figure 6b, the largest difference was up to 0.05 m per day. It is not hard to notice that for both cases, the curves started to diverge when the concentration started to increase, and the divergence almost diminished when the concentration reached its maximum. This process occurs when the dispersion zone travels across the point and the freshwater at this point gradually salinizes into saltwater. It can be defined as the break-through period of the point.
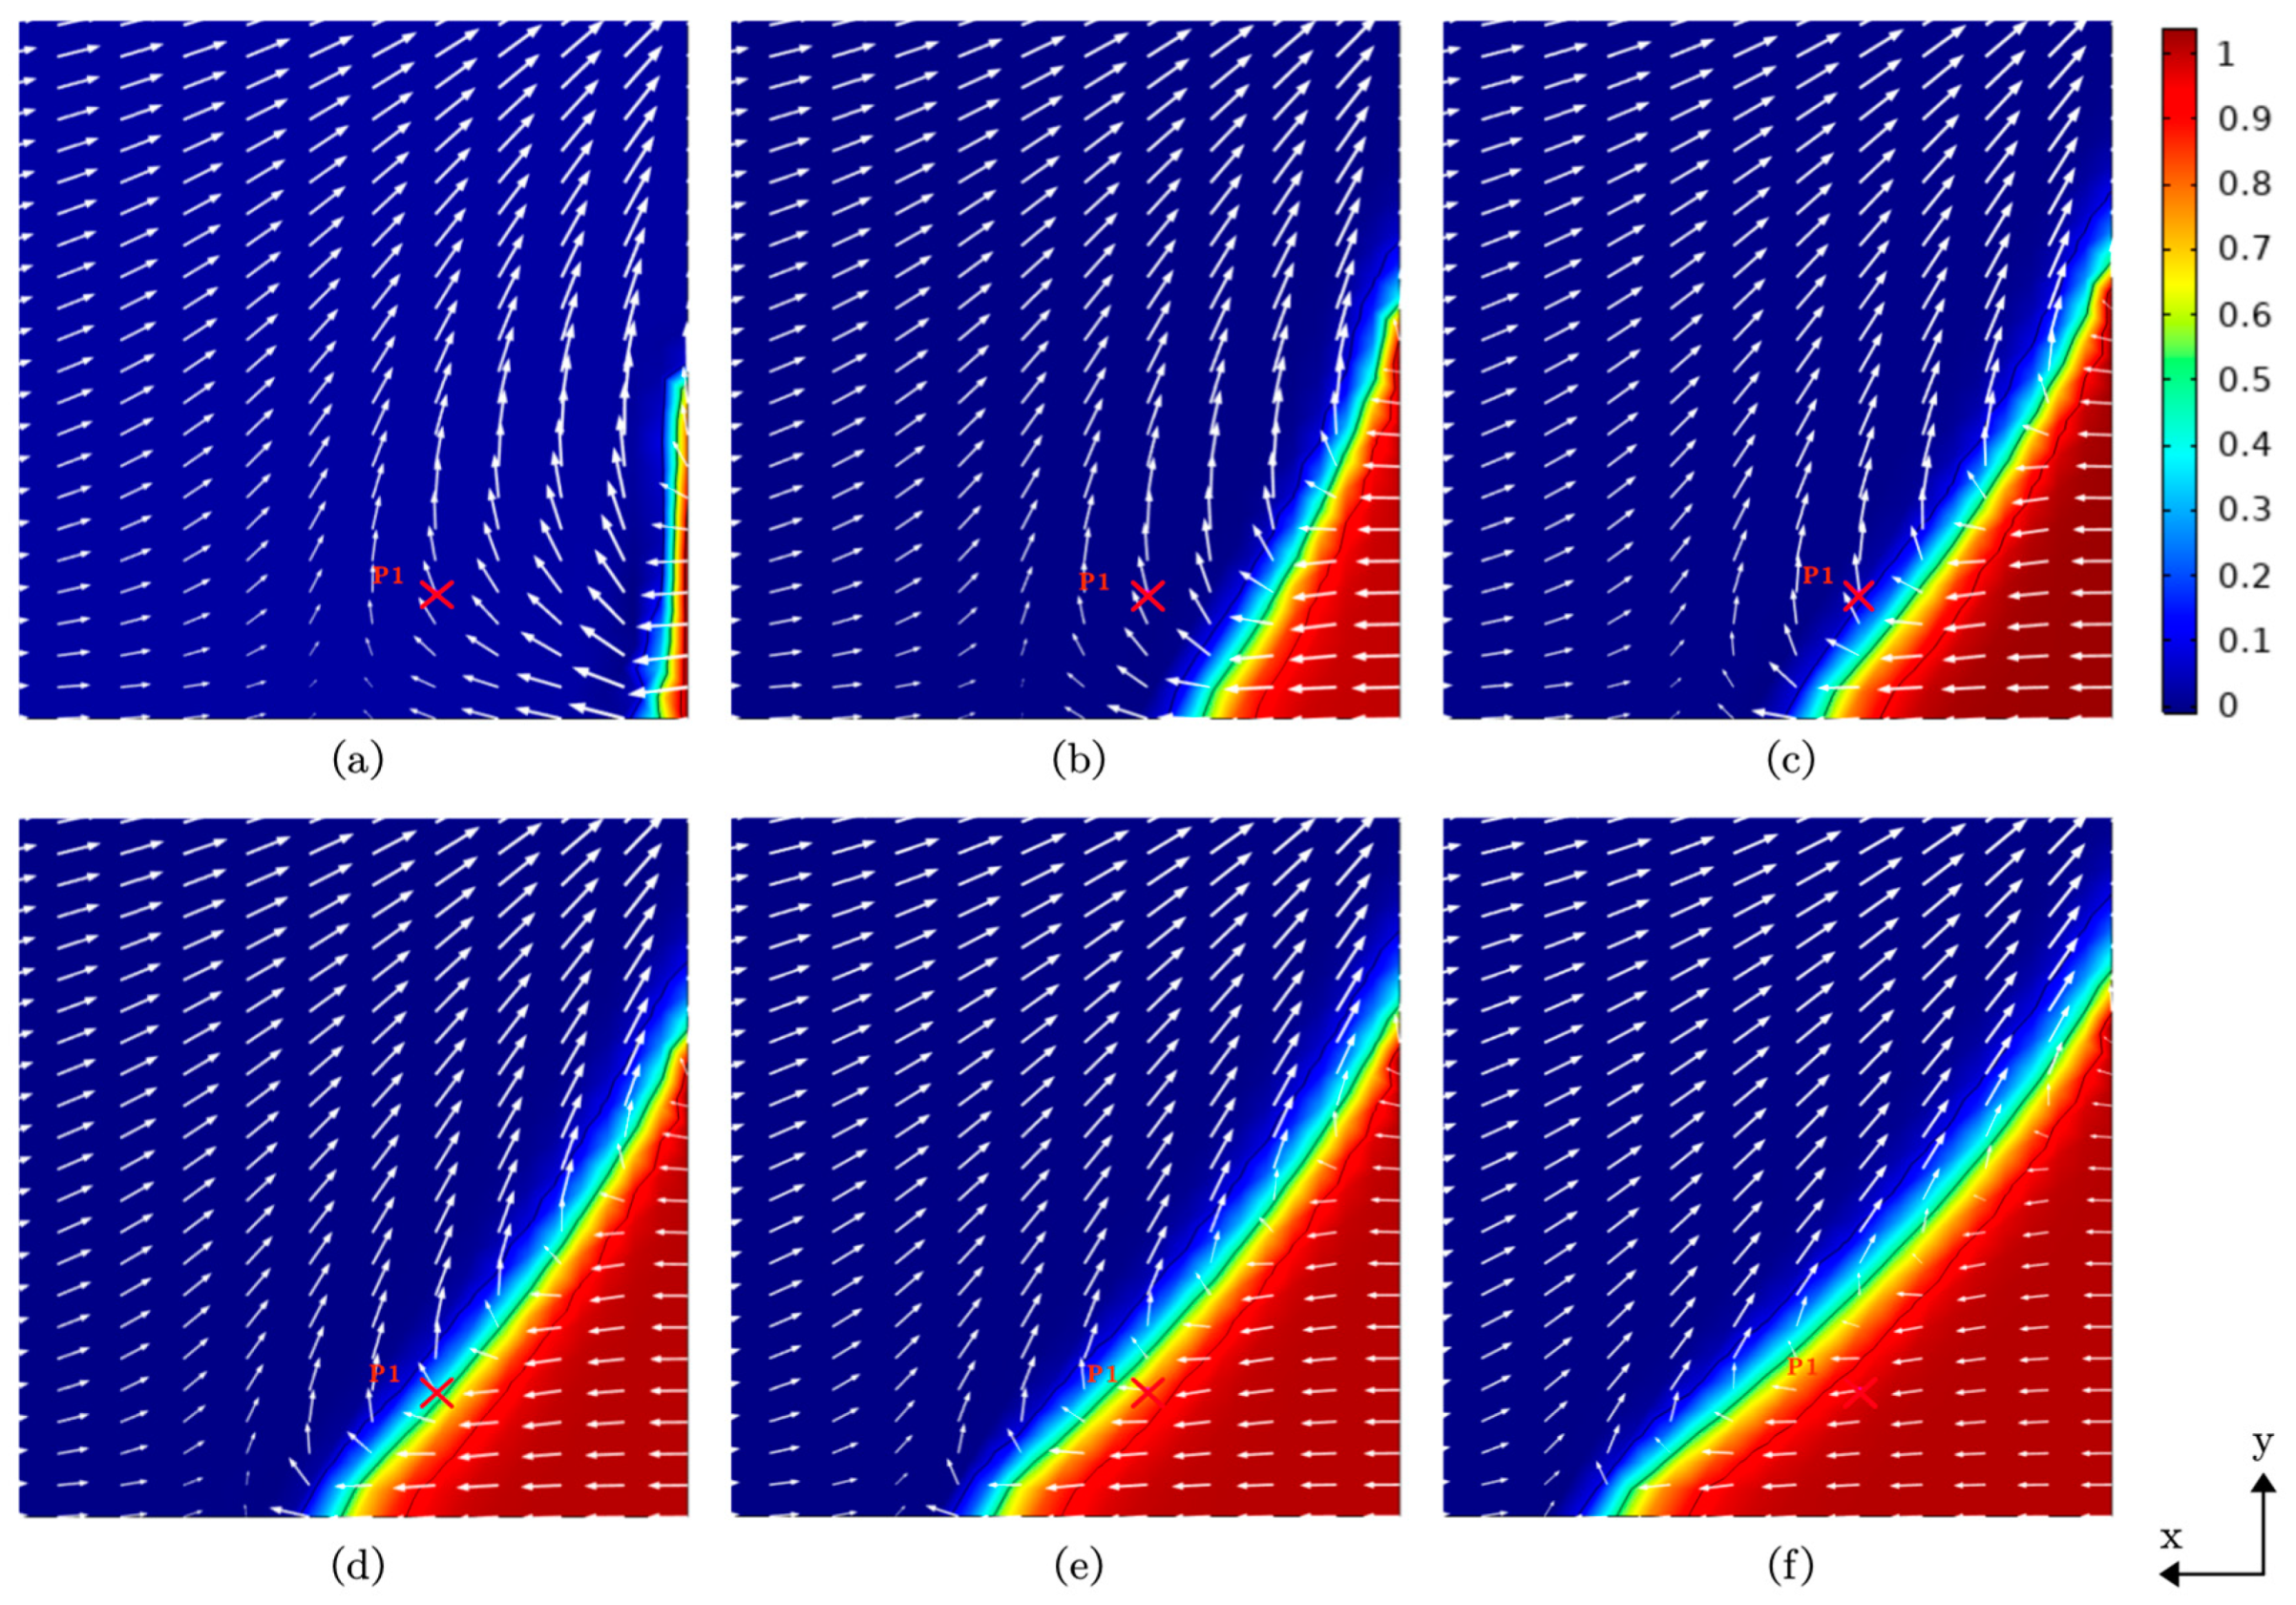
During this period, the fluid velocity changes along with the density variations. Figure 7 presents the typical phases before, during, and after the break-through period of P1 in Case 1. The three black lines are isohalines of 10%, 50%, and 90%, respectively, which basically outline the dispersion zone. As shown in Figure 7a, as the saltwater wedge approached P1, it created a force towards the top left and induced circulation. The freshwater and part of the saline water in the dispersion zone flowed towards the outflow face and completed the circulation. From Figure 7b,c, the vertical influence induced by vertical density gradients was larger at P1, thus causing the flow turning to the top right. During the breakthrough in (d) and (e), the density gradients became smaller while the horizontal pressure gradients became more and more dominate; this led to the flow turning back towards the left. After the breakthrough, P1 was within the saltwater wedge, as shown in (f). Water flowed inland, driven primarily by horizontal pressure gradients. The changes in fluid velocities and densities caused more energy dissipation due to the viscous effects in porous media, which is only accounted for by the Brinkman Equation. Hence, the differences between the Brinkman Equation and Darcy’s Law are most pronounced in this break-through period. Essentially, for the whole domain, the break-through period happens inside the dispersion zone all through the intrusion process. Thus, the dispersion zone is the main concern when comparing the two equations.
Figure 6b demonstrates that the Brinkman models exhibit more moderate horizontal velocity variations compared to the Darcy models, which is primarily due to increased kinetic dissipation. Consequently, the concentration, which also depends on the velocity variations, had a milder rise in the Brinkman models. It led to a relatively slower intrusion rate and a more mitigative extent of saltwater intrusion, compared to the results of the Darcy models. The Brinkman Equation produced a less aggressive intrusion process than Darcy’s Law. It can also be analysed using horizontal profiles of concentration. Figure 8 presents the profiles at a height of 20, 40, and 60 m from the bottom at the end of the simulation of Cases 1 and 2. The Brinkman models proceed with less intrusion than the Darcy’s model at all levels for both cases. Additionally, when the normalized concentration was approximately 0.8 to 0.9, the difference in intrusion extent was the largest. Moreover, in both cases, the divergence weakened with a rising height. The bottom part of the aquifer bears more hydraulic pressure, driving larger flow velocities and further intrusions. As a result, the viscous term in the Brinkman Equation has a stronger influence in deeper layers. In additional, the higher hydraulic conductivity in Case 2 leads to larger velocities, intensifying the discrepancy between the two models even further. Overall, the results indicate that the Brinkman models exhibit more controlled and subdued saltwater intrusion, making them a favourable option for studying and managing saltwater movement in aquifers compared to the Darcy models.

3.2.2. Inflow Rate

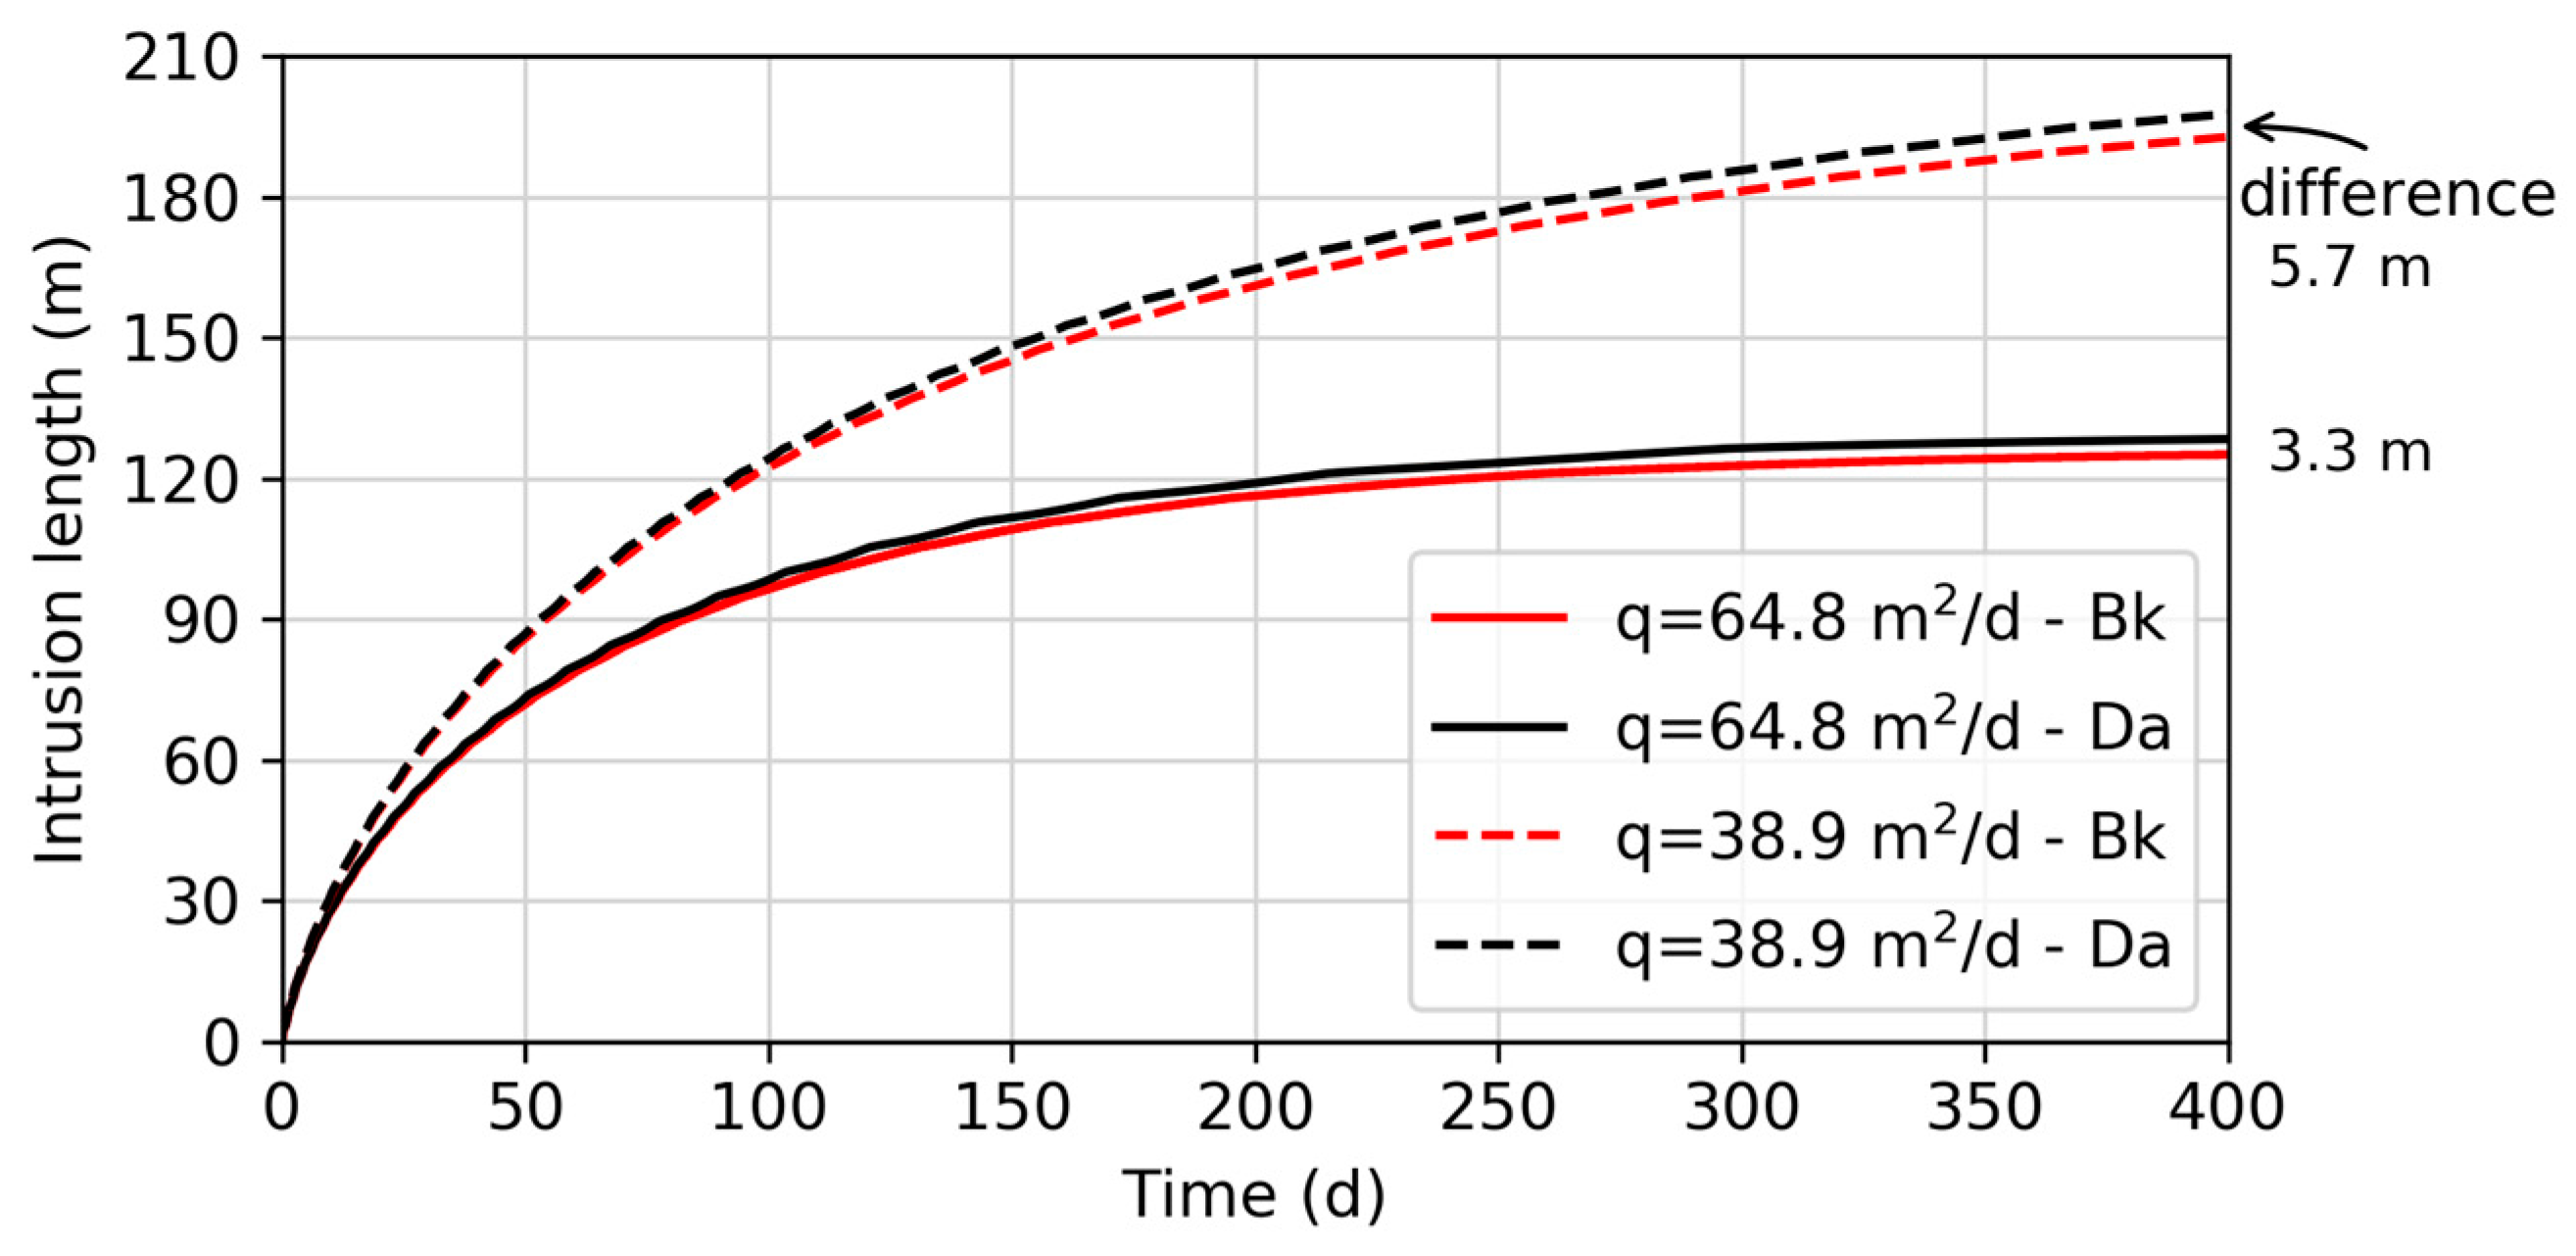
Case 3 was specifically designed to study the impacts of the freshwater inflow rate at the inland boundary. Analogous to Figure 5, Figure 9 presents the comparison of intrusion lengths represented by 50% salt concentrations of isohalines. With a smaller inflow rate, the intrusion was accelerated and exacerbated. The overall deviation of intrusion lengths increased from 3.3 m to 5.7 m. Figure 10 depicts the timeseries at point P1(40,20), which is similar to the analysis of Figure 6. A smaller flow rate has analogous impacts as a larger hydraulic conductivity. A reduced freshwater recharge from inland accelerated the flow and intrusion processes, leading to stronger viscous dissipation and thus escalating the discrepancy between the two equations.
To further investigate the impact of hydraulic conductivities ( K ) and inflow rates ( q ), additional tests were carried out. Six values of K and three values of q were collectively examined. In each case, the intrusion length was compared between the two models throughout the propagation process and the largest difference for each case was presented in Figure 11. The intrusion length was still based on the toe of 50% isohalines. It can be analysed in two aspects. Firstly, for a certain q , the trends of the differences with an increasing K are consistent, rising rapidly at first and dropping off after a peak. When K is between 43.2 to 86.4 m/d (i.e., in the range of medium sand, coarse sand, and gravel), the difference escalates, and more attention should be paid to the choice of governing motion equations. Secondly, for a certain K in the range of 21.6 to 60.5 m/d (i.e., medium and coarse sands) a small freshwater recharge induced more salient differences. However, when K continues increasing after 60.5 m/d, which represents gravel and coarser soils, a higher recharge inversely induces larger differences. Medium and coarse sand are more common in coastal regions; thus, conditions with lower inflow rates, like drought seasons, increasing pumping rates, and dam constructions, require more attention in the Brinkman Equation.

3.2.3. Tidal Effects

The seaside boundary conditions were stable in Case 1. To investigate the effects of tidal fluctuations, a periodic oscillation of the hydraulic head was applied in Case 4. In this way, the pressure of the sea boundary is dependent both on height and time.
p ( y , t ) = ρ s g ( H ( t ) + L y ) ,  
H ( t ) = Δ h + A s i n ( 2 π t T ) ,
where H ( t ) is the hydraulic head difference between the two vertical boundaries at time t , consisting of a constant driving head Δ h and a sinusoidal fluctuation. A and T are the fluctuation amplitude and period, respectively. The timesteps were reduced to half an hour and the model was run until reaching a quasi-steady state.
The results indicted little difference between the two models. The main cause of the similar results is that the model is a flux-controlled system. The fixed inflow at the left boundary balanced the relatively small fluctuations on the right side. Therefore, the flow velocity was influenced little by the tidal oscillations.

4. Discussion

Comparing the intrusion process between the two models, the results indicate that the most significant moment is during the break-through period, which happens within the dispersion zone. The opposite flows of freshwater and saltwater meet and mix here. Changes in fluid salinity and density induce velocity variations in both magnitude and direction, thus strengthening the shear stress and dissipation of kinetic energy. The difference in the normalized concentrations computed using the two models reached up to 2.5%, which equals a density difference of 25.6 kg/m3 for a saltwater source of 1024 kg/m3. The Brinkman Equation is more accurate than Darcy’s Law for the analysis of dispersion zones for saltwater intrusion studies. In reality, the mixing zones range from hundreds of metres to kilometres in different coasts and are still going further inland. This condition draws considerable attention from researchers from multiple disciplines [40], and more accurate estimations using numerical models are significant. Similarly, it also applies to other density-dependent studies like solute or contaminant transport in porous media [41]. With more focus on the distribution of fluid density, the Brinkman Equation is capable of capturing the details. Apart from salinity and concentration, density variations can be caused by thermal conditions. The heat transfer in porous media is widely involved in natural processes and industrial applications like geothermal systems, soil bioremediation processes, and petroleum reservoirs. Recent studies have made efforts to incorporate the Brinkman Equation into the heat equation, and the frictional heat induced by viscous dissipations can be involved in non-isothermal fluid flow [42,43].
The discrepancy between the two equations is essentially caused by the velocity changes. It is found that the impact of viscous forces enlarges with higher velocity variations. In this way, the fluid movement has a stronger dependence on the Brinkman term. Changes in external conditions including head differences and recharge rates have substantial impacts on the groundwater flow rate. This study built a flux-controlled system with a constant flux from inland. The hydraulic head on the seaside oscillated due to tidal fluctuations, which did not induce large discrepancies as expected. According to Werner and Simmons [44], the seawater intrusion model with a flux-dependent inland boundary condition is not sensitive to changes induced by sea level rise of up to 1.5 m, corresponding to the results of this study. It can also be concluded that the velocity in a flux-controlled system is not sensitive to seaside head changes of up to 2 m. Further studies can be carried out for head changes in head-controlled systems and flux changes in flux-controlled systems.
In addition to external forcing, velocity variations are also related to the internal characteristics of the porous media. This condition is likely in porous media with higher permeabilities and porosities or with heterogeneous properties. The results revealed that the discrepancy is the largest in medium sands, coarse sands, and gravel, where the Brinkman Equation is required. An extreme condition is in fractured aquifers, and several studies have supported that the Brinkman Equation is more accurate for related study [45,46]. In addition, hierarchical porous media, like large-scale study domains with distinct aquifers, also result in rapid changes in velocities [28]. Similarly, near a free-flow body, the transitional groundwater flow should employ the Brinkman Equation, as suggested by numerous research [26,27,47].
The two models were operated using the same hardware, and on average, the Brinkman model required twice the computational time as the Darcy model. Given that the Brinkman Equation is a more refined model, the additional Laplace term adds computational complexity compared to Darcy’s Law. For certain conditions requiring accurate estimations of the intricate flow movement, the Brinkman Equation is necessary despite its increased computational efficiency. The choice between Darcy’s Law and the Brinkman Equation depends on the specific requirements of the simulation.
Certain limitations should be taken into account when interpreting the results and considering the implications of this research. First of all, both models rely on simplifying assumptions, including the homogeneity and anisotropy of porous media, the negligence of alongshore movement, and the absence of chemical reactions. These assumptions might potentially lead to deviations between simulation results and actual observations. Furthermore, the choice and accuracy of boundary conditions make a great difference in the predictive capabilities of the models. More boundary conditions are expected to be tested. In addition, the results in this study were obtained from a relatively small-scale system (300 m × 150 m). Caution should be exercised when applying to other scales.
Future work will focus on investigating the further impacts of seawater intrusion in coastal regions, specifically the phenomenon of salt intrusion into coastal lakes. This study will explore the mutual interactions between saline groundwater and coastal lakes. The Brinkman model, validated in this research, will be applied to simulate saline groundwater flow and will be coupled with the free flow within the coastal lake system.

5. Conclusions

This study examined the performance of Darcy’s Law and the Brinkman Equation in saltwater intrusion problems through numerical modelling. Through a comprehensive analysis of different cases, we have gained valuable insights into the model selection process for coastal aquifers. The choice between these two models should be made judiciously based on the specific characteristics of the problem at hand.
The Brinkman Equation builds on Darcy’s Law through accounting for viscous and inertial effects, thereby offering improved accuracy, particularly in situations where the density and velocity variations are substantial. The most significant period of saltwater intrusion is inside the dispersion zone during the break-through process, and it is necessary to select the Brinkman Equation in studies on freshwater–saltwater interfaces and quick porous media flows. Through incorporating the Brinkman Equation, the total intrusion length could be reduced by up to 6.1 m in a 180 m intrusion case, and the concentration difference is 2.5% compared to the Darcy model. The Brinkman Equation excels at capturing the intricacies of flow in complex situations. Applications can be extended to groundwater–surface water interfaces, pumping well design and planning, contaminant transport, non-isothermal flows, and other complex geological conditions.
As the world continues to face challenges related to freshwater resources and their sustainable use, the insights gained from this work can guide decision-makers and researchers in making informed choices for accurate and reliable simulations of saltwater intrusion phenomena.

Author Contributions

Conceptualization, J.Y. and H.Z.; methodology, J.Y. and H.Z.; software, J.Y. and H.Z.; validation, J.Y.; formal analysis, J.Y.; resources, J.Y. and H.Z.; data curation, J.Y. and H.Z.; writing—original draft preparation, J.Y.; writing—review and editing, J.Y. and H.Z.; visualization, J.Y.; supervision, H.Z.; project administration, H.Z. All authors have read and agreed to the published version of the manuscript.

Funding

This research was supported by the Griffith University International Postgraduate Research Scholarship and the Griffith University Postgraduate Research Scholarship which provides the Ph.D. tuition fee and living allowance to the first author.

Institutional Review Board Statement

Not applicable.

Informed Consent Statement

Not applicable.

Data Availability Statement

Not applicable.

Acknowledgments

The authors acknowledge Griffith University, Australia for the financial support. In addition, special thanks to the contribution of Bofu Yu for his guidance and active feedbacks throughout the program. In addition, the authors extend our gratitude to Graeme Hocking for providing valuable insights and discussions.

Conflicts of Interest

The authors declare no conflict of interest.

References

  1. Maul, G.A.; Duedall, I.W. Demography of Coastal Populations. In Encyclopedia of Coastal Science; Finkl, C.W., Ed.; Springer: Berlin/Heidelberg, Germany; New York, NY, USA, 2019; pp. 692–700. ISBN 978-3-319-93805-9. [Google Scholar]
  2. Werner, A.D.; Bakker, M.; Post, V.E.A.; Vandenbohede, A.; Lu, C.; Ataie-Ashtiani, B.; Simmons, C.T.; Barry, D.A. Seawater intrusion processes, investigation and management: Recent advances and future challenges. Adv. Water Resour. 2013, 51, 3–26. [Google Scholar] [CrossRef]
  3. Michael, H.A.; Russoniello, C.J.; Byron, L.A. Global assessment of vulnerability to sea-level rise in topography-limited and recharge-limited coastal groundwater systems. Water Resour. Res. 2013, 49, 2228–2240. [Google Scholar] [CrossRef]
  4. Hussain, M.S.; Abd-Elhamid, H.F.; Javadi, A.A.; Sherif, M.M. Management of Seawater Intrusion in Coastal Aquifers: A Review. Water 2019, 11, 2467. [Google Scholar] [CrossRef]
  5. Zhang, H.; Hocking, G.C.; Barry, D.A. An analytical solution for critical withdrawal of layered fluid through a line sink in a porous medium. J. Aust. Math. Soc. Ser. B Appl. Math. 1997, 39, 271–279. [Google Scholar] [CrossRef]
  6. Lu, C.; Xin, P.; Li, L.; Luo, J. Seawater intrusion in response to sea-level rise in a coastal aquifer with a general-head inland boundary. J. Hydrol. 2015, 522, 135–140. [Google Scholar] [CrossRef]
  7. Cartwright, N.; Li, L.; Nielsen, P. Response of the salt–freshwater interface in a coastal aquifer to a wave-induced groundwater pulse: Field observations and modelling. Adv. Water Resour. 2004, 27, 297–303. [Google Scholar] [CrossRef]
  8. Post, V.E.A.; Houben, G.J.; van Engelen, J. What is the Ghijben-Herzberg principle and who formulated it? Hydrogeol. J. 2018, 26, 1801–1807. [Google Scholar] [CrossRef]
  9. Bear, J.; Cheng, A.H.-D. Modeling Groundwater Flow and Contaminant Transport; Springer: Dordrecht, The Netherlands; London, UK, 2010; ISBN 9781402066825. [Google Scholar]
  10. Fahs, M.; Ataie-Ashtiani, B.; Younes, A.; Simmons, C.T.; Ackerer, P. The Henry problem: New semianalytical solution for velocity-dependent dispersion. Water Resour. Res. 2016, 52, 7382–7407. [Google Scholar] [CrossRef]
  11. Zhang, H.; Hocking, G.C. Withdrawal of layered fluid through a line sink in a porous medium. J. Aust. Math. Soc. Ser. B Appl. Math. 1996, 38, 240–254. [Google Scholar] [CrossRef]
  12. Lu, C.; Chen, Y.; Zhang, C.; Luo, J. Steady-state freshwater–seawater mixing zone in stratified coastal aquifers. J. Hydrol. 2013, 505, 24–34. [Google Scholar] [CrossRef]
  13. Yu, X.; Xin, P.; Lu, C. Seawater intrusion and retreat in tidally-affected unconfined aquifers: Laboratory experiments and numerical simulations. Adv. Water Resour. 2019, 132, 103393. [Google Scholar] [CrossRef]
  14. Felder, C.; Oltean, C.; Buès, M.A. Density-driven flow and transport in saturated porous media. Salt solute infiltration into Hele-Shaw cells—A comparison between numerical and experimental results. In Computational Methods in Water Resources, Proceedings of the XIVth International Conference on Computational Methods in Water Resources (CMWR XIV), Delft, The Netherlands, 23–28 June 2002; Hassanizadeh, S.M., Schotting, R.J., Gray, W.G., Pinder, G.F., Eds.; Elsevier: Amsterdam, The Netherlands, 2002; pp. 515–522. ISBN 0167-5648. [Google Scholar]
  15. Zhang, Q.; Volker, R.E.; Lockington, D.A. Influence of seaward boundary condition on contaminant transport in unconfined coastal aquifers. J. Contam. Hydrol. 2001, 49, 201–215. [Google Scholar] [CrossRef]
  16. Zhang, Q.; Volker, R.E.; Lockington, D.A. Numerical investigation of seawater intrusion at Gooburrum, Bundaberg, Queensland, Australia. Hydrogeol. J. 2004, 12, 674–687. [Google Scholar] [CrossRef]
  17. Henry, H.R. Effects of Dispersion on Salt Water Encroachment in Coastal Aquifers. U.S. Geol. Surv. Water Supply Pap. 1964, 1613-C, C70–C84. [Google Scholar]
  18. Kuan, W.K.; Xin, P.; Jin, G.; Robinson, C.E.; Gibbes, B.; Li, L. Combined Effect of Tides and Varying Inland Groundwater Input on Flow and Salinity Distribution in Unconfined Coastal Aquifers. Water Resour. Res. 2019, 55, 8864–8880. [Google Scholar] [CrossRef]
  19. Mastrocicco, M.; Busico, G.; Colombani, N.; Vigliotti, M.; Ruberti, D. Modelling Actual and Future Seawater Intrusion in the Variconi Coastal Wetland (Italy) Due to Climate and Landscape Changes. Water 2019, 11, 1502. [Google Scholar] [CrossRef]
  20. Abdoulhalik, A.; Ahmed, A.A. Transience of seawater intrusion and retreat in response to incremental water-level variations. Hydrol. Process. 2018, 32, 2721–2733. [Google Scholar] [CrossRef]
  21. AL-ALI, S.; Hocking, G.C.; Farrow, D.E.; Zhang, H. A spectral modelling approach for fluid flow into a line sink in a confined aquifer. Eur. J. Appl. Math. 2022, 33, 960–981. [Google Scholar] [CrossRef]
  22. Vu, T.-D.; Ni, C.-F.; Li, W.-C.; Truong, M.-H.; Hsu, S.M. Predictions of groundwater vulnerability and sustainability by an integrated index-overlay method and physical-based numerical model. J. Hydrol. 2021, 596, 126082. [Google Scholar] [CrossRef]
  23. Barzehkar, M.; Parnell, K.E.; Soomere, T.; Dragovich, D.; Engström, J. Decision support tools, systems and indices for sustainable coastal planning and management: A review. Ocean. Coast. Manag. 2021, 212, 105813. [Google Scholar] [CrossRef]
  24. Darcy, H. Les Fontaines Publiques de la Ville de Dijon: Exposition et application des principes à suivre et des formules à employer dans les questions de distribution d’eau ouvrage terminé, par un appendice relatif aux fournitures d’eau de plusieurs villes au filtrage des eaux; Dalmont, V., Ed.; Libraire des Corps imperiaux des ponts et chaussées et des mines: Paris, France, 1856. [Google Scholar]
  25. Brinkman, H.C. A calculation of the viscous force exerted by a flowing fluid on a dense swarm of particles. Appl. Sci. Res. 1949, 1, 27–34. [Google Scholar] [CrossRef]
  26. Nield, D.A.; Bejan, A. Convection in Porous Media, 4th ed.; Springer Science + Business Media: New York, NY, USA, 2013; ISBN 9781461455400. [Google Scholar]
  27. Ehlers, W. Darcy, Forchheimer, Brinkman and Richards: Classical hydromechanical equations and their significance in the light of the TPM. Arch. Appl. Mech. 2022, 92, 619–639. [Google Scholar] [CrossRef]
  28. Chabanon, M.; Valdés-Parada, F.J.; Ochoa-Tapia, J.A.; Goyeau, B. Large-scale model of flow in heterogeneous and hierarchical porous media. Adv. Water Resour. 2017, 109, 41–57. [Google Scholar] [CrossRef]
  29. Tam, C.K.W. The drag on a cloud of spherical particles in low Reynolds number flow. J. Fluid Mech. 1969, 38, 537–546. [Google Scholar] [CrossRef]
  30. Auriault, J.-L.; Geindreau, C.; Boutin, C. Filtration Law in Porous Media with Poor Separation of Scales. Transp. Porous Med. 2005, 60, 89–108. [Google Scholar] [CrossRef]
  31. Rubinstein, J. Effective equations for flow in random porous media with a large number of scales. J. Fluid Mech. 1986, 170, 379–383. [Google Scholar] [CrossRef]
  32. Durlofsky, L.; Brady, J.F. Analysis of the Brinkman equation as a model for flow in porous media. Phys. Fluids 1987, 30, 3329. [Google Scholar] [CrossRef]
  33. Liang, M.; Fu, C.; Xiao, B.; Luo, L.; Wang, Z. A fractal study for the effective electrolyte diffusion through charged porous media. Int. J. Heat Mass Transf. 2019, 137, 365–371. [Google Scholar] [CrossRef]
  34. Liang, M.; Liu, Y.; Xiao, B.; Yang, S.; Wang, Z.; Han, H. An analytical model for the transverse permeability of gas diffusion layer with electrical double layer effects in proton exchange membrane fuel cells. Int. J. Hydrogen Energy 2018, 43, 17880–17888. [Google Scholar] [CrossRef]
  35. Long, G.; Liu, Y.; Xu, W.; Zhou, P.; Zhou, J.; Xu, G.; Xiao, B. Analysis of Crack Problems in Multilayered Elastic Medium by a Consecutive Stiffness Method. Mathematics 2022, 10, 4403. [Google Scholar] [CrossRef]
  36. Sheibani, S.; Ataie-Ashtiani, B.; Safaie, A.; Simmons, C.T. Influence of lakebed sediment deposit on the interaction of hypersaline lake and groundwater: A simplified case of lake Urmia, Iran. J. Hydrol. 2020, 588, 125110. [Google Scholar] [CrossRef]
  37. Sayyah Alborzi, Z.; Amini, Y.; Amirabedi, P.; Raveshiyan, S.; Hassanvand, A. Computational Fluid Dynamics Simulation of a Membrane Contactor for CO2 Separation: Two Types of Membrane Evaluation. Chem. Eng. Technol. 2023, 46. [Google Scholar] [CrossRef]
  38. COMSOL Multiphysics, Version 5.6; Introduction to COMSOL Multiphysics. Available online: https://cdn.comsol.com/doc/5.6/IntroductionToCOMSOLMultiphysics.pdf (accessed on 21 April 2021).
  39. Bear, J.; Bachmat, Y. Introduction to Modeling of Transport Phenomena in Porous Media; Kluwer Academic: Dordrecht, The Netherlands; London, UK, 1990; ISBN 9789400919266. [Google Scholar]
  40. Chen, L.; Hu, B.X.; Dai, H.; Zhang, X.; Xia, C.-A.; Zhang, J. Characterizing microbial diversity and community composition of groundwater in a salt-freshwater transition zone. Sci. Total Environ. 2019, 678, 574–584. [Google Scholar] [CrossRef]
  41. Muhsun, S.S.; Saleh, M.S.; Qassim, A.R. Physical and CFD Simulated Models to Analyze the Contaminant Transport through Porous Media under Hydraulic Structures. KSCE J. Civ. Eng. 2020, 24, 3674–3691. [Google Scholar] [CrossRef]
  42. Pažanin, I.; Radulović, M. Effects of the viscous dissipation on the Darcy-Brinkman flow: Rigorous derivation of the higher-order asymptotic model. Appl. Math. Comput. 2020, 386, 125479. [Google Scholar] [CrossRef]
  43. Hung, Y.-M.; Tso, C.P. Effects of viscous dissipation on fully developed forced convection in porous media. Int. Commun. Heat Mass Transf. 2009, 36, 597–603. [Google Scholar] [CrossRef]
  44. Werner, A.D.; Simmons, C.T. Impact of sea-level rise on sea water intrusion in coastal aquifers. Ground Water 2009, 47, 197–204. [Google Scholar] [CrossRef]
  45. Teng, B.; Luo, W.; Chen, Z.; Kang, B.; Chen, L.; Wang, T. A comprehensive study of the effect of Brinkman flow on the performance of hydraulically fractured wells. J. Pet. Sci. Eng. 2022, 213, 110355. [Google Scholar] [CrossRef]
  46. Marušić-Paloka, E.; Pažanin, I.; Marušić, S. Comparison between Darcy and Brinkman laws in a fracture. Appl. Math. Comput. 2012, 218, 7538–7545. [Google Scholar] [CrossRef]
  47. Salinger, A.G.; Aris, R.; Derby, J.J. Finite element formulations for large-scale, coupled flows in adjacent porous and open fluid domains. Int. J. Numer. Meth. Fluids 1994, 18, 1185–1209. [Google Scholar] [CrossRef]
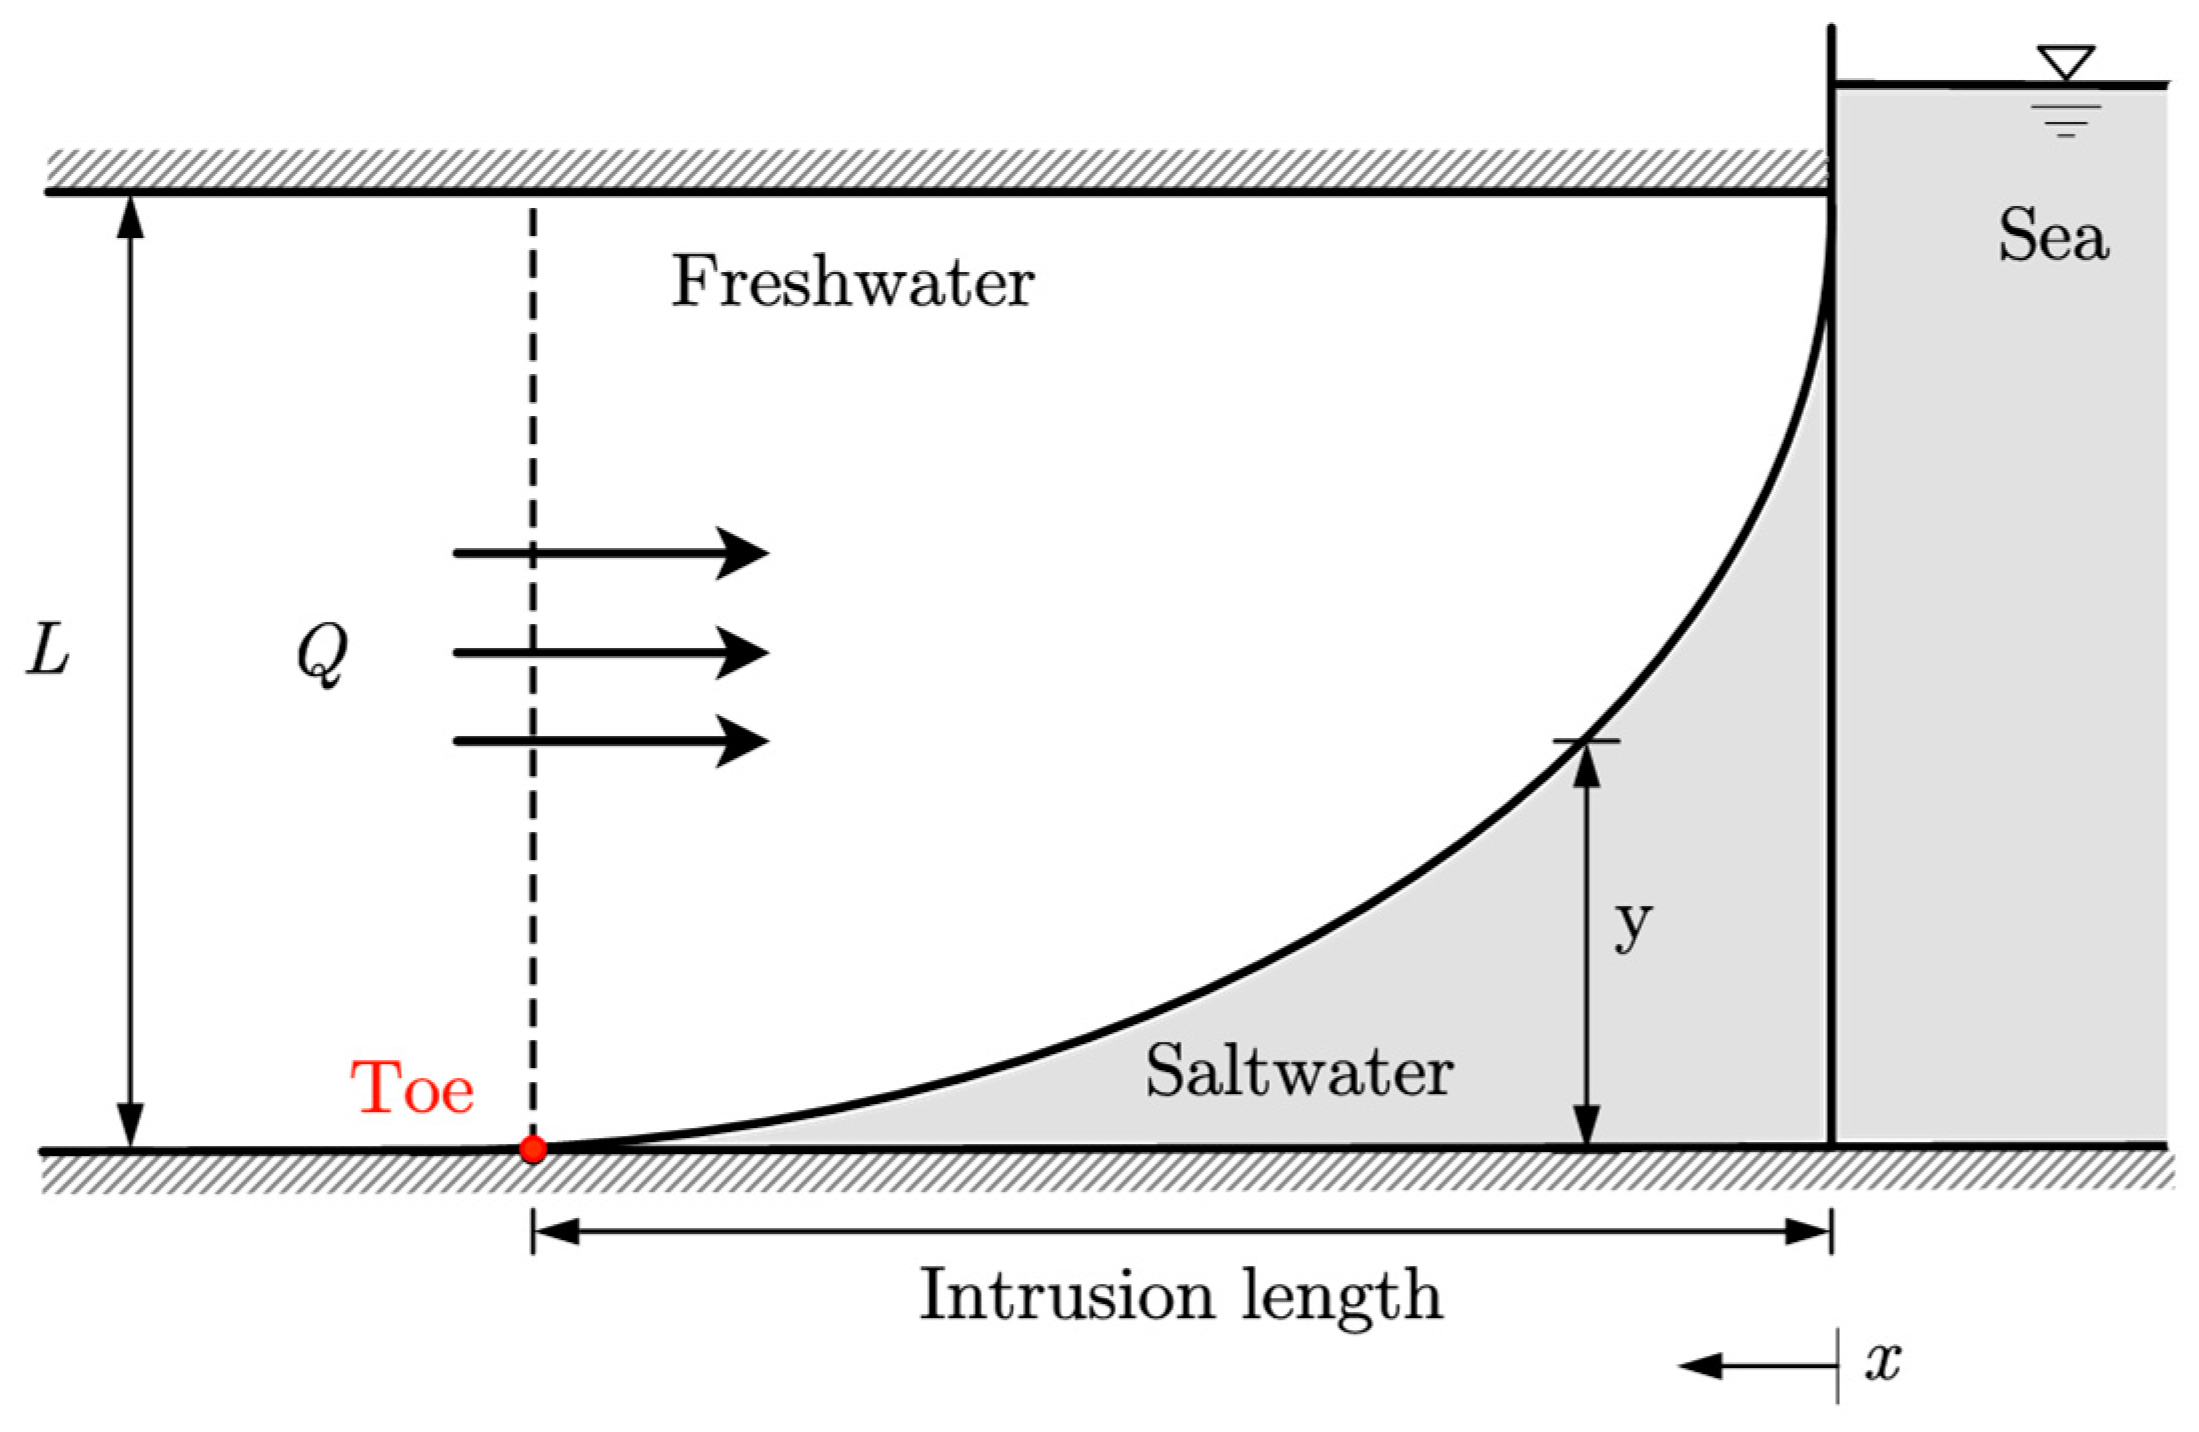
Figure 1. Problem configuration of seawater intrusion in a confined aquifer.
Sustainability 15 13287 g001
Figure 2. The Ghyben–Herzberg and Dupuit Approximations cancel the outflow face, resulting in the analytical interface (dashed curve a) above the real one (solid curve b).
Sustainability 15 13287 g002
Figure 3. Numerical model settings.
Sustainability 15 13287 g003
Figure 4. The saltwater–freshwater interfaces from analytical and numerical solutions of (a) Darcy’s Law and (b) the Brinkman Equation.
Sustainability 15 13287 g004
Figure 5. Intrusion length by the toe of 50% isohalines for two cases with different hydraulic conductivities ( K ).
Sustainability 15 13287 g005
Figure 6. Comparisons of (a) concentration, (b) horizontal velocity, and (c) vertical velocity, at P1(40,20) with different hydraulic conductivities.
Sustainability 15 13287 g006
Figure 7. Break-through process of P1 (pink dot) for Brinkman’s model in Case 1, showing concentration contours and flow velocities (logarithmic arrow size) after 1, 12, 22, 30, 40, and 60 days. The velocity turns towards the top right before entering the dispersion zone (ac) and turns back towards the left afterwards (df). The dispersion zone is outlined by the three black lines, which are 10%, 50%, and 90% isohalines, respectively.
Sustainability 15 13287 g007
Figure 8. Horizontal profiles of concentration at different depths for (a) Case 1 and (b) Case 2.
Sustainability 15 13287 g008
Figure 9. Intrusion length by the toe of 50% isohalines for two cases with different inflow rates ( q ).
Sustainability 15 13287 g009
Figure 10. Comparisons of (a) concentration, (b) horizontal velocity, and (c) vertical velocity, at P1(40,20) with different inflow rates.
Sustainability 15 13287 g010
Figure 11. Maximum differences of intrusion length by 50% isohalines.
Sustainability 15 13287 g011
Table 1. Values of parameters.
ParametersValues
Seawater density ρ s 1024 kg/m3
Freshwater density ρ f 1000 kg/m3
Dynamic viscosity μ0.001 Pa·s
Normalized seawater concentration c s 1 mol/m3
Normalized freshwater concentration c f 0 mol/m3
Fluid diffusion coefficient D F 3.56 × 10⁻⁶ m2/s
Porosity ε0.4
Tortuosity τ1
Hydraulic conductivity K 43.2 m/d
Longitudinal dispersivity α L 0.005 m
Transverse dispersivity α T 0.0005 m
Inflow rate q 64.8 m2/d
Raised sea level Δ h 3 m
Table 2. Parameters of different cases.
ParametersCase 1Case 2Case 3Case 4
Tidal amplitude A (m)/period T (h)0002/12
Hydraulic conductivity K (m/d)43.260.543.243.2
Inflow rate q (m2/d)64.864.838.964.8
The values changed from Case 1 are bolded for each case.
Disclaimer/Publisher’s Note: The statements, opinions and data contained in all publications are solely those of the individual author(s) and contributor(s) and not of MDPI and/or the editor(s). MDPI and/or the editor(s) disclaim responsibility for any injury to people or property resulting from any ideas, methods, instructions or products referred to in the content.