Article

Formaldehyde Removal by Expanded Clay Pellets and Biofilm in Hydroponics of a Green Wall System

1
Faculty of Biology, University of Latvia, 1 Jelgavas Str., LV-1004 Riga, Latvia
2
Institute of Food Safety, Animal Health and Environment, BIOR, 3 Lejupes Str., LV-1076 Riga, Latvia
3
Lafivents Ltd., 1B K.Ulmana Ave., LV-1004 Riga, Latvia
*
Author to whom correspondence should be addressed.
Sustainability 2023, 15(18), 13303; https://doi.org/10.3390/su151813303
Submission received: 10 August 2023 / Revised: 29 August 2023 / Accepted: 3 September 2023 / Published: 5 September 2023
(This article belongs to the Section Pollution Prevention, Mitigation and Sustainability)

Abstract

:
Air pollution with formaldehyde (FA) has been an emerging concern over recent years. This study was aimed at evaluating the contribution of green wall system-derived expanded clay pellets (ECP) and biofilms to FA removal in liquid phase. The effects of four plant species on this process were compared. An inhibition of the fluorescein diacetate hydrolysis activity of biofilm-derived microorganisms was detected during the exposure to FA in both air and liquid phases, and this effect was plant-species-specific. Liquid chromatography with a UV detector was applied for the quantification of FA. The FA removal activity of ECP in the liquid phase was 76.5 mg ECP−1 after a 24 h incubation in the presence of 100 mg/L FA, while the removal activity of the biofilm differed depending on the plant species used, with the highest values detected in the set with Mentha aquatica, i.e., 59.2 mg ECP−1. The overall FA removal from the liquid phase during 24 h varied in the range from 63% to 82% with the initial FA concentration of 100 mg/L. Differences in biofilm formation upon ECP enrichment were detected by using confocal laser scanning microscopy. These results contribute to the understanding of air biofiltration mechanisms in hydroponic systems.

1. Introduction

Volatile organic compounds (VOCs) such as formaldehyde (FA), acetone, ethyl acetate, benzene, and chloroform are common indoor pollutants [1]. Some VOCs, including FA, are carcinogenic, damage the nervous and circulatory system [2], and cause allergies, skin irritation, and respiratory diseases [3]. That are related to the sick building syndrome.
The problem of indoor FA emission and its remediation technologies have been recently reviewed by Peng et al. [4]. Industrial processing of various products, e.g., building materials, wood products containing FA-based resins, textiles, and electronic equipment are the main sources of indoor pollution with FA [4]. The indoor FA emissions tested in different countries varied in the range from 1.5 to 100 μg/m3 and may depend on environmental factors (e.g., temperature, humidity, season), as well as the age and type of buildings, air exchange rate, and other factors [4].
Various techniques are used to ensure indoor air circulation and purification from VOCs.
Building heating, ventilation, and air conditioning (HVAC) systems are commonly used in the developed world and are considered the simplest and most effective method for indoor air quality management; however, they require a substantial energy use. Additional methods, such as ozonation, activated carbon absorption, ionization, and other approaches, are effective only for specific pollutant types and can be potentially hazardous (e.g., ozonation) [5]. In comparison to conventional air conditioning systems, a green wall system (GWS) offers a sustainable green infrastructure with such environmental and social benefits as a reduction of energy demand, the improvement of air quality, carbon sequestration, and expanding green spaces [6]. Nevertheless, the relatively high construction and maintenance costs of GWS remain significant obstacles to their development [7].
A GWS consists of tanks filled with a substrate, different plant species, as well as irrigation and ventilation systems that provide water circulation and air flow within the GWS. Among the substrates used for air biofiltration systems, polyurethane [8], husk-based substrates with activated carbon [9], mixtures of compost–scoria–sugarcane bagasse [10], expanded clay pellets with different amendments [7,8,9], and other compositions have been reported. The effectiveness of air biofiltration in a GWS is highly dependent on the plant species [11]. The remediation of air contaminants by plant systems occurs via three routes, i.e., removal by the aerial parts of the plants, by the rhizosphere, and through the hydroponic media [5].
A broad range of plant species, which were considered suitable for indoor air phytoremediation, have been recently reviewed by Bandehali et al. [12]. The potted plant species were grouped according to the air pollutants, e.g., ozone, CO2, toluene, benzene, FA, particulate matters, and others. Among the best indoor plants for removing CO were mentioned Chlorophytum comosum, Dracaena deremensis, and Ficus sp.; for VOCs—Epipremnum aures, Epipremnum aureum, and Philodendron, respectively. Yet, a high efficiency of air purification was also shown by Hemigraphis alternata, Tradescantia pallida, Hedera helix, Asparagus densiflorous, Hoya camosa, and Crassula portulacea [13]. One of the tools appropriate for selecting plants is the Air Pollution Tolerance Index (APTI), calculated according to the biochemical properties of leaves (e.g., the relative water content, total chlorophyll, ascorbic acid, leaf extract pH) [12].
The mechanisms of FA remediation are dependent on plant species, the GWS design, and operational and environmental conditions. In particular, Xu et al. [14] reported that FA removal by a biofilter with Chlorophytum comosum L. occurred by assimilation in roots, followed by microbial degradation, which was stimulated by root exudates. The removal of about 60% of FA was detected in the first 5 cm high biofilter at a 406 L/h flow rate at 5–207 mg/m3 FA inlet concentrations [14]. The role of FA-degrading bacteria, i.e., Ochrobactrum intermedium, was studied in the biofiltration system planted by C. comosum. Comparing three inoculation methods, i.e., root irrigation, acupuncture injury to leaves, and acupuncture injury to stem, the latter was the most efficient. In the sets with bioaugmented C. comosum, the average FA removal was higher by 20% during daytime and 63% at night, comparing with respective controls [15]. A study with E. aureum was performed in a sealed chamber and demonstrated the FA removal efficiency by stems, which reached 0.089 mg/m3 h with a rate of purification of 40% [16].
Formaldehyde removal was reported by such plant species as Hedera helix, Chrysanthemum morifolium, Dieffenbachia compacta, Epipremnum aureum grown on stone, expanded clay, activated carbon [17], Hedera helix [18], Chlorophytum comosum grown hydroponically with Hoagland’s solution [19], Chamaedorea elegans grown in loamy soil [20], Chlorophytum comosum, Aloe vera, and Epipremnum aureum grown in dry fluvo-aquic soil [21]. Several studies were focused on the application of genetically modified plants, e.g., Epipremnum aureum (mammalian cytochrome P450 2e1) in order to enhance their detoxifying activity against VOCs [1]. The FA dehydrogenase (FADH) activity in plants was recently suggested as a criterion for the assessment of the FA remediation effectiveness in air at lower concentrations [22]. The mechanisms of FA removal are based on combining C3 (Calvin cycle) and Crassulacean acid metabolism (CAM) [23]. Formaldehyde can be transported from air to the rhizosphere by plants via foliar uptake and subsequent movement to the root zone [24].
Another aspect of the effective functioning of GWSs is related to the microbial activity, which strongly depend on plant species, substrate, operating conditions, and the chemical composition of air. As FA is highly water-soluble, it is believed that airflow brings FA to the liquid phase of a hydroponic system, where FA can be subjected to microbial biodegradation. In turn, the metabolic activity of microbial communities is highly variable. For example, FA can be produced inside a biofilter as a secondary emission, being one of the first metabolic intermediates in the consumption of methanol in methylotrophic microorganisms [19,20].
Moreover, FA is a microbial metabolite of plant-derived methoxylated aromatic chemicals [21,22]. An optimization of operating conditions towards effective FA removal can notably influence the microbial abundance and activity. Thus, the addition of ozone was shown to stimulate the removal of FA in a biofiltration system. At the same time, ozone inhibited the production of exopolymeric substances in a biofilm without affecting cell viability [25]. Among FA-degrading bacteria, different proteobacteria have been detected, e.g., Pseudomonas, Methyloversatilis, Methylophilus, and Methylobacterium [26].
Our preliminary studies showed a strong impact of the plant species used in a GWS on the biofilm microbial community composition on expanded clay pellets (ECP). We hypothesized that the removal of FA from air could be managed by choosing the plant species, which in turn would influence the rhizosphere’s microbial community in a hydroponic system. This study was aimed at evaluating the effect of plant species used in a GWS on the FA removal by ECP and a biofilm (either active or inactivated) in the liquid phase. Four plant species were compared, i.e., Mentha aquatica spp. litoralis, Chlorophytum comosum, Anthurium andraeanum, and Epipremnum aureum.

2. Materials and Methods

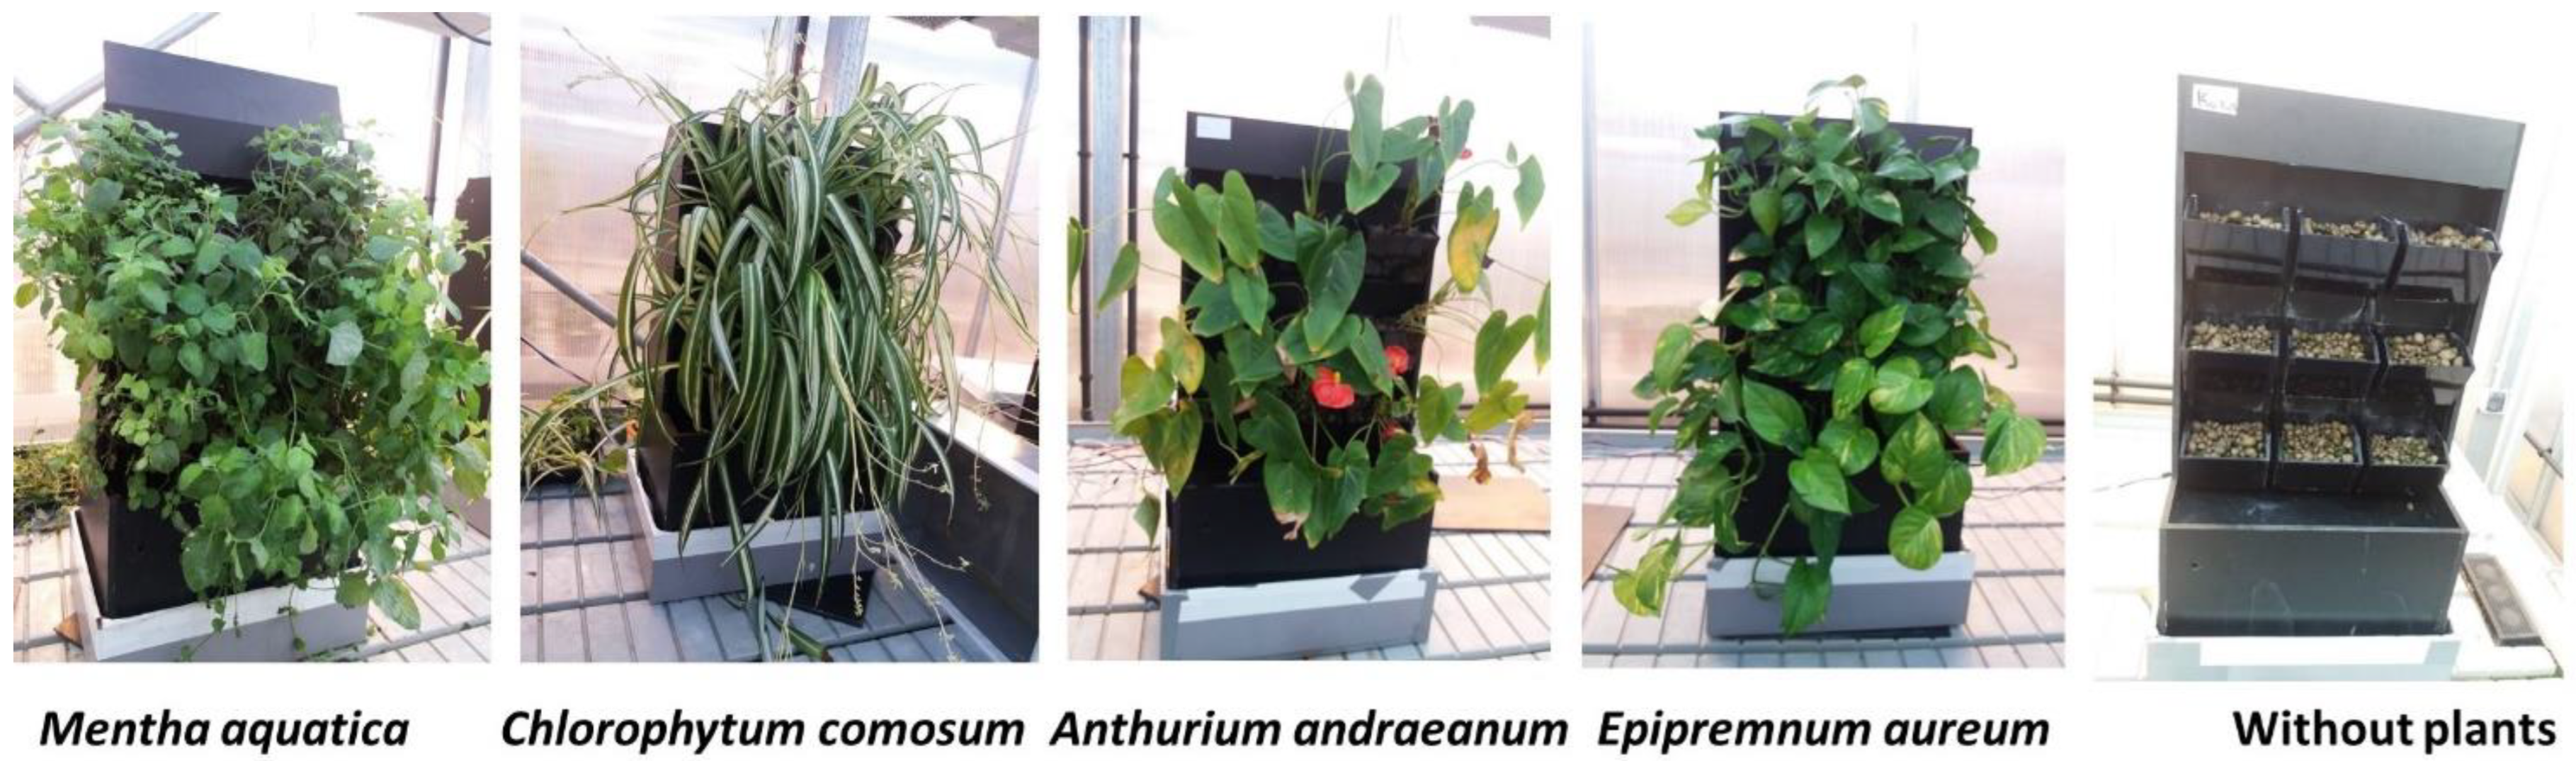
2.1. The Assembly of a Green Wall System

The ELPO GWS models were made from PVC foam (frame) and acrylic glass (pots). The substrate was expanded clay pellets (LECA 10-20, Leca International, KGaA-Lübeck, Denmark). Plant cuttings were taken from the University of Latvia Botanical Garden (Chlorophytum comosum), wholesale sources (Anthurium andraeanum, Epipremnum aureum), and from material harvested in the wild (Mentha aquatica spp. litoralis). Plants were grown in the modules for 30 days (Figure 1). Then, the modules were exposed to FA (at a 7 ppm concentration) for 1.5 h every 4 days, for a total of 6 times over a 21-day period. The fertilizer (1:1 Yaratera KRISTALON RED and CALCINIT, Madresfield, UK) concentration in the water was kept at EC 1.2 mS. The conditions during plant exposure to FA were as follows: the chamber with the biofilter was illuminated with LED lamps, providing a photosynthetic photon flux density of about 80 μmol/m s near the leaves. To ensure a stable concentration of FA in the air flowing through the biofilter, a plastic tube was used, which was immersed in a water bath at 80 °C. The airflow was provided by standard 120 × 120 mm axial fans and was controlled by a diffuser with an air flow of 17 ± 2 m3/h. The source of FA was a ~37% aqueous solution (catalog no. 1.04001.1000 from Merck KGaA, Darmstadt, Germany). The concentration of FA in the air was between 0 and 10.5 ppm as determined by an FA gas measuring device with a concentration range of 0 to 200 ppm and a detection limit of 2 ppm (Dragger PAC 8000, Drägerwerk AG & Co. KGaA, Darmstadt, Germany).

2.2. Enrichment of the Biofilm

The tests were performed with ECP coated with a biofilm that was developed during our previous experiment with a GWS (p. 2.1). The biofilm enrichment was performed with the aim to enhance the biofilm metabolic activity by providing easily catabolized carbohydrates that are known to be present in root exudates [27]. The enrichment medium contained a complex mineral fertilizer VITO (Spodriba, Dobeles Novads, Latvia) and carbohydrates. The composition of minerals (%) in the stock was as follows: N-NO3—2.5; N-NH4+—1.2; P2O5—2.1; K2O—4.7; Mg2+—0.65; B3+—0.002; Cu2+—0.0005; Fe3+—0.08; Mn2+—0.01; Mo—0.0002; Zn2+—0.003. The stock was added to the enrichment medium in the concentration of 0.5%. Glucose, sucrose, lactose, and fructose were used in equal concentrations, i.e., for the 1st enrichment stage—0.05% each; 2nd stage—0.10%; and third stage—0.15%. The period of incubation at each enrichment step was 72 h at 23 °C. The enrichment was performed in 1 L glass columns. Each column was filled with ECP, representing all three height levels of GWS. Unused (new) ECP were rinsed with sterile deionized water and used as a control.

2.3. Measurement of the Fluorescein Diacetate Hydrolysis Activity

The immobilized microorganisms were detached from ECP for further testing of the microbial enzyme activity. Test tubes with 3 submerged pellets were placed in an ultrasonic bath and were subjected to ultrasound for 5 min at 50 W. The obtained suspension was transferred to a 12-well plate (600 μL/well). Each well was amended with 2.4 mL of a fluorescein diacetate (FDA) reaction mixture (4 mg of FDA, 2 mL of acetone, 48 mL of 60 mM phosphate buffer, pH 7.6) and the plate was incubated for 48 h at 37 °C. After incubation, 600 μL of acetone was added to each well in order to stop the reaction. After centrifugation at 10,000 rpm for 5 min, 200 μL portions of the supernatant were added to the wells of a 96-well microplate. The concentration of hydrolyzed FDA was determined spectrophotometrically at OD492 in a Tecan Infinite F50 microplate reader, using a calibration curve (y = 0.0175x + 0.0656) with R2 = 0.99, which was prepared with thermally hydrolyzed FDA.

2.4. Microscopy Study

The samples were analyzed using a Leica DM RA-2 confocal laser scanning microscope (CLSM) (Wetzlar, Germany) equipped with a TCS-SL confocal scanning head. The biofilm on ECP was fixed with 70% ethanol and afterwards stained with 20 mM propidium iodide (PI). The PI was excited at the 488 nm band, and fluorescence was detected between 600 nm and 640 nm. The thickness of the biofilm was measured by focusing on the very top of the biofilm and the substrate level (the base of the biofilm). The recorded readings (three ECP fragments with three measurement points on each) were used to determine the average biofilm thickness.

2.5. Incubation of Expanded Clay Pellets with a Biofilm in Formaldehyde

Samples of ECP obtained from the GWS modules followed by enrichment (p. 2.2), as well as new ECP were used. The incubation was performed in sterile 20 mL polypropylene tubes containing three pellets and 9 mL of liquid phase. Each pellet was weighted prior to the testing. Three types of liquid phase were used: (i) 100 mg/L FA; (ii) 100 mg/L FA amended with NaN3; (iii) water. The tubes with 9 mL of 100 mg/L FA without EPC served as control. Samples were incubated for 24 h at 23 °C in triplicate. The tubes with 9 mL of 100 mg/L FA without ECP served as control.

2.6. Determination of Formaldehyde Concentration in the Liquid Phase

First, 1 mL of sample and 1 mL of 0.2% 2,4-dinitrophenylhydrazine solution in acetonitrile:methanol (1:1) solution was added to a 15 mL plastic tube and the mixture was warmed in a water bath at 70 °C for 30 min. Then, the derivatization reaction of FA was performed while shaking in the heated water bath. After the completion of the reaction, a 10 μL aliquot of the sample was injected into a high-performance liquid chromatography instrument (UltiMate 3000, ThermoFisher Scientific, Waltham, MA, USA). The compounds were separated on a Luna C18 4.6 × 150 mm 5 µm column and detected by a UV detector at a 355 nm wavelength. Water:acetonitrile (40:60, v/v) was used as the mobile phase at the flow rate of 0.8 mL/min. The assay demonstrated a linearity of R2 > 0.99, and the precision was expressed as a <10% standard deviation of repeated measurements.

2.7. Screening of Carbon Sources Stimulating a Microbial Growth in the Presence of Formaldehyde in EcoPlates™

The catabolic diversity of the microbial community in the biofilm was determined by using Biolog EcoPlates™ (Biolog, Inc., Hayward, CA, USA). The measurement of the substrate metabolism with an EcoPlate™ was based on the color formation from a tetrazolium dye, a redox indicator. The cell suspension was diluted with a sterile 0.85% NaCl solution, then inoculated (100 μL) into each well and afterward incubated for 72 h at 23 °C, with periodic shaking and measurement (once per 24 h). Additional plates were prepared as described above but amended with FA (50 mg L−1). The microbial activity in each well was expressed as the average well color development measured at 620 nm after 24 h, 48 h, and 72 h, using a Tecan Infinite F50 microplate reader (Männedorf, Switzerland). The results of the Biolog profiles were represented by the Shannon diversity index, which was calculated by the following equation (Equation (1)):
H′ = −Σ pj log2 pj
where pj is the relative color intensity of an individual well [28].

2.8. Statistical Analysis

The data are expressed as the mean value ± standard deviation. The differences between the treatments were assessed by the student’s t-test and a one-way analysis of variance (ANOVA) in Excel, MS Office365. The number of experiments were n = 9 for testing the enzyme activity and n = 3 for the measurements of FA concentration.

3. Results

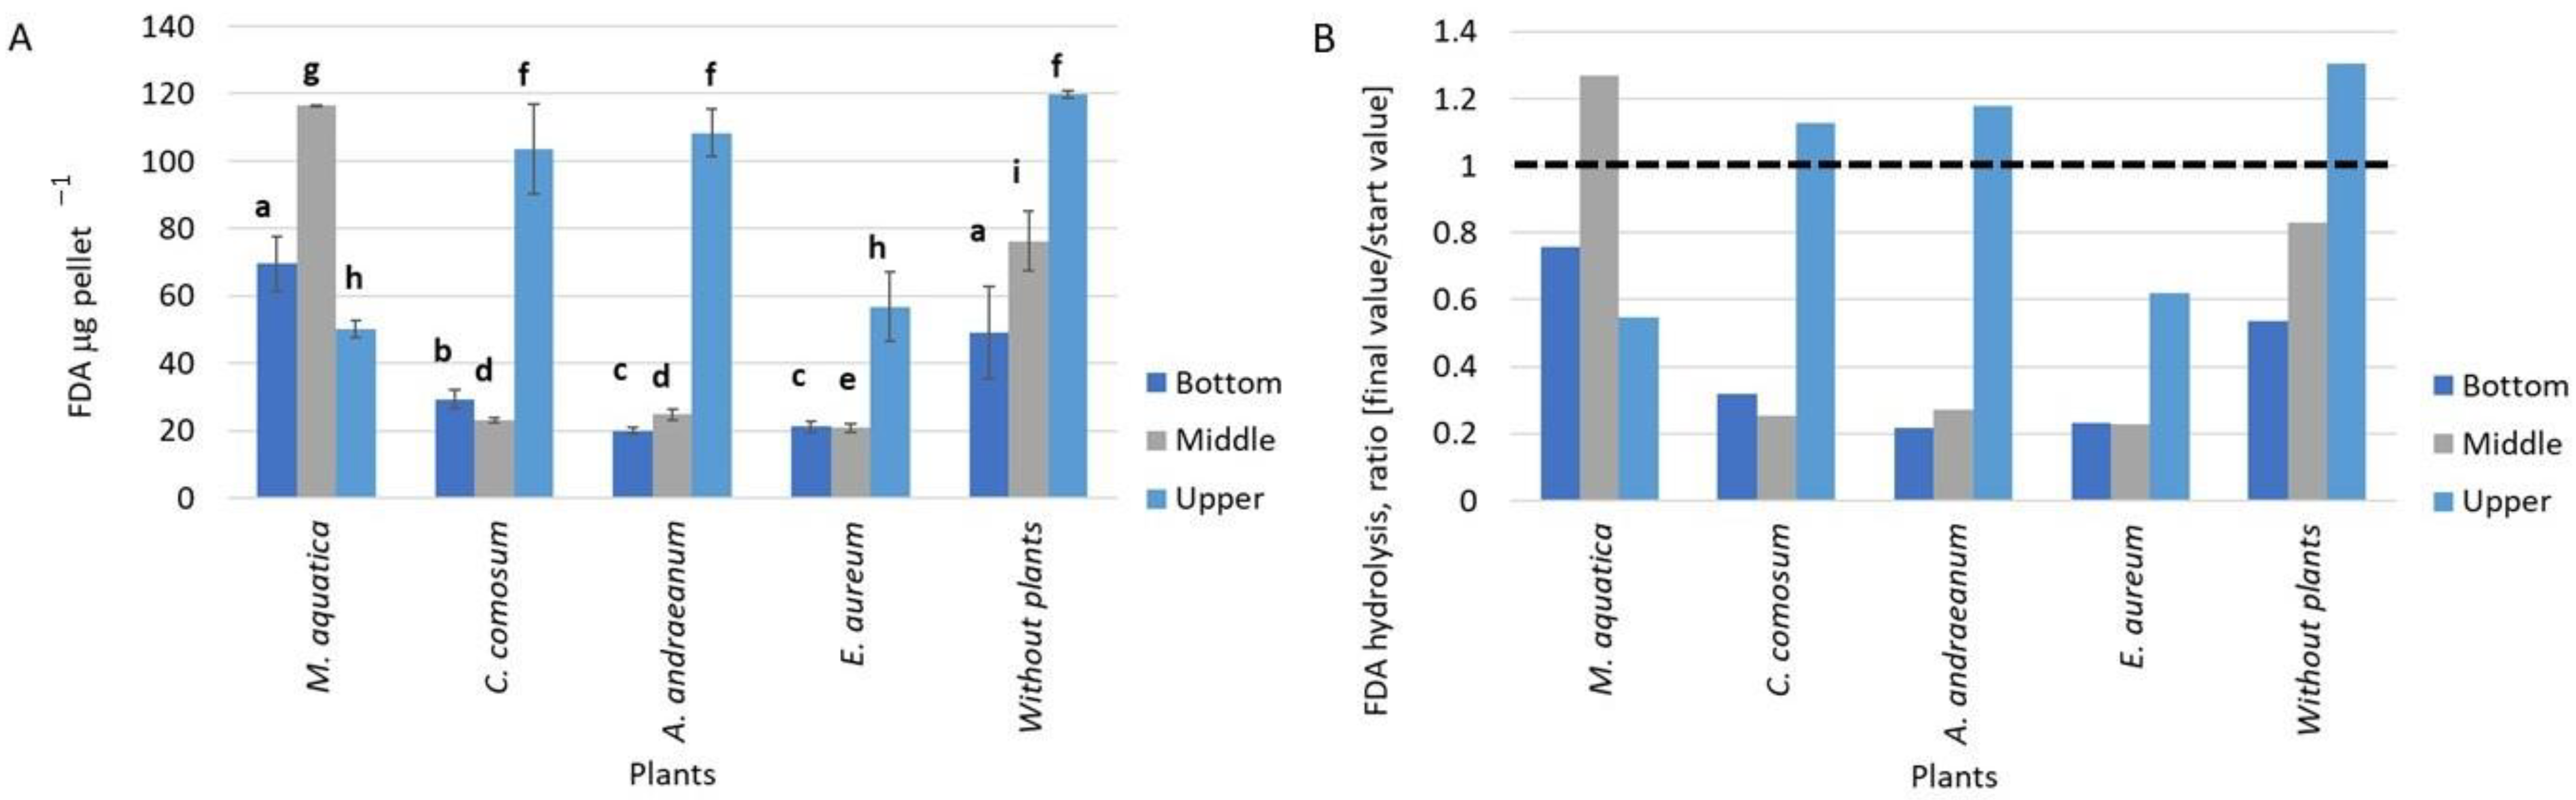
3.1. The Fluorescein Diacetate Hydrolysis Activity in Biofilms on Expanded Clay Pellets Obtained at Different Height Levels of the GWS Modules with Different Plant Species

An important criterion for characterizing the activity of microorganisms is their enzymatic activity. The FDA hydrolysis activity of biofilms was determined for ECP that were sampled at different height levels of the GWS modules with different plant species. The lowest FDA hydrolysis activity was found in biofilms taken from the modules of the GWS with C. comosum, A. andraeanum and E. aureum at the bottom and middle levels. The FDA hydrolysis activity of the same plants at the upper level was significantly (p < 0.05) higher than at the bottom and middle levels.
The FDA hydrolysis activity of biofilms without plants at the bottom and middle levels was significantly higher (p < 0.05) than in samples with the three plant species mentioned above. At the middle level, it was 0.83 µg ECP−1 and at the bottom level, −0.54 µg ECP−1, respectively (Figure 2A). An exception was the M. aquatica plant, which was associated with a biofilm showing a significantly (p < 0.05) higher FDA hydrolysis activity than other plants at the middle and bottom levels, i.e., 1.27 µg ECP−1 and 0.76 µg ECP−1, respectively. Thus, the upper level showed the most suitable conditions for the activity of immobilized microorganisms on ECP under the hydroponic conditions in the GWS.
The microbial enzyme activity changes in the GWS were assessed after operating the GWS for 21 days with a periodic exposure to FA. As shown in Figure 2B, at the majority of sampling sites (different heights of the GWS, plant species) the FDA decreased compared to the initial state (i.e., before 15 days of pretreatment with volatile FA). The exception was the ECP from the bottom levels with C. comosum, A. andraeanum, and without plants, which showed an increased FDA hydrolysis activity at levels up to 13%, 18%, and 30%, respectively (Figure 2B). In the set with M. aquatica on the middle level, the FDA hydrolysis was higher by 27% as compared to the starting point (Figure 2B).

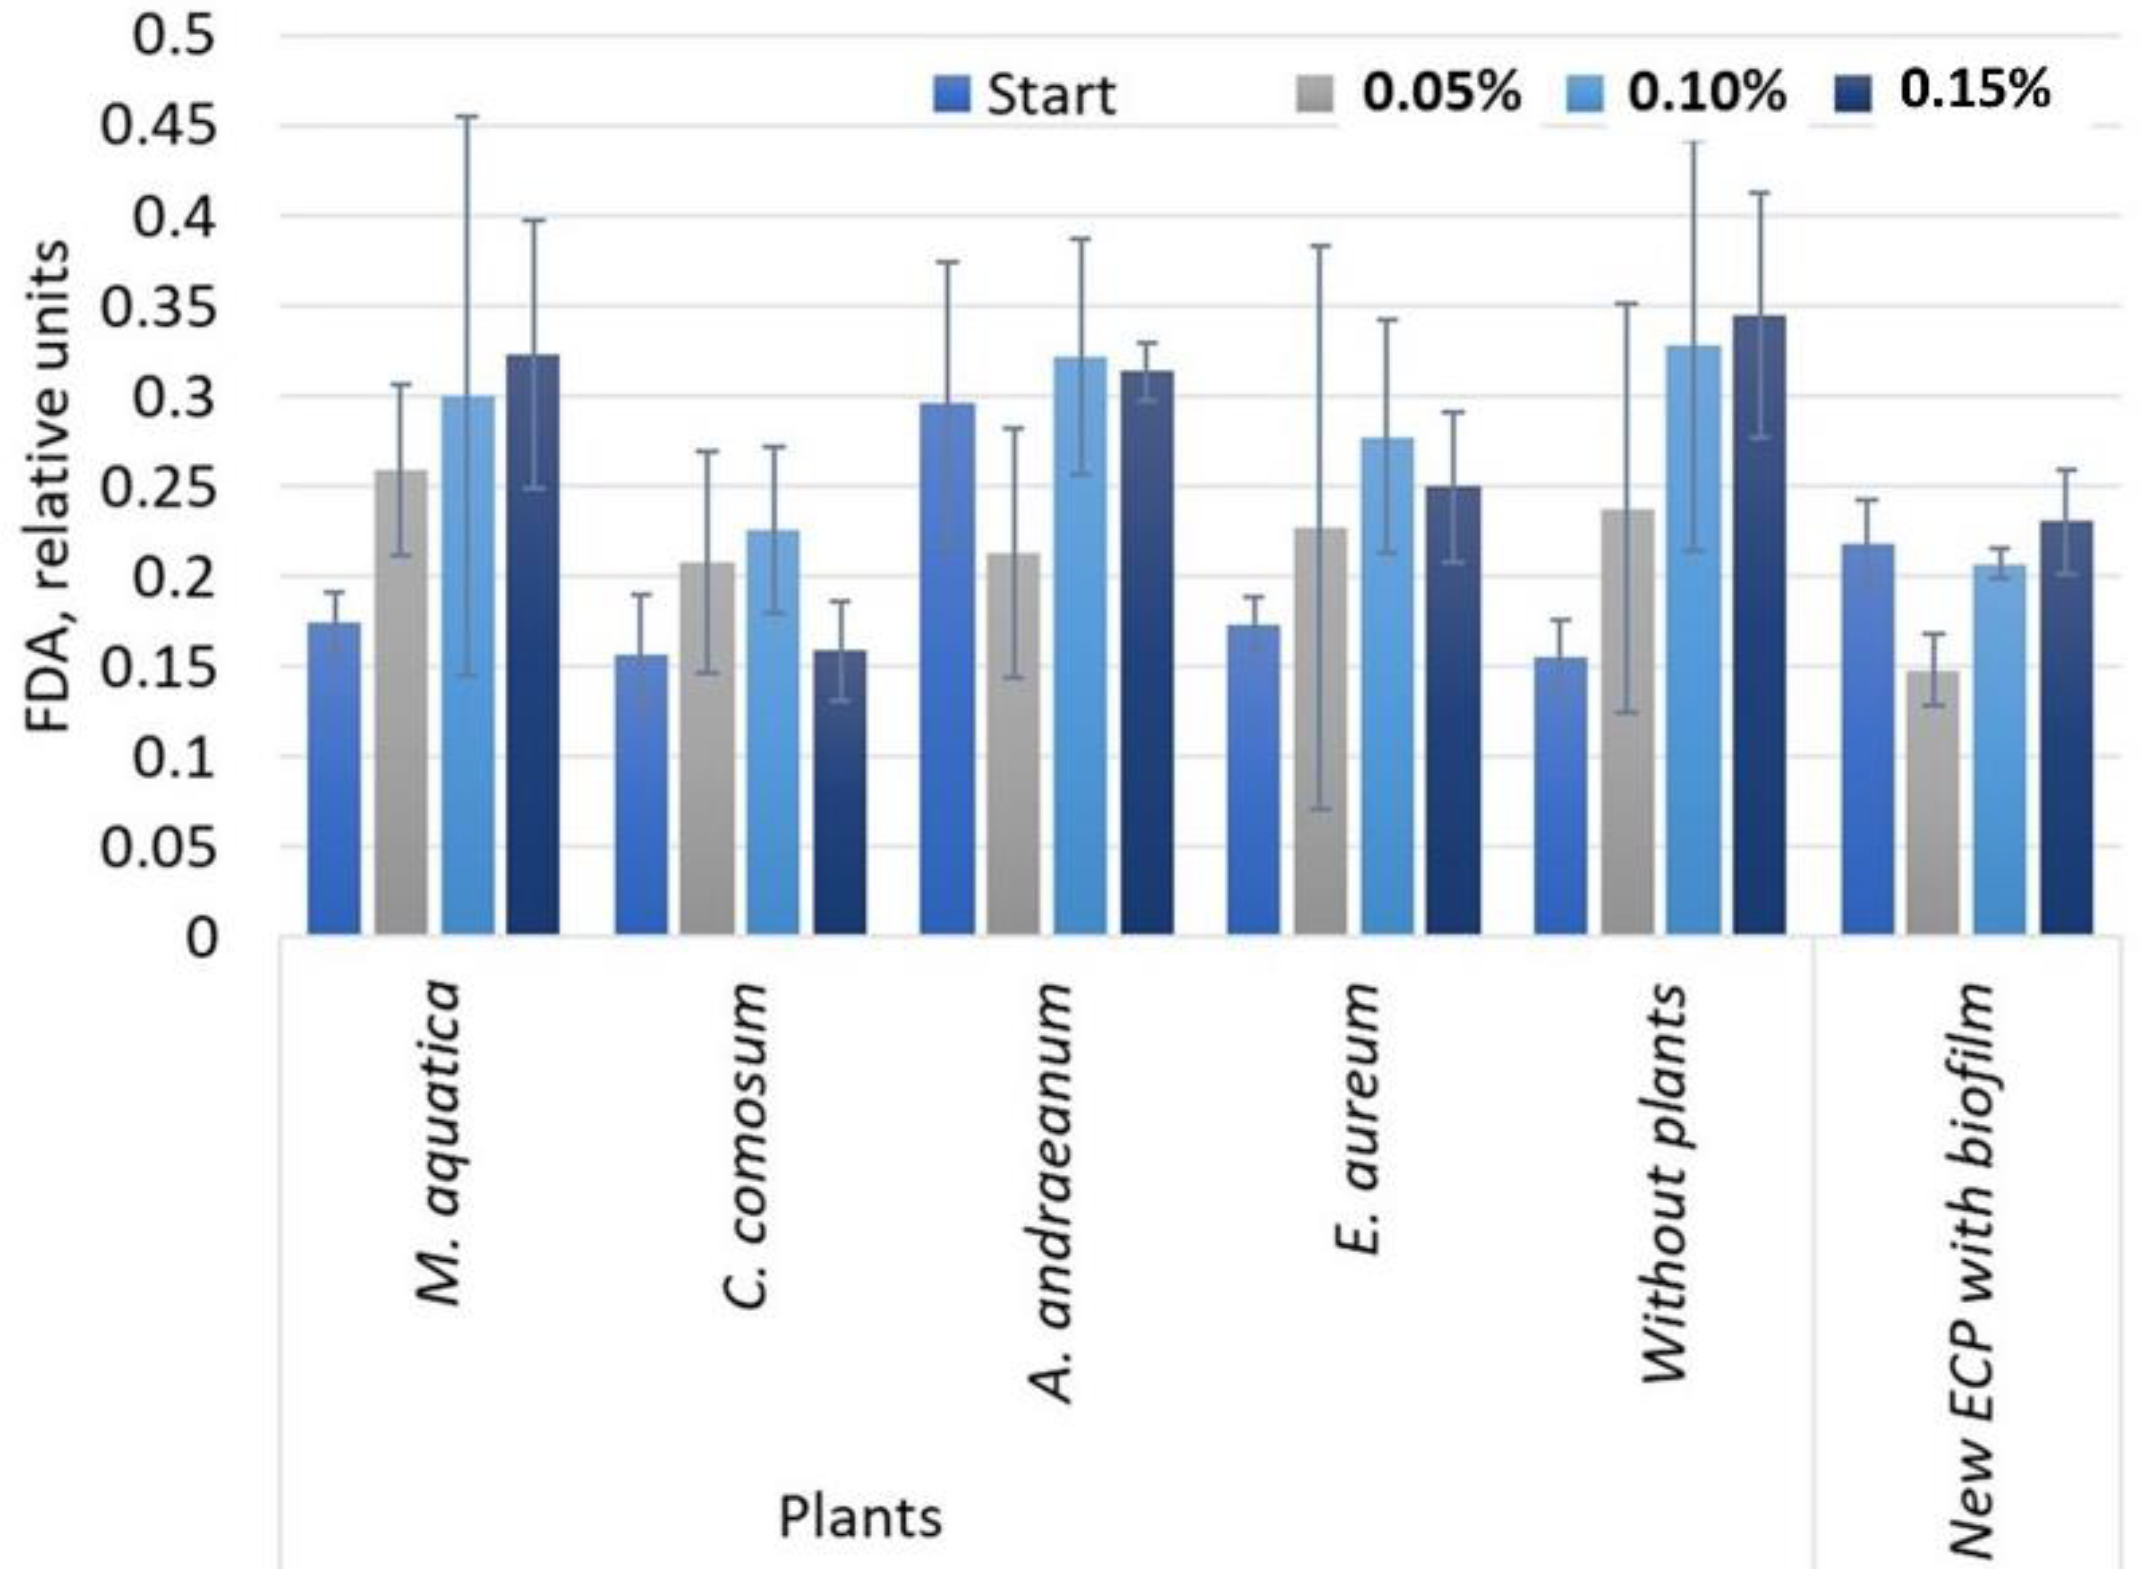
3.2. Biofilm Enrichment in the Synthetic Medium with a Gradual Increase of Carbohydrates

In order to maintain the activity of the biofilm microorganisms on the ECP, a carbohydrate mixture consisting of four sugars (glucose, sucrose, lactose, and fructose) was added at different concentrations of 0.05%, 0.10%, and 0.15% each. In addition, 10% of the mineral fertilizer VITO was added, which is often used for promoting plant growth, containing the necessary macro- and micronutrients. The FDA hydrolysis activity was determined on the surface of ECP after the three-step biofilm enrichment. The results are shown in Figure 3.
For a large part of the analyzed samples, a tendency was observed where the enzyme activity increased with the increasing sugar concentration. The more pronounced stimulation due to sugar addition was detected for samples from the sets with M. aquatica, E. aureum and without plants (Figure 3). The results of sugar addition were satisfactory for further experiments on FA removal from a liquid phase. First, the enzyme activity of the biofilm was increased; second, the biofilm activity on ECP in the column was expected to become even more than it was in the GWS.
The CLSM allows a 3D visualization of the biofilm architecture and can be used to quantify biofilms on opaque surfaces, such as ECP. In our study, the ECP before enrichment and after the final, i.e., third, enrichment step were tested for the presence of a biofilm. The average thickness of the biofilm found on the ceramic surface in the enriched set was significantly (p = 0.0004) greater than that on nonenriched pellets, i.e., 45.9 ± 23.7 and 12.0 ± 6.4 μm (n = 9), respectively (Figure 4).

3.3. Determination of Formaldehyde Removal from the Liquid Phase by Expanded Clay Pellets Coated with a Biofilm

In order to evaluate the removal of FA by ECP coated with a biofilm, a 24 h incubation of pellets in 100 mg L−1 FA was performed. The remaining FA concentrations in the liquid phase after incubation are summarized in Figure 5A. A comparison of ECP with an intact and inactivated biofilm showed that an intact biofilm provided a significantly (p < 0.05) higher FA removal effectiveness than a biofilm treated with NaN3. Sodium azide has the ability to inhibit the activity of microorganisms [29]. This approach is used when the role of metabolically active cells should be distinguished from passive sorption processes [30]. Regarding the role of ECP in FA removal, additional controls with new sterile ECP showed their absorption capacity of 76.5 μg ECP−1 under the tested conditions (Figure 5B). It is important to note that different plant species in the GWS indirectly influenced the FA removal efficiency by the microbial community, which had developed in the rhizosphere of the tested plants. Thus, the highest amount of degraded/sorbed FA (59.2 μg ECP−1) was observed in the set with M. aquatica. Sets with C. comosum and A. andraeanum also showed a rather high FA removal efficiency, i.e., 45.4 μg ECP−1 and 47.9 μg ECP−1, respectively (Figure 5B).

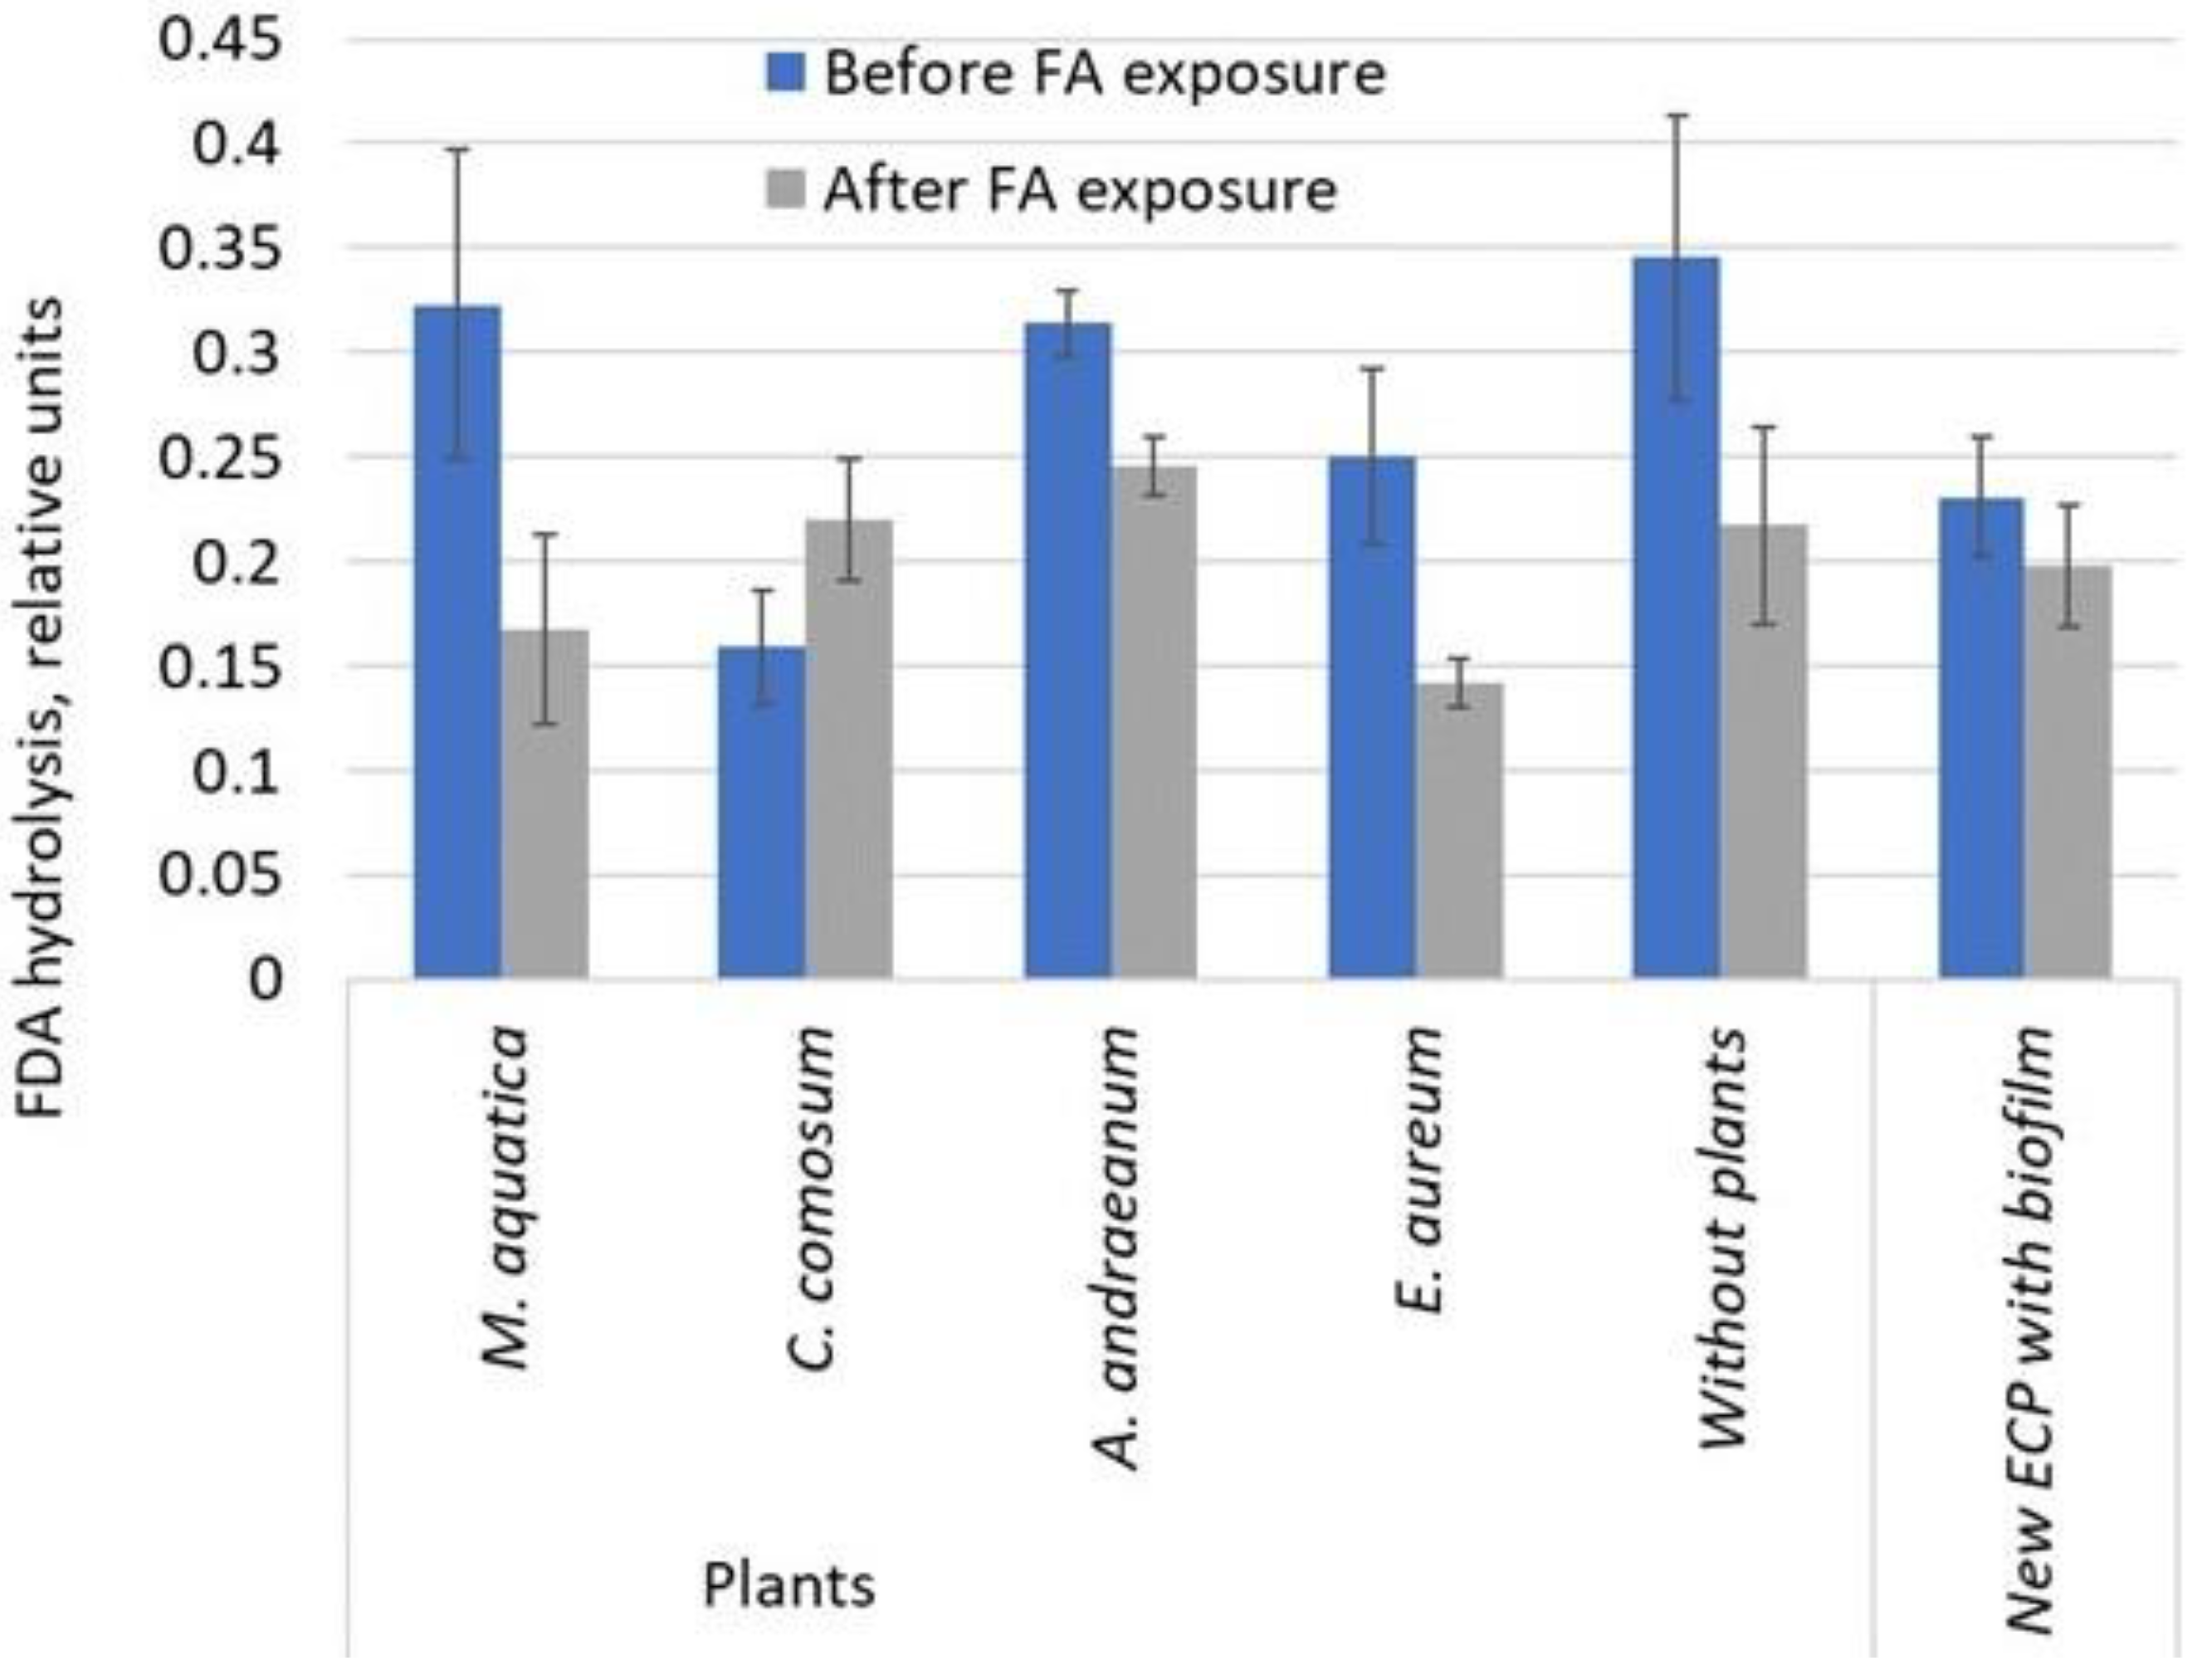
3.4. Determination of the FDA Hydrolysis Activity in a Biofilm on ECP after 24 h Exposure to FA in Liquid Phase

In order to determine how the addition of FA at a concentration of 100 mg/L affected the activity of microorganisms immobilized on ECP, the FDA hydrolysis activity was determined before and after the addition of FA. The obtained results are shown in Figure 6. For all samples analyzed, except for C. comosum, the enzyme activity decreased after the addition of FA. In the case of M. aquatica, the enzyme activity decreased by 50% compared to the results before the addition of FA, A. andraeanum by 19%, and E. aureum by 44%. In the sample without plants, the FDA hydrolysis activity decreased by 37%, but in the control experiment with new ECP, it decreased by 13%. The enzyme activity of a biofilm developed in the GWS with C. comosum increased by 38% after the addition of FA. Thus, these results demonstrated distinct differences of microbial response towards FA depending on the plant species used in the hydroponic culture.

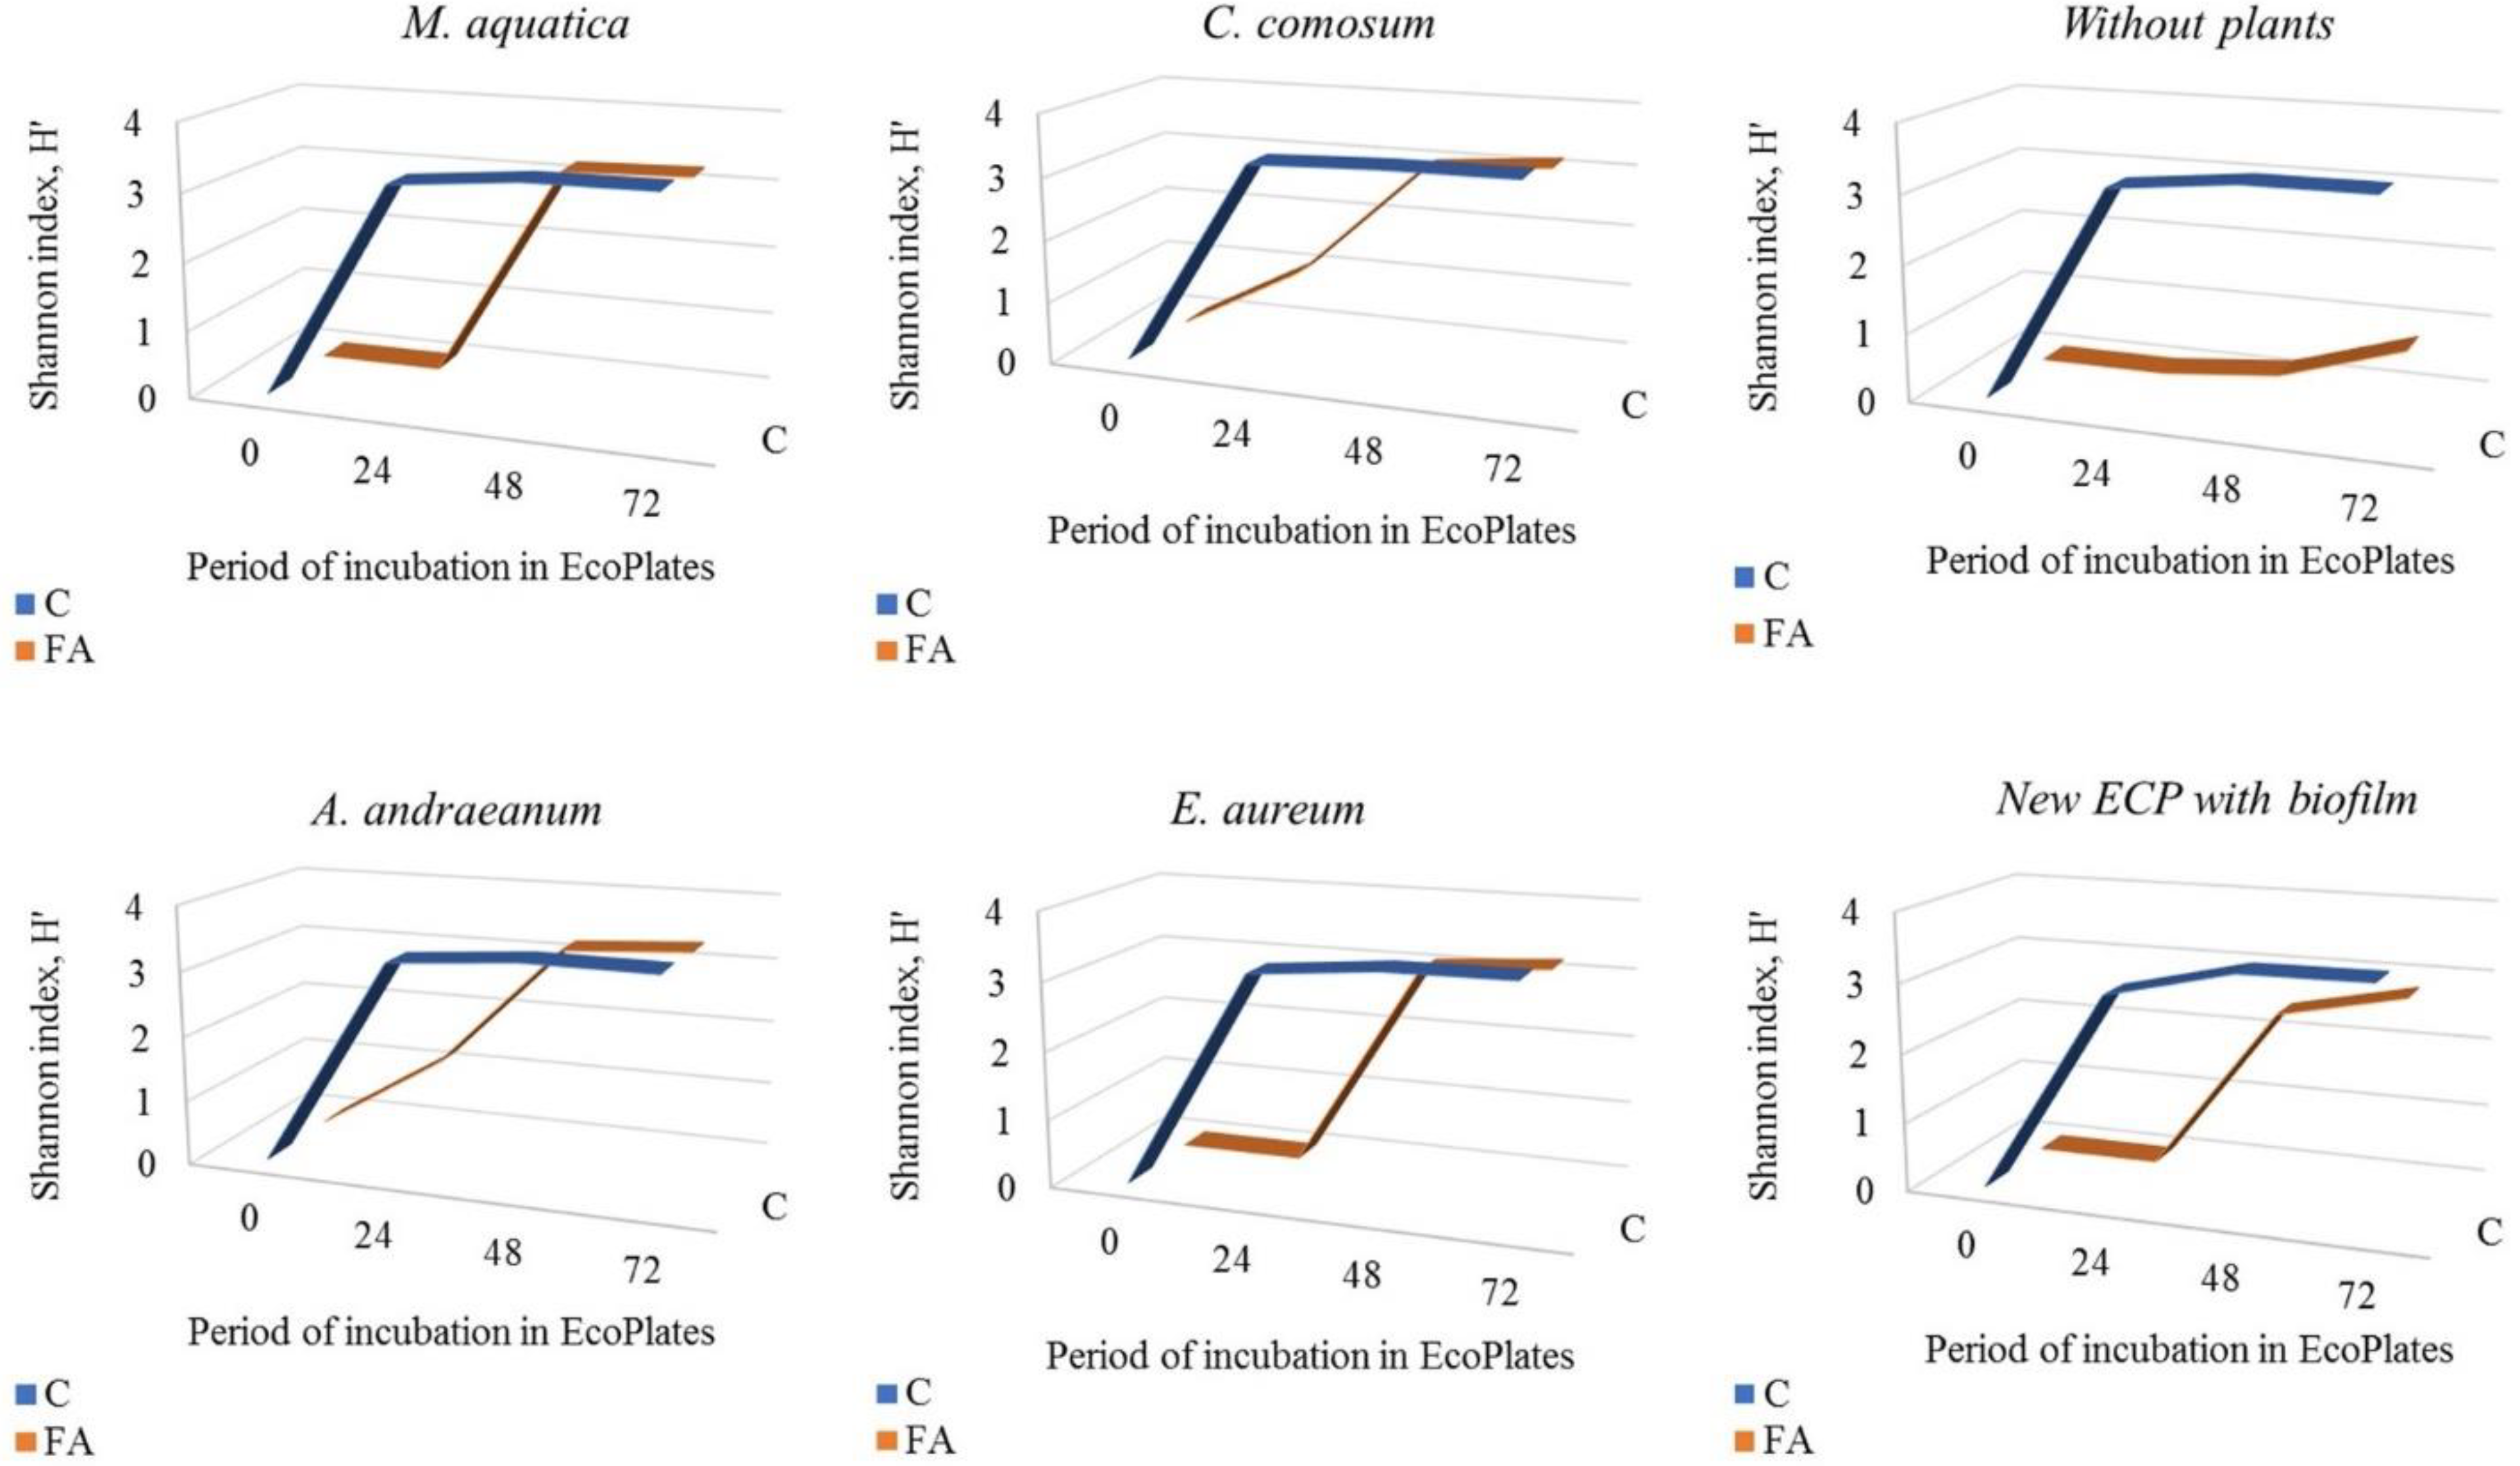
3.5. Screening of Carbon Sources Stimulating Microbial Growth in the Presence of FA in EcoPlates™

The metabolic activity of six microbial communities in the presence of 50 mg/L FA was screened in EcoPlates™. The microbial growth in EcoPlates™ differed depending on the origin of the microorganisms and the presence of FA. The Shannon diversity index (H′) was calculated for each sample dynamically. As shown in Figure 7, FA inhibited the microbial metabolic activity for the first 24 h of incubation, while a further incubation (48 h) resulted in similar H′ values in the sets with FA and without it, except those derived from the nonplanted GWS and new ECP (i.e., nonincubated in the GWS, but enriched as described in p. 2.2). Among the 31 substrates available in EcoPlates™, some of them supported microbial growth in the presence of FA. Moreover, the growth intensity was higher than in the control experiment without FA. This effect was dependent on the origin of the microbial community and the added carbon source. The data on microbial response towards FA in the presence of different carbon substrates are summarized in Table 1. Itaconic acid stimulated microbial growth in the presence of FA in four experimental sets. Specifically, this substrate amended with 50 mg/L FA stimulated the growth of microorganisms obtained from ECP with C. comosum, A. andraeanum, and E. aureum up to 21%, 37%, and 49%, respectively, as compared to the respective controls (Table 1). Beta-methyl-D-glucoside with FA stimulated microbial growth in the set with A. andraeanum to 41% and 26% in the set with phenylethyl-amine (Table 1). Interestingly, microbial communities derived from the nonplanted sets from the GWS and new ECP with a biofilm showed that D-glucosamic acid stimulated microbial growth in the presence of FA, reaching levels of 51% and 33% higher than in the control experiment, respectively (Table 1).

4. Discussion

The mechanisms and effectiveness of air biofiltration in GWS depend on a broad range of factors related to plant species, fertilizers, microbial community structure, air contamination load, airflow rate, environmental conditions (e.g., seasonal variations), and the GWS design [31,32,33,34]. Three groups of factors, i.e., the sorption capacity of ECP, the specific impact of plant species on the biofilm activity/metabolic diversity, and their ability to remove FA, were tested.
First, the sorption of FA by ECP was characterized at the level of 76.5 μg ECP−1 under the tested conditions. As was reported by Wrobetz et al. [35], different filtering media greatly vary in terms of FA sorption. Thus, four porous materials, i.e., growstone, hydroton expanded clay, coco coir, and activated carbon showed average sorption potentials of 0.241, 0.572, 42.36, and 174.13 mg/g media, respectively. This study was conducted in a column type setup at a 0.4 ppm inlet concentration of gaseous FA [35]. Although the data mentioned above cannot be directly related to the present study because of different experimental designs, nevertheless, the “theoretical” sorption capacity should be considered for choosing filtering media. Such media should be compatible with higher plants, microorganisms, as well as meet the requirements of the GWS maintenance.
Second, different plant species had specific effects on the biofilm activity on ECP. The plant-species-specific effects could be explained by the following assumptions: (i) the phytoremediation potential for FA removal depends on distinct FA distribution in various parts of the plant, as well as the environmental conditions (light intensity, nutrients, substrate, etc.); (ii) the differences in a rhizosphere’s microbial community structure are dependent on the plant species regardless of FA exposure, plant-specific physiological response to FA, and physiological characteristics of the microbial community (FA resistance, degradation potential, shift in the community structure due to plant and microbial response to FA, expression of specific enzymes, e.g., the glutathione-dependent FA dehydrogenase) [17,34,36]. The use of bamboo and dracaena in botanical walls has shown a high effectiveness in FA reduction [37,38]. In a study by Wu and Yu, Chlorophytum comosum gave the best FA reduction, followed by Schefflera octophylla, with Chamaedorea elegans being the least effective [33]. Nevertheless, enhanced concentrations of FA hindered its removal by plants. Abedi et al. [39] recently reported that the highest single-pass FA removal efficiency occurred at the lowest air flow rate (0.8 L/s) and concentration (0.3 mg/m3) through a 0.25 m2 filter. Any increases in airflow rate resulted in a reduced effectiveness of FA removal [39]. This observation can also be applied to liquid phase systems.
Third, the biofilm activity was compared among plant hosts, with additional nutrients and levels of exposure to FA. In this study, microbial activity was quantified by FDA hydrolysis activity. The FDA hydrolysis reaction involves several groups of enzymes-lipases, esterases, proteases, and hydrolases; therefore, this method is widely used to determine the total activity of heterotrophic microorganisms in wastewater, soil, biofilm, and other samples [40,41,42]. The inhibition of the microbial activity by FA in this study could be explained by the general bacteriostatic activity of FA at sublethal concentrations due to the growth disruption and interference with methionine biosynthesis [43]. At the same time, it was shown that FA at concentrations below 1.61 mg/L in an aquatic environment could be assimilated without compromising the ecosystem [44,45].
The differences of FA removal capacity among the tested biofilms could be explained by the different physiological conditions of the immobilized microorganisms. This assumption is supported by the data on FDA hydrolysis in the enriched biofilms (Figure 3). Obviously, the experimental setup considerably influenced the results on FA removal. Other authors have studied FA removal by biofilms in various membrane reactors. For example, Mei et al. [45] reported that the effective FA degradation by a biofilm in a membrane-aerated biofilm reactor was stimulated by a methanol co-substrate. Ong et al. [46] added glucose to an ultracompact biofilm reactor for FA degradation by a biofilm. Qadery et al. [47] compared two aerobic biological treatment systems, i.e., a moving bed biofilm and sequencing batch reactors, where the latter was more efficient in FA removal. Therefore, the addition of appropriate co-substrates and the optimization of degradation conditions could considerably increase the FA removal efficiency by the tested biofilms.
In our study, an additional treatment of GWS-derived ECP with sugars resulted in a considerable biofilm enrichment. Under wild conditions, many of these sugars are released by plant roots (so-called root exudates), thus providing microorganisms with a variety of valuable compounds that can stimulate their growth [27,48,49]. Nevertheless, not all tested ECP demonstrated an enhanced FDA hydrolysis activity upon enrichment with sugars, e.g., sets with A. andraeanum and new ECP, which had not been incubated in GWS (Figure 3). This fact could indicate that the benefits of enrichment are specific for each microbial community [50]. The role of trace elements introduced to the enrichment medium with a highly diluted VITO plant fertilizer could not be precisely evaluated, as the concentration of added microelements was constant during all three stages of enrichment and was comparable to the concentration of micronutrients (e.g., B, Cu, Fe, Mn, Zn) in the standard M9 medium [51].
The direct measurement of the biofilm thickness has several limitations that complicate the obtention of correct results. The irregular localization of microcolonies on the surface makes this quantification challenging. Therefore, the additional testing of cell activity is necessary. In this study, the FDA hydrolysis activity by immobilized cells on the ECP that were subjected to enrichment was higher compared to unenriched pellets, which was in a good agreement with our microscopy data (Figure 3 and Figure 4). The visualization of ECP surface before and after enrichment showed that the biofilm had thickened after enrichment, while remaining discrete (noncontinuous). In this regard, the porous architectural plasticity, flow-related processes, microbial community structure, and environmental factors affect the biofilm architecture and physiological activity [52]. The use of CLSM for the quantification of the biofilm viability and surface coverage has been recently described. In particular, the application of live/dead staining [53], the biovolume elasticity method for automatic thresholding [54], and the image cytometry software tool BiofilmQ [55] improve the precision of biofilm visualization and quantification.
In our previous study, we tested the structure of bacterial communities attached to ECP, which served as a substrate for Mentha aquatica in a hydroponic system in a 47-day greenhouse experiment without FA. At the phylum level, the biofilm was colonized mostly by Proteobacteria (80.21–90.89%). Other phyla with an abundance above 1% were as follows: Bacteroidetes, Actinobacteria, Planctomycetes, Firmicutes, and Verrucomicrobia [36]. The use of EcoPlates™ in this study showed a diverse metabolic response of microbial communities to the presence of FA in combination with supplemental carbon sources. The positive role of itaconic acid as a co-substrate was recently reported by Feng, Yu et al. [56] in a study on the degradation of ciprofloxacin by a microbial consortium. Further studies are needed to clarify the range of co-substrates that could facilitate the degradation of organic contaminants by microorganisms in hydroponics of the GWS.

5. Conclusions

The data obtained in this study can be summarized in the following conclusions:
  • The FDA hydrolysis activity of the biofilm was shown to change depending on the type of ECP treatment. A decrease in enzyme activity after a 21-day pretreatment with FA, as well as after a 24 h incubation of ECP in an FA solution, indicated the inhibition of the metabolic activity of immobilized heterotrophic microorganisms by FA at concentrations up to 100 mg/L. The inhibition effect was highly dependent on the plant species and the sampling location in the GWS.
  • The enrichment conditions increased the FDA hydrolysis activity of biofilms in the sets of GWS with M. aquatica, E. aureum, and without plants. Obviously, enrichment conditions were specific to each microbial community, which, in turn, was affected by the selection of plant species.
  • The FA removal activity of ECP was 76.5 μg ECP−1 after a 24 h incubation in the presence of 100 mg/L FA, while the removal activity of the biofilm varied, with the highest value (59.2 μg ECP−1) observed in the set with M. aquatica.
  • The screening of 31 carbon substrates available in EcoPlates™ revealed substrates which stimulated the growth of particular microbial communities obtained from ECP. For example, itaconic acid stimulated microbial growth in the presence of 50 mg/L FA in the sets with C. comosum, A. andraeanum, and E. aureum up to 21%, 37%, and 49%, respectively, as compared to the respective controls.

Author Contributions

Conceptualization, G.I., A.S., O.M. and B.B.; methodology, A.S., G.I., U.A.-O. and V.B.; validation, G.I., V.B. and O.M.; formal analysis, L.Ž. and K.C.; investigation, L.Ž., A.S., U.A.-O. and T.S.; writing—original draft preparation, O.M., A.S. and L.Ž.; writing—review and editing, O.M., G.I. and V.B.; visualization, T.S. and A.S.; supervision, G.I. and O.M. All authors have read and agreed to the published version of the manuscript.

Funding

The research was funded by the project “Research and development of bioremediation-based indoor air biofiltration system” in accordance with the contract no. 1.2.1.1/18/A/001 between “ETKC” Ltd. and the Central Finance and Contracting Agency of Latvia with support from the European Regional Development Fund (ERDF), project Y5-AZ20-ZF-N-270; SAM 8.2.2 “Optimization of biotechnological processes for effective utilization of renewable resources”, the third round project “Strengthening the capacity of the doctoral program of the University of Latvia in the framework of the new doctoral program model”.

Institutional Review Board Statement

Not applicable.

Informed Consent Statement

Not applicable.

Data Availability Statement

Not applicable.

Acknowledgments

Authors are grateful to Janis Jaunbergs for suggested manuscript revisions.

Conflicts of Interest

The authors declare no conflict of interest.

References

  1. Zhang, L.; Routsong, R.; Strand, S.E. Greatly Enhanced Removal of Volatile Organic Carcinogens by a Genetically Modified Houseplant, Pothos Ivy (Epipremnum aureum) Expressing the Mammalian Cytochrome P450 2e1 Gene. Environ. Sci. Technol. 2019, 53, 325–331. [Google Scholar] [CrossRef] [PubMed]
  2. Zhu, L.; Shen, D.; Luo, K.H. A critical review on VOCs adsorption by different porous materials: Species, mechanisms and modification methods. J. Hazard. Mater. 2020, 389, 122102. [Google Scholar] [PubMed]
  3. Sahu, L.K.; Tripathi, N.; Yadav, R. Contribution of biogenic and photochemical sources to ambient VOCs during winter to summer transition at a semi-arid urban site in India. Environ. Pollut. 2017, 229, 595–606. [Google Scholar] [CrossRef] [PubMed]
  4. Peng, W.X.; Yue, X.; Chen, H.; Ma, N.L.; Quan, Z.; Yu, Q.; Wei, Z.; Guan, R.; Lam, S.S.; Rinklebe, J.; et al. A review of plants formaldehyde metabolism: Implications for hazardous emissions and phytoremediation. J. Hazard. Mater. 2022, 436, 129304. [Google Scholar] [PubMed]
  5. Matheson, S.; Fleck, R.; Irga, P.J.; Torpy, F.R. Phytoremediation for the indoor environment: A state-of-the-art review. Rev. Environ. Sci. Biotechnol. 2023, 22, 249–280. [Google Scholar]
  6. Reyhani, M.; Santolini, E.; Tassinari, P.; Torreggiani, D. Environmental assessment of design choices of green walls based for materials combination and plants. Int. J. Life Cycle Assess. 2023, 28, 1078–1091. [Google Scholar] [CrossRef]
  7. Riley, B. The state of the art of living walls: Lessons learned. Build. Environ. 2017, 114, 219–232. [Google Scholar]
  8. Goli, A.; Talaiekhozani, A.; Eshtiaghi, N.; Chisti, Y.; Aramesh, R.; Aramesh, R.; Shamiri, A. Biotreatment of formaldehyde-contaminated air in a trickle bed bioreactor. Desalin. Water Treat. 2017, 93, 83–92. [Google Scholar] [CrossRef]
  9. Pettit, T.; Irga, P.J.; Torpy, F.R. Functional green wall development for increasing air pollutant phytoremediation: Substrate development with coconut coir and activated carbon. J. Hazard. Mater. 2018, 360, 594–603. [Google Scholar] [CrossRef]
  10. Jamshidi, A.; Hajizadeh, Y.; Amin, M.M.; Kiani, G.; Haidari, R.; Falahi-Nejad, K.; Parseh, I. Biofiltration of formaldehyde, acetaldehyde, and acrolein from polluted airstreams using a biofilter. J. Chem. Technol. Biotechnol. 2018, 93, 1328–1337. [Google Scholar] [CrossRef]
  11. Suárez-Cáceres, G.P.; Fernández-Cañero, R.; Fernández-Espinosa, A.J.; Rossini-Oliva, S.; Franco-Salas, A.; Pérez-Urrestarazu, L. Volatile organic compounds removal by means of a felt-based living wall to improve indoor air quality. Atmos. Pollut. Res. 2021, 12, 224–229. [Google Scholar] [CrossRef]
  12. Bandehali, S.; Miri, T.; Onyeaka, H.; Kumar, P. Current state of indoor air phytoremediation using potted plants and green walls. Atmosphere 2021, 12, 473. [Google Scholar] [CrossRef]
  13. Soreanu, G.; Dixon, M.; Darlington, A. Botanical biofiltration of indoor gaseous pollutants—A mini-review. Chem. Eng. J. 2013, 229, 585–594. [Google Scholar]
  14. Xu, Z.; Qin, N.; Wang, J.; Tong, H. Formaldehyde Biofiltration as Affected by Spider Plant. Bioresour. Technol. 2010, 101, 6930–6934. [Google Scholar] [CrossRef] [PubMed]
  15. Li, J.; Zhong, J.; Liu, Q.; Yang, H.; Wang, Z.; Li, Y.; Zhang, W.; Agranovski, I. Indoor Formaldehyde Removal by Three Species of Chlorophytum comosum under Dynamic Fumigation System: Part 2—Plant Recovery. Environ. Sci. Pollut. Res. 2021, 28, 8453–8465. [Google Scholar] [CrossRef]
  16. Zuo, L.; Wu, D.; Yu, L.; Yuan, Y. Phytoremediation of Formaldehyde by the Stems of Epipremnum aureum and Rohdea japonica. Environ. Sci. Pollut. Res. 2022, 29, 11445–11454. [Google Scholar] [CrossRef]
  17. Aydogan, A.; Montoya, L.D. Formaldehyde removal by common indoor plant species and various growing media. Atmos. Environ. 2011, 45, 2675–2682. [Google Scholar] [CrossRef]
  18. Liu, Y.J.; Mu, Y.J.; Zhu, Y.G.; Ding, H.; Crystal Arens, N. Which ornamental plant species effectively remove benzene from indoor air? Atmos. Environ. 2007, 41, 650–654. [Google Scholar] [CrossRef]
  19. Su, Y.; Liang, Y. Foliar uptake and translocation of formaldehyde with Bracket plants (Chlorophytum comosum). J. Hazard. Mater. 2015, 291, 120–128. [Google Scholar] [CrossRef]
  20. Teiri, H.; Pourzamani, H.; Hajizadeh, Y. Phytoremediation of VOCs from indoor air by ornamental potted plants: A pilot study using a palm species under the controlled environment. Chemosphere 2018, 197, 375–381. [Google Scholar] [CrossRef]
  21. Xu, Z.; Wang, L.; Hou, H. Formaldehyde removal by potted plant-soil systems. J. Hazard. Mater. 2011, 192, 314–318. [Google Scholar] [CrossRef] [PubMed]
  22. He, X.; Li, D.; Ablikim, A.; Yang, Y.; Su, Y. A rapid method to assess the formaldehyde dehydrogenase activity in plants for the remediation of formaldehyde. Environ. Sci. Pollut. Res. 2021, 28, 8782–8790. [Google Scholar] [CrossRef]
  23. Sharma, S.; Bakht, A.; Jahanzaib, M.; Lee, H.; Park, D. Evaluation of the Effectiveness of Common Indoor Plants in Improving the Indoor Air Quality of Studio Apartments. Atmosphere 2022, 13, 1863. [Google Scholar] [CrossRef]
  24. Zhao, S.; Su, Y.; Liang, H. Efficiency and mechanism of formaldehyde removal from air by two wild plants; Plantago asiatica L. and Taraxacum mongolicum Hand.-Mazz. J. Environ. Health Sci. Eng. 2019, 17, 141–150. [Google Scholar] [CrossRef]
  25. Maldonado-Diaz, G.; Arriaga, S. Biofiltration of high formaldehyde loads with ozone additions in long-term operation. Appl. Microbiol. Biotechnol. 2015, 99, 43–53. [Google Scholar] [CrossRef]
  26. Wen, H.; Wang, J.; Yang, C.; Bi, X.; Zou, P. Study of the Performance of a Composite Bioreactor on Removal of High Concentrations of Formaldehyde. Water Air Soil Pollut. 2020, 231, 131. [Google Scholar] [CrossRef]
  27. Pereira, L.C.; Pereira, C.B.; Correia, L.V.; Matera, T.C.; Dos Santos, R.F.; de Carvalho, C.; Osipi, E.A.F.; Braccini, A.L. Corn responsiveness to azospirillum: Accessing the effect of root exudates on the bacterial growth and its ability to fix nitrogen. Plants 2020, 9, 923. [Google Scholar] [CrossRef]
  28. Gabor, E.M.; De Vries, E.J.; Janssen, D.B. Efficient recovery of environmental DNA for expression cloning by indirect extraction methods. FEMS Microbiol. Ecol. 2003, 44, 153–163. [Google Scholar] [CrossRef]
  29. Lichstein, H.C.; Soule, M.H. Studies of the Effect of Sodium Azide on Microbic Growth and Respiration: II. The Action of Sodium Azide on Bacterial Catalase. J. Bacteriol. 1944, 47, 239–251. [Google Scholar]
  30. Ning, Z.; Kennedy, K.J.; Fernandes, L. Biosorption of 2,4-dichlorophenol by live and chemically inactivated anaerobic granules. Water Res. 1996, 30, 2039–2044. [Google Scholar] [CrossRef]
  31. Shushunova, N.; Korol, E.; Luzay, E.; Shafieva, D. Impact of the Innovative Green Wall Modular Systems on the Urban Air. Sustainability 2023, 15, 9732. [Google Scholar] [CrossRef]
  32. Yang, Y.; Hu, K.; Liu, Y.; Wang, Z.; Dong, K.; Lv, P.; Shi, X. Optimisation of Building Green Performances Using Vertical Greening Systems: A Case Study in Changzhou, China. Sustainability 2023, 15, 4494. [Google Scholar] [CrossRef]
  33. Wu, D.; Yu, L. Effects of Airflow Rate and Plant Species on Formaldehyde Removal by Active Green Walls. Environ. Sci. Pollut. Res. 2022, 29, 88812–88822. [Google Scholar] [CrossRef]
  34. Teiri, H.; Hajizadeh, Y.; Azhdarpoor, A. A Review of Different Phytoremediation Methods and Critical Factors for Purification of Common Indoor Air Pollutants: An Approach with Sensitive Analysis. Air Qual. Atmos. Health 2022, 15, 373–391. [Google Scholar] [CrossRef]
  35. Wrobetz, A.; Matteazzi, M.; Montoya, L.D. Formaldehyde Sorption to Porous Media for Air Quality Applications. In Proceedings of the Healthy Buildings 2015 America: Innovation in a Time of Energy Uncertainty and Climate Adaptation, HB 2015, Boulder, CO, USA, 19–22 July 2015. [Google Scholar]
  36. Kalniņš, M.; Andersone-Ozola, U.; Gudrā, D.; Sieriņa, A.; Fridmanis, D.; Ievinsh, G.; Muter, O. Effect of Bioaugmentation on the Growth and Rhizosphere Microbiome Assembly of Hydroponic Cultures of Mentha Aquatica. Ecol. Genet. Genom. 2022, 22, 100107. [Google Scholar] [CrossRef]
  37. Bevilacqua, P.; Bruno, R.; Arcuri, N. Green Roofs in a Mediterranean Climate: Energy Performances Based on in-Situ Experimental Data. Renew Energy 2020, 152, 1414–1430. [Google Scholar] [CrossRef]
  38. Bevilacqua, P. The Effectiveness of Green Roofs in Reducing Building Energy Consumptions across Different Climates. A Summary of Literature Results. Renew. Sustain. Energy Rev. 2021, 151, 111523. [Google Scholar] [CrossRef]
  39. Abedi, S.; Yarahmadi, R.; Farshad, A.A.; Najjar, N.; Ebrahimi, H.; Soleimani-Alyar, S. Evaluation of the critical parameters on the removal efficiency of a botanical biofilter system. Build. Environ. 2022, 212, 108811. [Google Scholar] [CrossRef]
  40. Adam, G.; Duncan, H. Development of a sensitive and rapid method for the measurement of total microbial activity using fluorescein diacetate (FDA) in a range of soils. Soil Biol. Biochem. 2001, 33, 943–951. [Google Scholar] [CrossRef]
  41. Bandick, A.K.; Dick, R.P. Field management effects on soil enzyme activities. Soil Biol. Biochem. 1999, 31, 1471–1479. [Google Scholar] [CrossRef]
  42. Muter, O.; Perkons, I.; Svinka, V.; Svinka, R.; Bartkevics, V. Distinguishing the roles of carrier and biofilm in filtering media for the removal of pharmaceutical compounds from wastewater. Process Saf. Environ. Prot. 2017, 111, 462–474. [Google Scholar] [CrossRef]
  43. Neely, W.B. Action of formaldehyde on microorganisms. Iii. Bactericidal action of sublethal concentrations of formaldehyde on aerobacter aerogenes. J. Bacteriol. 1963, 86, 445–448. [Google Scholar] [CrossRef] [PubMed]
  44. Hohreiter, D.W.; Rigg, D.K. Derivation of Ambient Water Quality Criteria for Formaldehyde. Chemosphere 2001, 45, 471–486. [Google Scholar] [CrossRef] [PubMed]
  45. Mei, X.; Guo, Z.; Liu, J.; Bi, S.; Li, P.; Wang, Y.; Shen, W.; Yang, Y.; Wang, Y.; Xiao, Y.; et al. Treatment of Formaldehyde Wastewater by a Membrane-Aerated Biofilm Reactor (MABR): The Degradation of Formaldehyde in the Presence of the Cosubstrate Methanol. Chem. Eng. J. 2019, 372, 673–683. [Google Scholar] [CrossRef]
  46. Ong, S.L.; Sarkar, S.K.; Lee, L.Y.; Hu, J.Y.; Ng, H.Y.; van Loosdrecht, M. Effect of Formaldehyde on Biofilm Activity and Morphology in an Ultracompact Biofilm Reactor for Carbonaceous Wastewater Treatment. Water Environ. Res. 2006, 78, 372–380. [Google Scholar] [CrossRef]
  47. Qadery, F.; Ayati, B.; Ganjidoust, H. Role of Moving Bed Biofilm Reactor and Sequencing Batch Reactor in Biological Degradation of Formaldehyde Wastewater. Iran. J. Environ. Health Sci. Eng. 2011, 8, 295–306. [Google Scholar]
  48. Badri, D.V.; Vivanco, J.M. Regulation and Function of Root Exudates. Plant Cell Environ. 2009, 32, 666–681. [Google Scholar] [CrossRef]
  49. Williams, A.; de Vries, F.T. Plant Root Exudation under Drought: Implications for Ecosystem Functioning. New Phytol. 2020, 225, 1899–1905. [Google Scholar] [CrossRef]
  50. Stach, J.E.M.; Burns, R.G. Enrichment versus Biofilm Culture: A Functional and Phylogenetic Comparison of Polycyclic Aromatic Hydrocarbon-Degrading Microbial Communities. Environ. Microbiol. 2002, 4, 169–182. [Google Scholar] [CrossRef]
  51. Flamholz, A.; Dugan, E.; Milo, R.; Savage, D. 100x Trace Elements for M9 Minimal Medium. Bio-Protocol Preprint. Available online: Bio-protocol.org/prep1287 (accessed on 2 September 2023).
  52. Scheidweiler, D.; Peter, H.; Pramateftaki, P.; de Anna, P.; Battin, T.J. Unraveling the biophysical underpinnings to the success of multispecies biofilms in porous environments. ISME J. 2019, 13, 1700–1710. [Google Scholar] [CrossRef]
  53. Mountcastle, S.E.; Vyas, N.; Villapun, V.M.; Cox, S.C.; Jabbari, S.; Sammons, R.L.; Shelton, R.M.; Walmsley, A.D.; Kuehne, S.A. Biofilm viability checker: An open-source tool for automated biofilm viability analysis from confocal microscopy images. npj Biofilms Microbiomes 2021, 7, 44. [Google Scholar] [CrossRef]
  54. Luo, T.L.; Eisenberg, M.C.; Hayashi, M.A.L.; Gonzalez-Cabezas, C.; Foxman, B.; Marrs, C.F.; Rickard, A.H. A Sensitive Thresholding Method for Confocal Laser Scanning Microscope Image Stacks of Microbial Biofilms. Sci. Rep. 2018, 8, 13013. [Google Scholar] [CrossRef] [PubMed]
  55. Hartmann, R.; Jeckel, H.; Jelli, E.; Singh, P.K.; Vaidya, S.; Bayer, M.; Rode, D.K.H.; Vidakovic, L.; Díaz-Pascual, F.; Fong, J.C.N.; et al. Quantitative image analysis of microbial communities with BiofilmQ. Nat. Microbiol. 2021, 6, 151–156. [Google Scholar] [CrossRef] [PubMed]
  56. Feng, N.X.; Yu, J.; Xiang, L.; Yu, L.Y.; Zhao, H.M.; Mo, C.H.; Li, Y.W.; Cai, Q.Y.; Wong, M.H.; Li, Q.X. Co-metabolic degradation of the antibiotic ciprofloxacin by the enriched bacterial consortium XG and its bacterial community composition. Sci. Total Environ. 2019, 665, 41–51. [Google Scholar] [CrossRef] [PubMed]
Figure 1. Experimental modules of the GWS.
Sustainability 15 13303 g001
Figure 2. The FDA hydrolysis activity on the surface of ECP, sampled from different height levels of the GWS module. The incubation period in the enzyme mixture was 48 h. (A) FDA hydrolysis activity after a 15 day pretreatment with FA; (B) the ratio of FDA hydrolysis activity obtained after and before the 15 day pretreatment with FA. The dotted line indicates no differences between final and start values. For all variables with different letters, the difference between the mean values is statistically significant (p < 0.05).
Sustainability 15 13303 g002
Figure 3. The FDA hydrolysis activity on the surface of ECP after the three-step biofilm enrichment. Enrichment scheme: 0.5% VITO mineral fertilizer + glucose, sucrose, lactose, fructose (at 0.05%, 0.10%, and 0.15% levels each). The period of incubation at each enrichment step was 72 h.
Sustainability 15 13303 g003
Figure 4. Confocal laser scanning micrographs of the ECP’s surface at the beginning (AC) and after the third step of biofilm enrichment (DF). The enrichment scheme is as in p. 2.2. The ECP were derived from the GWS module with Mentha aquatica spp. litoralis, as described in p. 2.1. Cells were fixed with 70% ethanol and afterwards stained with 20 mM propidium iodide (PI). Green and red areas correspond to the abiotic and biotic parts of the specimen, respectively. Green arrows indicate the microcolonies. The white bar length is 150 μm.
Sustainability 15 13303 g004
Figure 5. The removal of FA by ECP with a biofilm from the liquid phase. (A) The concentration of FA remaining in the sets with ECP and intact/inactivated biomass; (B) The degree of FA removal by an intact biofilm and ECP. The incubation period was 24 h.
Sustainability 15 13303 g005
Figure 6. The FDA hydrolysis activity of the fluoresceine diacetate hydrolysis on the surface of ECP before and after exposure to FA (100 mg L−1).
Sustainability 15 13303 g006
Figure 7. Changes of the Shannon diversity index (H′) upon the incubation of microbial communities in EcoPlates™. Microbial communities were obtained from the surfaces of ECP in the modules with and without plants after a 15-day pretreatment with FA.
Sustainability 15 13303 g007
Table 1. The growth intensity of ECP-derived microorganisms in the presence of 50 mg/L FA and different supplemental carbon sources. The testing was performed in EcoPlates™ for 72 h. The data are expressed as percentages of the growth intensity compared to the control without FA. Table 1 represents 15 carbon sources from 31 sources where the stimulation of microbial growth in the presence of FA was detected in at least one experimental set.
M. aquaticaC. comosumA. andraeanumE. aureumNonplantedNew ECP with Biofilm
D-glucosamic acid−5.16−57.67−43.01−31.7151.2533.22
Itaconic acid−60.1420.6036.6649.42−98.986.66
L-arginine2.69−14.59−5.1424.27−99.754.09
L-serine18.248.695.6216.11−98.201.81
Gamma-hydroxy butyric acid−90.544.860.7615.33−98.14−5.65
4-Hydroxy benzoic acid2.875.320.8514.64−98.97−6.23
D-galacturonic acid−90.953.852.106.65−98.16−6.33
Pyruvic acid methyl ester8.21−10.20−19.31−5.79−98.50−41.56
Tween 4038.16−31.38−9.12−18.58−100.00−44.76
Beta-methyl-D-glucoside−31.13−62.5040.84−61.88−94.46−79.94
D-malic acid−68.2628.725.64−63.01−97.40−85.88
N-acetyl-D-glucosamine16.02−69.3418.822.16−99.70−96.96
L-asparagine8.187.7510.9520.91−87.34−97.63
D-cellobiose−29.21−24.914.01−71.44−96.69−99.70
Phenethylamine11.29−97.1325.81−46.32−99.36−99.75
Disclaimer/Publisher’s Note: The statements, opinions and data contained in all publications are solely those of the individual author(s) and contributor(s) and not of MDPI and/or the editor(s). MDPI and/or the editor(s) disclaim responsibility for any injury to people or property resulting from any ideas, methods, instructions or products referred to in the content.

