
Heterogeneity Analysis of Spatio-Temporal Distribution of Vegetation Cover in Two-Tider Administrative Regions of China


Abstract
:1. Introduction
- (1)
- What is the overall distribution of multi-year vegetation coverage in China’s provincial and prefectural administrative regions?
- (2)
- What are the interannual variations in vegetation cover within administrative regions, and does vegetation cover exhibit a trend of growth or degradation?
- (3)
- Where are the extreme areas mainly distributed, and what are the possible reasons for this?
2. Materials and Methods
2.1. Study Area
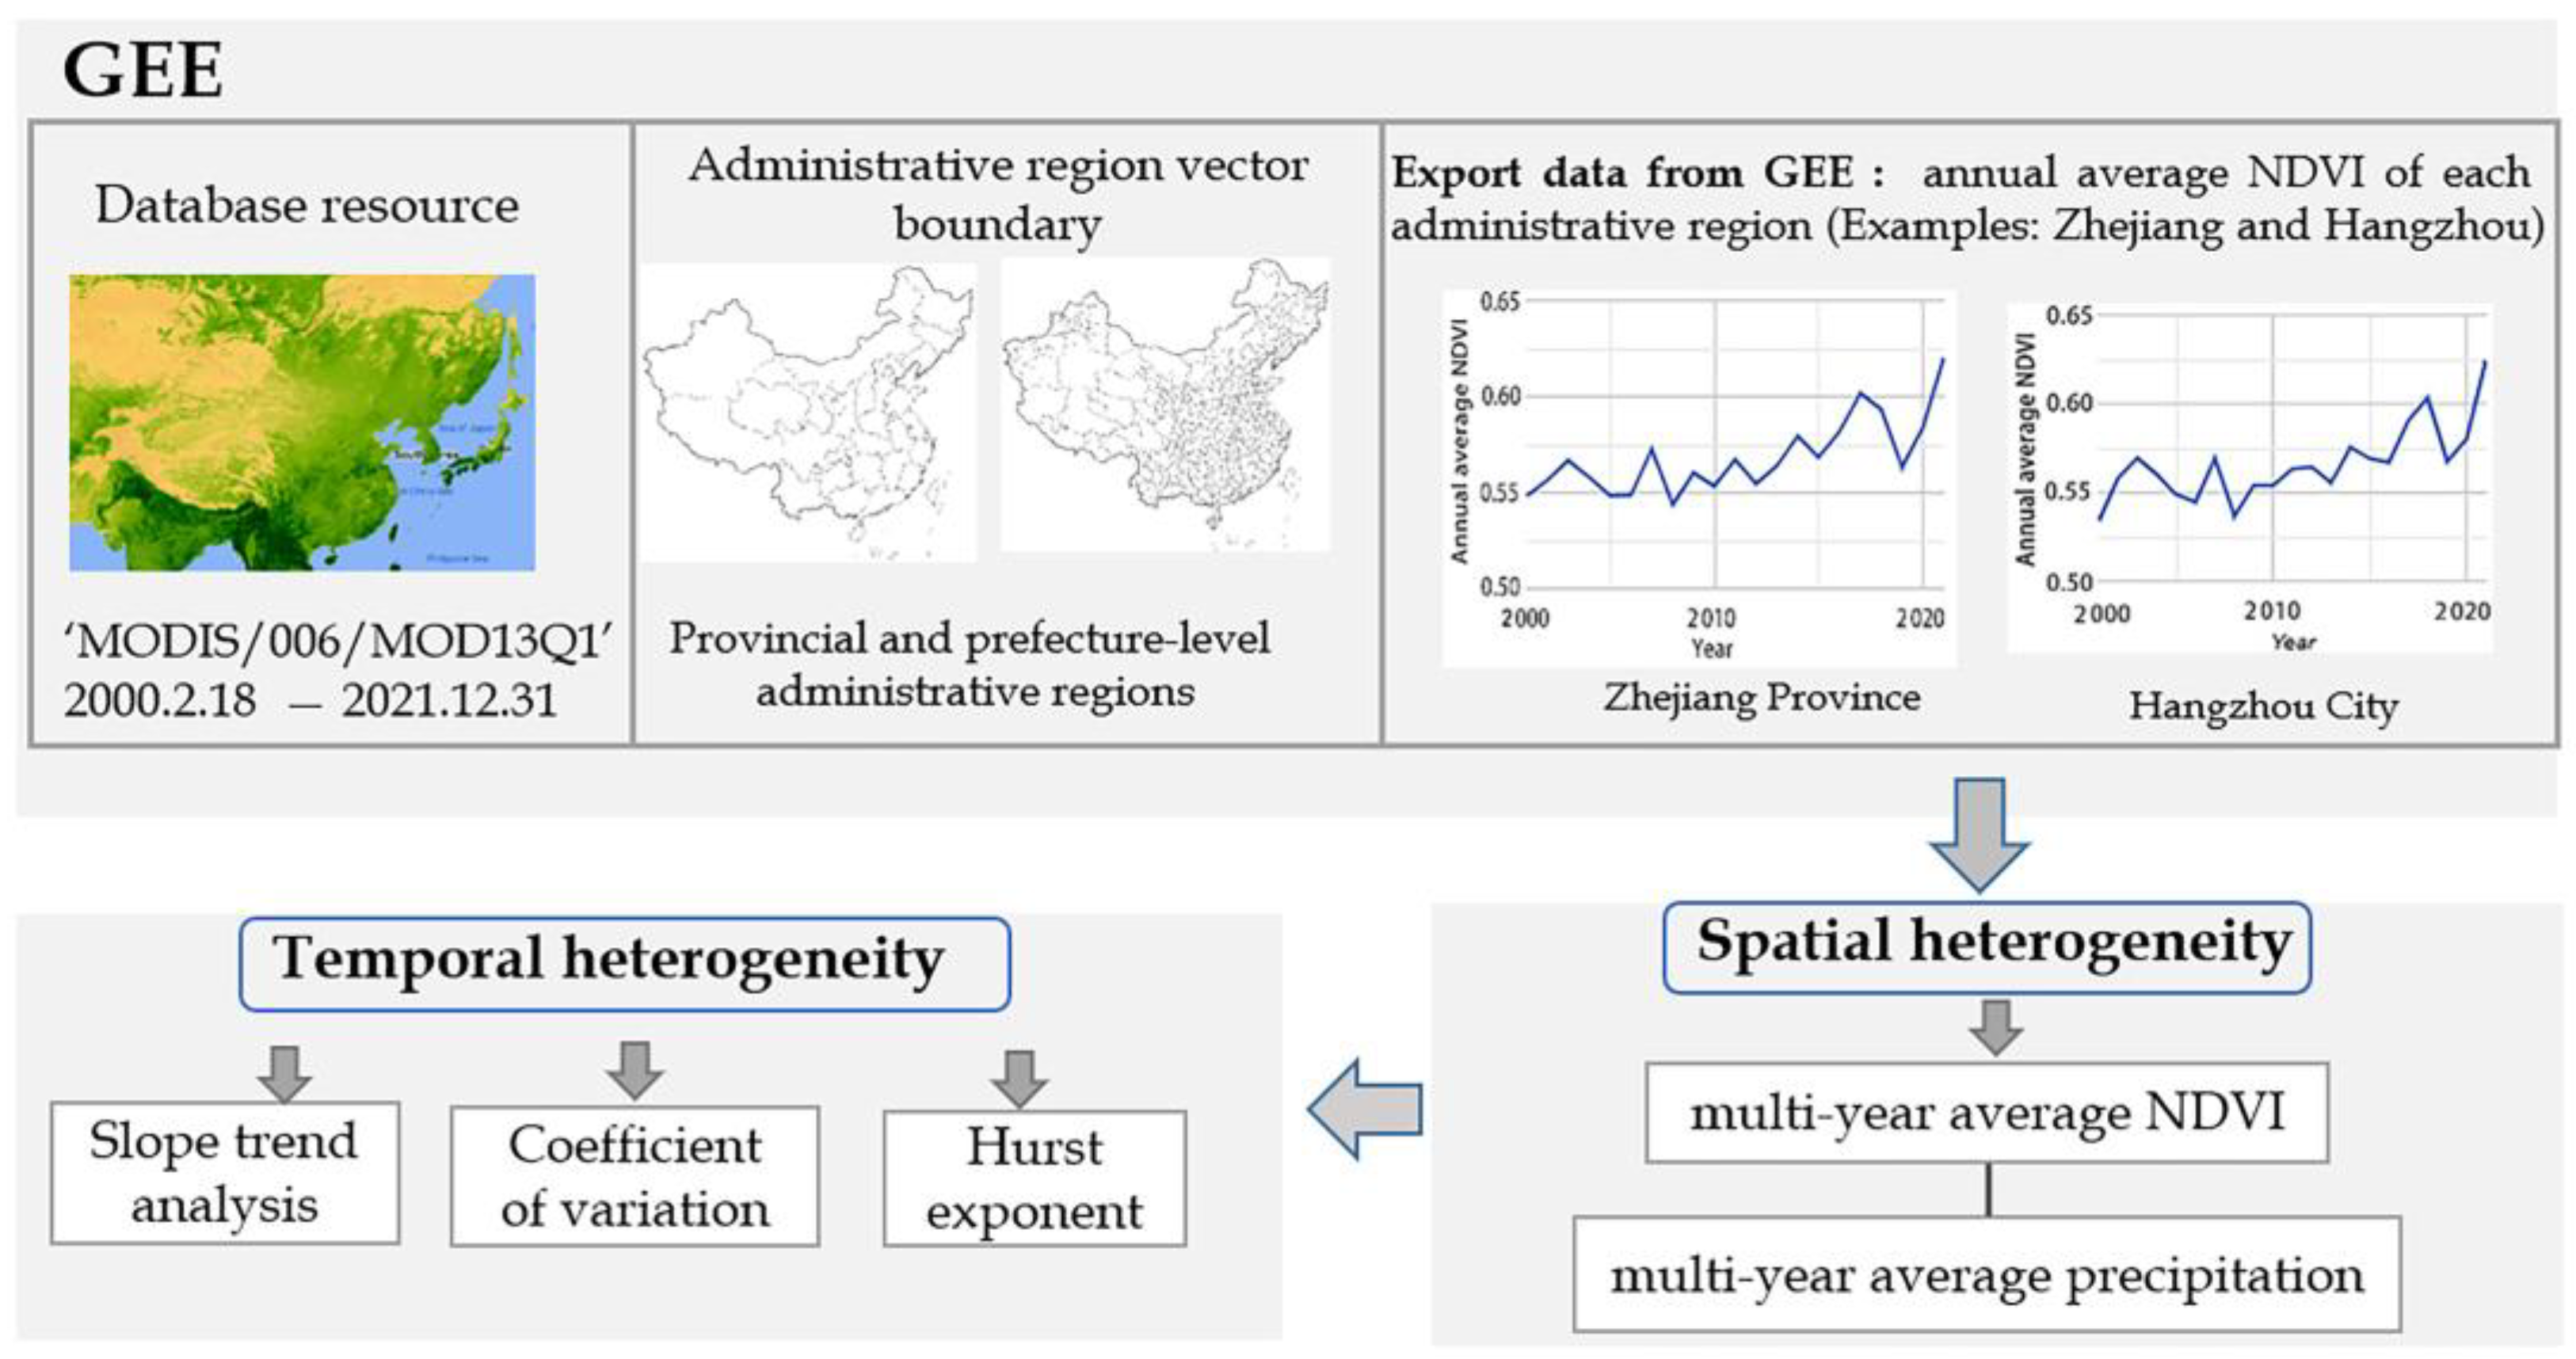
2.2. Data Sources
2.2.1. NDVI Product
2.2.2. Average Annual Precipitation
2.3. Methods
2.3.1. Multi-Year Average NDVI
2.3.2. Trend Analysis of NDVI Changes
2.3.3. Coefficient of Variation
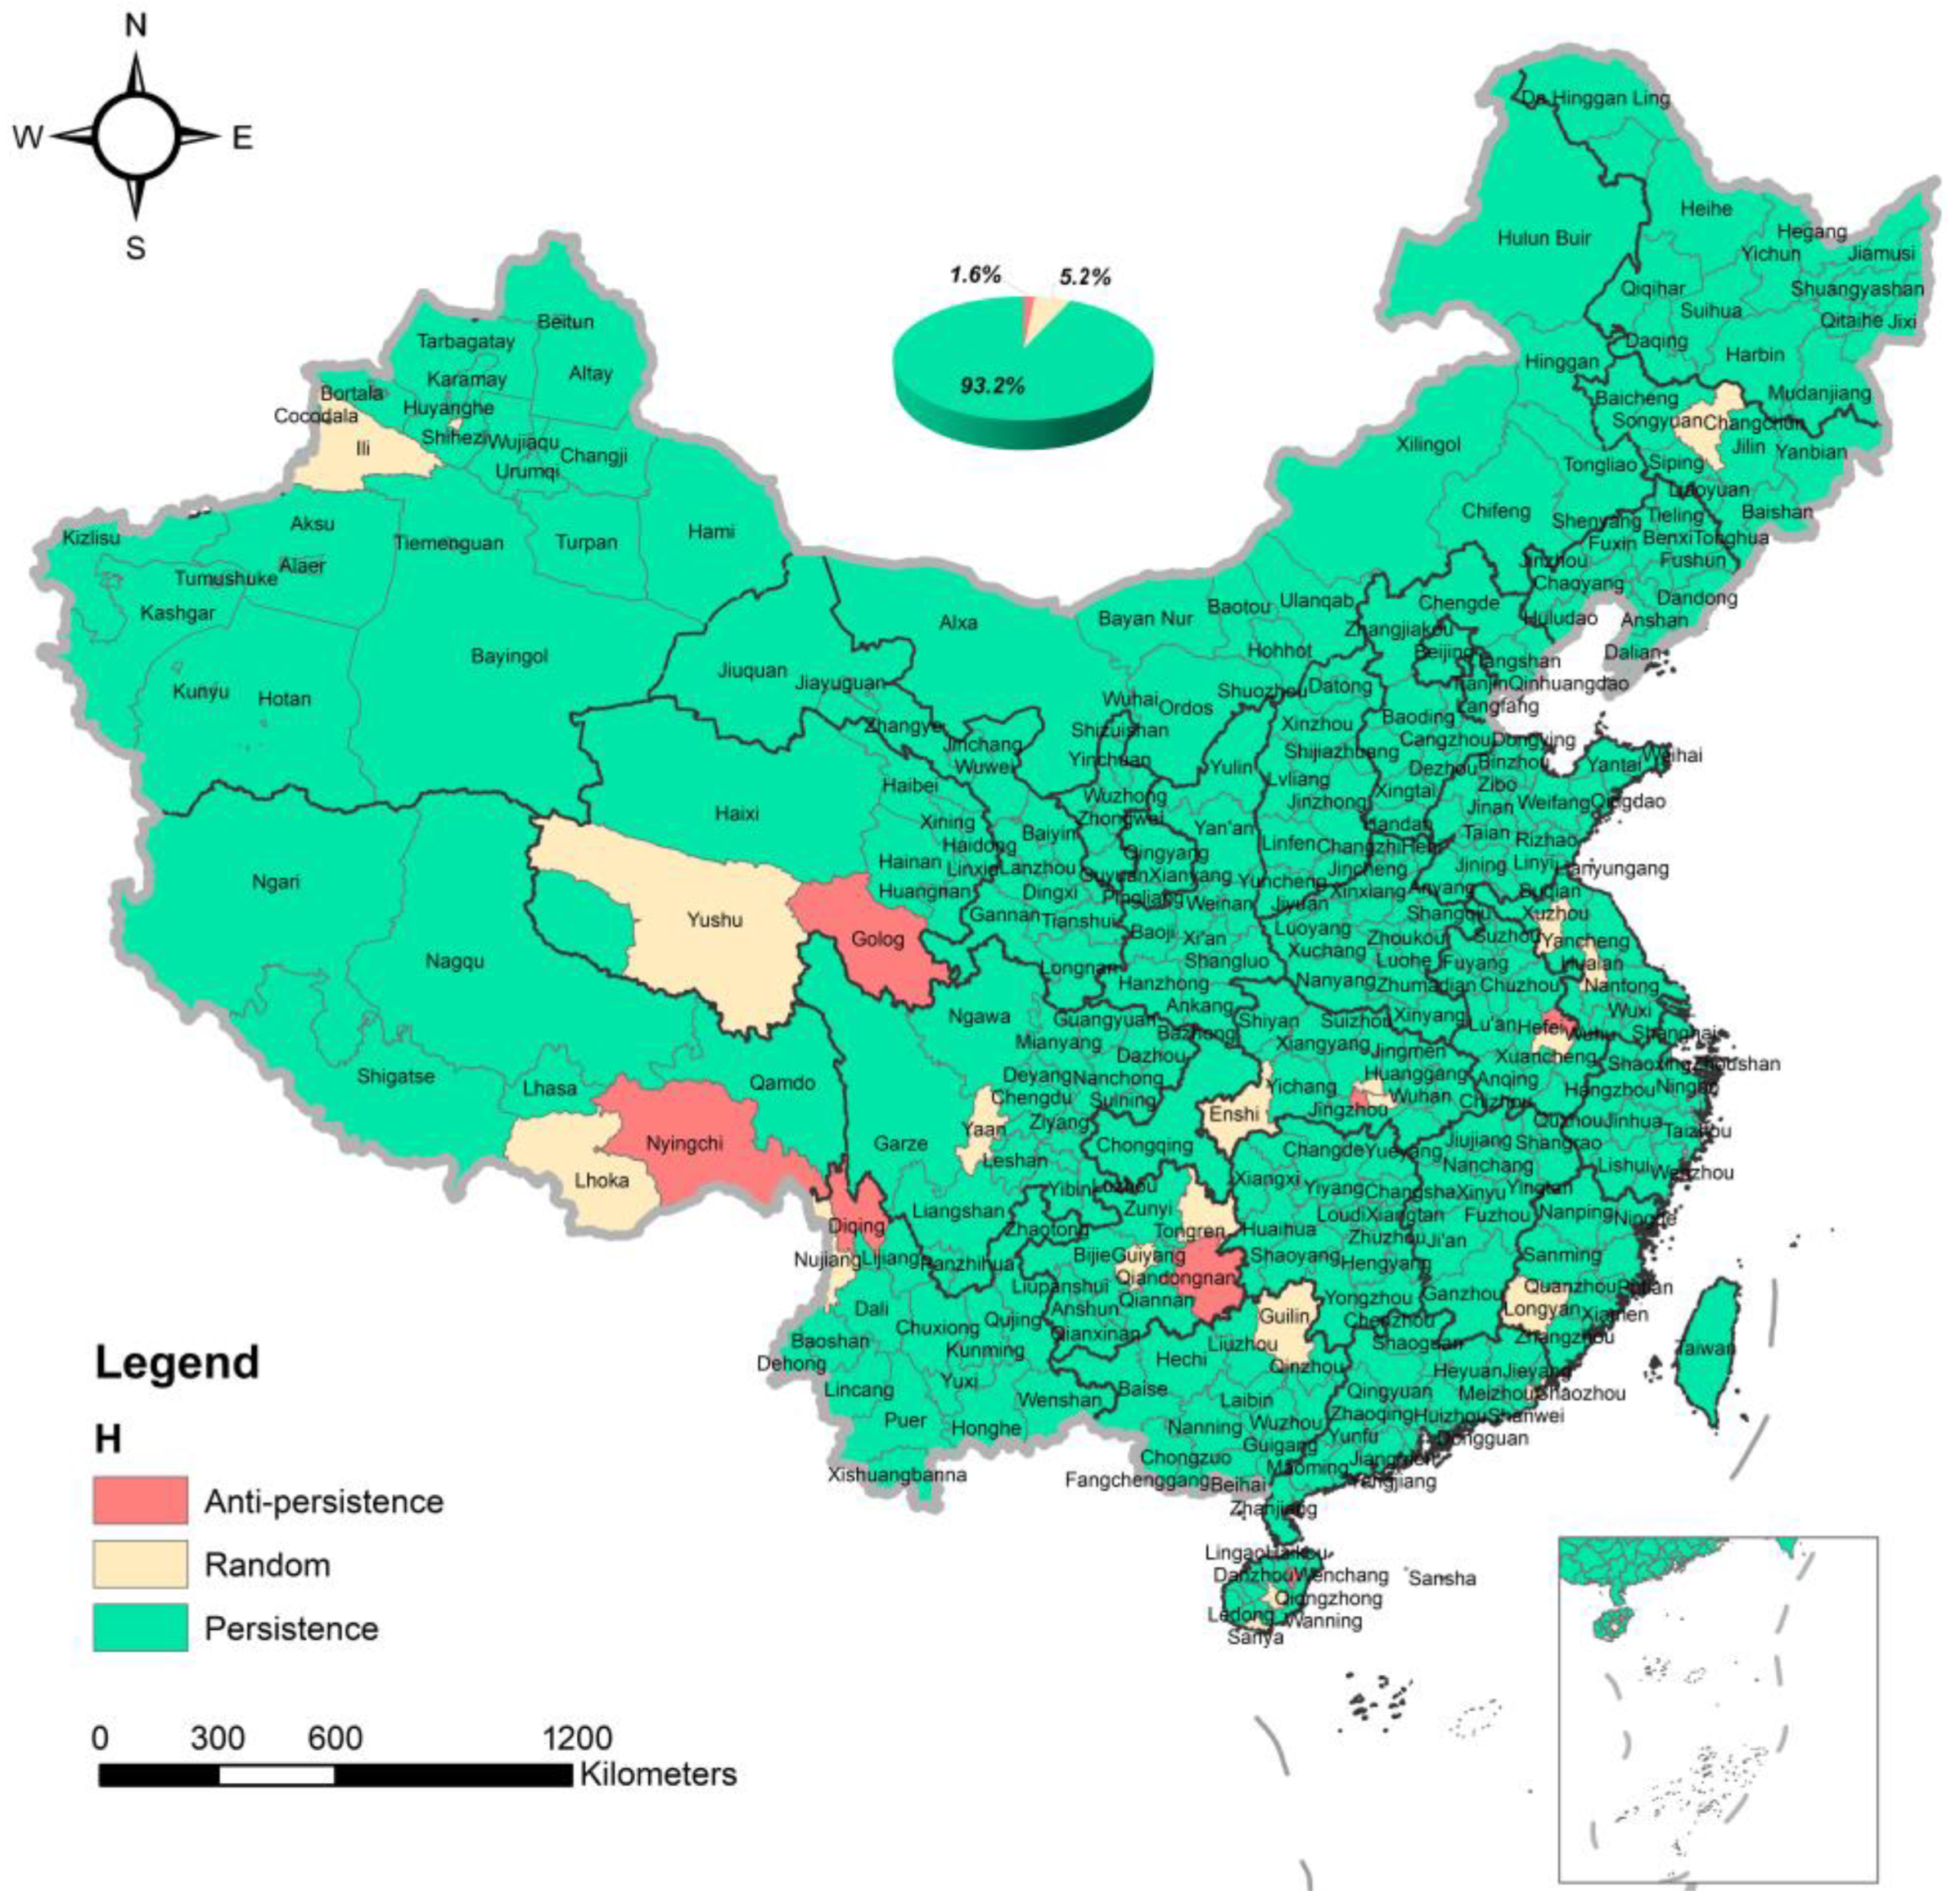
2.3.4. Hurst Exponent
3. Results
3.1. Spatial Heterogeneity of Regional Vegetation Cover
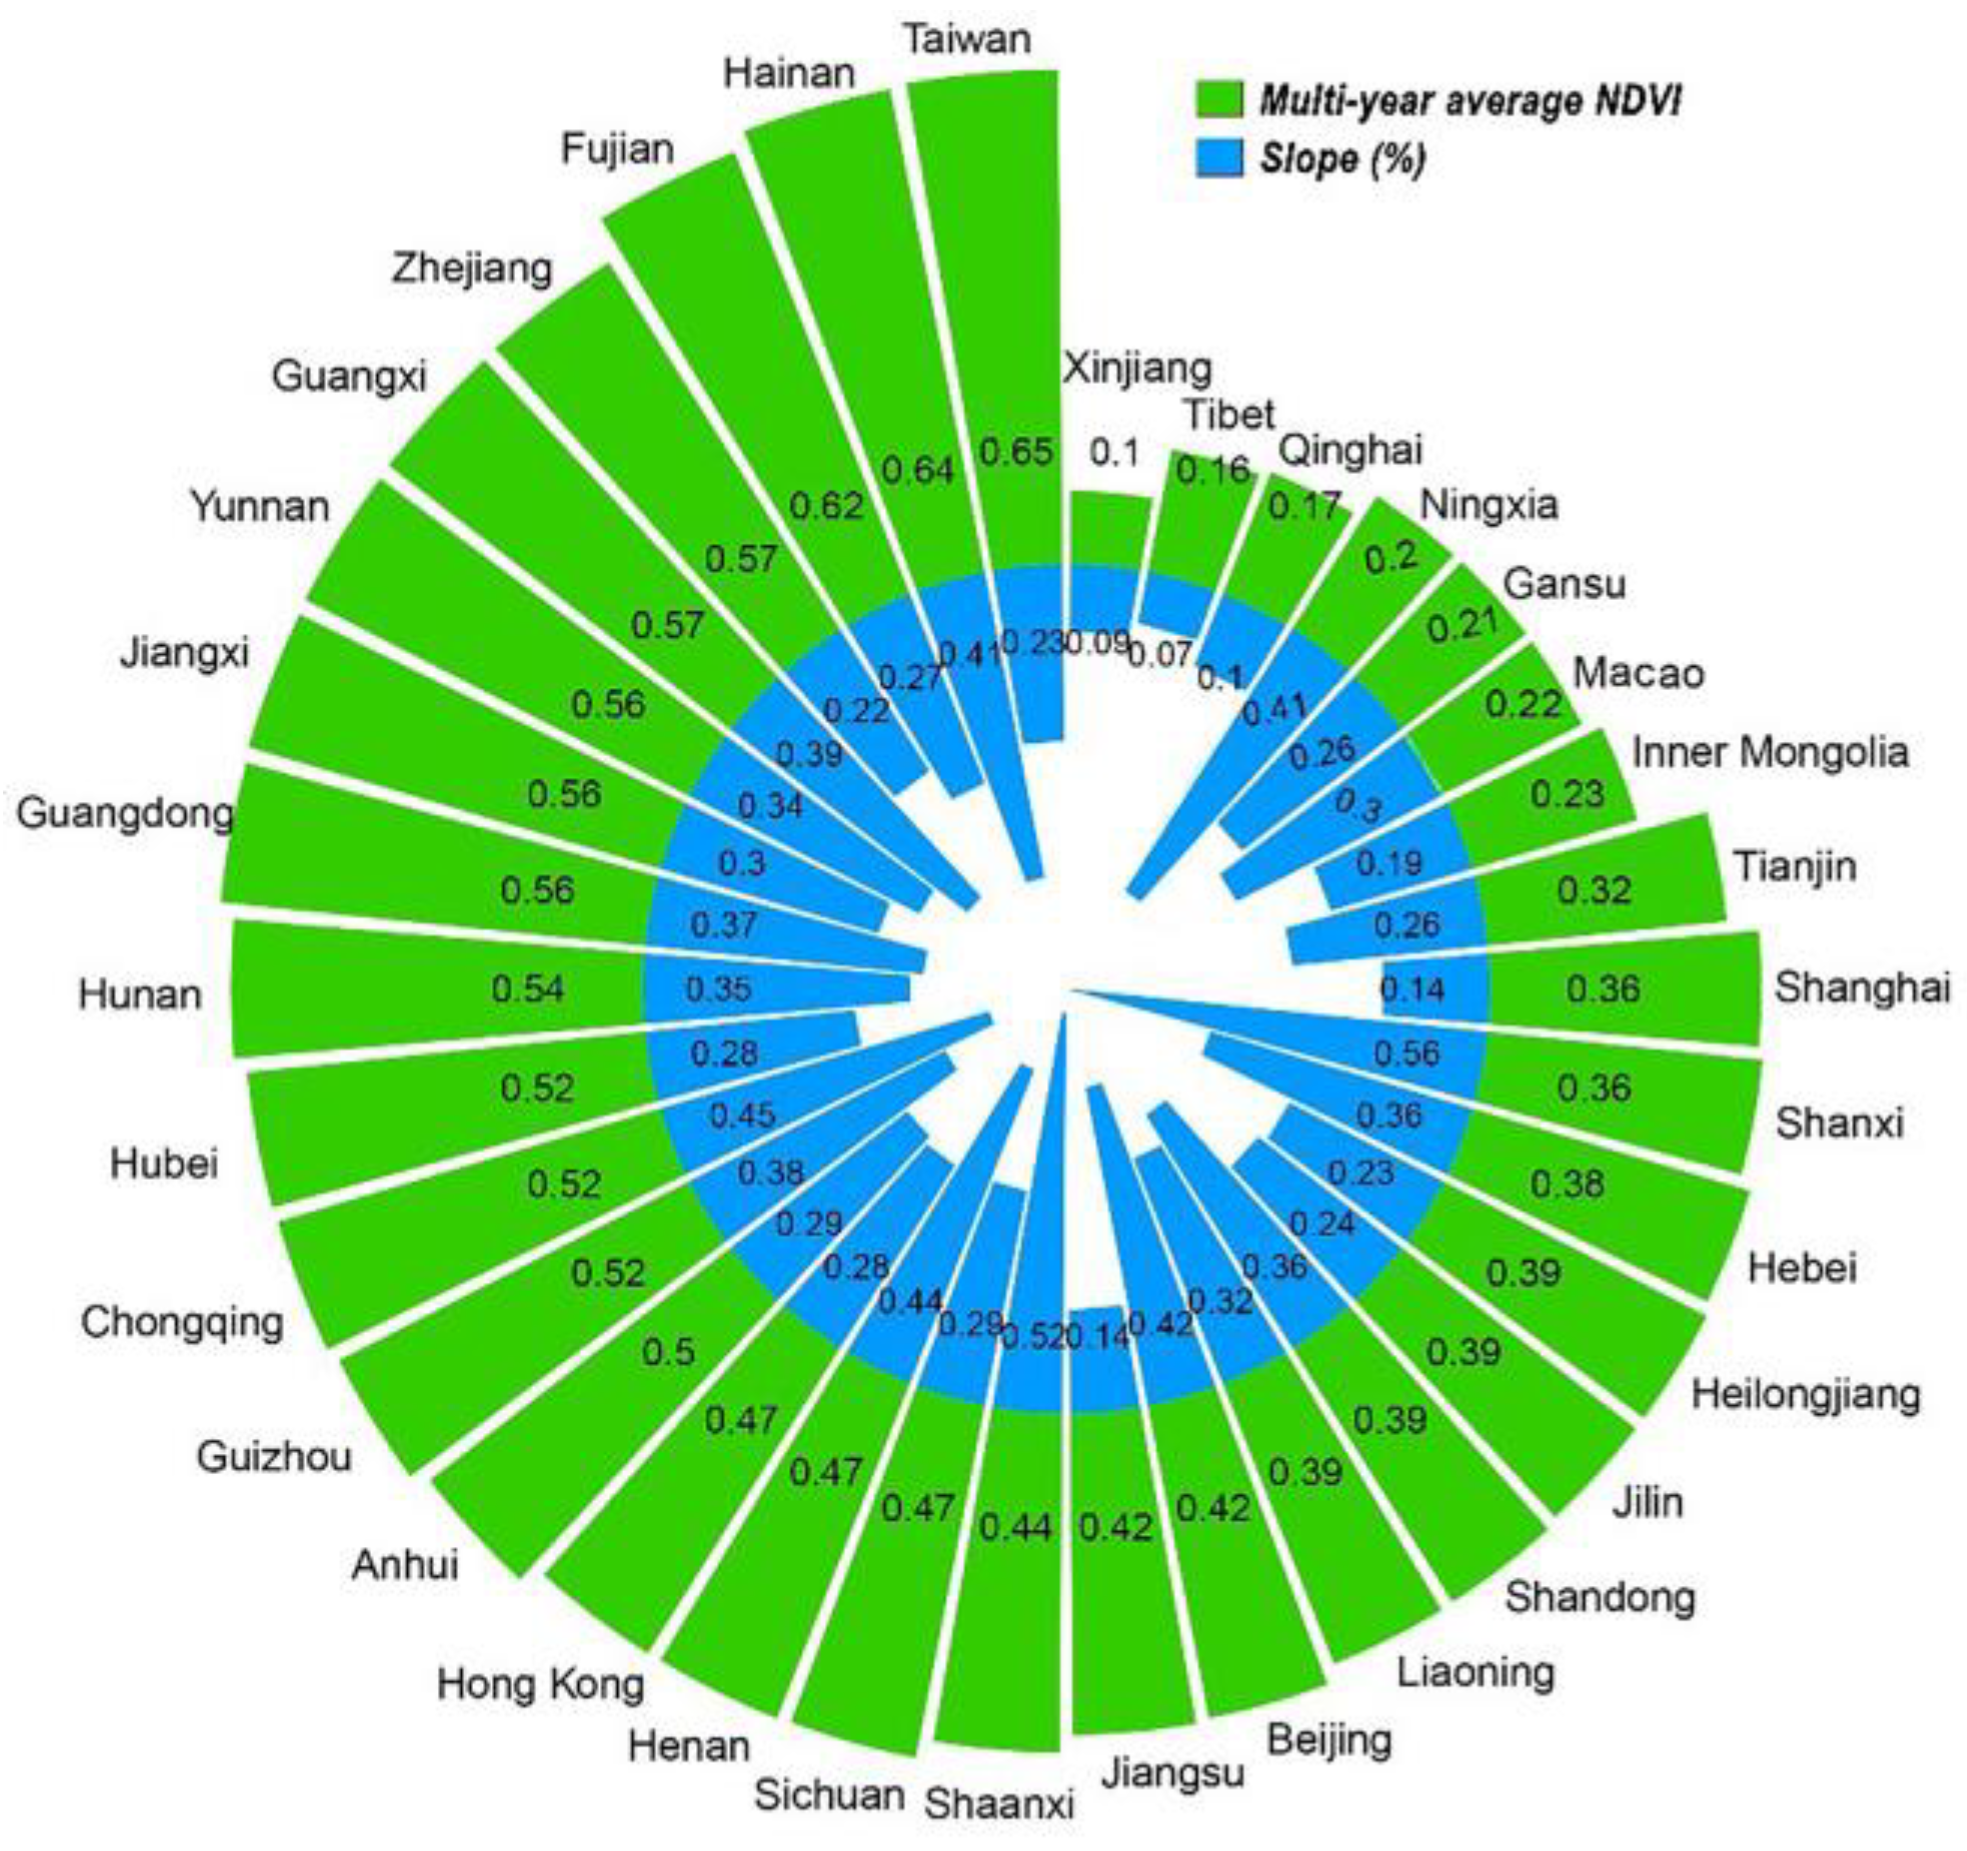
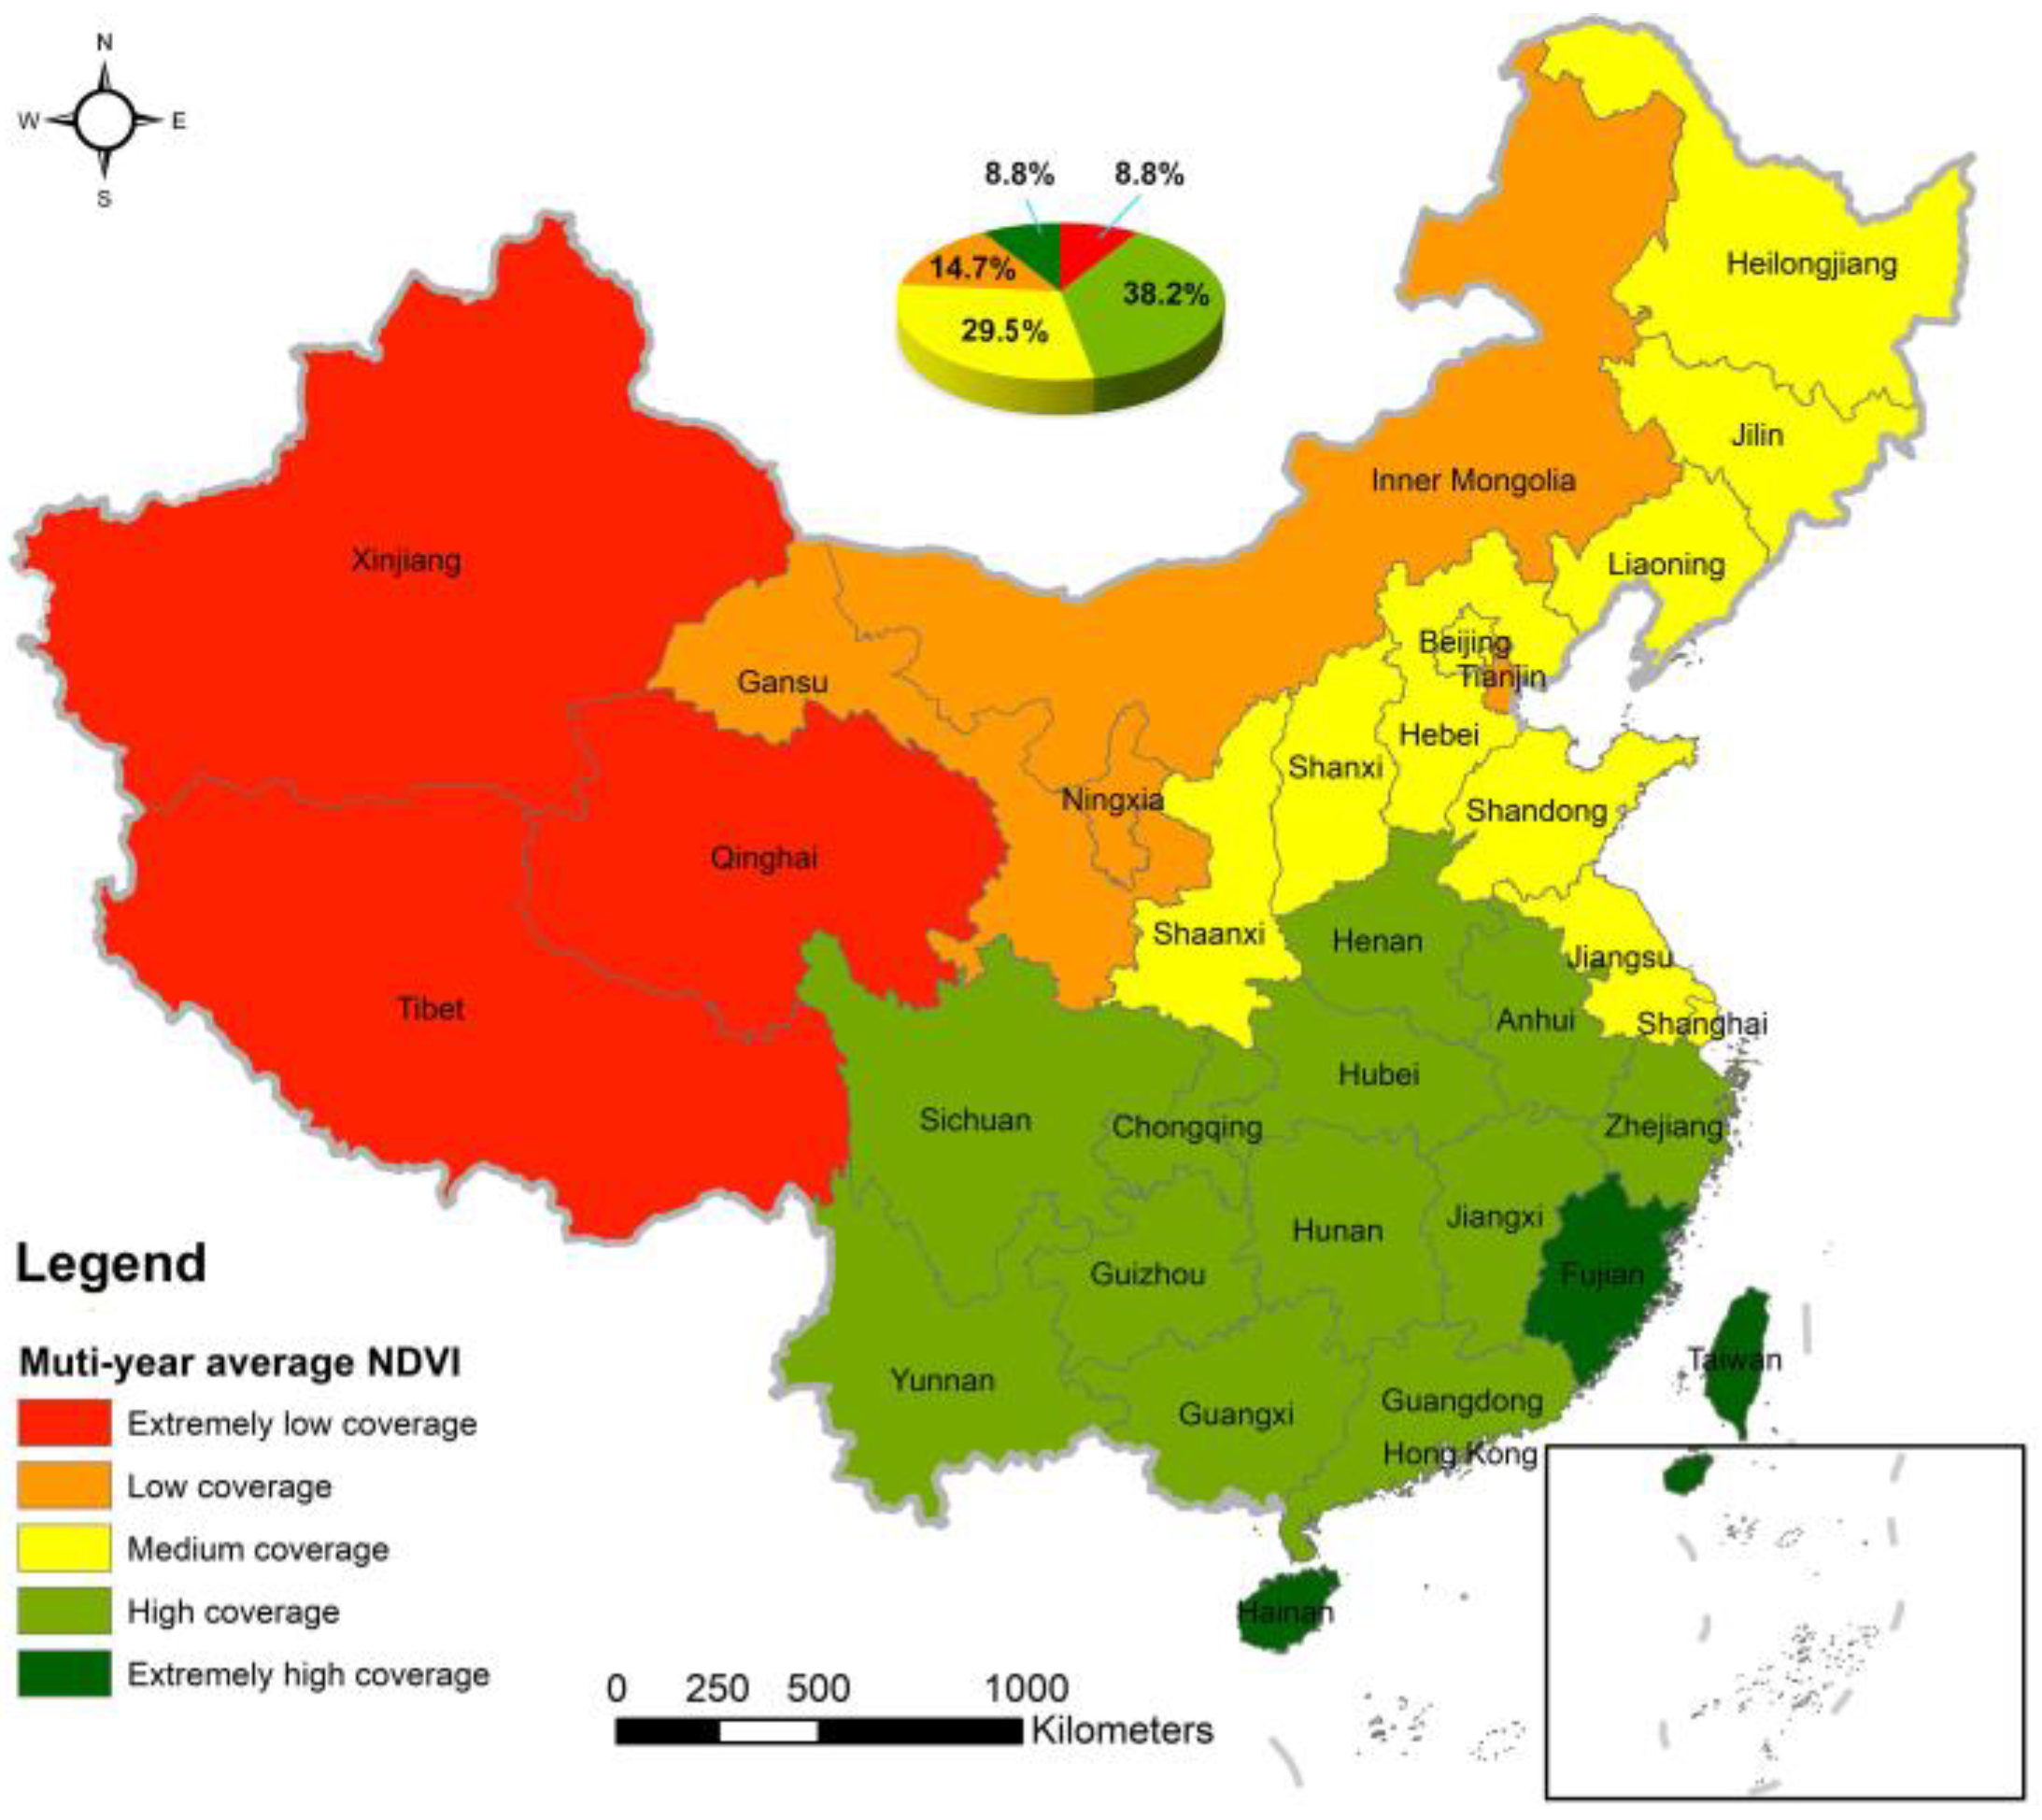
3.1.1. Spatial Heterogeneity of Multi-Year Average NDVI in Provincial Administrative Regions
3.1.2. Spatial Heterogeneity of Multi-Year Average NDVI in Prefectural Administrative Regions
3.1.3. Linear Correlation between Multi-Year Average Precipitation and Multi-Year Average NDVI
3.2. Temporal Heterogeneity of Regional Vegetation Coverage
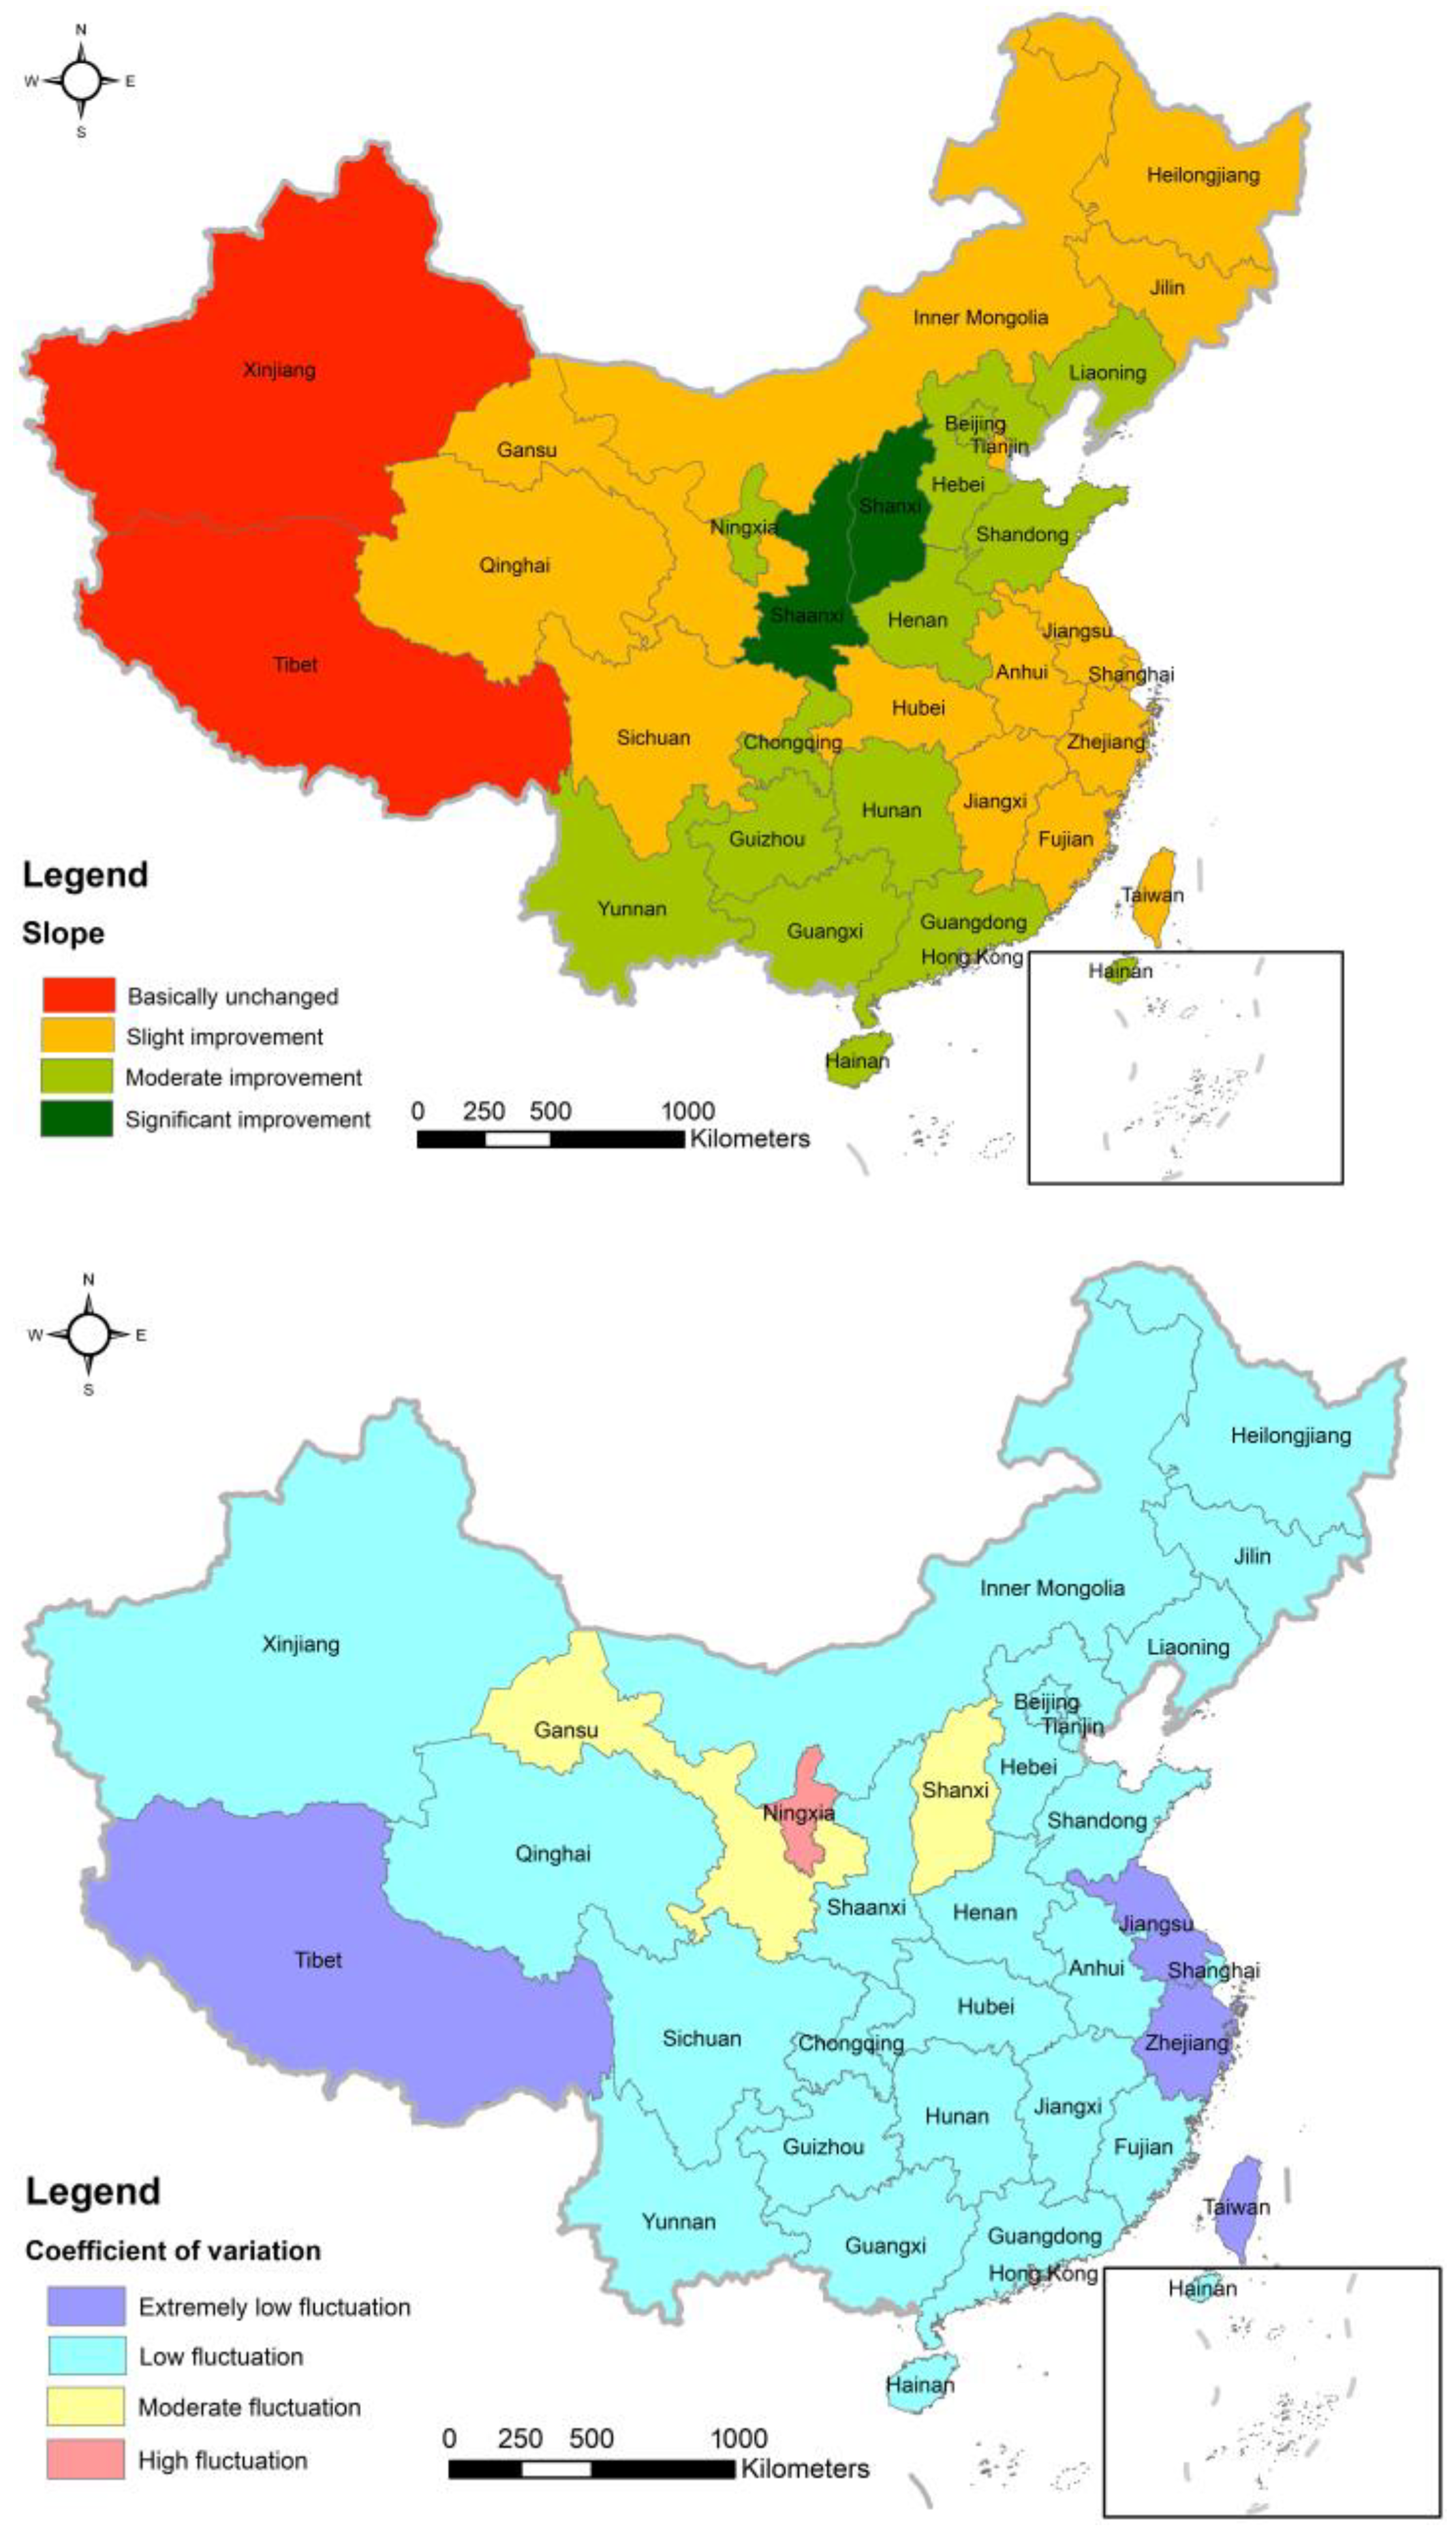
3.2.1. Temporal Heterogeneity of Vegetation Coverage in Provincial Administrative Regions
3.2.2. Temporal Heterogeneity of Vegetation Coverage in Prefectural Administrative Regions
3.3. Overall Change Trend of Regional Annual Average NDVI
4. Discussion
4.1. Provincial Administrative Regions
4.2. Prefectural Administrative Regions
5. Conclusions
- (1)
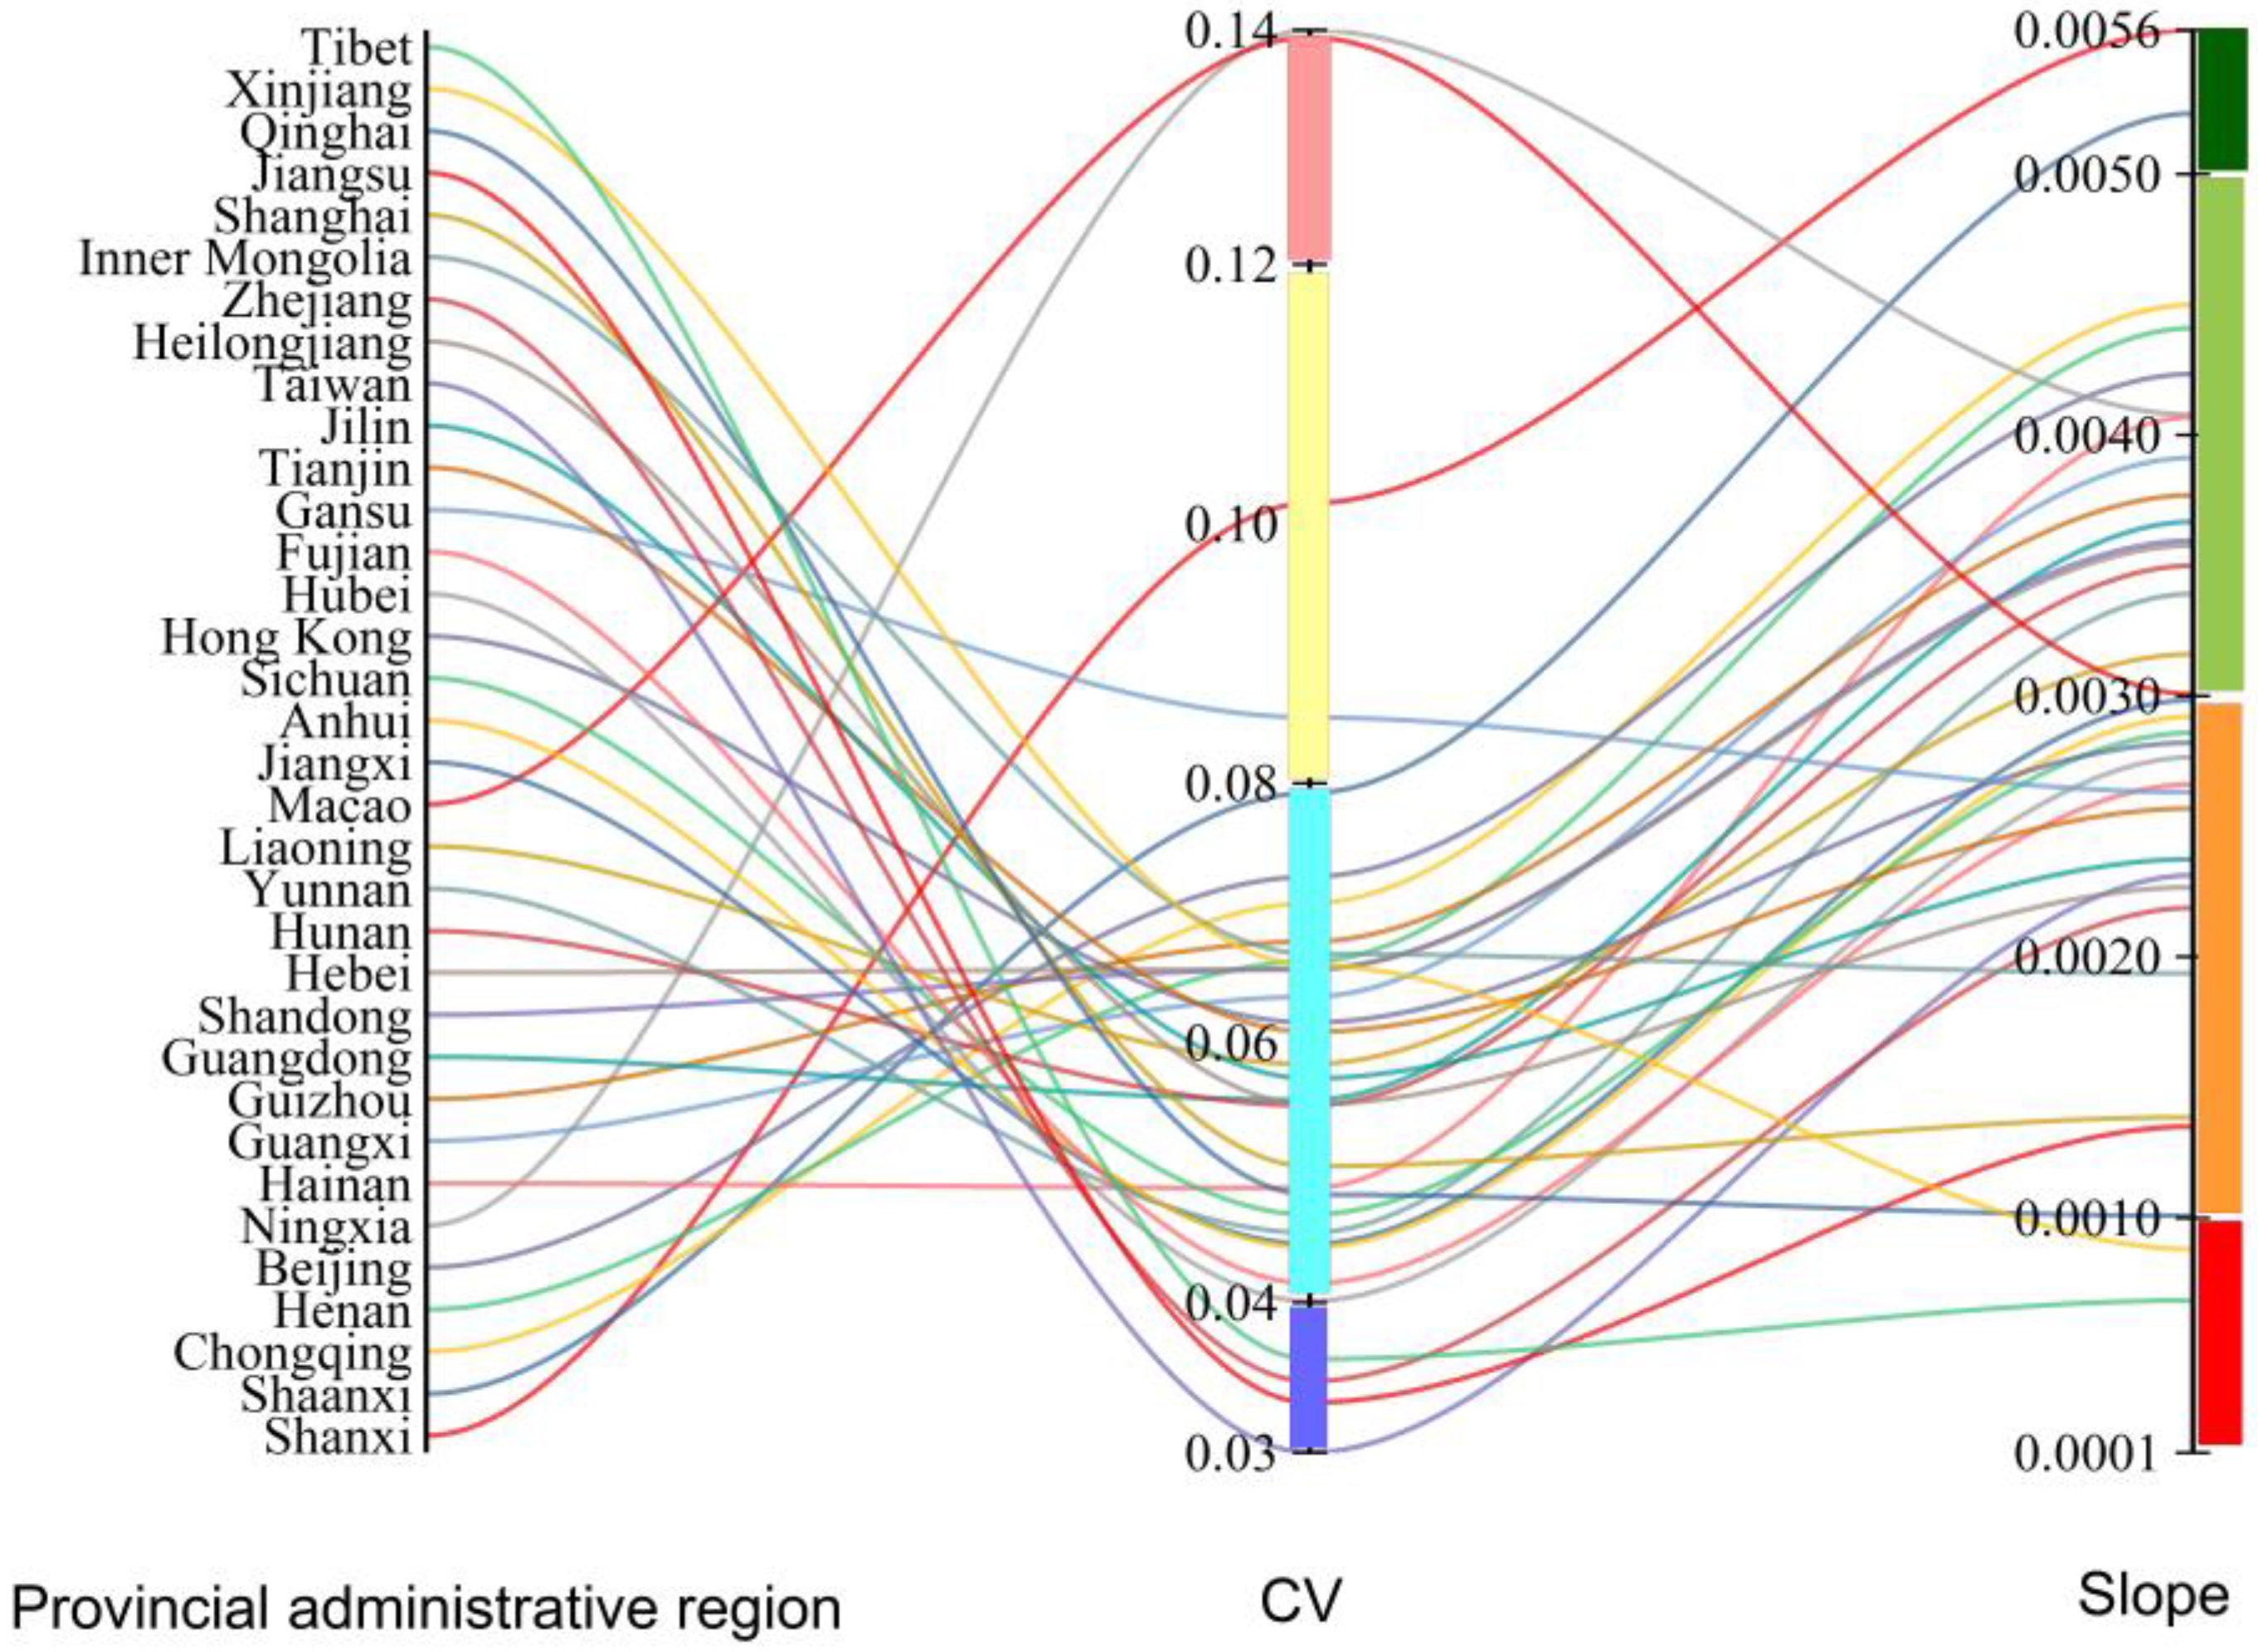
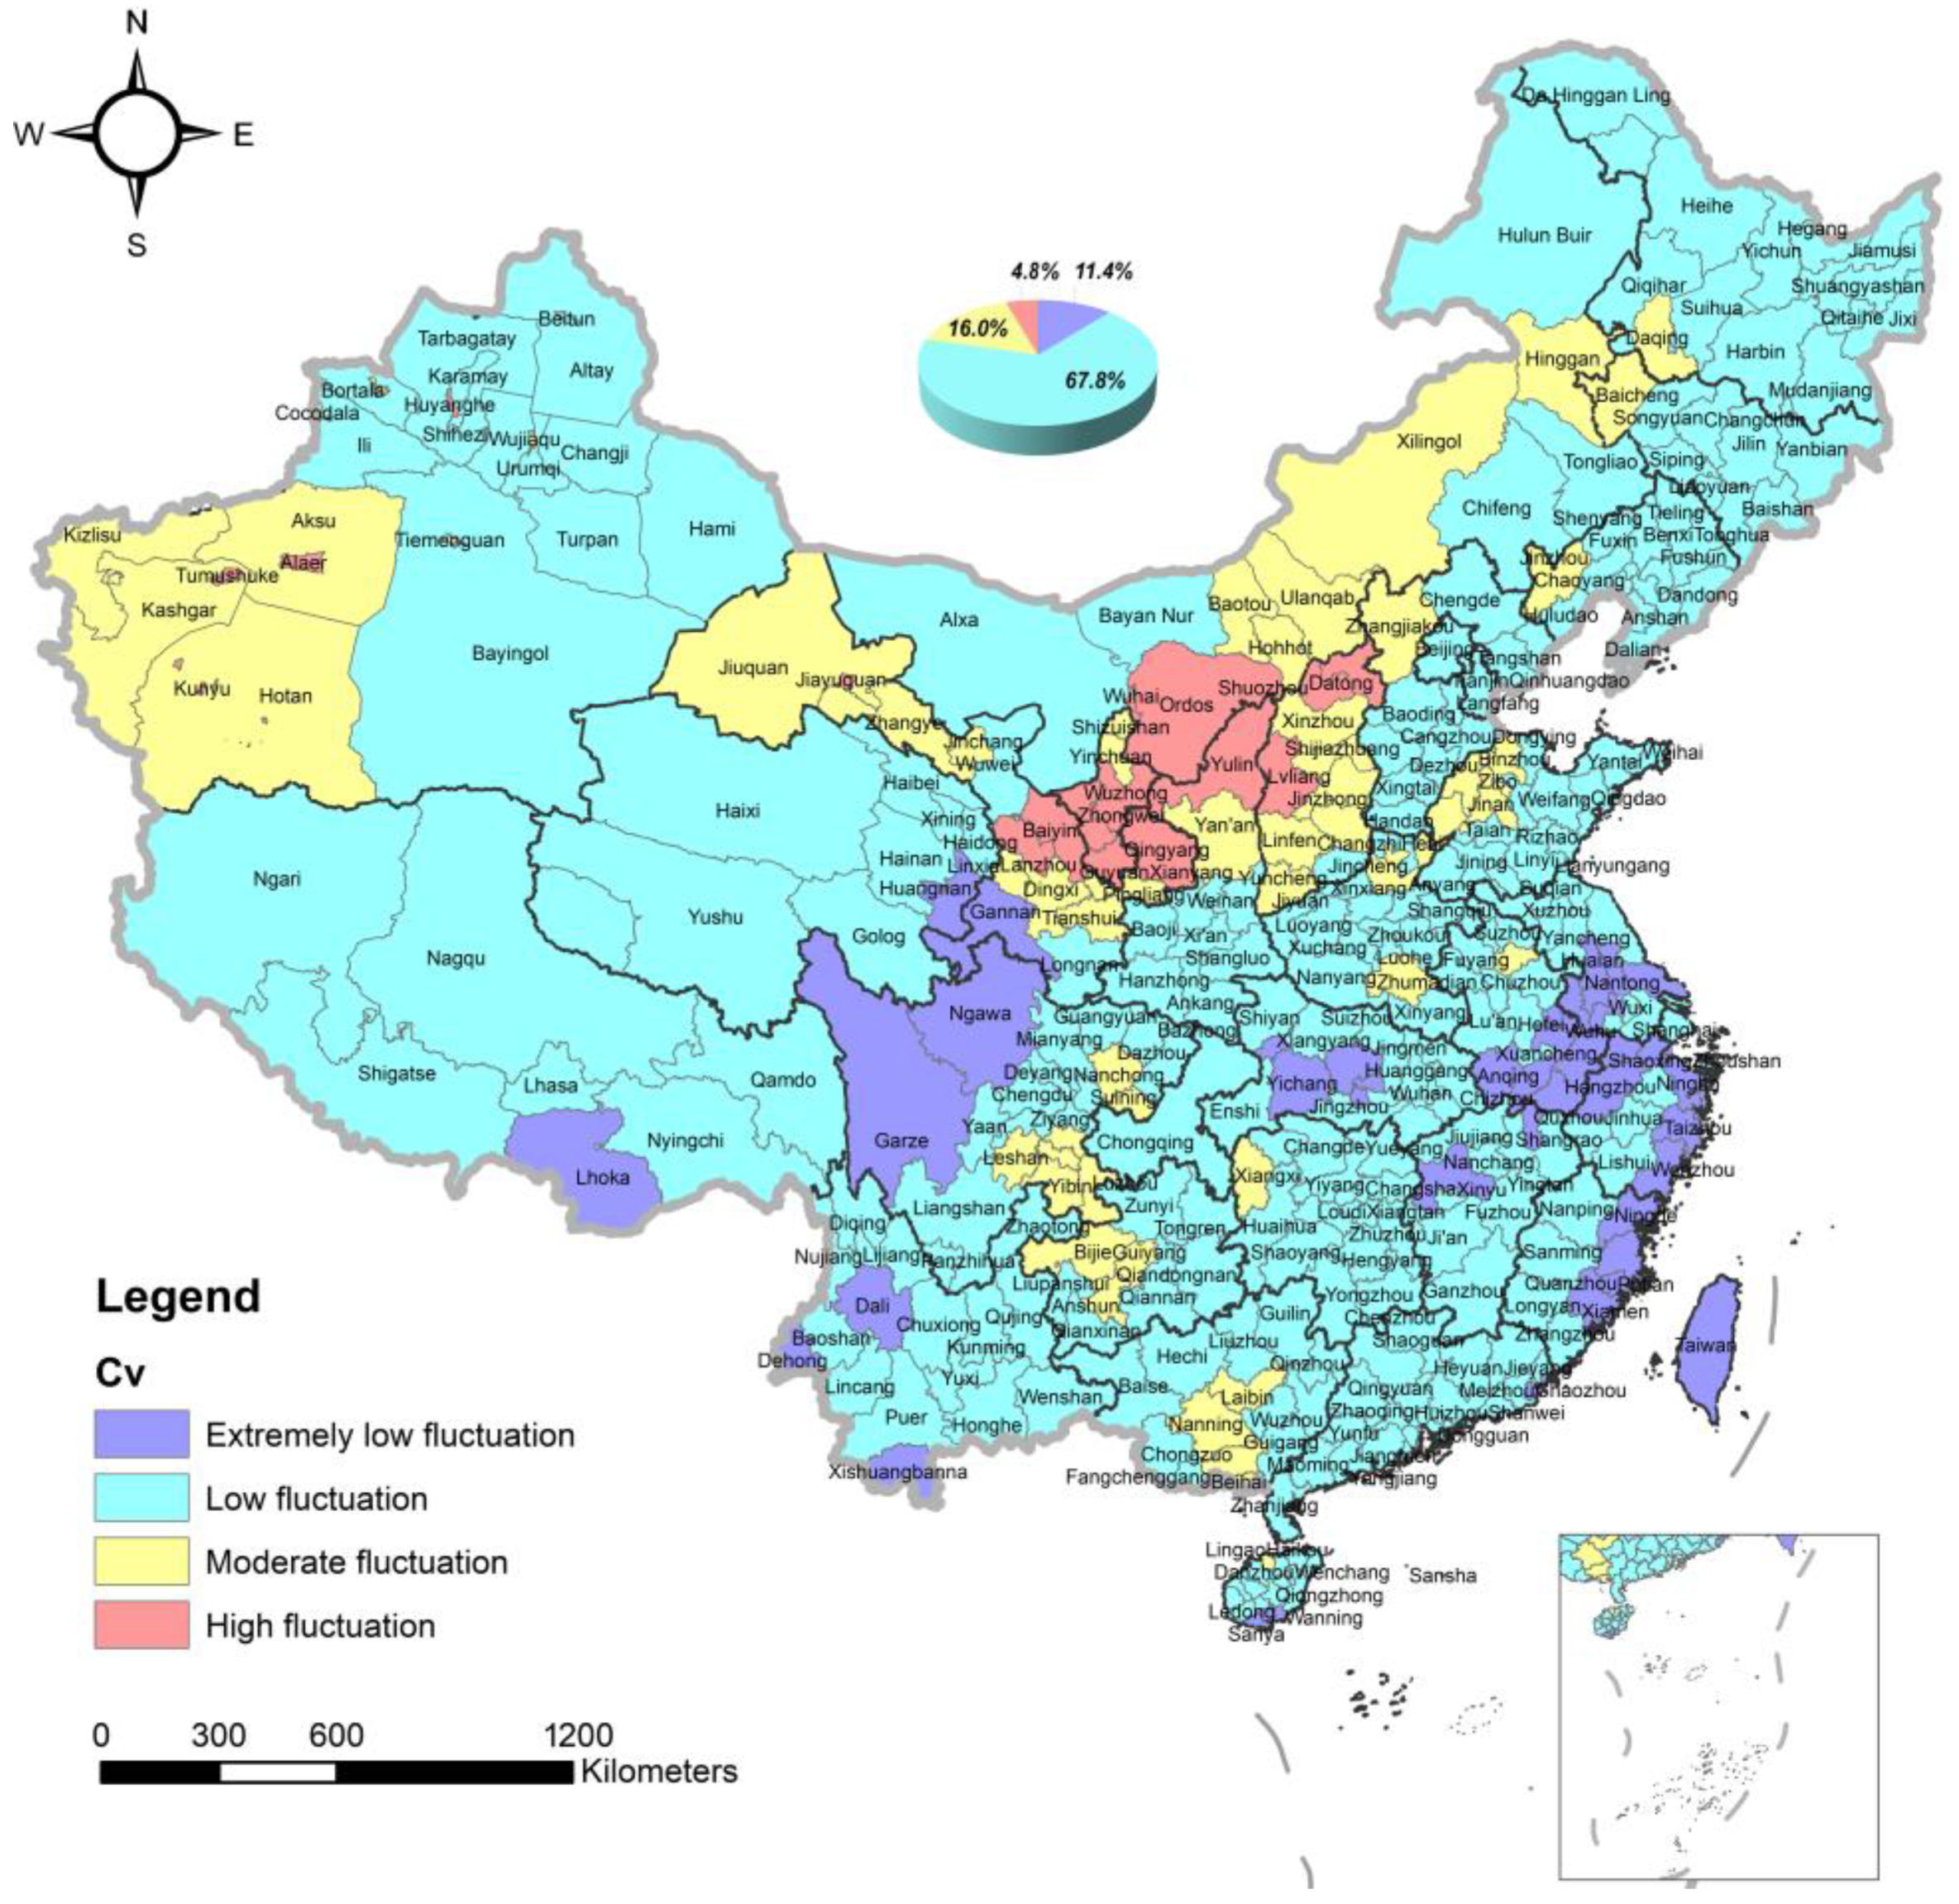
- During the period from 2000 to 2021, China’s overall vegetation coverage showed an increasing trend. At the provincial and prefecture levels, the annual growth rates of vegetation coverage were 0.032/10a and 0.03/10a, respectively. At the provincial level, the vegetation coverage in Xinjiang, Tibet, Qinghai, and Ningxia was extremely low, while Taiwan, Hainan, and Fujian showed extremely high coverage levels. During the research period, Shanxi and Shaanxi saw the most significant vegetation improvement, followed by moderate growth trends in the eastern, central, and southern regions, while the vegetation coverage in Tibet and Xinjiang remained unchanged. The vegetation in Ningxia Autonomous Region was at a high level of fluctuation, and its ecological condition remained fragile.
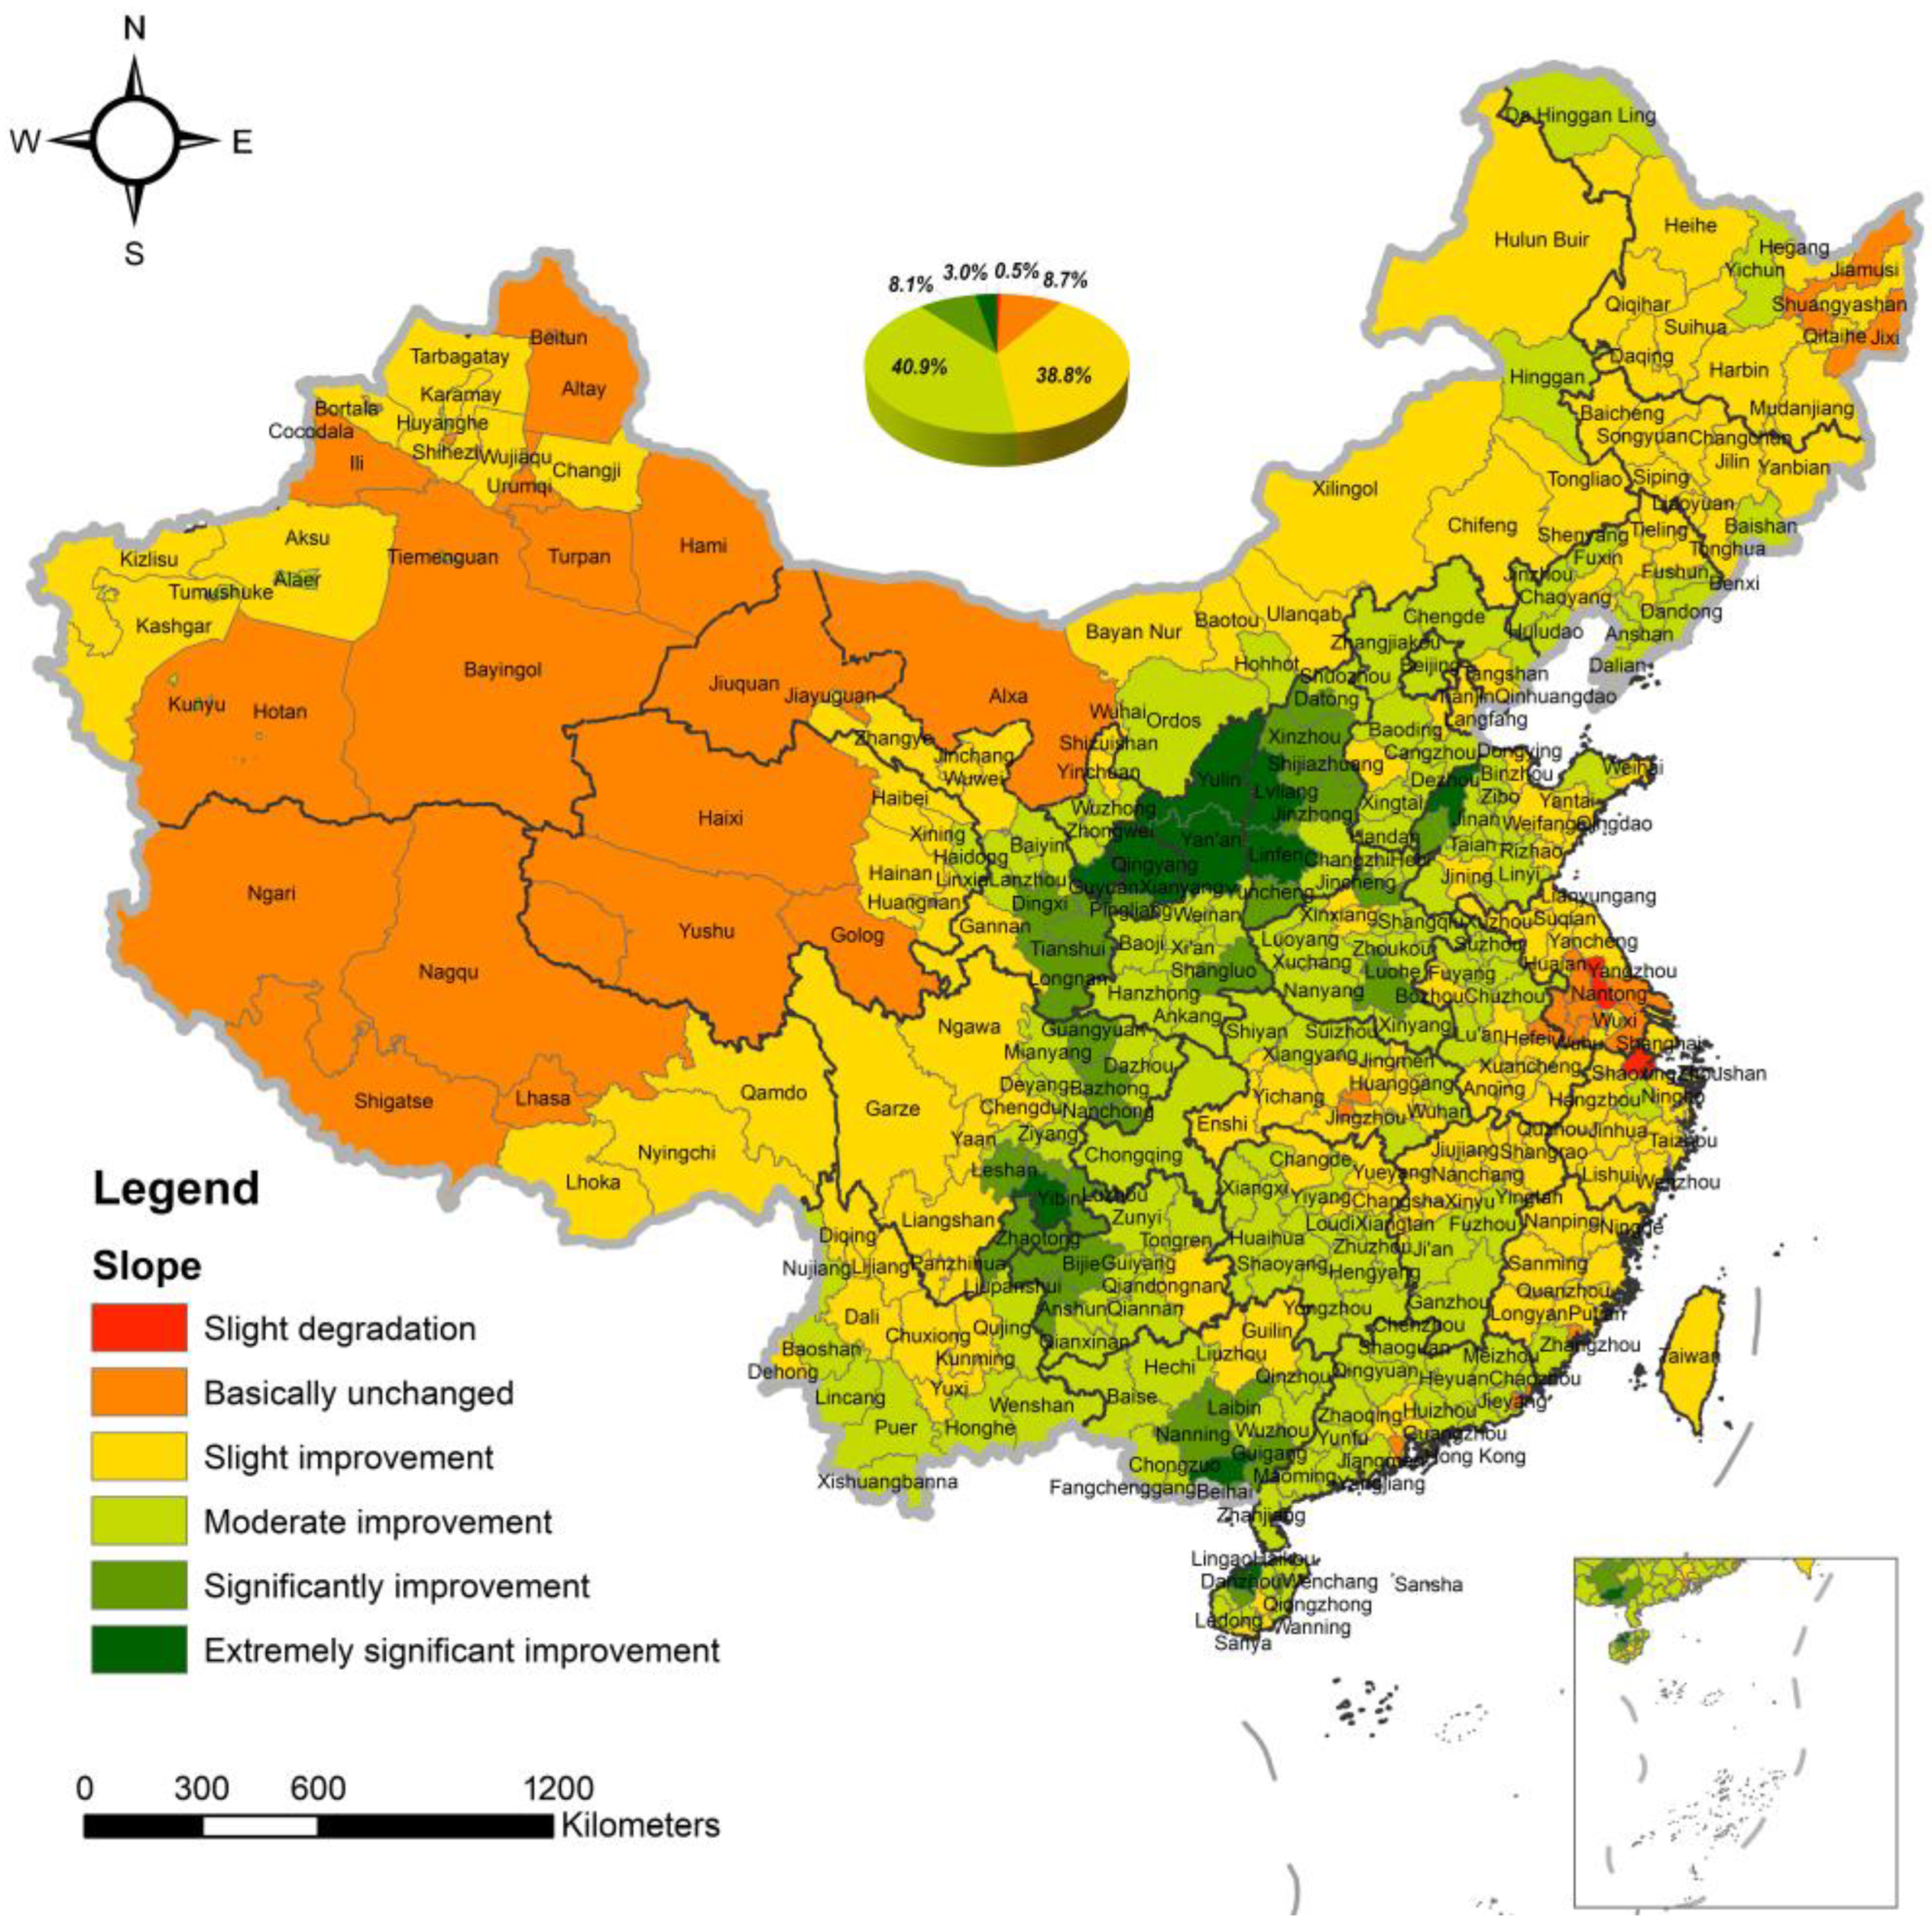
- (2)
- At the prefecture level, the fastest-growing areas were mainly located in China’s Loess Plateau region. In addition, moderate growth occurred on a larger scale. However, cities such as Taizhou in Jiangsu and Jiaxing in Zhejiang have experienced vegetation degradation. Meanwhile, the vegetation growth in the central and western parts of the northwest region, the central and western parts of the Qinghai-Tibet Plateau, the eastern part of Heilongjiang, and the southern parts of Guangdong and Fujian was slow, and they were on the brink of degradation.
- (3)
- The distribution pattern of vegetation coverage is widely influenced by climate conditions and human activities. At the regional level, the correlation coefficients between rainfall and NDVI mean values of provincial and prefecture-level administrative regions reached 0.84 and 0.8, respectively. Combined with the spatial distribution of vegetation coverage, this indicates that rainfall has a profound influence on the distribution pattern of vegetation. Human activities are also participating in and changing the regional vegetation conditions in an extremely extensive and complex way, both positively and negatively.
- (4)
- The research results indirectly confirm that the high vegetation growth in the Loess Plateau region demonstrates the effectiveness of a series of ecological greening projects in the area. Conversely, localized vegetation degradation (such as in Taizhou and Jiaxing) in the east and southeast coastal regions of China implies that economic and population growth during specific periods may lead to such degradation.
Author Contributions
Funding
Institutional Review Board Statement
Informed Consent Statement
Data Availability Statement
Acknowledgments
Conflicts of Interest
References
- Feng, X.; Zeng, Z.; He, M. A 20-Year Vegetation Cover Change and Its Response to Climate Factors in the Guangdong-Hong Kong-Macao Greater Bay Area under the Background of Climate Change. Front. Ecol. Evol. 2023, 10, 1080734. [Google Scholar] [CrossRef]
- Li, S.; Wei, F.; Wang, Z.; Shen, J.; Liang, Z.; Wang, H.; Li, S. Spatial Heterogeneity and Complexity of the Impact of Extreme Climate on Vegetation in China. Sustainability. 2021, 13, 5748. [Google Scholar] [CrossRef]
- Liang, S.; Wang, J. (Eds.) Chapter 15—Estimate of Vegetation Production of Terrestrial Ecosystem. In Advanced Remote Sensing, 2nd ed.; Academic Press: Cambridge, MA, USA, 2020; pp. 581–620. ISBN 978-0-12-815826-5. [Google Scholar]
- Piao, S.; Wang, X.; Park, T.; Chen, C.; Lian, X.; He, Y.; Bjerke, J.W.; Chen, A.; Ciais, P.; Tømmervik, H.; et al. Characteristics, Drivers and Feedbacks of Global Greening. Nat. Rev. Earth Environ. 2019, 1, 14–27. [Google Scholar] [CrossRef]
- Wen, X.; Liu, C.; Luo, S. Comparative Analysis of Water-Energy Cycle Processes Based on High-Resolution Assimilation Dataset of the Water-Energy Cycle in China Data Over Different Underlying Surfaces in Qinghai-Tibet Plateau. Front. Earth Sci. 2020, 8, 576461. [Google Scholar] [CrossRef]
- Feng, D.; Fu, M.; Sun, Y.; Bao, W.; Zhang, M.; Zhang, Y.; Wu, J. How Large-Scale Anthropogenic Activities Influence Vegetation Cover Change in China? A Review. Forests 2021, 12, 320. [Google Scholar] [CrossRef]
- Gaberščik, A.; Murlis, J. The Role of Vegetation in the Water Cycle. Ecohydrol. Hydrobiol. 2011, 11, 175–181. [Google Scholar] [CrossRef]
- Carlson, T.N.; Ripley, D.A. On the Relation between NDVI, Fractional Vegetation Cover, and Leaf Area Index. Remote Sens. Environ. 1997, 62, 241–252. [Google Scholar] [CrossRef]
- Berveglieri, A.; Imai, N.N.; Christovam, L.E.; Galo, M.L.B.T.; Tommaselli, A.M.G.; Honkavaara, E. Analysis of Trends and Changes in the Successional Trajectories of Tropical Forest Using the Landsat NDVI Time Series. Remote Sens. Appl. Soc. Environ. 2021, 24, 100622. [Google Scholar] [CrossRef]
- Huang, S.; Tang, L.; Hupy, J.P.; Wang, Y.; Shao, G. A Commentary Review on the Use of Normalized Difference Vegetation Index (NDVI) in the Era of Popular Remote Sensing. J. For. Res. 2021, 32, 1–6. [Google Scholar] [CrossRef]
- Shibani, N.; Pandey, A.; Krishan Satyam, V.; Singh Bhari, J.; Ahmed Karimi, B.; Kumar Gupta, S. Study on the Variation of NDVI, SAVI and EVI Indices in Punjab State, India. IOP Conf. Ser. Earth Environ. Sci. 2023, 1110, 012070. [Google Scholar] [CrossRef]
- Liu, Y.; Li, Y.; Li, S.; Motesharrei, S. Spatial and Temporal Patterns of Global NDVI Trends: Correlations with Climate and Human Factors. Remote Sens. 2015, 7, 13233–13250. [Google Scholar] [CrossRef]
- Pettorelli, N.; Vik, J.O.; Mysterud, A.; Gaillard, J.-M.; Tucker, C.J.; Stenseth, N.C. Using the Satellite-Derived NDVI to Assess Ecological Responses to Environmental Change. Trends Ecol. Evol. 2005, 209, 503–510. [Google Scholar] [CrossRef] [PubMed]
- Zhao, X.; Zhou, D.; Fang, J. Satellite-Based Studies on Large-Scale Vegetation Changes in China. J. Integr. Plant Biol. 2012, 54, 713–728. [Google Scholar] [CrossRef]
- Zhao, W.; Li, A. A Review on Land Surface Processes Modelling over Complex Terrain. Adv. Meteorol. 2015, 2015, 607181. [Google Scholar] [CrossRef]
- Zhao, B.; Wang, K. The Differences between County, County-Level City and Municipal District in the System of Administrative Divisions in China. J. Geogr. Res. 2022, 5, 25–38. [Google Scholar] [CrossRef]
- Runfola, D.S.M.; Anderson, A.; Baier, H.; Crittenden, M.; Dowker, E.; Fuhrig, S.; Goodman, S.; Grimsley, G.; Layko, R.; Melville, G.; et al. GeoBoundaries: A Global Database of Political Administrative Boundaries. PLoS ONE 2020, 15, e0231866. [Google Scholar] [CrossRef] [PubMed]
- Wang, J.-F.; Zhang, T.-L.; Fu, B.-J. A Measure of Spatial Stratified Heterogeneity. Ecol. Indic. 2016, 67, 250–256. [Google Scholar] [CrossRef]
- Jin, K.; Wang, F.; Han, J.; Shi, S.; Ding, W. Contribution of climatic change and human activities to vegetation NDVI change over China during 1982–2015. Acta Geogr. Sin. 2020, 75, 961–974. [Google Scholar]
- Li, Q.; Shi, X.; Wu, Q. Effects of China’s Ecological Restoration on Economic Development Based on Night-Time Light and NDVI Data. Environ. Sci. Pollut. Res. 2021, 28, 65716–65730. [Google Scholar] [CrossRef]
- Liu, Q.; Yang, Y.; Tian, H.; Zhang, B.; Gu, L. Assessment of Human Impacts on Vegetation in Built-up Areas in China Based on AVHRR, MODIS and DMSP_OLS Nighttime Light Data, 1992–2010. Chin. Geogr. Sci. 2014, 24, 231–244. [Google Scholar] [CrossRef]
- Zou, Y.; Chen, W.; Li, S.; Wang, T.; Yu, L.; Xu, M.; Singh, R.P.; Liu, C.-Q. Spatio-Temporal Changes in Vegetation in the Last Two Decades (2001–2020) in the Beijing–Tianjin–Hebei Region. Remote Sens. 2022, 14, 3958. [Google Scholar] [CrossRef]
- Geng, S.; Zhang, H.; Xie, F.; Li, L.; Yang, L. Vegetation Dynamics under Rapid Urbanization in the Guangdong–Hong Kong–Macao Greater Bay Area Urban Agglomeration during the Past Two Decades. Remote Sens. 2022, 14, 3993. [Google Scholar] [CrossRef]
- Deng, X.; Wu, L.; He, C.; Shao, H. Study on Spatiotemporal Variation Pattern of Vegetation Coverage on Qinghai–Tibet Plateau and the Analysis of Its Climate Driving Factors. Int. J. Environ. Res. Public Health 2022, 19, 8836. [Google Scholar] [CrossRef]
- Nie, T.; Dong, G.; Jiang, X.; Lei, Y. Spatio-Temporal Changes and Driving Forces of Vegetation Coverage on the Loess Plateau of Northern Shaanxi. Remote Sens. 2021, 13, 613. [Google Scholar] [CrossRef]
- Sun, X.; Cao, Y.; He, X.-D.; Wang, R.; Zeng, P.; Li, Y.; Huang, Z.; Xiao, W. Administrative Level May Be the Key Factor to Improve Protection Effectiveness of Nature Reserves in China. Sustainability 2022, 14, 4853. [Google Scholar] [CrossRef]
- Gorelick, N.; Hancher, M.; Dixon, M.; Ilyushchenko, S.; Thau, D.; Moore, R. Google Earth Engine: Planetary-Scale Geospatial Analysis for Everyone. Remote Sens. Environ. 2017, 202, 18–27. [Google Scholar] [CrossRef]
- Tamiminia, H.; Salehi, B.; Mahdianpari, M.; Quackenbush, L.J.; Adeli, S.; Brisco, B. Google Earth Engine for Geo-Big Data Applications: A Meta-Analysis and Systematic Review. Isprs J. Photogramm. Remote Sens. 2020, 164, 152–170. [Google Scholar] [CrossRef]
- Kumar, L.; Mutanga, O. Google Earth Engine Applications Since Inception: Usage, Trends, and Potential. Remote Sens. 2018, 10, 1509. [Google Scholar] [CrossRef]
- Zhou, Z.; Ding, Y.; Shi, H.; Cai, H.; Fu, Q.; Liu, S.; Li, T. Analysis and Prediction of Vegetation Dynamic Changes in China: Past, Present and Future. Ecol. Indic. 2020, 117, 106642. [Google Scholar] [CrossRef]
- Ghorbanian, A.; Mohammadzadeh, A.; Jamali, S. Linear and Non-Linear Vegetation Trend Analysis throughout Iran Using Two Decades of MODIS NDVI Imagery. Remote Sens. 2022, 14, 3683. [Google Scholar] [CrossRef]
- Eckert, S.; Hüsler, F.; Liniger, H.; Hodel, E. Trend Analysis of MODIS NDVI Time Series for Detecting Land Degradation and Regeneration in Mongolia. J. Arid Environ. 2015, 113, 16–28. [Google Scholar] [CrossRef]
- Zhang, Y.; Ye, A. Spatial and Temporal Variations in Vegetation Coverage Observed Using AVHRR GIMMS and Terra MODIS Data in the Mainland of China. Int. J. Remote Sens. 2020, 41, 4238–4268. [Google Scholar] [CrossRef]
- Didan, K.; Munoz, A.B. MODIS Vegetation Index User’s Guide (MOD13 Series). Available online: https://lpdaac.usgs.gov/documents/103/MOD13_User_Guide_V6.pdf (accessed on 10 January 2023).
- Muñoz Sabater, J. ERA5-Land Monthly Averaged Data from 1950 to Present. Copernicus Climate Change Service (C3S) Climate Data Store (CDS). Available online: https://cds.climate.copernicus.eu/cdsapp#!/dataset/10.24381/cds.68d2bb30?tab=overview (accessed on 10 January 2023).
- Li, M.; Yin, L.; Zhang, Y.; Su, X.; Liu, G.; Wang, X.; Au, Y.; Wu, X. Spatio-Temporal Dynamics of Fractional Vegetation Coverage Based on MODIS-EVI and Its Driving Factors in Southwest China. Acta Ecol. Sin. 2021, 41, 1138–1147. [Google Scholar]
- Wang, X.; Shi, S.; Chen, J. Fractional Vegetation Cover Change and Its Driving Factors in the Yellow River Basin. China Environ. Sci. 2022, 42, 5358–5368. [Google Scholar]
- Fu, P.; Gong, Y. Analyzing Variation of NDVI and Its Relationship with Slope in Hubei Province, China. In Proceedings of the 2015 23rd International Conference on Geoinformatics, Wuhan, China, 19–21 June 2015; pp. 1–6. [Google Scholar]
- Han, W.; Chen, D.; Li, H.; Chang, Z.; Chen, J.; Ye, L.; Liu, S.; Wang, Z. Spatiotemporal Variation of NDVI in Anhui Province from 2001 to 2019 and Its Response to Climatic Factors. Forests 2022, 13, 1643. [Google Scholar] [CrossRef]
- Jiang, D.; Zhang, H.; Zhang, Y.; Wang, K. Interannual Variability and Correlation of Vegetation Cover and Precipitation in Eastern China. Theor. Appl. Climatol. 2014, 118, 93–105. [Google Scholar] [CrossRef]
- Mo, K.; Chen, Q.; Chen, C.; Zhang, J.; Wang, L.; Bao, Z. Spatiotemporal Variation of Correlation between Vegetation Cover and Precipitation in an Arid Mountain-Oasis River Basin in Northwest China. J. Hydrol. 2019, 574, 138–147. [Google Scholar] [CrossRef]
- Pang, J.; Du, Z.; Zhang, X. Understanding of the Relationship between Vegetation Change and Physical Geographic Factors Based on Geographical Detector. In Proceedings of the International Conference on Intelligent Earth Observing and Applications, Guilin, China, 23–24 October 2015; SPIE: Bellingham, DC, USA, 2015; Volume 9808, p. 98081D. [Google Scholar]
- Ding, Y.; Wang, F.; Mu, Q.; Sun, Y.; Cai, H.; Zhou, Z.; Xu, J.; Shi, H. Estimating Land Use/Land Cover Change Impacts on Vegetation Response to Drought under ‘Grain for Green’ in the Loess Plateau. Land Degrad. Dev. 2021, 32, 5083–5098. [Google Scholar] [CrossRef]
- Liu, J.; Li, S.; Ouyang, Z.; Tam, C.; Chen, X. Ecological and Socioeconomic Effects of China’s Policies for Ecosystem Services. Proc. Natl. Acad. Sci. USA 2008, 105, 9477–9482. [Google Scholar] [CrossRef]
- Lu, F.; Hu, H.; Sun, W.; Zhu, J.; Liu, G.; Zhou, W.; Zhang, Q.; Shi, P.; Liu, X.; Wu, X.; et al. Effects of National Ecological Restoration Projects on Carbon Sequestration in China from 2001 to 2010. Proc. Natl. Acad. Sci. USA 2018, 115, 4039–4044. [Google Scholar] [CrossRef]
- Chen, H.; Marter-Kenyon, J.; López-Carr, D.; Liang, X. Land Cover and Landscape Changes in Shaanxi Province during China’s Grain for Green Program (2000–2010). Environ. Monit. Assess. 2015, 187, 644. [Google Scholar] [CrossRef] [PubMed]
- Li, S.; Yang, S.; Liu, X.; Liu, Y.; Shi, M. NDVI-Based Analysis on the Influence of Climate Change and Human Activities on Vegetation Restoration in the Shaanxi-Gansu-Ningxia Region, Central China. Remote Sens. 2015, 7, 11163–11182. [Google Scholar] [CrossRef]
- Sun, H.; Wu, L.; Hu, J.; Ma, L.; Li, H.; Wu, D. Evaluating Eco-Environment in Urban Agglomeration from a Vegetation-Impervious Surface-Soil-Air Framework: An Example in Ningxia, China. J. Appl. Remote Sens. 2021, 15, 014518. [Google Scholar] [CrossRef]
- Guo, X.; Zhang, H.; Wu, Z.; Zhao, J.; Zhang, Z. Comparison and Evaluation of Annual NDVI Time Series in China Derived from the NOAA AVHRR LTDR and Terra MODIS MOD13C1 Products. Sensors 2017, 17, 1298. [Google Scholar] [CrossRef]
- Chang, J.; Liu, Q.; Wang, S.; Huang, C. Vegetation Dynamics and Their Influencing Factors in China from 1998 to 2019. Remote Sens. 2022, 14, 3390. [Google Scholar] [CrossRef]
- Zhou, T.; Liu, H.; Gou, P.; Xu, N. Conflict or Coordination? Measuring the Relationships between Urbanization and Vegetation Cover in China. Ecol. Indic. 2023, 147, 109993. [Google Scholar] [CrossRef]
- Li, C.; Kuang, Y.; Huang, N.; Zhang, C. The Long-Term Relationship between Population Growth and Vegetation Cover: An Empirical Analysis Based on the Panel Data of 21 Cities in Guangdong Province, China. Int. J. Environ. Res. Public Health 2013, 10, 660–677. [Google Scholar] [CrossRef] [PubMed]
- Jin, K.; Wang, F.; Li, P. Responses of Vegetation Cover to Environmental Change in Large Cities of China. Sustainability 2018, 10, 270. [Google Scholar] [CrossRef]


| Level | Multi-Year Average NDVI |
|---|---|
| Extremely low coverage | |
| Low coverage | |
| Medium coverage | |
| High coverage | |
| Extremely high coverage |
| Level | Variation Trend of NDVI Mean Value |
|---|---|
| Slight degradation | S < −0.001 |
| Basically unchanged | −0.001 ≤ S < 0.001 |
| Slight improvement | 0.001 ≤ S < 0.003 |
| Moderate improvement | 0.003 ≤ S < 0.005 |
| Significantly improvement | 0.005 ≤ S < 0.006 |
| Extremely significant improvement | S ≥ 0.006 |
| Level | Coefficient of Variation (CV) |
|---|---|
| Extremely low fluctuation | CV < 0.04 |
| Low fluctuation | 0.04 ≤ CV < 0.08 |
| Moderate fluctuation | 0.08 ≤ CV < 0.12 |
| High fluctuation | CV ≥ 0.12 |
Disclaimer/Publisher’s Note: The statements, opinions and data contained in all publications are solely those of the individual author(s) and contributor(s) and not of MDPI and/or the editor(s). MDPI and/or the editor(s) disclaim responsibility for any injury to people or property resulting from any ideas, methods, instructions or products referred to in the content. |
© 2023 by the authors. Licensee MDPI, Basel, Switzerland. This article is an open access article distributed under the terms and conditions of the Creative Commons Attribution (CC BY) license (https://creativecommons.org/licenses/by/4.0/).
Share and Cite
Shang, G.; Wang, X.; Li, Y.; Han, Q.; He, W.; Chen, K. Heterogeneity Analysis of Spatio-Temporal Distribution of Vegetation Cover in Two-Tider Administrative Regions of China. Sustainability 2023, 15, 13305. https://doi.org/10.3390/su151813305
Shang G, Wang X, Li Y, Han Q, He W, Chen K. Heterogeneity Analysis of Spatio-Temporal Distribution of Vegetation Cover in Two-Tider Administrative Regions of China. Sustainability. 2023; 15(18):13305. https://doi.org/10.3390/su151813305
Chicago/Turabian StyleShang, Guoxiu, Xiaogang Wang, Yun Li, Qi Han, Wei He, and Kaixiao Chen. 2023. "Heterogeneity Analysis of Spatio-Temporal Distribution of Vegetation Cover in Two-Tider Administrative Regions of China" Sustainability 15, no. 18: 13305. https://doi.org/10.3390/su151813305