Article

Performance Evaluation of Asphalt Mixtures Containing Different Proportions of Alternative Materials

1
Department of Civil and Environmental Engineering, University of New Hampshire, Durham, NH 03824, USA
2
Department of Transportation, University of Isfahan, Isfahan 8174673441, Iran
3
Faculty of Civil Engineering, University of Belgrade, 11000 Belgrade, Serbia
4
Department of Civil and Environmental Engineering, University of Virginia, Charlottesville, VA 22904, USA
5
Department of Civil Engineering, Iran University of Science and Technology, Tehran 16846-13114, Iran
*
Authors to whom correspondence should be addressed.
Sustainability 2023, 15(18), 13314; https://doi.org/10.3390/su151813314
Submission received: 5 July 2023 / Revised: 16 August 2023 / Accepted: 4 September 2023 / Published: 5 September 2023
(This article belongs to the Section Sustainable Materials)

Abstract

:
With the increasing scarcity and cost of virgin materials for asphalt mixtures, the exploration of alternative components has intensified. Reclaimed asphalt pavement (RAP), crumb rubber (CR), steel slag (SS), and waste engine oil (WEO) have emerged as promising alternatives. Individually, RAP enhances rutting resistance but may compromise cracking tolerance; CR boosts cracking resistance; WEO affects cracking and rutting differently; and SS can influence moisture sensitivity. However, their combined impacts on asphalt performance, specifically on moisture damage, rutting, and cracking resistance, remain underexplored. In this study, 44 mixtures were assessed with varying RAP (0–75%), WEO (0–15%), and CR (0–15%) contents, alongside a constant SS aggregate (0% or 20%). The results indicate that specific combinations of these alternative materials can satisfy all performance thresholds for rutting, cracking, and moisture damage. To pinpoint ranges of optimal material contents for different high-traffic scenarios, prediction models were crafted using techniques like feed-forward neural network (FNN), generalized linear model (GLM), support vector regression (SVM), and Gaussian process regression (GPR). Among these, GPR demonstrated superior efficacy, effectively identifying regions of satisfactory performance.

1. Introduction

In recent years, the utilization of reclaimed asphalt pavement (RAP) has become common worldwide because of its potential to conserve natural resources, reduce greenhouse gas emissions, and decrease construction costs [1,2]. However, despite its significant advantages, using RAP may affect the final reclaimed asphalt mixture (RAM) performance, particularly in terms of cracking and moisture damage resistance [3,4]. To mitigate these issues and maintain RAP’s remarkable economic and environmental benefits, a variety of alternative materials, such as waste polymers, waste tires, waste glass, waste plastic, and different types of alternative aggregates, have been employed as binder modifiers or aggregate replacements in RAMs [5,6,7]. This approach of enhancing performance using alternative materials has provided a promising avenue in the field of pavement engineering, thereby motivating researchers to explore and innovate further.
Various solutions have been explored to mitigate the adverse effects of RAP. One promising approach involves the use of asphalt recycling agent (ARA), including different types of waste oils, paired with binder modifiers [3,6]. In this context, waste engine oil (WEO) is one specific type of oil that has been investigated. However, the effects of WEO on asphalt mixtures are multifaceted and require further research for full understanding. Potential challenges posed by WEO include a possible decrease in rutting and moisture damage resistance due to its softening effect [3]. As per the study performed by RILEM, an effective ARA should augment the flexibility of bituminous materials and their cracking resistance, without adversely affecting the rutting resistance of RAMs. This principle aligns well with the efforts to employ binder modifiers to counterbalance the potential drawbacks of ARAs [8]. For example, one study reported that styrene–butadiene–styrene (SBS) positively impacted the rutting resistance of asphalt mixtures containing 35% RAP [5]. Another study indicated that the combination of waste-polymer-modified bitumen (WPMB) and ARA could significantly enhance the rutting resistance of RAMs [9]. In the quest for balance in asphalt mixture composition, an experimental study underscored the potential of using waste polyethylene (PE) [10]. The research showed that the addition of waste PE at an optimal level of 1.5% of the mixture mass improved the mixture’s strength, stiffness, and resistance to permanent deformation. Majidifar et al. used crumb rubber (CR) as a binder modifier alongside WEO to bolster the economic–environmental aspects and improve the moisture and rutting resistance of RAMs [6]. Furthermore, the use of CR was reported to positively influence mixtures’ rutting and moisture resistance, including RAP and WEO [3]. These findings highlight the potential of using CR, derived from waste tires, in counterbalancing the softening effect of ARAs, consequently enhancing the overall performance and durability of RAMs.
Despite the promising results of incorporating CR in mixtures with varying amounts of RAP and WEO, performance issues have been observed when high RAP contents are used [3]. A recent study investigating the fatigue performance of binder blends containing RAP binder and rubberized asphalt (CRRAPBs) found that this performance can be exceedingly complex [11]. Certain combinations of CR and RAP may even lead to a decrease in fatigue resistance. However, the study further revealed that with careful selection of the appropriate proportions of CR and RAP, the fatigue resistance of CRRAPBs can outperform that of virgin binders.
However, achieving a balance in the performance of RAMs containing high amounts alternative materials remains a challenge. It necessitates the exploration of additional solutions to further enhance the performance behaviors and strengthen the sustainability aspects of these mixtures. In this context, steel or copper slags, a byproduct of various steel- and copper-making processes, are promising aggregate replacements in asphalt mixtures. Their use is environmentally beneficial and reduces landfill usage [12]. Moreover, the diverse physical and chemical properties of steel slag (SS) can considerably enhance the asphalt mixtures’ mechanical properties. The addition of SS can improve several key properties of asphalt mixtures, including cracking resistance, moisture damage, and rutting resistance [13,14] mostly because of its favorable angularity, which increases the mixture’s internal friction and cohesion [15]. Additionally, the presence of CaO and MgO creates an alkaline environment that improves adhesion with the acidic asphalt binder, thereby improving moisture damage resistance [16]. These beneficial outcomes stem from the aggregate’s inherent attributes like hardness, shear strength, and abrasion resistance [14].
Numerous studies, using various mix design methods, have been performed with the aim to produce RAMs with satisfying properties. However, the traditional Superpave mix design method may have some limitations when incorporating RAP or other alternative materials. These limitations can lead to the production of RAMs with unsatisfactory performance, especially when multiple materials are simultaneously combined. In this context, the balanced mix design (BMD) emerges as a refined alternative [17,18]. Unlike the Superpave method, which mainly focuses on volumetric properties, the BMD simultaneously considers different properties of an asphalt mixture. This approach allows for a detailed study of the interactions and effects of various alternative materials on the overall performance of asphalt mixtures. Essentially, the BMD method provides a comprehensive framework that ensures mixtures are not only well-balanced but also durable and effective in real-world scenarios. The current study, therefore, had two objectives. The first one was to examine and understand the simultaneous impact of various types and proportions of alternative materials (RAP, SS, WEO and CR) on the mixture’s properties, such as moisture sensitivity, rutting and cracking resistance. The second objective was to develop prediction models for the properties being investigated. This was accomplished using the BMD approach. Gaussian process regression (GPR) was selected as the most appropriate among the four investigated methods (feed-forward neural network—FNN, generalized linear model—GLM, support vector regression—SVR and GPR) and then utilized to find the optimal ranges of alternative materials considering different traffic levels.

2. Materials and Methods

2.1. Materials

2.1.1. Limestone Aggregate

Limestone aggregate (L) was used in this study to produce asphalt mixtures. The physical and mechanical properties of the L are given in Table 1, whereas the selected gradation, including the upper and lower limits according to the Iran Asphalt Paving Code [9], is provided in Figure 1 (L).

2.1.2. Steel Slag Aggregate

In addition to the L, the coarse SS aggregate, with a gradation curve provided in Figure 1, was used. The SS was solely used to replace the limestone aggregate fractions retained on the #4 sieve. Thus, the passing percentage for sieving sizes smaller than 2.36 mm was equal zero. The physical properties and chemical composition of the SS are further provided in Table 1 and Table 2, respectively. A key property of the SS is its hydrophobic nature, which enhances its adhesion to the asphalt binder in asphalt mixtures.
The volumetric approach was selected over the weight method due to the higher density of the SS, which was identified as 3.299 g/cm3, when compared to that of the L aggregate (2.695 g/cm3). Therefore, certain amounts of coarse L aggregate, 20% of the whole mixture volume, were replaced with the SS.
The 20% SS aggregate content was chosen following ASI recommendations, which were made after investigating the properties of RAMS with SS substitutions ranging from 0% to 100% [19]. The study highlighted that a 25% substitution rate yielded the optimal performance for mixtures with SS as a coarse aggregate, so it was decided to proceed with a slightly lower SS content.

2.1.3. Reclaimed Asphalt Pavement

The RAP material was derived from a highway, with an estimated age of 20 years. Gradation of the extracted RAP aggregate, as depicted in Figure 1, conforms to the upper and lower boundaries defined by the Iran Highway Asphalt Paving Code, specifically for a nominal maximum aggregate size of 19 mm. Consistent with the restrictions set by this code, the gradation of RAP materials remained unaltered.
This study investigated three different proportions of RAP in RAM: 25% (in line with the Department of Transportation’s standard guidelines) [20], (an elevated percentage, which is common practice in countries such as the Netherlands and Japan) [21], and 75% (an extraordinarily high amount) [7].
The aged asphalt binder from the RAP materials was originally classified as PG64-22. The binder content of RAP was determined using two distinct methodologies: ASTM D2172 and ASTM D6307. These procedures resulted in values of 4.4% and 4.6%, respectively. Subsequently, the final binder content of RAP was taken as the average of these two values, equating to 4.5%.

2.1.4. Waste Engine Oil

The WEO was procured directly from an automobile garage and it was incorporated into the study without further treatment. It exhibited a flash point of 220 °C, a viscosity of 280 mPa.s at 135 °C, and a relative density of 0.915. Initial WEO percentages, which were calculated relative to the weight of the aged binder from the RAP, were selected within a range from 0% to 15%, progressing in 5% increments.
Recent studies have tried to determine the optimal content of WEO. However, it has mostly been tested at the binder level, where certain amounts of WEO were blended with the virgin and aged/extracted binder [9,22]. The optimal WEO content was thus generally determined considering the desired enhancement in the rheological, chemical or mechanical properties of the obtained binder blend [23,24].
This study was conducted under the guidance of the balanced mix design theory. This approach dictates that both the appropriate quantities and types of virgin binders and recycled components be determined considering the expected performance behavior of the mixtures. With this theoretical framework, suitable amounts of WEO for mixtures—containing various contents of RAP or blends of RAP and CR-modified binder—were established through performance tests.

2.1.5. Crumb Rubber

The present study incorporated CR obtained from passenger car tires. The CR was incorporated using the wet process, which is known to enhance the performance benefits associated with CR [25,26]. The mixing conditions employed in the study involved temperatures ranging from 170 °C to 190 °C for 30 min, along with a shear rate varying between 2000 and 3000 rpm [27]. The CR gradation was chosen based on a mesh size of 40, following the studies performed by Khalili et al. [28] and Shen et al. [29]. It is worth noting that approximately 80% of CR utilization in these applications consists of particles finer than 0.8 mm, while particles finer than 0.4 mm account for only 25% of the CR [26]. The specific CR gradation utilized in this study is presented in Table 3.
Following the principles of balanced mix design theory, the CR usage proportions varied between 0% and 15%, in 5% increments, relative to the virgin binder content.

2.1.6. Asphalt Binder

PG64-22 asphalt binder was utilized as the virgin binder in this study. The fundamental characteristics of the virgin binder are given in Table 4.

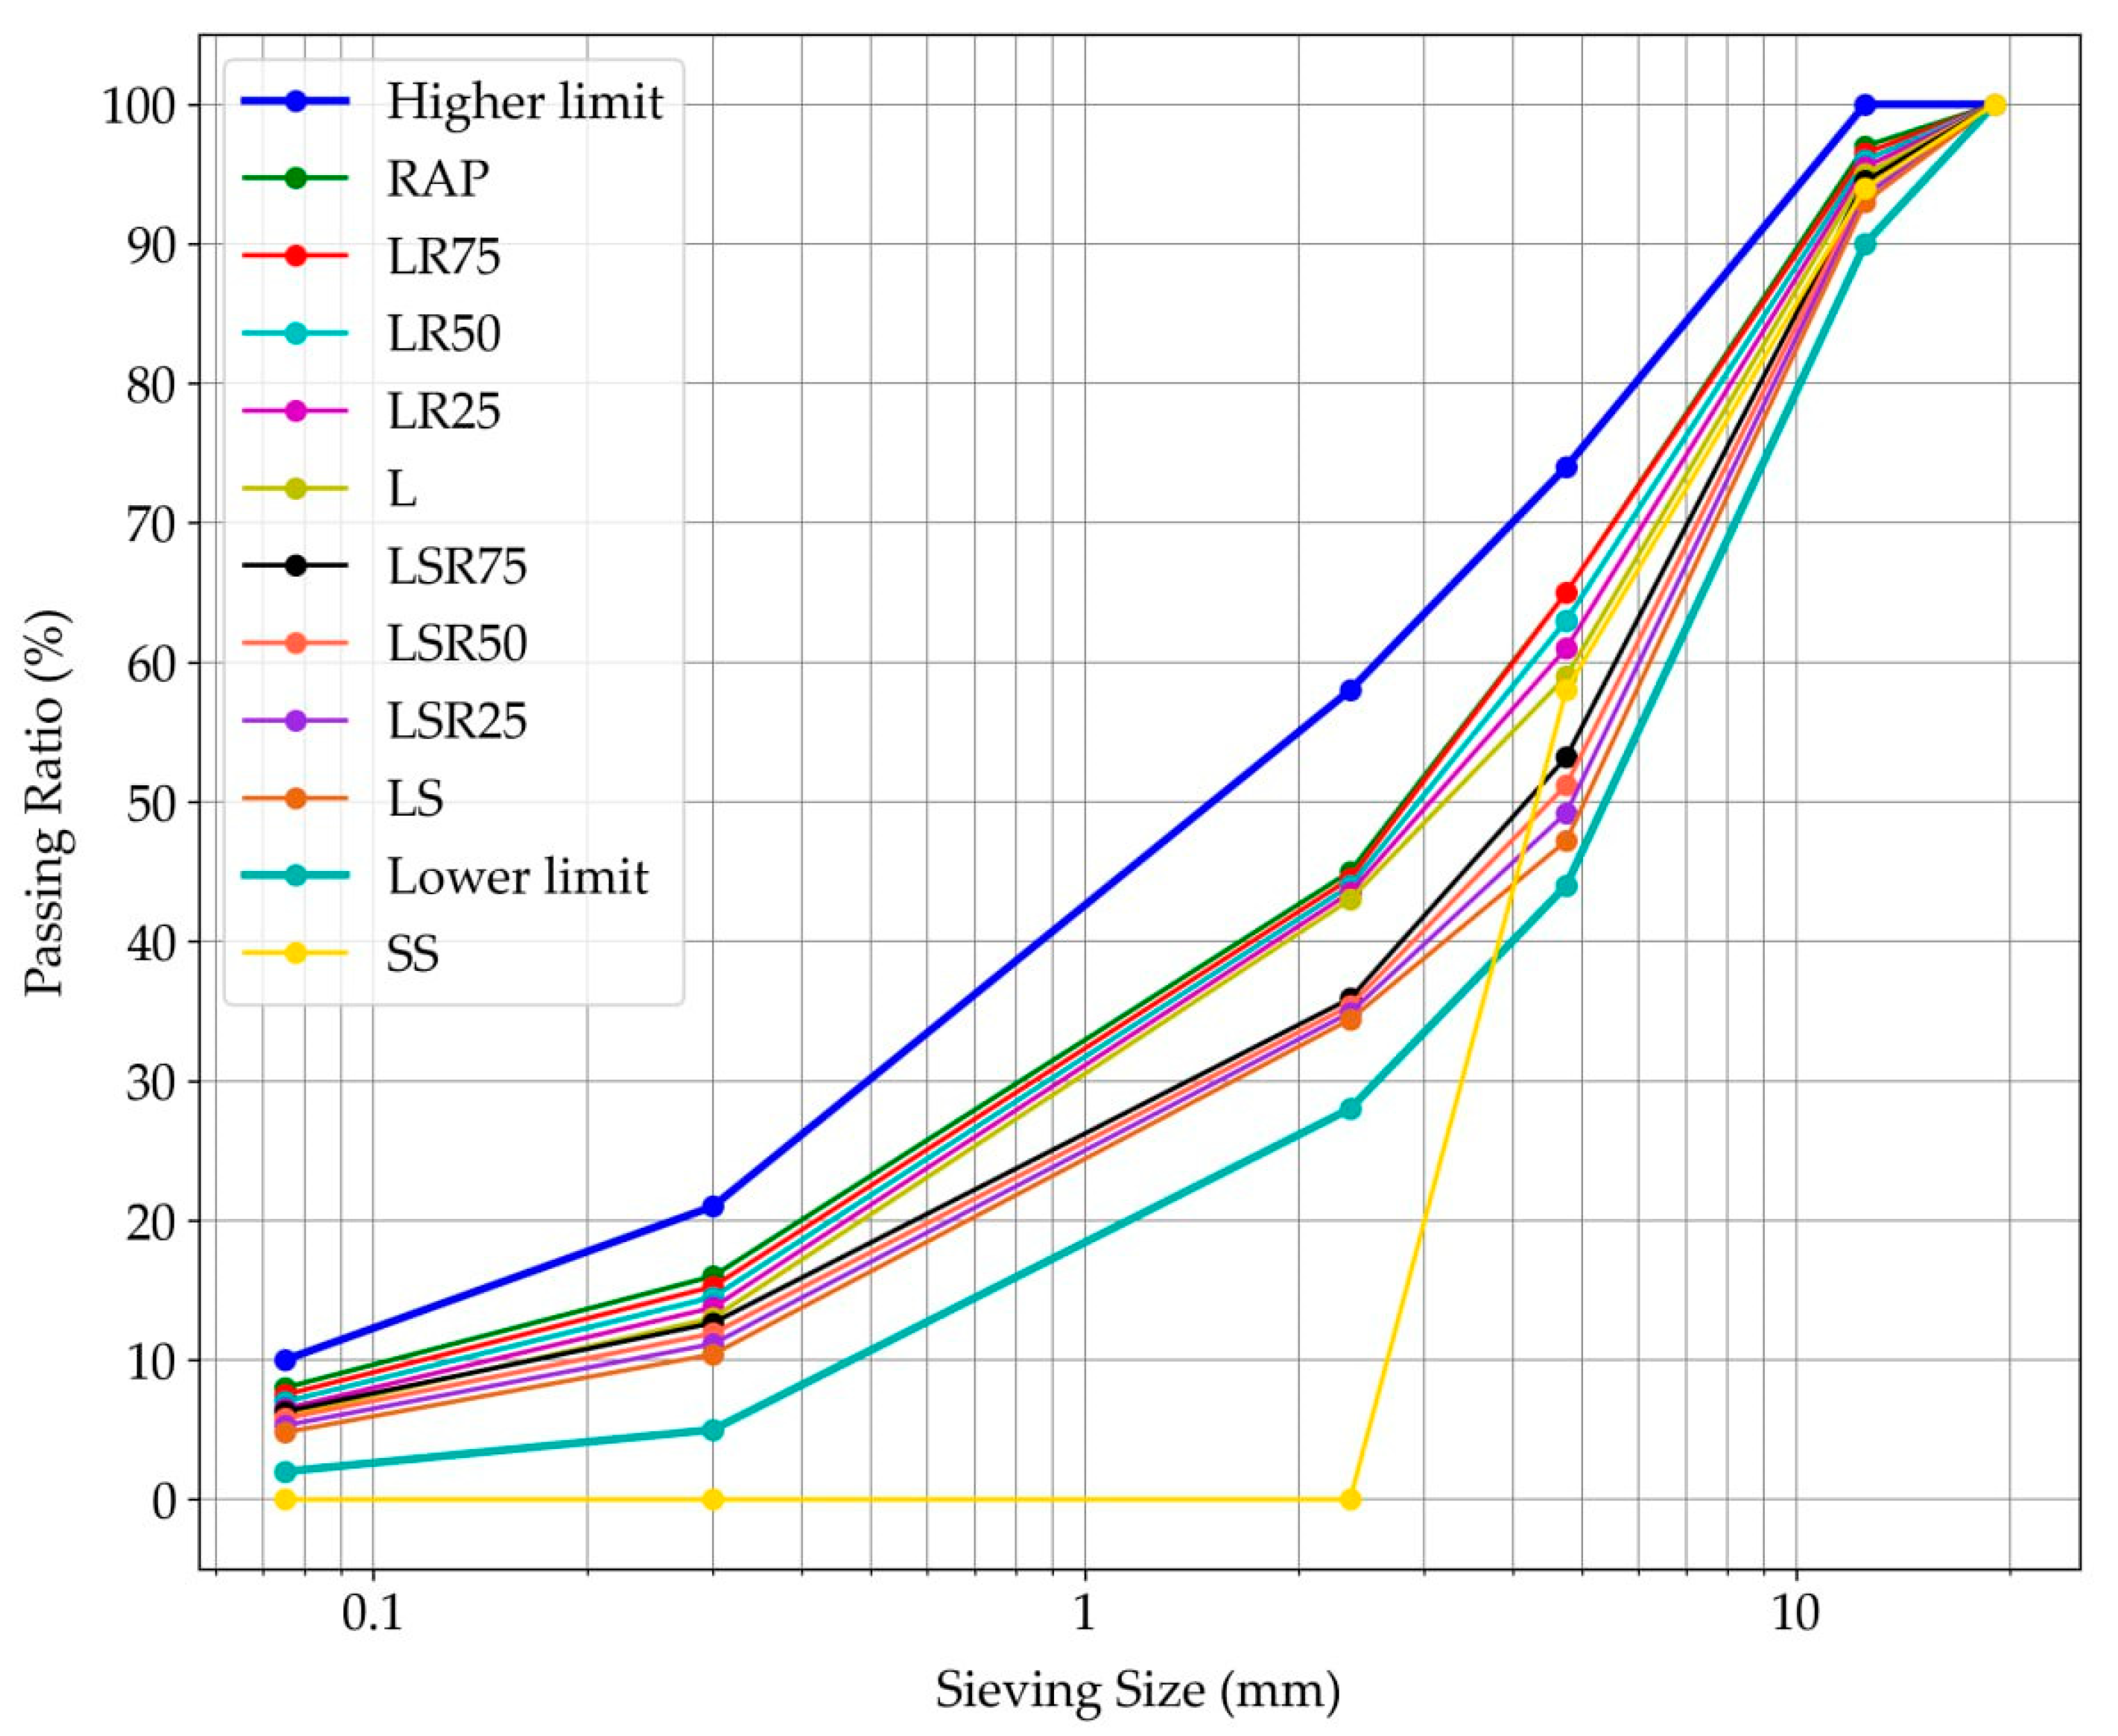
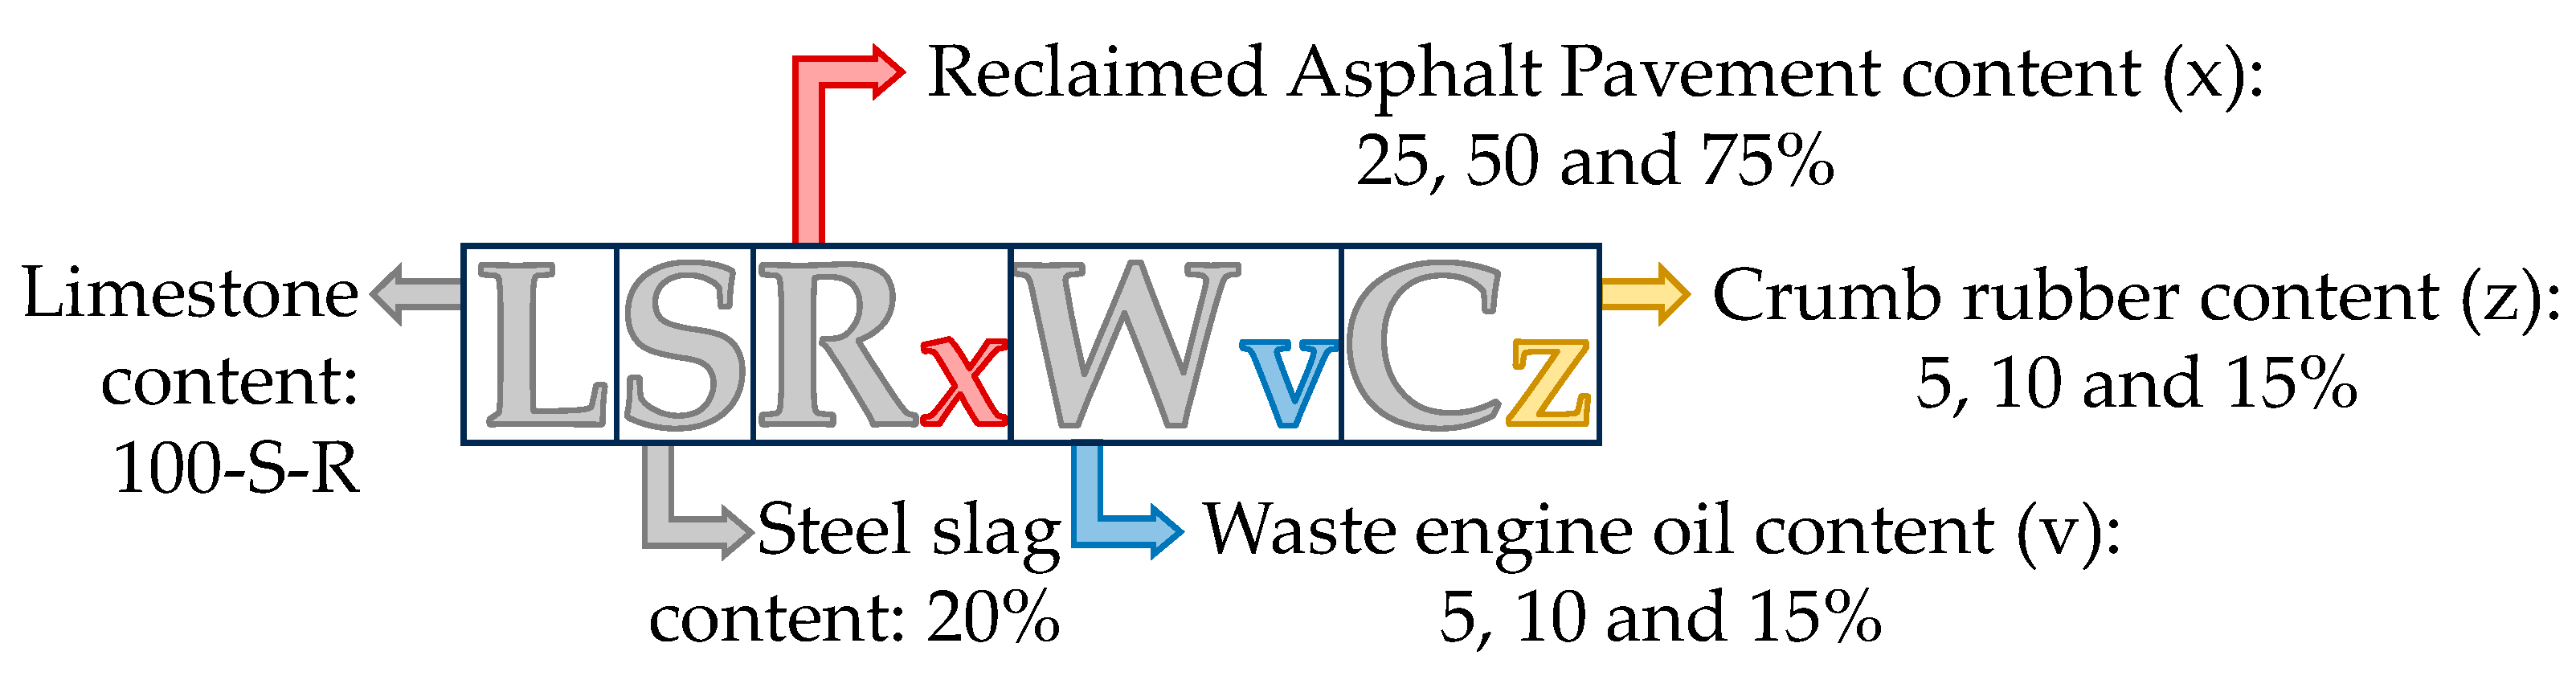
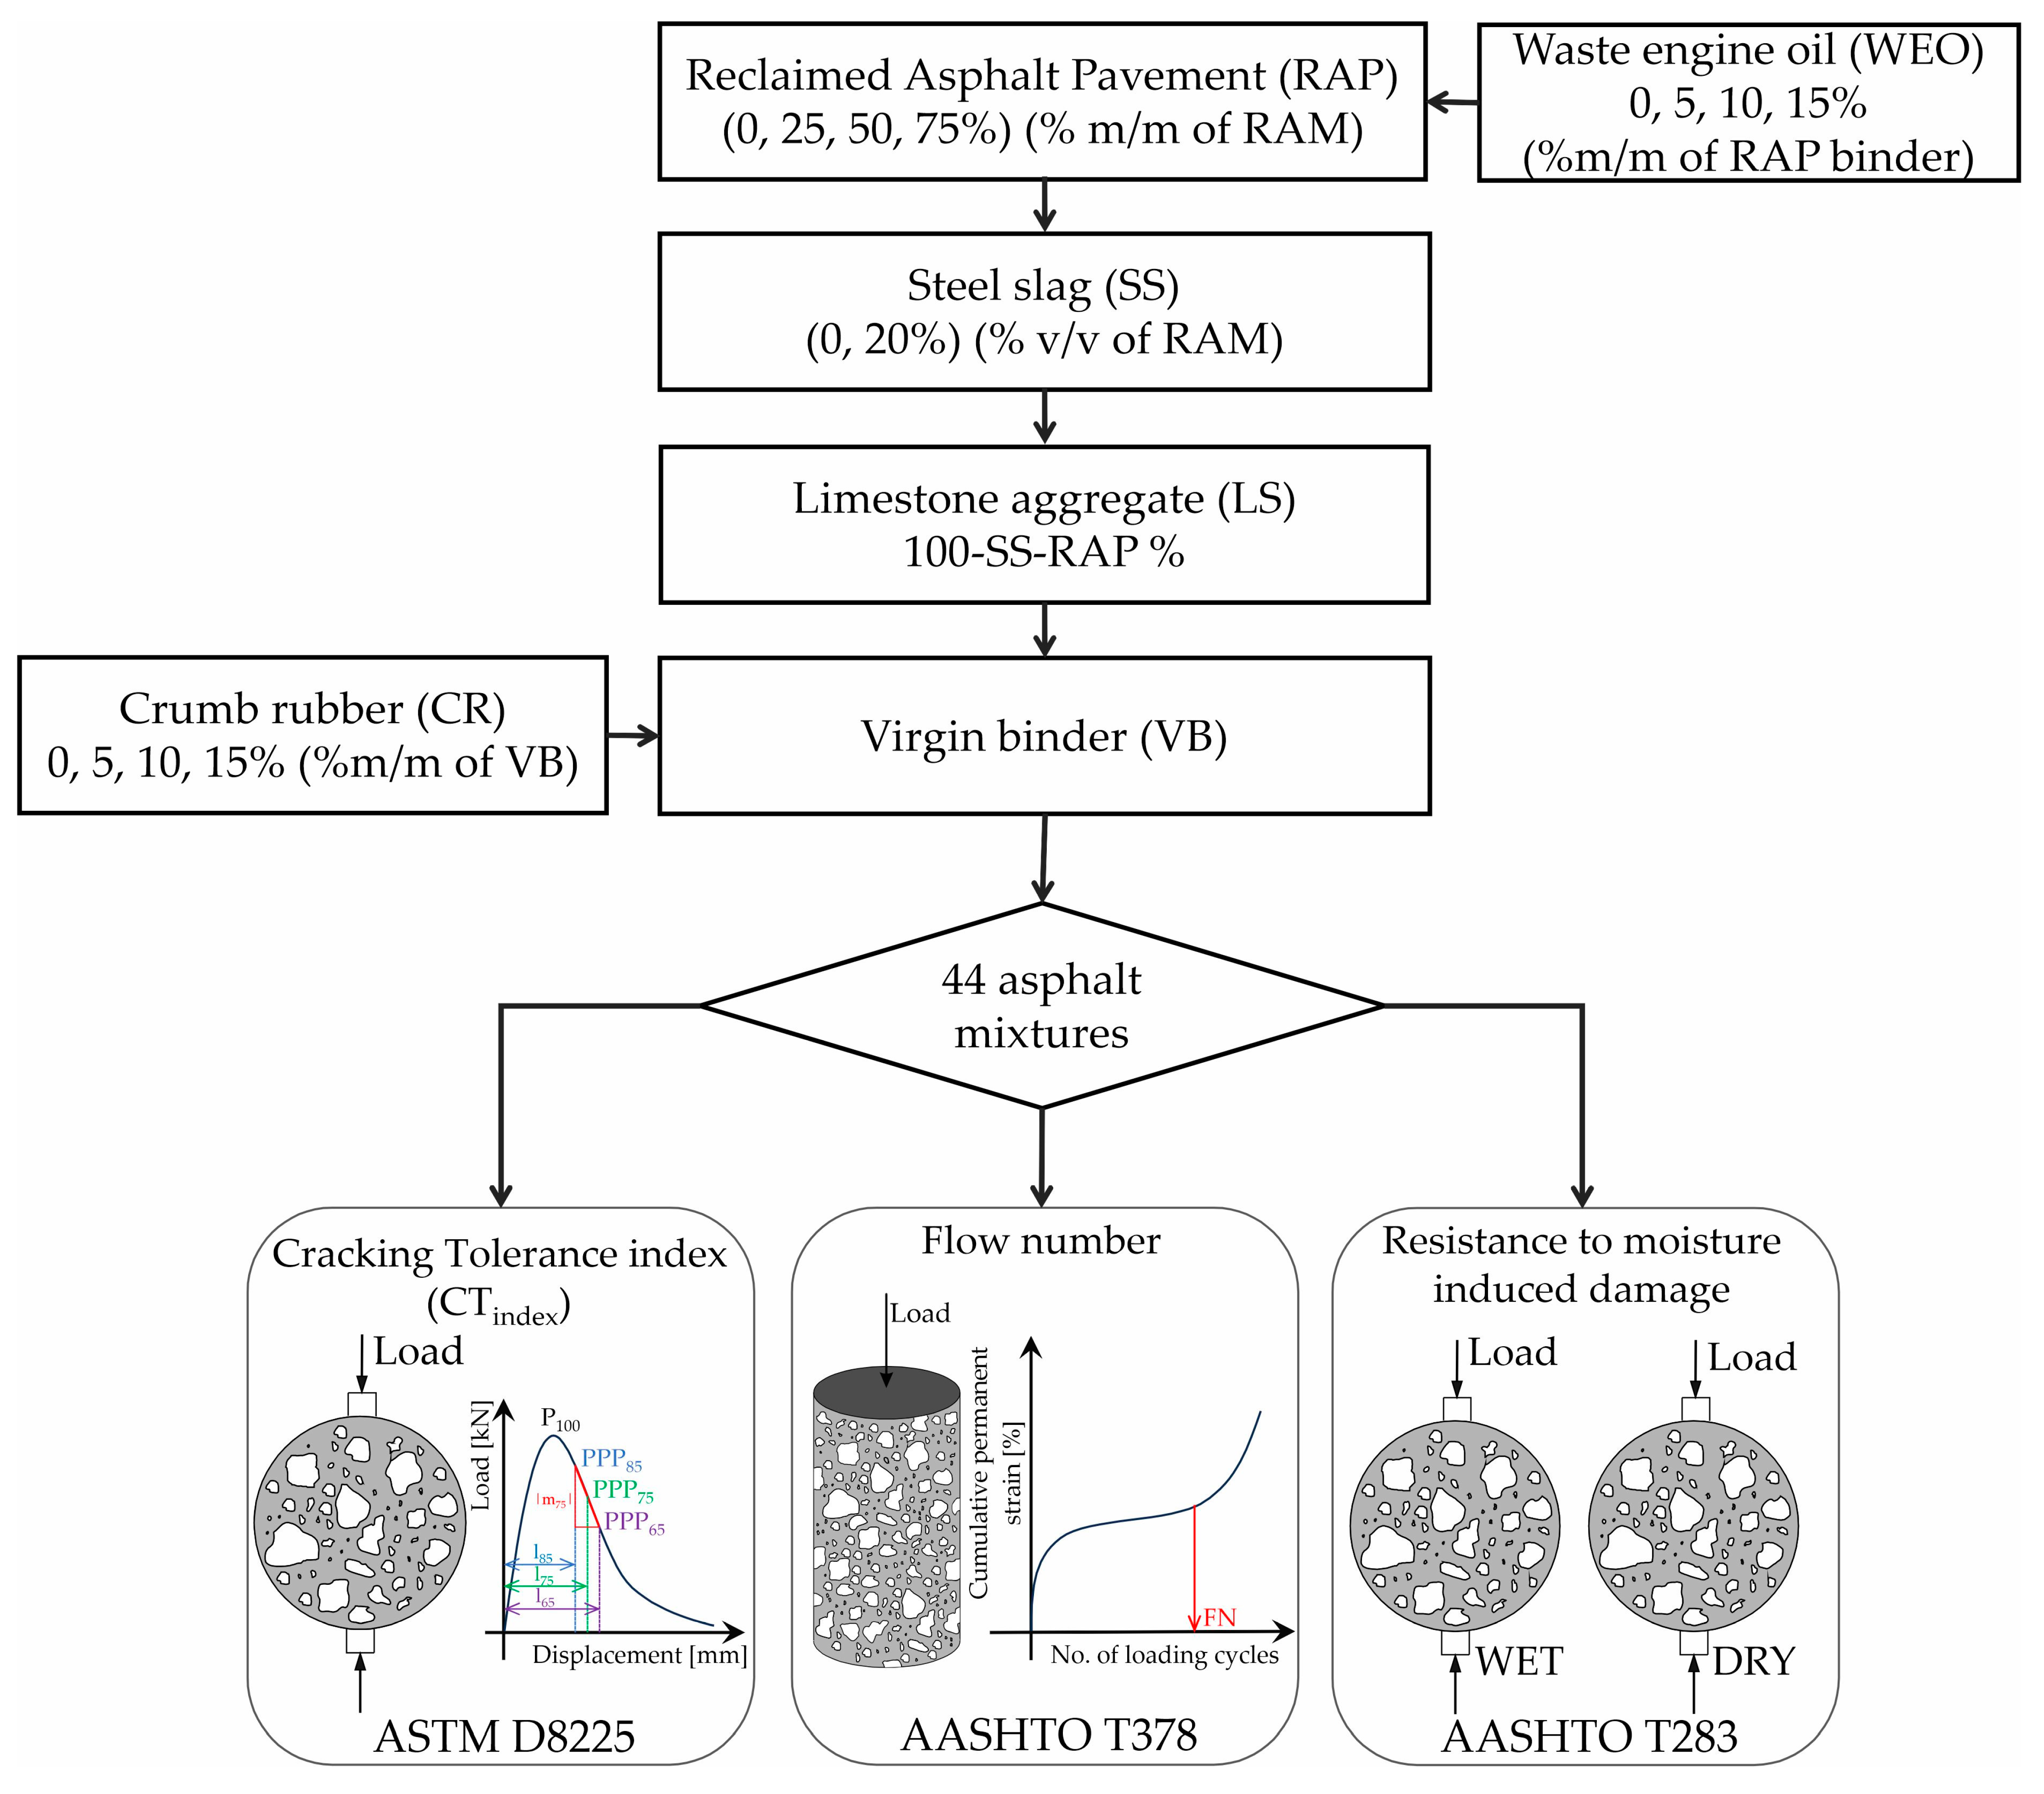
2.1.7. Asphalt Mixture

Asphalt mixture that is used for a surface layer, with a nominal aggregate size of 19 mm, was selected for investigation in this study. In addition to the mixture, which was made entirely of virgin materials (designated as “L”), 43 other mixtures were prepared by varying the proportions of the component materials. Figure 2 outlines the notations for the asphalt mixtures, and Table 5 offers a few examples of these mixtures’ notations. The optimal binder content (OBC) was determined in accordance with the guidelines provided by SHRP-A407. The same OBC of 4.3% was used in all asphalt mixtures to ensure equal comparisons of their properties.

2.2. Methods

After determining the basic properties of the component materials, the experimental plan of the study was carried out according to Figure 3.

2.2.1. Specimen Preparation

The L and SS aggregate fractions were preheated at the mixing temperature for 16 h before the mixing process. RAP was preheated at the mixing temperature for two hours, and the WEO was sprayed onto and mixed with the RAP a half hour prior to its mixing with other mixture components. Before compaction, loose mixtures underwent short-term aging as per the AASHTO R30 guidelines, being exposed to the compaction temperature for 4 h. It should be noted that the mixing and compaction temperatures were not determined for each mixture due to a comprehensive experimental plan. Instead, these temperatures were determined based on the virgin binder alone and the binder blends, which combined the virgin binder with varying amounts of the CR, given CR’s significant impact on binder viscosity [30]. This was performed by determining rotational viscosity according to ASTM D4402, and appropriate temperatures are reported in Table 6.

2.2.2. Cracking Resistance

Cracking resistance of asphalt mixtures was assessed at a testing temperature of 25°C using the indirect tensile cracking test (IDEAL-CT) according to ASTM D8225 [31], with a load rate of 50 ± 2 mm/min.
For this test, three cylindrical specimens of each asphalt mixture (132 specimens in total) were compacted using a gyratory compactor, targeting an air void content of 7 ± 0.5%. Specimens had a diameter of 150 ± 2 mm and a height of 62 ± 1 mm.
Data collected from the IDEAL-CT were used to assess cracking resistance using a fracture-mechanics-based parameter, the cracking tolerance index (CTindex), as outlined in Equation (1):
C T i n d e x = t 62 × l 75 D × G f | m 75 | × 10 6
where Gf is the failure energy (J/m2), a measure of the energy absorbed by the asphalt before failure; |m75| is the absolute value of the post-peak slope (N/m); l75 is the displacement at 75% of the peak load following the peak (mm), a parameter tied to the mixture’s deformation under load; and D and t are the specimen’s diameter and thickness (mm), respectively.
The CTindex is commonly used to assess the cracking resistance of asphalt mixtures, considering the variations in virgin binder and aggregates, binder additives, and RAP content [32], where a higher CTindex value means a greater cracking resistance. Given this study’s emphasis on evaluating the cracking resistance of asphalt mixtures appropriate for high-traffic conditions, a CTindex threshold value of 110, recommended for traffic conditions exceeding 10 million equivalent single axle loads (ESALs), was adopted [33]. Mixtures that exceed this value are considered adequate for this traffic condition.

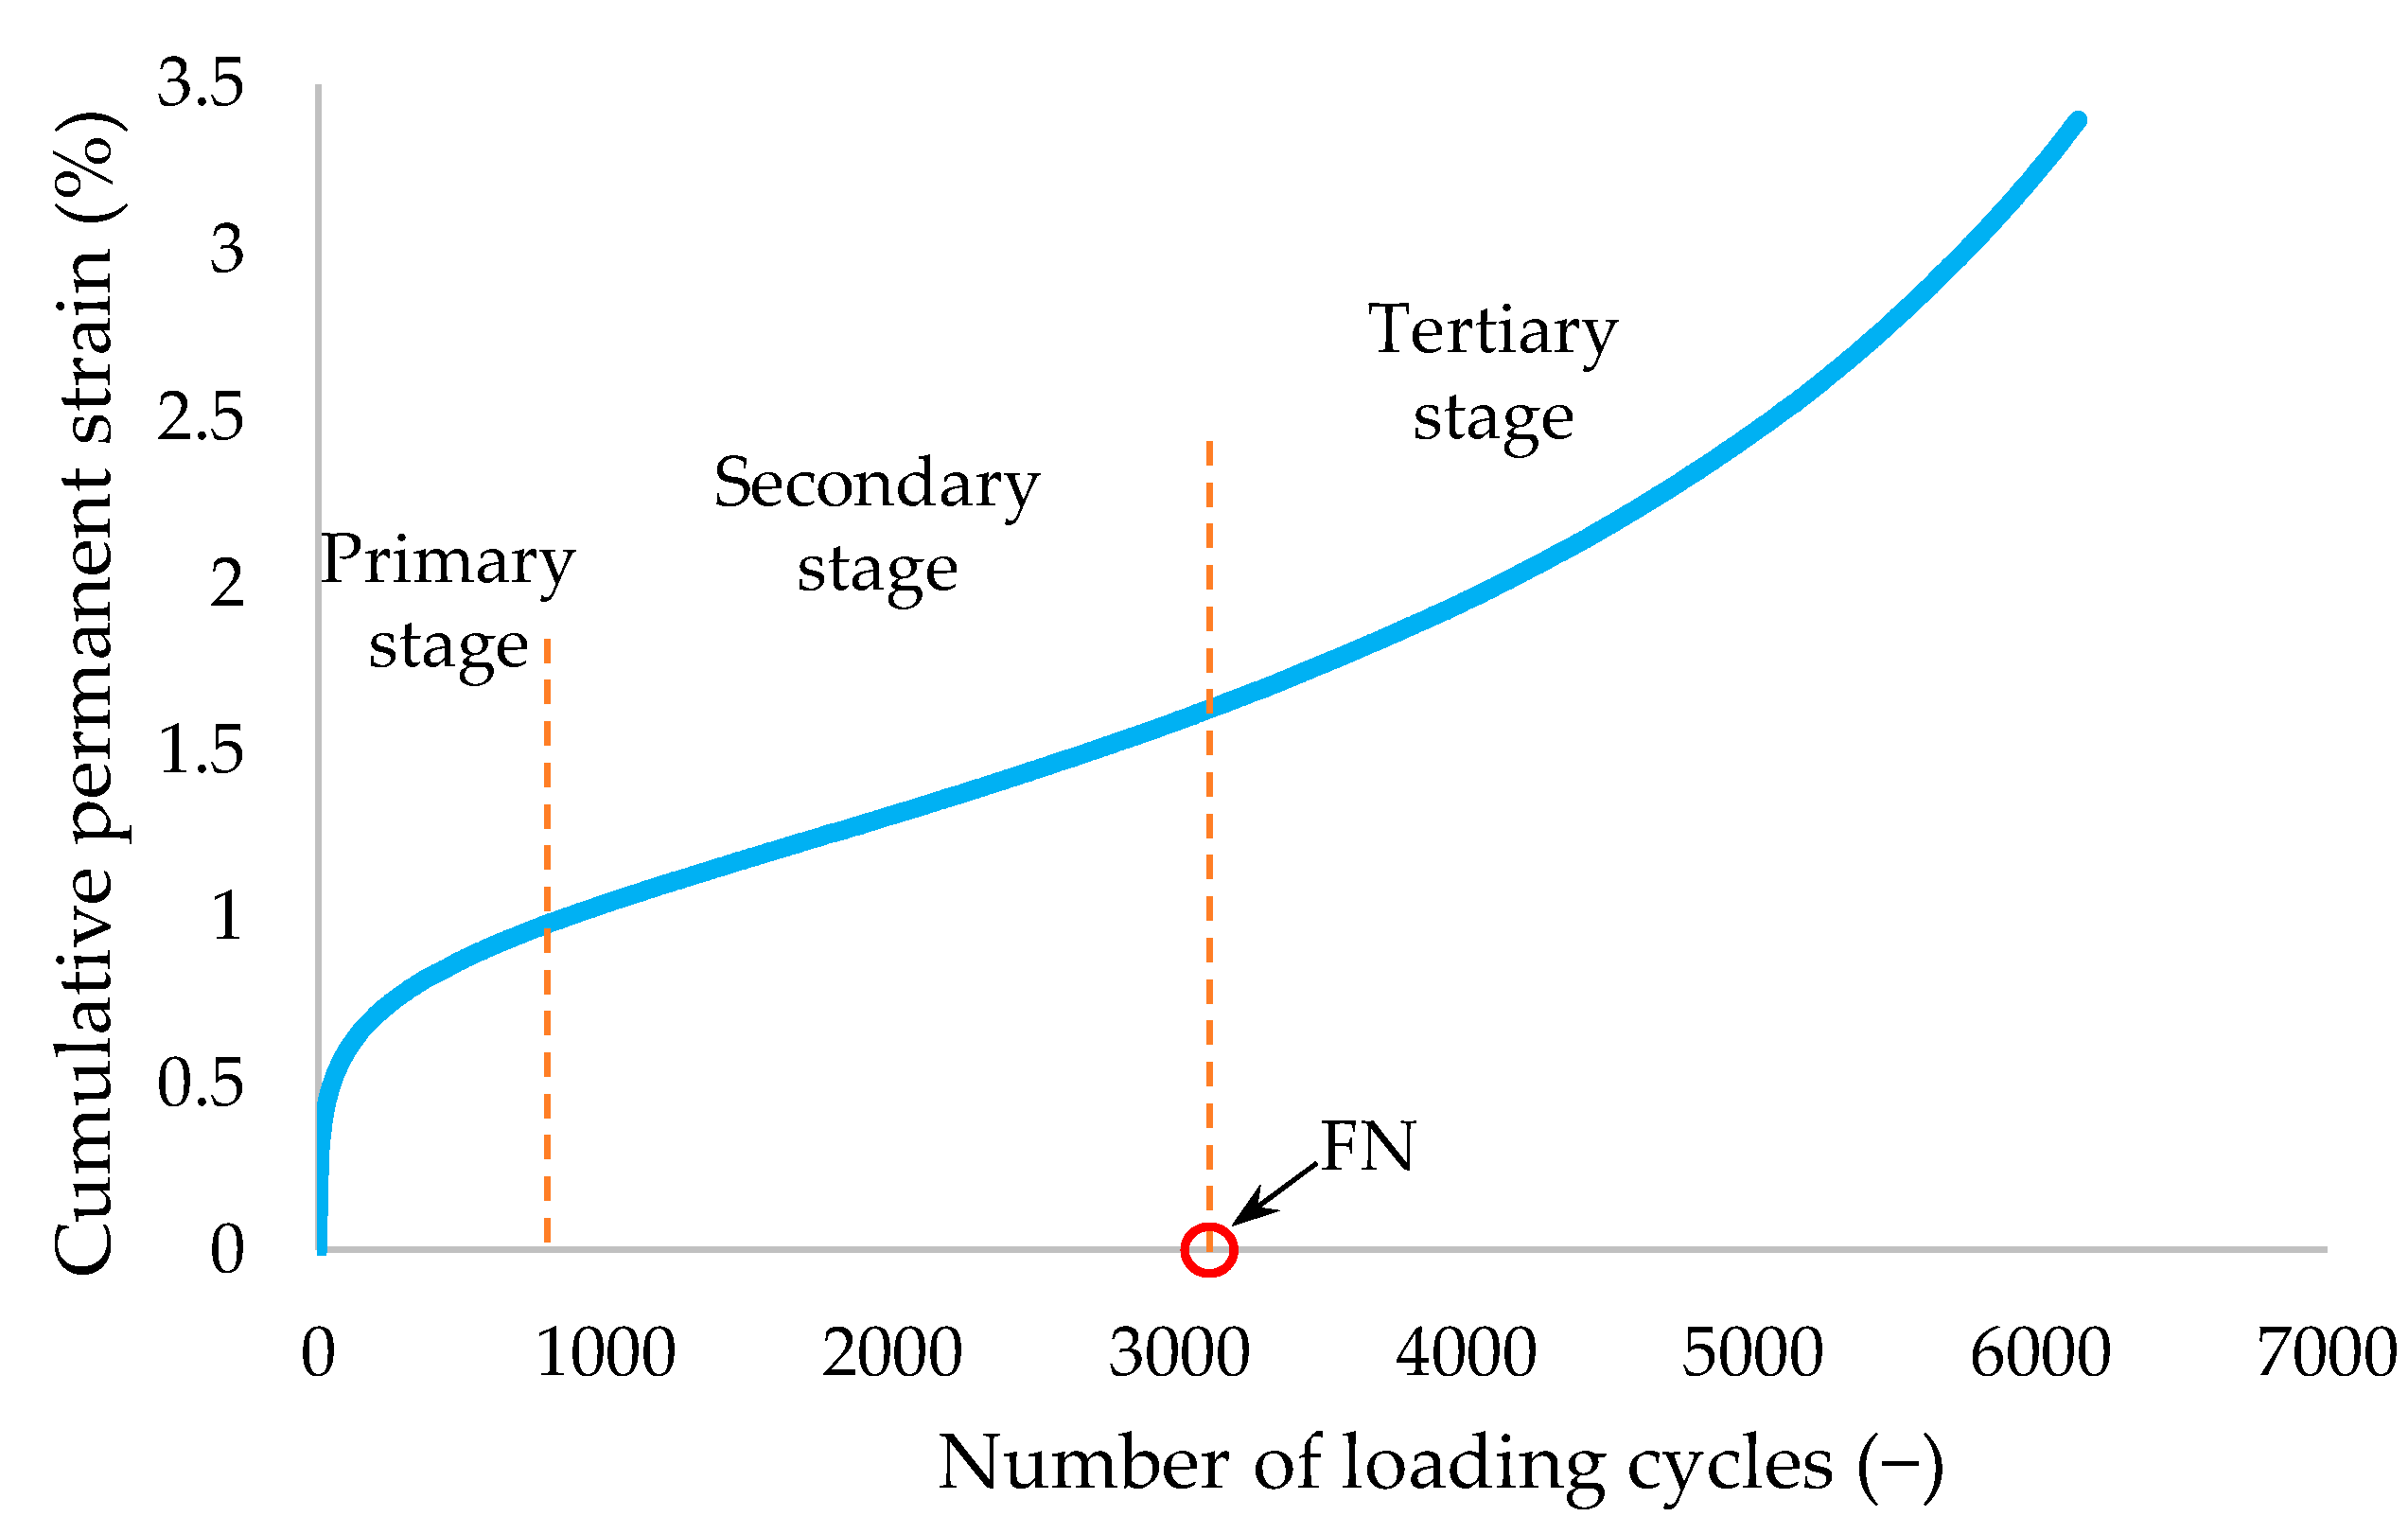
2.2.3. Rutting Resistance

The evaluation of rutting resistance was an integral part of asphalt mixture design in this study, providing insight into the mixture’s performance under high-temperature conditions [3,34]. Due to its importance and simplicity, the dynamic creep test, a highly regarded method for assessing permanent deformation potential, was employed. Based on previous research [35,36], this test was chosen to examine the impacts of various ARAs on the rutting resistance and to ascertain the impact of alternative materials on the RAM performance.
The ‘Flow Number’, a key metric from the dynamic creep test, quantified the asphalt mixtures’ resistance to permanent deformation. This value aided in ranking RAMs and informed the selection of a suitable mixture composition for certain traffic levels. Similar to the CTindex, the FN has established thresholds that are instrumental in determining the rutting resistance of asphalt mixtures suitable for high-traffic conditions.
The literature suggests two specific threshold values for FN, depending on the expected ESALs [37]. For traffic conditions with ESALs ranging between 10 and 30 million, the recommended FN threshold value is 190. For even higher traffic levels, with ESALs exceeding 30 million, the suggested FN threshold value increases to 740. Asphalt mixtures that meet or exceed these values are generally considered to possess adequate rutting resistance for these traffic scenarios.
The outcome of the test is presented as a plot of accumulated permanent strain versus the number of loading cycles. A typical plot, as shown in Figure 4, could be segmented into three distinct stages: the primary, secondary, and tertiary. Each of them represents a different stage in the strain development of the asphalt mixture under the applied load. The onset of the tertiary zone, characterized by a rapid increase in strain, is marked by a specific number of cycles, known as the ‘Flow Number—FN’ [38]. This number represents the mixture’s transition from a state of stable deformation (secondary zone) to a state of accelerated deformation (tertiary zone), and it serves as a key indicator of the mixture’s resistance to rutting.
Before testing, the specimens were subjected to a 5 h conditioning period at a temperature of 50 °C. After the conditioning phase, a preload of 10 kPa was applied for a duration of 5 min. This preloading step prepared the specimen for the subsequent stress application and reduced the risk of premature failure due to sudden load application. Following the preloading phase, a haversine load of 400 kPa, characterized by its ‘sine wave’ shape, was applied. Each loading cycle comprised a loading time of 0.5 s, followed by a rest period of 1.5 s. This process was conducted for three replicates of each type of mixture.

2.2.4. Moisture Damage Resistance

In this investigation, the indirect tensile strength (ITS) test was employed to assess the strength and moisture damage resistance of asphalt mixtures. According to the AASHTO T283 guidelines, 6 replicates of each asphalt mixture were prepared to determine their moisture damage resistance (AASHTO, 2014), resulting in a total of 264 specimens. The specimens were prepared according to the specifications, with a diameter of 100 mm, a height of 63.5 ± 2.5 mm and an air void content of 7 ± 0.5%. Specimens were divided into two subgroups, conditioned and unconditioned, both with comparable air void contents. The unconditioned specimens were kept at a temperature of 25 °C for 120 min before the ITS test. The conditioned specimens were initially saturated with water between 55 and 80%, after which they were placed in a freezer at −18 °C for 16 h. Finally, specimens were immersed in a 60 °C water bath for 24 h and then kept in a water bath at a testing temperature of 25 °C for at least two hours. After conditioning, both subgroups were subjected to a constant strain loading rate of 50 mm/min, and individual ITS values were calculated using the following Equation (2):
I T S = 2000 × P π × t × D
where P is the maximum load applied to the specimens (N), t is the thickness of the specimen, and D is the diameter of the specimen (mm).
Finally, the tensile strength ratio (TSR) was calculated by dividing the average ITS value of the conditioned group (ITSC) by that of the unconditioned group (ITSU) for each mixture type, following Equation (3):
T S R = I T S C I T S U
The TSR values obtained offered a benchmark for evaluating the moisture damage resistance of the different asphalt mixtures utilized in this study. Similar to the CTindex and FN, the TSR has an established threshold that is instrumental in determining the moisture damage resistance of asphalt mixtures. The recommended threshold value for TSR is 0.8 for all traffic conditions [39]. Asphalt mixtures that meet or exceed this threshold are generally considered to possess adequate resistance to moisture damage.

2.2.5. Prediction Model’s Development

Building on the growing emphasis in civil engineering literature on the effectiveness of prediction models for the performance behavior of various materials and systems [40,41], this research seeks to advance these methodologies, focusing specifically on alternative materials in RAMs. After performing laboratory tests, the experimental data were further used to develop prediction models of each property investigated with the aim of determining allowable contents of alternative materials in RAM that would satisfy required threshold values for two traffic levels: between 10 and 30 million ESALs and above 30 million ESALs. These contents and combinations of the materials were determined utilizing various regression techniques, such as FNN [42], GLM [43], SVM [44] and GPR [45]. Leveraging test data from 44 different mixture types, these models were extensively trained and evaluated with the aim of identifying which technique provides the most accurate predictions, factoring in the inherent uncertainty, thus allowing better capture of performance variability and reliability.
The FNN model underwent tuning across several parameters, including the number of layers, hidden units, epochs, regularization coefficient, and batch size. Similarly, for the GLM, the regularization strength was adjusted. For the support vector regression (SVR), different kernels, penalty parameters, and tube widths were tested. Instead of using existing optimizers for hyperparameter tuning, which might lead to overfitting due to the training set’s limited size, a different approach was adopted for the GPR. Different kernels were investigated, settling on the linear and radial basis function kernel, followed by a grid search for the optimal model variance and length scale values. The chosen metric for these hyperparameter selections was the mean relative error (MRE) of the predictions on the test set, which helped in selecting the most appropriate prediction model.
Subsequently, after developing and tuning various prediction models, the focus shifted to identifying the regions indicating satisfactory performance. To do this, a grid search was performed on the feasible input space for RAP, CR, and WEO. This process allowed the computation of predicted performance for each point using the developed models. They were then categorized as either satisfactory or unsatisfactory based on the performance test results and threshold values established. Utilizing this categorization, the boundary points were in the 3D space delineating satisfactory from unsatisfactory results. Using these points, 3D planes were fitted using polynomial regression (with a maximum order of 2) to act as the performance border surfaces. Essentially, these surfaces define the lower and/or upper boundaries in the material utilization ratio space that would produce satisfactory performance. This methodology provides quick control to determine if a mixture, with different percentages of the three alternative materials, falls within the defined boundaries for satisfactory performance based on its corresponding position in the space.
In addition to the predictive modeling, a statistical methodology was adopted to evaluate the impact of each alternative material on the predicted performance outcomes. A paired t-test was utilized to contrast the influence of the input variables (RAP, CR, and WEO) on the discrepancies between model predictions and actual performance tests for FN, CT, and TSR. The results from the t-test offered insights into the most influential material for each performance test, thereby enhancing the comprehension of material effects.

3. Results and Discussion

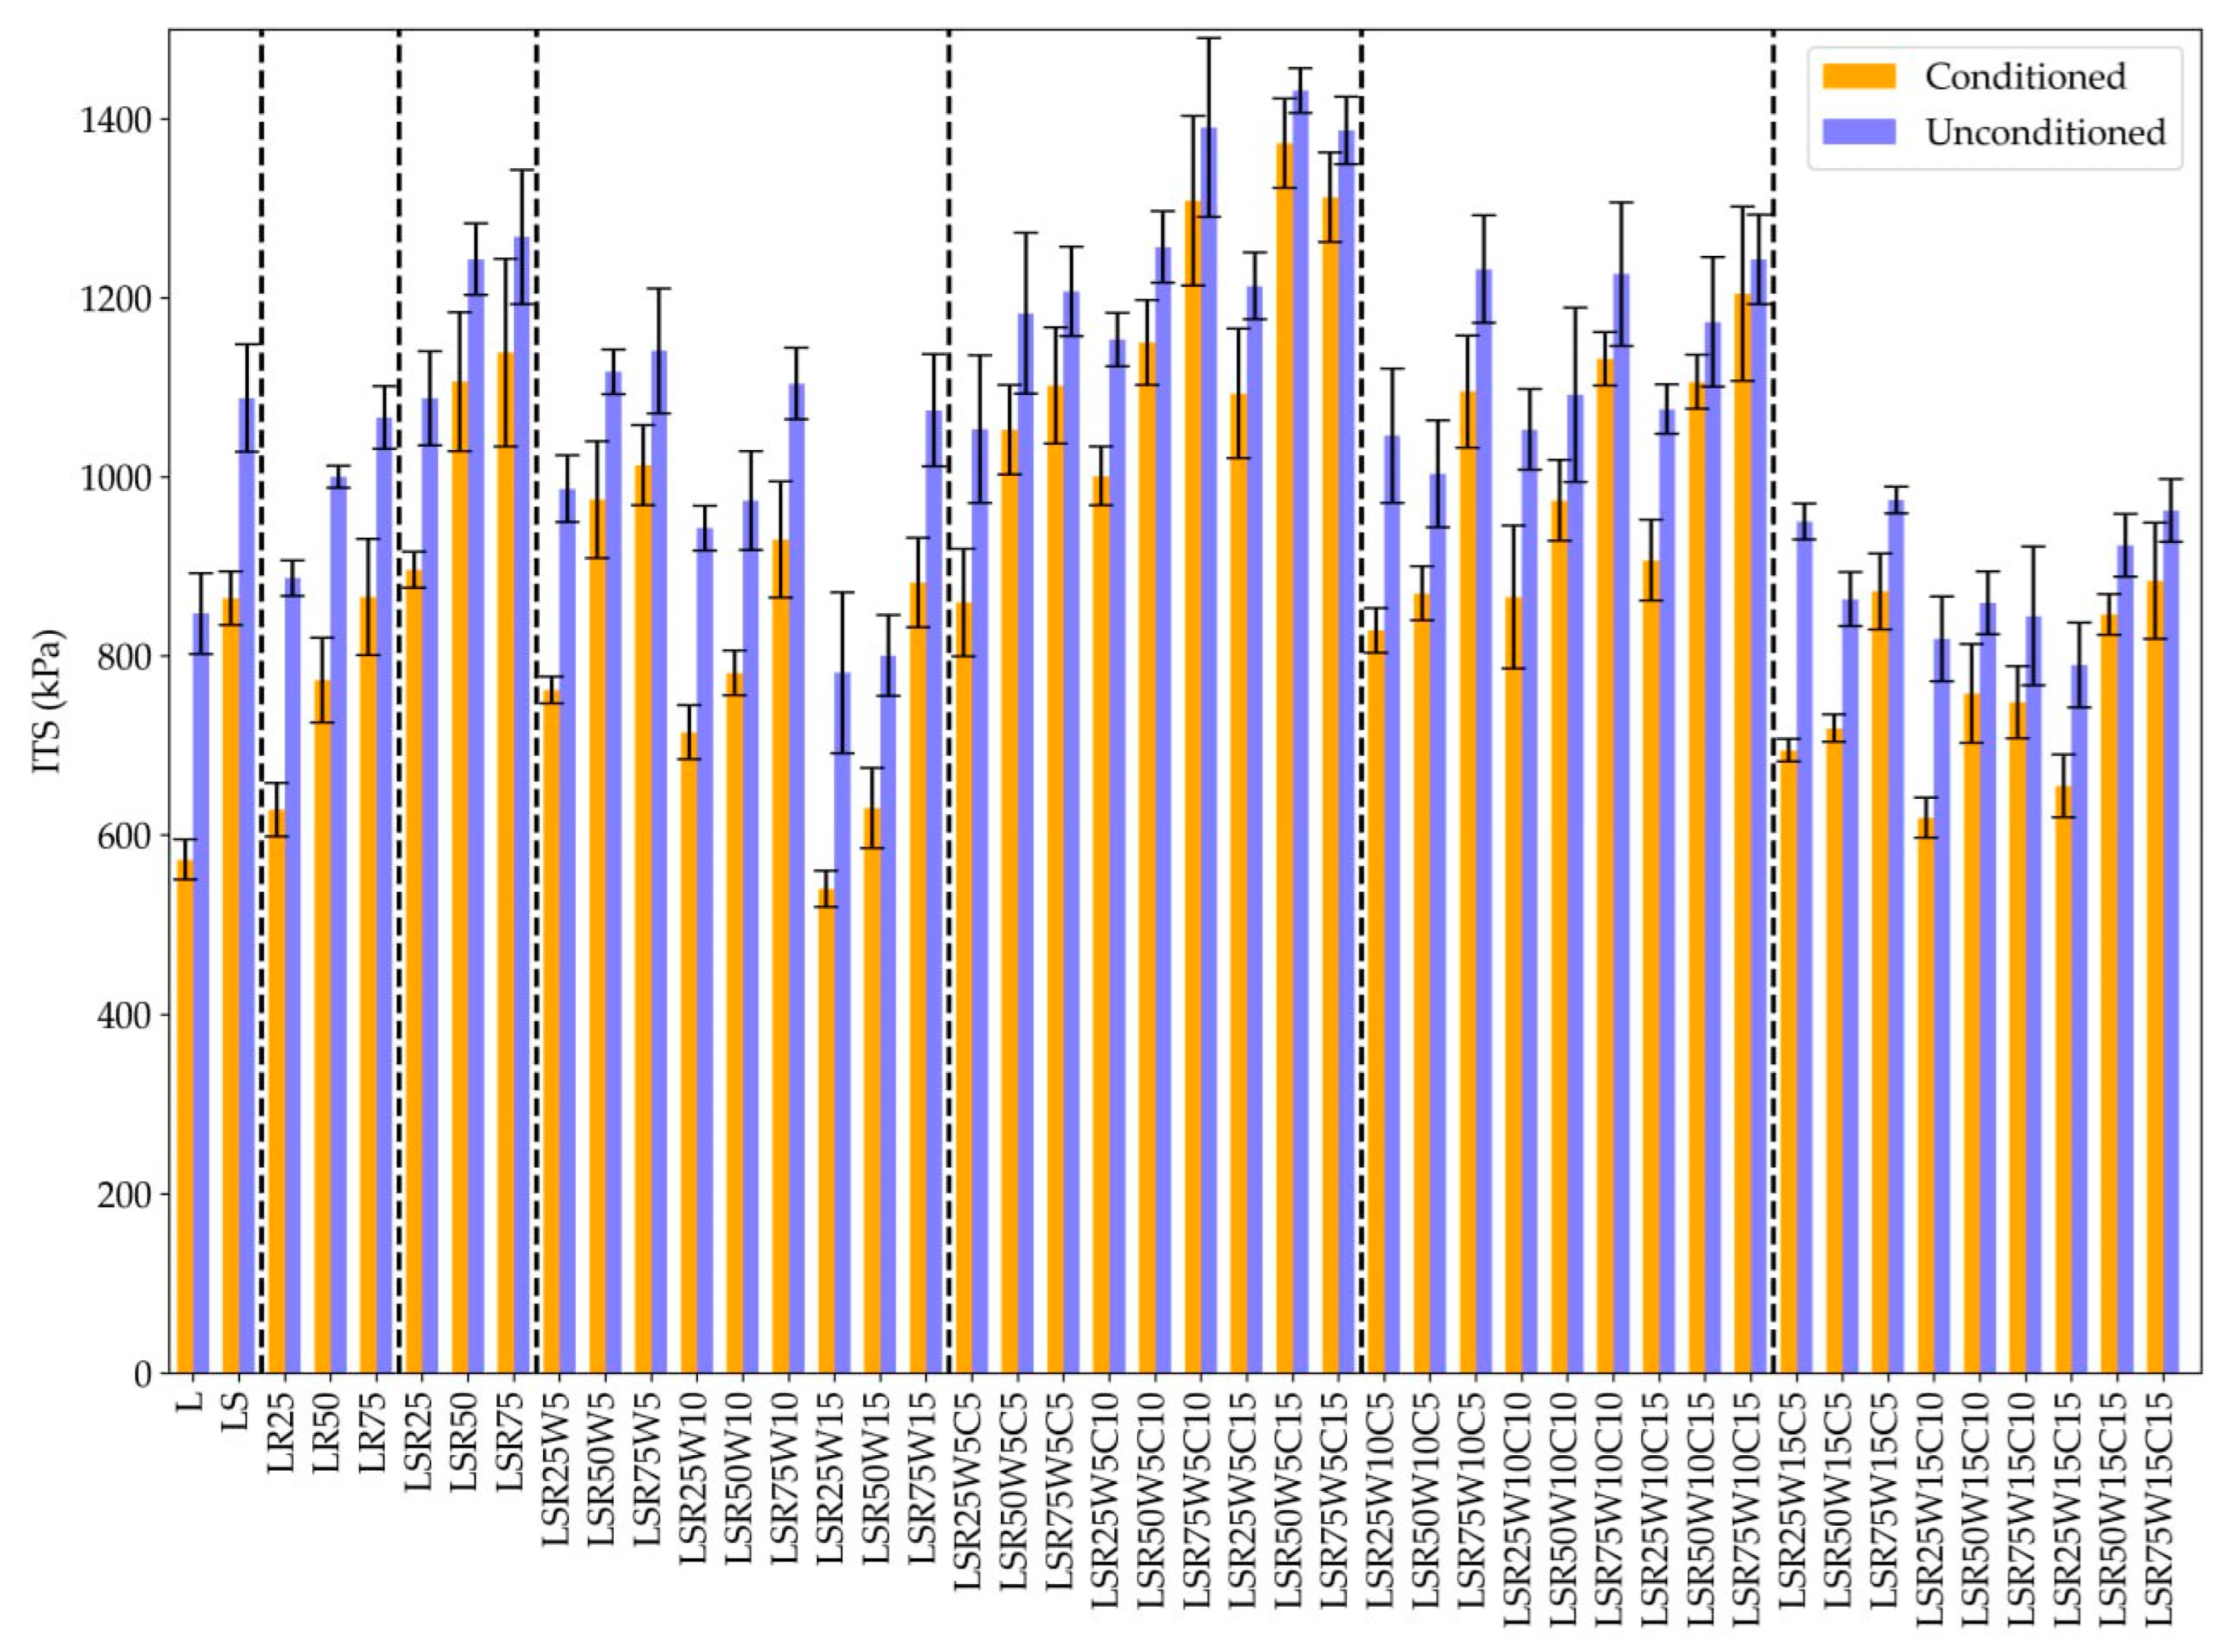
3.1. Moisture Damage Resistance and ITS Test

Figure 5 illustrates the ITS test results for both unconditioned and conditioned subgroups of various asphalt mixtures, whereas Figure 6 illustrates the resulting TSR values for various asphalt mixtures. The blue horizontal line in the figure represents the threshold value of TSR for all traffic levels, set at 0.8. This figure has been delineated with distinct boundaries, categorizing the results according to the WEO contents. Within these delineations, a range of colors signifies the varied CR dosages, and distinctive hatching patterns differentiate the mixtures based on RAP content.
In this study, only the role of the SS aggregate was evaluated in the asphalt mixtures without other materials (LS) and in three distinct RAP proportions: LSR25, LSR50, and LSR75. The results showed that addition of SS increased the toughness and moisture resistance. For the mixtures with SS, an increase in moisture resistance of 18%, 16%, 15%, and 11% was observed when compared to the L, LR25, LR50, and LR75 mixtures, respectively. This can be attributed to the alkaline environment of SS aggregates due to the presence of calcium and magnesium oxides, materials that may bind the asphalt binder stronger than L aggregate, thus improving the moisture damage resistance [16]. Previous studies have reported similar results [46,47], although some have indicated that these types of recycled aggregates might reduce resistance to moisture damage [48,49]. This discrepancy might arise from the formation of a silica gel around the aggregates’ surface, weakening the adhesion between the binder and slag aggregates [49].
The RAP introduction generally improves their ITS and moisture damage resistance. An enhancement in moisture damage resistance was observed when 25%, 50%, and 75% of RAP was used, showing increases in TSR values of 4%, 14%, and 20%, respectively, compared to the L mixture. Furthermore, the addition of RAP mitigated the moisture damage associated with different WEO contents. Apart from LSR75W5C15, RAP positively influenced moisture damage resistance for both WEO and CR at various consistent percentages. This improvement arose due to the increased viscosity of the aged binder in RAP mixtures, resulting from the loss of volatile and oxidative compounds, which improved the strength of the mixtures. Also, the virgin binder in RAMs probably failed to mix thoroughly with the aged binder from RAP, thereby creating an additional layer over the RAP particles. These two layers minimize the susceptibility of asphalt mixes to moisture, inhibiting water penetration at the boundary between the binder and particles. This research found that RAP positively contributed to resistance against moisture damage, aligning with conclusions from previous studies [50,51].
As the WEO content in asphalt mixes containing RAP and SS increased, the ITS and TSR values decreased. For example, in 50% RAP mixtures, the TSR values decreased by 2%, 10%, and 12% with WEO usage levels of 5%, 10%, and 15%, respectively. However, in mixtures with 25%, moisture resistance was observed to diminish when the WEO content increased above 5%. For mixtures LSR75W10C15 and LSR75W15C5, introducing WEO had the exception of reducing moisture damage resistance. Similar findings of reduced moisture damage resistance and ITS values have already been reported in previous research [3,24]. This may be due to the increased viscosity of the asphalt binder, making it more susceptible to moisture [3], along with an improved degree of blending.
When CR was used in combination with SS, RAP and WEO, it played an important role in enhancing the rheological characteristics of the binder and offsetting the negative impact of the WEO. Based on the ITS and TSR results, except for LSR75W15C10, the addition of CR showed a positive effect on the moisture damage resistance. Previous studies have reported findings consistent with these effects of CR usage [6,52].
In asphalt mixtures comprising 75% RAP and 15% WEO, the distinction in moisture damage resistance between 10% and 5% CR was negligible, with a difference of less than 2%. This limited disparity implies that within these particular RAP and WEO compositions, the effectiveness of CR for moisture resistance may become more intricate at higher percentages.
The enhanced TSR values in mixtures containing CR can be attributed to the improved adhesion between the binder and aggregates when this material is applied, particularly in the wet process [26].

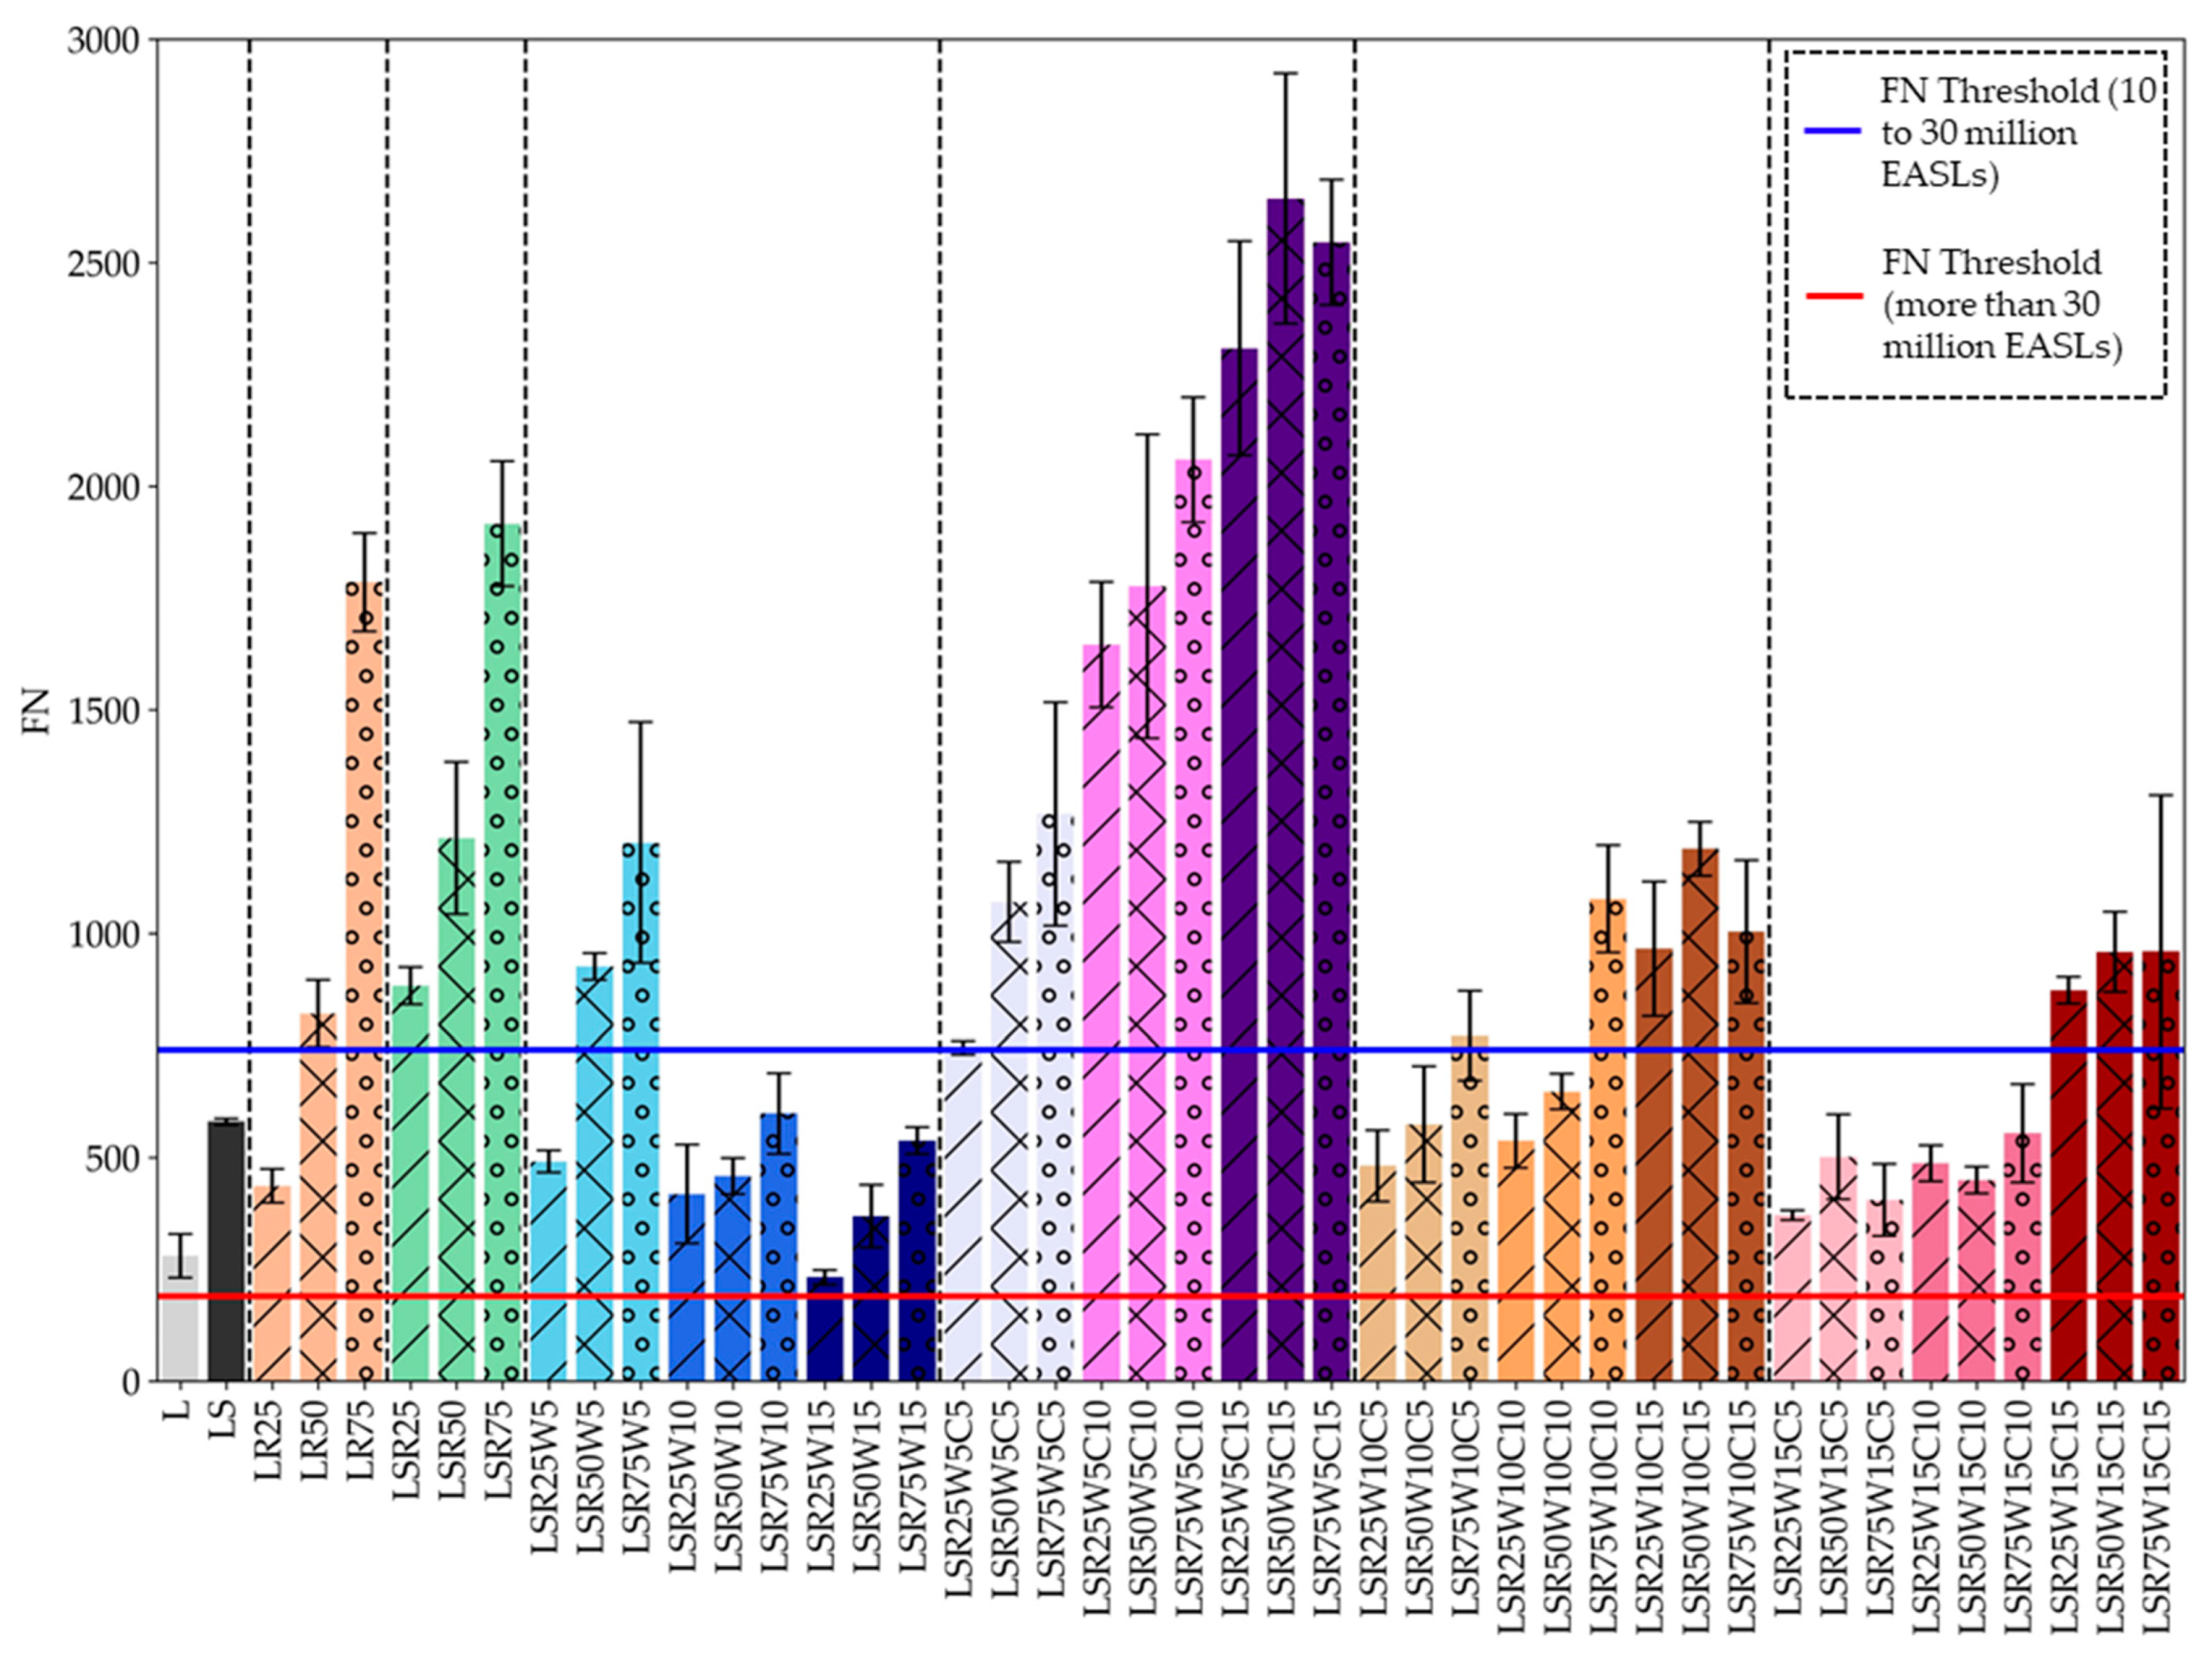
3.2. Dynamic Creep Test

Figure 7 presents the FN results from this study, with two horizontal lines offering reference points: the blue line indicating the FN threshold for traffic levels exceeding 30 million EASLs, set at 740, and the red line representing the FN threshold for traffic levels ranging from 10 to 30 million EASLs (set at 190).
Replacing limestone with either the SS or RAP significantly improves rutting resistance. Compared to the L mixture, the LS mixture exhibited an increase in FN value by 107%. Moreover, the addition of SS in the mixtures containing 25%, 50%, and 75% RAP improved the FN by 102%, 47%, and 7%, respectively. The enhanced performance is attributed to the aggregate’s angularity, stiffness and shear strength, which make RAMs resistant to permanent deformation [14]. These findings align with previous studies, reinforcing the positive impact of the SS on the rutting resistance of asphalt mixtures [14,53].
Consistent findings in the existing literature indicate that the RAP content in asphalt mixtures improves rutting resistance [3,51]. This study affirms these findings, demonstrating an increase in FN values upon RAP addition to the L aggregates or the combination of L and SS aggregates. The enhanced performance is attributed to the higher aged binder viscosity, which confers stiffness and deters deformation. Additionally, the introduction of varying RAP contents with constant WEO percentages, and when combined with WEO and CR, improved rutting resistance, except in the LSR75W5C15, LSR75W10C15, LSR75W15C5, and LSR50W15C10 mixtures. This is probably a consequence of a high binder blend content in these mixtures, which were composed of virgin binder, aged binder, WEO and CR.
While the inclusion of WEO in asphalt mixtures offers certain advantages, it was observed to negatively affect rutting performance. This was primarily attributed to the softening effect of WEO on the aged binder, which reduced the overall stiffness of the mixture. As a consequence, the mix became more susceptible to permanent deformation. The potential of WEO to compromise the adhesion between the binder and aggregates was posited as a factor that could further accelerate the progression of rutting. These findings were consistent with earlier research [22,24], emphasizing the necessity of thoughtful material selection and balancing of properties during the asphalt mixture design process.
Finally, the incorporation of CR into the mixture enhanced the rutting resistance compromised by WEO. The direct influence of CR is an increase in stiffness, strength and elasticity [54], which, in turn, enhances rutting resistance. The addition of CR alters the binder’s physical properties, increasing its viscosity and elasticity. CR, when acting as a modifier, swells and partially dissolves upon integration with the asphalt binder, producing a more viscous and stiffer mixture [55]. This stiffness assists in warding off deformation under substantial loads and elevated temperatures. The general observation is that with consistent amounts of RAP and WEO, the addition of CR improves rutting resistance. Some exceptions were noted for LSR75W10C15, LSR75W15C5, and LSR50W15C10 mixtures, necessitating further investigation to understand the interaction among the various materials and their mutual impact on rutting performance. Additionally, it can be shown that the CR has the greatest influence when 5% WEO is used, making them extremely resistant to rutting. However, at greater WEO dosages, the CR was unable to compensate for low binder blend viscosity.

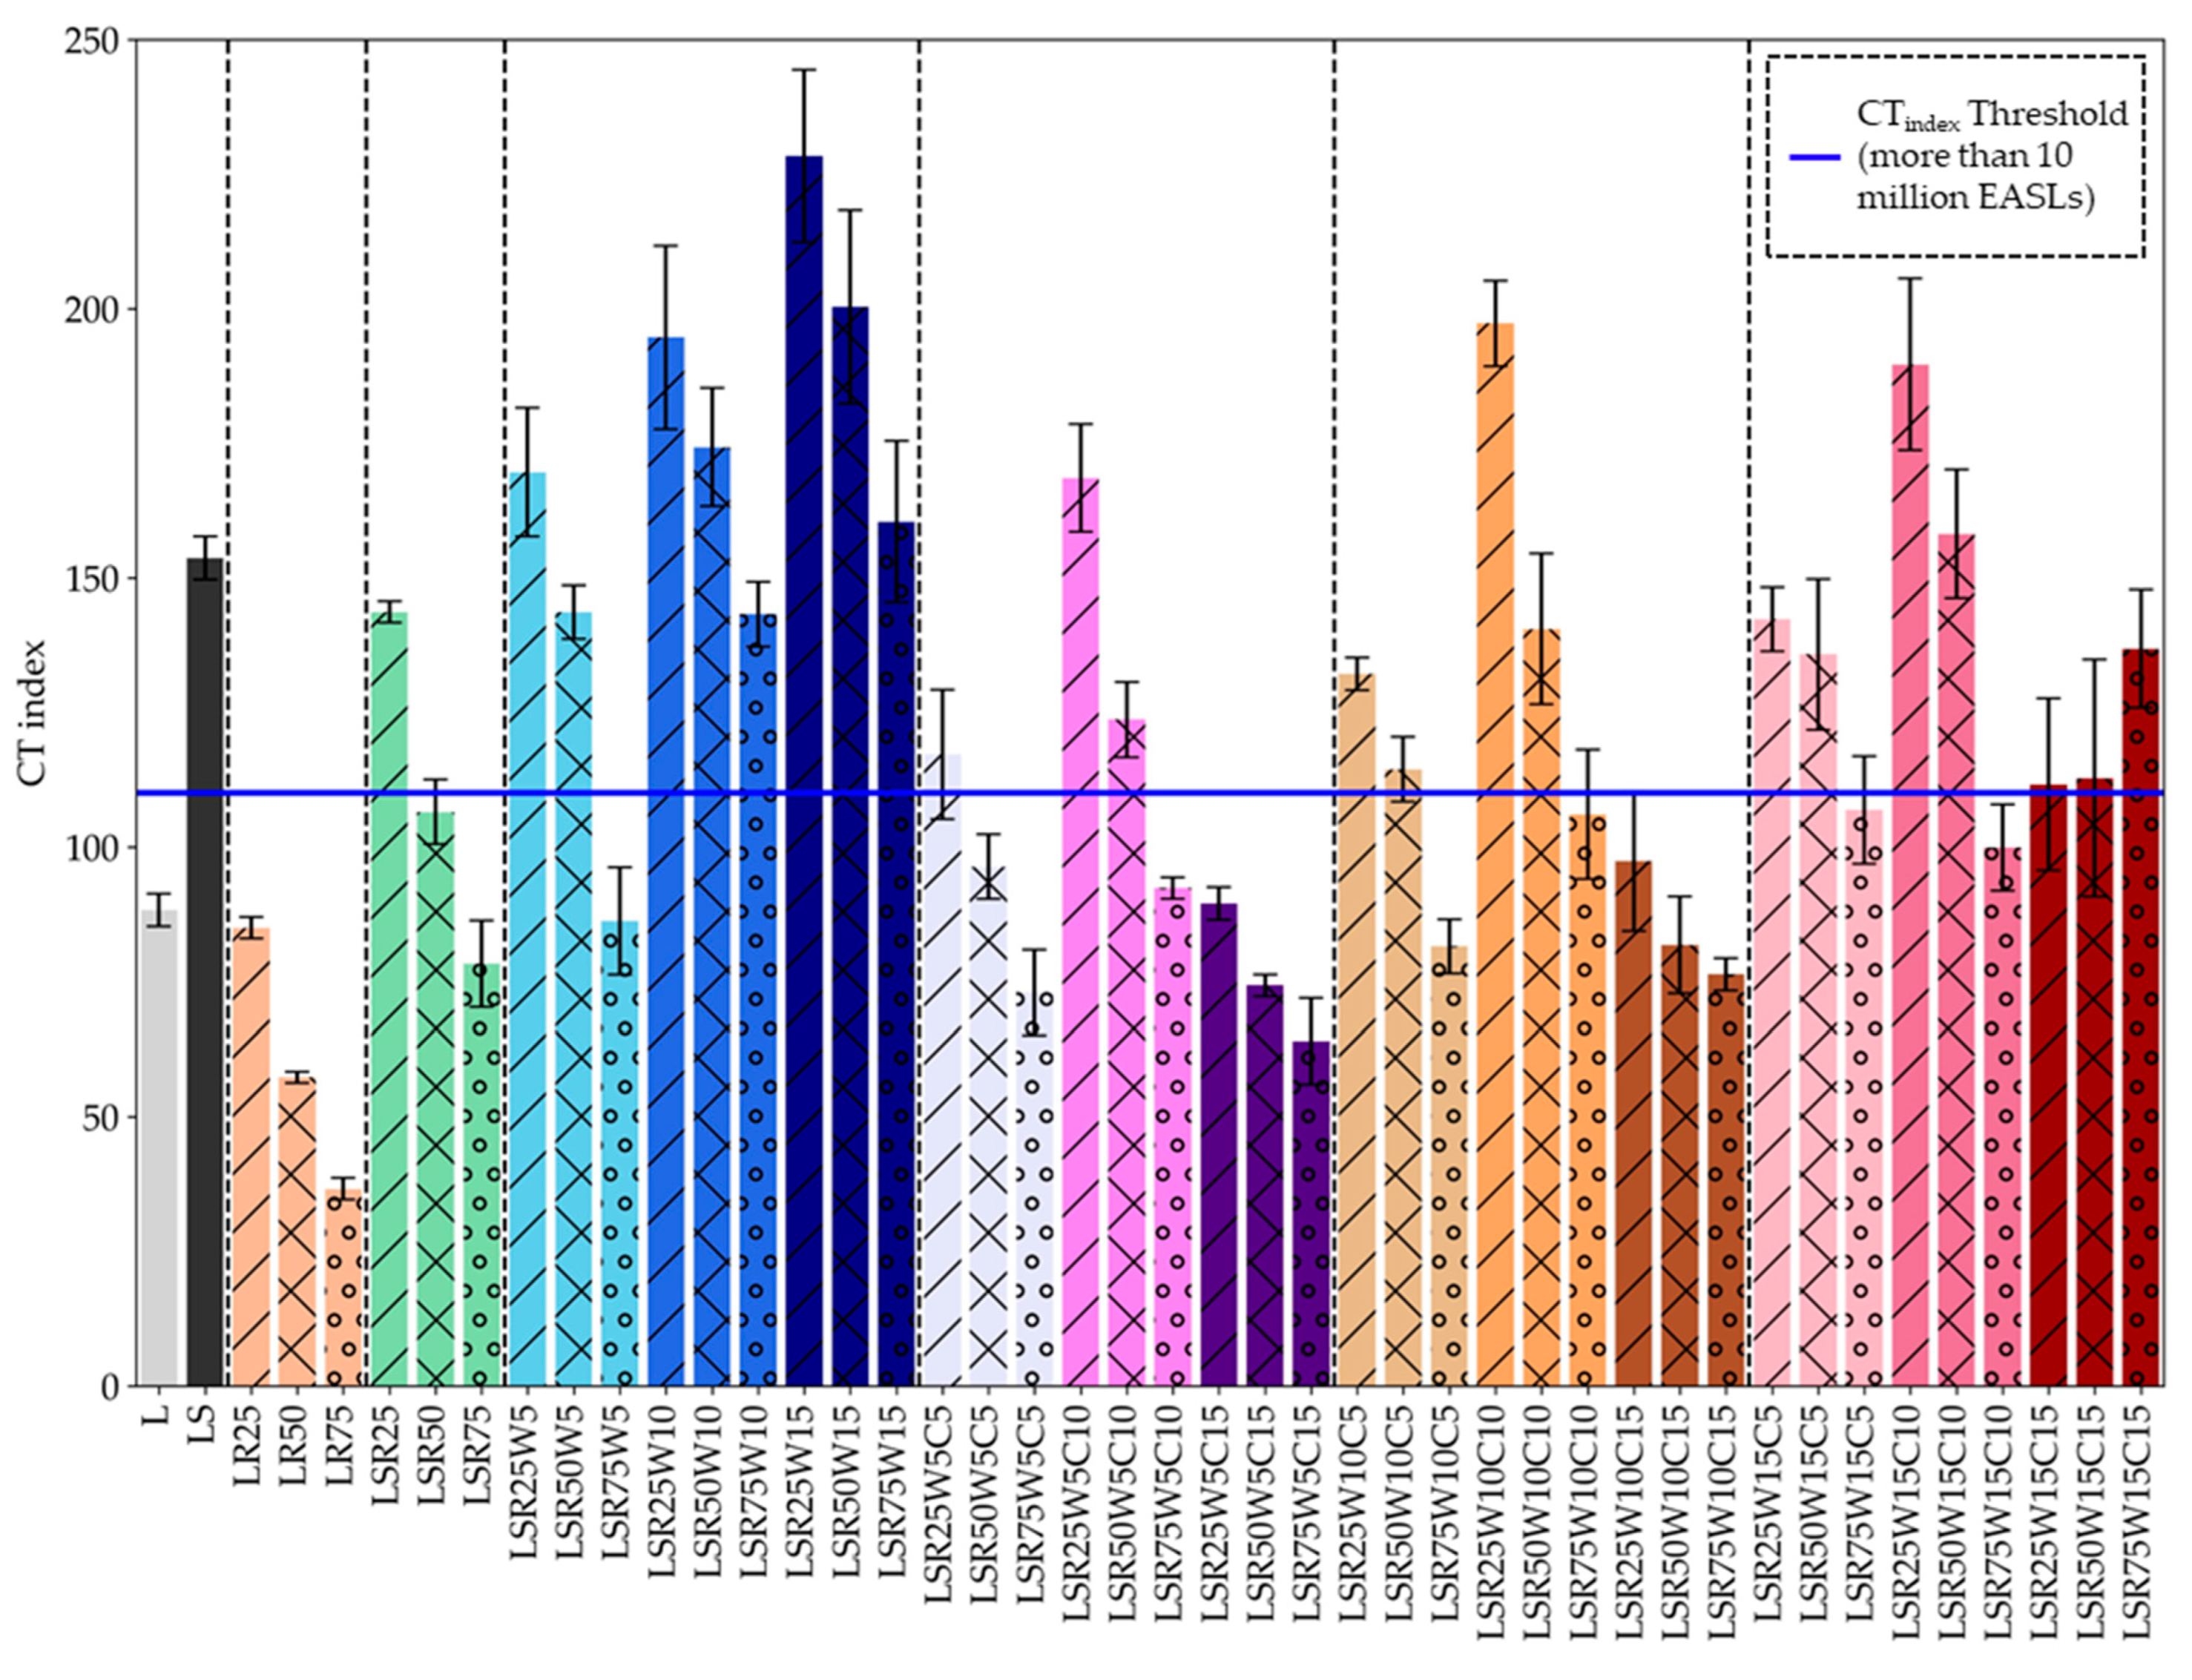
3.3. Indirect Tensile Cracking Test

The IDEAL-CT test, known for its simplicity and efficacy, was employed in this investigation to examine cracking resistance and identify the optimal content ranges and combinations of alternative materials in RAMs. Figure 8 displays the test outcomes, with the blue horizontal line demarcating the CTindex threshold for traffic levels above 10 million EASLs, established at 110.
The results indicate that adding SS positively impacts the mixtures’ cracking resistance. The increased internal friction angle in the mixtures, due to the angularity of the slag, is speculated to enhance adhesion with the asphalt binder, thereby enhancing cracking resistance [56]. Furthermore, this angularity may delay initial microcrack propagation [57].
However, when incorporating RAP into virgin asphalt mixture (L), a negative effect could be observed, where higher content decreased cracking resistance. Compared to the L mixture, RAP mixtures exhibited a drop in CT values: reductions of 4%, 35%, and 59% were noted for 25%, 50%, and 75% RAP, respectively. Intriguingly, for mixtures with 15% WEO and 15% CR, the improvement in cracking resistance was not substantial when moving from 25% to 50% RAP. Additionally, a notable enhancement in resistance was observed with the inclusion of 75% RAP. This suggests that in mixtures with intricate material combinations, particularly with elevated percentages of WEO, CR, and RAP, unexpected performance behaviors can emerge due to the complex interaction of these components.
Addition of SS was also observed to enhance the cracking resistance of mixtures with RAP, which aligns with conclusions from previous studies [40,58]. However, these mixtures have the same trend of cracking resistance, where CTindex values decrease with an increase in RAP content. This declining trend can be partly attributed to the stiff aged binder from RAP. Additionally, the degree of blending between aged and virgin asphalt, as emphasized in recent investigations [59,60], might also influence this outcome. The role of binder activity is another contributing factor to consider [61].
Contrastingly, the integration of WEO into the mixtures enhances cracking resistance. The observed improvement is hypothesized to stem from the softening effect of WEO on the binder within the RAMs. In addition to mixture’s stiffness reduction, WEO addition also improves the degree of binder activation, consequently leading to improved cracking resistance and offsetting the embrittlement introduced by RAP. This finding goes along with previous studies [3,24] suggesting that strategic use of ARAs can mitigate the brittleness of RAP mixtures, thus improving their cracking performance.
The results when integrating CR into the mixtures were more intricate. In general, it can be observed that mixtures containing 10% CR had the highest cracking resistance when compared to those mixtures with 5 and 15% CR. When isolating the impact of RAP, it can be seen that these mixtures followed the same trend as the mixtures with only RAP and WEO, except in the case of mixtures with 15% WEO and 15% CR, where cracking resistance was improved with an increase in RAP content. Additionally, it can be concluded that mixtures with 25% RAP and 10% CR had the highest cracking resistance regardless of the WEO content among all asphalt mixtures containing these materials, whereas addition of only 5% WEO helped in satisfying the threshold value.
In conclusion, as the RAP concentration in RAMs increases, cracking resistance decreases. However, the addition of 20% SS helps in restoring cracking resistance. Addition of only WEO, regardless of its content, significantly improves the cracking resistance, which is strongly affected by RAP content. The mutual impact of WEO and CR is much more complex, so mixtures with high CR and low WEO contents usually have insufficient cracking resistance. Therefore, the CR content in RAM must be carefully selected in order to have satisfying cracking resistance [3,10,40].

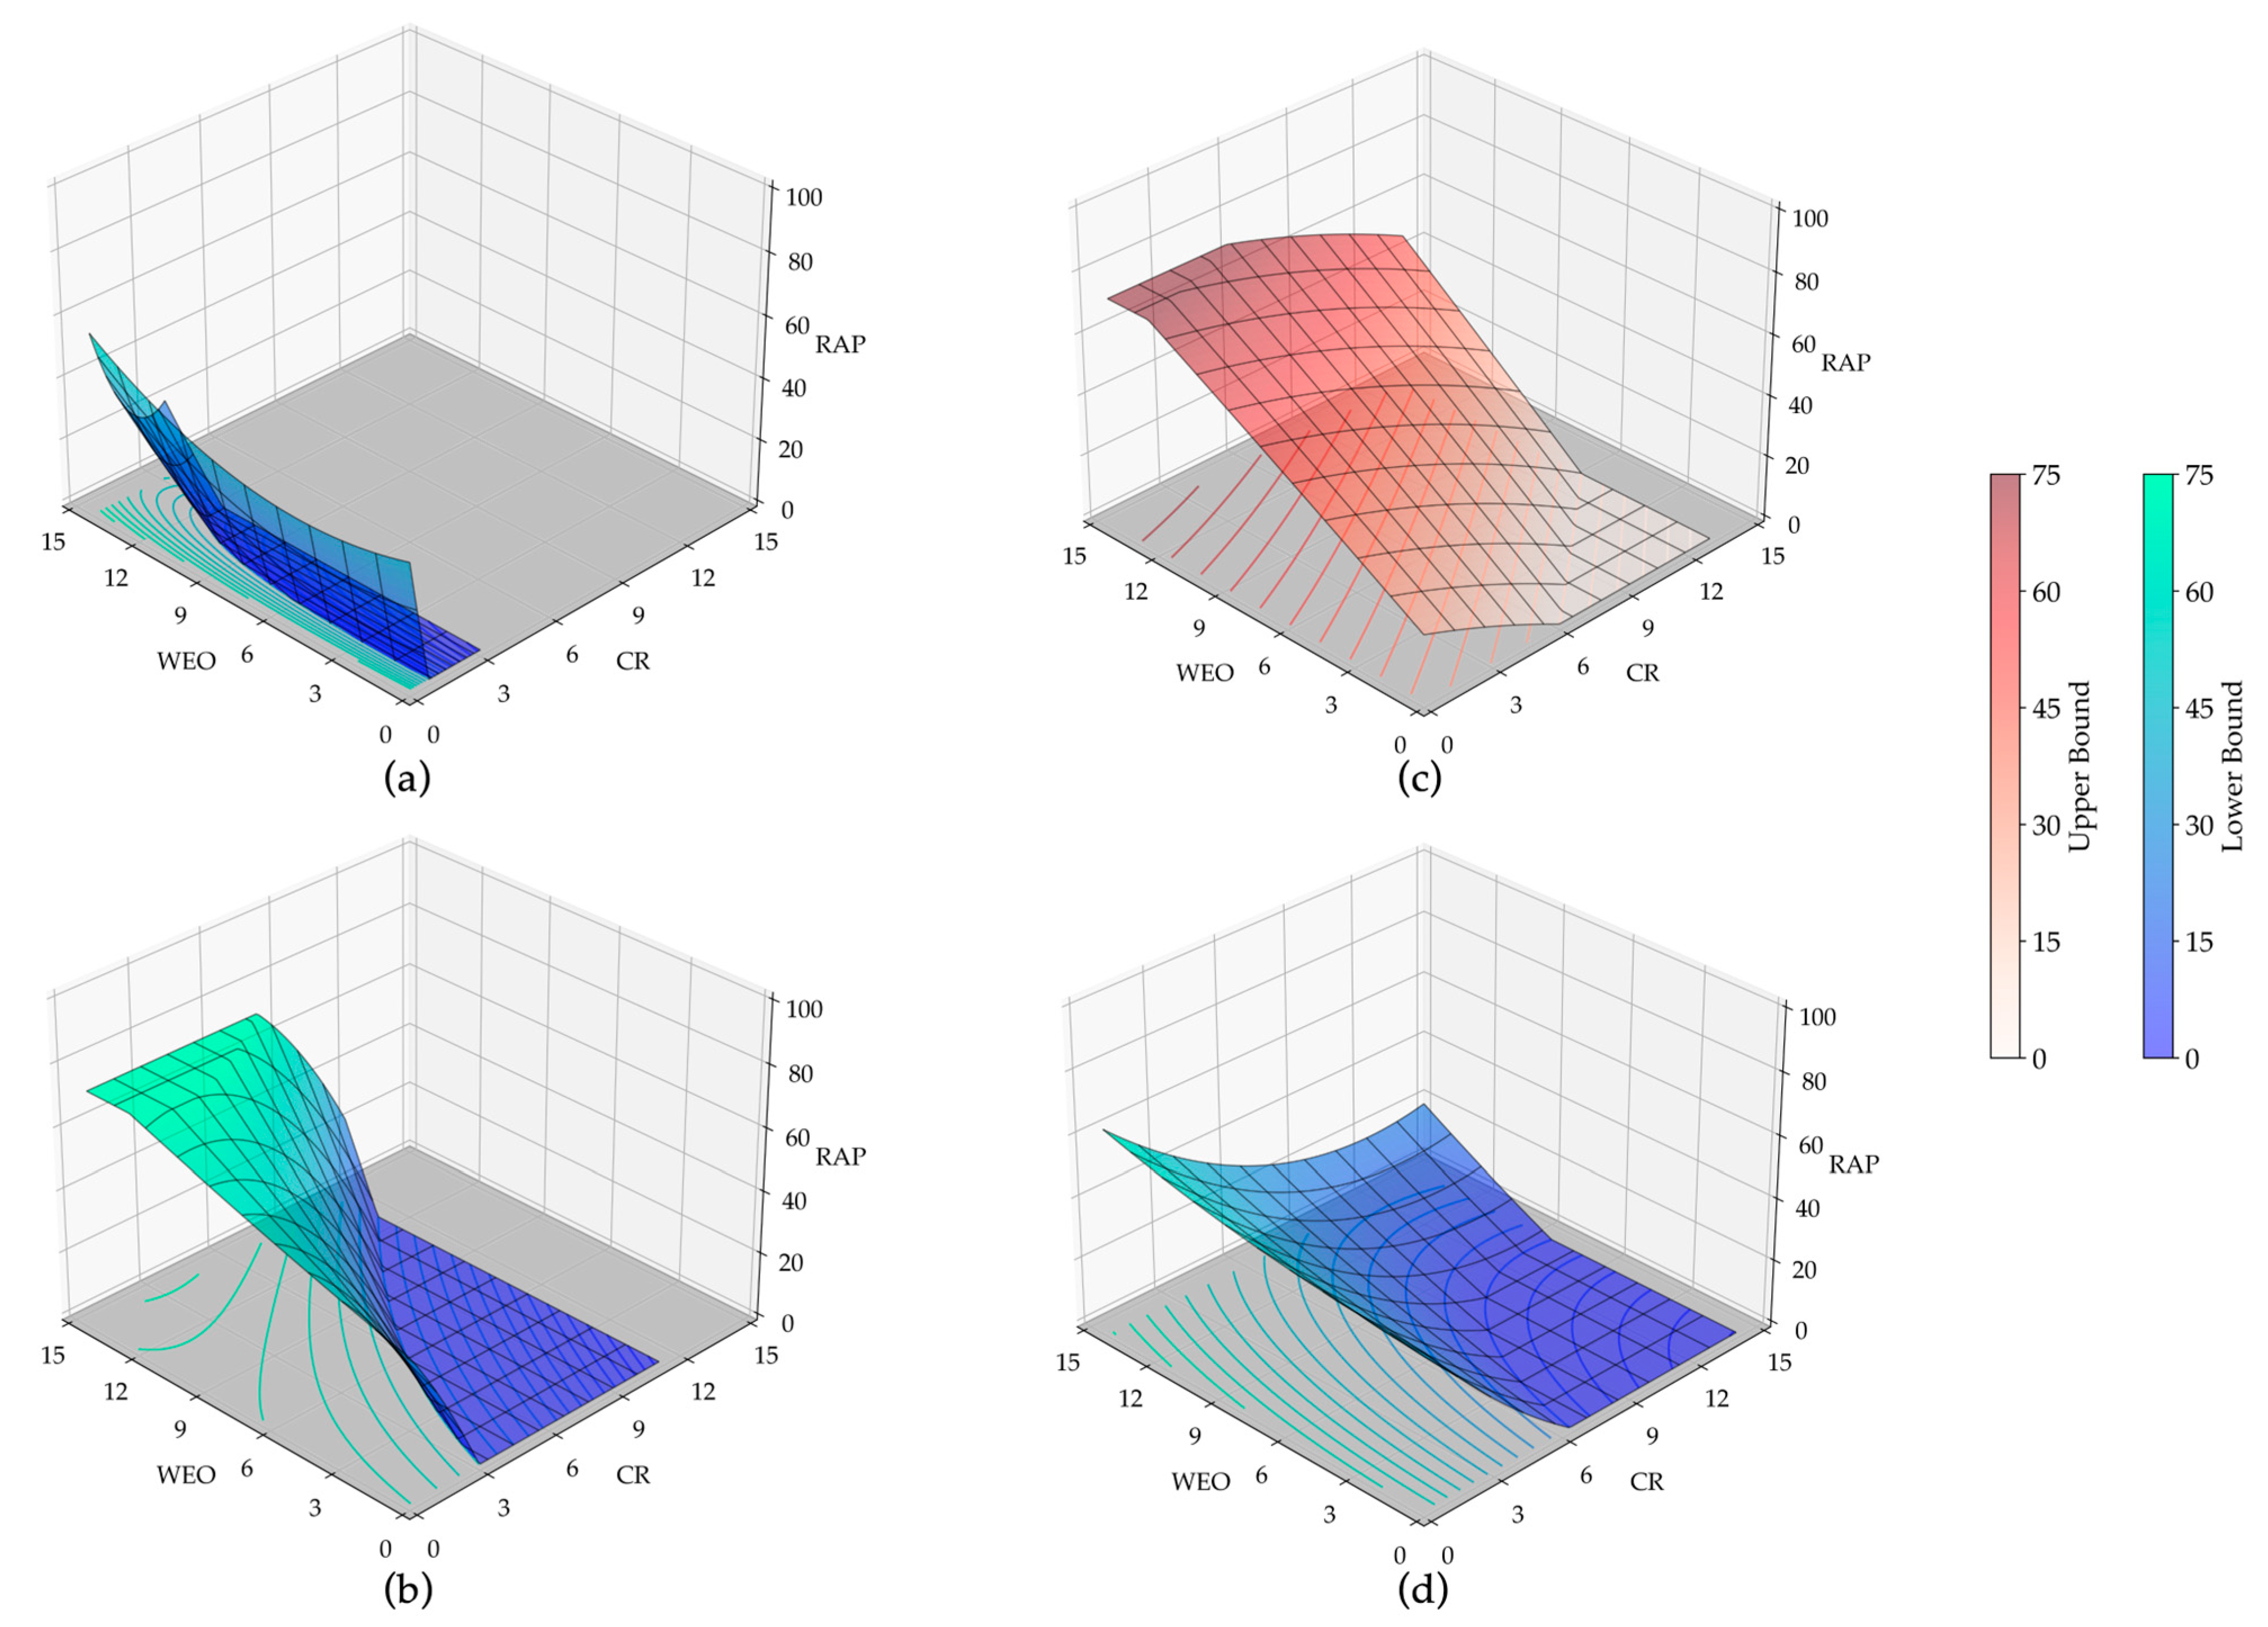
3.4. Determining the Appropriate Usage Percentages of Alternative Materials

The process undertaken to establish accurate prediction models involved a systematic tuning of the hyperparameters associated with each modeling technique. The designated hyperparameters for each of the four distinct models, used for predicting the three performance parameters, are provided in Table 7. Once the tuning of hyperparameters for each technique was finalized, three regression model prediction metrics, namely mean absolute error (MAE), root mean squared error (RMSE), and mean relative error (MRE), were established for each model. Subsequently, the four trained and tuned models were ranked for each test regression model and every prediction metric, and, consequently, an overall ranking was established. Given the results observed, as documented in Table 8, the GPR was determined to be the most appropriate model and was thus utilized in the succeeding segments of the study.
In the employed GPR model, the paired t-test results unveiled the pivotal roles that each material plays in influencing the performance test parameters. For the CTIndex and FN, the variable WEO emerged as the most influential factor, whereas for the TSR, the CR showcased significant influence. This underscores the role each alternative material plays in determining the overall performance of asphalt mixtures.
The comprehensive methodology is translated into figures and tables explaining the usage of threshold values for asphalt mixtures composed of SS, RAP, CR, and WEO. Figure 9 presents insights into the lower and upper bounds for material ratio utilization for three performance test parameters under high-traffic conditions. Specifically, Figure 9a,b delineate the lower bounds for alternative material utilization ratios essential for satisfactory FN for different traffic scenarios: between 10 and 30 million and more than 30 million ESALs, respectively. Notably, the shift from lower to higher traffic impacts the lower bound surface, causing it to elevate and consequently shrink the acceptable region in the input space. This transition decreases the satisfactory region of the utilization space from 98% to 72%, resulting in a 24% reduction. Moreover, Figure 9c exhibits the upper bound for the CTindex values, indicating the range within which satisfactory performance can be achieved. The cracking resistance performance stands out as it restricts the utilization space from above, thereby predominantly limiting the use of RAP. Figure 9d shows the lower bound for material utilization necessary for satisfactory performance in the TSR ratio.
As illustrated by these figures, the RAP material contributes positively to the FN and TSR parameters, but it can adversely affect the CTindex. Similarly, the use of CR is limited by the CTindex values as higher CR values may lead to subpar cracking resistance performance. However, higher WEO values coupled with lower CR values generally necessitate increased RAP utilization for satisfactory FN and TSR. Importantly, the cracking resistance emerges as the most restrictive, with its satisfactory region covering around 46% of the space and thereby acting as an issue for achieving satisfactory performance. The surfaces defining these boundaries are reported in Table 9.
Broadening the analysis to include all three test parameters, Figure 10 summarizes the upper and lower bounds for the alternative material utilization ratios under different traffic conditions. The region between these bounds in the figures designates the area within which a user’s chosen alternative material utilization ratios would yield satisfactory performance in all three parameters, thereby making them suitable for the BMD approach. Additionally, the contours for these surfaces are depicted on the floor plane of the 3D spaces, enhancing the understanding of these 3D shapes. The upper bound in these figures is determined by the CTindex values, while the lower bound results from a combination of the bounds set by the FN and TSR, meaning that any point between these surfaces would be having satisfactory properties considering various traffic levels. Figure 10a exhibits the thresholds for alternative materials’ utilization under traffic levels of 10 to 30 million ESALs, accounting for approximately 25% of the total utilization space. The transition to higher ESALs (more than 30 million) leads to a reduction in the acceptable region between the upper and lower bounds, primarily driven by the stricter threshold for the FN, causing a further decrease of 40% in the acceptable region. The equations for the upper and lower bound surfaces in this space are reported in Table 9, where values in brackets present the amounts of appropriate materials within the limits used in this study: RAP—0–75%, WEO—0–15% and CR 0–15%. These visualizations provide insights into the performance boundaries and their sensitivity to different high-traffic conditions, consequently helping in the understanding of the complex interaction between alternative materials and their impact on RAM performance.

4. Conclusions

This research evaluated the effects of different RAP, WEO, and CR contents and combinations, alongside a constant dosage of steel slag (SS) aggregate, on the RAM performance. The obtained results were further used for developing prediction models using the GPR technique, with the aim to determine the contents of these materials required to achieve satisfactory performance depending on traffic levels and to determine the most influential component materials on each performance parameter. The performance assessments focused on cracking resistance (via CTindex), rutting resistance (using flow number), and moisture damage resistance (measured by TSR). The main conclusions are:
  • Overall, the use of 20% SS instead of virgin aggregate enhances all performance metrics of asphalt mixtures, especially when combined with a low RAP content (25%).
  • The RAP content significantly affects the cracking resistance. When compared to the L mixture, the CTindex value dropped by up to 59% with an increase in RAP content of up to 75% in asphalt mixtures without other alternative materials. RAP presence generally improves the rutting and moisture damage resistance of all asphalt mixtures, regardless of the contents and combination of alternative materials.
  • WEO significantly improves cracking resistance, where only 5% was enough to meet the proposed threshold value. At the same time, it reduces the rutting and moisture damage resistance, especially if more than 5% is used.
  • Addition of 10% CR led to the highest cracking resistance of the mixtures containing RAP, SS and WEO. The use of CR simultaneously offsets the negative effect of WEO on the rutting resistance, especially when combined with 5% WEO, and has a positive impact on moisture damage resistance.
  • The GPR model can successfully be used to determine the most beneficial ratio and combination of alternative materials, considering individual or overall performance of RAMs depending on the traffic level.
  • The application of a paired t-test to the GPR models showed that rutting and cracking resistance are mostly influenced by WEO, whereas moisture damage resistance is mostly affected by CR.
The results provided in this article were obtained using only one type of each alternative material. Therefore, these findings should be verified by external results, collected by testing RAMs with different combinations, contents and types of alternative materials. Nonetheless, the proposed methodology has high potential to be used for BMD purposes; therefore, its applicability should be further investigated by performing other performance tests.

Author Contributions

Conceptualization, M.K., M.A., M.O. and K.K; methodology, M.K., K.K. and A.G.; validation, M.A., A.G. and M.O.; formal analysis, M.K. and K.K.; investigation, M.K.; resources, A.G.; data curation, M.K.; writing—original draft preparation, M.K.; writing—review and editing, A.G., M.A. and M.O.; visualization, M.K., K.K. and M.O.; supervision, M.A. and A.G.; project administration, M.A. and A.G.; funding acquisition, M.A. All authors have read and agreed to the published version of the manuscript.

Funding

This research received no external funding.

Institutional Review Board Statement

Not applicable.

Informed Consent Statement

Not applicable.

Data Availability Statement

Data are unavailable due to privacy or ethical restrictions.

Acknowledgments

M.O. would like to express his sincere thanks to the Ministry of Education, Science, and Technological Development of the Republic of Serbia for the support provided under research project number 2000092. M.O. also gratefully acknowledges financial support for this research provided by the Fulbright Visiting Scholar Program, which is sponsored by the U.S. Department of State. The contents of this article are solely the responsibility of M.O. and do not necessarily represent the official views of the Fulbright Program or the Government of the United States.

Conflicts of Interest

The authors declare no conflict of interest.

References

  1. Aurangzeb, Q.; Al-Qadi, I.L.; Ozer, H.; Yang, R. Hybrid Life Cycle Assessment for Asphalt Mixtures with High RAP Content. Resour. Conserv. Recycl. 2014, 83, 77–86. [Google Scholar] [CrossRef]
  2. Willis, J.R.; Turner, P.; Julian, G.; Taylor, A.J.; Tran, N.; Padula, F. Effects of Changing Virgin Binder Grade and Content on Rap Mixture Properties—NCAT Report 12-03. Natl. Cent. Ashalt Technol. 2012, 1–47. [Google Scholar]
  3. Jahanbakhsh, H.; Karimi, M.M.; Naseri, H. Sustainable Asphalt Concrete Containing High Reclaimed Asphalt Pavements and Recycling Agents: Performance Assessment, Cost Analysis, and Environmental Impact. J. Clean. Prod. 2020, 244, 118837. [Google Scholar] [CrossRef]
  4. Williams, B.A.; Willis, J.R.; Ross, T.C. Asphalt Pavement Industry Survey on Recycled Materials and Warm-Mix Asphalt Usage: 2018. Natl. Asph. Pavement Assoc. 2019, 1–46. [Google Scholar]
  5. Kim, S.; Sholar, G.A.; Byron, T.; Kim, J. Performance of Polymer-Modified Asphalt Mixture with Reclaimed Asphalt Pavement. Transp. Res. Rec. 2009, 2126, 109–114. [Google Scholar] [CrossRef]
  6. Majidifard, H.; Tabatabaee, N.; Buttlar, W. Investigating Short-Term and Long-Term Binder Performance of High-RAP Mixtures Containing Waste Cooking Oil. J. Traffic Transp. Eng. English Ed. 2019, 6, 396–406. [Google Scholar] [CrossRef]
  7. Taherkhani, H.; Noorian, F. Comparing the Effects of Waste Engine and Cooking Oil on the Properties of Asphalt Concrete Containing Reclaimed Asphalt Pavement (RAP). Road Mater. Pavement Des. 2020, 21, 1238–1257. [Google Scholar] [CrossRef]
  8. Hugener, M.; Wang, D.; Cannone Falchetto, A.; Porot, L.; Kara De Maeijer, P.; Orešković, M.; Sa-da-Costa, M.; Tabatabaee, H.; Bocci, E.; Kawakami, A. Recommendation of RILEM TC 264 RAP on the Evaluation of Asphalt Recycling Agents for Hot Mix Asphalt. Mater. Struct. 2022, 55, 31. [Google Scholar] [CrossRef]
  9. Daryaee, D.; Ameri, M.; Mansourkhaki, A. Utilizing of Waste Polymer Modified Bitumen in Combination with Rejuvenator in High Reclaimed Asphalt Pavement Mixtures. Constr. Build. Mater. 2020, 235, 117516. [Google Scholar] [CrossRef]
  10. Poulikakos, L.D.; Pasquini, E.; Tusar, M.; Hernando, D.; Wang, D.; Mikhailenko, P.; Pasetto, M.; Baliello, A.; Cannone Falchetto, A.; Miljković, M.; et al. RILEM Interlaboratory Study on the Mechanical Properties of Asphalt Mixtures Modified with Polyethylene Waste. J. Clean. Prod. 2022, 375, 134124. [Google Scholar] [CrossRef]
  11. Mohamed, A.S.; Cao, Z.; Xu, X.; Xiao, F.; Abdel-wahed, T. Bonding, Rheological, and Physiochemical Characteristics of Reclaimed Asphalt Rejuvenated by Crumb Rubber Modified Binder. J. Clean. Prod. 2022, 373, 133896. [Google Scholar] [CrossRef]
  12. Dhoble, Y.N.; Ahmed, S. Review on the Innovative Uses of Steel Slag for Waste Minimization. J. Mater. Cycles Waste Manag. 2018, 20, 1373–1382. [Google Scholar] [CrossRef]
  13. Orešković, M.; Santos, J.; Mladenović, G.; Rajaković-Ognjanović, V. The Feasibility of Using Copper Slag in Asphalt Mixtures for Base and Surface Layers Based on Laboratory Results. Constr. Build. Mater. 2023, 384, 131285. [Google Scholar] [CrossRef]
  14. Wen, H.; Wu, S.; Bhusal, S. Performance Evaluation of Asphalt Mixes Containing Steel Slag Aggregate as a Measure to Resist Studded Tire Wear. J. Mater. Civ. Eng. 2016, 28, 04015191. [Google Scholar] [CrossRef]
  15. Kavussi, A.; Qazizadeh, M.J. Fatigue Characterization of Asphalt Mixes Containing Electric Arc Furnace (EAF) Steel Slag Subjected to Long Term Aging. Constr. Build. Mater. 2014, 72, 158–166. [Google Scholar] [CrossRef]
  16. Ye, Y.; Wu, S.; Li, C.; Kong, D.; Shu, B. Morphological Discrepancy of Various Basic Oxygen Furnace Steel Slags and Road Performance of Corresponding Asphalt Mixtures. Materials Basel 2019, 12, 2322. [Google Scholar] [CrossRef]
  17. Zaumanis, M.; Poulikakos, L.D.; Partl, M.N. Performance-Based Design of Asphalt Mixtures and Review of Key Parameters. Mater. Des. 2018, 141, 185–201. [Google Scholar] [CrossRef]
  18. Sabouri, M. Evaluation of Performance-Based Mix Design for Asphalt Mixtures Containing Reclaimed Asphalt Pavement (RAP). Constr. Build. Mater. 2020, 235, 117545. [Google Scholar] [CrossRef]
  19. Asi, I.M.; Qasrawi, H.Y.; Shalabi, F.I. Use of Steel Slag Aggregate in Asphalt Concrete Mixes. Can. J. Civ. Eng. 2007, 34, 902–911. [Google Scholar] [CrossRef]
  20. Rahbar-Rastegar, R.; Zhang, R.; Sias, J.E.; Dave, E.V. Evaluation of Laboratory Ageing Procedures on Cracking Performance of Asphalt Mixtures. Road Mater. Pavement Des. 2019, 20, S647–S662. [Google Scholar] [CrossRef]
  21. Meroni, F.; Flintsch, G.W.; Habbouche, J.; Diefenderfer, B.K.; Giustozzi, F. Three-Level Performance Evaluation of High RAP Asphalt Surface Mixes. Constr. Build. Mater. 2021, 309, 125164. [Google Scholar] [CrossRef]
  22. Jia, X.; Huang, B.; Moore, J.A.; Zhao, S. Influence of Waste Engine Oil on Asphalt Mixtures Containing Reclaimed Asphalt Pavement. J. Mater. Civ. Eng. 2015, 27, 04015042. [Google Scholar] [CrossRef]
  23. Devulapalli, L.; Kothandaraman, S.; Sarang, G. Effect of Rejuvenating Agents on Stone Matrix Asphalt Mixtures Incorporating RAP. Constr. Build. Mater. 2020, 254, 119298. [Google Scholar] [CrossRef]
  24. Khan, M.Z.H.; Koting, S.; Katman, H.Y.B.; Ibrahim, M.R.; Babalghaith, A.M.; Asqool, O. Performance of High Content Reclaimed Asphalt Pavement (Rap) in Asphaltic Mix with Crumb Rubber Modifier and Waste Engine Oil as Rejuvenator. Appl. Sci. 2021, 11, 5226. [Google Scholar] [CrossRef]
  25. Sienkiewicz, M.; Borzędowska-Labuda, K.; Wojtkiewicz, A.; Janik, H. Development of Methods Improving Storage Stability of Bitumen Modified with Ground Tire Rubber: A Review. Fuel Process Technol. 2017, 159, 272–279. [Google Scholar] [CrossRef]
  26. Bressi, S.; Fiorentini, N.; Huang, J.; Losa, M. Crumb Rubber Modifier in Road Asphalt Pavements: State of the Art and Statistics. Coatings 2019, 9, 384. [Google Scholar] [CrossRef]
  27. Lo Presti, D. Recycled Tyre Rubber Modified Bitumens for Road Asphalt Mixtures: A Literature Review. Constr. Build. Mater. 2013, 49, 863–881. [Google Scholar] [CrossRef]
  28. Khalili, M.; Jadidi, K.; Karakouzian, M.; Amirkhanian, S. Rheological Properties of Modified Crumb Rubber Asphalt Binder and Selecting the Best Modified Binder Using AHP Method. Case Stud. Constr. Mater. 2019, 11, e00276. [Google Scholar] [CrossRef]
  29. Shen, J.; Amirkhanian, S.; Xiao, F.; Tang, B. Influence of Surface Area and Size of Crumb Rubber on High Temperature Properties of Crumb Rubber Modified Binders. Constr. Build. Mater. 2009, 23, 304–310. [Google Scholar] [CrossRef]
  30. Mohammadi, I.; Khabbaz, H. Challenges Associated with Optimisation of Blending, Mixing and Compaction Temperatures for Asphalt Mixture Modified with Crumb Rubber Modifier (CRM). Appl. Mech. Mater. 2013, 256–259, 1837–1844. [Google Scholar] [CrossRef]
  31. ASTM D8225 Standard; Test Method for Determination of Cracking Tolerance Index of Asphalt Mixture Using the Indirect Tensile Cracking Test at Intermediate Tempreture. ASTM International: West Conshohocken, PA, USA, 2019; pp. 1–6. [CrossRef]
  32. Zhou, F.; Im, S.; Sun, L.; Scullion, T. Development of an IDEAL Cracking Test for Asphalt Mix Design and QC/QA. Road Mater. Pavement Des. 2017, 18, 405–427. [Google Scholar] [CrossRef]
  33. Yin, F.; West, R. Balanced Mix Design Resource Guide; National Asphat Pavement Assiciation: Greenbelt, MD, USA, 2021. [Google Scholar]
  34. Zhang, R.; Sias, J.E.; Dave, E.V. Comparison and Correlation of Asphalt Binder and Mixture Cracking Parameters Incorporating the Aging Effect. Constr. Build. Mater. 2021, 301, 124075. [Google Scholar] [CrossRef]
  35. Khodaii, A.; Mehrara, A. Evaluation of Permanent Deformation of Unmodified and SBS Modified Asphalt Mixtures Using Dynamic Creep Test. Constr. Build. Mater. 2009, 23, 2586–2592. [Google Scholar] [CrossRef]
  36. Behnood, A.; Shah, A.; McDaniel, R.S.; Beeson, M.; Olek, J. High-Temperature Properties of Asphalt Binders: Comparison of Multiple Stress Creep Recovery and Performance Grading Systems. Transp. Res. Rec. 2016, 2574, 131–143. [Google Scholar] [CrossRef]
  37. National Academies of Sciences, Engineering, and Medicine. A Manual for Design of Hot-Mix Asphalt with Commentary; The National Academies Press: Washington, DC, USA, 2011. [Google Scholar]
  38. Goh, S.W.; You, Z. A Simple Stepwise Method to Determine and Evaluate the Initiation of Tertiary Flow for Asphalt Mixtures under Dynamic Creep Test. Constr. Build. Mater. 2009, 23, 3398–3405. [Google Scholar] [CrossRef]
  39. Khalifah, S. Use of Anova Asphalt Rejuvenator and Balanced Mix Design Principle to Improve the Performance of High-RAP Asphalt Mixtures. Auburn Univ. 2019, 126, 1–7. [Google Scholar]
  40. Khorshidi, M.; Ameri, M.; Goli, A. Cracking Performance Evaluation and Modelling of RAP Mixtures Containing Different Recycled Materials Using Deep Neural Network Model. Road Mater. Pavement Des. 2023, 1–20. [Google Scholar] [CrossRef]
  41. Taherkhani, A.H.; Mei, Q.; Han, F. A Deep Learning Model to Predict the Lateral Capacity of Monopiles. In Proceedings of the Geo-Congress 2023, Los Angeles, CA, USA, 26–29 March 2023; pp. 220–227. [Google Scholar]
  42. Lecun, Y.; Bengio, Y.; Hinton, G. Deep Learning. Nature 2015, 521, 436–444. [Google Scholar] [CrossRef]
  43. Nelder, J.A.; Wedderburn, R.W.M. Generalized Linear Models. J. R. Stat. Soc. Ser. A Stat. Soc. 1972, 135, 370–384. [Google Scholar] [CrossRef]
  44. Smola, A.J.; Schölkopf, B. A Tutorial on Support Vector Regression. Stat. Comput. 2004, 14, 199–222. [Google Scholar] [CrossRef]
  45. Williams, C. Gaussian processes for machine learning (Presentation). Inst. Adapt. Neural Comput. 2007, 2, 3. [Google Scholar]
  46. Motevalizadeh, S.M.; Sedghi, R.; Rooholamini, H. Fracture Properties of Asphalt Mixtures Containing Electric Arc Furnace Slag at Low and Intermediate Temperatures. Constr. Build. Mater. 2020, 240, 117965. [Google Scholar] [CrossRef]
  47. Liu, W.; Li, H.; Zhu, H.; Xu, P. The Interfacial Adhesion Performance and Mechanism of a Modified Asphalt-Steel Slag Aggregate. Materials Basel 2020, 13, 1180. [Google Scholar] [CrossRef]
  48. Fakhri, M.; Ahmadi, A. Evaluation of Fracture Resistance of Asphalt Mixes Involving Steel Slag and RAP: Susceptibility to Aging Level and Freeze and Thaw Cycles. Constr. Build. Mater. 2017, 157, 748–756. [Google Scholar] [CrossRef]
  49. Chen, Z.; Jiao, Y.; Wu, S.; Tu, F. Moisture-Induced Damage Resistance of Asphalt Mixture Entirely Composed of Gneiss and Steel Slag. Constr. Build. Mater. 2018, 177, 332–341. [Google Scholar] [CrossRef]
  50. Al-Qadi, I.L.; Qazi, A.; Carpenter, S.H. Impact of High RAP Content on Structural and Performance Properties of Asphalt Mixtures; Illinois Center for Transportation: Urbana, IL, USA, 2012; pp. 1–107. [Google Scholar]
  51. Ghabchi, R.; Singh, D.; Zaman, M.; Hossain, Z. Laboratory Characterisation of Asphalt Mixes Containing RAP and RAS. Int. J. Pavement Eng. 2016, 17, 829–846. [Google Scholar] [CrossRef]
  52. Kocak, S.; Kutay, M.E. Use of Crumb Rubber in Lieu of Binder Grade Bumping for Mixtures with High Percentage of Reclaimed Asphalt Pavement. Road Mater. Pavement Des. 2017, 18, 116–129. [Google Scholar] [CrossRef]
  53. Lee, E.J.; Park, H.M.; Suh, Y.C.; Lee, J. Performance Evaluation of Asphalt Mixtures with 100% EAF and BOF Steel Slag Aggregates Using Laboratory Tests and Mechanistic Analyses. KSCE J. Civ. Eng. 2022, 26, 4542–4551. [Google Scholar] [CrossRef]
  54. Duan, K.; Wang, C.; Liu, J.; Song, L.; Chen, Q.; Chen, Y. Research Progress and Performance Evaluation of Crumb-Rubber-Modified Asphalts and Their Mixtures. Constr. Build. Mater. 2022, 361, 129687. [Google Scholar] [CrossRef]
  55. Ren, S.; Liu, X.; Xu, J.; Lin, P. Investigating the Role of Swelling-Degradation Degree of Crumb Rubber on CR/SBS Modified Porous Asphalt Binder and Mixture. Constr. Build. Mater. 2021, 300, 124048. [Google Scholar] [CrossRef]
  56. Kavussi, A.; Qazizadeh, M.J.; Hassani, A. Fatigue Behavior Analysis of Asphalt Mixes Containing Electric Arc Furnace (EAF) Steel Slag. J. Rehabil. Civ. Eng. 2016, 1, 74–86. [Google Scholar]
  57. Pasetto, M.; Baldo, N. Mix Design and Performance Analysis of Asphalt Concretes with Electric Arc Furnace Slag. Constr. Build. Mater. 2011, 25, 3458–3468. [Google Scholar] [CrossRef]
  58. Pattanaik, M.L.; Choudhary, R.; Kumar, B.; Kumar, A. Mechanical Properties of Open Graded Friction Course Mixtures with Different Contents of Electric Arc Furnace Steel Slag as an Alternative Aggregate from Steel Industries. Road Mater. Pavement Des. 2021, 22, 268–292. [Google Scholar] [CrossRef]
  59. Ma, Y.; Zheng, K.; Ding, Y.; Polaczyk, P.; Jiang, X.; Huang, B. Binder Availability and Blending Efficiency of Reclaimed Asphalt: A State-of-the-Art Review. Constr. Build. Mater. 2022, 357, 129334. [Google Scholar] [CrossRef]
  60. Xing, C.; Li, M.; Liu, L.; Lu, R.; Liu, N.; Wu, W.; Yuan, D. A Comprehensive Review on the Blending Condition between Virgin and RAP Asphalt Binders in Hot Recycled Asphalt Mixtures: Mechanisms, Evaluation Methods, and Influencing Factors. J. Clean. Prod. 2023, 398, 136515. [Google Scholar] [CrossRef]
  61. Lo Presti, D.; Vasconcelos, K.; Orešković, M.; Pires, G.M.; Bressi, S. On the Degree of Binder Activity of Reclaimed Asphalt and Degree of Blending with Recycling Agents. Road Mater. Pavement Des. 2020, 21, 2071–2090. [Google Scholar] [CrossRef]
Figure 1. Gradation curves of asphalt mixtures and component materials including limit lines.
Sustainability 15 13314 g001
Figure 2. Asphalt mixtures’ notation pattern.
Sustainability 15 13314 g002
Figure 3. Experimental plan of the study.
Sustainability 15 13314 g003
Figure 4. Division of the different stages based on accumulative permanent stress curve.
Sustainability 15 13314 g004
Figure 5. Results of the indirect tensile strength test for various types of mixtures.
Sustainability 15 13314 g005
Figure 6. The TSR values of mixtures.
Sustainability 15 13314 g006
Figure 7. Flow number values of mixtures.
Sustainability 15 13314 g007
Figure 8. CTindex values of mixtures investigated.
Sustainability 15 13314 g008
Figure 9. Utilization ratio threshold surfaces for (a) FN (10 to 30 million ESALs), (b) FN (more than 30 million), (c) CTindex and (d) TSR.
Sustainability 15 13314 g009
Figure 10. Three-dimensional presentation of the performance test threshold surfaces for (a) traffic between 10 and 30 million ESALs and for (b) traffic with more than 30 million ESALs.
Sustainability 15 13314 g010
Table 1. The physical and mechanical properties of limestone and steel slag aggregates.
PropertyStandardRequirementLimestoneSteel Slag
Los Angeles abrasion (%)ASTM-C131<302318
Water absorption of coarse aggregates (%)ASTM-C127<2.50.91.28
Water absorption of fine aggregates (%)<2.81.1-
Compressive strength (kg/cm2)ASTM-C39-4091823
Specific gravity of coarse aggregates (g/cm3)ASTM-C128-2.663.299
Specific gravity of fine aggregates (g/cm3)ASTM-C127-2.51-
Table 2. Chemical components of steel slag aggregates.
IngredientAl2O3FeOP2O5MgOMnOSiO2CaO
Percent3.95%33.68%0.68%11.44%2.24%17.72%29.96%
Table 3. Crumb rubber gradation for mesh #40 [28,29].
Sieve SizeNo. 20No. 30No. 40No. 50No. 80No. 100
Required passing percentages10010085–9055–6021–2517–20
Utilized passing percentages10010087582217
Table 4. The virgin asphalt binder’s properties.
PropertyTest StandardValue
Penetration at 25 °CASTM D565
Softening point (°C)ASTM D3649
Ductility (cm)ASTM D113100
Flashpoint (°C)ASTM D92280
Mass lost (%)ASTM D60.1
Viscosity at 135 °C (0.01 cSt)ASTM D2170490
Viscosity at 160 °C (0.01 cSt)ASTM D2170120
Table 5. Examples of the mixtures’ notation.
ExamplesComponents
LS80% limestone aggregate
20% SS aggregate
LR5050% limestone aggregate
50% RAP
LSR50W10C1530% limestone aggregate
20% SS aggregate
50% RAP
10% WEO
15% CR
Table 6. Viscosity values and production temperatures of different CR usage percentages.
BinderRotational Viscosity (mPa.s)Temperature (°C)
135 °C160 °CMixingCompaction
0% CR490120154145
5% CR670150158150
10% CR1080250167158
15% CR1930580185174
Table 7. Tuned hyperparameters for performance test prediction models.
ParameterGLMSVRGPRFNN
FNAlpha: 1 × 101Kernel: LinearVariance: 1 × 100# Neurons: 32
C: 1# Layers: 3
Fit intercept: TrueEpsilon: 1 × 10⁻¹Length scale: 1 × 100Batch Size: 8
# Epochs: 500
CTindexAlpha: 1 × 101Kernel: LinearVariance: 1 × 101# Neurons: 4
C: 1# Layers: 3
Fit intercept: TrueEpsilon: 1 × 10⁻¹Length scale: 1 × 100Batch Size: 8
# Epochs: 500
TSRAlpha: 1 × 10⁻¹Kernel: RBFVariance: 1 × 10¹⁰# Neurons: 32
C: 1# Layers: 2
Fit intercept: TrueEpsilon: 1 × 10⁻³Length scale: 1 × 10⁴Batch Size: 8
# Epochs: 500
#: Number.
Table 8. Performance test prediction models’ metrics and rankings.
ParameterGLMSVRGPRFNN
MAERMSEMREMAERMSEMREMAERMSEMREMAERMSEMRE
(Rank)(Rank)(Rank)(Rank)(Rank)(Rank)(Rank)(Rank)(Rank)(Rank)(Rank)(Rank)
FN174.91257.80.243175.39254.3570.241162.36188.2550.262153.734185.1190.259
(3)(4)(2)(4)(3)(1)(2)(2)(4)(1)(1)(3)
CTindex22.71227.6640.17931.51136.510.20617.523.1540.12922.68228.4370.181
(3)(2)(2)(4)(4)(4)(1)(1)(1)(2)(3)(3)
TSR0.0270.0340.0350.0190.0250.0190.0240.0230.0290.020.0260.021
(4)(4)(4)(1)(2)(1)(3)(1)(3)(2)(3)(2)
Overall Rank3.1112.6672.0002.222
Table 9. Performance tests’ threshold surface equations.
ParameterThresholdEquation
FN (10 to 30 million ESALs)Low Bound0.265(WEO)2 +6.383(CR)2 − 2.436(WEO) − 55.100(CR) + 1.788(WEO)(CR) + 40.064 − min (RAP, 75) = 0
FN (more than 30 million ESALs)Low Bound0.028(WEO)2 − 1.059(CR)2 + 2.112(WEO) − 12.301(CR) + 1.363(WEO)(CR) + 45.545 − min (RAP, 75) = 0
CTindexHigh Bound−0.012(WEO)2 − 0.108(CR)2 + 4.571(WEO) − 2.959(CR) + 0.135(WEO)(CR) + 21.485 − min (RAP, 75) = 0
TSRLow Bound0.07(WEO)2 + 0.327(CR)2 + 0.158(WEO) − 9.923(CR) + 0.172(WEO)(CR) + 49.513 − min (RAP, 75) = 0
All three (10 to 30 million ESALs)Low Bound0.085(WEO)2 + 0.201(CR)2 + 1.376(WEO) − 5.863(CR) − 0.041(WEO)(CR) + 30.748 − min (RAP, 75) = 0
High Bound−0.012(WEO)2 − 0.108(CR)2 + 4.571(WEO) − 2.959(CR) + 0.135(WEO)(CR) + 21.485 − min (RAP, 75) = 0
All three (more than 30 million ESALs)Low Bound0.553(WEO)2 + 0.197(CR)2 + 0.610(WEO) − 4.093(CR) − 0.562(WEO)(CR) + 28.403 − min (RAP, 75) = 0
High Bound−0.012(WEO)2 − 0.108(CR)2 + 4.571(WEO) − 2.959(CR) + 0.135(WEO)(CR) + 21.485 − min (RAP, 75) = 0
Disclaimer/Publisher’s Note: The statements, opinions and data contained in all publications are solely those of the individual author(s) and contributor(s) and not of MDPI and/or the editor(s). MDPI and/or the editor(s) disclaim responsibility for any injury to people or property resulting from any ideas, methods, instructions or products referred to in the content.

