Article

An Analysis Framework to Reveal Automobile Users’ Preferences from Online User-Generated Content

1
Institute of Big Data Intelligent Management and Decision, College of Management, Shenzhen University, Shenzhen 518060, China
2
College of Management, Shenzhen University, Shenzhen 518060, China
*
Author to whom correspondence should be addressed.
Sustainability 2023, 15(18), 13336; https://doi.org/10.3390/su151813336
Submission received: 16 August 2023 / Revised: 31 August 2023 / Accepted: 4 September 2023 / Published: 6 September 2023

Abstract

:
This work attempts to develop a novel framework to reveal the preferences of Chinese car users from online user-generated content (UGC) and guides automotive companies to allocate resources reasonably for sustainable design and improve existing product or service attributes. Specifically, a novel unsupervised word-boundary-identified algorithm for the Chinese language is used to extract domain professional feature words, and a set of sentiment scoring rules is constructed. By matching feature-sentiment word pairs, we calculate car users’ satisfaction with different attributes based on the rules and weigh the importance of attributes using the TF-IDF method, thus constructing an importance-satisfaction gap analysis (ISGA) model. Finally, a case study is used to realize the framework evaluation and analysis of the twenty top-mentioned attributes of a small-sized sedan, and the dynamic ISGA-time model is constructed to analyze the changing trend of the importance of user demand and satisfaction. The results show the priority of resource allocation/adjustment. Fuel consumption and driving experience urgently need resource input and management.

1. Introduction

The birth of the modern automotive industry is an important symbol of human technological progress and socio-economic development. Cars not only provide people with various conveniences as a means of transportation but also play an important pillar role in the country’s economic development. Since the 21st century, cars have become indispensable to every family. Up to 2019, the number of car ownership per thousand people was 500–800 in developed countries, while this figure in China is only 173 [1]. In 2021, the number fell by 11. Considering the population size, regional structure and national differences in resources, the automobile sector in China still has large room for growth as people’s incomes continue to rise and urbanization gradually advances [2]. With the rapid development of technology and the continuous upgrading of consumer demand, the automotive industry is facing unprecedented challenges. Fierce market competition, changes in environmental protection policies and the impact of emerging technologies have made consumers increasingly cautious when choosing and purchasing cars [3,4]. In addition to considering their own needs and being influenced by automotive company advertisements, consumers will browse online user-generated content, which documents what other consumers feel after an in-depth experience driving a car [5]. It provides a higher level of credibility than merchant promotions and helps consumers make reasonable judgments when making purchasing decisions [6]. On the other hand, online user-generated content has design value for automotive manufacturers in social, economic and environmental aspects, addressing issues such as low utilization, high energy consumption and negative environmental impacts during the design process, promoting product iteration and upgrading, and affecting the sustainable development of the product [7,8]. Therefore, focusing on online user-generated content to explore sustainable design needs with high user satisfaction, as well as the core elements that are most sensitive to the sustainability value of products, is of great significance to major automotive brands and is also the focus of this paper.
Traditional methods for automobile companies to judge consumer preferences, like studying the annual sales of various types of new cars in major areas that typically only reflect users’ basic needs and their pre-purchase behavior, are not adequate to assess their experience needs after driving the cars, let alone adjusting product improvement orientation by identifying the problems found by experienced consumers. Some consulting companies investigate consumers’ preferences for cars through voice-of-customer (VOC) interviews. However, VOC research is labor- and time-intensive, and it is difficult to respond to the market in a timely manner. Most recently, researchers have paid attention to user-generated content (UGC), which is rich in customer opinion information [9]. UGC-based customer needs are proven to be comparable to VOC-based customer needs [6]. In the study of Artem et al. [10], analysts identified more customer needs from UGC than from interviews of a VOC study at a given cost of time and money. Prior studies also provide evidence that it is of great commercial value to mine customers’ shopping behavior patterns from user-generated information, e.g., [11,12,13]. These huge, disorganized and fast-updating UGC data contain real and diverse information on user needs. Therefore, it is quite practical to leverage UGC to identify the needs of Chinese car users. Most UGC research claps eyes on the online reviews of B2C platforms, where most of the product categories are fast-moving consumer goods (FMCG) with relatively short life cycles [14]. Compared with FMCG, non-fast-moving consumer goods, such as the automobiles we discuss in this paper, lead to different buying patterns. For example, Luo et al. [15] considered that non-FMCG is characterized by a low degree of homogeneity and thus, consumers have stronger loyalty to the brand. In addition, it is hard to find a B2C platform selling cars online because consumers always need to take their preferential products for a test drive and make deliberate decisions. Fortunately, the online vertical forum autohome.com provides convenient data access to Chinese consumer reviews. Different from comprehensive platforms (e.g., Amazon.com), vertical platforms focus on specific fields or specific needs and provide all the in-depth information and related services. As a new bright spot of the internet, vertical websites are attracting more and more people’s attention. Website autohome.com is an O2O model (online to offline, i.e., online booking and offline consumption)-based e-commerce vertical platform on which Chinese users can share their opinions on the cars they are driving. It not only provides buyers with reliable information on different cars and preferential prices for reference but also provides researchers who intend to study the Chinese auto market convenience to investigate consumers’ cognition, choices and consumer demands in the process of car maintenance and use. There are few fake reviews on such platforms because customers can tell their true experiences anonymously online without being worried about retaliation by offline merchants, and such review data is more authentic and reliable. Another benefit is that reviews on these forums do not involve logistics, sellers and other factors unrelated to product performance, filtering out irrelevant information for us. Therefore, mining customer preferences through UGC on such forums can be an important means of finding new business opportunities and attracting customers in China.
To address the problem that the importance of sustainable design requirements in the car conceptual design phase is difficult to assess accurately through traditional methods, a framework to reveal the preferences of Chinese car users from online user-generated content (UGC) is proposed for product improvement and resource allocation in this paper. Our approach is as follows: firstly, feature words are extracted from online reviews on the forum, and attributes are obtained by the classification of feature words. Then, the score of the attributes of each review is calculated by using the sentiment scoring rules we set, and then the importance-satisfaction gap analysis (ISGA) model is constructed. Although many related studies concerning customer needs apply similar methods and processes to other consumer goods and achieve good results [16,17,18], little attention has been paid to the automobile industry, particularly the Chinese market, which has huge consumption potential. First, user-generated content is not easy to access; only some surface data, such as sales, are available online. Second, the automobile industry is very professional, which involves a lot of professional words, and data processing is more difficult. Moreover, since our research subjects are Chinese people, the data are all in the Chinese language, which differs from English in that no character distinguishes the boundary of words (in English, space is the character to identify the boundary of a word). Research that uses reviews in other languages for data analysis is not adequate to make a conclusion for Chinese consumers. In our paper, we adopt the boundary-average entropy (BAE) algorithm to identify feature words of automobiles. The BAE algorithm was a newly proposed unsupervised algorithm by Liu [19] in 2016 for Chinese word segmentation and is still rarely known; however, it works well in this experiment. The extraction of feature words using the algorithm and the rules for calculating the score of attributes of each review are discussed in Section 3. By applying the method, we verify the feasibility of the BAE algorithm in building a professional feature word dictionary for a language in which the word boundary is ambiguous. Considering that time is a key context variable that can change the nature of a relationship, retrospective information is essential for a richer understanding. To investigate the evolution of users’ preferences in China, we take time into account to analyze the ISGA model.
The rest of this paper is structured as follows. Section 2 presents the literature review. Section 3 presents and evaluates the proposed method. Section 4 presents the empirical study and concludes the last section.

2. Literature Review

The first stream of literature related to our study is customer preference identification from online UGC. Since we use sentiment scoring as the basis of the users’ satisfaction calculation, we also review the sentiment analysis of product attributes with a focus on feature word extraction methods.

2.1. Customer Preferences Identification in the Automobile Industry

After more than 100 years of continuous improvement and innovation, the automobile embodies the wisdom and ingenuity of human beings, and thanks to the support of oil, steel, electronic technology, finance and other industries, it has realized today’s transportation tools with various types and different specifications, which are widely used in various fields of social and economic life. The development of automobile industry globalization is a systematic science that has risen to the height of national strategy and strategy between countries. More and more attention is being paid to the industry. According to the retrieval data from the Web of Science, as of 26 October 2021, 38,399 articles related to automobiles have been published on the database, and the number is increasing year by year. These studies largely cover the areas of vehicle designs and mechanical engineering that concern environmental problems, e.g., [20,21,22], driving safety, e.g., [23] and transportation science, e.g., [24], while there is lesser focus on the basic needs of car attributes for users, which are normally the major concern of enterprises. Most of the papers related to consumer preferences are research on pricing and decision models, e.g., [25]. However, these studies do not mine deeply into customers’ opinions on various automobile attributes, and most of the related cases focus on brand preference, technology preference and vehicle type preference. This paper hopes to have a more detailed understanding of customers’ preferences for specific vehicle attributes.
Customer needs are descriptions of the benefits that a product or service can achieve [26]. Many studies strive to propose methods to help companies quickly and accurately find out what customers care about and complain about [10,27,28,29,30], which share a similar purpose with this study. The most traditional way to uncover customer needs is the voice-of-customer study, which typically starts with a limited number of qualitative experiential interviews, of which the records will be transformed into scripts. Analysts will then review the scripts, manually identify what people are concerned about their products, move out redundancy and develop abstract customer needs statements, usually in the form of a hierarchical structure [31,32] (i.e., needs are organized in primary groups, secondary groups and tertiary groups, etc.). Such manual coding methods require extensive labor, and thus, the size of the sample analyzed is usually small and cannot be representative. The development of online user-generated content has brought about great interest among researchers in using big data and text-mining techniques to mine people’s opinions in different categories. Since one of our study aspects is to propose a method to identify Chinese car users’ preferences, we have developed Table A1 in Appendix A, which summarizes the research results of studies close to our research purpose of customer preferences mining based on the Web of Science. Among the fifty-eight studies, a large proportion of them use opinion mining techniques on the hotel industry and FMCGs; only five are related to automobiles. It is suggested that the research methods of customer demand or customer behavior for one product may not be applicable to other products [10,33]. In terms of the five automobile research studies, Kühl et al. evaluated eight previously defined customer needs for electric cars by applying a supervised machine learning method on German tweets [34]. Lee et al. chose Toyota Yaris as the case to study and designed a content analyzer based on co-occurrence analysis to find out the most important elements that the users in MForum care about [35]. Asghar et al. analyzed the sentiment of Twitter users towards Honda, Toyota, BMW, Audi and Mercedes using a naive Bayes classification method [36]. Sun et al. proposed a method for dynamically analyzing changes in customers’ sentiments toward the attributes of Trumpchi GS4 and GS8 [37]. In the study of Fang et al., Chinese feature words of cars were obtained based on one of the rules that the word is a noun in the lexicon of a Chinese word segmentation tool (i.e., Jieba) [38]. On this research basis, we have introduced a framework that identifies the preferences of Chinese automobile users.

2.2. Sentiment Analysis of Product Attributes

With the rise of the internet, people’s opinions and ideas began to be analyzed using natural language processing technology. Researchers value people’s attitudes and emotions on a topic, such as the degree of public support or opposition to the introduction of policies, in order to grasp the follow-up development and take corresponding control measures. In addition to politics, sentiment analysis is also used for commercial purposes. It can detect whether the trend of an aspect or attribute of a product or service is positive, negative or neutral. For example, this paper analyzes the satisfaction degree of car users in various attributes. Sentiment classification and the calculation of sentiment scores based on natural language processing are the two most common outputs in the field, which usually convert people’s comments about a subject on the internet into structured data. Sentiment analysis approaches are divided into three categories: (1) machine learning methods, (2) lexicon-based methods, and (3) hybrid methods. Research that is based on machine learning (ML) trains various well-known classifiers to determine emotional direction. For example, Rai et al. selected the best parameterized naive Bayes classifier to evaluate the sentiment polarity of live tweets, and it performed better compared to the random forest and support vector machine in terms of accuracy, precision and time consumption [39]. The lexicon-based approach includes a set of sentiment dictionaries used to express positive or negative emotions. For example, words like “good”, “nice”, “bad”, and “sad” are used to express positive and negative emotions, respectively. Dealing with lexicons allows us to analyze the polarity of the sentiment of sentences or documents. Sometimes, synonyms and antonyms are added to improve accuracy [40]. The novel hybrid methods of machine learning and lexicon dictionaries are becoming popular. In some of these research studies, e.g., [41], opinion words are first extracted from lexicon resources with the help of sentiment word identifiers like SentiWordNet and AFFIN-111, and then they are tagged by part-of-speech (POS). A machine learning classifier is finally used to identify the sentiments. Some research first calculates the sentiment scores of reviews and then determines the antecedents of dissatisfaction through the topic model, e.g., [31,42]. However, it has a defect: when an attribute appears frequently in a review, it will be regarded as a topic, even if the customer thinks it is positive. For example, a car review with a very low sentiment score wrote: “The only thing I am satisfied with about this car is the seat. The seat design is reasonable, in line with human mechanics, and comfortable for long-distance driving. But the air conditioning noise is too loud, which makes my family restless”. The negative attribute of this review is air conditioning; however, due to the high occurrence of the seat, the seat will be regarded as the topic. Therefore, not all topics obtained from low-score comments are negative topics, and vice versa. Our method first forms feature-sentiment word pairs according to the Chinese turning word and sentence separator to ensure that the sentiment word corresponds to the feature word. Each attribute in each comment is assigned a sentiment score instead of extracting topics, followed by calculating the score of a review.
Most of the current work generates lexicons with a set of dictionaries or word identifiers trained by the previous corpus. However, sentiment analysis of a corpus of emerging industries requires building lexicons by researchers to cover the lack of dictionary groundwork. High-technology industries like automobiles grow rapidly, and their professional terms are constantly updated. If feature words are extracted based on a previously defined lexicon, some new product feature words will be ignored, and it is difficult to comprehensively grasp an overview of the advantages and disadvantages of products. The most commonly used Chinese word segmentation system, Jieba, is based on string matching (i.e., the method based on a dictionary) and the hidden Markov model (HMM). Although, to a certain extent, HMM solves the problem of unlisted words, its string-matching priority rules will affect the segmentation of specialized domain words. The most common error is to cut long-string proper nouns into two or more entries in dictionaries. For example, “大众车 (Volkswagen car)” will be divided into two words, “大众 (general)” and “车 (car)”; however, the original meaning of “大众车” refers to the cars of Germany’s Volkswagen brand. Therefore, this paper proposes to use an unsupervised word-boundary-identified algorithm, namely the boundary-average entropy (BAE) algorithm, to solve the problem of unlisted word identification. This study answers the following three research questions. RQ1: How do we extract attributes from online user-generated content? RQ2: How do we calculate the satisfaction score and importance weight for each attribute? RQ3: How do we identify product improvement orientations and consider dynamic changes?

3. A Method to Identify Customer Preferences and Product Improvement Orientation

We propose a method to identify customer needs from Chinese UGC (especially online reviews) using four main techniques. Firstly, the BAE algorithm is used in lexical word extraction, which has been proven reliable and feasible in Chinese word segmentation but has not yet been widely used; this is applied in this study to help automatically extract feature words and sentiment words for specialized industries [19]. Based on the lexicon built from these words, we propose a set of matching rules to calculate the user satisfaction score for each product attribute, and the TF-IDF method is used to determine the user’s importance weights for each attribute, which is a metric used to reflect the significance of a word in a document [40]. Finally, product improvement directions are identified based on an importance-satisfaction gap analysis (ISGA) model to identify the direction of product improvement, where resources are rationally allocated to the attributes with higher importance weights, as well as to consider the dynamic changes over time. Figure 1 shows the flowchart of the process [43]. In this framework, the methods chosen for the different steps are fully utilized to their advantage. The evaluation session at the end of this section shows the superiority of the performance.

3.1. Chinese UGC Data Collection and Data Cleansing

As the research object of this paper is the Chinese consumer group, the data collected are all Chinese user-generated text. The longer the total number of characters, the better the result of subsequent lexicon building. The data cleansing procedure in this paper is relatively simple and slightly different from other studies in that we do not remove stop words, which the following training requires. All non-Chinese characters are removed, including punctuation marks and transposes. Next, all sentences are concatenated into a long string containing only Chinese characters as a result of this step.

3.2. Word Segmentation and Feature Words Extraction
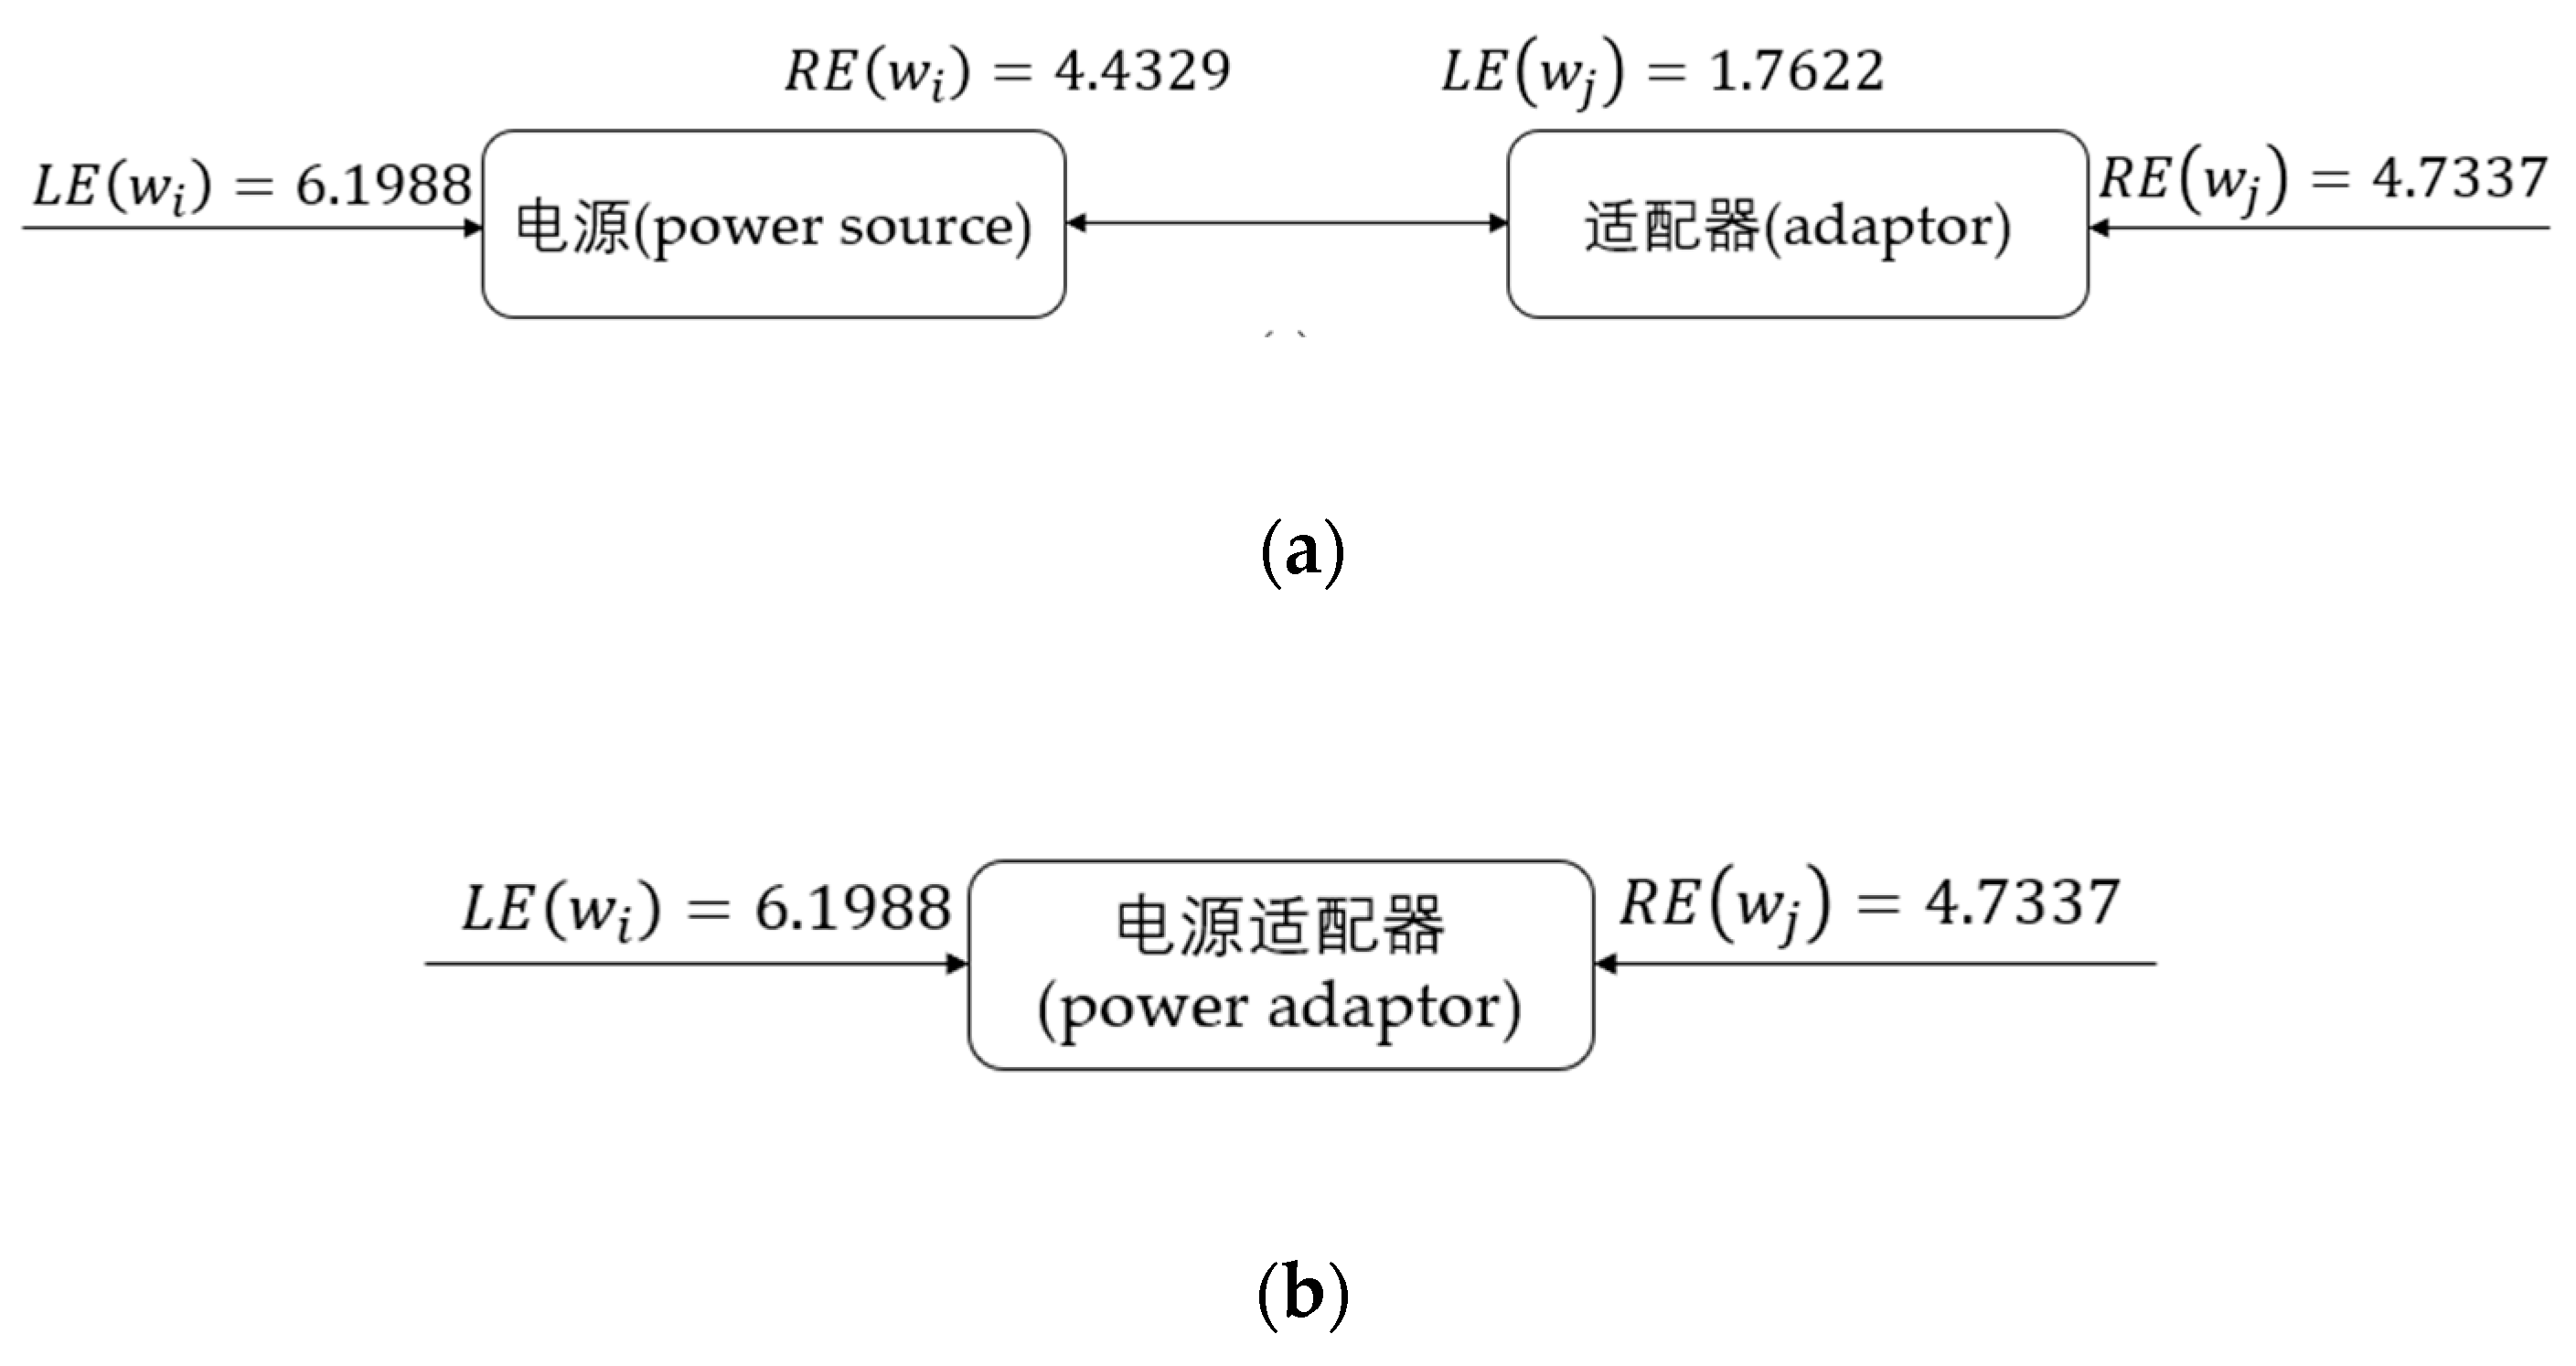
We obtained a long string consisting of many Chinese characters in step 3. 1. To identify which two or more consecutive characters can form an independent word in the language environment, we then applied the BAE algorithm, which is designed based on the principle of comparing the information entropy of concatenating strings before and after determining the word boundary. “Information entropy” stands for the average amount of information contained in the received information without redundancy, which can represent the uncertainty of an event. Assume that for the discrete variable X, its value range is { x 1 , x 2 , , x n } , and the corresponding probabilities are { P ( x 1 ) , P ( x 2 ) , , P ( x n ) } , then the “information entropy” of the variable is:
H ( X ) = i = 1 n P ( x i ) log P ( x i ) .
The BAE algorithm first defines the left and right information entropy L E ( s ) and R E ( s ) of a string s according to the information entropy:
L E ( s ) = l L P ( l s | s ) log P ( l s | s ) ,
R E ( s ) = r R P ( s r | s ) log P ( s r | s ) ,
where L and R , respectively, represent the set of word string elements adjacent to the left and right of character s in the corpus. P ( l s | s ) represents the conditional probability that the left-adjacent string is l when the string s occurs, and P ( s r | s ) represents the conditional probability that the right-adjacent string is r when the string s occurs.
Assuming that the current string is w i (the string length of w i can be several Chinese characters but has an initial length of 1), its boundary-average entropy is:
B A E ( w i ) = 1 2 [ L E ( w i ) + R E ( w i ) ] .
The boundary-average entropy of two consecutive strings w i and w j is:
B A E ( w i w j ) = 1 2 [ B A E ( w i ) + B A E ( w j ) ] .
Similarly, the boundary-average entropy of three consecutive strings w i , w j and w k is:
B A E ( w i w j w k ) = 1 3 [ B A E ( w i ) + B A E ( w j ) + B A E ( w k ) ] .
Next, the function f ( W , n ) that determines whether the string W made up of w 1 ,   w 2 ,   ,   w n can form a word is defined as follows:
f ( W , 1 ) = { 1 , f r e q ( w i ) > α 1 0 , e l s e ,
f ( W , 2 ) = { 1 , f r e q ( w i w j ¯ ) α 2 & & B A E ( w i w j ¯ ) > B A E ( w i w j ) 0 , e l s e ,
f ( W , 3 ) = { 1 , f r e q ( w i w j w k ¯ ) α 3 & & B A E ( w i w j w k ¯ ) > B A E ( w i w j w k ¯ ) > B A E ( w i w j w k ) 0 , e l s e ,
where f r e q ( W ) is the frequency of string W in the corpus, and α 1 , α 2 and α 3 are the parameters we set before training. When the function value is 1, it indicates that the string W consisting of n strings w 1 ,   w 2 ,   ,   w n might be a word in the corpus, or is 0 otherwise. When there is a line over multiple strings (for example, w i w j ¯ ), they are treated as one string, and the dimension of n decreases. Calculating the f ( ) function of each consecutive combination in the long string obtained in step 3.1 yields one-character, two-character and three-character words. Basically, two iterations are sufficient for the Chinese language. In this way, we can obtain specific or unlisted words in the field of study, which cannot be accomplished by other word segmentation methods based on dictionary matching. To illustrate, with “电源 (power source)” and “适配器 (adaptor)” represented by w i and w j , respectively, and the 2-g string “电源适配器 (power adaptor)” as a potential word. Figure 2 shows the determining process and the left and right information entropy L E ( w n ) and R E w n of words:
  • According to Figure 2a:   B A E ( w i w j ) = 6.1988 + 4.4329 + 1.7622 + 4.7337 4 = 4.2819 ;
  • According to Figure 2b: when w i and w j combine to become “电源适配器 (power adaptor)”, B A E ( w i w j ¯ ) = 6.1988 + 4.7337 2 = 5.4557 .
Since B A E   ( w i w j ¯ ) > B A E ( w i w j ) , indicating that the boundary-average entropy of the combined string is higher, “电源适配器 (power adaptor)” can be adopted as a new word to extend the original lexicon.
Next, we use the part-of-speech tagging model of the Tsinghua University Lexical Analyzer for Chinese to code the part-of-speech of each word. The words we need in the next step are nouns, adjectives, verbs, adverbs and unknown words. Normally, the words coded as “unknown” are unlisted words that do not exist in the dictionary of common tokenizers and are possibly newly emerging words. After manually abandoning some of the words irrelevant to the attributes of the product (e.g., one may write in an oral care review that “my wife likes the make-up mirror”, where “wife” is not one of the product attributes and does not contain useful information for product development and therefore it should not be included in the following analysis), we classify all the remaining nouns into several major attributes and these nouns are feature words. In some work, the classification of feature words is realized by clustering or word co-occurrence. We perform this manually for higher accuracy, and it does not take much time and effort because a product usually does not have too many feature words people care about. Determining whether a word is a feature word costs less effort than determining the attribute it belongs to.

3.3. Calculating the Satisfaction Score and Importance Weight for Each Attribute

To measure the users’ satisfaction with attributes, we first score their sentiment. There are three important points to note when calculating the sentiment score of attributes for each review. First, what attributes are mentioned in the review (Q1)? Second, if an attribute is mentioned (i.e., there are corresponding feature words in the review), is the customer’s attitude positive or negative (Q2)? Third, how strong are the customer’s feelings (Q3)?
In order to better display the sentiment scoring rules, Table 1 is constructed on the basis of the three questions: In review i , attribute j should have the positive and negative sentiment scores of both 0 if it is not mentioned ( a t t i j p o s = 0 ,   a t t i j n e g = 0 ). To judge one’s attitude towards the attributes mentioned, we built a sentiment dictionary consisting of the adjectives (i.e., “优秀 (excellent)”, “时尚 (fashionable)”, “物有所值 (worthy)”) and verbs (i.e., “喜欢 (like)”, “满意 (satisfy)”, “讨厌 (hate)”) we obtained in step 3.2 and classified them into positive and negative sentiment words. Then, we judged whether the sentiment word that is adjacent to the feature word f i j is positive or negative and marked the score as a t t i j p o s = f i j p o s = 1 and a t t i j n e g = f i j n e g = 1 , correspondingly. If there are any privative elements like “几乎不 (hardly)” or “没有 (no)”, the score should multiply k w ( p r i i k ) , which is 1 if the number of privative words k is even, or −1 otherwise. Adverbs are used to measure how strong the sentiment is. Compared with feature words and sentiment words, degree adverbs, as auxiliary components in sentences, have almost no difference in different fields. We, therefore, refer to the mature scale of HowNet to divide the polarity of emotion into four levels (see examples in Table 2). Then, the score multiplies t A d v i t , where A d v i t is the score of the level of the adverb t in review i .
Before applying the sentiment scoring rules for each attribute in a review, we need to process the review sentences. First, most of the reviews are not just talking about one attribute; therefore, it is important to separate each feature-sentiment word pair. We divide each review into several sentences by commas, full stops and other typical sentence separators. Chinese is different from the Germanic languages in which subject, predicate and object constitute a strictly self-contained sentence. The Chinese comma often serves as sentence boundaries. In addition, adversative words and conjunctions (words like “but” and “and”) interfere with subsequent feature-sentiment word matching and, therefore, we treat them as follows: if there is a complete feature-sentiment word pair before and after the disturbance terms (for example, in the review, “空调十分凉快但是窗户太小了 (The air conditioner is really cool but the windows are so small)”, there are two feature-sentiment word pairs: “空调-凉快 (air conditioner-cool)” and “窗户-小 (window-small)” separated by the word “但是 (but)”; thus, we treat the disturbance terms as separators and divide one sentence into two. If the feature words only appear in the preceding part of the disturbance term, we add the feature words mentioned above after it and then cut it. For example, in the review, “窗户看起来很干净但是有点小 (the window looks very clean but a little bit small)”, there is no feature word after “但是 (but)” and, thus, we add another “窗户 (window)” to it so that it forms two feature-sentiment word pairs: namely, “窗户-干净 (window-clean)” and “窗户-小 (window-small)”. Each Chinese sentence obtained in this way will finally contain only one feature word and one sentiment word, and the score can be calculated by the sentiment scoring rules mentioned above. If several sentences of a review discuss the same attribute and hold with the same attitude, we end up with the highest score, and finally, we obtain the matrix-like Table 3.
In this study, we measure the performance of an attribute by the following method. As long as a review contains one of the feature words of this attribute, no matter how many there are, we will calculate it as 1. By adding all the 1s together, we obtain the number of reviews mentioning this attribute, and we mark this figure as j . The satisfaction scores of the attributes are calculated based on the sentiment scores of the attributes in each review, which we have already learned in Section 3.3. We sum up the positive and negative scores for each attribute by adding Table 2 vertically and obtaining [ a t t 1 p o s , a t t 2 p o s , , a t t n p o s , a t t 1 n e g , a t t 2 n e g , , a t t n n e g ] . The equation for calculating the performance of each attribute p e r j and the adjusted metrics after rescaling to [0, 1] A d j u s t e d P e r j are expressed as follows:
p e r j = a t t j p o s a t t j n e g f r e q j ,
A d j u s t e d P e r j = p e r j min j p e r j max j p e r j min j p e r j .
To determine the users’ importance weight for each attribute, we apply the TF-IDF method, which is a metric used to reflect the significance of a word in a document [40]. TF-IDF is generated by two metrics: namely, term frequency (TF) and inverse document frequency (IDF). The former represents the total number of a specific word that occurs in the document, while the latter is designed to attenuate the effect of meaninglessness resulting from a too-high occurrence. Mathematically, given a product p , a product collection P , for an attribute j , the T F , I D F and i m p that determines the importance weight of the attribute are defined as:
T F j = | f j | j | f j | ,
I D F j = log | f j | 1 + | { p P : f j d p } | ,
i m p j = T F j × I D F j ,
where f j are the feature words of attribute   j , and d p   is the text document of p .

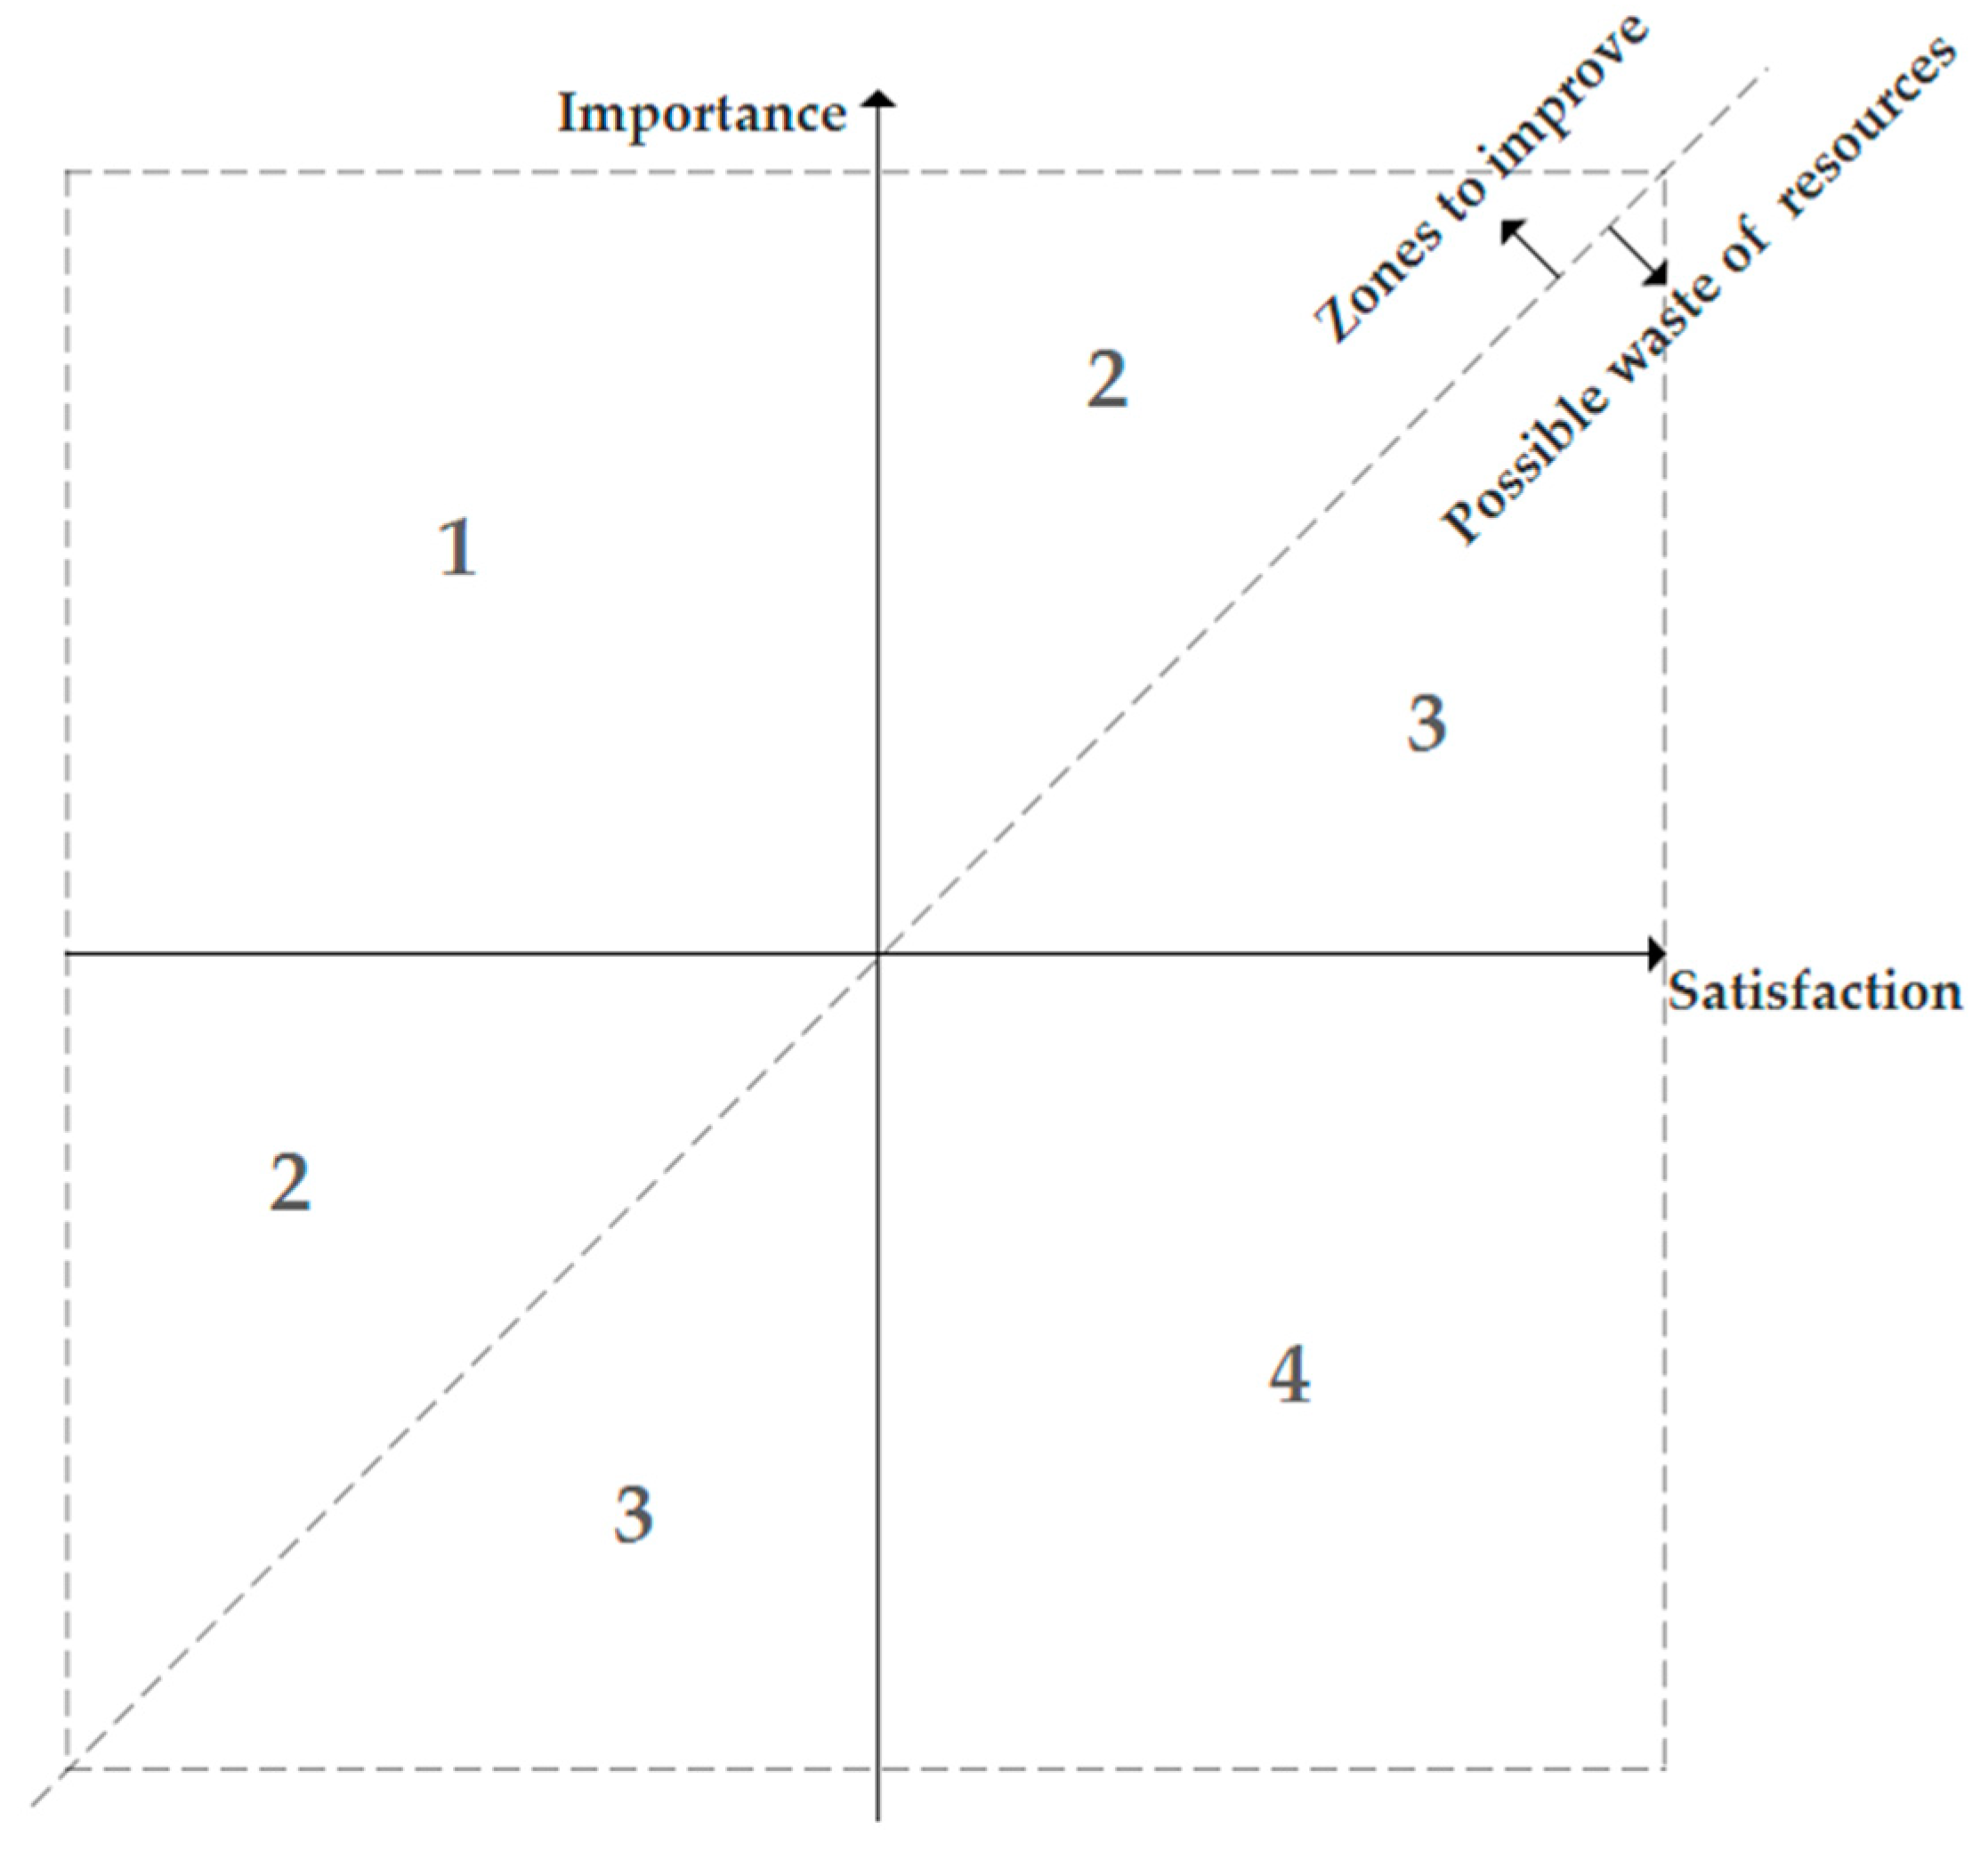
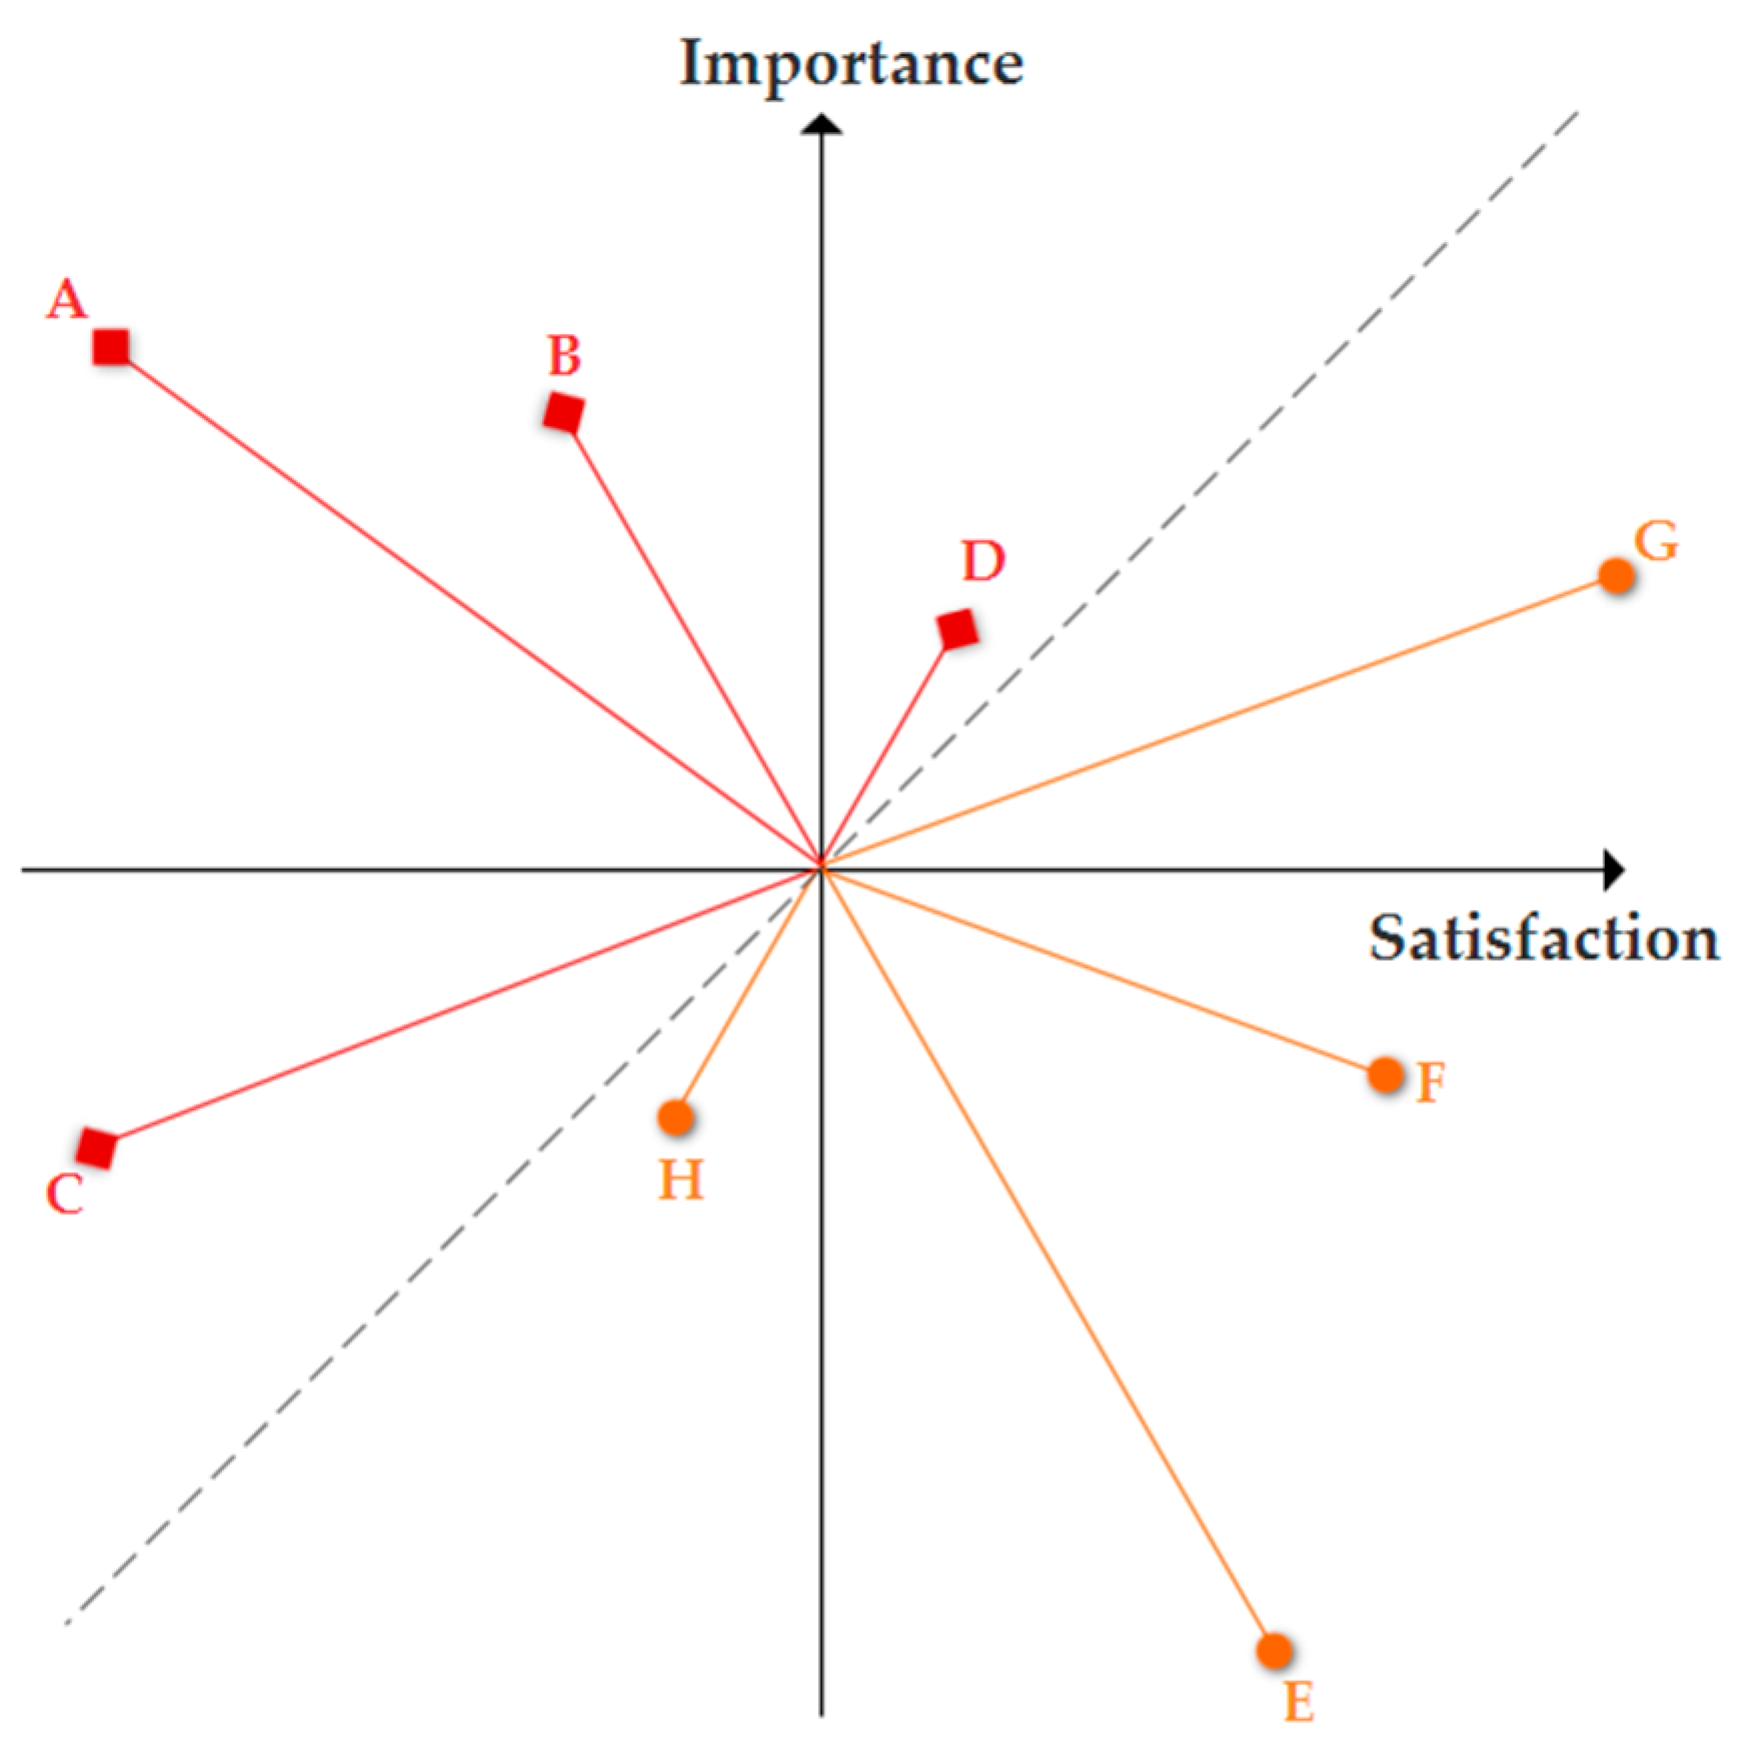
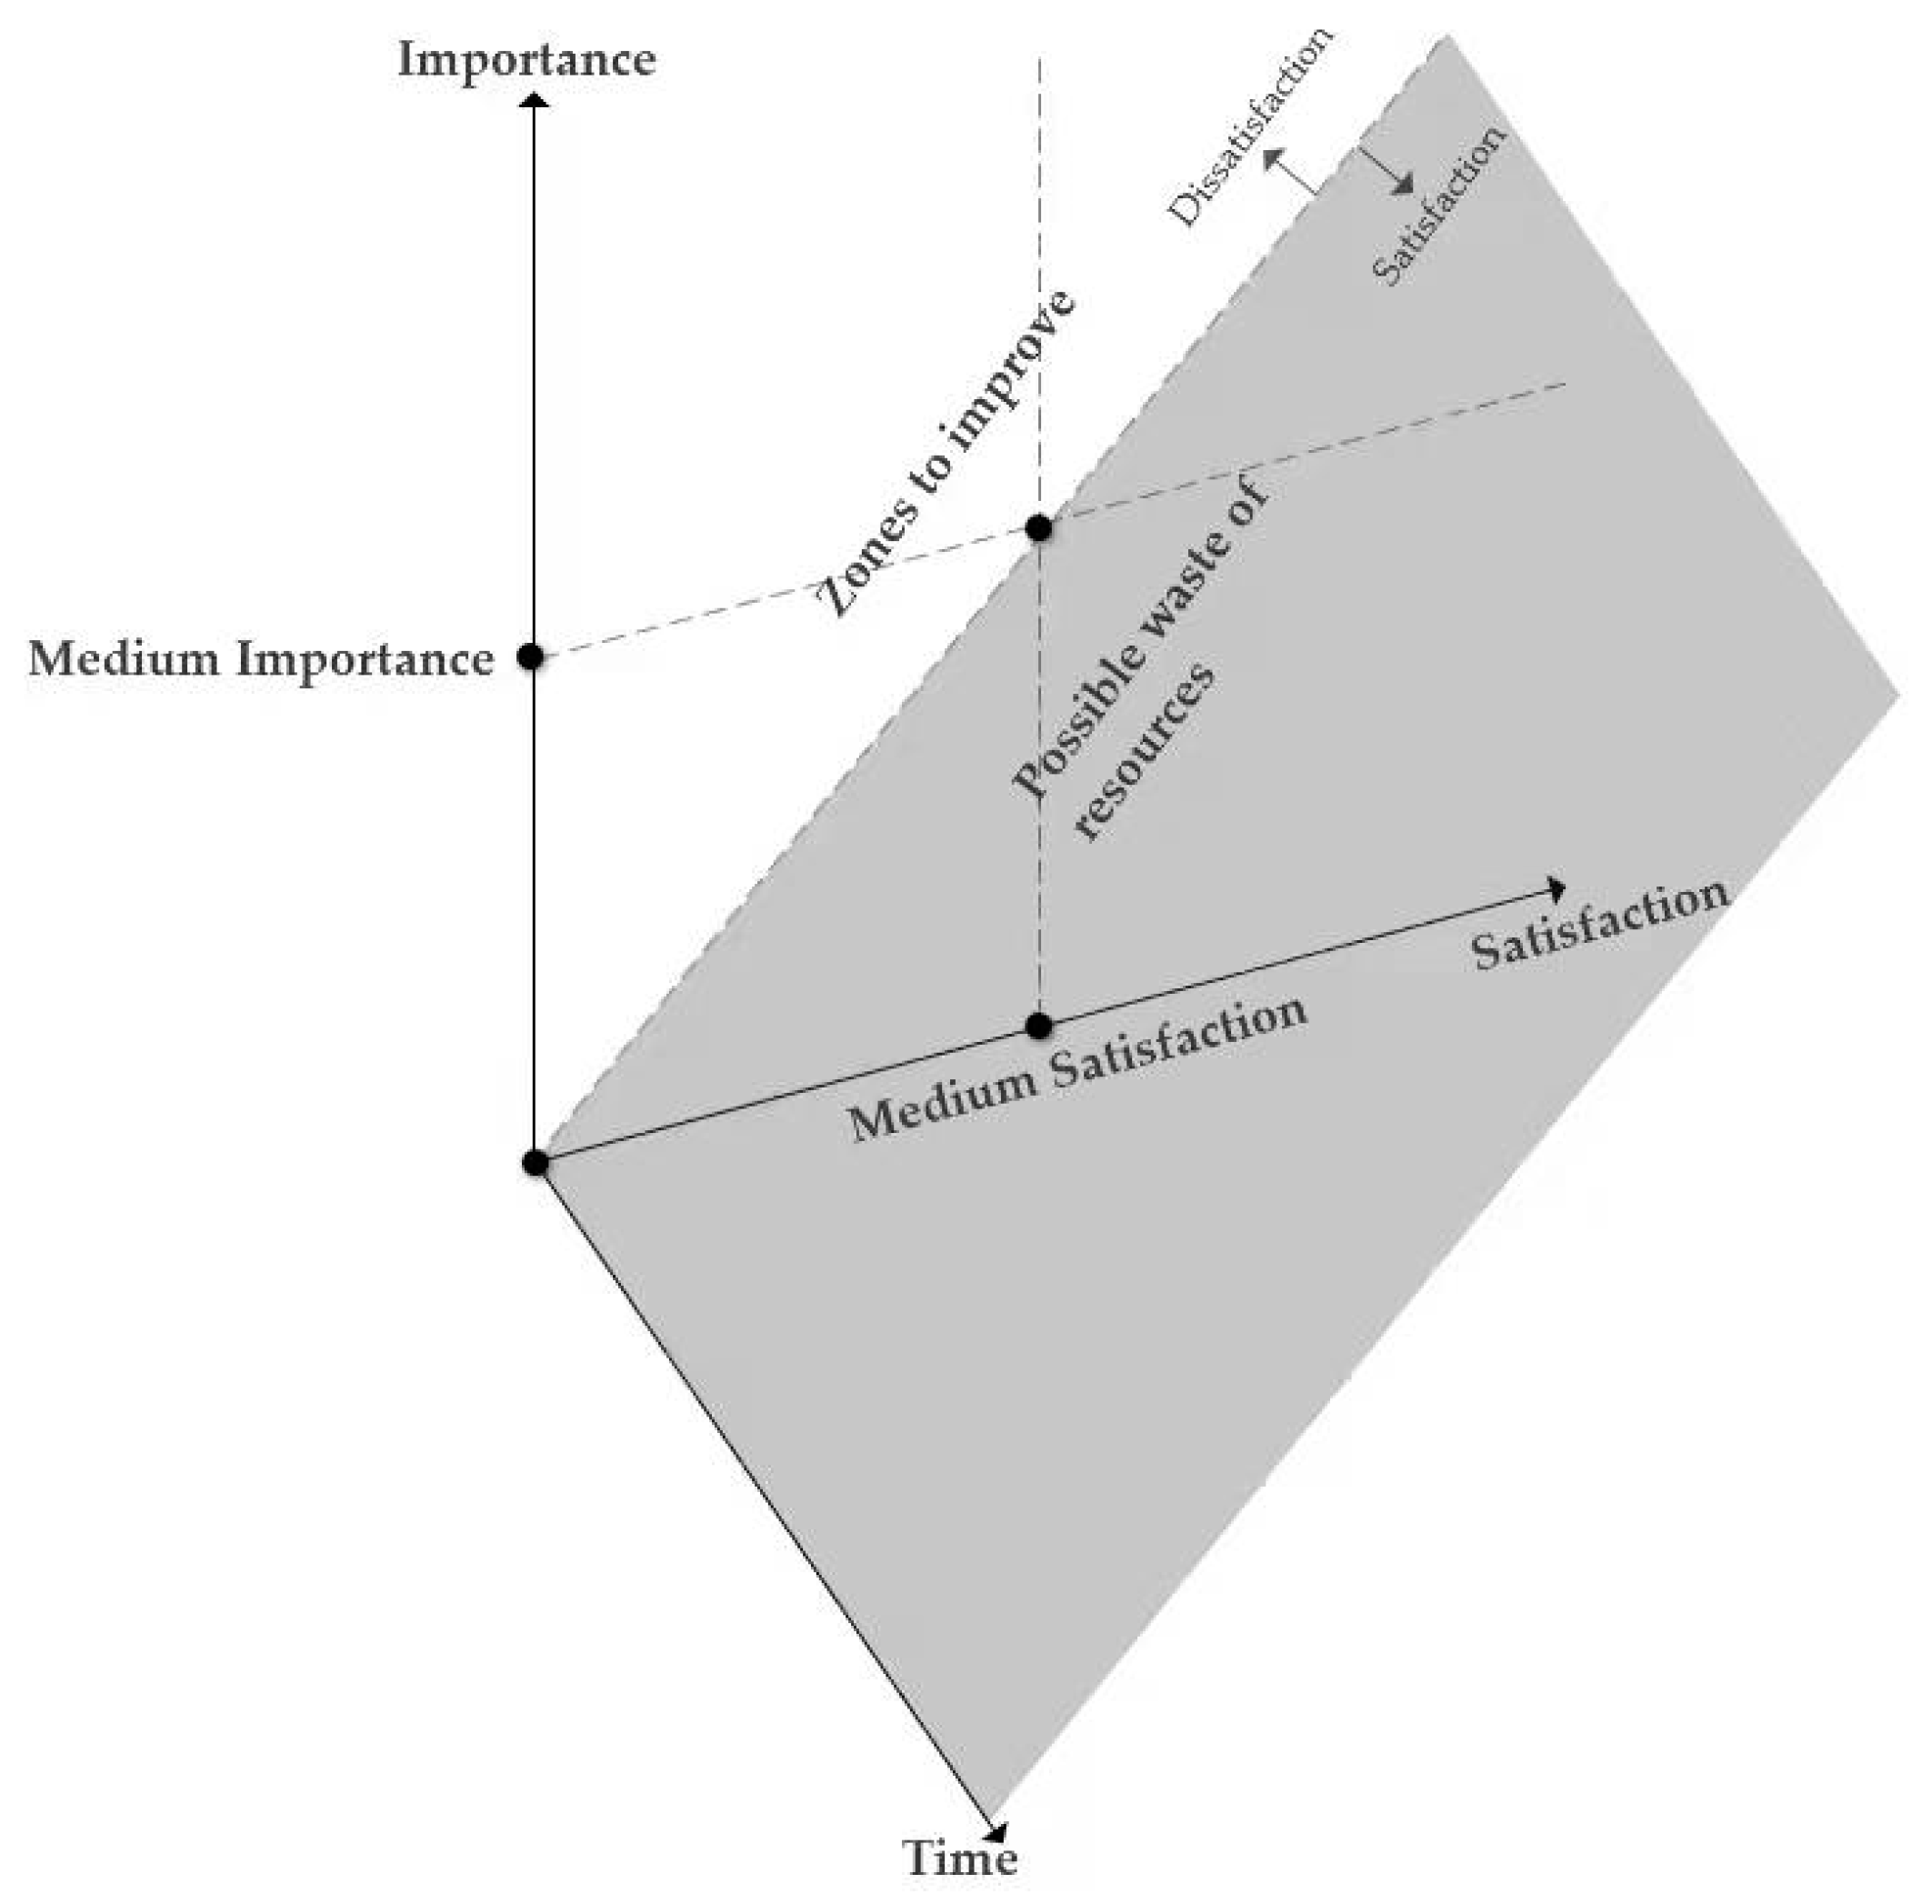
3.4. Product Improvement Orientation Identification

The satisfaction score of the attributes we obtained by matching feature words, sentiment words and other auxiliary terms can tell manufacturers the strengths and the weaknesses of their products so that they have a correct direction on what areas need to be maintained and improved to increase customer satisfaction. However, resources are always limited, and therefore, manufacturers have to wisely allocate them to those with a higher importance weight, which is the core of the importance-performance analysis (IPA) model [43].
In this study, we refer to the adjusted IPA model, which integrates gap analysis to better understand the priorities for corrective product improvement actions and develop the importance-satisfaction gap analysis model (ISGA model). Figure 3 shows the basic zone distribution of the model. The median value of importance weight and the median value of satisfaction score are used as coordinate cross-sections. To avoid subjective bias due to the evaluation of the cross-section of coordinates, a diagonal line at an angle of 45° is added, where the values of satisfaction and importance are equal (no gap). As shown in the figure, the four quadrants are re-divided into four zones. Zone 1 and Zone 2 contain elements that should be allocated resources from Zone 3 and Zone 4. Zone 1 is the same as the second quadrant, where the elements have high importance but low user satisfaction. Zone 2 consists of the two triangles of the first and the third quadrants above the diagonal line. Elements within Zone 1 have higher resource allocation priorities than elements within Zone 2, i.e., where attention should be paid first. Zone 3 consists of the two triangles of the first and the third quadrants below the diagonal line. Zone 4 is the same as the fourth quadrant, where importance is low but possibly over-performs. The elements in Zone 4 have a higher resource adjustment priority in relation to those in Zone 3. For each zone, the distance between the element and the coordinate of the intersection determines the resource allocation/adjustment priorities for actions. Suppose the cross-section of the coordinate is ( x M , y M ) , we measure the distance between M and the element ( x * ,   y * ) using the Euclidean distance formula:
d ( * ) = ( x * x M ) 2 + ( y * y M ) 2 .
For example, in Figure 4, for the elements in Zone 1 and Zone 2, the priority for resource allocation is A > B > C > D; for the elements in Zone 3 and 4, the priority for resource adjustment is E > F > G > H.
Considering that dynamical changes in the importance-satisfaction-gap provide insights into the evolving trends of users’ preferences, we divide the data by different periods. Then, a 3D ISGA-time model is constructed with time as the x-axis, customer satisfaction (attribute performance) as the y-axis and attribute importance as the z-axis; see Figure 5. The shaded bevel separates the zones to improve zones that possibly waste resources. The evolvement of the consumer preferences of attributes and product improvement orientation thus can be learned through analysis. A specific discussion will be presented in the next section of our application on the automobile market.

3.5. Evaluation of the Method

In order to evaluate the proposed method, we measure it from three aspects: the word segmentation performance of the BAE algorithm, the accuracy of the feature-sentiment word pair matching and the accuracy of the emotional direction of sentiment words.

3.5.1. Word Segmentation Performance

A total of 100 reviews of the 5171 reviews used in the case study were randomly selected to evaluate the word segmentation performance. We manually took the word segmentation of 100 reviews and counted them as the correct result. We compared the word segmentation results of the 100 reviews obtained by Jieba, THULAC and the BAE algorithms in Table 4 (it should be noted that the BAE algorithm obtains the words based on the corpus of the whole set of reviews, not only the 100). In this paper, three of the most commonly used indicators, precision, recall and F 1 of the second international Chinese word segmentation assessment are adopted. The calculation methods are as follows:
Precision = the   number   of   words   correctly   segmented total   number   of   words   segmented × 100 % ,
Recall = the   number   of   words   correctly   segmented the   real   total   number   of   words × 100 % ,
F 1 = 2 × Precision × Recall Precision + Recall × 100 % .
The results of the different word segmentation methods are shown in Table 4. It can be seen that the BAE word segmentation algorithm performs the best in all indicators.

3.5.2. Matching Accuracy Rate of Feature-Sentiment Words

To calculate the satisfaction score of each attribute, we automatically matched the sentiment words for each feature word in each review based on sentence delimiters, Chinese transitional words and conjunctions. There may be two types of errors in this method: (1) the sentiment words are matched by a feature word that belongs to others, or (2) there are sentiment words for a feature in the sentence, but no match is found. We first manually identified the feature-sentiment word pairs of 100 reviews and then compared the results with those obtained in Section 4.2. The number of feature words correctly matched is 1060, and the total frequency of feature words is 1324. Therefore, the accuracy rate is approximately 80.06%. Considering the high cost of manual recognition, the overall performance of this method is relatively good.

3.5.3. Evaluation of Accuracy Rate of Emotional Direction

The plus–minus of satisfaction may be wrong, even if the feature-sentiment words match correctly. The collocation of the same sentiment word with different feature words may be positive or negative. Even two feature words with the same attribute, such as “价格 (price)” and “性价比 (cost performance)”, which belong to the same attribute, when matched with the sentiment word “低 (low)”, the emotional direction will be different. Therefore, we further investigated whether the correct emotional direction was given to the sentiment words matched by the feature words under an attribute when calculating the satisfaction score of an attribute in each review. Among the 1060 feature words correctly matched with sentiment words, 955 of them were correct in emotional direction, with an accuracy rate of 90.09%.

4. Empirical Study on The Automobile Industry

4.1. Product Improvement Orientation Identification

In this section, we illustrate the proposed product improvement orientation analysis method in the field of automobile online reviews and gain insight into the challenges and opportunities of the Chinese automobile market. With the method proposed above, we used the content generated by automobile users from autohome.com to address three concerns: Which attributes are most important to automobile users? How satisfied are the automobile users with these attributes? How does the consumers’ satisfaction with these attributes and attribute importance change over time?
The products under study should be as similar as possible in function and price so that the manufacturers can compete with similar producers with limited resources. A total of 5171 data were collected from autohome.com for a small-sized sedan. Its purchase price ranges from RMB 60,000 to RMB 80,000 (around USD 9400 to USD 12,600). It came onto the market in 2017 and was still for sale at the time when this study was conducted in December 2021. All the review contents are written in Chinese.

4.2. Feature Words Identification

In this study, the main tool we used for data processing was Python 3.8.5. By removing all the non-Chinese ideographs from the reviews and concatenating the remaining elements, we obtained strings of 1,086,924 Chinese characters. After identifying words by iterating the BAE algorithm twice with α 1 = 5 , and α 2 , α 3 = 3 and tagging, we only left nouns, adjectives, adverbs, verbs and unknown words.
Two participants with the experience of driving a car were asked to identify feature words from the nouns. They were told that the feature words must be related to the attributes of the car. Any words like “reason” or “family” that do not contain information on product development should not be regarded as feature words. For the words that the two people held different opinions, we asked a third participant to judge it again. There are not as many professional words as there are everyday words; therefore, the time for coding was only approximately 2.5 h (less than 3 s for a word on average) for each participant. And finally, a total of 314 words were identified as feature words. Since some of the feature words belonged to the same attribute, we finally sorted out 119 attributes. Therefore, some attributes are made up of several feature words. A sentiment dictionary was built on adjectives and verbs. The construction of the sentiment dictionary needs to judge whether the word is a sentiment word and its emotional direction. There are only two categories of emotion direction, i.e., positive vs. negative. In the Chinese language context, neutral words always express a tinge of dissatisfaction. For unregulated feature words that point to an adverse direction of emotion when using the emotional matching rules, we built another sentiment dictionary for them. Following the rules proposed in Section 3.3, for each attribute of the car, the satisfaction scores were determined using the sentiment scoring rules, and the importance weights were calculated using the TF-IDF method.

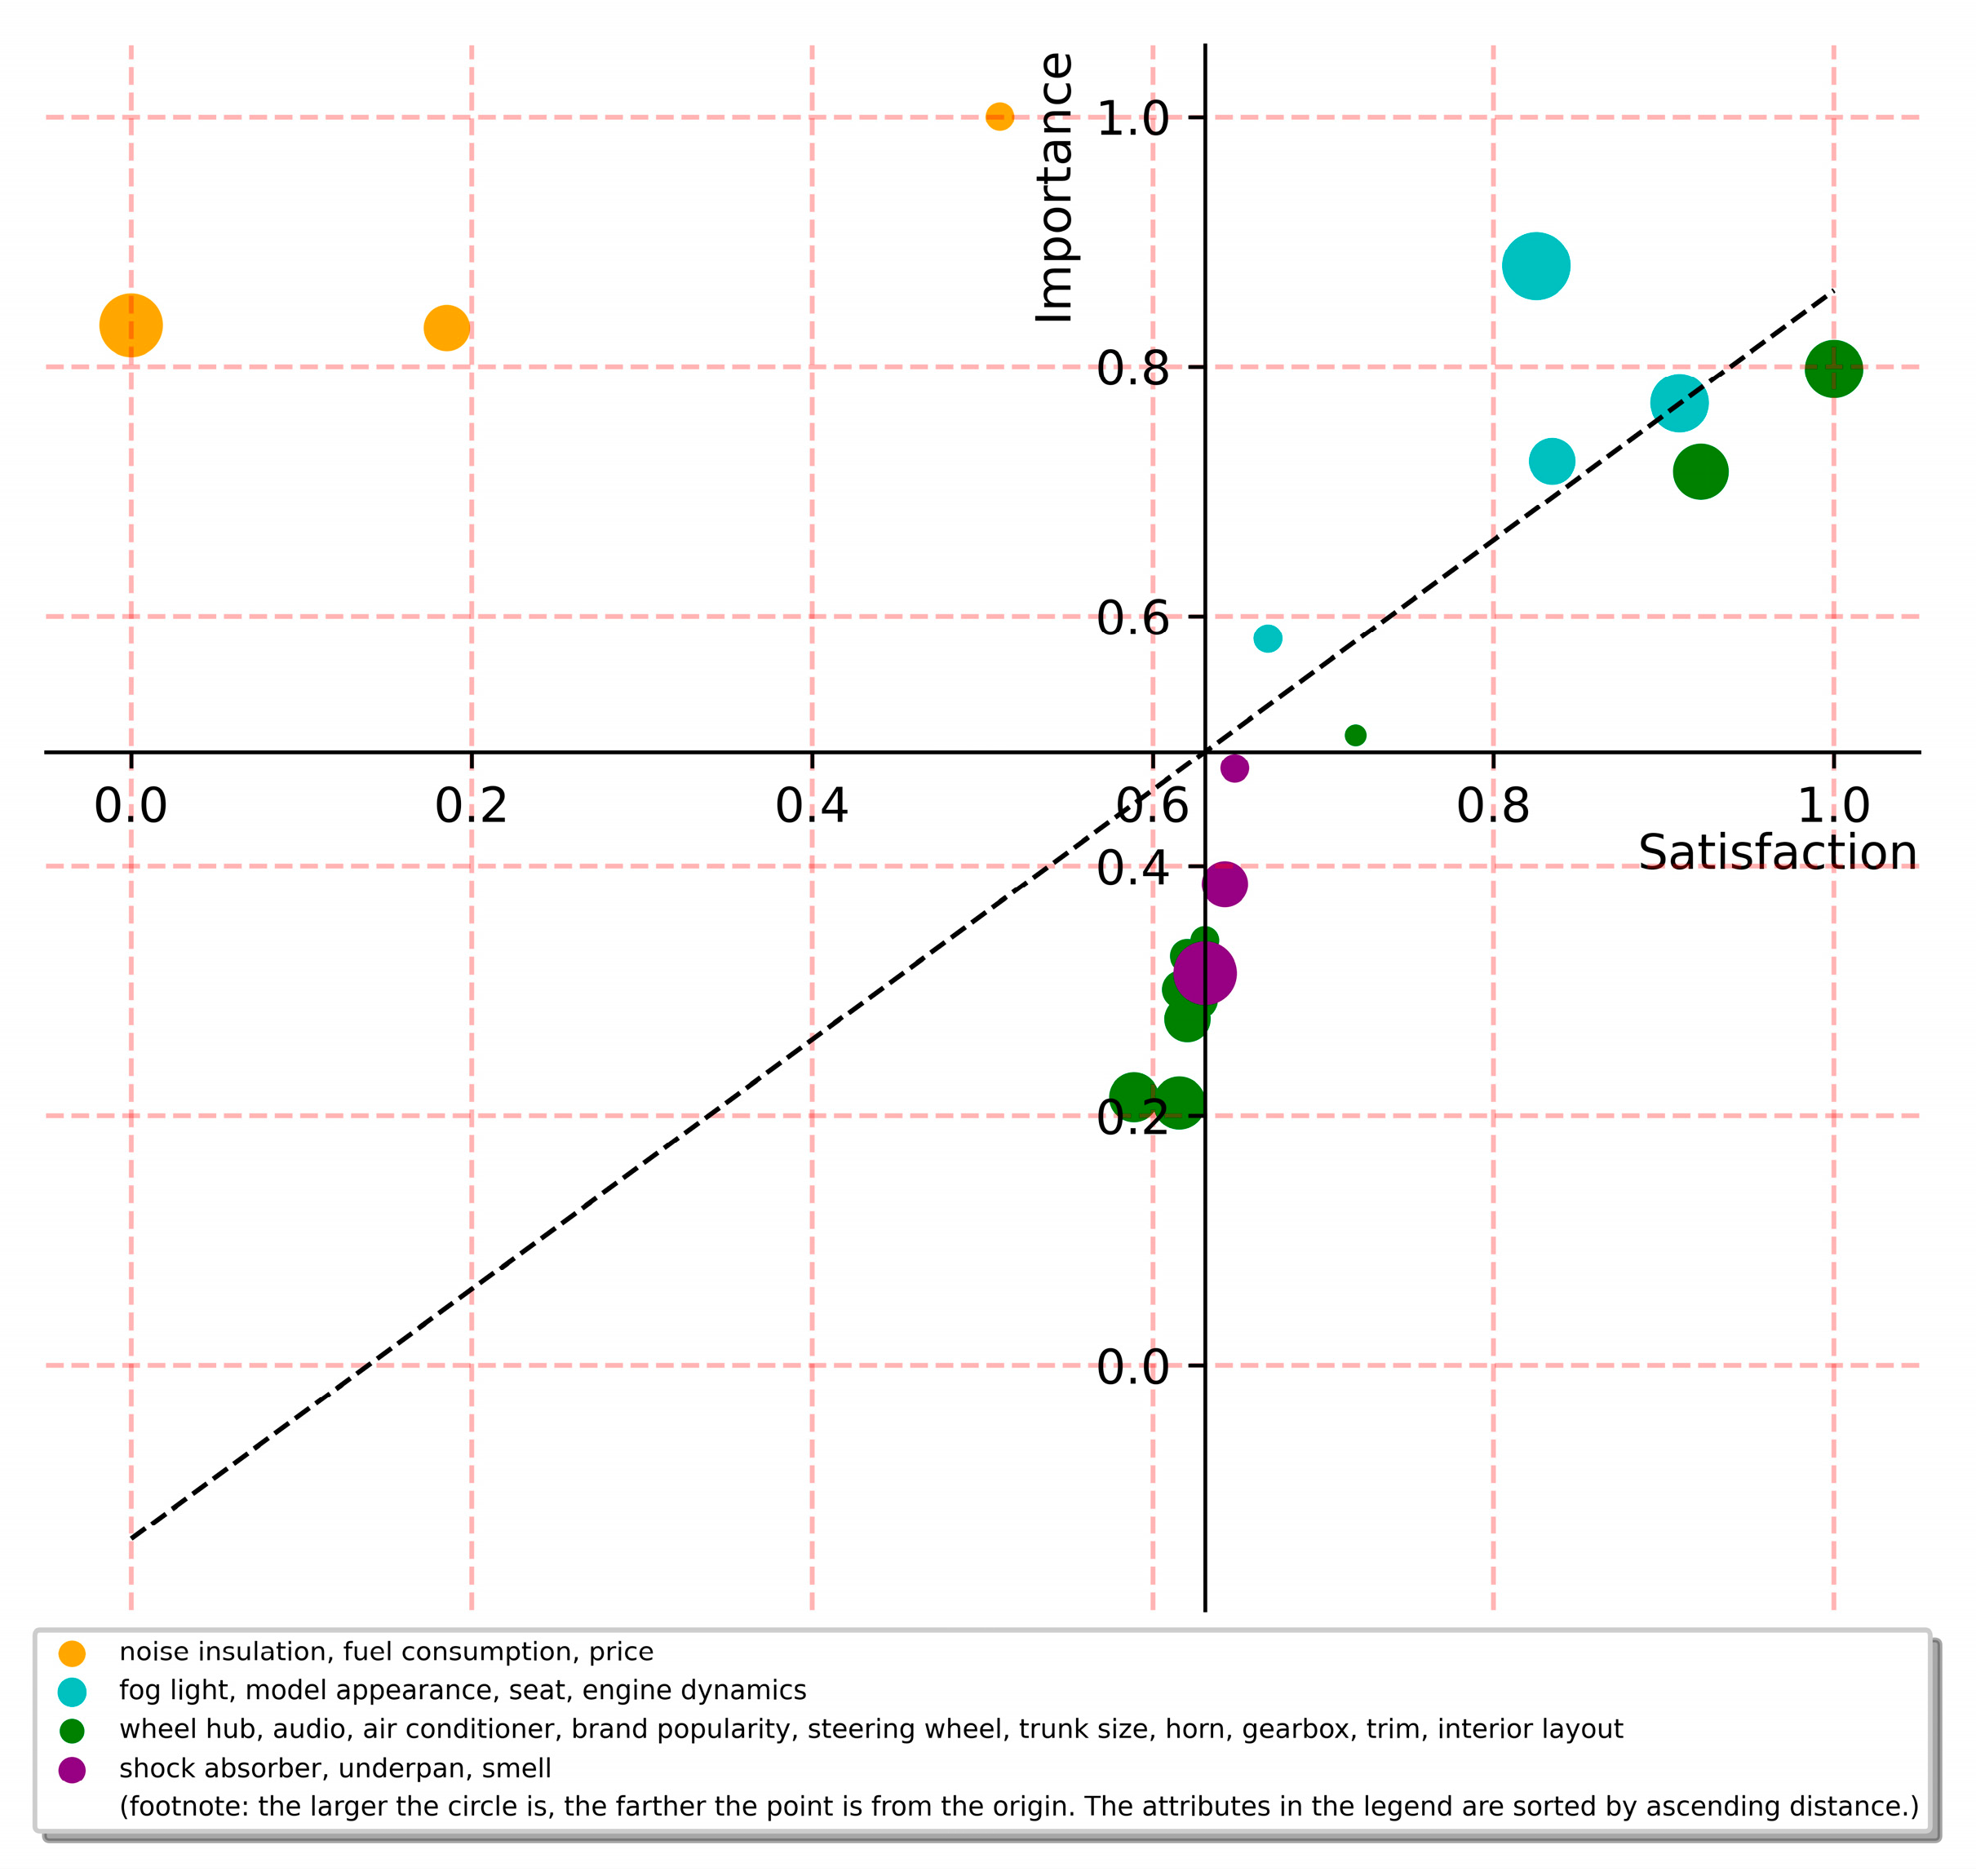
4.3. Importance-Satisfaction Gap Analysis

Due to space limitations, only twenty top-mentioned attributes were selected for the importance-satisfaction gap analysis in this part. Based on all the reviews, we drew an ISGA map for the car. With users’ satisfaction as the horizontal axis, importance as the vertical axis, and the median of both as the origin, the coordinate matrix was established. We added a 45-degree slash to each of the four zones to indicate the different resource allocation/adjustment priorities. The upper-left zone (Zone 1) is the one that requires the most attention, and the lower-right zone (Zone 4) element is the one where attention can be reduced.
Figure 6 shows that price, fuel consumption and sound insulation in Zone 1 are the attributes that users of this small-sized sedan consider very important but are not satisfied with. Among them, price is furthest from the origin, which is the attribute that needs the most attention. Fog light, the model’s appearance, seat and engine dynamics are distributed in Zone 2, and they can be improved after considering the resource allocation of Zone 1’s attributes. Shock absorber, underpan and smell are in Zone 4, indicating that they are over-resourced and that manufacturers can reduce their resource investments in these attributes and switch to Zone 1 and Zone 2 attributes. Wheel hub, audio, air conditioner, brand popularity, steering wheel, trunk size, horn, gearbox, trim and interior layout are attributes of Zone 3. Manufacturers can adjust their resources in this zone after adjusting their resources in Zone 4.

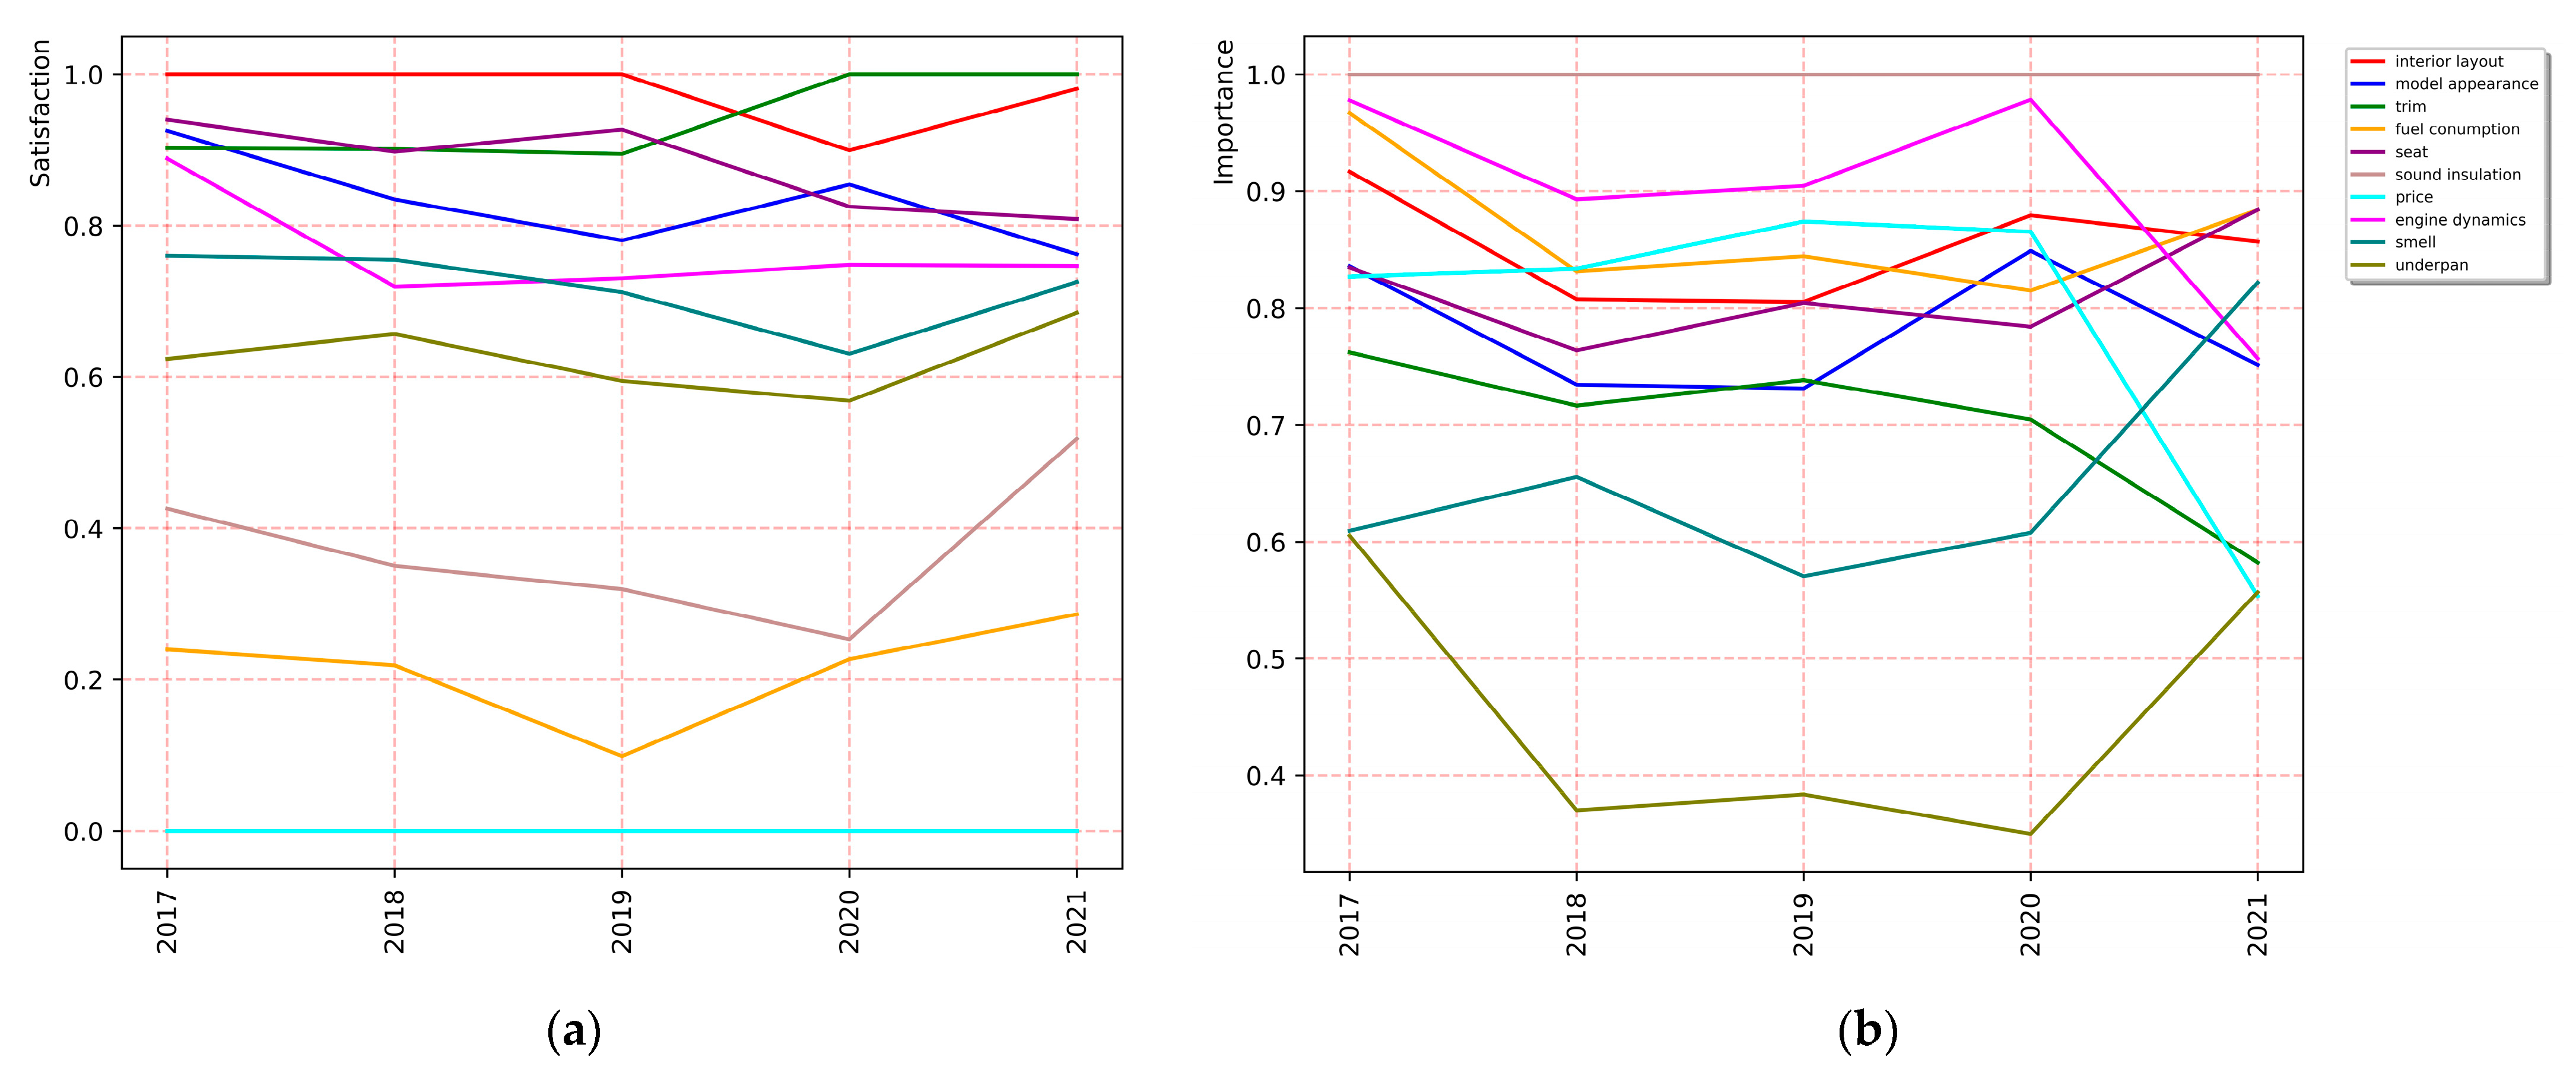
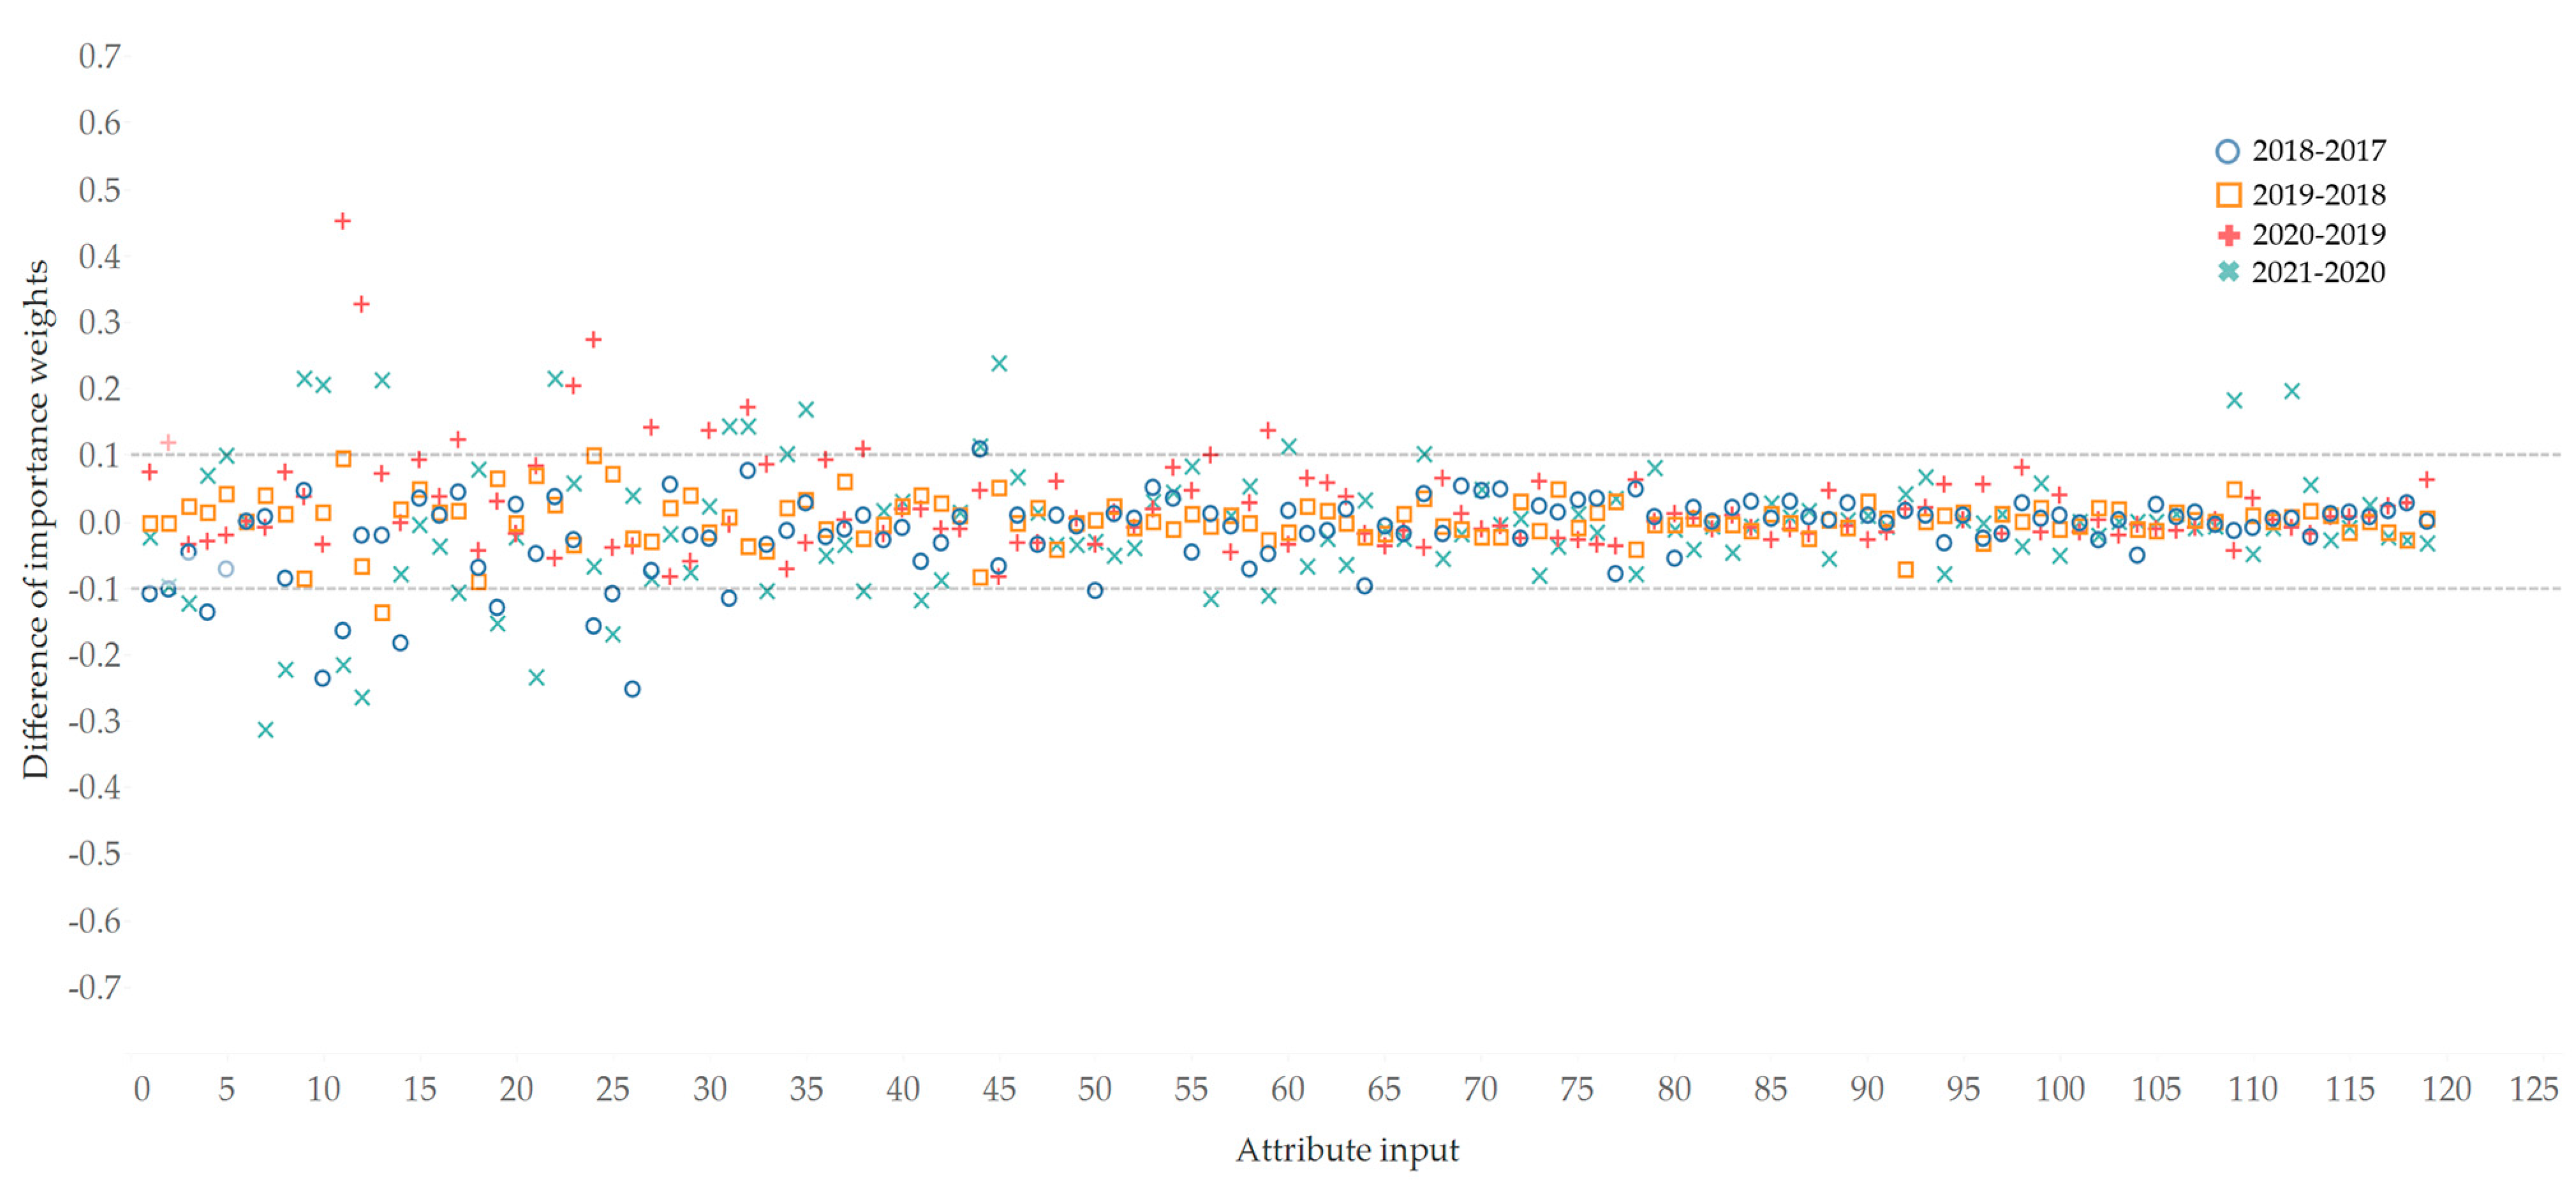
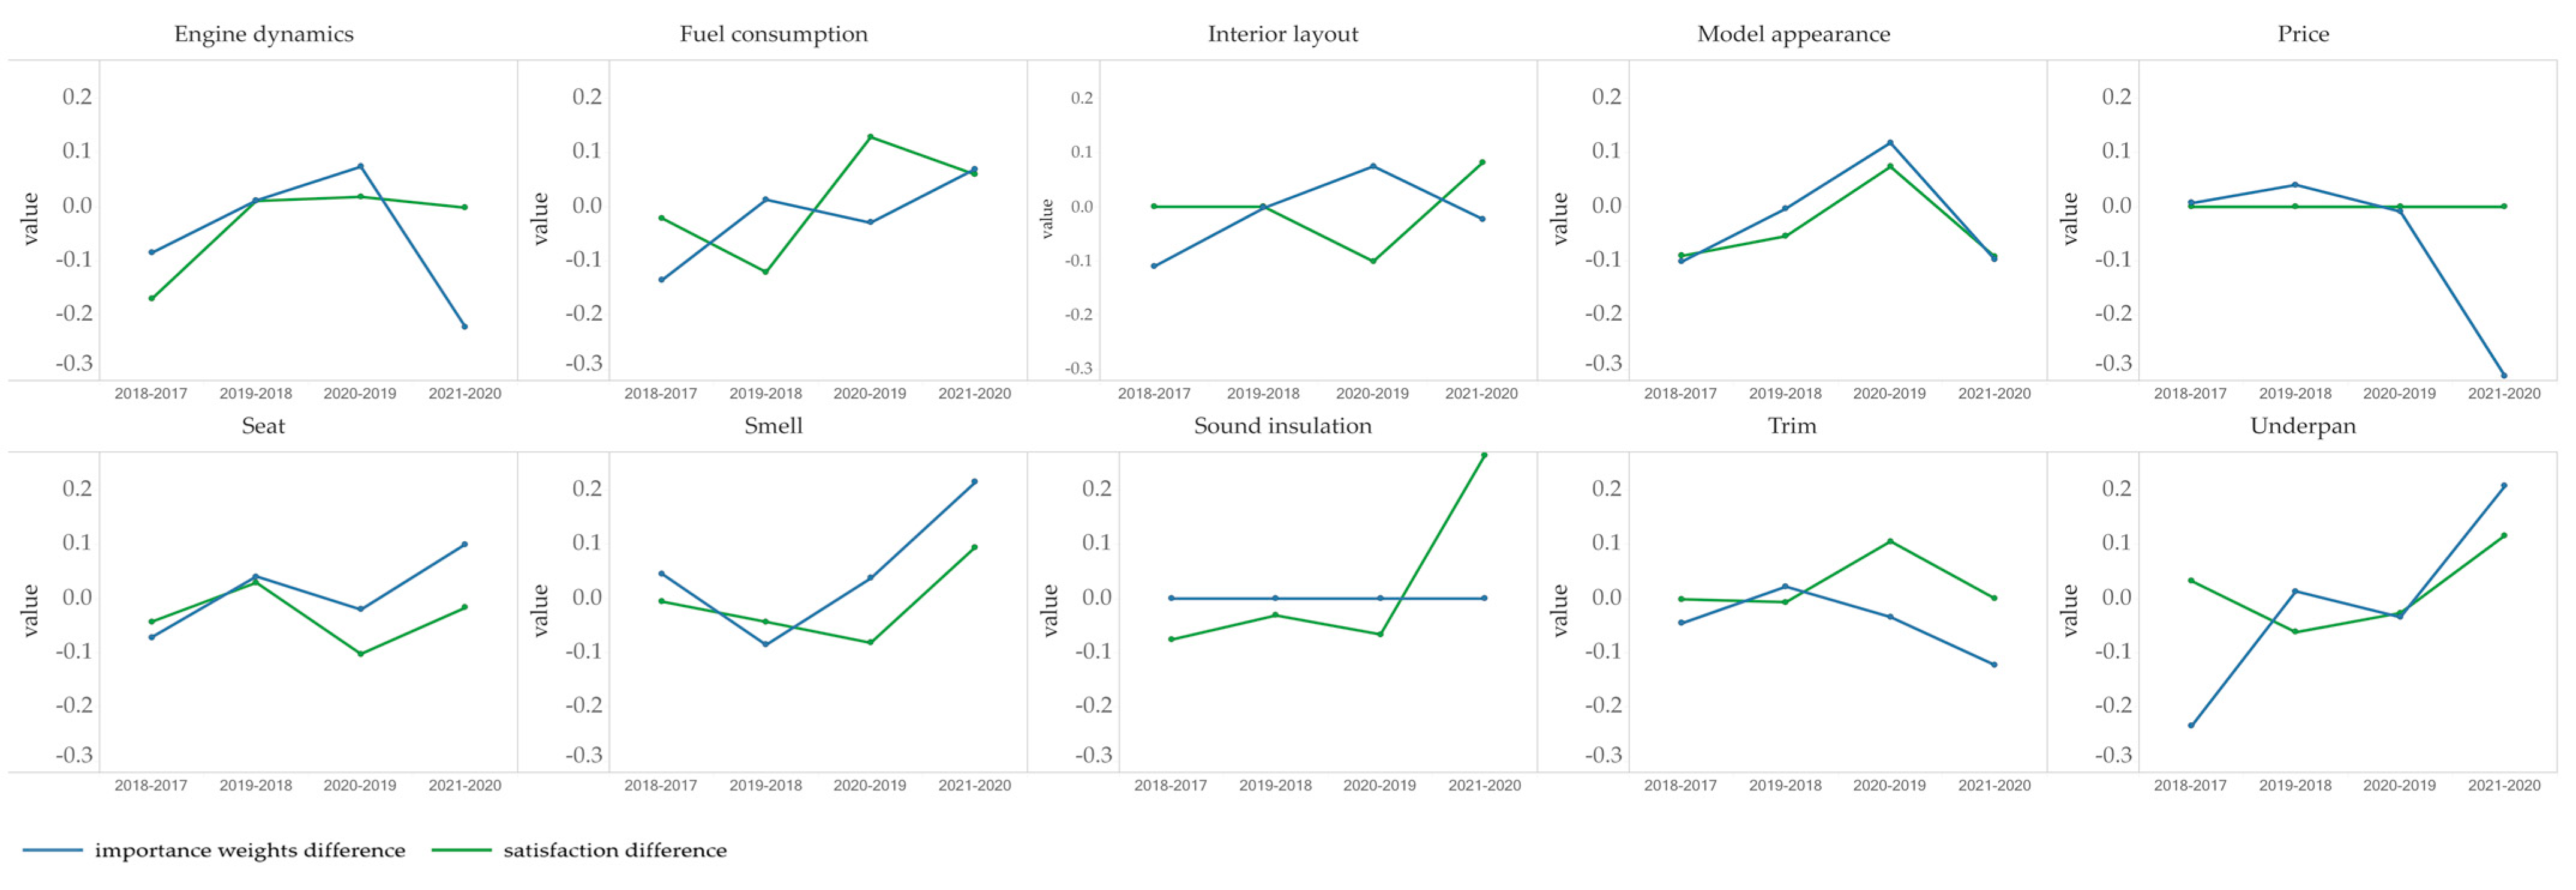
4.4. ISGA-Time Analysis

In order to analyze the development trends of customer demand for different attributes, ISGA is needed for different periods. Therefore, the dynamic ISGA-time model is constructed in this section to analyze the changing trends of the importance of user demand and satisfaction regarding the small-sized sedan in this study.
We divided the five review datasets by time period and constructed an ISGA-time analysis chart (see Figure 7) with time as the x-axis, customer satisfaction as the y-axis and importance as the z-axis. The marker on the folding point represents the zone where the attribute is located in that year. At the same time, we also drew the diagram of satisfaction changing over time (Figure 8a) and the diagram of importance changing over time (see Figure 8b).
For the users of the small-sized sedan, it can be seen that the importance of interior layout, model appearance, price, trim, engine dynamics, smell and the underpan have all decreased. However, the price is always in Zone 1 or Zone 2, indicating that users’ satisfaction with this attribute is still low; that is, they think the price is unreasonable. We tracked down reviews about the price and found that most people thought that, even though the price was not high, the specs were not worth it. Moreover, compared with other vehicles entering the market during the same period, the price reduction of this vehicle is lower, and the discount is too small. This attribute became less important to people when the attribute of the engine switched from Zone 1 and Zone 2 to last year’s Zone 4 (higher satisfaction was harder to come by because the engine was immutable when it was designed). The importance of fuel consumption, seat, sound insulation, smell and the underpan is on the rise. Fuel consumption and sound insulation were almost maintained in Zone 1 in recent years, which belong to the properties with high importance but low customer satisfaction and are in urgent need of resource input and management. The remaining attributes belong to Zone 3 and Zone 4.
We also drew a thermodynamic diagram according to the distance of each attribute from the origin of every year (see Figure 9). Zone 1 and Zone 2 are in red, which are dissatisfactory zones that need to be allocated resources. The blue represents Zone 3, and Zone 4 is the satisfying zone where resources can be reduced. The farther away from the origin, the darker the square color and the higher the priority of resource allocation/adjustment. As can be seen, most of the attributes remain in the same color scheme over time.
In order to better describe the changing behavior of the attributes, the product attributes whose importance weight changes are outside the range of [−0.1, 0.1] are defined as active attributes. The 119 attributes in Figure 10 are sorted by how often they appear in the reviews. It is clear that there is little change in these attributes between 2018 and 2019, while from 2017 to 2018 and from 2019 to 2021, there were more active attributes, especially those mentioned frequently. The change in their importance weight is positive or negative, indicating that some attributes become more important to people while others decrease. From 2020 to 2021, the attributes that become significantly more important are seat, smell, underpan, fog light, backspace, dashboard, rearview mirror, antenna, armrest box, iron sheet, disc brake, water thermometer and tire noise; and the attributes that become significantly less important are trim, price, engine dynamics, radio, air conditioner, steering wheel, gearbox, wheel hub, exhaust pipe and window. Figure 11 shows the dynamic changes regarding the product attribute importance weights and satisfaction scores over time. Taking the vehicle attribute of engine dynamics as an example, it can be seen from Figure 11 that the importance of this attribute increased slightly (positive) from 2019 to 2020. However, while people’s satisfaction with it remained almost the same, its importance decreased greatly from 2020 to 2021. Therefore, manufacturers can focus less on this attribute. The change of importance of some of the attributes was maintained at 0, such as sound insulation, indicating that people have always attached the same importance to this attribute.

5. Conclusions

The existing methods for determining consumer preferences and addressing sustainable design needs in automotive design rely on human interactions with customers, such as experiential interviews and focus groups [10]. However, traditional methods are expensive and time-consuming, often resulting in delays in time-to-market. User-generated content (UGC) is a promising alternative source for identifying customer needs. However, most current UGC studies focus on fast-moving consumer products with relatively short life cycles [14]. In addition, most established methods are neither efficient nor effective for user comments in automotive vertical forums, as much of the content is unrecognizable from existing UGC corpora [35]. To address the drawbacks of traditional methods in determining user preferences, as well as the importance of better identifying user comments in automotive vertical forums to achieve an accurate assessment of the core design needs and requirements—with a goal of user satisfaction—we propose a method to measure their perceptions of attribute quality regarding different types of cars through online user-generated content. This method uses a bounded-average entropy algorithm to identify domain-specific vocabulary and uses an ISGA model to determine the changes in the preferences of Chinese car users over time. By using the BAE algorithm, we avoided the drawbacks of commonly used word segmentation systems, which heavily depend on a pre-established lexicon and are hardly able to distinguish new terms from a new corpus, especially in an industry like the automobile industry, which derives specific terminologies very quickly. Through the importance-satisfaction gap analysis, we evaluated the allocation of resources to car attributes. We also added time as an element to allow us to discuss the dynamic changes in importance and satisfaction. The results can help automotive companies capture the real needs of consumers and allocate resources reasonably for sustainable design, as well as improve their existing products or service attributes and increase customer satisfaction.
Overall, this study enriches the field of mining opinions from user-generated content. Three main aspects of novelty are exhibited: (1) the implementation of the BAE algorithm on automobile-domain professional vocabularies identification; (2) the ISGA of automobile attributes for resource adjustments; and (3) the presentation of the ISGA-time model analysis of future designing orientation.
The framework of this study has to be seen in light of some limitations. First, taking the customers’ demands for different attributes brought about by automobile types into consideration, we conducted ISGA on three types of automobile attributes separately. In fact, other factors can lead to different demands on an automobile’s attributes. For instance, customers living in different regions will have different income levels, infrastructure and transportation conditions, all of which can generate different customer demands for automobile attributes. In addition, factors from customers themselves, namely gender and age, can have a similar effect as external factors like regions and automobile types. Due to data limitations, we did not obtain other detailed dimensions for classification in the process of ISGA. Therefore, future studies can leverage other dimensions to classify the attributes data before analysis in order to provide suggestions for enterprises on prioritizing improving their product/service features. Second, employing the BAE algorithm can improve word segmentation precision while posing a negative impact on recall, and this algorithm has a high time complexity. In the step of sentiment dictionary matching, the preset score for each degree adverb when building a sentiment lexicon is subjective to some extent. Future studies can make further improvements based on the product’s specificity and grammar structure context.

Author Contributions

H.L.: supervision, conceptualization, funding acquisition, methodology, validation and writing—review and editing; W.Z.: conceptualization, methodology, investigation, resources, data curation and writing—original draft preparation; W.S.: software, validation and investigation; X.L.: project administration, resources, methodology and visualization; S.Y.: software, formal analysis, validation and visualization. All authors have read and agreed to the published version of the manuscript.

Funding

This work was supported by the Discipline Co-construction Project for Philosophy and Social Science in Guangdong Province (No. GD20XGL03), the Universities Stability Support Program in Shenzhen (No. 20200813151607001), the Major Planned Project for Education Science in Shenzhen (No. zdfz20017) and the National Natural Science Foundation of China (No. 71901151).

Institutional Review Board Statement

Not applicable.

Informed Consent Statement

Not applicable.

Data Availability Statement

Not applicable.

Conflicts of Interest

The authors declare no conflict of interest.

Appendix A

Table A1. Research that shares a similar purpose with this study on the Web of Science.
Author (Year)TitlePublication SourceType of UGC and Category
Timoshenko, A and Hauser, JR. (2019) [10]Identifying customer needs from user-generated contentMARKETING SCIENCE 38(1), 1–20Oral care reviews from Amazon
Rasool, G.;Pathania, A. (2021) [44]Reading between the lines: untwining online user-generated content using sentiment analysisJOURNAL OF RESEARCH IN INTERACTIVE MARKETING 15(3), 401–418Airline passenger reviews from TripAdvisor
Fels, A.; Briele, K.; Ellerich, M.; Schmitt, R. (2018) [45]Extracting customer-related information for need identificationINTERNATIONAL CONFERENCE ON HUMAN SYSTEMS ENGINEERING AND DESIGN: FUTURE TRENDS AND APPLICATIONS IHSED2018 876, 1108–1112Vacuum cleaner and smart phone reviews from Amazon
Kühl, N.; Mühlthaler, M.; Goutier, M. (2019) [34]Supporting customer-oriented marketing with artificial intelligence: automatically quantifying customer needs from social mediaELECTRONIC MARKETS 30(2), 351–367Electric vehicle tweets
Lee, JYH; Yang, CS and Chen, SY (2017) [35]Understanding customer opinions from online discussion forums: A design science frameworkENGINEERING MANAGEMENT JOURNAL 29(4), 235–243Discussions about cars from Mforum
Vollero, A; Sardanelli, D; Siano, A (2021) [46]Exploring the role of the Amazon effect on customer expectations: An analysis of user-generated content in consumer electronics retailingJOURNAL OF CONSUMER BEHAVIOURAmazon electronic reviews and Facebook discussions about electronics
Zhu, D; Lappas, T and Zhang, JH (2018) [47] Unsupervised tip-mining from customer reviewsDECISION SUPPORT SYSTEMS 107, 116–124TripAdvisor hotel reviews
Ekhlassi, A; Zahedi, A. (2018) [48]A unique method of constructing brand perceptual maps by the text mining of multimedia consumer reviewsINTERNATIONAL JOURNAL OF MOBILE COMPUTING AND MULTIMEDIA COMMUNICATIONS 9(3), 1–22Amazon digital tablet reviews
Yu, CE; Zhang, XY (2020) [49]The embedded feelings in local gastronomy: a sentiment analysis of online reviewsJOURNAL OF HOSPITALITY AND TOURISM TECHNOLOGY 11(3), 461–478Online reviews of restaurants from one of the most popular tourism websites (no mentioned name)
Hsiao, YH; Chen, MC; Liao, WC. (2017) [50]Logistics service design for cross-border E-commerce using Kansei engineering with text-mining-based online content analysisTELEMATICS AND INFORMATICS 34(4), 284–302Cross-boarder e-commerce online reviews
Zhang, R.; Pang, Z.; Liu, X. (2021) [51]Mining express service innovation opportunity from online reviewsJOURNAL OF ORGANIZATIONAL AND END USER COMPUTING (JOEUC) 33(6)Online reviews of express delivery from Baidu Koubei
Valsan, A; Sreepriya, CT; Nitha, L. (2017) [52]Social media sentiment polarity analysis: A novel approach to promote business performance and consumer decision-makingARTIFICIAL INTELLIGENCE AND EVOLUTIONARY COMPUTATIONS IN ENGINEERING SYSTEMS, ICAIECES 2016 517, 1–12Online cameras reviews
Hasan, MR.; Abdunurova, A.; Wang, W.; Zhang, J.; Shams, S.M.R. (2021) [53]Using deep learning to investigate digital behavior in culinary tourismJOURNAL OF PLACE MANAGEMENT AND DEVELOPMENT 14(1), 43–65Online restaurant reviews from TripAdvisor
Kauffmann, E. (2019) [54]A step further in sentiment analysis application in marketing decision-makingRESEARCH & INNOVATION FORUM 2019: TECHNOLOGY, INNOVATION, EDUCATION, AND THEIR SOCIAL IMPACT, 211–221Online reviews of cell phones and accessories from Amazon
Vinodhini, G.; Chandrasekaran, RM. (2014) [55]Measuring the quality of hybrid opinion mining model for e-commerce applicationMEASUREMENT 55, 101–109Publicly available reviews of digital cameras from University of Chicago dataset
Chalupa, S.; Petricek, M.; Chadt, K. (2021) [56]Improving service quality using text mining and sentiment analysis of online reviewsQUALITY-ACCESS TO SUCCESS 22(182), 46–49Online hotel reviews from various booking sites
Dickinger, A and Mazanec, JA (2015) [57]Significant word items in hotel guest reviews: A feature extraction approachTOURISM RECREATION RESEARCH 40 (3), 353–363Online hotel reviews from TripAdvisor
Asghar, Z.; Ali, T.; Ahmad, I.; Tharanidharan, S.; Nazar, S.K.A.; Kamal, S. (2018) [36]Sentiment analysis on automobile brands using Twitter dataINTELLIGENT TECHNOLOGIES AND APPLICATIONS, INTAP 2018 932, 76–85Tweets about automobiles
Aman, JJC.; Smith-Colin, J.; Zhang, WW. (2021) [58]Listen to e-scooter riders: Mining rider satisfaction factors from app store reviewsTRANSPORTATION RESEARCH PART D-TRANSPORT AND ENVIRONMENTE-scooter rider app store reviews
Ng, CY.; Law, KMY. (2020) [59]Investigating consumer preferences on product designs by analyzing opinions from social networks using evidential reasoningCOMPUTERS & INDUSTRIAL ENGINEERING 139Comments on smart phones from Facebook
Becken, S.; Alaei, AR.; Wang, Y. (2019) [60]Benefits and pitfalls of using tweets to assess destination sentimentJOURNAL OF HOSPITALITY AND TOURISM TECHNOLOGY 11(1), 19–34Tourism tweets
Wang, W.; Feng, Y.; Dai, W. (2018) [61]Topic analysis of online reviews for two competitive products using latent Dirichlet allocationELECTRONIC COMMERCE RESEARCH AND APPLICATIONS 29, 142–156Online reviews of wireless mice from Amazon.com
Zhu, D.; Lappas, T.; Zhang, J. (2018) [47]Unsupervised tip-mining from customer reviewsDECISION SUPPORT SYSTEMS 107, 116–124Travel guide reviews from TripAdvisor
Al-Obeidat, F.; Spencer, B.; Kafeza, E. (2018) [62]The opinion management framework: Identifying and addressing customer concerns extracted from online product reviewsELECTRONIC COMMERCE RESEARCH AND APPLICATIONS 27, 52–64Online hotel reviews
Vo, A.; Nguyen, Q.; Ock, C. (2018) [63]Opinion-aspect relations in cognizing customer feelings via reviewsIEEE ACCESS 6, 5415–5426Cameras reviews from dataset and SemEval-2016 laptop reviews
Oh, Y.K.; Yi, J. (2021) [64]Asymmetric effect of feature level sentiment on product rating: an application of bigram natural language processing (NLP) analysisINTERNET RESEARCHReviews of wireless earbud products on Amazon.com
Singh, A.; Tucker, C.S. (2017) [65]A machine learning approach to product review disambiguation based on function, form and behavior classificationDECISION SUPPORT SYSTEMS 97, 81–91Laptop reviews from amazon.com
Eldin, S.S.; Mohammed, A.; Hefny, H.; Ahmed, A.S.E. (2021) [66]An enhanced opinion retrieval approach on Arabic text for customer requirements expansionJOURNAL OF KING SAUD UNIVERSITY-COMPUTER AND INFORMATION SCIENCES 33(3), 351–363Several social product resources, including souq.com
Riaz, S.; Fatima, M.; Kamran, M.; Nisar, N.W. (2019) [67]Opinion mining on large-scale data using sentiment analysis and k-means clusteringCLUSTER COMPUTING-THE JOURNAL OF NETWORKS SOFTWARE TOOLS AND APPLICATIONS 22, S7149–S7164Reviews of camera, mobile phone, laptop, tablet, TV and video surveillance devices from Amazon, Ebay, Alibaba
Jin, J.; Ji, P.; Liu, Y. (2015) [68]Translating online customer opinions into engineering characteristics in QFD: A probabilistic language analysis approachENGINEERING APPLICATIONS OF ARTIFICIAL INTELLIGENCE 41, 115–127Printer reviews from Amazon.com
Jin, J; Jia, D.P.; Chen, K.J. (2021) [69]Mining online reviews with a Kansei-integrated Kano model for innovative product designINTERNATIONAL JOURNAL OF PRODUCTION RESEARCH, 1–20Smartphone reviews
Zhang, L.; Chu, X.N.; Xue, D.Y. (2019) [70]Identification of the to-be-improved product features based on online reviews for product redesignINTERNATIONAL JOURNAL OF PRODUCTION RESEARCH 57(8), 2464–2479Smartphone reviews
Zhou, F.; Jiao, R.J.; Linsey, J.S. (2015) [71]Latent customer needs elicitation by use case analogical reasoning from sentiment analysis of online product reviewsJOURNAL OF MECHANICAL DESIGN 137(7), 071401Kindle Fire HD reviews from Tablet
Zhou, F.; Ayoub, J.; Xu, Q. Jessie Yang, X. (2020) [72]A machine learning approach to customer needs analysis for product ecosystemsJOURNAL OF MECHANICAL DESIGN 142(1), 011101Kindle Fire tablet reviews from Amazon
Liu, Y.; Jin, J.; Ji, P.; Harding, J.A.; Fung, R.Y. (2013) [73]Identifying helpful online reviews: A product designer’s perspectiveCOMPUTER-AIDED DESIGN 45(2), 180–194Phone reviews collected from Amazon
Ireland, R.; Liu, A. (2018) [74]Application of data analytics for product design: Sentiment analysis of online product reviewsCIRP JOURNAL OF MANUFACTURING SCIENCE AND TECHNOLOGY 23, 128–144Reviews on Coleman chair from Amazon
Joung, J.; Jung, K.; Ko, S.; Kim, K. (2019) [75]Customer complaints analysis using text mining and outcome-driven innovation method for market-oriented product developmentSUSTAINABILITY 1(1), 40Reviews of stand-type air conditioners
Jain, P.K.; Pamula, R.; Srivastava, G. (2021) [76]A systematic literature review on machine learning applications for consumer sentiment analysis using online reviewsCOMPUTER SCIENCE REVIEW 41, 100413Reviews cover many industries (hotel, airline, restaurant, airport, tourist, art and museum)
Foris, D.; Crihalmean, N.; Foris, T. (2020) [77]Exploring the environmental practices in hospitality through booking websites and online tourist reviewsSUSTAINABILITY 12(24), 10282Online hotel reviews from booking.com
Han, Y.; Moghaddam, M. (2021) [78]Eliciting attribute-level user needs from online reviews with deep language models and information extractionJOURNAL OF MECHANICAL DESIGN 143(6), 061403Online sneaker reviews
Wu, J.; Wang, Y.; Zhnag, R.; Cai, J. (2018) [79]An approach to discovering product/service Improvement priorities: Using dynamic importance-performance analysisSUSTAINABILITY 10(10), 3564Reviews of Huawei P series smartphones from Jingdong.com
Htay, S.S.; Lynn, K.T. (2013) [80]Extracting product features and opinion words using pattern knowledge in customer reviewsSCIENTIFIC WORLD JOURNAL, 1–5Customer reviews of five electronic products: two digital cameras, one DVD player, one mp3 player and one cellular phone from Amazon
Wang, W.M.; Tian, Z.G.; Li, Z.; Wang, J.W. (2019) [81]Supporting the construction of affective product taxonomies from online customer reviews: an affective-semantic approachJOURNAL OF ENGINEERING DESIGN 30(10–12), 445–476Reviews on toys and games on Amazon
Zhou, F.; Jiao, J.R.; Yang, X.J.; Lei, B. (2017) [82]Augmenting feature model through customer preference mining by hybrid sentiment analysisEXPERT SYSTEMS WITH APPLICATIONS 89, 306–317Reviews of the first generation Kindle Fire HD tablets from Amazon
Jin, J.; Ji, P.; Kwong, C.K. (2016) [83]What makes consumers unsatisfied with your products: Review analysis at a fine-grained levelENGINEERING APPLICATIONS OF ARTIFICIAL INTELLIGENCE 47, 38–48Customer reviews of six mobile phones from Amazon
Wu, Y.; Wei, F.; Liu, S.; Au, N.; Cui, W.; Zhou, H.; Qu, H. (2010) [84]OpinionSeer: interactive visualization of hotel customer feedbackIEEE TRANSACTIONS ON VISUALIZATION AND COMPUTER GRAPHICS 16(6), 1109–1118Reviews of Hong Kong hotels from TripAdvisor
Sun, H.; Guo, W.; Shao, H.; Rong, B. (2020) [37]Dynamical mining of ever-changing user requirements: A product design and improvement perspectiveADVANCED ENGINEERING INFORMATICS 46, 101174Online reviews of Trumpchi GS4 and GS8
Anh, K.Q.; Nagai, Y.; Le Minh, N. (2019) [85]Extracting user requirements from online reviews for product design: A supportive framework for designersJOURNAL OF INTELLIGENT & FUZZY SYSTEMS 37(6), 7441–7451Nokia phone reviews
Nam, S.; Lee, H.C. (2019) [86]A text analytics-based importance performance analysis and its application to airline serviceSUSTAINABILITY 11(21), 6153Reviews of airline services from TripAdvisor
Nam, S.; Yoon, S.; Raghavan, N.; Park, H. (2021) [87]Identifying service opportunities based on outcome-driven innovation framework and deep learning: A case study of hotel serviceSUSTAINABILITY 13(1), 391Online hotel reviews from TripAdvisor
Hong, W.; Zheng, C.; Wu, L.; Pu, X. (2019) [88]Analyzing the relationship between consumer satisfaction and fresh e-commerce logistics service using text mining techniquesSUSTAINABILITY 11(13), 3570Reviews of logistics from JD Fresh Supermarket
Malik, H.; Afthanorhan, A.; Amirah, N.A.; Fatema, N. (2021) [89]Machine learning approach for targeting and recommending a product for project managementMATHEMATICS 9(16), 1958Reviews of cellphones on Amazon
Trappey, A.J.C.; Trappey, C.V.; Fan, C.Y.; Lee, I.J. (2018) [90]Consumer driven product technology function deployment using social media and patent miningADVANCED ENGINEERING INFORMATICS 36, 120–129Reviews of three smartphones from Amazon
Fang, Z.; Zhang, Q.; Tang, X.; Wang, A.; Baron, C. (2020) [91]An implicit opinion analysis model based on feature-based implicit opinion patternsARTIFICIAL INTELLIGENCE REVIEW 53(6), 4547–4574Online car reviews from PCauto.com.cn
Sankar, H.; Subramaniyaswamy, V.; Vijayakumar, V.; Arun Kumar, S.; Logesh, R.; Umamakeswari, A.J.S.P. (2020) [92]Intelligent sentiment analysis approach using edge computing-based deep learning techniqueSOFTWARE-PRACTICE & EXPERIENCE 50(5), 645–657Reviews from Internet Movie Database, Rotten Tomatoes dataset and Polarity dataset
Shah, A.M.; Yan, X.; Tariq, S.; Ali, M. (2021) [93]What patients like or dislike in physicians: Analyzing drivers of patient satisfaction and dissatisfaction using a digital topic modeling approachINFORMATION PROCESSING & MANAGEMENT 58(3), 102516Reviews from iwantgreatcare.org
Gregoriades, A.; Pampaka, M.; Herodotou, H.; Christodoulou, E. (2021) [94]Supporting digital content marketing and messaging through topic modelling and decision treesEXPERT SYSTEMS WITH APPLICATIONS 184, 115546Online Cyprus reviews from TripAdvisor
Wang, W.M.; Li, Z.; Tian, Z.G.; Tsui, E. (2018) [38]Mining of affective responses and affective intentions of products from unstructured textJOURNAL OF ENGINEERING DESIGN 29(7), 404–429Reviews on 24 different product categories from Amazon

References

  1. McKinsey China Auto Consumer Insights 2019. Available online: https://www.mckinsey.com/~/media/mckinsey/industries/automotive%20and%20assembly/our%20insights/china%20auto%20consumer%20insights%202019/mckinsey-china-auto-consumer-insights-2019.pdf (accessed on 15 August 2023).
  2. Press Conference of the State Council’s Joint Prevention and Control Mechanism on April 9. Available online: http://www.gov.cn/xinwen/gwylflkjz86/index.htm (accessed on 15 August 2023).
  3. Diana, R.; Bruno, S.; Sofia, G.; José, O.; Eunice, L. Exploring Consumer Behavior and Brand Management in the Automotive Sector: Insights from a Digital and Territorial Perspective. Adm. Sci. 2023, 13, 36. [Google Scholar]
  4. Li, M.; Liu, Y.; Yue, W. Evolutionary Game of Actors in China’s Electric Vehicle Charging Infrastructure Industry. Energies 2022, 15, 8806. [Google Scholar] [CrossRef]
  5. Luis, M.; Alberto, R. How to Improve Customer Engagement in Social Networks: A Study of Spanish Brands in the Automotive Industry. J. Theor. Appl. Electron. Commer. Res. 2021, 16, 3269–3281. [Google Scholar]
  6. Bogdan, A.; Nicoleta, D.; Octavian, D. Word-of-Mouth Engagement in Online Social Networks: Influence of Network Centrality and Density. Electronics 2023, 12, 2857. [Google Scholar]
  7. Jing, L.; Xu, Q.; Sun, T.; Peng, X.; Li, J.; Gao, F.; Jiang, S. Conceptual Scheme Decision Model for Mechatronic Products Driven by Risk of Function Failure Propagation. Sustainability 2020, 12, 7134. [Google Scholar] [CrossRef]
  8. He, B.; Liu, Y.; Zeng, L.; Wang, S.; Zhang, D.; Yu, Q. Product carbon footprint across sustainable supply chain. J. Clean. Prod. 2019, 241, 118320. [Google Scholar] [CrossRef]
  9. Tirunillai, S.; Tellis, G.J. Does chatter really matter? Dynamics of user-generated content and stock performance. Mark. Sci. 2012, 31, 198–215. [Google Scholar] [CrossRef]
  10. Timoshenko, A.; Hauser, J.R. Identifying customer needs from user-generated content. Mark. Sci. 2019, 38, 1–192. [Google Scholar] [CrossRef]
  11. Liu, B.Q.; Karahanna, E. The dark side of reviews: The swaying effects of online product reviews on attribute preference construction. MIS Q. 2017, 41, 427–448. [Google Scholar] [CrossRef]
  12. Duan, W.; Gu, B.; Whinston, A.B. Do online reviews matter?—An empirical investigation of panel data. Decis. Support Syst. 2008, 45, 1007–1016. [Google Scholar] [CrossRef]
  13. Archak, N.; Ghose, A.; Ipeirotis, P.G. Deriving the pricing power of product features by mining consumer reviews. Manag. Sci. 2011, 57, 1485–1509. [Google Scholar] [CrossRef]
  14. McDonald, M.H.B.; de Chernatony, L.; Harris, F. Corporate marketing and service brands—Moving beyond the fast moving consumer goods model. Eur. J. Mark. 2001, 35, 335–352. [Google Scholar] [CrossRef]
  15. Luo, H.; Cheng, S.; Zhou, W.; Song, W.; Yu, S.; Lin, X. Research on the Impact of Online Promotions on Consumers’ Impulsive Online Shopping Intentions. J. Theor. Appl. Electron. Commer. Res. 2021, 16, 2386–2404. [Google Scholar] [CrossRef]
  16. Bracewell, D.B.; Minato, J.; Ren, F.; Kuroiwa, S. Determining the emotion of news articles. In Proceedings of the International Conference on Intelligent Computing, Kunming, China, 16–19 August 2006; pp. 918–923. [Google Scholar]
  17. Rao, Y.; Lei, J.; Liu, W.; Li, Q.; Chen, M. Building emotional dictionary for sentiment analysis of online news. World Wide Web 2014, 17, 723–742. [Google Scholar] [CrossRef]
  18. Ji, Q.; Raney, A.A. Developing and validating the self-transcendent emotion dictionary for text analysis. PLoS ONE 2020, 15, e0239050. [Google Scholar] [CrossRef]
  19. Liu, T.; Zhang, C.; Wu, M. Product feature extraction algorithm based on boundary average information entropy in online reviews. Syst. Eng.―TheoryPractice 2016, 36, 2416–2423. [Google Scholar]
  20. Jing, R.; Yuan, C.; Rezaei, H.; Qian, J.; Zhang, Z. Assessments on emergy and greenhouse gas emissions of internal combustion engine automobiles and electric automobiles in the USA. J. Environ. Sci. 2020, 90, 297–309. [Google Scholar] [CrossRef]
  21. Du, Z.; Lin, B. Changes in automobile energy consumption during urbanization: Evidence from 279 cities in China. Energy Policy 2019, 132, 309–317. [Google Scholar] [CrossRef]
  22. Tong, R.; Cheng, M.; Ma, X.; Yang, Y.; Liu, Y.; Li, J. Quantitative health risk assessment of inhalation exposure to automobile foundry dust. Environ. Geochem. Health 2019, 41, 2179–2193. [Google Scholar] [CrossRef]
  23. Bao, G.Z.; Liu, W.; Wei, L.; Zhao, J.G. Automobile brake protection based on laser pulse real-time ranging. Lasers Eng. (Old City Publ.) 2020, 45, 353–365. [Google Scholar]
  24. James, A.T.; Kumar, G.; Arora, A.; Padhi, S. Development of a design based remanufacturability index for automobile systems. J. Automob. Eng. 2021, 235, 3138–3156. [Google Scholar] [CrossRef]
  25. Ma, J.; Hou, Y.; Wang, Z.; Yang, W. Pricing strategy and coordination of automobile manufacturers based on government intervention and carbon emission reduction. Energy Policy 2021, 148, 111919. [Google Scholar] [CrossRef]
  26. Zhang, X.; Lou, Z.; Sun, Z.; Dai, X. Pricing and investment decision issues of an automobile manufacturer for different types of vehicles. IEEE Access 2021, 9, 73083–73089. [Google Scholar] [CrossRef]
  27. Griffin, A.; Hauser, J.R. The Voice of the Customer. Mark. Sci. 1993, 12, 1–124. [Google Scholar] [CrossRef]
  28. Hu, N.; Zhang, T.; Gao, B.; Bose, I. What do hotel customers complain about? Text analysis using structural topic model. Tour. Manag. 2019, 72, 417–426. [Google Scholar] [CrossRef]
  29. Kitsios, F.; Kamariotou, M.; Karanikolas, P.; Grigoroudis, E. Digital marketing platforms and customer satisfaction: Identifying eWOM using big data and text mining. Appl. Sci. 2021, 11, 8032. [Google Scholar] [CrossRef]
  30. Xiang, Z.; Schwartz, Z.; Gerdes, J.H., Jr.; Uysal, M. What can big data and text analytics tell us about hotel guest experience and satisfaction? Int. J. Hosp. Manag. 2015, 44, 120–130. [Google Scholar] [CrossRef]
  31. Xu, X.; Li, Y. The antecedents of customer satisfaction and dissatisfaction toward various types of hotels: A text mining approach. Int. J. Hosp. Manag. 2016, 55, 57–69. [Google Scholar] [CrossRef]
  32. Jiao, J.; Chen, C.H. Customer requirement management in product development: A review of research issues. Concurr. Eng. 2006, 14, 173–185. [Google Scholar] [CrossRef]
  33. Min Kim, J.; Han, J.; Jun, M. Differences in mobile and nonmobile reviews: The role of perceived costs in review-posting. Int. J. Electron. Commer. 2020, 24, 450–473. [Google Scholar] [CrossRef]
  34. Kühl, N.; Mühlthaler, M.; Goutier, M. Supporting customer-oriented marketing with artificial intelligence: Automatically quantifying customer needs from social media. Electron. Mark. 2020, 30, 351–367. [Google Scholar] [CrossRef]
  35. Lee, J.Y.H.; Yang, C.S.; Chen, S.Y. Understanding customer opinions from online discussion forums: A design science framework. Eng. Manag. J. 2017, 29, 235–243. [Google Scholar] [CrossRef]
  36. Asghar, Z.; Ali, T.; Ahmad, I.; Tharanidharan, S.; Nazar, S.K.A.; Kamal, S. Sentiment analysis on automobile brands using Twitter data. In Proceedings of the International Conference on Intelligent Technologies and Applications, Bahawalpur, Pakistan, 23–25 October 2018; pp. 76–85. [Google Scholar]
  37. Sun, H.; Guo, W.; Shao, H.; Rong, B. Dynamical mining of ever-changing user requirements: A product design and improvement perspective. Adv. Eng. Inform. 2020, 46, 101174. [Google Scholar] [CrossRef]
  38. Wang, W.M.; Li, Z.; Liu, L.; Tian, Z.G.; Tsui, E. Mining of affective responses and affective intentions of products from unstructured text. J. Eng. Des. 2018, 29, 404–429. [Google Scholar] [CrossRef]
  39. Shamantha, R.B.; Shetty, S.M.; Rai, P. Sentiment analysis using machine learning classifiers: Evaluation of performance. In Proceedings of the 2019 IEEE 4th International Conference on Computer and Communication Systems (ICCCS), Singapore, 23–25 February 2019; pp. 21–25. [Google Scholar]
  40. Wijayanti, R.; Arisal, A. Automatic indonesian sentiment lexicon curation with sentiment valence tuning for social media sentiment analysis. ACM Trans. Asian Low-Resour. Lang. Inf. Process. 2021, 20, 1–16. [Google Scholar] [CrossRef]
  41. Sahu, T.P.; Khandekar, S. A machine learning-based lexicon approach for sentiment analysis. J. Technol. Hum. Interact. (IJTHI) 2020, 16, 8–22. [Google Scholar] [CrossRef]
  42. Mankad, S.; Han, H.S.; Goh, J.; Gavirneni, S. Understanding online hotel reviews through automated text analysis. Serv. Sci. 2016, 8, 124–138. [Google Scholar] [CrossRef]
  43. Martilla, J.A.; James, J.C. Importance-Performance Analysis. J. Mark. 1977, 41, 77–79. [Google Scholar] [CrossRef]
  44. Rasool, G.; Pathania, A. Reading between the lines: Untwining online user-generated content using sentiment analysis. J. Res. Interact. Mark. 2021, 15, 401–418. [Google Scholar] [CrossRef]
  45. Fels, A.; Briele, K.; Ellerich, M.; Schmitt, R. Extracting customer-related information for need identification. In Proceedings of the International Conference on Human Systems Engineering and Design: Future Trends and Applications, Reims, France, 25–27 October 2018; pp. 1108–1112. [Google Scholar]
  46. Vollero, A.; Sardanelli, D.; Siano, A. Exploring the role of the Amazon effect on customer expectations: An analysis of user-generated content in consumer electronics retailing. J. Consum. Behav. 2021, 1–12. [Google Scholar] [CrossRef]
  47. Zhu, D.; Lappas, T.; Zhang, J. Unsupervised tip-mining from customer reviews. Decision Support Syst. 2018, 107, 116–124. [Google Scholar] [CrossRef]
  48. Ekhlassi, A.; Zahedi, A. A unique method of constructing brand perceptual maps by the text mining of multimedia consumer reviews. Int. J. Mob. Comput. Multimed. Commun. (IJMCMC) 2018, 9, 1–22. [Google Scholar] [CrossRef]
  49. Yu, C.E.; Zhang, X. The embedded feelings in local gastronomy: A sentiment analysis of online reviews. J. Hosp. Tour. Technol. 2020, 11, 461–478. [Google Scholar] [CrossRef]
  50. Hsiao, Y.H.; Chen, M.C.; Liao, W.C. Logistics service design for cross-border E-commerce using Kansei engineering with text-mining-based online content analysis. Telemat. Inform. 2017, 34, 284–302. [Google Scholar] [CrossRef]
  51. Zhang, N.; Zhang, R.; Pang, Z.; Liu, X.; Zhao, W. Mining express service innovation opportunity from online reviews. J. Organ. End User Comput. (JOEUC) 2021, 33, 1–15. [Google Scholar] [CrossRef]
  52. Valsan, A.; Sreepriya, C.T.; Nitha, L. Social media sentiment polarity analysis: A novel approach to promote business performance and consumer decision-making. In Artificial Intelligence and Evolutionary Computations in Engineering Systems; Dash, S.S., Vijayakumar, K., Panigrahi, B.K., Das, S., Eds.; Springer: Singapore, 2017; pp. 1–12. ISBN 978-981-10-3173-1. [Google Scholar]
  53. Hasan, M.R.; Abdunurova, A.; Wang, W.; Zheng, J.; Shams, S.R. Using deep learning to investigate digital behavior in culinary tourism. J. Place Manag. Dev. 2021, 14, 43–65. [Google Scholar] [CrossRef]
  54. Kauffmann, E.; Gil, D.; Peral, J.; Ferrández, A.; Sellers, R. A step further in sentiment analysis application in marketing decision-making. In Proceedings of the International Research & Innovation Forum, Rome, Italy, 24–26 April 2019; pp. 211–221. [Google Scholar]
  55. Vinodhini, G.; Chandrasekaran, R.M. Measuring the quality of hybrid opinion mining model for e-commerce application. Measurement 2014, 55, 101–109. [Google Scholar] [CrossRef]
  56. Chalupa, S.; Petricek, M.; Chadt, K. Improving service quality using text mining and sentiment analysis of online reviews. Qual.-Access Success 2021, 22, 46–49. [Google Scholar]
  57. Dickinger, A.; Mazanec, J.A. Significant word items in hotel guest reviews: A feature extraction approach. Tour. Recreat. Res. 2015, 40, 353–363. [Google Scholar] [CrossRef]
  58. Aman, J.J.C.; Smith-Colin, J.; Zhang, W. Listen to E-scooter riders: Mining rider satisfaction factors from app store reviews. Transp. Res. Part D Transp. Environ. 2021, 95, 102856. [Google Scholar] [CrossRef]
  59. Ng, C.Y.; Law, K.M.Y. Investigating consumer preferences on product designs by analyzing opinions from social networks using evidential reasoning. Comput. Ind. Eng. 2020, 139, 106180. [Google Scholar] [CrossRef]
  60. Becken, S.; Alaei, A.R.; Wang, Y. Benefits and pitfalls of using tweets to assess destination sentiment. J. Hosp. Tour. Technol. 2019, 11, 19–34. [Google Scholar] [CrossRef]
  61. Wang, W.; Feng, Y.; Dai, W. Topic analysis of online reviews for two competitive products using latent Dirichlet allocation. Electron. Commer. Res. Appl. 2018, 29, 142–156. [Google Scholar] [CrossRef]
  62. Al-Obeidat, F.; Spencer, B.; Kafeza, E. The opinion management framework: Identifying and addressing customer concerns extracted from online product reviews. Electron. Commer. Res. Appl. 2018, 27, 52–64. [Google Scholar] [CrossRef]
  63. Vo, A.D.; Nguyen, Q.P.; Ock, C.Y. Opinion–aspect relations in cognizing customer feelings via reviews. IEEE Access 2018, 6, 5415–5426. [Google Scholar] [CrossRef]
  64. Oh, Y.K.; Yi, J. Asymmetric effect of feature level sentiment on product rating: An application of bigram natural language processing (NLP) analysis. Internet Res. 2021, 30, 1023–1040. [Google Scholar] [CrossRef]
  65. Singh, A.; Tucker, C.S. A machine learning approach to product review disambiguation based on function, form and behavior classification. Decis. Support Syst. 2017, 97, 81–91. [Google Scholar] [CrossRef]
  66. Eldin, S.S.; Mohammed, A.; Hefny, H.; Ahmed, A.S.E. An enhanced opinion retrieval approach on Arabic text for customer requirements expansion. J. King Saud Univ.-Comput. Inf. Sci. 2019, 33, 351–363. [Google Scholar] [CrossRef]
  67. Riaz, S.; Fatima, M.; Kamran, M.; Nisar, N.W. Opinion mining on large scale data using sentiment analysis and k-means clustering. Clust. Comput. 2019, 22, 7149–7164. [Google Scholar] [CrossRef]
  68. Jin, J.; Ji, P.; Liu, Y.; Lim, S.J. Translating online customer opinions into engineering characteristics in QFD: A probabilistic language analysis approach. Eng. Appl. Artif. Intell. 2015, 41, 115–127. [Google Scholar] [CrossRef]
  69. Jin, J.; Jia, D.; Chen, K. Mining online reviews with a Kansei-integrated Kano model for innovative product design. Int. J. Prod. Res. 2021, 60, 6708–6727. [Google Scholar] [CrossRef]
  70. Zhang, L.; Chu, X.; Xue, D. Identification of the to-be-improved product features based on online reviews for product redesign. Int. J. Prod. Res. 2019, 57, 2464–2479. [Google Scholar] [CrossRef]
  71. Zhou, F.; Jiao, R.J.; Linsey, J.S. Latent customer needs elicitation by use case analogical reasoning from sentiment analysis of online product reviews. J. Mech. Des. 2015, 137, 071401. [Google Scholar] [CrossRef]
  72. Zhou, F.; Ayoub, J.; Xu, Q.; Jessie Yang, X. A machine learning approach to customer needs analysis for product ecosystems. J. Mech. Des. 2020, 142, 011101. [Google Scholar] [CrossRef]
  73. Liu, Y.; Jin, J.; Ji, P.; Harding, J.A.; Fung, R.Y. Identifying helpful online reviews: A product designer’s perspective. Comput.-Aided Des. 2013, 45, 180–194. [Google Scholar] [CrossRef]
  74. Ireland, R.; Liu, A. Application of data analytics for product design: Sentiment analysis of online product reviews. CIRP J. Manuf. Sci. Technol. 2018, 23, 128–144. [Google Scholar] [CrossRef]
  75. Joung, J.; Jung, K.; Ko, S.; Kim, K. Customer complaints analysis using text mining and outcome-driven innovation method for market-oriented product development. Sustainability 2019, 11, 40. [Google Scholar] [CrossRef]
  76. Jain, P.K.; Pamula, R.; Srivastava, G. A systematic literature review on machine learning applications for consumer sentiment analysis using online reviews. Comput. Sci. Rev. 2021, 41, 100413. [Google Scholar] [CrossRef]
  77. Foris, D.; Crihalmean, N.; Foris, T. Exploring the environmental practices in hospitality through booking websites and online tourist reviews. Sustainability 2020, 12, 10282. [Google Scholar] [CrossRef]
  78. Han, Y.; Moghaddam, M. Eliciting attribute-level user needs from online reviews with deep language models and information extraction. J. Mech. Des. 2021, 143, 061403. [Google Scholar] [CrossRef]
  79. Wu, J.; Wang, Y.; Zhang, R.; Cai, J. An approach to discovering product/service improvement priorities: Using dynamic importance-performance analysis. Sustainability 2018, 10, 3564. [Google Scholar] [CrossRef]
  80. Htay, S.S.; Lynn, K.T. Extracting product features and opinion words using pattern knowledge in customer reviews. Sci. World J. 2013, 2013, 394758. [Google Scholar] [CrossRef] [PubMed]
  81. Wang, W.M.; Tian, Z.G.; Li, Z.; Wang, J.W. Supporting the construction of affective product taxonomies from online customer reviews: An affective-semantic approach. J. Eng. Des. 2019, 30, 445–476. [Google Scholar] [CrossRef]
  82. Zhou, F.; Jiao, J.R.; Yang, X.J.; Lei, B. Augmenting feature model through customer preference mining by hybrid sentiment analysis. Expert Syst. Appl. 2017, 89, 306–317. [Google Scholar] [CrossRef]
  83. Jin, J.; Ji, P.; Kwong, C.K. What makes consumers unsatisfied with your products: Review analysis at a fine-grained level. Eng. Appl. Artif. Intell. 2016, 47, 38–48. [Google Scholar] [CrossRef]
  84. Wu, Y.; Wei, F.; Liu, S.; Au, N.; Cui, W.; Zhou, H.; Qu, H. OpinionSeer: Interactive visualization of hotel customer feedback. IEEE Trans. Vis. Comput. Graph. 2010, 16, 1109–1118. [Google Scholar]
  85. Anh, K.Q.; Nagai, Y.; Le Minh, N. Extracting user requirements from online reviews for product design: A supportive framework for designers. J. Intell. Fuzzy Syst. 2019, 37, 7441–7451. [Google Scholar] [CrossRef]
  86. Nam, S.; Lee, H.C. A text analytics-based importance performance analysis and its application to airline service. Sustainability 2019, 11, 6153. [Google Scholar] [CrossRef]
  87. Nam, S.; Yoon, S.; Raghavan, N.; Park, H. Identifying service opportunities based on outcome-driven innovation framework and deep learning: A case study of hotel service. Sustainability 2021, 13, 391. [Google Scholar] [CrossRef]
  88. Hong, W.; Zheng, C.; Wu, L.; Pu, X. Analyzing the relationship between consumer satisfaction and fresh e-commerce logistics service using text mining techniques. Sustainability 2019, 11, 3570. [Google Scholar] [CrossRef]
  89. Malik, H.; Afthanorhan, A.; Amirah, N.A.; Fatema, N. Machine learning approach for targeting and recommending a product for project management. Mathematics 2021, 9, 1958. [Google Scholar] [CrossRef]
  90. Trappey, A.J.C.; Trappey, C.V.; Fan, C.Y.; Lee, I.J. Consumer driven product technology function deployment using social media and patent mining. Adv. Eng. Inform. 2018, 36, 120–129. [Google Scholar] [CrossRef]
  91. Fang, Z.; Zhang, Q.; Tang, X.; Wang, A.; Baron, C. An implicit opinion analysis model based on feature-based implicit opinion patterns. Artif. Intell. Rev. 2020, 53, 4547–4574. [Google Scholar] [CrossRef]
  92. Sankar, H.; Subramaniyaswamy, V.; Vijayakumar, V.; Arun Kumar, S.; Logesh, R.; Umamakeswari, A.J.S.P. Intelligent sentiment analysis approach using edge computing-based deep learning technique. Softw. Pract. Exp. 2020, 50, 645–657. [Google Scholar] [CrossRef]
  93. Shah, A.M.; Yan, X.; Tariq, S.; Ali, M. What patients like or dislike in physicians: Analyzing drivers of patient satisfaction and dissatisfaction using a digital topic modeling approach. Inf. Process. Manag. 2021, 58, 102516. [Google Scholar] [CrossRef]
  94. Gregoriades, A.; Pampaka, M.; Herodotou, H.; Christodoulou, E. Supporting digital content marketing and messaging through topic modelling and decision trees. Expert Syst. Appl. 2021, 184, 115546. [Google Scholar] [CrossRef]
Figure 1. System architecture of the method.
Sustainability 15 13336 g001
Figure 2. (a) Boundary-average entropy before the combination of the two strings; (b) boundary-average entropy after the combination of the two strings.
Sustainability 15 13336 g002
Figure 3. Zone distribution of the ISGA model.
Sustainability 15 13336 g003
Figure 4. Demonstration of zone priority.
Sustainability 15 13336 g004
Figure 5. The base ISGA-time model.
Sustainability 15 13336 g005
Figure 6. Importance-satisfaction value distribution of the small-sized sedan attributes.
Sustainability 15 13336 g006
Figure 7. Importance-satisfaction distribution of the small-sized sedan over time.
Sustainability 15 13336 g007
Figure 8. (a) Changes in the car users’ satisfaction of the small-sized sedan over time; (b) changes in attributes’ importance of the small-sized sedan over time.
Sustainability 15 13336 g008
Figure 9. Changes in distance and zones of the small-sized sedan.
Sustainability 15 13336 g009
Figure 10. Attributes of importance weights differences of the small-sized sedan over the four periods.
Sustainability 15 13336 g010
Figure 11. Dynamic performance of importance weights and satisfaction.
Sustainability 15 13336 g011
Table 1. Illustration of sentiment scoring rules.
Type of TextFormulaExample
Q1 No feature word a t t i j p o s = 0 , a t t i j n e g = 0 “我很满意 (I like it very much.)”
Q2Feature word + positive sentiment word a t t i j p o s = f i j p o s = 1 “座椅舒服 (The seat is comfortable.)”
Feature word + negative sentiment word a t t i j n e g = f i j n e g = 1 “窗户脏 (The windows are dirty.)”
Feature word + privative words + positive sentiment word a t t i j p o s = f i j p o s k w ( p r i i k ) “不喜欢后备箱 (I don’t like the trunk.)”
Feature word + privative words + negative sentiment word a t t i j n e g = f i j n e g k w ( p r i i k ) “价格不贵 (The price is not expensive.)”
Q3Feature word + degree adverbs + positive sentiment word a t t i j p o s = f i j p o s t A d v i t “外观很大气 (The appearance is very gorgeous.)”
Feature word + degree adverbs + negative sentiment word a t t i j n e g = f i j n e g t A d v i t “隔音棉很差 (The sound insulation cotton is really poor.)”
Feature word + privative words + degree adverbs + positive sentiment word a t t i j p o s = f i j p o s k w ( p r i i k ) t A d v i t “我特别喜欢这个颜色 (I love the color very much.)”
Feature word + privative words + degree adverbs + negative sentiment word a t t i j n e g = f i j n e g k w ( p r i i k ) t A d v i t “我老婆非常讨厌轮胎 (My wife really hates the tires.)”
Table 2. The score of level of adverbs.
ScoreExamples
Score of degree adverbs level 3.0极度 (extremely), 超 (super)
2.0非常 (very), 十分 (really)
1.5比较 (relatively), 颇 (relatively)
0.5有点 (slightly), 稍许 (somewhat)
Table 3. Example of sentiment scores of attribute   j   in review   i .
Review a t t i 1 p o s a t t i j p o s a t t i n p o s a t t i 1 n e g a t t i j n e g a t t i n n e g
i = 1 1.502.001.01.5
i = 22.01.001.01.50
i = m01.51.002.01.0
Table 4. Alternative methods for identifying Chinese word boundaries.
PrecisionRecall F 1
Jieba70.83%68.77%69.79%
THULAC65.98%62.40%64.13%
BAE72.54%69.69%71.08%
Disclaimer/Publisher’s Note: The statements, opinions and data contained in all publications are solely those of the individual author(s) and contributor(s) and not of MDPI and/or the editor(s). MDPI and/or the editor(s) disclaim responsibility for any injury to people or property resulting from any ideas, methods, instructions or products referred to in the content.

