Article

Environmental Impact Assessment of Frozen Peas Production from Conventional and Organic Farming in Italy

by
Kofi Armah Boakye-Yiadom
1,
Alessio Ilari
1,
Valentina Bisinella
2,
Ester Foppa Pedretti
1 and
Daniele Duca
1,*
1
Department of Agricultural, Food and Environmental Sciences, Università Politecnica delle Marche, 60131 Ancona, Italy
2
Department of Environmental and Resource Engineering, Technical University of Denmark, Bygningstorvet 115, Kongens, 2880 Lyngby, Denmark
*
Author to whom correspondence should be addressed.
Sustainability 2023, 15(18), 13373; https://doi.org/10.3390/su151813373
Submission received: 1 August 2023 / Revised: 25 August 2023 / Accepted: 4 September 2023 / Published: 6 September 2023
(This article belongs to the Section Sustainable Products and Services)

Abstract

:
Increasing legume intake through dietary diversification confers nutritional and environmental benefits. This study used life cycle assessment to evaluate the environmental impacts of producing frozen green peas from conventional and organic farming. We explored two ways of treating farm data: modeling each farm (baseline) and using a uniform distribution of each farm parameter’s average, maximum, and minimum values (alternative). We also assessed the indirect land-use change (iLUC) impacts by applying a deterministic model and used the EF 3.0 method to estimate the midpoint environmental impacts. The results of the two scenarios for pea cultivation (including iLUC) showed notable differences in absolute terms with minor discrepancies in the contribution analysis (e.g., climate change (CC) for the baseline and alternative were 0.98 and 2.09 kg CO2 eq./kg fresh peas, respectively). Generally, conventional peas had a higher environmental impact than organic peas, although this was not uniformly observed across all farms. When included, iLUC accounted for nearly half of the CC score. Pea cultivation was the most impactful phase due to emissions from fertilizers and field operations. The impacts of pea production can be reduced by anaerobic digestion of pea residues with energy and nutrient recycling. However, improvements in processing and nitrogen use efficiency could significantly enhance the overall environmental performance of frozen green peas. In summary, this study emphasizes the need for sustainable practices to minimize the environmental impact of frozen pea production.

1. Introduction

The agricultural sector contributes significantly to environmental issues such as land use, climate change, acidification, eutrophication, and ecotoxicity [1,2,3,4]. A large share of these environmental impacts is connected to food production [5]. Food production accounts for 48% and 70% of household impacts on land and water resources, respectively [6]. Given the ongoing global environmental challenges, embracing sustainable dietary practices and food choices has gained considerable traction [7]. A sustainable and healthy diet can be achieved by consuming more plant-based protein, reducing the environmental impact of food production [8]. However, it is essential to recognize that the production systems of staple crops can have adverse environmental impacts [9]. Therefore, gaining a better understanding of the environmental impact of alternative crops like peas can help us make more informed decisions about how to incorporate these crops into our diets to enhance the sustainability and diversity of our diet. Moreover, the focus on underutilized crops with food potential has drawn the interest of botanical and agronomic researchers not only from the viewpoint of environmental sustainability but also with the aim of rediscovering valuable traits lost due to intensive agriculture [10,11].
Environmental sustainability has become increasingly important in the food sector [12]. Many food value chain actors have developed initiatives to reduce their environmental footprint following increasing consumer pressure [13]. Therefore, to quantify the potential environmental impacts of products, technologies, and systems, life cycle assessment (LCA) is widely applied [14,15]. LCA is a standardized method used for assessing the environmental impacts of food products over their entire life cycle [16,17]. LCA identifies processes governing the environmental impacts of products and systems, as well as areas for improvement, and can be used to select environmentally preferable options among alternatives. It can provide information to establish standards and certifications for ecolabelling programs that are useful for environmental marketing. As a result of green procurement, food ingredient suppliers have become heavily involved in assessing their products and improving efficiency to reduce environmental impacts. Furthermore, there is a clear need to valorize bio-waste generated by food production chains to ensure the chains are optimized over time to achieve the circular bioeconomy models the EU promotes [18].
Frozen plant products, including green peas, have a stable global market with promising growth prospects. In 2021, frozen vegetable imports to Europe amounted to EUR 3 billion in value and 2.8 million tonnes aggregated by volume [19]. Concerning the environmental impacts linked with frozen plant products, LCA studies show frozen items tend to have higher impacts than fresh produce due to the energy and materials required for processing and storage [20,21,22,23,24]. Nevertheless, the prolonged shelf life of these products could significantly reduce their impact, especially when considering the potential waste of unconsumed fresh items. Several studies have also assessed the environmental impact of peas at different life cycle stages, mainly in the last decade [25,26,27,28,29,30,31]. Factors such as the geographical location, cultivation system, technology involved in processing and cooking, and transportation accounted for variations in impact results. For pea cultivation, including peas in crop rotations reduces environmental impacts due to their nitrogen-fixing ability, which offsets the required nitrogen fertilizer input [25,26,27]. Tidåker et al. [28] also reported little variations between organic and conventional farming systems for peas, with conventional farming systems having a lower climate change impact due to higher yields. Peas are predominantly cultivated under conventional and organic systems. The difference lies in the degree of control farmers have over the production process. Farmers can use agrochemicals in conventional farming to maximize yields. In contrast, organic farming systems allow farmers to use natural products and methods to enhance productivity. While organic systems are anticipated to have lower environmental impacts due to reduced emissions of environmentally harmful substances from synthetic agrochemicals, productivity may suffer, particularly during the emergence of new pests or disease outbreaks. Therefore, achieving a balance between environmental protection and agricultural productivity remains a contentious issue, and there is still no consensus on which approach is more environmentally sustainable, given the trade-off involved [32].
Concerning the impacts associated with the different stages of the production chain, Bandekar et al. [29] discovered that the consumption stage had the greatest impact, contributing over 70% of the total impact across various impact categories for dried pulses in the USA. Additionally, Svanes [30] found that processing dried peas into protein concentrate had more than double the climate change impact of cultivation. In contrast, Del Borghi et al. [31] identified packaging production as the most impacting factor, accounting for over 70% of the global warming potential for peas in tin-plated steel cans and glass bottles for an environmental product declaration.
Recognizing sustainability concerns and the need for data to inform procurement decisions drives additional research at small- and medium-scale production levels. While LCA results can help to address sustainability issues, they cannot be taken a priori and must be assessed on a case-by-case basis due to the uniqueness of each situation. The flexibility of the LCA methodology also allows practitioners to make choices that could influence the results. Choices could increase uncertainties regarding how to treat data, including or excluding land-use changes and waste management, which can significantly affect the conclusions drawn, especially when product comparisons are made. Thus, it is important to consider the influence of these factors in order to interpret results accurately [33,34]. Traditionally, the inclusion of iLUC has been primarily limited to biofuels and energy crops, with relatively less emphasis on agricultural products [4,35]. Since land is a limited resource in constant demand, utilizing land for agricultural purposes can trigger iLUC, such as converting land to grow energy crops or displacing one crop with another. Excluding direct and indirect land-use changes in LCA can significantly alter the study results, potentially underestimating impacts and shifting burden. However, objections exist concerning the justification and estimation of iLUC in LCA studies. There is still no consensus on the terminologies of iLUC and methods for estimations due to differences in spatial and temporal characteristics and assumed reference conditions [36,37]. It is challenging to establish a causal relationship between an activity that leads to an iLUC, given that land has multiple simultaneous uses that cannot be easily separated [37,38]. Nonetheless, land use is an important sustainability index that should be included when assessing food products.
This study aims to quantify the potential environmental impacts associated with frozen pea production by a supplier in central Italy, highlighting the environmental hotspots and opportunities for possible improvement. The assessment is based on primary data on conventional and organic farming. Specifically, our research aims to answer questions on how to effectively model both conventional and organic pea farming in life cycle assessment (LCA) and how the data should be treated. Additionally, we explore the proper consideration of the physicochemical characteristics of biomass in LCA. We also investigate the impact of including iLUC on frozen pea production. We also evaluate the potential benefits of residue management and compare the environmental friendliness of organic and conventional pea farming systems using different data handling methods. The goal is to suggest strategies to improve the overall sustainability of pea cultivation and processing at a medium-scale production level.

2. Materials and Methods

To evaluate the potential environmental impacts of frozen peas, we followed the ISO 14040/14044 standards [16,17] and the International Reference Life Cycle Data System (ILCD) Handbook [39] to conduct the LCA study. Partial compliance was also observed with the rules outlined for Type III eco-labels in the Product Category Rules (PCR 2019:10) document for “prepared and preserved vegetables” [40,41], published within the framework of the International Environmental Product Declaration (EPD) System [42] and ISO 14025 [43]. We used LCA software for Environmental Assessment of Environmental Technologies (EASETECH), version 3.4 [44]. Background data for ancillary materials and energy were obtained from the Ecoinvent database version 3.8, allocation, cut-off by classification [45].

2.1. Goal and Scope of the Study

The study aims to evaluate the environmental performance of minimally processed frozen green peas cultivated under different agricultural practices (organic and conventional) and processed by an agricultural joint-stock consortium in central Italy. The primary purpose of the product system is to grow green peas, which are then minimally processed into frozen peas, serving as an ingredient for other food business operators. The functional unit is “Production of minimally processed frozen peas in Italy in 2023”. The reference flow is 1 kg of packaged frozen peas ready for distribution. We also use a unit of 1 kg of freshly harvested peas at the farm gate to compare the two cultivation systems. The data pertain to frozen peas produced by the company in 2020–2021.
The system boundaries include foreground and background processes related to cultivation, transportation, processing, and treatment of residues. Foreground processes encompass the main processes specific to the product system being modeled, while the background processes represent subprocesses necessary to any of the foreground processes and are sourced from reference databases (ancillary materials and energy). The modeling of the foreground system is process-specific and input-specific, following the flow of materials in the system and its physicochemical composition. The bottom-up modeling was performed with the EASETECH software, which converts emissions, waste, and residues from producing a product into a final estimation of resource consumption and potential environmental impacts [44]. The foreground inventory data were obtained directly from the company. Secondary data on manure and slurry quantity, as well as water used to dilute and dissolve pesticides, were obtained from the scientific literature. The background inventory data were obtained from Ecoinvent.
We performed attributional LCA on the main system, considering all the interventions involved in producing 1 kg of frozen peas and excluding potential system changes (Figure 1). This study is a cradle-to-factory gate LCA and excludes the distribution, retail, and use phases due to unavailable primary data and many possible scenarios that may increase the uncertainty of the results. Moreover, the company has little control over those stages. Allocation of input and output flows for processes of the product system was carried out on a mass basis as needed. Additional functionalities, such as additional material and energy produced from pea residue management, are accounted for by substituting commercial products that perform similar functions through system expansion. The supply chain’s various stages were analyzed to determine the raw material reference flows with respect to 1 kg of frozen peas. During processing, the company receives 1.18 kg of peas from the fields, but only 1 kg of frozen peas is produced, accounting for a 15% waste fraction. We assumed no farm and transport losses, although a negligible mass loss due to sap secretion after shelling occurs. The pea residue going to the anaerobic digestor was treated as a burden-free factor [40].

2.2. Life Cycle Impact Assessment

The impacts of the frozen peas, per the selected functional units, were evaluated in terms of climate change (CC) estimated over a 100-year horizon, ozone depletion (OD), human toxicity, cancer (HT, car), human toxicity, non-carcinogenic (HT, non-car), particulate matter (PM), ionizing radiation (IR), photochemical ozone formation (POCF), acidification (AC), eutrophication, terrestrial (EUTT), eutrophication, freshwater (EUFW), eutrophication, marine (EUMA), ecotoxicity, freshwater (ETFW), water use (WU), resource use, minerals and metals (RUMM), and resource use, energy carrier (RUEC) using the Environmental Footprint (EF) 3.0 midpoint life cycle impact assessment (LCIA) methodology with long-term impacts [46].

2.3. Process Modeling

The collection of raw cultivation and production data was conducted within the activities of LiSEA (Energy-Environmental Sustainability Laboratory) and the PSR BSFly green project. LiSEA is affiliated with the Department of Agricultural, Food, and Environmental Sciences at Marche Polytechnic University. It conducts impact assessments on agricultural, food, forest, and agro-energy supply chains to support teaching and research.

2.3.1. Cultivation

The peas were cultivated in provinces in the Marche, Emilia Romagna, Puglia, Umbria, Molise, and Tuscany regions of Italy (Figure 2). Out of 457 fields, a representative data sample was collected from 187 fields. The sample included data from 177 conventional and 10 organic peas fields, accurately reflecting their production shares. Pea cultivation was carried out on open fields, applying standard agricultural practices on field surfaces between 2.5 ha and 28 ha. The farmers carried out several field operations like plowing, harrowing, sowing, and agrochemical distribution under the two cultivation systems: organic and conventional farming. Between November and January, the peas were planted, and their harvesting period varied from April to June, depending on the type of pea. On average, the seed quantity sown was between 200 and 250 kg/ha.
The water for dissolving and diluting fertilizers, herbicides, insecticides, and fungicides was calculated according to indications declared on the product labels. Data on fertilizers and pesticides were directly obtained from farmers’ documents. Solid and liquid digestate quantities were calculated as an average of the minimum and the maximum amount/ha of manure and slurry that can be distributed, considering fields as nitrate-vulnerable zones. The digestate composition was obtained from Möller and Müller [47]. Table 1 shows the inventory data used for pea cultivation.
The fate and relative emissions of fungicides, insecticides, and herbicides were calculated considering that 85% of the total active ingredient is emitted into the soil, 10% into the air, and 5% in the water [48]. No pesticides were applied to pea plants grown under the organic system. The emissions and fate of fertilizers were calculated following the Product Category Rules (PCR) for arable crops [41]. Estimation of emissions from inorganic fertilizers and digestate for NH3 and NO, N2O direct and indirect emissions, NO3 leaching, and P leaching were included. Agrochemicals, such as bio-stimulants (Spinosad, Kendal Te, and Impulsive Premium) used predominantly for organic green pea cultivation, were assumed to have no impacts. Other indirect emissions were from fuel combustion by tractors and other farm machinery. However, after the harvest, we did not consider the N emissions from the biodegradation of pea residues (straw and pods), which were returned to the fields as organic matter through plowing.
Regarding the cultivation phase, we looked at how different ways of handling or considering large datasets could influence the overall results. We created parameters for the different farm inputs and emissions and used two data handling approaches to calculate the potential impacts of the cultivation phase of the two farming systems. In the first approach (baseline scenario), we compiled a list of data values for each parameter at every farm. We then analyzed the impact scores for each farm in both farming systems across various impact categories and calculated the mean and standard deviations for the type of cultivation system. In the second approach (an alternative scenario), we used Monte Carlo simulation to create a probability distribution. We defined a uniform probability distribution for each parameter based on the two farming systems’ minimum, maximum, and mean values. We then calculated the averages and standard deviation from 1000 runs of the uniform distribution.
We also included iLUC for the cultivation of peas based on the deterministic model developed by Tonini et al. [49]. Based on this model, global agricultural production is represented in terms of crop production, crop yield changes over time (productivity per unit of land), arable land expansion, and fertilizer use for intensification (intended as an increase in productivity on the same amount of land). The framework aims to establish a causal relationship between the demand for arable land and the effects of expansion and intensification. It utilizes statistical data on deforestation, the loss of natural biomes such as shrubland and grassland, crop yields, and fertilizer consumption to analyze this relationship. The final aggregated inventory for arable land use is based on emissions from a share of expansion (25%) and intensification (75%) in response to additional crop production to meet food or feed demand for a change in land use.

2.3.2. Transportation of Peas to the Processing Plant

The harvested pea is transported to the processing plant right after harvest, where processing is carried out immediately. Third-party companies are responsible for pea transport. The transport of bulk peas is carried out through trucks with an average load capacity of 7 tons. The vehicles are open trucks to prevent overheating and microbial spoilage. They are diesel-powered with 60% load capacity to avoid mechanical damage. The average distances ranged between 33 and 357 km. The environmental class of the truck is EURO 3. The truck on the return journey is empty because they are only intended to transport food products.

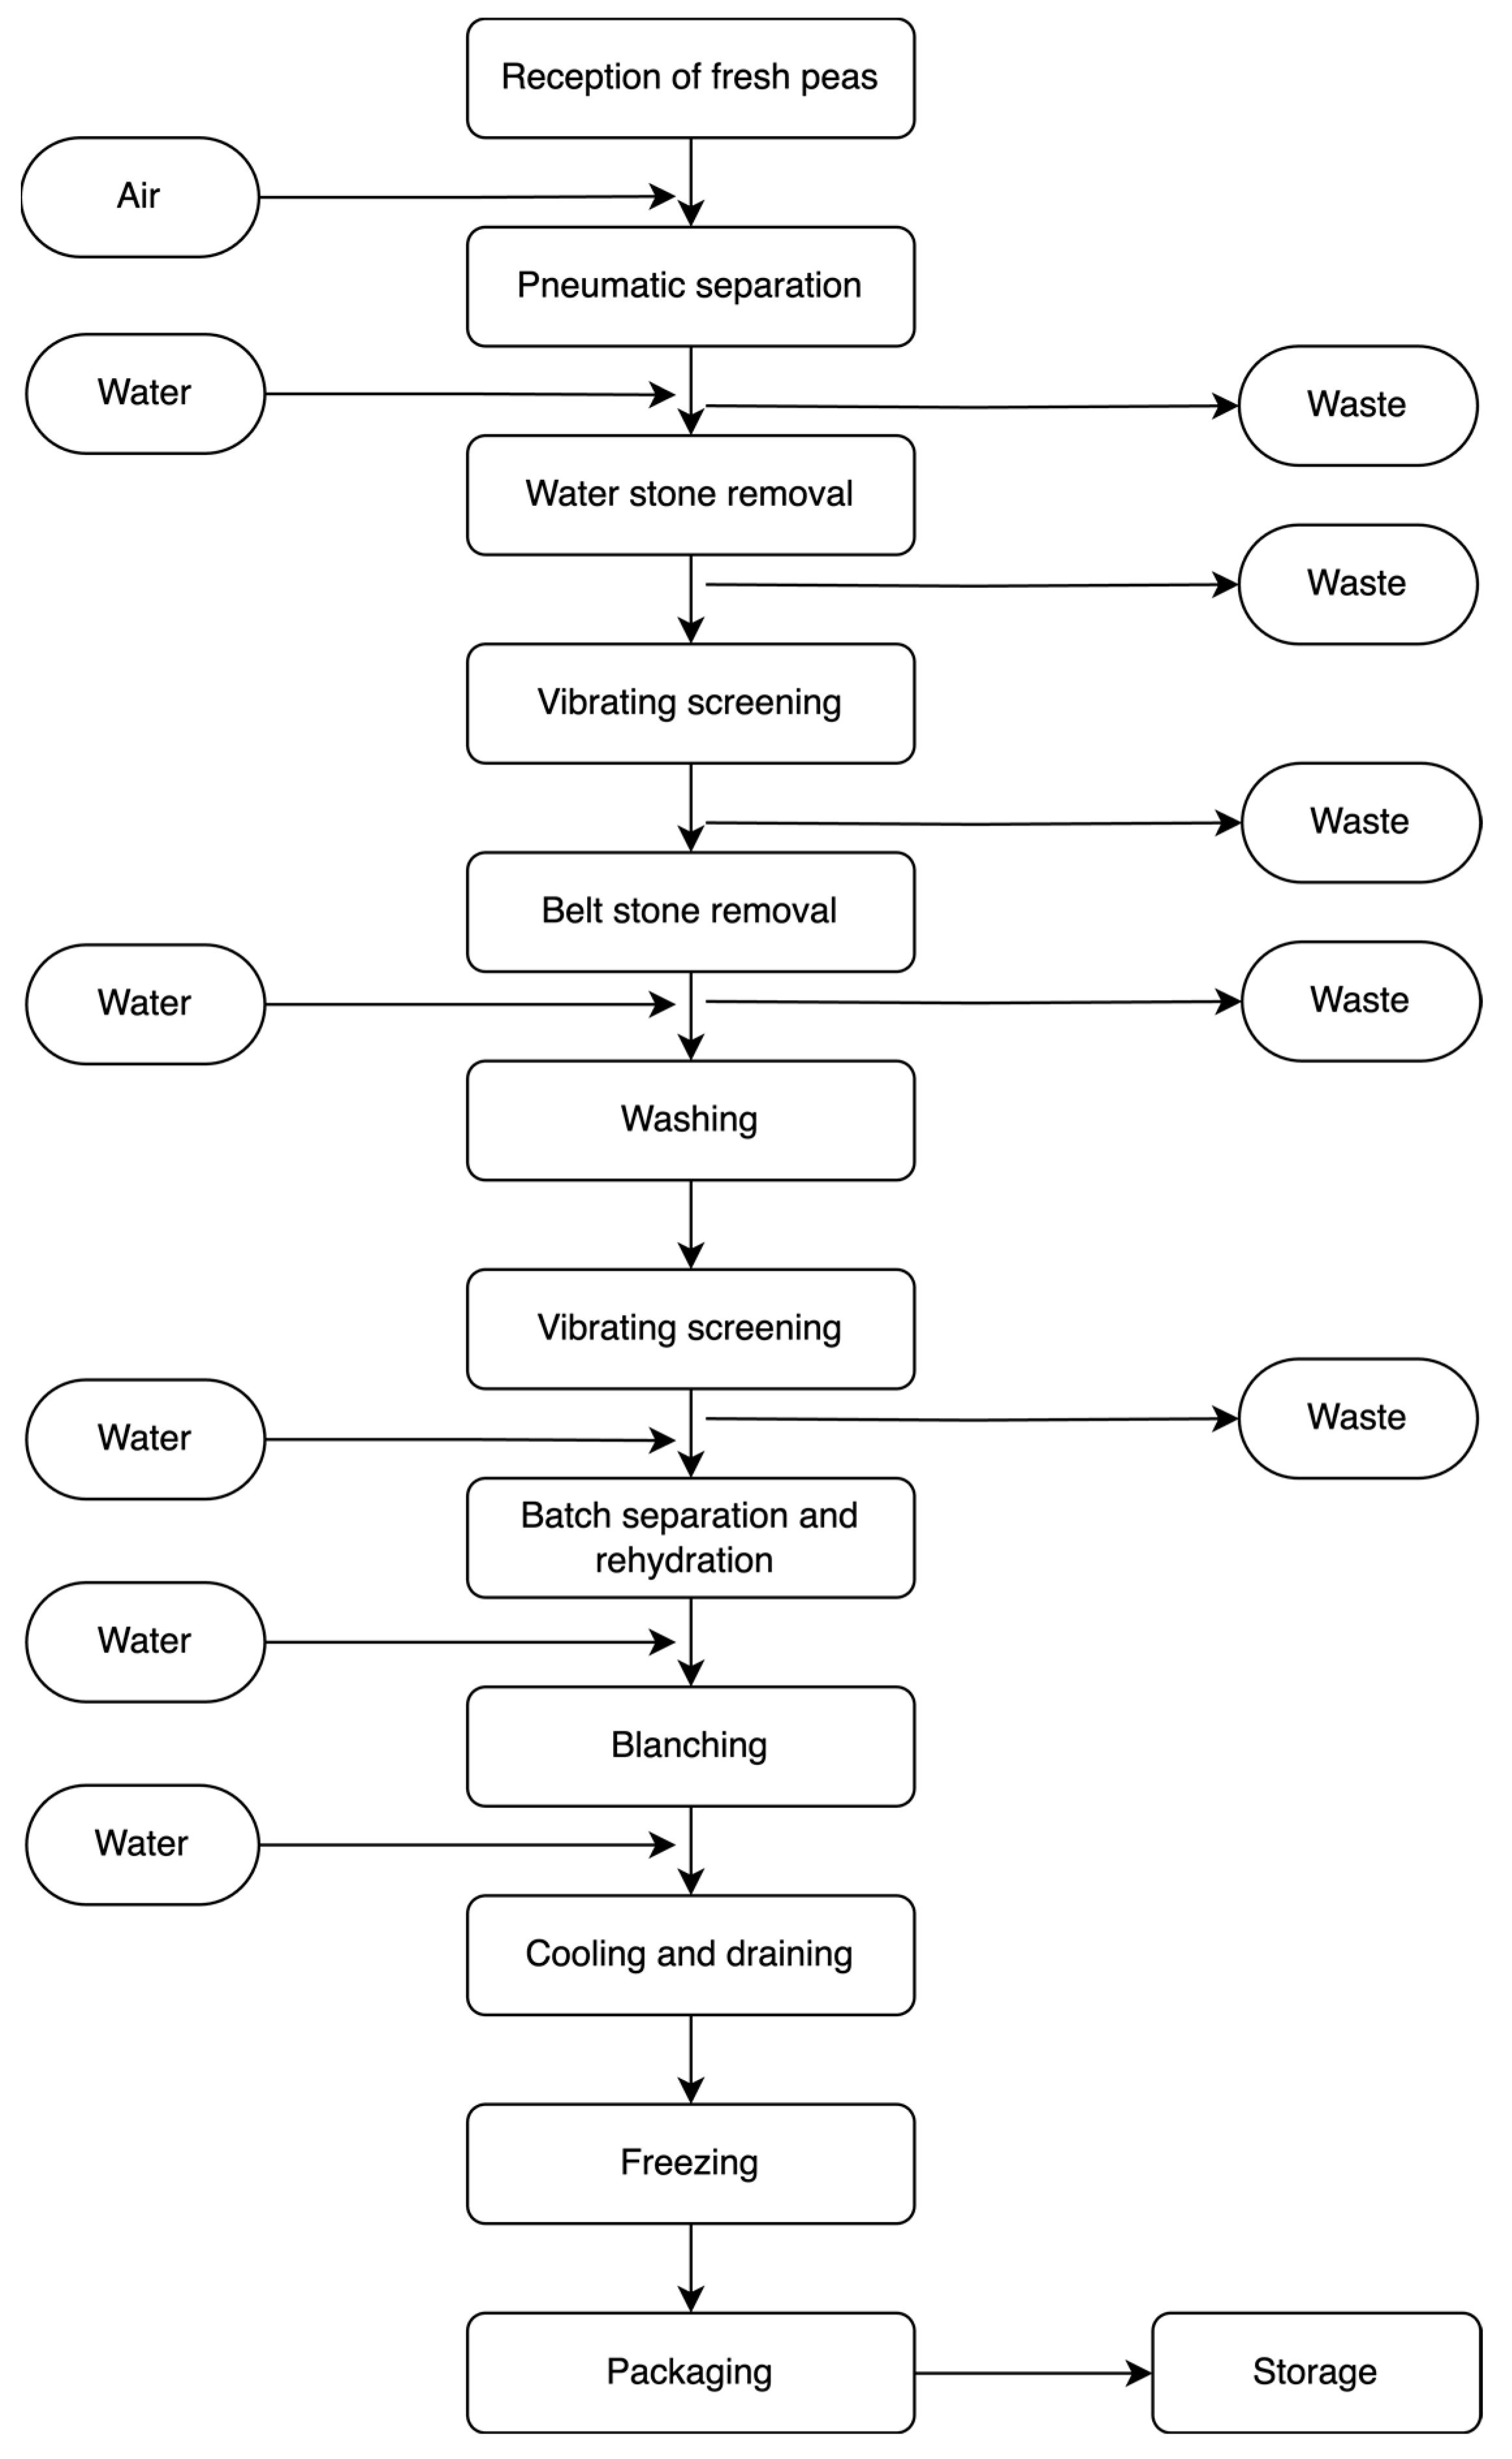
2.3.3. Processing and Packaging

The processing phase was modeled using a mass-based average of the peas from the two cultivation systems. Green peas cultivated under the conventional system comprised 96% of the total peas transported and processed at the facility. Figure 3 illustrates how fresh peas are transformed into packaged frozen products with minimal processing. The process begins with four unit processes involving a pneumatic separator, water stone remover, vibrating screen, and belt stone remover, which eliminates unwanted materials, such as sand, stones, insects, and heavy particles, such as stems and soil, from the peas. The peas are then washed by fluctuation and decantation with artesian well water. Subsequently, the peas are blanched in a steam cooker (a rotating drum with steam), heated to 94 °C, and cooled to 23 °C. Manual sorting is conducted through a visual inspection to remove any foreign material. The peas are then frozen and stored at −35 °C, with ammonia used as the refrigerant. All the solid organic waste generated during this process is directed to an agricultural biogas plant.
Concerning energy consumption, electricity from the national grid and a co-generator powers the engines to move the conveyor belts in the processing line, the pneumatic system, the freezer, and the compressors that pump the refrigerant. Moreover, electricity is also used to pump water, operate electric forklifts, and illuminate the plant’s offices and laboratories. Natural gas is used to produce steam for heating. Data for pea processing at the facility are summarized in Table 2.

2.3.4. Packaging and Storage

The products are safeguarded, preserved, and transported using two primary packaging layers for wholesale distribution. The initial layer comprises plastic, while the second layer comprises a carton box. Epal pallets of 100 × 120 cm were also considered for the transport of products. We modeled the pallets based on primary data regarding the number and assumed the average weight of each to be 30 kg and the lifespan to be 5 years. However, information concerning the distance covered while transporting packaging materials was not included. The peas are stored in freezing cells inside plastic bags placed in cardboard boxes. The storage period varies between 2 days and 6 months. The company primarily supplies frozen peas in bulk to other large companies for final packaging. We used suggested leakage rates to calculate refrigerant (ammonia) leakage [50,51]. For the chillers, the proposed leakage rates from the various stages were as follows: assembly (1%), annual leakage from operation (8%), and leakage from dumped refrigeration equipment (5%, assuming 95% recovery). The refrigeration system’s operational lifetime has been assumed to be 20 years.

2.3.5. Management of Residues

About 15% of the peas exit the processing phase as residue due to quality defects and processing inefficiencies. The residue is transported to an agricultural biogas plant to undergo anaerobic digestion, often co-digested with maize silage and poultry manure to generate biogas for heat and electricity and digestate. We estimated biomethane potential and modeled the anaerobic digestion process based on existing models in the EASETECH software. We assumed the methane content to be 50% of the biogas produced with a gas leakage of 5%. We credited the system based on the equivalent substitutable electricity from the Italian national grid and commercial NPK fertilizer. However, we excluded residue transportation to the agricultural biogas plant.

2.4. Interpretation

The midpoint characterization results per the functional unit of 1 kg of frozen peas are presented in this study. We first present the findings of the cultivation phase based on the two data handling approaches. The baseline scenario results refer to averages from modeling all the individual farms. In contrast, the alternative scenario refers to the impact scores based on a uniform distribution of the average, maximum, and minimum values of parameterized inputs and emissions. The impact scores on pea cultivation under the two farming systems are expressed per 1 kg of freshly harvested peas. Next, based on the baseline scenario, we show the results of frozen pea production from the “cradle-to-factory gate” expressed per kg of frozen peas. Conventional peas comprise 96% of processed peas, while organic peas comprise the other 4%. Results are reported for multiple impact categories, emphasizing climate change. The interpretation of results includes contribution analysis of the phases, key processes, and substances (hotspot analysis), sensitivity analysis, and data uncertainty analysis. The LCIA results are normalized and expressed in units of person equivalent (PE) based on the total impact of a reference region for a certain impact category in the EF 3.0 method. Each person equivalent represents the amount of environmental impact that equals one person’s average yearly share of the total impact of a reference region for a specific impact category in 2010 [52]. The life cycle impact analysis relied on average estimations of parameter values, which have some uncertainty and could affect the conclusions drawn. Again, as mentioned previously, the uncertainty associated with the second method of evaluating the impact of the cultivation phase was defined as a uniform distribution based on the mean, minimum, and maximum parameter values. We also considered how the results would be affected by excluding iLUC. Scenario uncertainty analysis of the cultivation phase parameters was also evaluated. To assess the impact of varying key parameters on different categories, we conducted a local sensitivity analysis on the cultivation phase (excluding the iLUC) by increasing the input values by 10% for one input at a time and calculating the corresponding result scores and sensitivity ratio (SR). A total of 44 parameters were tested and analyzed. Uncertainty related to background processes from the Ecoinvent database adopted into the model was included. However, there is some uncertainty regarding the geographical representativeness of the anaerobic digestion process, which was based on the process model available in the EASETECH model rather than a specific one for the Italian context.

3. Results and Discussion

This section presents and discusses the LCIA results of pea cultivation based on the two data handling approaches (Section 3.1), LCIA results of frozen peas from “cradle-to-factory gate” (Section 3.2), and pea residue management (Section 3.3). Normalized results and the sensitivity of model parameters are also presented and discussed in Section 3.4 and Section 3.5, respectively.

3.1. Cradle-to-Farm Gate Analysis (Conventional vs. Organic Pea Cultivation)

The environmental impacts of conventional and organic pea cultivation, considering the two data handling approaches per kg of freshly harvested peas, are shown in Table 3. The results suggest that conventional pea production has, on average, a more significant environmental impact than organic pea production in both scenarios. However, in the baseline method, some overlap exists due to the wide variability observed, as certain conventional farms perform better than their organic counterparts (Figure 4). Similarly, Tidåker et al. [28] reported organic yellow and grey peas as slightly more impacting. (0.18 to 0.24 kgCO2 eq./kg product) than conventional yellow and grey peas (0.18 to 0.20 kg CO2 eq./kg product). The alternative scenario, on the other hand, exhibits no overlap, likely because of the selected range. The primary contributors to the overall environmental impact differed for different impact categories.
The primary drivers of environmental impact varied across different impact categories. For climate change (CC), the most significant contributors were direct emissions from fertilizers, mainly dinitrogen monoxide, and background processes involving input materials like pea seeds and ammonium nitrate. Additionally, combined harvesting, harrowing, plowing, and sowing substantially contributed to CC impact. In terms of other impact categories like photochemical ozone formation (PCOF), processes such as broadcast fertilizing, sowing, hoeing, and manure spreading had the most significant impact due to the emission of nitrogen oxides, nitric oxides, and non-methane volatile compounds (NMVOCs) from background processes. Similarly, for human toxicity carcinogenic (HT car), heavy metals associated with field operations like hoeing, sowing, and manure spreading were the primary contributors to the overall impact. In the context of organic farms, fewer synthetic chemicals are employed, with the usage of biostimulants presenting low environmental impacts. Moreover, plant protection products were excluded from impact calculation due to a lack of data. It is also important to acknowledge that certain organic farms recorded no yields and were consequently excluded from the dataset under consideration. Therefore, although organic farming practices may have a reduced impact due to the limited control available to farmers to address unexpected adversities like pest attacks swiftly, it is essential to recognize that significantly higher impacts may be reported if minimal or no yields are obtained despite the resources expended, thus undermining environmental sustainability.
Comparing the outcomes obtained from the various data treatment approaches, substantial discrepancies were observed for conventional farms, whereas minimal disparities were observed for organic farms (Figure 4). In the alternative scenario, the environmental impacts of conventional peas were considerably higher than those in the baseline scenario across all impact categories. However, the extent of the differences varied. For instance, climate change (CC) impacts doubled in the alternative scenario, while ozone depletion (OD), ionizing radiation (IR), and the resource use of minerals and metals (RUMM) increased by over 200%. These variations can be attributed to the specified range of values between the minimum and maximum values. In the uniform distribution, all values between the maximum and minimum values have an equal probability of occurring, and therefore, applying it to data that are not normally distributed can skew the outcomes. For example, the climate change results for the conventional baseline scenario show results of 0.98, 2.89, and 0.58 kg CO2 per kilogram of fresh peas for the mean, maximum, and negative values, respectively. This implies that the datasets are positively skewed and account for higher impact scores for the alternative scenario. It is important to note that these maximum and minimum values may be outliers or extreme values that significantly influence the results and introduce higher uncertainty. However, eliminating outliers may only sometimes be ideal, as each farm possesses unique characteristics in the case foreground data have low uncertainty. Although the baseline method may be more time-consuming, particularly for large datasets, it ensures traceability and aids in the identification of farms with distinct characteristics. This approach helps to reduce uncertainty and enables the development of tailored mitigation strategies for specific farms. Moreover, farms with low impacts can serve as models for those with higher impacts.
Regarding the contribution analyses for the two data handling approaches, few discrepancies were observed concerning the significant impacting processes for the same cultivation system (Supplementary Materials). Additionally, conventional and organic peas exhibited a similar trend for the most impactful processes in the baseline scenario. However, in the alternative scenario, direct emissions were relatively more impactful for conventional peas compared to organic peas, particularly for particulate matter (PM), acidification potential (AC), and eutrophication, terrestrial (EUTT). Considering the limited disparities between the results obtained from the two data treatment approaches, it can be inferred that there is convergence and comparability in terms of relative contribution. Both methods offer valuable insights into the most influential processes and phases, thereby supporting the development of mitigation strategies to reduce impacts when appropriately addressed. Nevertheless, it is crucial to avoid drawing misleading conclusions by directly comparing the absolute results of the same product without considering the underlying modeling approaches utilized.
In both cultivation systems, iLUC significantly contributed to various impact categories, particularly CC, EFTW, PCOF, RUMM, and REUC. iLUC accounted for nearly half of the climate change score for pea cultivation. When excluding iLUC, CC scores for conventional and organic peas were 0.52 kg CO2 eq. and 0.44 kg CO2 eq. per 1 kg fresh peas, respectively. These results are higher than those reported in previous studies, ranging between 0.13 kg CO2 eq. and 0.32 kg CO2 eq. per 1 kg fresh peas [22,26,28,29,31] and 0.57 kg CO2.eq. per 1 kg dried peas [30]. Several reasons could explain the higher scores obtained in this study. One notable reason could be impacts related to the N sources and their related emissions. This study considered inorganic sources (urea and ammonium nitrate) and digestate, while other studies like Svanes et al. [30] considered N emissions from only crop residues and mineralized soil. Furthermore, differences in crop yields may also contribute to the variations in results. For example, this study’s average crop yield per hectare was 4 tonnes, whereas Del Borghi et al. [31] reported a higher value of 5 to 5.5 tonnes. Differences and uncertainties regarding data sources could also contribute to the differences in findings, as several studies relied on secondary data sources [22,26,29].
In this study, we focused solely on iLUC and did not consider direct land-use change (dLUC). Given that the cultivated fields were already dedicated to crop production with no needed expansion, and that pea cultivation was intensified through fertilizer use, we excluded dLUC. The magnitude of the iLUC impacts was directly related to an equivalent demand for the arable land used for pea cultivation for other activities. Increasing productivity through strategies such as improved breeding varieties to meet the same market demand will decrease the land size required, consequently leading to decreased iLUC impacts. Conversely, where land productivity is low, as is often the case in organic farming, more land will be required to meet the same demand, resulting in higher iLUC impacts. Accordingly, analysis of the relative contributions of organic peas revealed a slightly greater contribution of iLUC to the various impact categories for both scenarios compared to conventional peas (Supplementary Materials, S1: Sheet “contribution analysis_baseline” and ”contribution analysis alternati”).

3.2. Cradle-to-Factory Gate Analysis (Impacts of Frozen Peas Production)

The environmental impacts of the entire frozen peas production system by the medium-scale processor, expressed per the functional unit (1 kg of frozen peas), are summarized in Table 4. The total CC score was 1.35 kg CO2 eq., including pea residue management. However, when excluding iLUC from the cultivation phase, CC was 0.82 kg CO2 eq./kg frozen peas. Furthermore, by excluding iLUC and pea residue management, CC increased to 0.85 kg CO2 eq./kg frozen peas. These findings align with a previous study by Del Borghi et al. [31], which reported a comparable result of 1.18 kg CO2 eq./kg processed peas. Another study conducted in the UK by Frankowska et al. [22] found a cradle-to-retail gate CC of 1.2 kg CO2 eq./kg for frozen shelled peas. When considering the contributions to various impact categories, cultivation (plus related iLUC) was the dominant phase (Figure 5). This finding aligns with similar studies conducted by Ilari et al. [20] and Ríos-Fuentes et al. [24], which also identified cultivation as a key impacting phase. However, others reported the packaging phase [21,31] and processing step [22] as the most impacting step for frozen vegetable production.
Regarding the overall impacts of frozen pea production, the processing phase significantly contributed to CC, OD, IR, and RUEC (Figure 4). Upon further investigation of the processing phase, the significant contributors were electricity consumption and water usage. Electricity accounted for over 60% of the total impacts across most categories, except for WU and HT car, where water consumption accounted for 95% and 50% of the total impacts, respectively. High electricity consumption was heavily linked to the inefficiency of the old motors in the plant. Replacing the motors with new ones could reduce the electricity consumed by 30%. Natural gas heat accounted for less than 15% of the processing phase impact and had a negligible effect on WU and IR. The refrigerant (NH3) was the least impacting and made no significant contribution (<2%) across the various impact categories. The choice of ammonia as a refrigerant is favorable due to its lower environmental impacts than other alternatives [53] coupled with the limited storage time (2 days to 6 months), which explains the low impacts recorded. The CC score for the processing phase was 0.17 kg CO2 eq./FU, comparable to findings of 0.11 kg CO2 eq./kg frozen peas in Poland [54].
Regarding the packaging phase, the iron mesh cage had the highest impact, followed by wooden pallets and corrugated board boxes, with LDPE bags being the least impacting. Iron mesh cages made significant contributions to WU (81%), HT (66%), EUFW (65%), RUMM (60%), IR (55%), and CC (54%). Pallets also accounted for 28% to 32% of the total impacts in OD, POCP, EUTT, PM, and HT car. Corrugated board boxes also mainly impacted EUMA (32%), EUTT (24%), PM (22%), and OD (20%). LDPE bags (single-use plastic) and plastic bins made a relative contribution of less than 10% across all impact categories, except for REUC, which contributed 18% and 17%, respectively. Plastic packaging plays a vital role in preserving food quality, sanitation, and shelf life, although concerns regarding health and pollution exist [55]. In this study, single-use LDPE packaging was less environmentally impacting due to its light weight and the lesser resources and energy required for manufacturing. However, waste disposal and the management of packaging materials were excluded from the analysis.
Transportation had the most negligible impact within the supply chain, responsible for less than 4% of the impacts across all impact categories. This was primarily due to the relatively short transport distance between the fields and the processing company, with more than 60% of the raw materials sourced regionally. It should be noted that these findings are specific to the processing plant and must not be considered as a generalization of the entire Italian frozen pea supply chain. Several factors, such as transportation quantity, distance traveled, transport mode, and load capacity, could significantly influence the results. Nevertheless, many food processing companies strive to adopt sourcing materials locally (zero km food) due to associated environmental, economic, and social benefits [56].

3.3. Pea Residue Management

The inefficient processing of peas resulted in a significant amount of residue, leading to higher environmental impacts. By improving processing efficiency from 85% to 90%, it was possible to reduce impacts by 6%. Vegetable residue, comprising leaves, stalks, and florets, typically accounts for a substantial proportion of the total residue, ranging from 15% to 30% [21,22,24]. While enhancing processing efficiency is crucial for improving the overall environmental performance of frozen peas, it is important to recognize that increasing yield is not always feasible. Therefore, exploring alternative residue management strategies as an ideal approach to mitigate this impact is advisable. Managing the residue through anaerobic digestion yielded some benefits through substituted electricity and mineral fertilizer (Table 4 and Figure 5). Notable reductions were observed for WU (−67%), HT car (−39%), HT non-car (26%), and EUFW (10%). Exploring alternative management strategies for residue based on its biomass composition, such as its use as animal feed, compost, or bio-compound feedstock, may yield even greater benefits. Another promising approach involves rearing insects like Hermetia illucens on pea residue and utilizing the resulting litter in agricultural biogas plants, which can further enhance the valorization of the residue [57].

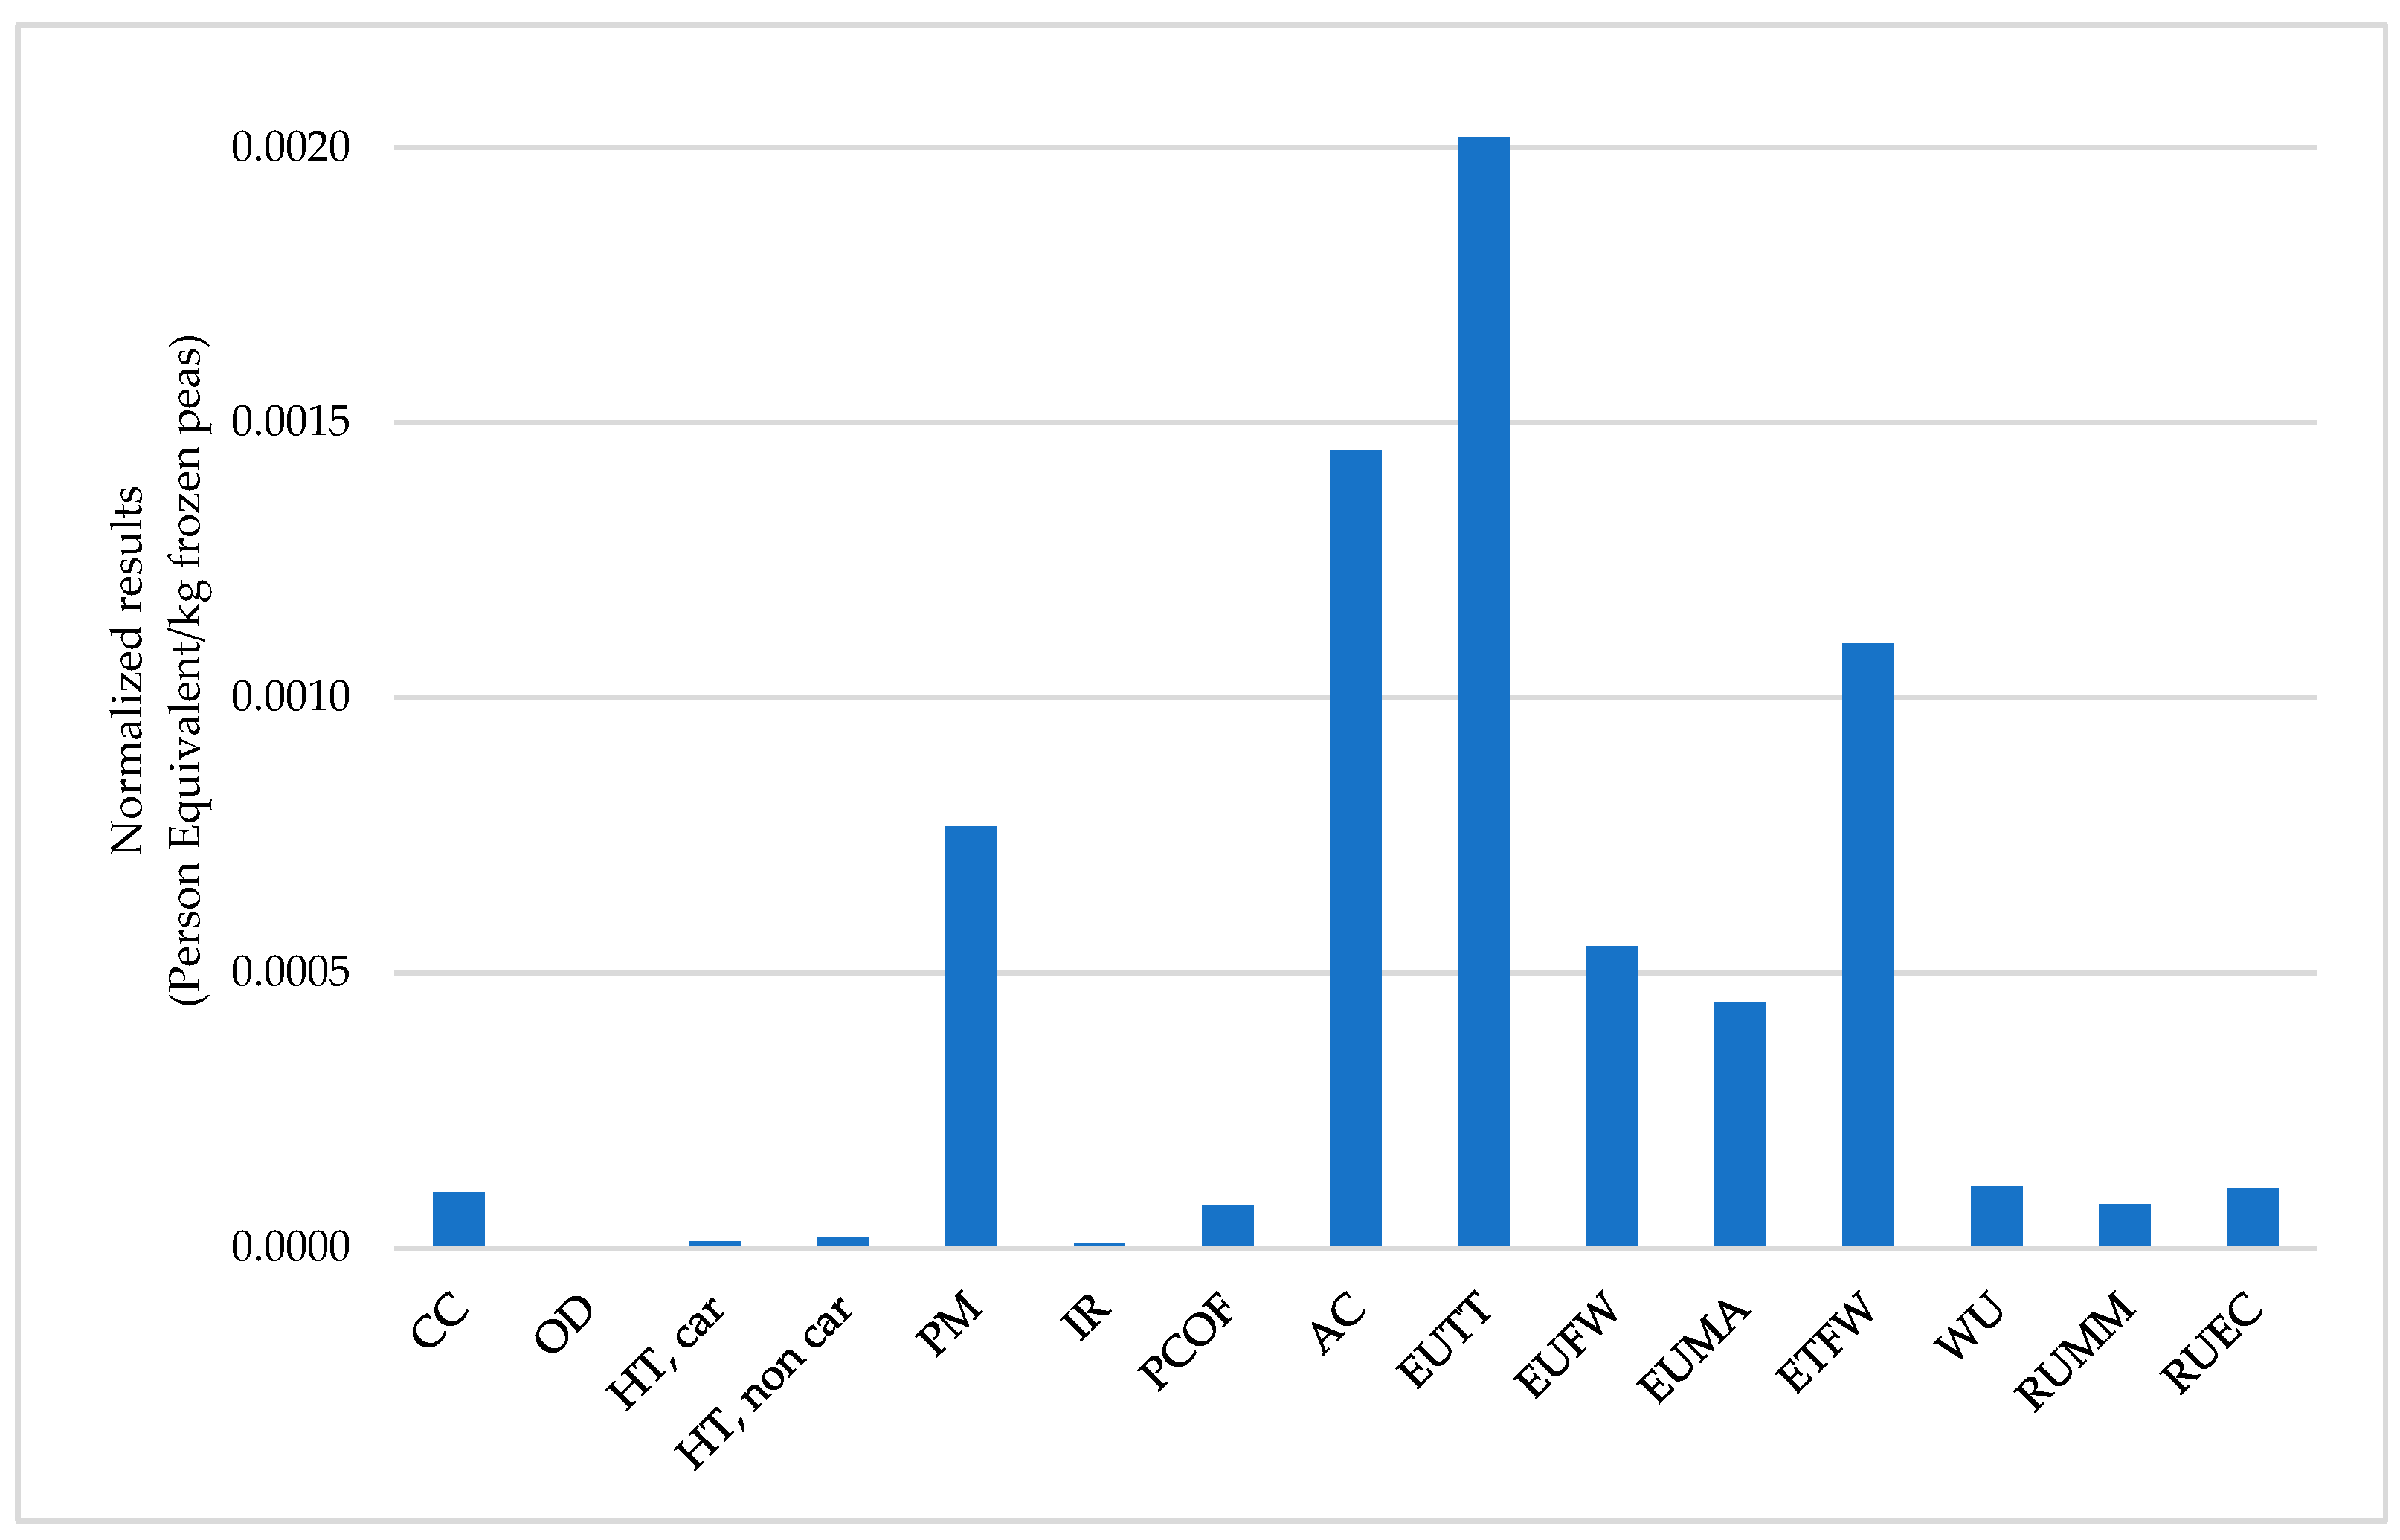
3.4. Normalized LCA Results

The normalized LCIA results for the impact categories in the EF 3.0 LCIA methodology are summarized in Figure 6. The highest normalized impact category is eutrophication, terrestrial (EUTT), followed by ecotoxicity, freshwater (ETFW), acidification (AC), and particulate matter (PM). Therefore, improvement in these categories can result in significant relative reductions in environmental impacts. The cultivation phase is primarily responsible for most impacts, with elements such as sulfur, ammonium, chloride, and aluminum being the main contributors. These substances are leached into the groundwater and soil due to agrochemicals, field operations, and emissions from iLUC. In the case of EUTT, AC, and PM, nitrogen compounds, including ammonia, nitrogen oxides, and nitric oxides from synthetic fertilizers and digestate, play a significant role. The emission inventory in the background data, particularly particulates, is also a key driver of the results. To mitigate these impacts, several strategies can be implemented. These include reducing applied nitrogen fertilizers and improving nitrogen use efficiency by incorporating nitrification inhibitors such as urease. These inhibitors can extend the duration during which the active nitrogen component of the fertilizer remains in the soil, either as urea-N or ammonium-N. Adopting these strategies makes it possible to reduce emissions and minimize the environmental footprint associated with these impact categories [58].

3.5. Sensitivity of Model Parameters

Due to the high impacts of the cultivation phase, we conducted a perturbation analysis to identify the most sensitive model parameters under the two farming systems based on the sensitivity ratio (SR). Although most parameters had very low or negligible SRs (<0.2), the sensitivity of the parameters varied across the various impact categories (Supplementary Materials). Direct emissions from synthetic fertilizers and digestate, farm operations such as combined harvesting and tillage, and sowing material were the most significant and sensitive parameters based on this study’s model. For conventional pea cultivation, the main sensitive parameters with an SR between 0.2 and 0.6 were combined harvesting (OD, PM, IR, PCOP, RUMM, and RUEC), CuSO4 (RUMM), sowing material (HT-non car, ETFW, and WU), direct emissions of NH3 (PM, AC, and EUTT), N2O (CC), the release of NO3- into groundwater (EUMA), and P leaching into the soil (EUFW). Similarly, for organic pea cultivation, combined harvesting (OD, HT car, IR, PCOP, RUMM, and RUEC), plowing (OD, IR, and RUEC), sowing material (HT non-car, ETFW, and WU), direct emissions of NH3 (PM, AC, and EUTT), N2O (CC), the release of NO3- into groundwater (EUMA), and P leaching into the soil (EUFW) were the most sensitive parameters. Therefore, reducing emissions from applied fertilizers, as discussed earlier, can significantly reduce impacts.

4. Conclusions

This study quantified the potential environmental impacts of frozen green pea production from two cultivation systems (conventional and organic) in Italy using LCA from a “cradle-to-factory gate” perspective. Based on first-hand data, we explored two ways of treating the farm data: modeling all the single farms and then either finding the average impacts (baseline) or using the average, maximum, and minimum values of each parameter to calculate the impacts based on a uniform distribution (alternative). In the EASETECH software, the foreground system was evaluated using a process-specific and input-specific LCA model, which follows the material flow within the system and considers the products’ physicochemical composition. We also included the environmental implications of pea cultivation linked to iLUC by applying a deterministic model.
Comparing the results for the two data treatments, we found significant differences between the results of the conventional peas with respect to absolute values. For example, the mean CC score for the baseline and alternative was 0.98 kg CO2 eq. and 2.09 kg CO2 eq./1 kg fresh peas, respectively. However, there was little difference in the results for the organic peas. Regarding the relative contribution analyses, negligible differences were observed for both scenarios. The results’ similarity depends on data skewness and potential outliers since the range between the maximum and minimum values significantly influences the results. Therefore, we recommend the baseline method even though it is time-consuming since the alternative method requires uniformly distributed data. Additionally, LCA studies involving extensive datasets must include details on handling the data. This will allow for a fair comparison and provide insights into the uncertainties associated with the results to ensure a cautious interpretation of the conclusions.
Concerning the cultivation systems in this study, we found that green peas produced by conventional farming systems were generally more environmentally impacting than organic peas for all the impact categories assessed. However, data for organic farming agricultural products were unavailable, potentially biasing the results in favor of organic peas. Further research is required to properly characterize these products for a balanced comparison. Moreover, some organic farms with no yields due to biotic and abiotic factors were excluded from the study. There were also few organic farms compared to conventional farms, resulting in an asymmetrical comparison. Although this is a true reflection of the current reality, there is greater uncertainty regarding the organic farm results since the small sample size affects precision and accuracy and introduces some biases, complicating the interpretation of the results. Hence, selecting the more environmentally friendly farming system should be based on factors influencing productivity, like cultivar, soil, and climatic conditions. Including iLUC also significantly affected several impact categories. For climate change, iLUC accounted for nearly half of the total impacts in both conventional and organic peas. Although controversial, the study highlights the importance of including iLUC in LCA to avoid burden shifting in food production.
The study also found that the total CC for producing 1 kg of frozen peas at the factory gate was 0.85 kg CO2 eq. (excluding iLUC). Cultivation was the most impacting phase, contributing more than 50% toward several impact categories, while transportation and packaging were the least impacting. Direct emissions from applied fertilizer were the main impacting substances and processes for the cultivation phase. Thus, reducing nitrogen emissions through reduced fertilizer use and improving nitrogen use efficiency by incorporating nitrification inhibitors could significantly reduce the total impacts of pea cultivation. Farmers should be encouraged to limit nitrogen use since peas have nitrogen-fixing ability. Enhancing efficiency and minimizing impacts during the cultivation phase can significantly advance the overall environmental sustainability of frozen peas, fostering our collective efforts toward promoting the consumption of sustainable diets.
Moreover, increased consumer demand for fresh peas can result in a corresponding expansion in cultivation practices, potentially leading to dLUC and iLUC. It is crucial to prioritize the promotion of frozen peas due to their extended shelf life and relatively minimized postharvest losses. This shift can be advantageous as the processing and storage phases have a reduced impact on land use and other environmental impacts compared to cultivating additional fresh peas. While this transition may necessitate increased energy consumption, a strategic move towards renewable energy sources can mitigate environmental consequences. Furthermore, pea residue management through anaerobic digestion resulted in substantial credits for some impact categories, such as water use and human toxicity. Although pea residue management through anaerobic digestion has some benefits, waste minimization by enhancing pea processing efficiency can lead to better results. Identifying innovative ways to valorize the residue can confer even greater environmental benefits. The findings obtained in this study are specific to the analyzed Italian system and should be interpreted within that context, and we caution against overgeneralization of these findings.

Supplementary Materials

The following supporting information can be downloaded at: https://www.mdpi.com/article/10.3390/su151813373/s1, Excel File S1: sustainability-15-13373-supplementary.

Author Contributions

Conceptualization, D.D. and A.I.; methodology, V.B. and K.A.B.-Y.; software, V.B.; validation, V.B. and D.D.; formal analysis, K.A.B.-Y. and A.I.; investigation, K.A.B.-Y.; resources, V.B. and D.D.; data curation, K.A.B.-Y.; writing—original draft preparation, D.D., V.B., K.A.B.-Y. and A.I.; writing—review and editing, D.D., V.B. and K.A.B.-Y.; supervision, D.D. and V.B.; project administration, E.F.P. and D.D.; funding acquisition, E.F.P. and D.D. All authors have read and agreed to the published version of the manuscript.

Funding

This research was carried out within the Agritech National Research Center and partly received funding from the European Union Next-GenerationEU (PIANO NAZIONALE DI RIPRESA E RESILIENZA (PNRR)—MISSIONE 4 COMPONENTE 2, INVESTIMENTO 1.4—D.D. 1032 17/06/2022, CN00000022). This research was also carried out within the BSFlyGreen project PSR Marche 2014/2020 ID 42668.

Institutional Review Board Statement

Not applicable.

Informed Consent Statement

Not applicable.

Data Availability Statement

Data are contained within the article or Supplementary Materials.

Conflicts of Interest

The authors declare no conflict of interest. The funders had no role in the design of the study; in the collection, analyses, or interpretation of data; in the writing of the manuscript; or in the decision to publish the results.

References

  1. Hertwich, E. Assessing the Environmental Impacts of Consumption and Production: Priority Products and Materials; Programa de la Naciones Unidas Para el Medio Ambiente: Nairobi, Kenya, 2010; ISBN 978-92-807-3084-5. [Google Scholar]
  2. Poore, J.; Nemecek, T. Reducing food’s environmental impacts through producers and consumers. Science 2018, 360, 987–992. [Google Scholar] [CrossRef]
  3. Withers, P.J.A.; Neal, C.; Jarvie, H.P.; Doody, D.G. Agriculture and Eutrophication: Where Do We Go from Here? Sustainability 2014, 6, 5853–5875. [Google Scholar] [CrossRef]
  4. Zaehringer, J.G.; Atumane, A.; Berger, S.; Eckert, S. Large-scale agricultural investments trigger direct and indirect land use change: New evidence from the Nacala corridor, Mozambique. J. Land Use Sci. 2018, 13, 325–343. [Google Scholar] [CrossRef]
  5. Ivanovich, C.C.; Sun, T.; Gordon, D.R.; Ocko, I.B. Future warming from global food consumption. Nat. Clim. Chang. 2023, 13, 297–302. [Google Scholar] [CrossRef]
  6. Ivanova, D.; Stadler, K.; Steen-Olsen, K.; Wood, R.; Vita, G.; Tukker, A.; Hertwich, E.G. Environmental Impact Assessment of Household Consumption. J. Ind. Ecol. 2016, 20, 526–536. [Google Scholar] [CrossRef]
  7. Vermeir, I.; Weijters, B.; De Houwer, J.; Geuens, M.; Slabbinck, H.; Spruyt, A.; Van Kerckhove, A.; Van Lippevelde, W.; De Steur, H.; Verbeke, W. Environmentally Sustainable Food Consumption: A Review and Research Agenda From a Goal-Directed Perspective. Front. Psychol. 2020, 11, 1603. Available online: https://www.frontiersin.org/articles/10.3389/fpsyg.2020.01603 (accessed on 23 August 2023). [CrossRef] [PubMed]
  8. Langyan, S.; Yadava, P.; Khan, F.N.; Dar, Z.A.; Singh, R.; Kumar, A. Sustaining Protein Nutrition Through Plant-Based Foods. Front. Nutr. 2022, 8, 772573. Available online: https://www.frontiersin.org/articles/10.3389/fnut.2021.772573 (accessed on 23 August 2023). [CrossRef]
  9. Reynolds, T.W.; Waddington, S.R.; Anderson, C.L.; Chew, A.; True, Z.; Cullen, A. Environmental impacts and constraints associated with the production of major food crops in Sub-Saharan Africa and South Asia. Food Secur. 2015, 7, 795–822. [Google Scholar] [CrossRef]
  10. Casella, F.; Vurro, M.; Valerio, F.; Perrino, E.V.; Mezzapesa, G.N.; Boari, A. Phytotoxic Effects of Essential Oils from Six Lamiaceae Species. Agronomy 2023, 13, 257. [Google Scholar] [CrossRef]
  11. Accogli, R.; Tomaselli, V.; Direnzo, P.; Perrino, E.V.; Albanese, G.; Urbano, M.; Laghetti, G. Edible Halophytes and Halo-Tolerant Species in Apulia Region (Southeastern Italy): Biogeography, Traditional Food Use and Potential Sustainable Crops. Plants 2023, 12, 549. [Google Scholar] [CrossRef]
  12. Çakmakçı, R.; Salık, M.A.; Çakmakçı, S. Assessment and Principles of Environmentally Sustainable Food and Agriculture Systems. Agriculture 2023, 13, 1073. [Google Scholar] [CrossRef]
  13. Wognum, P.M.; Bremmers, H.; Trienekens, J.H.; van der Vorst, J.G.A.J.; Bloemhof, J.M. Systems for sustainability and transparency of food supply chains—Current status and challenges. Adv. Eng. Inform. 2011, 25, 65–76. [Google Scholar] [CrossRef]
  14. Ott, D.; Goyal, S.; Reuss, R.; Gutzeit, H.O.; Liebscher, J.; Dautz, J.; Degieter, M.; de Steur, H.; Zannini, E. LCA as decision support tool in the food and feed sector: Evidence from R&D case studies. Environ. Syst. Decis. 2023, 43, 129–141. [Google Scholar] [CrossRef]
  15. Cucurachi, S.; Scherer, L.; Guinée, J.; Tukker, A. Life Cycle Assessment of Food Systems. One Earth 2019, 1, 292–297. [Google Scholar] [CrossRef]
  16. ISO 14040:2006; Environmental Management—Life Cycle Assessment—Requirements and Guidelines. ISO: Geneva, Switzerland, 2006. Available online: https://www.iso.org/standard/37456.html (accessed on 5 May 2023).
  17. ISO 14044:2006; Environmental Management—Life Cycle Assessment—Principles and Framework. ISO: Geneva, Switzerland, 2006. Available online: https://www.iso.org/standard/38498.html (accessed on 5 May 2023).
  18. Ribeiro, T.B.; Voss, G.B.; Coelho, M.C.; Pintado, M.E. Chapter 33—Food Waste and by-Product Valorization as an Integrated Approach with Zero Waste: Future challenges. In Future Foods; Bhat, R., Ed.; Academic Press: Cambridge, MA, USA, 2022; pp. 569–596. Available online: https://www.sciencedirect.com/science/article/pii/B9780323910019000177 (accessed on 23 August 2023).
  19. The European Market Potential for Frozen Vegetables|CBI. Available online: https://www.cbi.eu/market-information/processed-fruit-vegetables-edible-nuts/frozen-vegetables/market-potential (accessed on 5 May 2023).
  20. Ilari, A.; Duca, D.; Toscano, G.; Pedretti, E.F. Evaluation of cradle to gate environmental impact of frozen green bean production by means of life cycle assessment. J. Clean. Prod. 2019, 236, 117638. [Google Scholar] [CrossRef]
  21. Pedretti, E.F.; Duca, D.; Ballarini, M.; Boakye-Yiadom, K.A.; Ilari, A. Environmental impact assessment of producing frozen spinach in central Italy. Resour. Environ. Sustain. 2023, 12, 100110. [Google Scholar] [CrossRef]
  22. Frankowska, A.; Jeswani, H.K.; Azapagic, A. Environmental impacts of vegetables consumption in the UK. Sci. Total Environ. 2019, 682, 80–105. [Google Scholar] [CrossRef]
  23. Stoessel, F.; Juraske, R.; Pfister, S.; Hellweg, S. Life Cycle Inventory and Carbon and Water FoodPrint of Fruits and Vegetables: Application to a Swiss Retailer. Environ. Sci. Technol. 2012, 46, 3253–3262. [Google Scholar] [CrossRef]
  24. Ríos-Fuentes, B.; Rivas-García, P.; Estrada-Baltazar, A.; Rico-Martínez, R.; Miranda-López, R.; Botello-Álvarez, J.E. Life cycle assessment of frozen broccoli processing: Environmental mitigation scenarios. Sustain. Prod. Consum. 2022, 32, 27–34. [Google Scholar] [CrossRef]
  25. MacWilliam, S.; Wismer, M.; Kulshreshtha, S. Life cycle and economic assessment of Western Canadian pulse systems: The inclusion of pulses in crop rotations. Agric. Syst. 2014, 123, 43–53. [Google Scholar] [CrossRef]
  26. MacWilliam, S.; Parker, D.; Marinangeli, C.P.F.; Trémorin, D. A meta-analysis approach to examining the greenhouse gas implications of including dry peas (Pisum sativum L.) and lentils (Lens culinaris M.) in crop rotations in western Canada. Agric. Syst. 2018, 166, 101–110. [Google Scholar] [CrossRef]
  27. Nemecek, T.; von Richthofen, J.-S.; Dubois, G.; Casta, P.; Charles, R.; Pahl, H. Environmental impacts of introducing grain legumes into European crop rotations. Eur. J. Agron. 2008, 28, 380–393. [Google Scholar] [CrossRef]
  28. Tidåker, P.; Karlsson Potter, H.; Carlsson, G.; Röös, E. Towards sustainable consumption of legumes: How origin, processing and transport affect the environmental impact of pulses. Sustain. Prod. Consum. 2021, 27, 496–508. [Google Scholar] [CrossRef]
  29. Bandekar, P.A.; Putman, B.; Thoma, G.; Matlock, M. Cradle-to-grave life cycle assessment of production and consumption of pulses in the United States. J. Environ. Manag. 2022, 302, 114062. [Google Scholar] [CrossRef] [PubMed]
  30. Svanes, E.; Waalen, W.; Uhlen, A.K. Environmental impacts of field peas and faba beans grown in Norway and derived products, compared to other food protein sources. Sustain. Prod. Consum. 2022, 33, 756–766. [Google Scholar] [CrossRef]
  31. Del Borghi, A.; Strazza, C.; Magrassi, F.; Taramasso, A.C.; Gallo, M. Life Cycle Assessment for eco-design of product–package systems in the food industry—The case of legumes. Sustain. Prod. Consum. 2018, 13, 24–36. [Google Scholar] [CrossRef]
  32. Wittwer, R.A.; Bender, S.F.; Hartman, K.; Hydbom, S.; Lima, R.A.A.; Loaiza, V.; Nemecek, T.; Oehl, F.; Olsson, P.A.; Petchey, O.; et al. Organic and conservation agriculture promote ecosystem multifunctionality. Sci. Adv. 2021, 7, eabg6995. [Google Scholar] [CrossRef]
  33. Bisinella, V.; Conradsen, K.; Christensen, T.H.; Astrup, T.F. A global approach for sparse representation of uncertainty in Life Cycle Assessments of waste management systems. Int. J. Life Cycle Assess. 2016, 21, 378–394. [Google Scholar] [CrossRef]
  34. González-García, S.; Almeida, F.; Brandão, M. Do Carbon Footprint Estimates Depend on the LCA Modelling Approach Adopted? A Case Study of Bread Wheat Grown in a Crop-Rotation System. Sustainability 2023, 15, 4941. [Google Scholar] [CrossRef]
  35. Schmidt, J.H.; Weidema, B.P.; Brandão, M. A framework for modelling indirect land use changes in Life Cycle Assessment. J. Clean. Prod. 2015, 99, 230–238. [Google Scholar] [CrossRef]
  36. Gawel, E.; Ludwig, G. The iLUC dilemma: How to deal with indirect land use changes when governing energy crops? Land Use Policy 2011, 28, 846–856. [Google Scholar] [CrossRef]
  37. Dale, V.H.; Efroymson, R.A.; Kline, K.L. The land use–climate change–energy nexus. Landsc. Ecol. 2011, 26, 755–773. [Google Scholar] [CrossRef]
  38. Daioglou, V.; Woltjer, G.; Strengers, B.; Elbersen, B.; Barberena Ibañez, G.; Sánchez Gonzalez, D.; Gil Barno, J.; van Vuuren, D.P. Progress and barriers in understanding and preventing indirect land-use change. Biofuels Bioprod. Biorefining 2020, 14, 924–934. [Google Scholar] [CrossRef]
  39. European Commission, Joint Research Centre. European Commission—Joint Research Centre—Institute for Environment and Sustainability: International Reference Life Cycle Data System (ILCD) Handbook—General Guide for Life Cycle Assessment—Detailed Guidance; EUR 24708 EN; Publications Office: Luxembourg, 2010; Available online: https://data.europa.eu/doi/10.2788/38479 (accessed on 5 May 2023).
  40. International EPD® System. Product Category Rules: Vegetable Juices and Other Prepared and Preserved Vegetables, Pulses and Potatoes (Product Category Classification: UN CPC 213, 214). Version 2.0. 2019. Available online: https://api.environdec.com/api/v1/EPDLibrary/Files/e8d0a500-4a67-4923-28e9-08db259f9365/Data (accessed on 22 February 2023).
  41. International EPD® System. Product Category Rules: Arable Crops (PRODUCT GROUP: UN CPC 011, 012, 014, 017, 0191). version 1.01. 2020. Available online: https://api.environdec.com/api/v1/EPDLibrary/Files/5f58c9ff-0ce4-4668-243c-08db259f9365/Data (accessed on 3 August 2023).
  42. International EPD® System. General Programme Instructions for the International EPD® System 4.0. 2021. Available online: https://www.datocms-assets.com/37502/1617181375-general-programme-instructions-v-4.pdf (accessed on 22 February 2023).
  43. ISO 14025:2006; Environmental Labels and Declarations—Type III Environmental Declarations—Principles and Procedures. ISO: Geneva, Switzerland, 2006. Available online: https://www.iso.org/standard/38131.html (accessed on 5 May 2023).
  44. Clavreul, J.; Baumeister, H.; Christensen, T.H.; Damgaard, A. An environmental assessment system for environmental technologies. Environ. Model. Softw. 2014, 60, 18–30. [Google Scholar] [CrossRef]
  45. Wernet, G.; Bauer, C.; Steubing, B.; Reinhard, J.; Moreno-Ruiz, E.; Weidema, B. The ecoinvent database version 3 (part I): Overview and methodology. Int. J. Life Cycle Assess. 2016, 21, 1218–1230. [Google Scholar] [CrossRef]
  46. Fazio, S.; Biganzioli, F.; De Laurentiis, V.; Zampori, L.; Sala, S.; Diaconu, E. Supporting Information to the Characterisation Factors of Recommended EF Life Cycle Impact Assessment Methods: Version 2, from ILCD to EF 3.0; Publications Office: Luxembourg; Available online: https://data.europa.eu/doi/10.2760/002447 (accessed on 23 February 2023).
  47. Möller, K.; Müller, T. Effects of anaerobic digestion on digestate nutrient availability and crop growth: A review. Eng. Life Sci. 2012, 12, 242–257. [Google Scholar] [CrossRef]
  48. Margni, M.; Rossier, D.; Crettaz, P.; Jolliet, O. Life cycle impact assessment of pesticides on human health and ecosystems. Agric. Ecosyst. Environ. 2002, 93, 379–392. [Google Scholar] [CrossRef]
  49. Tonini, D.; Hamelin, L.; Astrup, T.F. Environmental implications of the use of agro-industrial residues for biorefineries: Application of a deterministic model for indirect land-use changes. GCB Bioenergy 2016, 8, 690–706. [Google Scholar] [CrossRef]
  50. DEFRA Guidelines to Defra/DECC’s GHG Conversion Factors for Company Reporting: Methodology Paper for Emission Factors. Department for Environment, Food & Rural Affairs 2011. Department for Environment, Food and Rural Affairs, Nobel House, 17 Smith Square, London SW1P 3JR (UK). Available online: https://www.gov.uk/government/publications/2011-guidelines-to-defra-decc-s-greenhouse-gas-conversion-factors-for-company-reporting-methodology-paper-for-emission-factors (accessed on 22 February 2023).
  51. GHG Protocol HFC Tool. Calculating HFC and PFC Emissions from the Manufacturing, Installation, Operation and Disposal of Refrigeration & Airconditioning Equipment (Version 1.0). 2005. Available online: https://ghgprotocol.org/sites/default/files/hfc-cfc_1.pdf (accessed on 22 February 2023).
  52. Sala, S.; Crenna, E.; Secchi, M.; Pant, R. Global Normalisation Factors for the Environmental Footprint and Life Cycle Assessment. JRC Publications Repository. 2018. Available online: https://publications.jrc.ec.europa.eu/repository/handle/JRC109878 (accessed on 19 June 2023).
  53. Rivera, X.C.S.; Azapagic, A. Life cycle costs and environmental impacts of production and consumption of ready and home-made meals. J. Clean. Prod. 2016, 112, 214–228. [Google Scholar] [CrossRef]
  54. Wróbel-Jędrzejewska, M.; Polak, E. Determination of carbon footprint in the processing of frozen vegetables using an online energy measurement system. J. Food Eng. 2022, 322, 110974. [Google Scholar] [CrossRef]
  55. Nielsen, T.D.; Hasselbalch, J.; Holmberg, K.; Stripple, J. Politics and the plastic crisis: A review throughout the plastic life cycle. WIREs Energy Environ. 2020, 9, e360. [Google Scholar] [CrossRef]
  56. Malak-Rawlikowska, A.; Majewski, E.; Wąs, A.; Borgen, S.O.; Csillag, P.; Donati, M.; Freeman, R.; Hoàng, V.; Lecoeur, J.-L.; Mancini, M.C.; et al. Measuring the Economic, Environmental, and Social Sustainability of Short Food Supply Chains. Sustainability 2019, 11, 4004. [Google Scholar] [CrossRef]
  57. Boakye-Yiadom, K.A.; Ilari, A.; Duca, D. Greenhouse Gas Emissions and Life Cycle Assessment on the Black Soldier Fly (Hermetia illucens L.). Sustainability 2022, 14, 10456. [Google Scholar] [CrossRef]
  58. Gao, Y.; Cabrera Serrenho, A. Greenhouse gas emissions from nitrogen fertilizers could be reduced by up to one-fifth of current levels by 2050 with combined interventions. Nat. Food 2023, 4, 170–178. [Google Scholar] [CrossRef] [PubMed]
Figure 1. Overview of the frozen pea production process (“cradle-to-factory gate”) studied. Colored boxes represent phases directly involved in production (common product environmental impact assessment), while others illustrate activities that are indirectly related (i.e., indirect land-use changes and pea residue management).
Sustainability 15 13373 g001
Figure 2. Map of Italy with the geographic locations of the pea-producing provinces.
Sustainability 15 13373 g002
Figure 3. The schematic process flow diagram of frozen peas production at the processing facility.
Sustainability 15 13373 g003
Figure 4. (ad). Environmental impacts of producing 1 kg of conventional and organic fresh peas at the farm gate (including indirect land-use change) based on two data handling approaches. Baseline results refer to averages from modeling all the individual farms, while alternative refers to the impact scores based on a uniform distribution of the average, maximum, and minimum values of parameterized inputs and emissions. Results for the other impact categories can be found in the Supplementary Materials.
Sustainability 15 13373 g004aSustainability 15 13373 g004b
Figure 5. The relative contribution from different phases and processes to various environmental impact categories associated with producing 1 kg of frozen peas (“cradle-to-factory gate”). Results indicated by (a) exclude indirect land-use change (iLUC) and pea residue management, while (b) encompass both factors.
Sustainability 15 13373 g005
Figure 6. Normalized life cycle impact assessment results in person equivalents per 1 kg frozen peas (“cradle-to-factory gate”) based on the Environmental Footprint 3.0 life cycle impact assessment methodology. Results do not include indirect land-use change and pea residue management.
Sustainability 15 13373 g006
Table 1. Life cycle inventory for the cultivation phase of the two cultivation systems expressed per tonne of fresh peas.
ParameterUnitConventional PeasOrganic Peas
Land surfaceha0.1280.124
Seeding ratekg/ha51.249.6
Field operations (tillage, plowing, sowing, fertilizing, plant protection application, hoeing, manure distribution, and harvesting)ha0.2560.248
Nitrogen fertilizer, inorganickg N0.7
Nitrogen fertilizer, digestatekg N43.5442.16
Phosphorus fertilizerkg P2O50.96
Phosphorus fertilizer, digestatekg P5.865.67
Potassium fertilizer kg K2O0.04
Solid digestatekg3658.62696.3
Liquid digestatem33.813.68
Calcium nitratekg0.25
Copper sulfate kg0.13
Zinc oxidekg0.0033
Sulfyl ureakg0.05
Pyrethroid kg0.0025
Thiocarbamatekg0.092
Pendimethalinkg0.12
Aclonifen kg0.14
Benzothiodiazolekg0.053
Phenoxy compoundkg0.005
Gylphosatekg0.00076
Spinosadkg0.001
Mineral oilkg0.034
Direct emissions
NH3-N–air kg10.418.43
N2O–airkg0.430.34
NO–air kg0.270.21
NO3–ground waterkg15.1712.65
P leaching–ground waterkg0.410.40
Indirect emissions
N2O–NH3-N–air kg0.1040.084
N2O–NO3-N–air kg0.1140.095
Table 2. Reference flow of raw materials used to produce 1 kg of frozen peas at the processing facility.
UnitQuantity
Functional unit (FU)kg1
Fresh peas (from the farm)kg1.18
Transport (farm to factory)kg-km1.56 × 102
Electricity (grid)kWh0.12
Electricity (co-generator)kWh0.13
Natural gasMJ6.8 × 10−2
Waterkg17.7
Refrigerant (NH3)kg2.43 × 10−5
Plastic packaging (LDPE)kg1.05 × 10−3
Plastic bin (polypropylene)kg8.85 × 10−4
Corrugated board boxkg5.12 × 10−3
Palletp8.41 × 10−4
Iron mesh cagekg5.63 × 10−2
Emissions
Refrigerant (NH3)kg3.28 × 10−6
Table 3. Environmental impacts associated with producing 1 kg of fresh peas at the farm gate based on two data handling approaches. Baseline results refer to averages from modeling all the individual farms, while alternative refers to the impact scores based on a uniform distribution of the average, maximum, and minimum values of parameterized inputs and emissions. Mean results are reported with standard deviation in brackets.
Impact CategoryBaselineAlternative
ConventionalOrganicConventionalOrganic
CC (kg CO2 eq.)0.98 (0.19)0.88 (1.86 × 10⁻²)2.09 (0.44)0.86 (1.06 × 10⁻²)
OD (kg CFC−11 eq.)3.66 × 10⁻⁸ (9.53 × 10⁻⁹)2.95 × 10⁻⁸ (6.93 × 10⁻¹⁰)1.13 × 10⁻⁷ (1.76 × 10⁻⁸)2.86 × 10⁻⁸ (2.67 × 10⁻¹⁰)
HT, car (CTUh)2.42 × 10⁻¹⁰ (5.62 × 10⁻¹¹)2.03 × 10⁻¹⁰ (4.52 × 10⁻¹²)7.48 × 10⁻¹⁰ (1.04 × 10⁻¹⁰)1.97 × 10⁻¹⁰ (1.62 × 10⁻¹²)
HT, non-car (CTUh)7.06 × 10⁻⁹ (1.7 × 10⁻⁹)5.77 × 10⁻⁹ (1.32 × 10⁻¹⁰)2.05 × 10⁻⁸ (2.94 × 10⁻⁹)5.6 × 10⁻⁹ (5.67 × 10⁻¹¹)
PM (disease incidences)4.77 × 10⁻⁷ (6.28 × 10⁻⁸)4.32 × 10⁻⁷ (4.95 × 10⁻⁹)6.92 × 10⁻⁷ (1.57 × 10⁻⁷)4.26 × 10⁻⁷ (4.14 × 10⁻⁹)
IR (kBq U−235 eq.)1.56 × 10⁻² (5.43 × 10⁻³)1.29 × 10⁻² (3 × 10⁻⁴)6.09 × 10⁻² (1.29 × 10⁻²)1.25 × 10⁻² (1.21 × 10⁻⁴)
PCOF (mol H+ eq.)3.14 × 10⁻³ (6.13 × 10⁻⁴)2.92 × 10⁻³ (6.28 × 10⁻⁵)6.92 × 10⁻³ (1.09 × 10⁻³)2.84 × 10⁻³ (2.63 × 10⁻⁵)
AC (mol N eq.)6.99 × 10⁻² (9.23 × 10⁻³)6.35 × 10⁻² (7.36 × 10⁻⁴)0.1 (2.26 × 10⁻²)6.25 × 10⁻² (5.96 × 10⁻⁴)
EUTT (kg N eq.)3.12 × 10⁻¹ (4.1 × 10⁻²)0.28 (3.29 × 10⁻³)0.45 (1.01 × 10⁻¹)0.28 (2.66 × 10⁻³)
EUFW (kg P eq.)3.22 × 10⁻⁴ (4.65 × 10⁻⁵)3.05 × 10⁻⁴ (4.33 × 10⁻⁶)6.41 × 10⁻⁴ (1.32 × 10⁻⁴)3 × 10⁻⁴ (3.11 × 10⁻⁶)
EUMA (kg N eq.)1.1 × 10⁻² (1.47 × 10⁻³)1.01 × 10⁻² (1.32 × 10⁻⁴)1.65 × 10⁻² (2.77 × 10⁻³)9.92 × 10⁻³ (7.07 × 10⁻⁵)
ETFW (CTUe)17.3 (3.71)15.5 (0.35)44.3 (8.19)15 (0.19)
WU (m3 water eq.)0.26 (6.22 × 10⁻²)0.22 (4.72 × 10⁻³)0.75 (0.16)0.22 (3.23 × 10⁻³)
RUMM (kg SB eq.)4.37 × 10⁻⁶ (1.49 × 10⁻⁶)2.71 × 10⁻⁶ (6.36 × 10⁻⁸)1.81 × 10⁻⁵ (3.15 × 10⁻⁶)2.63 × 10⁻⁶ (2.66 × 10⁻⁸)
RUEC (MJ)3.44 (0.99)2.70 (6.29 × 10⁻²)12.2 (2.23)2.62 (2.5 × 10⁻²)
Table 4. Environmental impacts related to producing 1 kg of frozen peas (“cradle-to-factory gate”), including residue management.
Impact CategoryTotalCultivationiLUCTransportProcessingPackagingAnaerobic DigestionSubstituted
Electricity
Substituted
Fertilizer
CC (kg CO2 eq.)1.350.610.540.020.170.0420.039−0.021−0.049
OD (kg CFC−11 eq.)7.64 × 10−83.68 × 10−86.13 × 10−93.59 × 10−123.07 × 10−83.32 × 10−91.16 × 10⁻¹⁰−6.05 × 10⁻¹⁰−3.63 × 10⁻¹⁴
HT, car (CTUh)1.75 × 10−102.52 × 10−103.17 × 10−111.46 × 10−125.69 × 10−111.34 × 10−105.95 × 10−131.06 × 10⁻¹²−3.03 × 10⁻¹⁰
HT, non-car (CTUh)7.57 × 10−97.27 × 10−99.96 × 10−102.54 × 10−101.14 × 10−97.78 × 10−101.19 × 10⁻⁹−8.93 × 10⁻¹¹−3.96 × 10⁻⁹
PM (disease incidences)5.68 × 10−75.46 × 10−71.46 × 10−85 × 10−101.84 × 10−92.01 × 10−94.90 × 10⁻⁹−5.94 × 10⁻¹⁰−1.15 × 10⁻⁹
IR (kBq U−235 eq.)2.99 × 10−21.37 × 10−24.54 × 10−32.66 × 10−51.02 × 10−24.76 × 10−33.57 × 10⁻⁶−3.37 × 10⁻³−2.69 × 10⁻⁷
PCOF (mol H+ eq.)4.23 × 10−32.63 × 10−31.06 × 10−31.03 × 10−42.81 × 10−41.38 × 10−44.15 × 10−66.88 × 10−5−5.7 × 10⁻⁵
AC (mol N eq.)8.34 × 10−27.98 × 10−22.41 × 10−39.21 × 10−54.47 × 10−41.63 × 10−47.03 × 10⁻⁴−1.77 × 10⁻⁶−1.4 × 10⁻⁴
EUTT (kg N eq.)0.3710.3561.09 × 10−24.44 × 10−49.44 × 10−43.98 × 10−43.14 × 10−33.29 × 10⁻⁴−4.36 × 10⁻⁴
EUFW (kg P eq.)3.78 × 10−43.63 × 10−41.64 × 10−51.60 × 10−82 × 10−51.89 × 10−57.13 × 10⁻⁶−1.63 × 10⁻⁸−4.73 × 10⁻⁵
EUMA (kg N eq.)1.38 × 10−21.24 × 10−24.51 × 10−43.95 × 10−58.24 × 10−54.73 × 10−51.19 × 10−33 × 10−5−4.4 × 10⁻⁴
ETFW (CTUe)21.811.29.090.01751.020.710.165−0.098−0.33
WU (m3 water eq.)−1.350.250.0570.030.950.063.93 × 10−4−2.69−2.99 × 10⁻⁴
RUMM (kg SB eq.)6 × 10−64.11 × 10−69.59 × 10−75.85 × 10−106.18 × 10−72.88 × 10−72.97 × 10⁻⁸−1.38 × 10⁻⁹−4.94 × 10⁻⁹
RUEC (MJ)7.363.140.880.252.980.660.012−0.43−0.15
iLUC—indirect land-use change.
Disclaimer/Publisher’s Note: The statements, opinions and data contained in all publications are solely those of the individual author(s) and contributor(s) and not of MDPI and/or the editor(s). MDPI and/or the editor(s) disclaim responsibility for any injury to people or property resulting from any ideas, methods, instructions or products referred to in the content.

