Article

Investigation of Meteorological Effects on Çivril Lake, Turkey, with Sentinel-2 Data on Google Earth Engine Platform

Department of Geomatics Engineering, Faculty of Engineering, Osmaniye Korkut Ata University, Osmaniye 80000, Turkey
Sustainability 2023, 15(18), 13398; https://doi.org/10.3390/su151813398
Submission received: 31 July 2023 / Revised: 31 August 2023 / Accepted: 3 September 2023 / Published: 7 September 2023
(This article belongs to the Section Sustainable Water Management)

Abstract

:
Lakes and reservoirs, comprising surface water bodies that vary significantly seasonally, play an essential role in the global water cycle due to their ability to hold, store, and clean water. They are crucial to our planet’s ecology and climate systems. This study analyzed Harmonized Sentinel-2 images using the Google Earth Engine (GEE) cloud platform to examine the short-term changes in the surface water bodies of Çivril Lake from March 2018 to March 2023 with meteorological data and lake surface water temperature (LSWT). This study used the Sentinel-2 Level-2A archive, a cloud filter, the NDVI (normalized difference vegetation index), NDWI (normalized difference water index), MNDWI (modified NDWI), and SWI (Sentinel water index) methods on lake surfaces utilizing the GEE platform and the random forests (RFs) method to calculate the water surface areas. The information on the water surfaces collected between March 2018 and March 2023 was used to track the trend of changes in the lake’s area. The seasonal (spring, summer, autumn, and winter) yearly and monthly changes in water areas were identified. Precipitation, evaporation, and temperature are gathered meteorological parameters that impact the observed variation in surface water bodies for the same area. The correlations between the lake area reduction and the chosen meteorological parameters revealed a strong positive or negative significant association. Meteorological parameters and human activities selected during different seasons, months, and years have directly affected the shrinkage of the lake area.

1. Introduction

Wetlands constitute the wealthiest and most productive ecosystems on earth. Wetlands, which have an essential place in the lives of the people living in the immediate vicinity, contribute to the region’s economy, the country, and the natural habitat. It has an essential and different place among other ecosystems in terms of protecting the natural balance and biological diversity. Wetlands play a vital role in water collection, irrigation, and wastewater management or water availability for flood protection, biodiversity conversion, fish stocks, safe drinking water supply, and water quality improvement. In addition, since wetlands are used as a food supply by birds and terrestrial animals, many bird species live in these areas [1]. Climate change and human activities may dramatically affect seasonal and annual variations in surface waters, which may also highly affect the resilience of the ecosystem and the long-term economic and social development of the lake and its surroundings [2,3]. With the decrease in water in wetlands, most aquatic plants stay out of the water, and fishing becomes impossible [1]. Therefore, a detailed mapping of the water surface area is required. Monthly, seasonal, and annual observations can be made in extracting the water surface area. As far as is known, monthly analyses have only been considered by [4,5,6,7,8,9], seasonality analyses have been evaluated by [7,10,11,12,13,14,15,16,17,18], and annual analyses have been assessed by [2,3,11,19,20,21,22,23,24,25].
The most important environmental problems in Çivril Lake, which is located in the Çivril District of Denizli Province, one of the critical wetlands of Turkey, and one of the lake systems rich in aquatic plants, are the opening of the wetlands to agriculture [26] and the deterioration of the water budget balance due to incorrect water use [27], the use of intensive agricultural fertilizers and pesticides [28], and erosion and alluvium carried by rivers [27]. In addition, the decrease in organic matter and plant diversity coupled with an excessive increase in the number of individuals, namely the density of aquatic plants and invasive fish species (such as Israeli carp), are among the most critical problems in these lakes [27].
The release of water from Çivril Lake, which is a dam lake, and the evaporation in the summer months cause a decrease in the water budget in the lake. If some measures are not taken, it is predicted that the water level in the lake will decrease to the drying level, and the lake ecosystem will deteriorate. In the project supported by GEKA (Güney Ege Kalkınma Ajansı) in 2015, a feasibility study was carried out to prevent the lake’s drying, restore its biological diversity and make it sustainable, and contribute to the region’s economic development and the public’s benefit from the lake [28]. At the same time, some studies need to be conducted to have sustainable agriculture. These studies are to regulate agricultural activities and prevent the opening of new agricultural areas for a sustainable conservation–utilization balance in this geography, where climate change, dry periods, and water shortages will be experienced in the future [29]. It is essential to determine whether the lake surface area has decreased due to the inadequacy of the measures taken or the climate change affecting the world. If the measures taken are insufficient, the measures should be increased by meeting with the local managers, and the problems should be found and corrected.
A few studies have been conducted on the surface area of Lake Çivril [30,31]. One of these studies presented a new country-wide database to show the spatio-temporal changes in natural lakes over 20 km2. To extract the database of natural lakes in Turkey, the long-term lake water surface areas of Lake Van, Salt Lake, Burdur Lake, and Beyşehir Lake, and the short-term lake water surface areas of Sapanca Lake, Manyas Lake, Tersakan Lake, and Çivril Lake were determined. The long-term evaluation was performed with Landsat data in spring and fall at 5-year intervals from 1985 to 2020. The short-term evaluation was performed with Sentinel-2 images between March and September 2016 and 2020. According to the study, it is essential to recognize that each lake has unique properties influenced by various factors. Therefore, each lake should be studied on an individual basis. Long- and short-term assessments of lakes should be paired with meteorological data (temperature, precipitation, and evaporation) covering the years of inquiry to comprehend the cause-and-effect relationship [30]. In another study, Landsat data of 10 lakes in Turkey and trend analysis of their surface areas were examined. The analysis reviewed ten lakes in Turkey’s Lakes Region, specifically Acigol, Burdur, Aksehir, Yarisli Isikli, Beysehir, Egirdir, Ilgin, Salda, and Karatas. NDWI was determined for each Landsat satellite image, and the water surfaces were removed using Otsu’s threshold technique from other details. The investigation discovered that all lakes’ F1-score values and overall accuracy were computed to be above 90%. Additionally, a correlation analysis was conducted to examine the connection between the variations in the surface areas of the lakes [31]. The seasonal and annual changes in Çivril Lake were examined, and it was determined that the causes of the decrease in the lake water surface area were both meteorological and human-induced.
However, all the available articles have relied on analyzing a few images to determine any decrease in the area. While determining the water surface areas, deciding on the suitable periods [30] for each year and the images with the same date in other years is complicated because sometimes no cloud-free images or images can be obtained. For this reason, the problems mentioned above can be avoided by using all available images during the year [3]. At the same time, in the seasonal evaluations, no evaluation was performed that included all four seasons in a whole year. In the seasonal evaluations, spring and summer months were considered [30,31]. However, it is essential to have a more detailed and frequent monitoring system to accurately capture the subtle monthly changes in water bodies. Monthly time-series analyses are needed to determine the change in water surface area within and between years. In the monthly satellite-based monitoring of water surface areas, meteorological data should be included in the study [16]. Studies on the changes in water surface area should also consider surface water temperature (SWT), a crucial variable that affects numerous environmental processes and the global energy balance [2]. The temperatures of lakes worldwide are increasing at an alarming rate, which is expected to adversely affect aquatic ecosystems [32]. Several studies have been conducted on the temperature of the lake’s water [2,33].
Due to this, a comprehensive study is needed to determine the effect of meteorological data on the variation in water surface areas using a sufficient number of satellite images taken over several seasons and years. More cloud cover and haze might decrease the number of usable images, which leaves inadequate data for monthly dynamic mapping. Consequently, the Sentinel-2 constellation’s potential application in water-body monitoring and dynamic analysis is an eagerly awaited exploration [16]. The Sentinel-2 mission is a highly effective and advanced project that utilizes multispectral imaging to capture high-resolution images over vast areas of Europe. The mission supports various services and applications, such as climate change, land monitoring, emergency management, and security. According to their entire mission specification, the twin satellites, which are in the same orbit but phased at 180°, are intended to provide a high revisit frequency of 5 days at the Equator [34]. With a resolution of 10 m, Sentinel-2 can accurately extract water distribution on land surfaces [16,35,36,37,38,39]. In studies to be carried out after 25 January 2022, the harmonized collection of Sentinel-2 is used. Sentinel-2 scenes with a processing baseline of ‘04.00’ or higher had their DN (value) range changed by 1000 after 25 January 2022. Therefore, the harmonized collection was chosen in its place. The harmonized collection changed the data range of more recent scenes to match earlier scenes [40]. The success of the harmonized Sentinel-2 image in determining the water surface area is a matter of curiosity.
All processes to determine the water surface area were carried out on the GEE. As the amount of geographic data grows, storage systems and the cloud have been developed to process the data. The Google Earth Engine (GEE) is a tool that facilitates geoprocessing and has attracted great interest from the academic and research world [41]. At the same time, the GEE platform has gained popularity in remote-sensing applications due to its ability to access many free satellite platforms and analyze large amounts of data [42]. The GEE platform offers support for both JavaScript and Python languages. It offers several advantages, including computing, analytical operations, data analysis, and the capacity to make maps and export these maps [43].
Currently, various machine-learning (ML) algorithms, such as decision trees (DT) [18], support vector machines (SVM) [44,45], and random forests (RFs) [12,23,46], have been utilized for wetland information extraction research. In the ref. [47] study, five ML algorithms were compared: K-nearest neighbor, RFs, maximum likelihood, SVM, and DT. The results showed that the RFs method had a high degree of accuracy and was particularly useful for classifying wetlands with remote sensing.
This study aims to examine the spatial and temporal changes in the water surface areas of Çivril Lake in the short-term from March 2018 to March 2023. The GEE cloud computing platform was used to extract and analyze the seasonal variation in the water surface area of Lake Çivril. This was performed by using the time series of harmonized Sentinel-2 imagery. To increase the classification accuracy, the NDVI, NDWI, MNDWI, and SWI indices related to water were used to determine the areas with and without water using the RFs method. Another purpose is to investigate the relationship between changes in lake water surface and LSWT with meteorological parameters (precipitation, evaporation, and temperature) to make it easier to comprehend what causes changes in surface water. This study presents and evaluates the statistical relationship (correlation matrix) between climatic variables, LSWT, and the reduction in lake area.

2. Materials and Methods

2.1. Study Area

This study is related to Çivril Lake, located in the Çivril district, the largest district of Denizli, in the southwest of Turkey. It is used for irrigation purposes, covering an area of 7028 hectares according to SAYBIS data. Işıklı (Çivril) Lake (38°14′ K, 29°55′ D) is one of the largest freshwater lakes in Turkey (Figure 1). Considering the region’s climate, summers are hot and dry, and winters are cold and rainy. Although Çivril Lake is a natural lake with a karstic structure, it has been converted into a dam lake to protect residential and agricultural areas from flooding. Çivril Lake has been given the status of Class A Wetland by the International Ramsar Convention and was registered as a “Wetland of National Importance” on 10 June 2016 [48]. Many sources, such as Kufi and dinar water, are moved into Çivril Lake. The lake’s waters are transferred to the Büyük Menderes River, located in the southwest. In this state, the lake acts as a regulator [29].
At the same time, this lake has been declared an important bird area as it provides a critical habitat and a spawning, hatching, and migration environment for waterfowl. However, natural life in the lake is seriously endangered due to the proximity of the lake to significant cities and the fact that hunters hunt all seasons without following the rules. In addition, groundwater is consumed unconsciously due to the drilling of boreholes around the lake without permission. At the same time, the lake water has been dramatically reduced due to the irrigation performed by randomly releasing the lake water to the fields. This decrease in the lake level has significantly increased the proportion of aquatic plants. Today, it is still used as a reservoir area for irrigation purposes. For all these reasons, it is essential that the lake does not dry out and its habitats are protected [27,49].

2.2. Datasets and GEE

Sentinel-2 is a wide-swath (290 km), high revisit time (10 days at the equator with one satellite and five days with two satellites under cloud-free conditions, resulting in 2–3 days at mid-latitudes), high-resolution multispectral mission that is polar-orbiting (consists of a constellation of two polar-orbiting satellites placed in the same sun-synchronous orbit, phased at 180° to each other). Sentinel-2A launched on 23 June 2015, and Sentinel-2B launched on 7 March 2017. Each satellite is equipped with a cutting-edge, broad-swath, high-resolution multispectral imager with 13 spectral bands for a fresh viewpoint, such as observing interior waterways and coastal areas and observing plant, soil, and water cover (Table 1). From sci-hub, the Sentinel-2 L2 data are downloaded [32,50].
This study uses the GEE cloud platform. The workflow of the methodology is shown in Figure 2. GEE provides programming, cloud storage, and graphical interfaces for remote-sensing studies [16]. It creates and runs scripts using a web-based integrated development environment (IDE). Furthermore, this integrated development environment (IDE) visualizes geographical research via the JavaScript application programming interface (API). One could utilize GEE libraries to construct programs in both JavaScript and Python. Satellite imagery is stored in a public data archive by Earth Engine, which includes historical earth images from the last forty years. These images are ingested daily and can be accessed for global-scale data mining. A helpful tool for studying spatial data is Google Earth Engine [51]. All the processing tasks were conducted in the GEE platform. Sentinel-2 data Level-2A products available at GEE were used; radiometric measurements per pixel in surface reflection were provided to convert them to radiation with all parameters [52]. This product does not need atmospheric correction [53]. The applications presented in this study focus on Çivril Lake. ALOS World 3D—30m (AW3D30) has been used to eliminate errors caused by the mountain’s shadow. It is a global digital surface model (DSM) dataset with a roughly 30 m horizontal resolution. In the Sentinel-2 Level-2A data is a QA60 band. Poor-quality images that were the result of cirrus and opaque clouds were removed from each image using the QA60 bitmask band with cloud information. Spectral criteria are used to calculate opaque and cirrus clouds [54]. The study collected Sentinel-2 Level-2A images with <10% cloud cover. A low cloud cover threshold (10%) was chosen to obtain high-quality images, which reduces the inclusion of omission errors in cloud/cloud shadow identification.
A lake’s surface water temperature, LSWT, determines its hydrology and biogeochemistry. Studying the temperature patterns of the lake over time can offer valuable information about the impact of climate change on the region. A correlation is established between the decrease in the lake surface area and the increase in LSWT measurements [55]. One of the most extensively used types of remote-sensing data is Landsat imagery, which is frequently used in (Land Surface Temperature) LST research. Using the Landsat 8 OLI/TIRS thermal bands, this study produced LSWT data for the lake [56].
The average surface temperature of the world has risen during the previous century. Therefore, it is predicted that climate change will negatively affect water systems. There is a relationship between the decrease in water surface area and meteorological parameters that is either positive or negative [3]. This study looked at possible relationships between water surface area and LSWT with meteorological variables, such as temperature, evaporation, and precipitation, using the ERA5-Land and CHIRPS Pentad monthly satellite datasets. Monthly precipitation data were collected from the “CHIRPS Pentad: Climate Hazards Group Infrared Precipitation with Station Data (Version 2.0 Final)” system, a system that includes ground-based observations and satellite data [57]. Evaporation and temperature data were also taken monthly from the ERA5-Land Monthly Aggregated—ECMWF Climate Reanalysis [58].
In this study, Sentinel-2 images were evaluated annually, seasonally, and monthly for 5 years. Taking into account the Northern Hemisphere’s meteorological seasons, the timeline of the obtained data was divided into four seasons. These are spring (March, April, and May), summer (June, July, and August), autumn (September, October, and November), and winter (December, January, and February) [59]. The annual map covers four quarterly datasets starting in March.

2.3. Spectral Indices

In analyzing digital images of a geographic area, mathematical operations, such as addition, subtraction, and multiplication, can be carried out on the pixel data of two or more spectral bands [60]. These mathematical operations, called the water index, are also used to extract the water fields. The water index can be combined with other remote-sensing indices to accurately distinguish water from non-water with precision water extraction [2]. This study used spectral indices with a near-infrared (NIR) band, which reduces water reflection, and a green band, which increases water reflection. As in the study area, wetlands may have muddy and shallow water bodies, especially after rainfall. In addition, vegetation indices can prevent shadow effects [61] and cause the misclassification of vegetation [11] when determining water areas. Except for their greater reflectance in the VIS bands, ice and snow show a similar spectral trend to water bodies (from VIS to NIR and SWIR). Therefore, the blue band (>0.5) is utilized in mountainous places to eliminate ice and snow cover [16].
Each time-series image collection image in the study had four spectral indices added to it. Table 2 shows a list of the indices, including the NDVI [62], NDWI [63], MNDWI [64], and SWI [65]. The new composite image was created with these four indices. The GEE platform conducted all the pre-processing tasks of building the composite image.

2.4. Random Forests

RFs are a standard ML algorithm. Its use in data classification has been reported by Breiman [66]. This method is based on the principle that many individual decision trees form a decision forest by integration. The algorithm combines random features or a combination of random features to create a tree. The bagging method is used to create training samples. At the next stage, after the bagging method, each selected feature is randomly drawn by changing N samples. N is the size of the original training set. The final prediction outcome is determined by voting after the predictions from various decision trees have been integrated [67].

2.5. Evaluation Metrics

The RFs method was used to classify the new composite image created with the four indices on the GEE platform. Approximately 100 points were randomly selected yearly, seasonally, and monthly for the classification method. The accuracy points were compared to the lake’s NDWI image to determine the water’s location. This comparison confirms the effectiveness of the lake water area extraction method and the accuracy of the extracted lake area data. Standard metrics, including user’s accuracy (UA), producer’s accuracy (PA), overall accuracy (OA), and Kappa, were used to evaluate the performance of the classification method used to determine the lake area. The Kappa coefficient measures the variances between the data expected and observed rates. It is well recognized that a coefficient more significant than 0.8 implies adequate confidence in the model’s performance [68,69].

2.6. LSWT (Lake Surface Water Temperature)

It provides a GEE code that enables the LST derivation from the Landsat Collection 1 Level-1 thermal infrared bands [56]. The statistical mono-window (SMW) technique was the foundation for the LST method, which was used. The Climate Monitoring Satellite Application Facility (CM-SAF) developed this technique to retrieve LST climate data records from Meteosat First- and Second-Generation satellites [70]. The method only uses one thermal infrared band (specifically, band 10 for Landsat 8) to achieve consistency across all Landsat series. This strategy uses the ASTER Global Emissivity Dataset (GED) database and a Landsat NDVI-based vegetation cover correction method [55]. MODIS LST data were used to validate the LSWT results due to the lack of a ground station at the test site.

3. Results

3.1. Extracted Lake Surface Accuracy Assessment

In this study, the water surface areas of Çivril Lake were obtained annually, seasonally, and monthly from Sentinel-2 Level-2A images. To demonstrate the accuracy of the findings, the data extracted from the study region-based Sentinel image segment were compared point-by-point with the NDWI images for water surface area maps. The range of the NDWI scale is −1 to +1 with NDWI > 0 denoting water and NDWI < 0 denoting no water. Sentinel-2 images from March 2018 to January 2023 were used. The study started in March 2018 because Level-2A products have been systematically produced in the ground segment throughout Europe since March 2018 [71].
Table 3 shows the lake area’s accuracy values for UA, PA, OA, and Kappa. Five years of calculating a confusion matrix for the lake’s water surface area yielded results with an OA of more than 98% and PA and UA of more than 94% for the water areas. In addition, the Kappa coefficient values are close to 1 and represent complete compliance. The OA of the results in the seasonal evaluation for the water areas was greater than 96% with the PA being 95% and the UA being greater than 94%. The values of the Kappa coefficient exceed 91%. The OA of the results in the monthly evaluation for the water areas was greater than 95% with the PA being 90% and the UA being greater than 91%. The values of the Kappa coefficient exceed 90%. All the parameters used in the accuracy assessment were calculated with an accuracy of over 90%, which indicates that the RFs method successfully extracted the water surfaces.

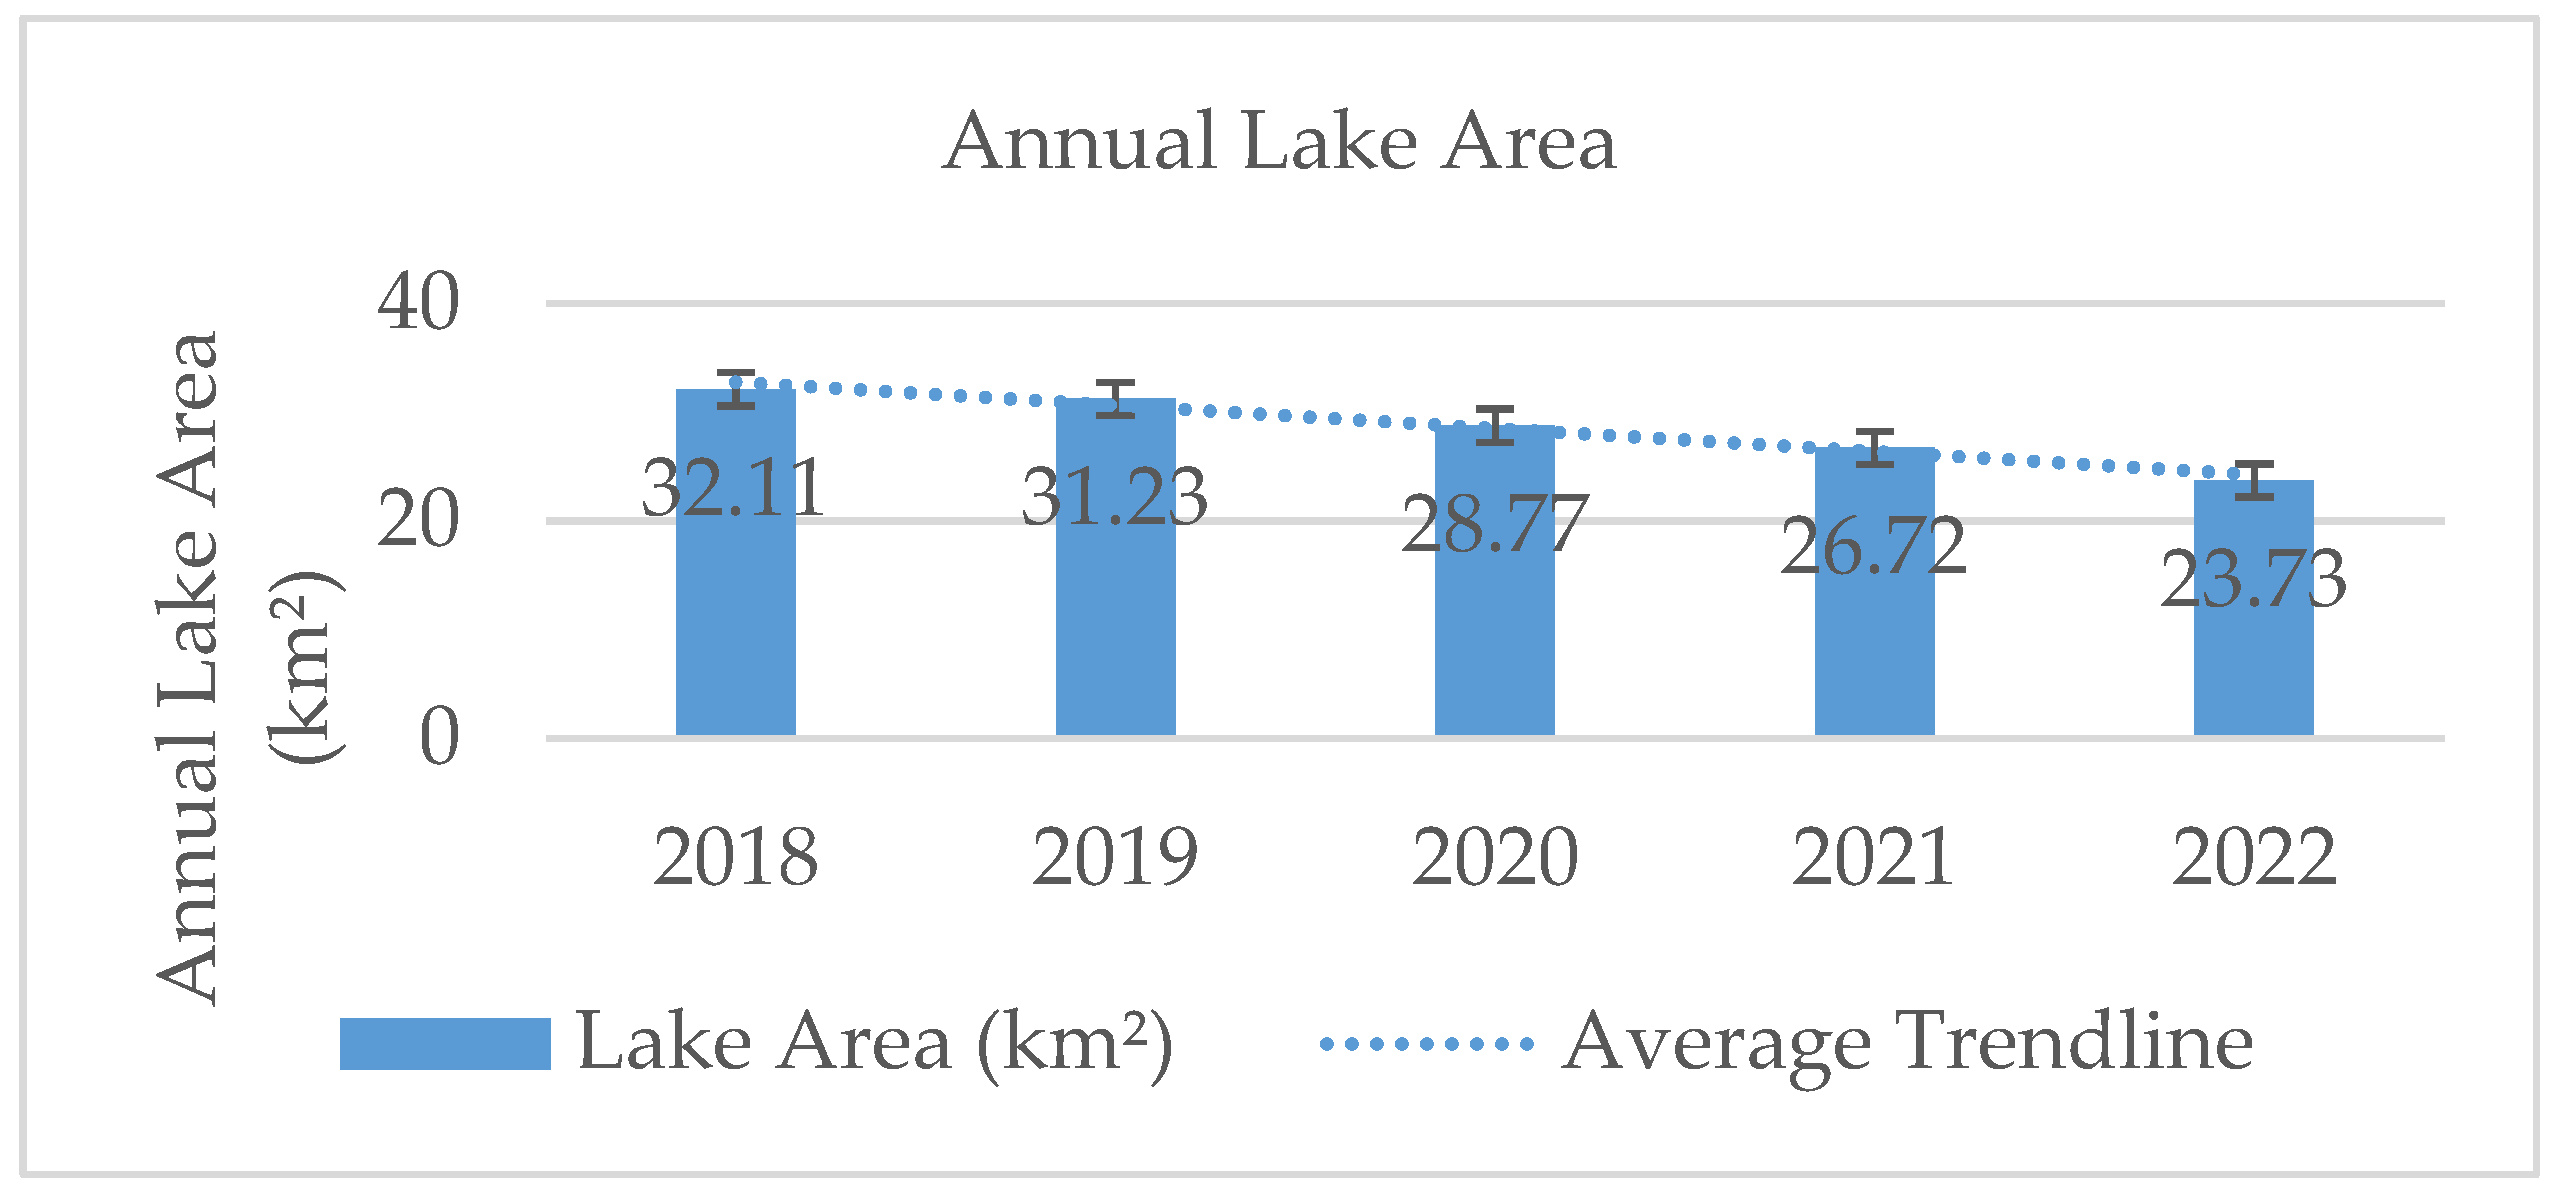
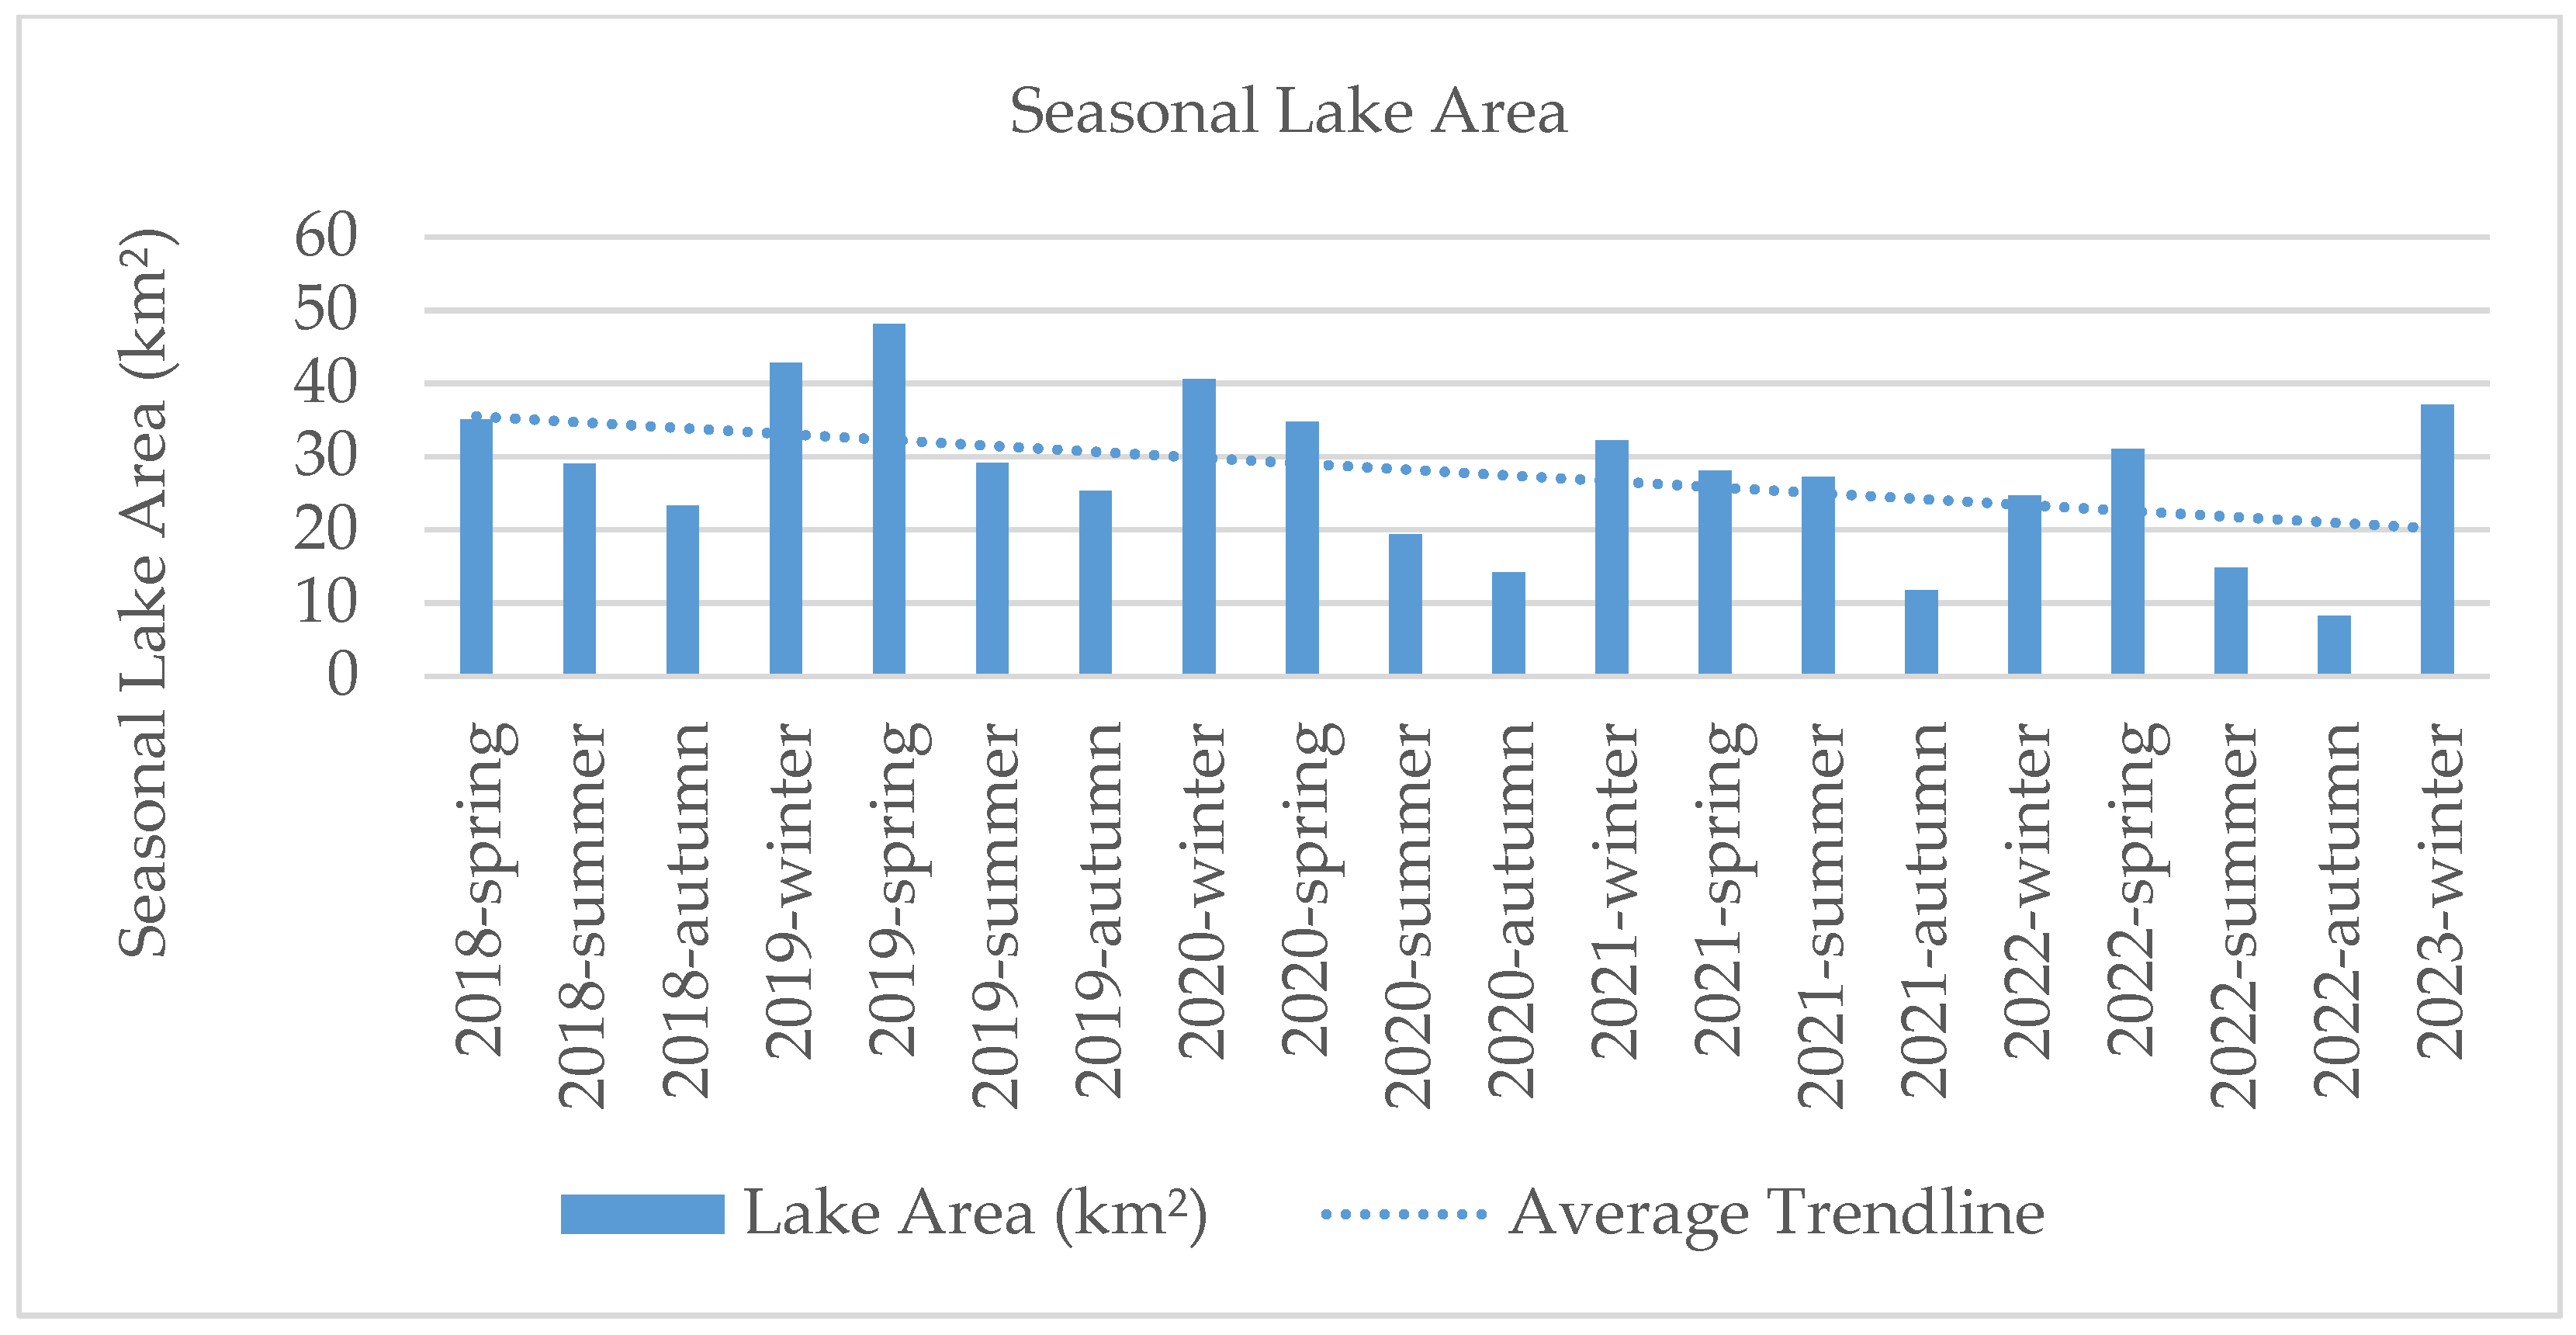
3.2. Areas of Extracted Lake Surface

This study utilized the Sentinel-2 Level-2A archive; applied a cloud filter; calculated the NDVI, NDWI, MNDWI, and SWI; and applied the RFs method to extract the water surface area on the GEE platform. Due to the cloud filter, it has been found that Sentinel photos occasionally have ten images in a month. Other times, there are no images for several months because of a temporal resolution of 2–3 days. There are no images for January 2019, March 2021, and February 2022. However, the data on water surfaces evaluated between March 2018 and March 2023 were sufficient to show the general trend of changes in the lakes’ water area. The annual, seasonal (spring, summer, autumn, and winter), and monthly changes in water areas were identified. Figure 3 displays the annual change graphs for the lake’s surface area. While the lake area was 32.11 km2 in 2018, it decreased to 23.73 km2 in 2022. It is observed that the lake area decreases a little more each year. Since the lake’s surface area is small, the changes in the seasonal transitions are becoming more radical.
When the water levels of Çivril Lake are evaluated seasonally, it can be observed in Figure 4 that the water levels in winter and spring are lower than in autumn and summer. As observed in Figure 4, the water levels were higher in the winter and spring months of 2019 compared to the other years. This is because the region received heavy rainfall in the winter months of 2019. The findings indicate a significant relationship between the lake’s size, precipitation and snowfall, and the source of the lake water. It has been determined that the water surface area decreases due to irrigation activities and meteorological parameters in summer. The reason for the lowest surface water in September is evaporation.
The trend and temporal fluctuation in the lake area between March 2018 and March 2023 are displayed in Figure 5. When analyzing Figure 5, it was observed that September has the lowest monthly lake levels. On the other hand, February and March have the highest monthly lake levels in the area. When the five-year lake level is examined, it is observed that there is a general decrease.

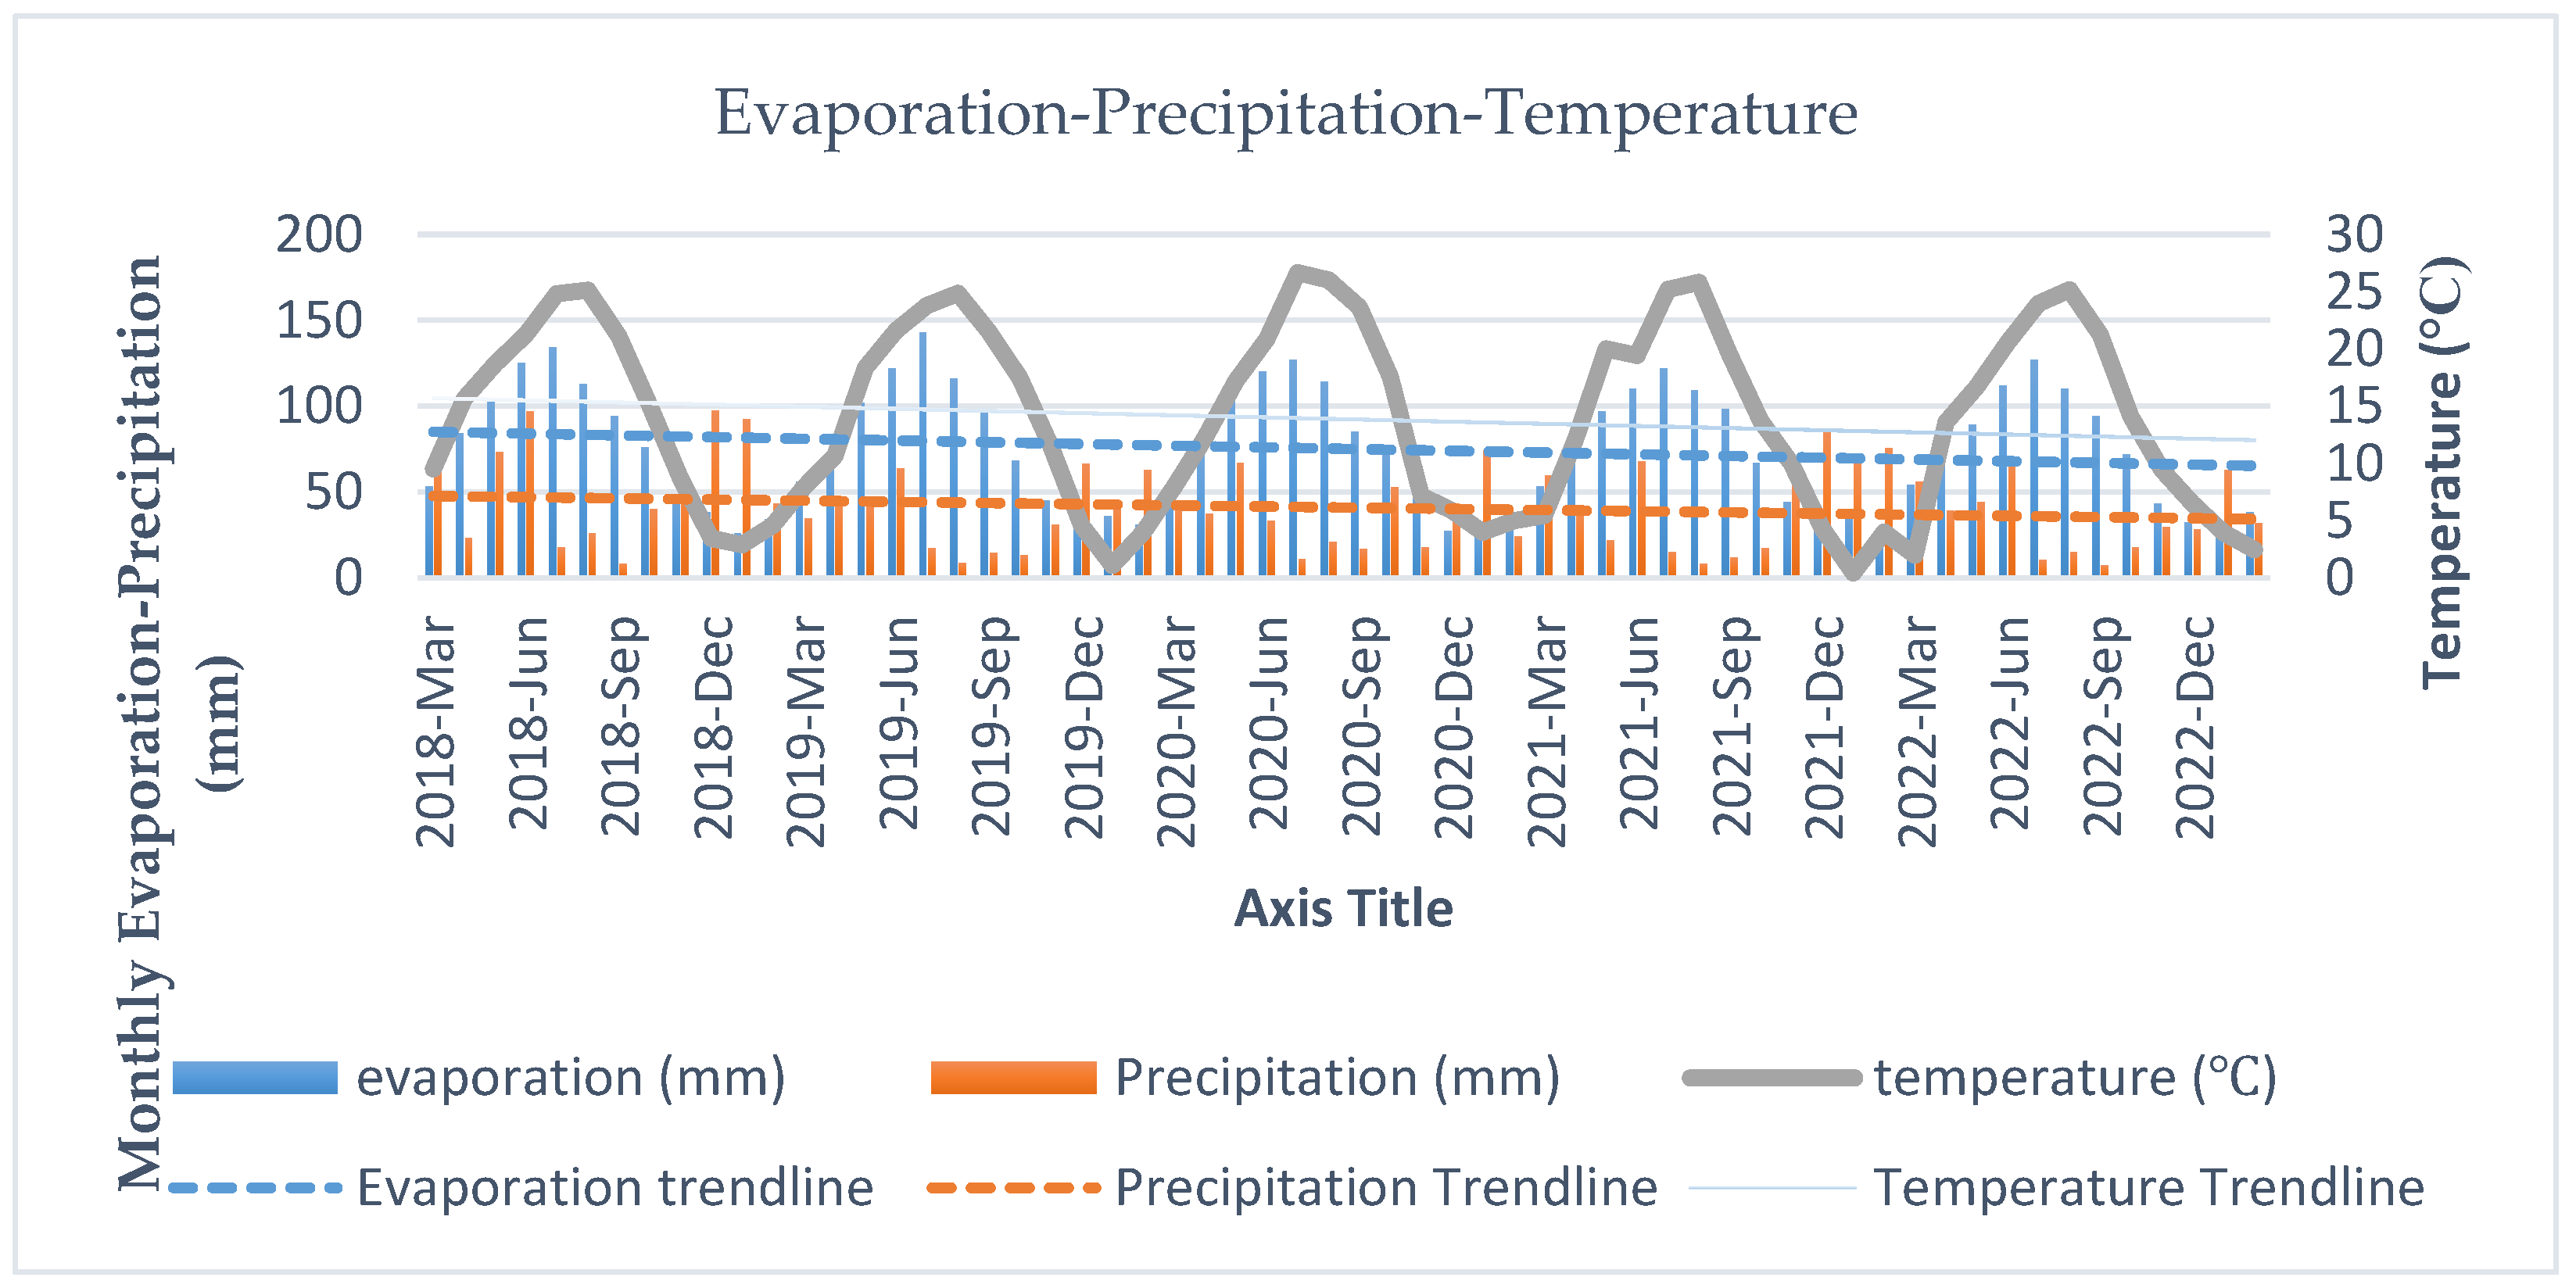
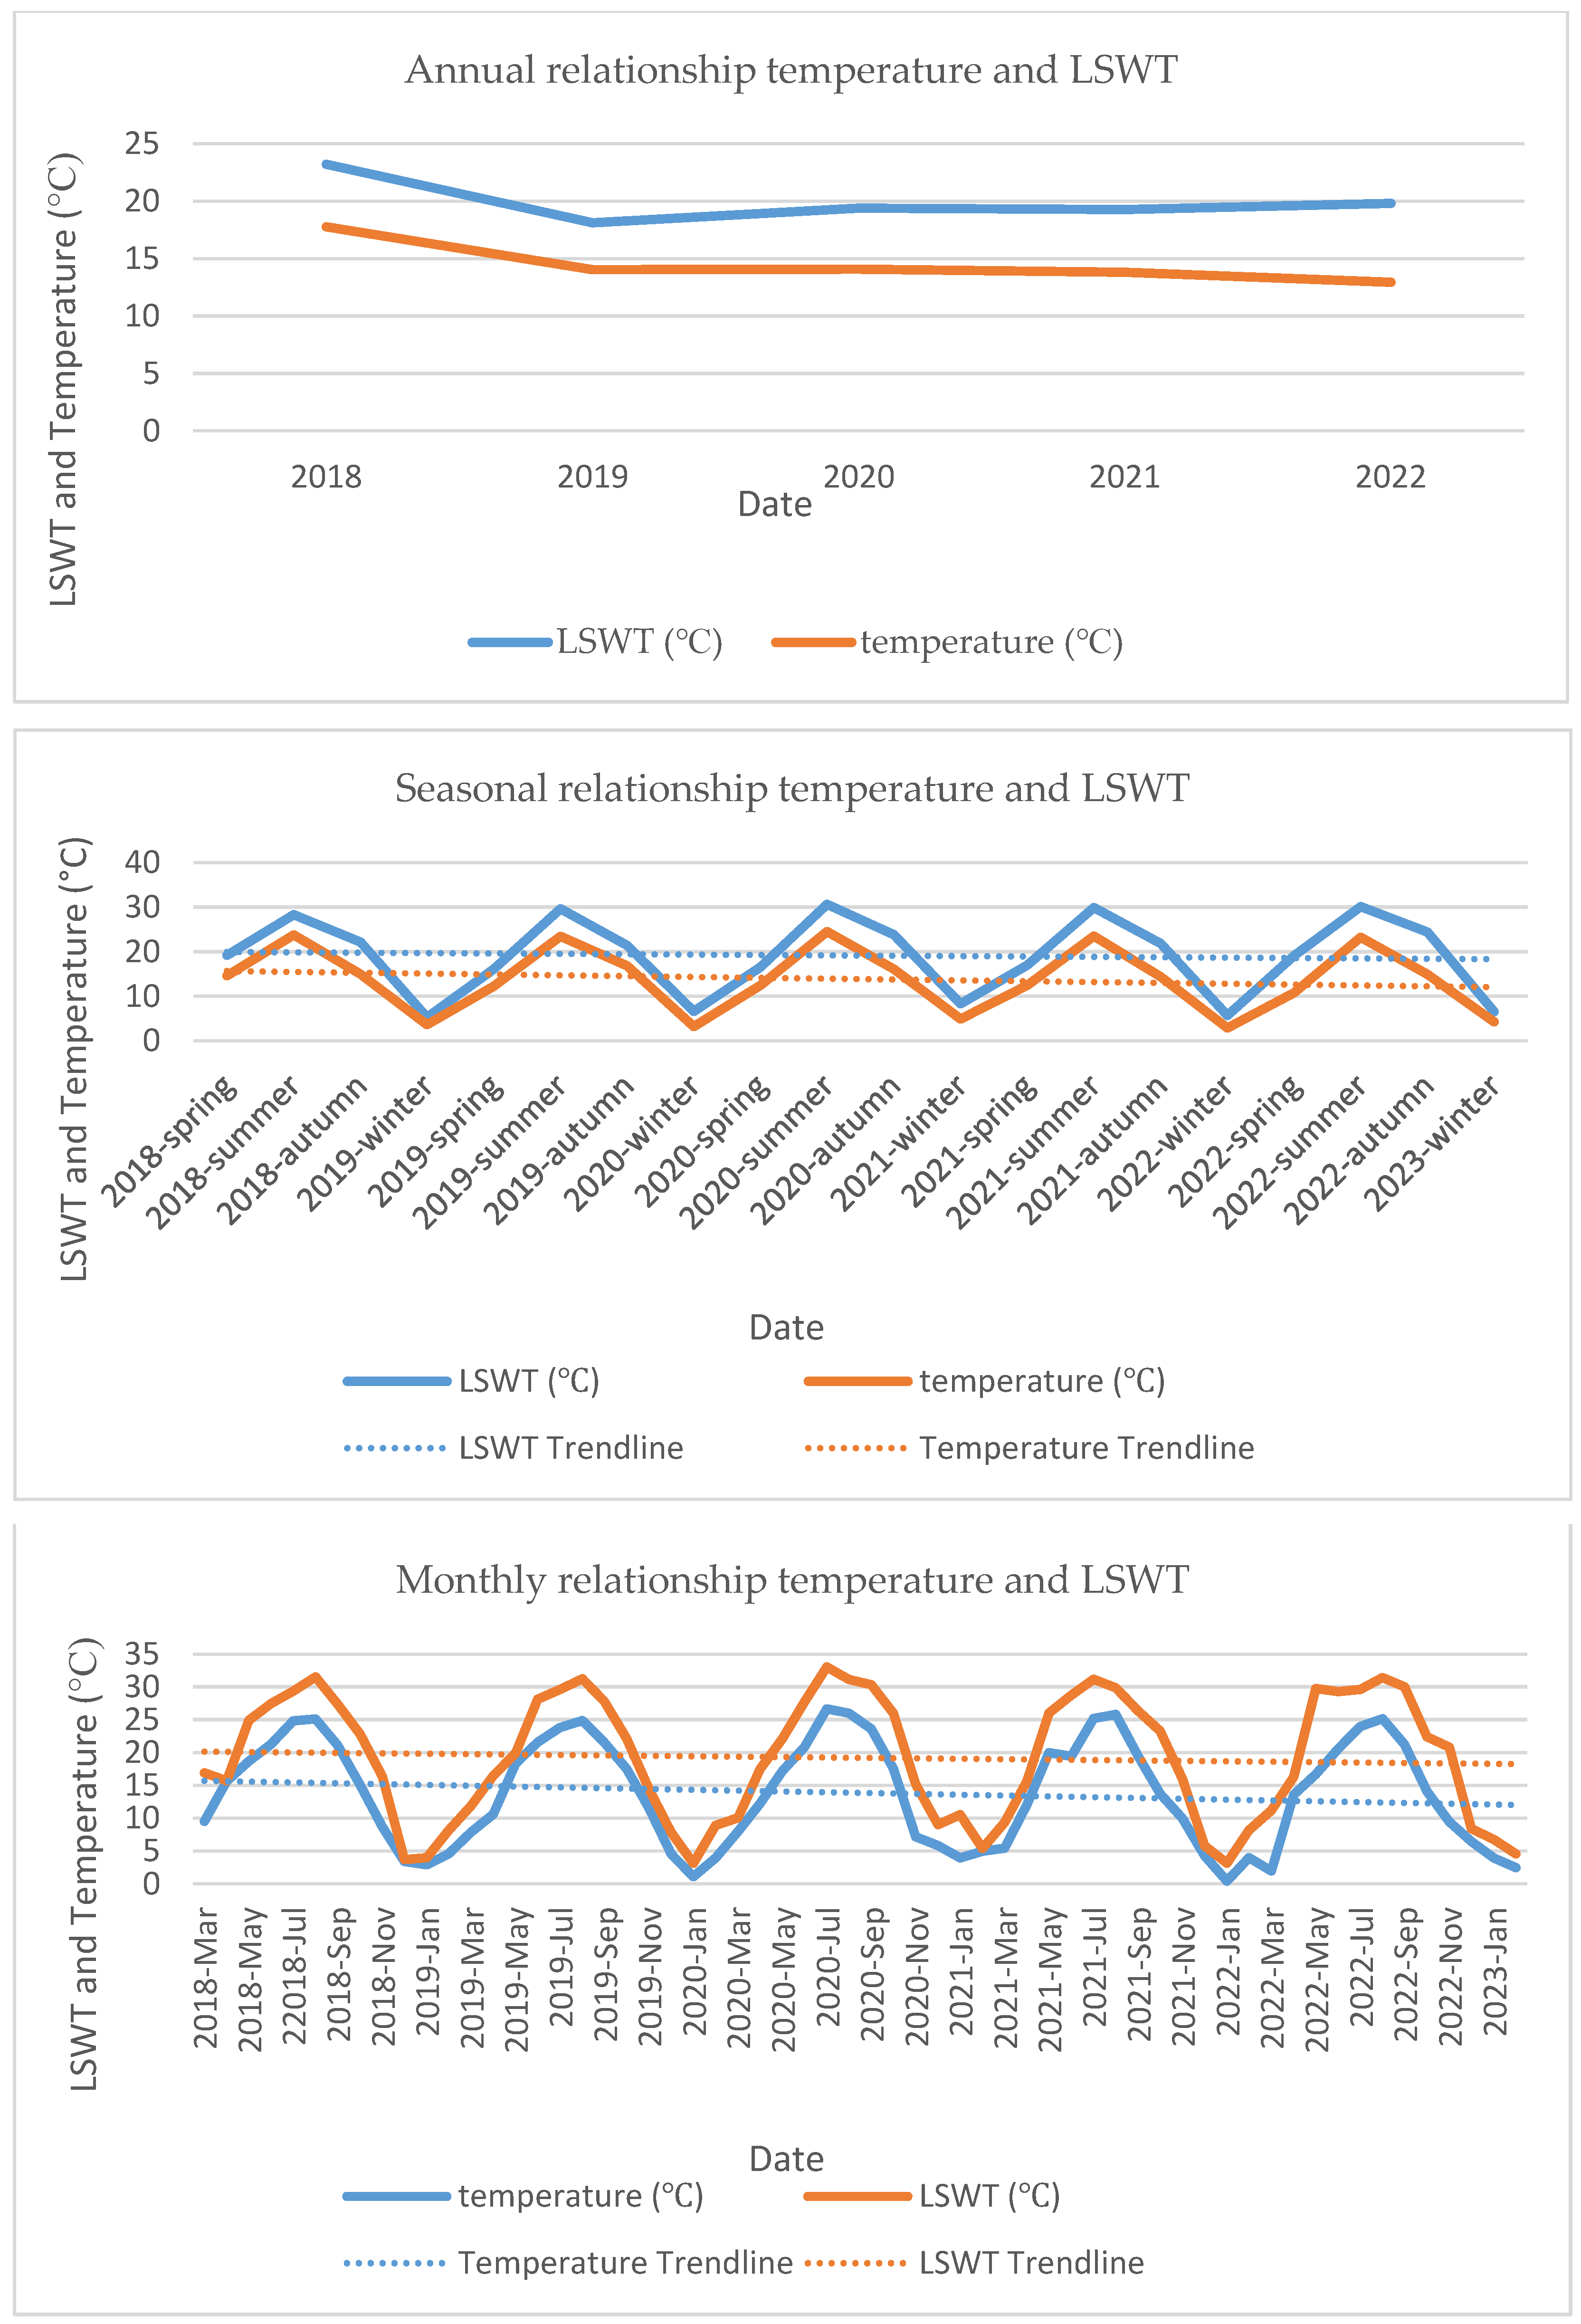
3.3. Relationship between Meteorological Parameters, LSWT, Spectral Indices, and Lake Surface Area

To comprehend each variable’s behavior in the presence of other factors, the relationship between the NDVI, NDWI, MNDWI, and SWI spectral indices employed in the classification of the lake region was investigated (Figure 6 and Figure 7). Considering the correlation between the spectral indices used in the classification method, it was observed that there was a 0.92 relationship between MNDWI and NDWI, a 0.74 relationship between SWI and NDWI, and a 0.85 relationship between SWI and MNDWI. There is a negative relationship between NDVI and the other indices (p-value < 0.01). This negative relationship between NDVI and the other indices shows that, while NDVI increases, other indices decrease. For this reason, it is observed that there is a strong relationship between NDVI and the other indices. This result showed that it is appropriate to use the NDVI index, one of the indices used to increase classification accuracy. The classifications for R (correlation coefficient) values were 1 > R > 0.8 extremely high, 0.8 > R > 0.6 strong, 0.6 > R > 0.4 moderate, 0.4 > R > 0.2 low, and 0.2 > R > 0 very low. Table 4 and Table 5 list the correlation matrix for the coefficient of correlation.
Correlation analyses between LSWT and water surface area and meteorological factors, such as temperature, precipitation, and evaporation, were performed, as observed in Figure 8, to show the effect of climatic effects on the time-series data. Correlation analysis was performed with LSWT and annual–seasonal–monthly water surface area and meteorological data (evaporation, precipitation, and temperature). The LSWT was compared with the water surface area obtained from Landsat satellite images, and R was estimated to achieve this goal. In addition, the meteorological data for the lake were collected from the ERA5-Land and CHIRPS databases. Only two of the 50 available variables in ERA5-Land (temperature above 2 m and total evaporation) were used in the research. Precipitation data were obtained from the CHIRPS database.
Based on the data from Figure 9, there appears to be a strong correlation of 0.96 between the monthly LSWT values and temperature. The relationship between LSWT and temperature values was found to be 0.98 seasonally and 0.86 annually.
Precipitation and evaporation are the other crucial meteorological variables. Çivril Lake has higher evaporation and lower precipitation, according to the statistics for these parameters for the lake (Figure 10). Based on the data from Figure 10, there appears to be a low negative correlation of −0.40394 between the monthly evaporation values and precipitation. The relationship between evaporation and precipitation values was found to be −0.53 seasonally and 0.69 annually. These results also demonstrate the importance of statistics, LSWT, temperature, and precipitation when analyzing the water surface area data.
A monthly correlation study analyzed data on water surface area, LSWT, and various climate variables, such as temperature, precipitation, and evaporation. Table 6 includes the R values obtained from the correlation analysis. The R values were classified as 1 > R > 0.8 extremely high, 0.8 > R > 0.6 strong, 0.6 > R > 0.4 moderate, 0.4 > R > 0.2 low, and 0.2 > R > 0 very low. To determine the relationship between the parameters, a 2-tailed statistical significance test was conducted. The p-value (probability value) is commonly used to determine statistical significance. Calculating the p-value can determine whether there is a significant statistical correlation between the two given variables. A p-value of less than 0.05 is typically regarded as statistically significant, while one less than 0.01 is typically regarded as very statistically significant. The relationship between LSWT and water surface area values was found to be −0.61 monthly, −0.58 seasonally, and 0.32 annually. A robust statistical correlation (p < 0.01) was found between the lake’s water surface area and LSWT every month, every year, and every season. During the monthly correlation analysis, it was determined that there was a strong relationship between LSWT and evaporation by 0.90 and an even stronger relationship between LSWT and temperature by 0.96. The seasonal correlation analysis also showed a 0.93 relationship between LSWT and evaporation and a 0.98 relationship between LSWT and temperature. The annual correlation analysis also showed a 0.87 relationship between LSWT and evaporation and a 0.86 relationship between LSWT and temperature. The monthly and seasonal analyses revealed a low to moderate negative correlation between the lake area and temperature, evaporation, and precipitation data. Temperature and evaporation show a highly statistically significant (p < 0.01) association with LSWT for the lake. The annual correlation analysis also showed a 0.75 relationship between lake area and temperature, a 0.74 relationship between lake area and evaporation, and a 0.33 relationship between lake area and precipitation.
To further understand how climatic variables affect the lake surface area, Table 6 provides correlation matrices on a monthly, seasonal, and annual basis between each variable and the lake surface area. When seasonal and monthly correlation data are examined, it is revealed that evaporation does not affect the lake area. When the temperature, precipitation, and LSWT values were examined, it was concluded that there was a moderate relationship. All data between March 2018 and March 2023 were analyzed, except for the cases where no data were in the study, to determine the surface water in the lake area precisely.

4. Discussion

This study evaluated the RFs algorithm on lake water surface areas on the GEE platform. Studies in the literature have shown that the RFs algorithm can reliably classify wetlands with an OA of over 80% [72,73]. The results of this study show that, using the RFs approach, the water pixels can be retrieved successfully with an overall accuracy of more than 95% for the lake area, which is in line with the literature. It is thought that the reason for obtaining OA classification results above 95% in this study is the four indices used.
The evaluations of the size of Çivril Lake show a downward trend, which is in line with the literature [27,29,30,31]. In one of these studies, spatiotemporal statistical analyses of water area changes of ten lakes in Turkey, including Çivril Lake, were performed using Landsat satellite imagery, considering the meteorological variables. As a result of these analyses, the lake area in 1985 was 4411.61 ha, and the lake area in 2022 was 3133.42 ha [29]. In this manuscript, the lake surface areas were found to be 32.11 km2 in 2018, 31.23 km2 in 2019, 28.77 km2 in 2020, 26.72 km2 in 2021, and 23.73 km2 in 2022 using harmonized Sentinel-2 satellite imagery. It can be claimed that these results confirm one another given that the spatial resolution of Sentinel satellite imagery is 10 m and that of Landsat satellite imagery is 30 m. In another study, the lake area water changes in six lakes in Turkey, including Lake Çivril, were examined at 5-year intervals with Landsat satellite imagery for 35 years with long-term, 7-month intervals with Sentinel satellite imagery for 5 years. In parallel with this manuscript, the lake water areas were found to decrease. Unlike this manuscript, long-term evaluations were performed by considering the spring and autumn periods, while short-term evaluations were performed by considering the months of March–September. Since the lake change between March and September is examined in this study, the lake water change in other months is unknown. In addition, they did not consider the meteorological data for Çivril Lake, which they examined in the short-term in their studies, and could not fully reveal the reason for the decrease in the lake area [30]. In this manuscript, the lake water exchange was determined in detail with all the data obtained during the year. In this way, unlike the other studies, the behavior of the water surface area change in Çivril Lake in different seasons and months has been determined in detail. In another study, the change in EUNIS habitat classes for Çivril Lake and Gölgöl for the years 1990, 2000, 2012 and 2018 was determined using the remote-sensing method. The increased agricultural lands between 1990 and 2018 and the resulting increased water demands put pressure on the wetlands of Çivril and Gökgöl, leading to decreased lake surface area and increased reeds [29]. In another study, the effect of the expansion of the agricultural fields around Çivril Lake was explained. Landsat TM images were obtained to examine the change in land cover of the lake between 1985 and 2010. Uncontrolled classification was applied to the August 1985 and 2010 images in the GIS environment. Accordingly, between 1985 and 2010, the irrigated agricultural areas around the lake increased by 100%. The increase in irrigated agricultural areas caused the narrowing of Çivril Lake, according to the data in this manuscript, and triggered the increase in aquatic plants [27].
Among the reasons for the decrease in water surface areas are excessive water withdrawal due to the water supply to streams and even lakes themselves, using lakes for industrial purposes in salty lakes, and partly the effects of climate change on lakes of various natures. The observed decreases in the lake water area were mainly based on human-caused activities and meteorological effects. The significant decrease in the lake’s size has caused a severe decline in wetland habitats, drying out shallow areas crucial to waterfowl. At the same time, the increase in irrigated agricultural areas has caused the narrowing of Çivril Lake and has triggered the increase in aquatic plants [27]. It is noticed that the water surface area significantly increases during the winter and spring seasons, while the most significant decrease occurs during autumn. Analyzing the data every month may lead to some gaps, but it can help detect the visible changes in hydrology with greater accuracy in terms of time [16]. This study revealed that each lake has unique characteristics depending on various factors, and each should be examined separately. An individual study of the lakes reveals that many factors affect the well-being and sustainability of the lakes and natural conditions such as climatic conditions. To understand the reasons for the change in the lake, annual, seasonal, and monthly lake areas must be combined with meteorological data covering the years of the study (temperature, precipitation, and evaporation). To better investigate the cause of water losses in the lake, it is necessary to examine the meteorological data of the lake as well. This is to determine whether the water losses are due to climatic or human-caused activities.
In light of these studies, annual, seasonal, and monthly lake areas should be combined with the meteorological data (temperature, precipitation, and evaporation) that cover the years of the study to understand the causes of the change in the lake. This is an essential indicator for determining whether the water losses are due to climatic or human-induced activities. These mentioned human-induced causes are cutting the trees around the lake and transforming them into agricultural lands, increasing the settlement areas, establishing ponds in the upper parts of the lakes, and irrigating for agricultural purposes [29]. The investigated Çivril Lake is a dam reservoir lake with different conditions than natural lakes. Therefore, fluctuations in the water level are expected. The meteorological factors examined in this study affect the seasonal and annual variability of the reservoir surface. However, it can be said that human-induced effects affect the lake surface area change as much as meteorological factors.

5. Conclusions

From the results discussed above, we can express the following conclusions:
  • Water surface areas can be extracted using harmonized Sentinel-2 images.
  • Classification results with 95% OA were obtained using NDVI, NDWI, MNDWI, and SWI spectral indices and the Rfs method.
  • There is a negative correlation between NDVI and the other spectral indices. In the seasonal and monthly analyses, there is an extremely high relationship between NDVI and NDWI, a strong relationship between NDVI and MNDWI, and a strong relationship between NDVI and SWI in the seasonal analyses and a moderate relationship in the monthly analyses.
  • A strong and extremely high correlation relationship was found between LSWT, temperature, and evaporation in all analyses.
  • It was revealed that there is a negative but moderate correlation between the lake area and the LSWT in the seasonal and monthly observations. As a result, it was concluded that the LSWT variable affected the lake area change in the opposite direction.
  • There was a strong relationship between the lake area and evaporation in the annual analysis and a low correlation in the monthly and seasonal analyses. This result shows that the evaporation variable related to the lake area change is somewhat related.
  • There was a strong relationship between the lake area and the temperature in the annual analysis and a moderate relationship in the monthly and seasonal analyses. This result shows that the temperature variable related to the lake area change is related.
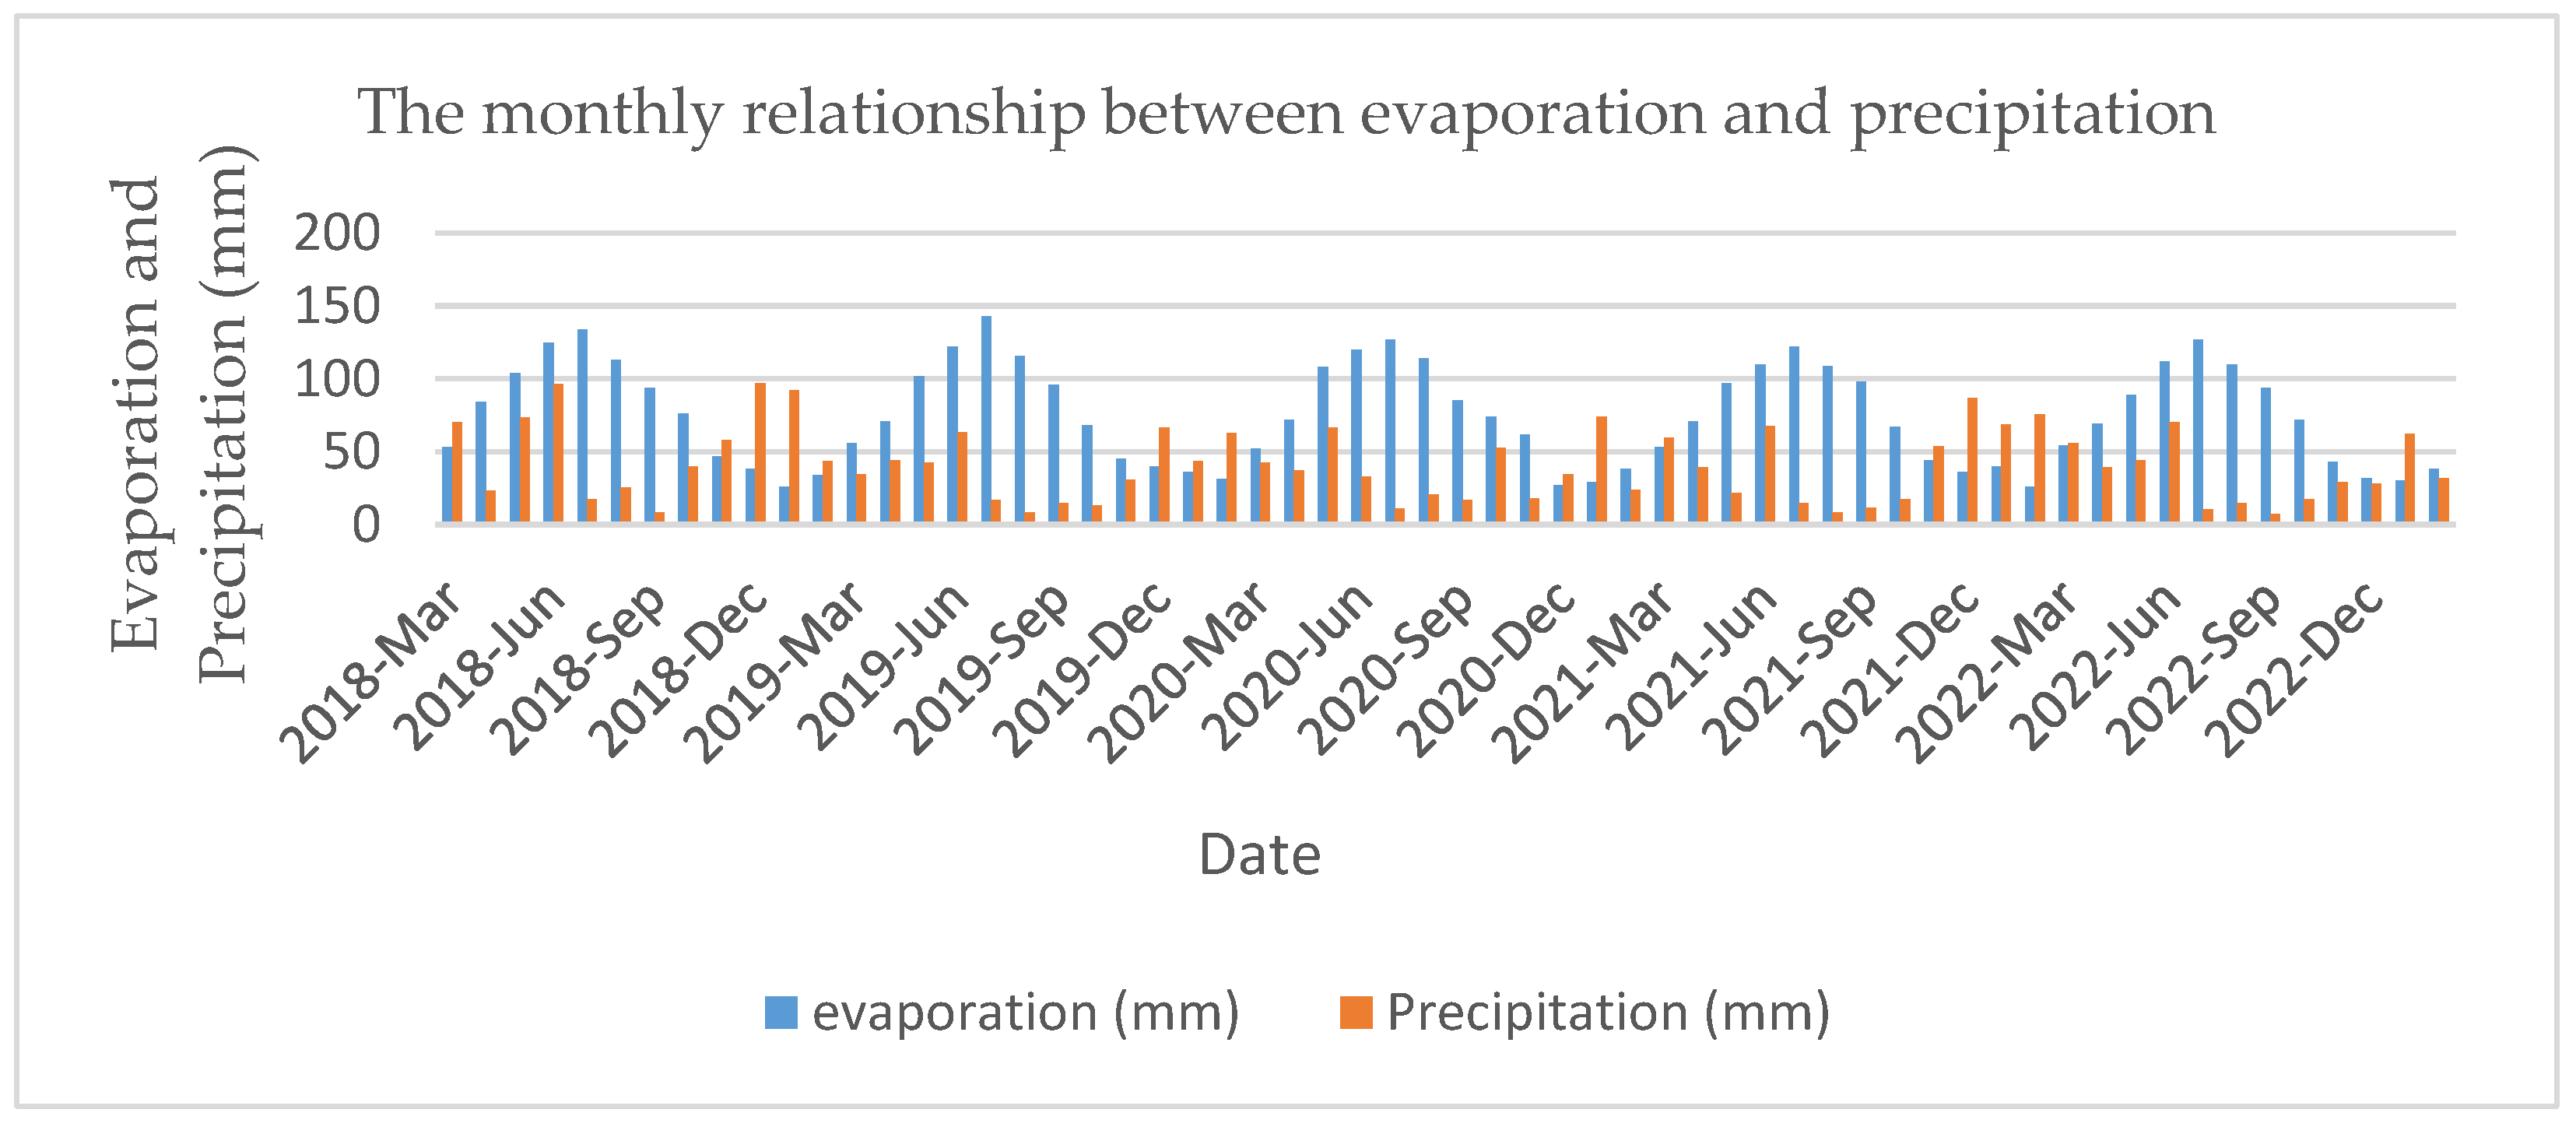
  • There was a low relationship between the lake area and precipitation in the annual analysis, moderate relationship in the monthly analysis, and a strong relationship in the seasonal analysis. This result shows that the precipitation variable related to the lake area change is related.
  • In small lakes such as Çivril Lake, which act as both a reservoir and a regulator, it was concluded that the lake water surface area should be determined by considering the meteorological data.

6. Recommendations

Decision-makers who want to develop sustainable agricultural and industrial water consumption policies must consider the conclusions of this research. These policies will help preserve water resources and prepare for possible climate changes.
For a sustainable conservation–utilization balance in this geography, where there will be climate change, dry spells, and water shortages in the future, it is vital to restrict agricultural activities and avoid the development of new agricultural areas.

Funding

This research received no external funding.

Data Availability Statement

GEE freely gave all the data utilized in this study. Using this platform, anyone has access to this data.

Acknowledgments

Thank you to the GEE platform, where data are obtained and processed free of charge.

Conflicts of Interest

The author declares no conflict of interest.

References

  1. Sülük, K.; Nural, S.; Tosun, İ. Sulak alanlarda halkın çevre bilincinin değerlendirilmesi: Işıklı Gölü örneği. Avrupa Bilim Ve Teknol. Derg. 2013, 1, 7–11. [Google Scholar]
  2. Albarqouni, M.M.; Yagmur, N.; Bektas Balcik, F.; Sekertekin, A. Assessment of Spatio-Temporal Changes in Water Surface Extents and Lake Surface Temperatures Using Google Earth Engine for Lakes Region, Türkiye. ISPRS Int. J. Geo-Inf. 2022, 11, 407. [Google Scholar] [CrossRef]
  3. Abujayyab, S.K.; Almotairi, K.H.; Alswaitti, M.; Amr, S.S.A.; Alkarkhi, A.F.; Taşoğlu, E.; Hussein, A.M. Effects of meteorological parameters on surface water loss in Burdur Lake, Turkey over 34 Years Landsat Google Earth Engine time-series. Land 2021, 10, 1301. [Google Scholar] [CrossRef]
  4. Hui, F.; Xu, B.; Huang, H.; Yu, Q.; Gong, P. Modelling spatial-temporal change of Poyang Lake using multitemporal Landsat imagery. Int. J. Remote Sens. 2008, 29, 5767–5784. [Google Scholar] [CrossRef]
  5. Dronova, I.; Gong, P.; Wang, L. Object-based analysis and change detection of major wetland cover types and their classification uncertainty during the low water period at Poyang Lake, China. Remote Sens. Environ. 2011, 115, 3220–3236. [Google Scholar] [CrossRef]
  6. Campos, J.C.; Sillero, N.; Brito, J.C. Normalized difference water indexes have dissimilar performances in detecting seasonal and permanent water in the Sahara–Sahel transition zone. J. Hydrol. 2012, 464, 438–446. [Google Scholar] [CrossRef]
  7. Pekel, J.F.; Cottam, A.; Gorelick, N.; Belward, A.S. High-resolution mapping of global surface water and its long-term changes. Nature 2016, 540, 418–422. [Google Scholar] [CrossRef]
  8. Tottrup, C.; Druce, D.; Meyer, R.P.; Christensen, M.; Riffler, M.; Dulleck, B.; Rastner, P.; Jupova, K.; Sokoup, T.; Haag, A.; et al. Surface water dynamics from space: A round robin intercomparison of using optical and sar high-resolution satellite observations for regional surface water detection. Remote Sens. 2022, 14, 2410. [Google Scholar] [CrossRef]
  9. Cao, H.; Han, L.; Li, L. Changes in extent of open-surface water bodies in China’s Yellow River Basin (2000–2020) using Google Earth Engine cloud platform. Anthropocene 2022, 39, 100346. [Google Scholar] [CrossRef]
  10. Tulbure, M.G.; Broich, M. Spatiotemporal dynamic of surface water bodies using Landsat time-series data from 1999 to ISPRS. J. Photogramm. Remote Sens. 2013, 79, 44–52. [Google Scholar] [CrossRef]
  11. Zou, Z.; Dong, J.; Menarguez, M.A.; Xiao, X.; Qin, Y.; Doughty, R.B.; Hooker, K.V.; Hambright, K.D. Continued decrease of open surface water body area in Oklahoma during 1984. Sci. Total Environ. 2017, 595, 451–460. [Google Scholar] [CrossRef] [PubMed]
  12. Tulbure, M.G.; Broich, M.; Stehman, S.V.; Kommareddy, A. Surface water extent dynamics from three decades of seasonally continuous Landsat time series at subcontinental scale in a semi-arid region. Remote Sens. Environ. 2016, 178, 142–157. [Google Scholar] [CrossRef]
  13. Sheng, Y.; Song, C.; Wang, J.; Lyons, E.A.; Knox, B.R.; Cox, J.S.; Gao, F. Representative lake water extent mapping at continental scales using multi-temporal Landsat-8 imagery. Remote Sens. Environ. 2016, 185, 129–141. [Google Scholar] [CrossRef]
  14. Rao, P.; Jiang, W.; Hou, Y.; Chen, Z.; Jia, K. Dynamic change analysis of surface water in the Yangtze River Basin based on MODIS products. Remote Sens. 2018, 10, 1025. [Google Scholar] [CrossRef]
  15. Huda, N.; Terao, T.; Nonomura, A.; Suenaga, Y. Time-Series Remote Sensing Study to Detect Surface Water Seasonality and Local Water Management at Upper Reaches of Southwestern Bengal Delta from 1972 to 2020. Sustainability 2021, 13, 9798. [Google Scholar] [CrossRef]
  16. Yang, X.; Qin, Q.; Yésou, H.; Ledauphin, T.; Koehl, M.; Grussenmeyer, P.; Zhu, Z. Monthly estimation of the surface water extent in France at a 10-m resolution using Sentinel-2 data. Remote Sens. Environ. 2020, 244, 111803. [Google Scholar] [CrossRef]
  17. Deng, Y.; Jiang, W.; Tang, Z.; Ling, Z.; Wu, Z. Long-term changes of open-surface water bodies in the Yangtze River basin based on the Google Earth Engine cloud platform. Remote Sens. 2019, 11, 2213. [Google Scholar] [CrossRef]
  18. Șerban, C.; Maftei, C.; Dobrică, G. Surface water change detection via water indices and predictive modeling using remote sensing imagery: A case study of Nuntasi-Tuzla Lake, Romania. Water 2022, 14, 556. [Google Scholar] [CrossRef]
  19. Allen, G.H.; Pavelsky, T.M. Global extent of rivers and streams. Science 2018, 361, 585–588. [Google Scholar] [CrossRef]
  20. Arvor, D.; Daher, F.R.; Briand, D.; Dufour, S.; Rollet, A.J.; Simoes, M.; Ferraz, R.P. Monitoring thirty years of small water reservoirs proliferation in the southern Brazilian Amazon with Landsat time series. ISPRS J. Photogramm. Remote Sens. 2018, 145, 225–237. [Google Scholar] [CrossRef]
  21. Avisse, N.; Tilmant, A.; Müller, M.F.; Zhang, H. Monitoring small reservoirs’ storage with satellite remote sensing in inaccessible areas. Hydrol. Earth Syst. Sci. 2017, 21, 6445–6459. [Google Scholar] [CrossRef]
  22. Carroll, M.L.; Loboda, T.V. Multi-decadal surface water dynamics in North American tundra. Remote Sens. 2017, 9, 497. [Google Scholar] [CrossRef]
  23. Deng, Y.; Jiang, W.; Tang, Z.; Li, J.; Lv, J.; Chen, Z.; Jia, K. Spatio-temporal change of lake water extent in Wuhan urban agglomeration based on Landsat images from 1987 to 2015. Remote Sens. 2017, 9, 270. [Google Scholar] [CrossRef]
  24. Fan, Y.; Chen, S.; Zhao, B.; Pan, S.; Jiang, C.; Ji, H. Shoreline dynamics of the active Yellow River delta since the implementation of Water-Sediment Regulation Scheme: A remote-sensing and statistics-based approach. Estuar. Coast. Shelf Sci. 2018, 200, 406–419. [Google Scholar] [CrossRef]
  25. Ogilvie, A.; Belaud, G.; Massuel, S.; Mulligan, M.; Le Goulven, P.; Calvez, R. Surface water monitoring in small water bodies: Potential and limits of multi-sensor Landsat time series. Hydrol. Earth Syst. Sci. 2018, 22, 4349–4380. [Google Scholar] [CrossRef]
  26. Aygen, C.; Balık, S. Işıklı Gölü ve Kaynaklarının (Çivril-Denizli) Crustacea Faunası. Ege J. Fish. Aquat. Sci. 2005, 22, 371–375. [Google Scholar]
  27. Çelik, M.A.; Gülersoy, A.E. Işıklı Gölü (Çivril-Denizli) çevresindeki arazi kullanım faaliyetlerinin göl üzerine etkilerinin incelenmesi. Süleyman Demirel Üniversitesi Fen-Edeb. Fakültesi Sos. Bilim. Derg. 2013, 29, 191–200. [Google Scholar]
  28. Işıklı ve Gökgöl Sulak Alanlarının Kurtarılması ve Sürdürülebilir Yönetimi için Fizibilite Raporu Oluşturulması Projesi. Available online: https://geka.gov.tr/uploads/pages_v/isikli-ve-gokgol-sulak-alanlarinin-surdurulebilir-yonetimi-fizibilite-raporu-2014.pdf (accessed on 24 June 2023).
  29. Ürker, O.; Arda, Ö. Işıklı Gölü ve Gökgöl Sulak Alanlarında Avrupa Doğa Bilgi Sistemi (EUNIS) Habitat Sınıflandırmasının Değerlendirilmesi. Erzincan Univ. J. Sci. Technol. 2020, 13, 518–531. [Google Scholar] [CrossRef]
  30. Firatli, E.; Dervisoglu, A.; Yagmur, N.; Musaoglu, N.; Tanik, A. Spatio-temporal assessment of natural lakes in Turkey. Earth Sci. Inform. 2022, 15, 951–964. [Google Scholar] [CrossRef]
  31. Yilmaz, O.S. Spatiotemporal statistical analysis of water area changes with climatic variables using Google Earth Engine for Lakes Region in Türkiye. Environ. Monit. Assess. 2023, 195, 735. [Google Scholar] [CrossRef]
  32. O’Reilly, C.M.; Sharma, S.; Gray, D.K.; Hampton, S.E.; Read, J.; Rowley, R.J.; Schneider, P.; Lenters, J.D.; Mcintyre, P.B.; Kraemer, B.M.; et al. Rapid and highly variable warming of lake surface waters around the globe. Geophys. Res. Lett. 2015, 42, 10773–10781. [Google Scholar] [CrossRef]
  33. Xie, C.; Zhang, X.; Zhuang, L.; Zhu, R.; Guo, J. Analysis of surface temperature variation of lakes in China using MODIS land surface temperature data. Sci. Rep. 2022, 12, 2415. [Google Scholar] [CrossRef]
  34. The Sentinel Missions. Available online: https://www.esa.int/Applications/Observing_the_Earth/Copernicus/The_Sentinel_missions (accessed on 4 June 2023).
  35. Li, J.; Peng, B.; Wei, Y.; Ye, H. Accurate extraction of surface water in complex environment based on Google Earth Engine and Sentinel-2. PLoS ONE 2021, 16, e0253209. [Google Scholar] [CrossRef]
  36. Chen, Z.; Zhao, S. Automatic monitoring of surface water dynamics using Sentinel-1 and Sentinel-2 data with Google Earth Engine. Int. J. Appl. Earth Obs. Geoinf. 2022, 113, 103010. [Google Scholar] [CrossRef]
  37. Gašparović, M.; Singh, S.K. Urban surface water bodies mapping using the automatic k-means based approach and sentinel-2 imagery. Geocarto Int. 2022, 2148757. [Google Scholar] [CrossRef]
  38. Wang, Y.; Li, X.; Zhou, P.; Jiang, L.; Du, Y. AHSWFM: Automated and hierarchical surface water fraction mapping for small water bodies using sentinel-2 images. Remote Sens. 2022, 14, 1615. [Google Scholar] [CrossRef]
  39. Niu, L.; Kaufmann, H.; Xu, G.; Zhang, G.; Ji, C.; He, Y.; Sun, M. Triangle Water Index (TWI): An advanced approach for more accurate detection and delineation of water surfaces in Sentinel-2 data. Remote Sens. 2022, 14, 5289. [Google Scholar] [CrossRef]
  40. Overview. Available online: https://sentinels.copernicus.eu/web/sentinel/missions/sentinel-2/overview (accessed on 22 June 2023).
  41. Velastegui-Montoya, A.; Montalván-Burbano, N.; Carrión-Mero, P.; Rivera-Torres, H.; Sadeck, L.; Adami, M. Google Earth Engine: A Global Analysis and Future Trends. Remote Sens. 2023, 15, 3675. [Google Scholar] [CrossRef]
  42. Owusu, C. PyGEE-SWToolbox: A Python Jupyter notebook toolbox for ınteractive surface water mapping and analysis using Google Earth Engine. Sustainability 2022, 14, 2557. [Google Scholar] [CrossRef]
  43. Wang, R.; Pan, L.; Niu, W.; Li, R.; Zhao, X.; Bian, X.; Yu, C.; Xia, H.; Chen, T. Monitoring the spatiotemporal dynamics of surface water body of the Xiaolangdi Reservoir using Landsat-5/7/8 imagery and Google Earth Engine. Open Geosci. 2021, 13, 1290–1302. [Google Scholar] [CrossRef]
  44. Qian, Y.; Zhou, W.; Yan, J.; Li, W.; Han, L. Comparing machine learning classifiers for object-based land cover classification using very high resolution imagery. Remote Sens. 2014, 7, 153–168. [Google Scholar] [CrossRef]
  45. Li, J.; Ma, R.; Cao, Z.; Xue, K.; Xiong, J.; Hu, M.; Feng, X. Satellite detection of surface water extent: A review of methodology. Water 2022, 14, 1148. [Google Scholar] [CrossRef]
  46. Sun, J.Y.; Wang, G.Z.; He, G.J.; Pu, D.C.; Jiang, W.; Li, T.T.; Niu, X.F. Study on the water body extraction using GF-1 data based on adaboost integrated learning algorithm. Int. Arch. Photogramm. Remote Sens. Spat. Inf. Sci. 2020, 42, 641–648. [Google Scholar] [CrossRef]
  47. Amani, M.; Salehi, B.; Mahdavi, S.; Granger, J.E.; Brisco, B.; Hanson, A. Wetland classification using multi-source and multi-temporal optical remote sensing data in Newfoundland and Labrador, Canada. Can. J. Remote Sens. 2017, 43, 360–373. [Google Scholar] [CrossRef]
  48. Ulusal Öneme Haiz Sulak Alanlar. Available online: https://www.tarimorman.gov.tr/DKMP/Belgeler/Korunan%20Alanlar%20Listesi/3-%20sulak%20alanlar.pdf (accessed on 23 June 2023).
  49. Fakıoğlu, Ö.; Demir, N. Beyşehir Gölü Fitoplankton Biyokütlesinin Mevsimsel ve Yersel Değişimleri. Ekoloji Dergisi 2011, 20, 23–32. [Google Scholar]
  50. Available online: https://earthengine.google.com/ (accessed on 26 May 2023).
  51. FAQ. Available online: https://earthengine.google.com/faq/ (accessed on 21 June 2023).
  52. Jia, M.; Wang, Z.; Mao, D.; Ren, C.; Wang, C.; Wang, Y. Rapid, robust, and automated mapping of tidal flats in China using time series Sentinel-2 images and Google Earth Engine. Remote Sens. Environ. 2021, 255, 112285. [Google Scholar] [CrossRef]
  53. Praticò, S.; Solano, F.; Di Fazio, S.; Modica, G. Machine learning classification of mediterranean forest habitats in google earth engine based on seasonal sentinel-2 time-series and input image composition optimisation. Remote Sens. 2021, 13, 586. [Google Scholar] [CrossRef]
  54. Li, H.; Jia, M.; Zhang, R.; Ren, Y.; Wen, X. Incorporating the plant phenological trajectory into mangrove species mapping with dense time series Sentinel-2 imagery and the Google Earth Engine platform. Remote Sens. 2019, 11, 2479. [Google Scholar] [CrossRef]
  55. Aslan, N.; Koc-San, D. Investigation of the changes of lake surface temperatures and areas: Case study of Burdur and Egirdir Lakes, Turkey. Int. Arch. Photogramm. Remote Sens. Spat. Inf. Sci. 2021, 43, 299–304. [Google Scholar] [CrossRef]
  56. Ermida, S.L.; Soares, P.; Mantas, V.; Göttsche, F.M.; Trigo, I.F. Google earth engine open-source code for land surface temperature estimation from the landsat series. Remote Sens. 2020, 12, 1471. [Google Scholar] [CrossRef]
  57. CHIRPS Pentad: Climate Hazards Group InfraRed Precipitation with Station Data (Version 2.0 Final). Available online: https://developers.google.com/earth-engine/datasets/catalog/UCSB-CHG_CHIRPS_PENTAD#description (accessed on 21 June 2023).
  58. ERA5-Land Monthly Aggregated—ECMWF Climate Reanalysis. Available online: https://developers.google.com/earth-engine/datasets/catalog/ECMWF_ERA5_LAND_MONTHLY_AGGR#description (accessed on 21 June 2023).
  59. NOAA. Meteorological Versus Astronomical Seasons. Available online: https://www.ncei.noaa.gov/news/meteorological-versus-astronomical-seasons (accessed on 21 June 2023).
  60. Jones, H.G.; Vaughan, R.A. Remote Sensing of Vegetation: Principles, Techniques, and Applications; Oxford University Press: Oxford, UK, 2010. [Google Scholar]
  61. Yamazaki, D.; Trigg, M.A.; Ikeshima, D. Development of a global~ 90 m water body map using multi-temporal Landsat images. Remote Sens. Environ. 2015, 171, 337–351. [Google Scholar] [CrossRef]
  62. Rouse, J.W.; Haas, R.H.; Deering, D.W.; Sehell, J.A. Monitoring the Vernal Advancement and Retrogradation (Green Wave Effect) of Natural Vegetation; 1974 Final Report RSC 1978-4; Remote Sensing Center, Texas A&M Univ.: College Station, TX, USA, 1974. [Google Scholar]
  63. McFeeters, S.K. The use of the Normalized Difference Water Index (NDWI) in the delineation of open water features. Int. J. Remote Sens. 1996, 17, 1425–1432. [Google Scholar] [CrossRef]
  64. Xu, H. Modification of normalised difference water index (NDWI) to enhance open water features in remotely sensed imagery. Int. J. Remote Sens. 2006, 27, 3025–3033. [Google Scholar] [CrossRef]
  65. Jiang, W.; Ni, Y.; Pang, Z.; Li, X.; Ju, H.; He, G.; Lv, J.; Yang, K.; Fu, J.; Qin, X. An effective water body extraction method with new water index for sentinel-2 imagery. Water 2021, 13, 1647. [Google Scholar] [CrossRef]
  66. Breiman, L. Random forests. Mach. Learn. 2001, 45, 5–32. [Google Scholar] [CrossRef]
  67. Zhou, X.; Wen, H.; Zhang, Y.; Xu, J.; Zhang, W. Landslide susceptibility mapping using hybrid random forest with GeoDetector and RFE for factor optimization. Geosci. Front. 2021, 12, 101211. [Google Scholar] [CrossRef]
  68. McHugh, M.L. Interrater reliability: The kappa statistic. Biochem. Medica 2012, 22, 276–282. [Google Scholar] [CrossRef]
  69. Karakuş, P.; Karabork, H.; Kaya, S. A comparison of the classification accuracies in determining the land cover of Kadirli Region of Turkey by using the pixel based and object based classification algorithms. Int. J. Eng. Geosci. 2017, 2, 52–60. [Google Scholar] [CrossRef]
  70. Duguay-Tetzlaff, A.; Bento, V.A.; Göttsche, F.M.; Stöckli, R.; Martins, J.P.; Trigo, I.; Olesen, F.; Bojanowski, J.S.; Da Camara, C.; Kunz, H. Meteosat land surface temperature climate data record: Achievable accuracy and potential uncertainties. Remote Sens. 2015, 7, 13139–13156. [Google Scholar] [CrossRef]
  71. Level-2A. Available online: https://sentinels.copernicus.eu/web/sentinel/user-guides/sentinel-2-msi/product-types/level-2a (accessed on 21 June 2023).
  72. De Sousa, C.; Fatoyinbo, L.; Neigh, C.; Boucka, F.; Angoue, V.; Larsen, T. Cloud-computing and machine learning in support of country-level land cover and ecosystem extent mapping in Liberia and Gabon. PLoS ONE 2020, 15, e0227438. [Google Scholar] [CrossRef]
  73. Zhao, F.; Feng, S.; Xie, F.; Zhu, S.; Zhang, S. Extraction of long time series wetland information based on Google Earth Engine and random forest algorithm for a plateau lake basin–A case study of Dianchi Lake, Yunnan Province, China. Ecol. Indic. 2023, 146, 109813. [Google Scholar] [CrossRef]
Figure 1. Study Area.
Sustainability 15 13398 g001
Figure 2. The workflow of the methodology.
Sustainability 15 13398 g002
Figure 3. Annual Lake Area.
Sustainability 15 13398 g003
Figure 4. Seasonal Lake Area.
Sustainability 15 13398 g004
Figure 5. Monthly Lake Area.
Sustainability 15 13398 g005
Figure 6. The seasonal relationship between the NDVI, NDWI, MNDWI, and SWI spectral indices.
Sustainability 15 13398 g006
Figure 7. The monthly relationship between the NDVI, NDWI, MNDWI, and SWI spectral indices.
Sustainability 15 13398 g007
Figure 8. Monthly evaporation, precipitation, and temperature.
Sustainability 15 13398 g008
Figure 9. Annual, seasonal, and monthly relationship of temperature and LSWT.
Sustainability 15 13398 g009
Figure 10. The monthly relationship between evaporation and precipitation.
Sustainability 15 13398 g010
Table 1. Band information of the Sentinel-2 Level-2A data.
Band NamePixel Size (Meters)Band
Description
Band NamePixel Size
(Meters)
Band
Description
B160AerosolsB810NIR
B210Blue B8A20Red Edge 4
B310GreenB960Water vapor
B410RedB1120SWIR 1
B520Red Edge 1B1220SWIR 2
B620Red Edge 2QA6060Cloud mask
B720Red Edge 3   
Table 2. Spectral indices are used to improve classification accuracy.
Water IndicesLiteratureBands
NDWI[63] (McFeeters, 1996)B8, B4
MNDWI[64] (Xu, 2006)B3, B8
NDVI[62] (Rouse et al.,1974)B3, B11
SWI[65] (Jiang et al., 2021)B5, B11
Table 3. The annual accuracy assessment results in the RFs Method.
 20182019202020212022
Lake Area (km2)32.1131.2328.7726.7223.73
OA10.980.980.981
UA10.940.960.981
PA10.980.980.981
Kappa10.960.970.961
Table 4. Seasonal correlation matrix between spectral indices.
 NDWIMNDWISWINDVI
NDWI1   
MNDWI0.9227731  
SWI0.7478630.8522291 
NDVI−0.94603−0.89701−0.770011
Table 5. Monthly correlation matrix between spectral indices.
 NDWISWIMNDWINDVI
NDWI1   
SWI0.7084591  
MNDWI0.8696210.8673741 
NDVI−0.90895−0.68793−0.750761
Table 6. Annual, Monthly, and Seasonal correlation analysis.
Annual CorrelationLSWT (°C)Evaporation (mm)Temperature (°C)Precipitation (mm)
Lake Area (km2)0.3233510.7381690.748710.332416
LSWT10.8665450.8635740.620194
Monthly Correlation    
Lake Area (km2)−0.60633−0.36548−0.550650.498379
LSWT10.9033520.964479−0.50364
Seasonal Correlation    
Lake Area (km2)−0.579663−0.329132−0.4705740.5994775
LSWT10.93304130.9795878−0.731416
Disclaimer/Publisher’s Note: The statements, opinions and data contained in all publications are solely those of the individual author(s) and contributor(s) and not of MDPI and/or the editor(s). MDPI and/or the editor(s) disclaim responsibility for any injury to people or property resulting from any ideas, methods, instructions or products referred to in the content.

