Article

Product Traceability and Supply Chain Sustainability of Black Soybeans as Raw Materials for Soy Sauce in Maintaining Quality and Safety

1
Doctorate Program of Agricultural Science, Faculty of Agriculture, Universitas Padjadjaran, Sumedang 45363, Indonesia
2
Department of Agro Socio-Economics, Faculty of Agriculture, Universitas Padjadjaran, Sumedang 45363, Indonesia
3
Department of Agronomy, Faculty of Agriculture, Universitas Padjadjaran, Sumedang 45363, Indonesia
*
Author to whom correspondence should be addressed.
Sustainability 2023, 15(18), 13453; https://doi.org/10.3390/su151813453
Submission received: 2 July 2023 / Revised: 29 August 2023 / Accepted: 6 September 2023 / Published: 8 September 2023

Abstract

:
Black soybeans are a necessary raw material for the soy sauce industry in Indonesia, with the reason being that they are preferred because they have a natural black color and a delicious and savory taste. As a source of raw material for soy sauce, the industry ensures that the black soybean supply chain is sustainable and can meet production requirements in quality and quantity. This research aims to trace the product and supply chain of sustainable black soybeans as raw materials for soy sauce. The selection of data sources or informants in this study in Indonesia comprised 122 farmer groups that assisted or collaborated with cooperatives that sent black soybeans to be used as raw materials for making soy sauce; 1 field assistant; and 4 cooperatives that collaborated with the industry. The data collection techniques used in this study were observation, in-depth interviews, and documentation. The types of documentation were research notes based on interview guides, research photos, and official institutional documents. The data analysis method used in this study was a qualitative approach with the help of QSR NVivo version 12 Plus software. The results of this study show that traceability in production is necessary to maintain safety, quality, and sustainability. Product traceability requires a monitoring system and regulations established by the industry that all stakeholders must follow, starting with farmer groups and cooperatives that supply raw materials to the industry. A good monitoring system places employees from the industry as agricultural assistants. As such, it will also determine the sustainability of the economic, social, environmental, technological, institutional, and infrastructural dimensions. Traceability in the production of black soybeans used as raw materials for making soy sauce, namely those of the Mallika variety that are round/whole and unbroken, will be accepted by the industry. The process carried out by farmer groups from planting to harvesting black soybeans is controlled by agricultural assistants and follows regulations set by the industry. The cooperative lends black soybean seeds to grade-A-seed-quality farmer groups. The farmer group repays the loan at harvest time and returns it to the cooperative in cash sums of 10,000 IDR/kg.

1. Introduction

In the late 1970s, soybeans started to receive attention from organizations in the global market [1,2], so at that time, many industries began to need soybean supplies [3]. Soybeans are consumed globally in various forms, such as whole soybeans and processed products [4]. Six percent of soybeans are used as seeds, and the remainder are used in industry, such as in soy sauce, tofu, tempeh, tacos, milk, yogurt, burgers, and feed [3,5,6,7].
In Indonesia, the manufacture of soy sauce uses black soybean as a raw material due to its preferred natural black color, pleasant taste, and savoriness [8]. As a raw material for soy sauce, the industry ensures a stable supply chain of black soybeans that can meet production requirements in quality and quantity [9,10]. To deal with the supply of black soybeans, preparations are made to increase their production, such as expanding soybean development on forest land [11] and designing an effective supply chain to meet the demand for black soybeans [9].
Increasing the production and consumption of black soybeans requires traceability information from an appropriate, effective, and efficient supply chain network [10]. Leading multinational food and agribusiness enterprises (F&A MNEs) that need soybean raw materials, such as Unilever, Hershey, Mars, Cargill, and Nestlé, have designed supply chains to be effective and efficient [9,10,12]. The consumption of processed products using GM (genetically modified) raw soybean materials worries consumers [1]. Consumers have perceptions regarding nutrition, potential health risks, perishable products, and insufficient food labels as controls for product safety and quality [13,14,15].
To maintain the quality and safety of soybean products, it is necessary to trace production and processing and analyze the basic traceability framework for recording product information [16], because this traceability can communicate product quality and origin information for consumer safety [17]. In addition, it is possible to track the stakeholders involved, such as farmers, distributors, retailers, and consumers [18,19], so that they know how to handle products and sustainability [20,21,22,23,24]. Thus, product traceability is used to provide quality and safe food products for consumption [25,26]. It is also used to track food or food-producing ingredients through all stages of production, processing, and distribution [27], as well as to maintain detailed information about planting and processing that it can provide regarding quality problems and for consumers [16]. This traceability takes the form of systematic records from the supply chain related to food product items through identification and documentation of how ingredients from food products are combined [10].
The traceability system is applied as a tool to ensure food safety and quality and gain consumer confidence [28,29]. Traceability information can effectively help consumers master purchase details and contribute to the efficient development of various industries, which can store product names, raw materials, production and processing processes, transportation, and other information in digital form [30]. This digital technology information is necessary for tracking all kinds of work and data security in various organizations and institutions [31]. Thus, in the supply chain hierarchy, when there is a manufacturing defect, mislabeling, safety issue, or the product has exceeded its shelf life, a product recall can be carried out, and both time and additional costs can be calculated [32]. The use of digital information, such as watermarking or cloud computing, can provide owner identification, transaction tracking, access control, authentication, tamper-proofing, and even persistent item identification, resulting in efficiency, cost-effectiveness, flexibility, and scalability [33,34]. Digital information with the Internet of Things (IoT) requires detailed access control, so data security is essential for transferring data over the Internet [35].
It can be used to determine the whereabouts of several actors and production volumes to facilitate decision-making [36], and traceability is based on reports from various actors involved in the supply chain (including production, shipping, and processing systems) until the product is received in the industry [37,38]. It is an effective solution, acting as a management tool to ensure product safety and quality in the supply chain [39]. Traceability concerns the verification of a product’s authenticity to ensure its safety and quality, such as a true statement of geographic origin, variety, or cultivation [40,41], and provides valuable and timely information for various stakeholders and decision-makers, from planting to harvesting to crop production forecasting [42].
Product traceability can also review black soybean supply chain sustainability through the economic, social, environmental, technological, institutional, and infrastructural dimensions [23]. Economically, it can reduce losses, increase income, minimize risk [36,37], and allocate resources efficiently [13,17]. In addition, it can maximize the expected profits from supply chain actors and improve product quality so that the higher the product quality, the lower the return [14,43], and it can increase asset value and business profits by reducing the risk of costs that will occur [11,28,44]. Socially, traceability can effectively reduce performance bottlenecks and improve the communication of supply chain actors [45]. However, government support, consumer support, vendor support with management, and effective communication [20,29,46] are required to create strong trust and transparency among supply chain actors [31,47].
The environmental dimension can be addressed with waste management [20], pest and disease control [48], the availability of fertilizers and pesticides [24,29,40,49], and sustainable water management [38]. Waste management considers the benefits of reusing/recycling waste materials [50]. Furthermore, the technological dimension ensures sustainability under climate change by adopting plant breeding seed technology to achieve high production and increased productivity [48,51]. Field use of seeds needs to be tracked [40], as seeds have a direct impact on production [52]. Traceability examines the institutional dimension; supply chain stakeholders make internal governance arrangements, and external stakeholders seek to influence supply chain activities [48]. There has been proactive development of various innovation institutions and regulations for supply chain sustainability, such as codes of conduct, product information, and eco-branding [14]. Sustainability in the infrastructure dimension has increased, such as for roads, product storage, product conditions, irrigation development, and port improvements [30].
This study aims to trace the product and supply chain of sustainable black soybeans as raw materials for soy sauce using a qualitative approach with the help of QSR NVivo version 12 Plus software. Traceability can be realized by several companies, such as the Great Northern Wilderness People Organic Food Co., Ltd., which made their organic soybean production traceable [16]. The European Food Safety Agency (EFSA) enforced stricter traceability for the food industry in Europe to avoid bovine spongiform encephalopathy (BSE), foot-and-mouth disease (FMD) [17,19], and issues relating to the use of GMO products in food [25,28], and the European Commission sponsored the TRACE project to deal with various food safety and health issues [10]. Soybean production companies in Brazil, such as in the states of Mato Grosso, Paraná, and Rio Grande do Sul, apply traceability to manage seed use through distribution [30]. The contribution of this article is product traceability, starting from seedling, planting, harvesting, pest control, and sustainability (Table 1). Sustainability is examined in six dimensions: economic, social, environmental, technological, institutional, and infrastructure. Product traceability in the description above has several research gaps, namely in seeds; seeds and planting; planting and harvesting; and planting, pests, and diseases. Likewise, with sustainability, there are gaps in one-dimensional, two-dimensional, or three-dimensional research. Therefore, this article combines various articles on product traceability with four topics to be discussed, namely seeding, planting, harvesting, and pest control, and six dimensions of sustainability.
Several literature searches in Table 1 are classified regarding article period, product traceability (food/soy), discussion of product traceability (seed, plant, harvest, pest, and disease), sustainability, approaches, and models. The sustainability of this article has six dimensions: economic (eco), social (soc), environmental (env), technological (tech), institutional (inst), and infrastructure (infra). In this article, 21 pieces of literature were obtained from 2006 to 2022 using quantitative (quan) and qualitative (qual) approaches. Models found in the literature include XML-PML (eXtensible markup language-physical markup language), XML, RFID (radio frequency identification), RFID TQM (RFID total quality management), UML (unified modeling language), SEI-PCS (spatially explicit information on production to consumption systems), ERP (enterprise resource planning), blockchain, blockchain-IoT (blockchain-Internet of Things), GEE (Google Earth engine), logit, and websites. The symbols Y and N, representing yes and no, respectively, indicate whether a given article falls within the predefined classification.

2. Materials and Methods

2.1. Study Area

The locations in this study were places where farmer groups are assisted by or collaborate with cooperatives that supply Mallika black soybeans to be used as raw materials for making soy sauce. The research locations were in Indonesia, in Bantul Regency, Kulonprogo Regency, Pacitan Regency, Blitar Regency, Trenggalek Regency, Nganjuk Regency, Madiun Regency, and Banyuwangi Regency (Figure 1). The informants in this study were (1) farmer groups working with cooperatives that supply Mallika black soybeans to the soy sauce industry; (2) field assistants; and (3) cooperatives working with the soy sauce industry.
The main use of black soybeans is as a raw material for making soy sauce [51]. They are preferred because they give it a natural black color and a delicious taste [52]. As a source of raw materials for soy sauce, Unilever ensures a stable black soybean supply chain and can meet production requirements in quality and quantity [9,10,53]. The supply of black soybeans must be maintained for the sustainability of the soysauce industry [54].

2.2. Participants

There were 122 farmer group informants in this study. Specifically, there were 5 groups in Bantul Regency, 6 groups in Kulonprogo Regency, 17 groups in Pacitan Regency, 12 groups in Blitar Regency, 13 groups in Trenggalek Regency, 8 groups in Nganjuk Regency, 6 groups in Madiun Regency, and 55 groups in Banyuwangi Regency. There was 1 field assistant informant and 4 cooperatives, namely the Mekar Mas Lendah, the Agro Bina Mandiri, Business Development, and Sinar Agro Solusi cooperatives.
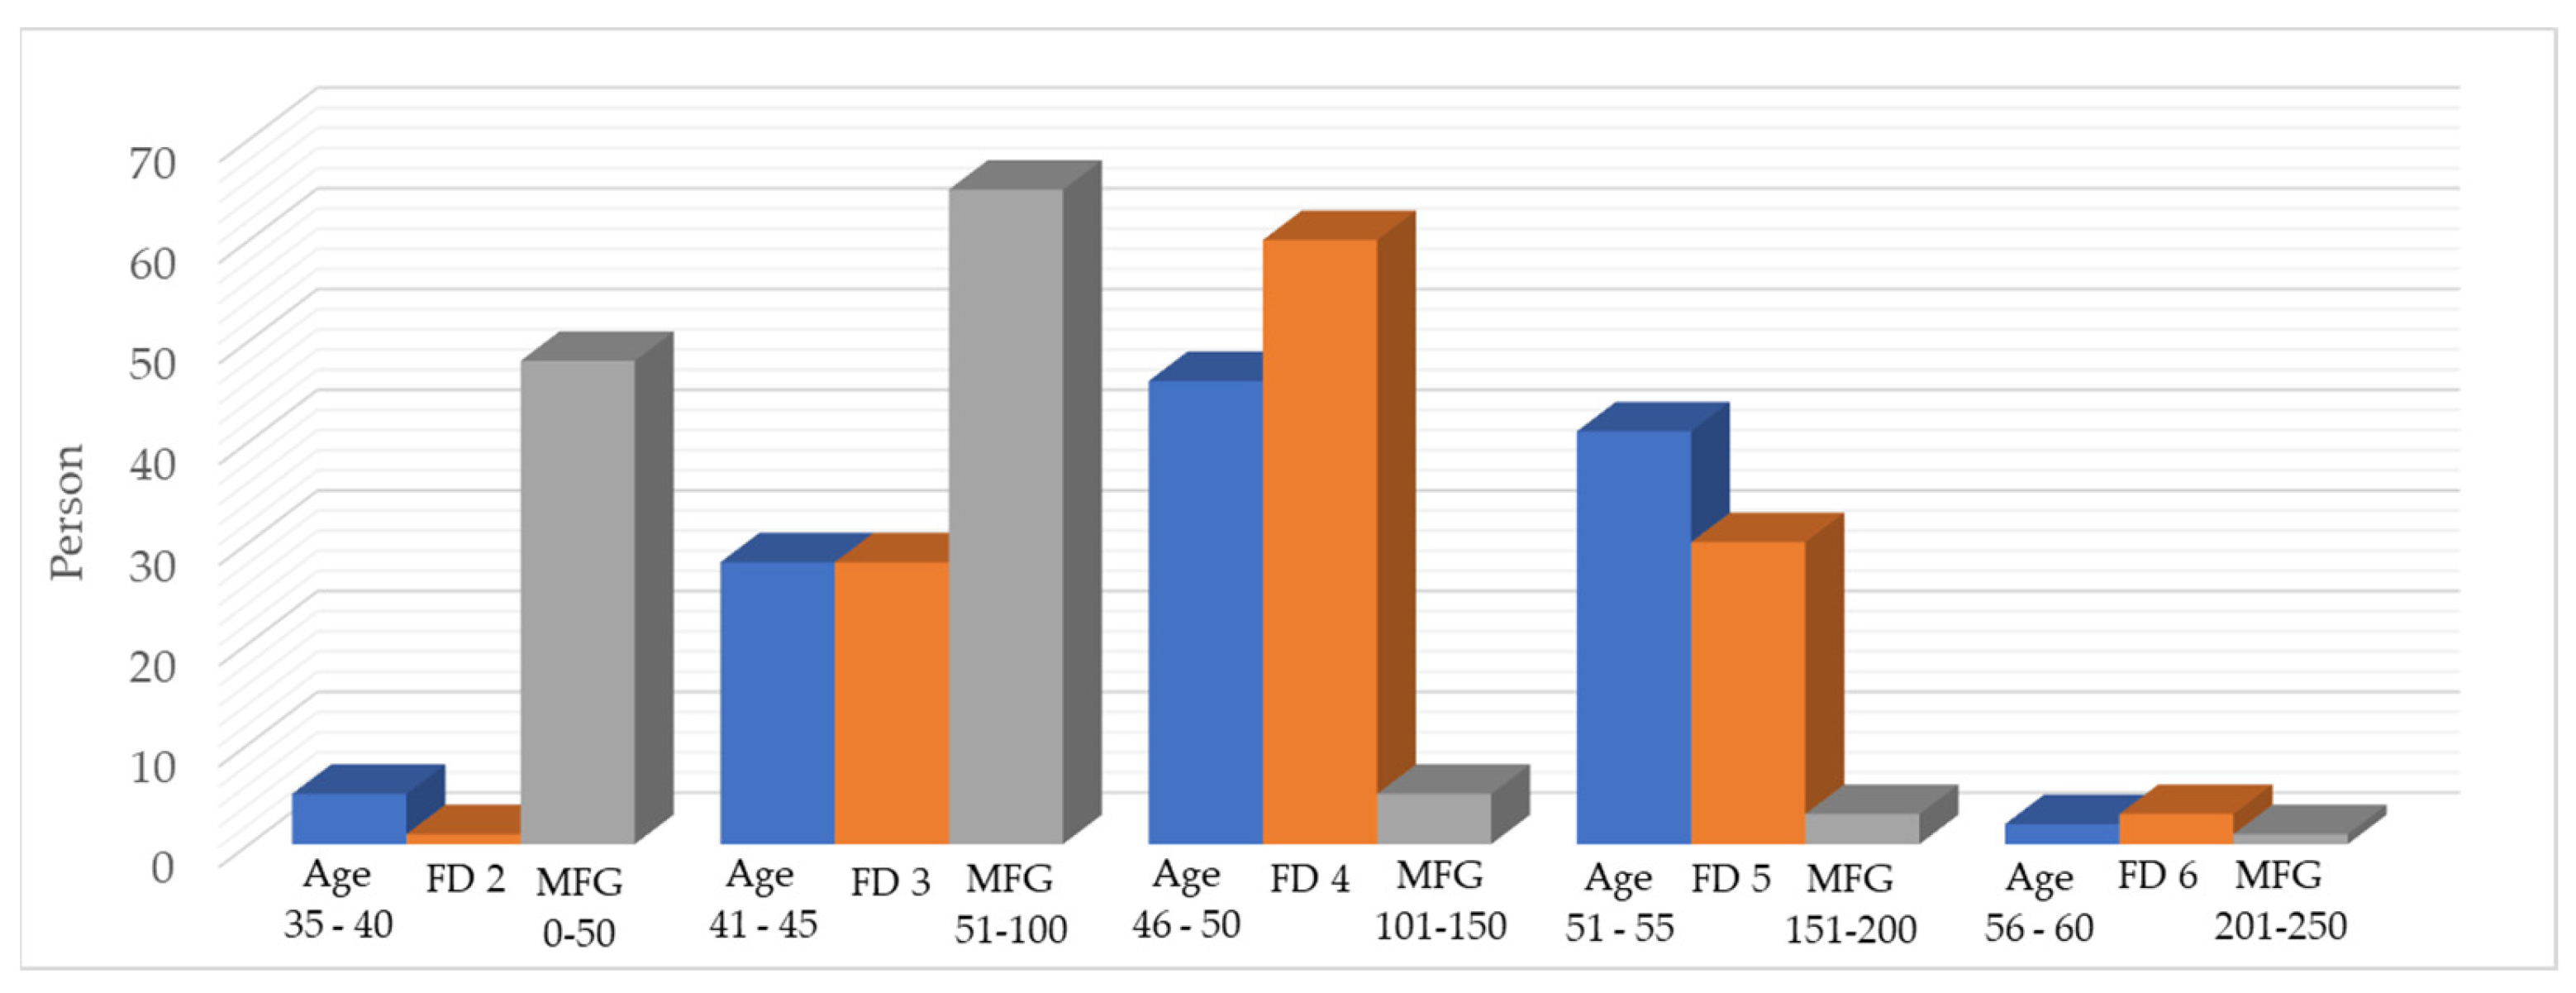
Figure 2 above shows that the average age of black soybean farmer group informants is 46–50 years old, with an average number of dependents of 4 people and 51–100 farmer group members. It can be concluded that the age of black soybean supply chain actors at the upstream level is the productive age, which is between 15 and 64 years, while the unproductive ages are under 15 years and 65 years and over [55]. For the dependents of black soybean supply chain actor families, there are four people at most, meaning that the burden of responsibility is greater to meet the needs of the family, and the maximum number of farmer group members is between 51 and 100 people, so there are many roles for increasing black soybean farming. The higher the number of family dependents, the greater the amount of income needed, so if the income from black soybeans is not enough, the farmer groups will look for additional income [56]. Groups that have more members will motivate their members to be more active and play a role in various activities to improve their farming [57].

2.3. Data Analysis

In this study, data analysis was performed using a qualitative approach with the help of QSR NVivo version 12 Plus software. Qualitative research data are very rich, coming from various sources with various data collection techniques, and can be analyzed in QSR NVivo version 12 Plus software [58]. At first, the data were organized into the same themes and subthemes by coding, where themes were generated based on research questions and recorded [59]. The data sources analyzed were internal and external research data sources, as well as researchers’ notes during the study. Data were collected and coded in separate classified files [60].
The theme categories that the researcher analyzed during the coding process were stored in nodes. Nodes were created for black soybean seeds, plant, harvest, production, and the SAC (Table 2). Nodes are ‘containers’ where researchers store themes, participants, research settings, and research organizations [61]. Within these nodes, there are parent nodes and child nodes. To make it easier to make nodes, parent nodes, and child nodes were made [61]. We created nodes by using the word frequency query feature to search for these nodes’ words, and we explored it further with the text search query feature.
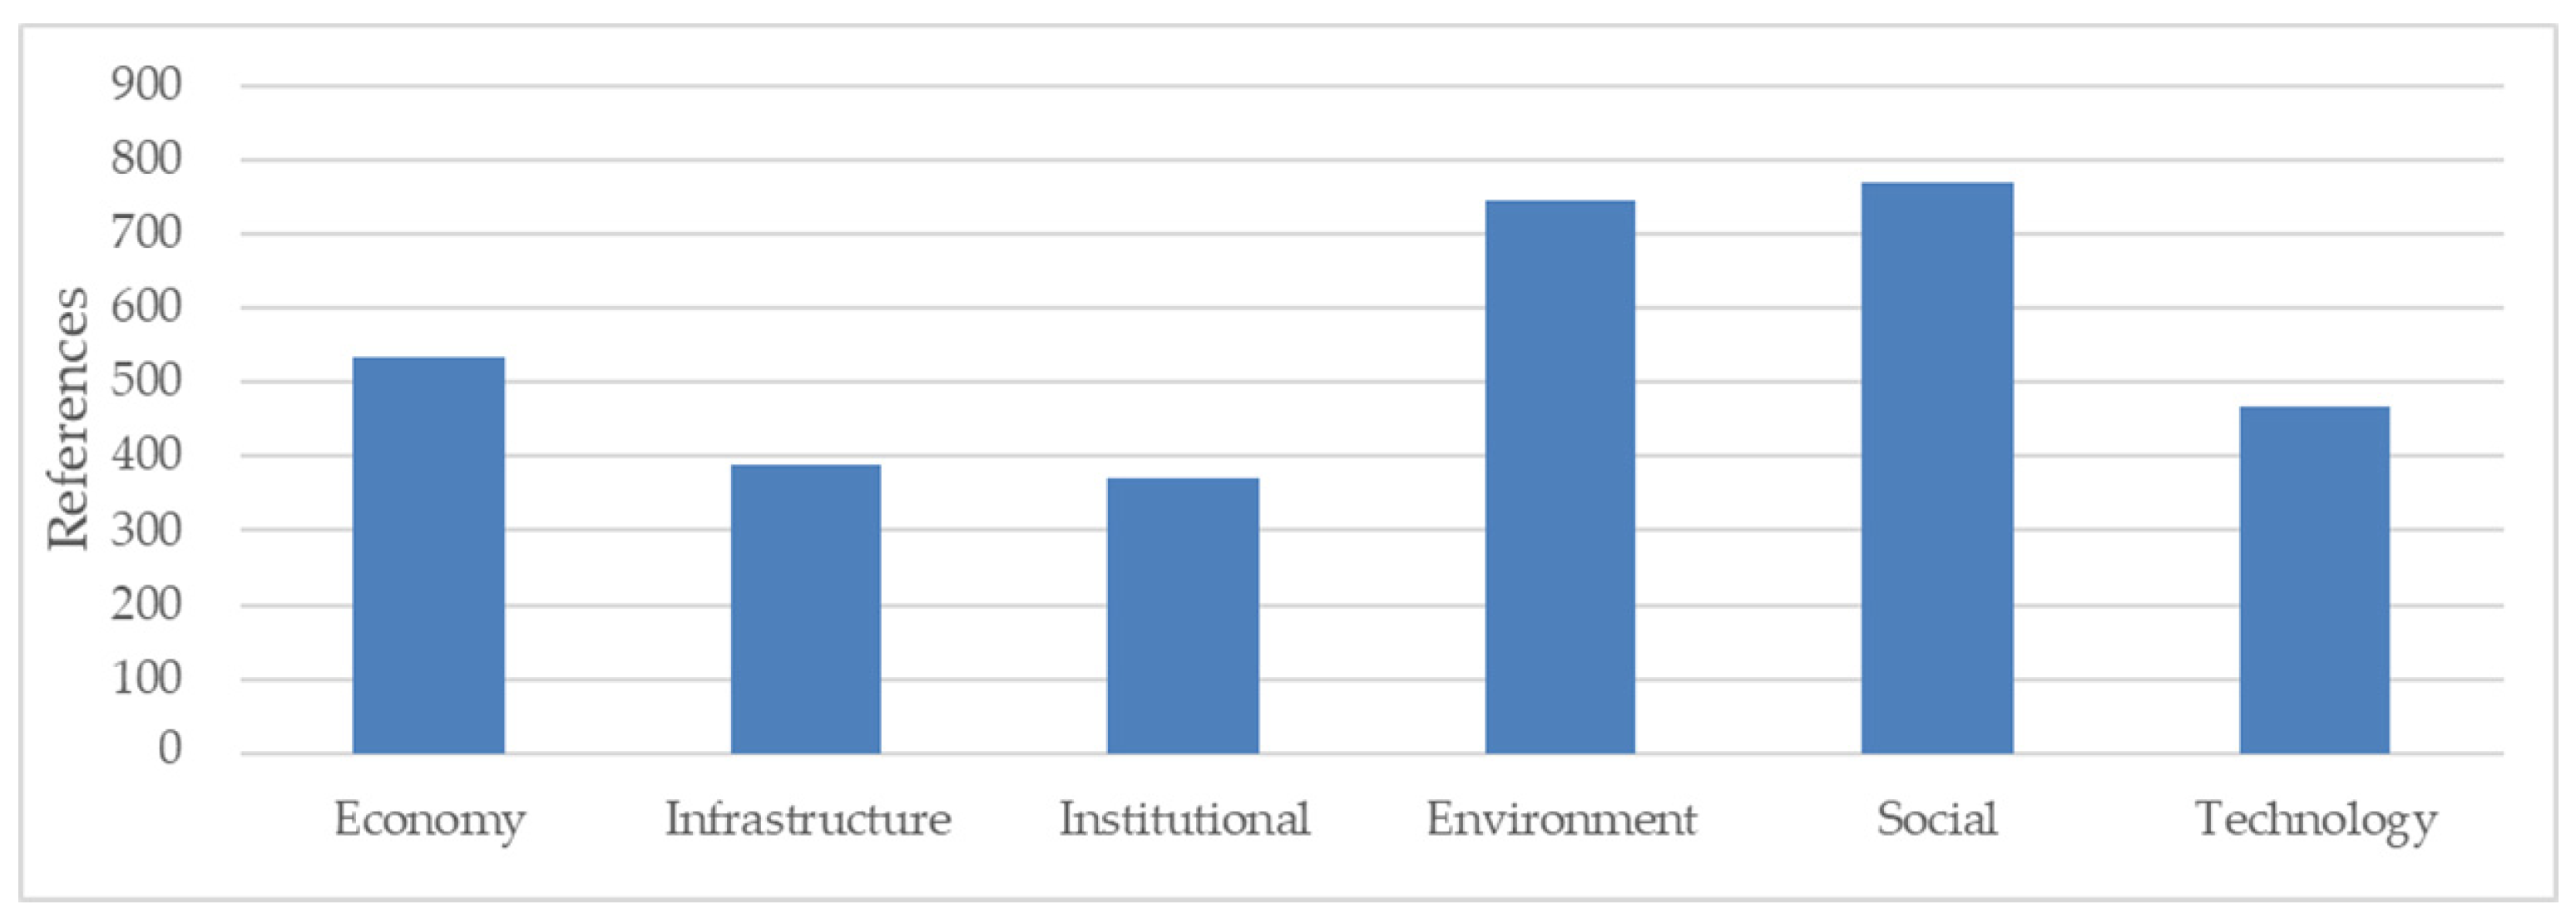
We coded nodes for black soybean supply chain sustainability. The dimensions of sustainability were economic, social, environmental, technological, institutional, and infrastructural. The number of references for coding these nodes on the QSR comes from the type of research documentation presented in Figure 3.
In Figure 3 above, the nodes formed have an average of 125 files, with an average reference of 447 for each piece of information from informants. Production, use of seeds, and farmer groups participating in planting were the nodes that were most often conveyed by informants. It can be seen that informants more often disclosed about products received by the cooperative or received by the soy sauce industry, namely grades A, B, C, and D. Informants also often informed me that grade A Mallika black soybean seeds were used. In addition, informants often expressed enthusiasm among farmer groups for participating in the planting of black soybeans.
In coding economic nodes, parent nodes are income, farm expenses, and loans. Coding infrastructure nodes created parent nodes, namely farm roads and irrigation lines. For coding institutional nodes, the parent nodes are the number of farmer group members participating in farming, the number of farmer groups participating in farming, and group capital. Parent nodes for water availability, fertilizer availability, and pest control are for coding environmental nodes. Social nodes are parent nodes for group meetings and labor (social service). Parent nodes for harvest area, planting area, seed use, production, and productivity are for coding technology nodes.
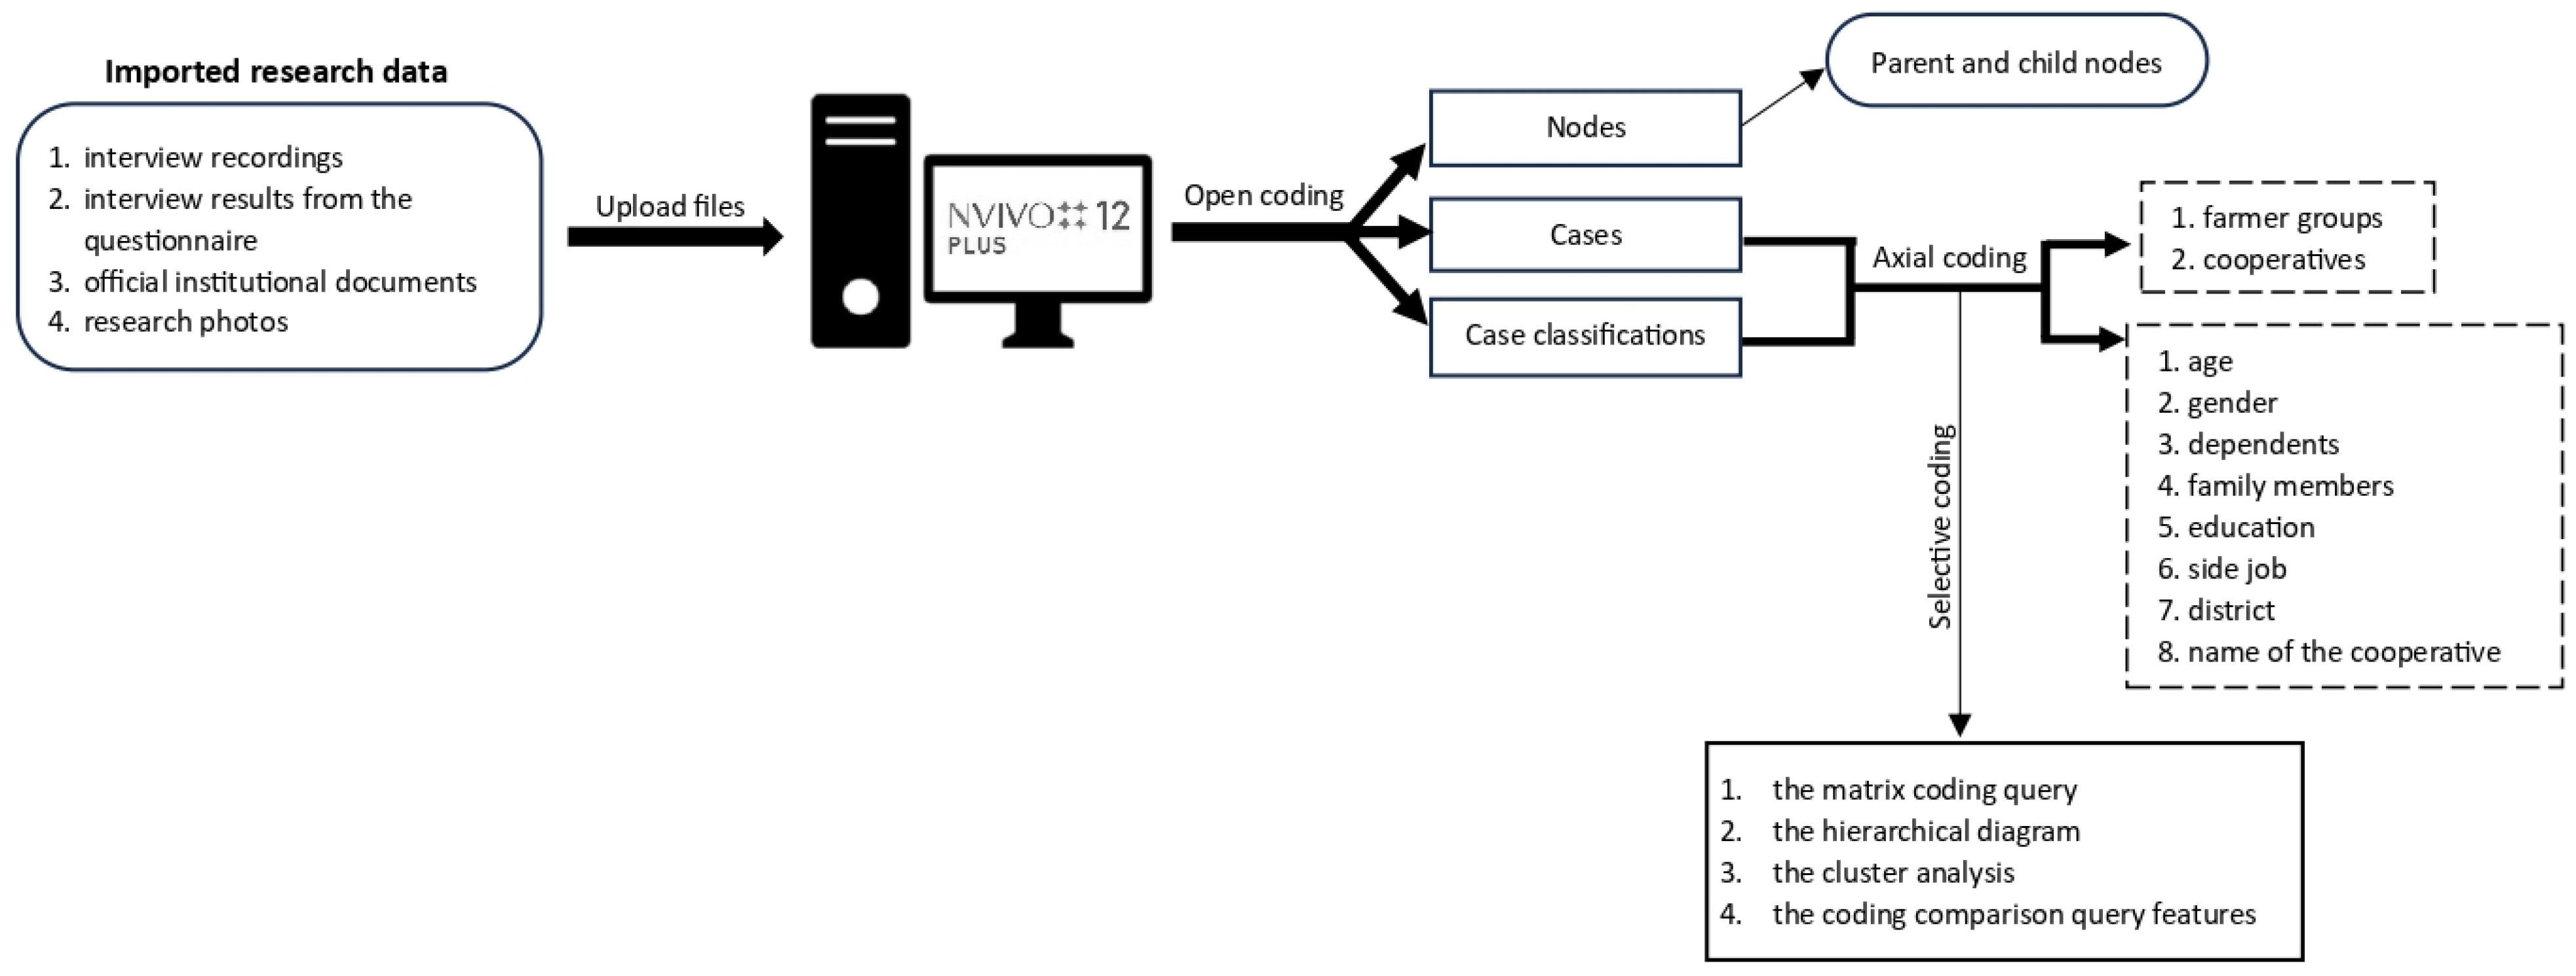
Table 2 above was derived from the documentation imported into QSR NVivo version 12 Plus. Four folders were created: interview recordings, interview results from the questionnaire, official institutional documents, and research photos, as shown in Figure 4. The descriptive coding above is the sentence that appears the most in the coding. We used the research data collection techniques of observation, in-depth interviews, and documentation. The observation technique used was indirect. This kind of observation was made to explain, provide, and detail everything that happened. There are two types of observation: (1) indirect observation, an observation in which a researcher does not enter the community, can only see with their eyes about activities and objects, or is assisted by other tools, such as a camera; and (2) participant observation, a direct observation performed by involving oneself in the activities of the community being studied [58,61]. The type of documentation technique performed consisted of recording information based on interview guides, official institutional documents, and research photographs. Interviews were carried out systematically by compiling an interview guide. In interviews, researchers could conduct face-to-face or telephone interviews with participants or be directly involved in focus group discussion interviews consisting of six to eight participants per group [58,61]. There were two ways to collect interview data: with a voice recorder or a Google Form. The Google Form comprised questions according to the interview guide and information on how to retrieve data using Google Board, which are saved to Google Drive.
After data were collected, they were processed by means of data reduction, presentation, and conclusion. Data reduction techniques comprise open coding, axial coding, and selective coding [61]. In QSR NVivo version 12 Plus, we conducted the data reduction with open coding, which consists of nodes, cases, and case classifications. Furthermore, axial coding techniques comprise the coding and classification of cases. In the coding of cases, we created two categories, namely farmer groups and cooperatives. For case classifications, we created eight attributes, namely age, gender, dependents, family members, education, side job, district, and name of the cooperative. After creating open coding and axial coding, we performed selective coding by clicking features in the open coding and axial coding that had been created previously. The result was the matrix coding query, the hierarchical diagram, the cluster analysis, and the coding comparison query features. A matrix coding query is a data structure that can represent information, where the data structure comes from nodes and cases that have been made [61,62,63]. A hierarchical diagram is a chart that shows hierarchical data as a set of graded rectangles of various sizes [60,61,62]. Hierarchical diagrams scale best according to available space, so rectangle sizes should be considered relative to each other, not as absolute numbers [61,62,63]. The widest area is shown at the top left of the graph, while the smallest area is shown at the bottom right [61]. Cluster analysis on NVivo QSR is an analysis of data sources or nodes that have a higher level of similarity based on the occurrence and frequency of words that are displayed in groups; analyses of data sources or nodes that have lower levels of similarity based on the occurrence and frequency of words are displayed further [61,62,63]. This coding comparison query feature provides two ways to measure the reliability of qualitative research: measuring the level of agreement among users by calculating the percentage of agreement or measuring the reliability between users through Cohen’s Kappa coefficient. The Cohen’s Kappa coefficient test is carried out because one of the fundamental things that every qualitative researcher needs to know is how to measure the accuracy or consistency of qualitative research [62,63]. The Kappa coefficient is interpreted using guidelines: if a Kappa value is less than 0.40, it means it is not good enough; a Kappa value of 0.40–0.75 means fairly good; and a Kappa value of more than 0.75 means very good [62,63].

3. Result

3.1. Results of Analysis with QSR NVivo Version 12 Plus

Before obtaining the results of this analysis, we performed an analysis of the connectedness of the encoded concepts between nodes and cases using the matrix coding query feature in QSR NVivo version 12 Plus, as shown in Figure 5. In this study, several different responses from informants regarding the product traceability and sustainability of the black soybean supply chain are based on the reality of what they do. Thus, this matrix-coding query is useful.
By making this matrix coding query, we can already see the visualization in the form of a hierarchy diagram (Figure 6). The size indicates the amount of coding on nodes or the number of references to coding.
After producing this hierarchy diagram, we wanted to know the alignment or consistency of the coding. We performed cluster analysis on the NVivo QSR based on word similarity, meaning that the words contained in the selected data sources or nodes were compared. Based on this analysis, it was found that seven pairs of nodes had similarities in the traceability of black soybeans. This result is supported by correlations that fall into the moderate-to-high category. The seven pairs of nodes are black soybeans according to grade, black soybean seeds grown from borrowed Mallika soybean seeds, planting and harvesting black soybeans, and SAC codification on Mallika. This information indicates that (1) the traceability of the black soybeans was adjusted according to the grade; (2) the traceability was known from the Mallika variety seeds lent by the cooperative; (3) the traceability was determined by planting and harvesting black soybeans; and (4) the traceability of black soybeans was carried out by the SAC, with the SAC codification on Mallika provided by the soy sauce industry.
For the analysis of black soybean supply chain sustainability, fourteen pairs of nodes were similar, and this result is supported by moderate-to-moderately high correlations. The correlations indicate that (1) the dimensions of black soybean supply chain sustainability (technological, infrastructural, institutional, environmental, economic, and social) are very influential; (2) there are group meetings that are often held by black soybean farmer groups to inform each other; (3) black soybean productivity was maximized by groups to achieve their desired production levels; (4) the availability of fertilizer for black soybean planting was maintained, as well as the availability of water; (5) there are loans made by cooperatives to black soybean farmer groups to use Mallika seeds; and (6) workers among farmer groups help each other (social service) with pest control.
After we carried out the analysis using the matrix coding query feature, the hierarchical diagram feature, and the cluster analysis feature, we found out the results. We used the coding comparison query feature. This feature measures the reliability of qualitative research in two ways: it measures the degree of agreement among users by calculating the percentage of agreement, or it measures the reliability between users through Cohen’s Kappa coefficient.
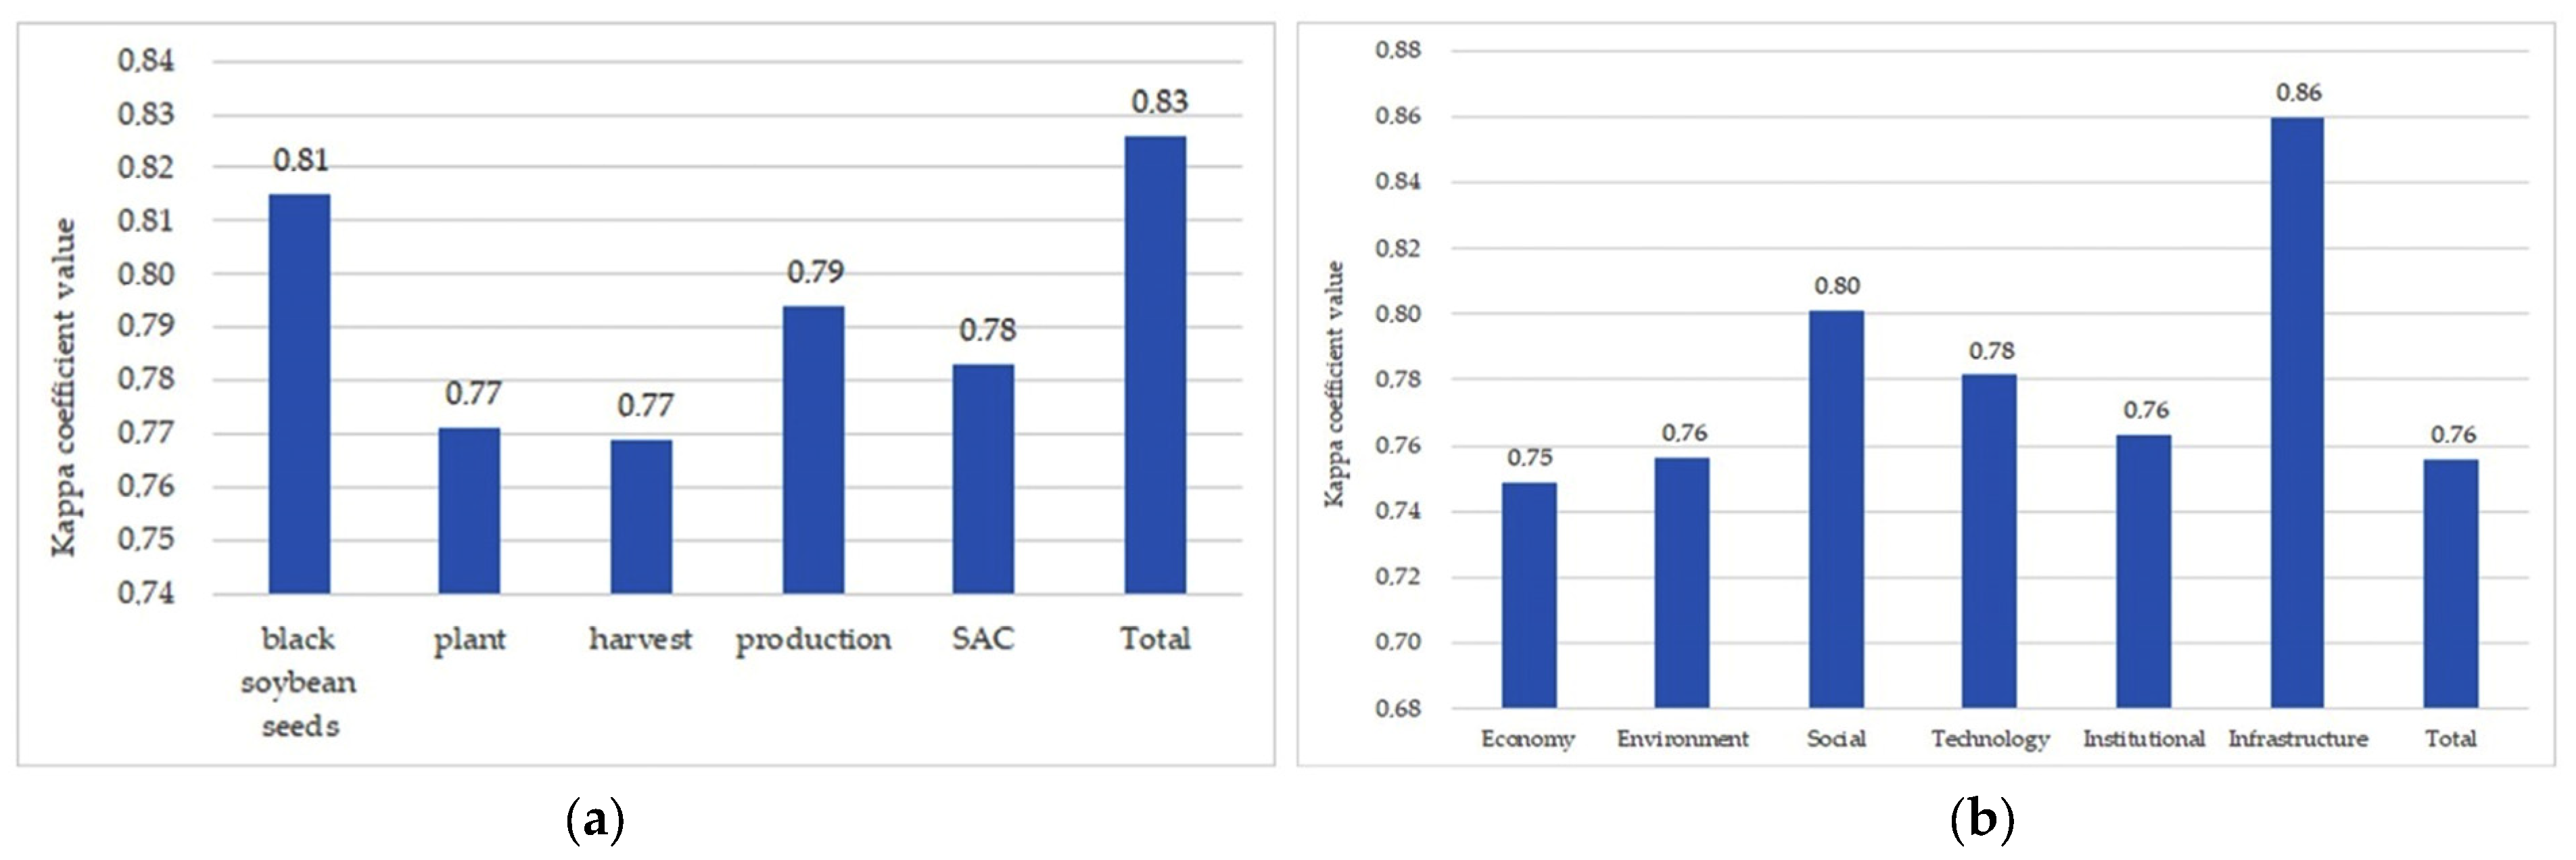
Based on the results of the coding comparison query analysis, the traceability of black soybeans had a total Cohen’s Kappa coefficient value of 0.83, and black soybean supply chain sustainability had a total Cohen’s Kappa coefficient value of 0.76, as shown in Figure 7. Therefore, the results of the analysis of the two codes are interpreted as being in excellent agreement.

3.2. Traceability of Black Soybeans

Traceability is needed for decision-makers to determine the time to plant and harvest soybeans [24]. The type of technology also needs to be mapped from planting to harvest in order to find out what needs to be achieved regarding production and productivity [18]. It is necessary to adopt black soybean cultivation technology to improve planting or harvesting [62]. The practice of adopting seed technology allows for long-term genetic acquisition, thereby achieving improved productivity and coproduction with nutrients [46,48]. The use of seeds in the field needs to be tracked [22] because they directly affect production and productivity [49].
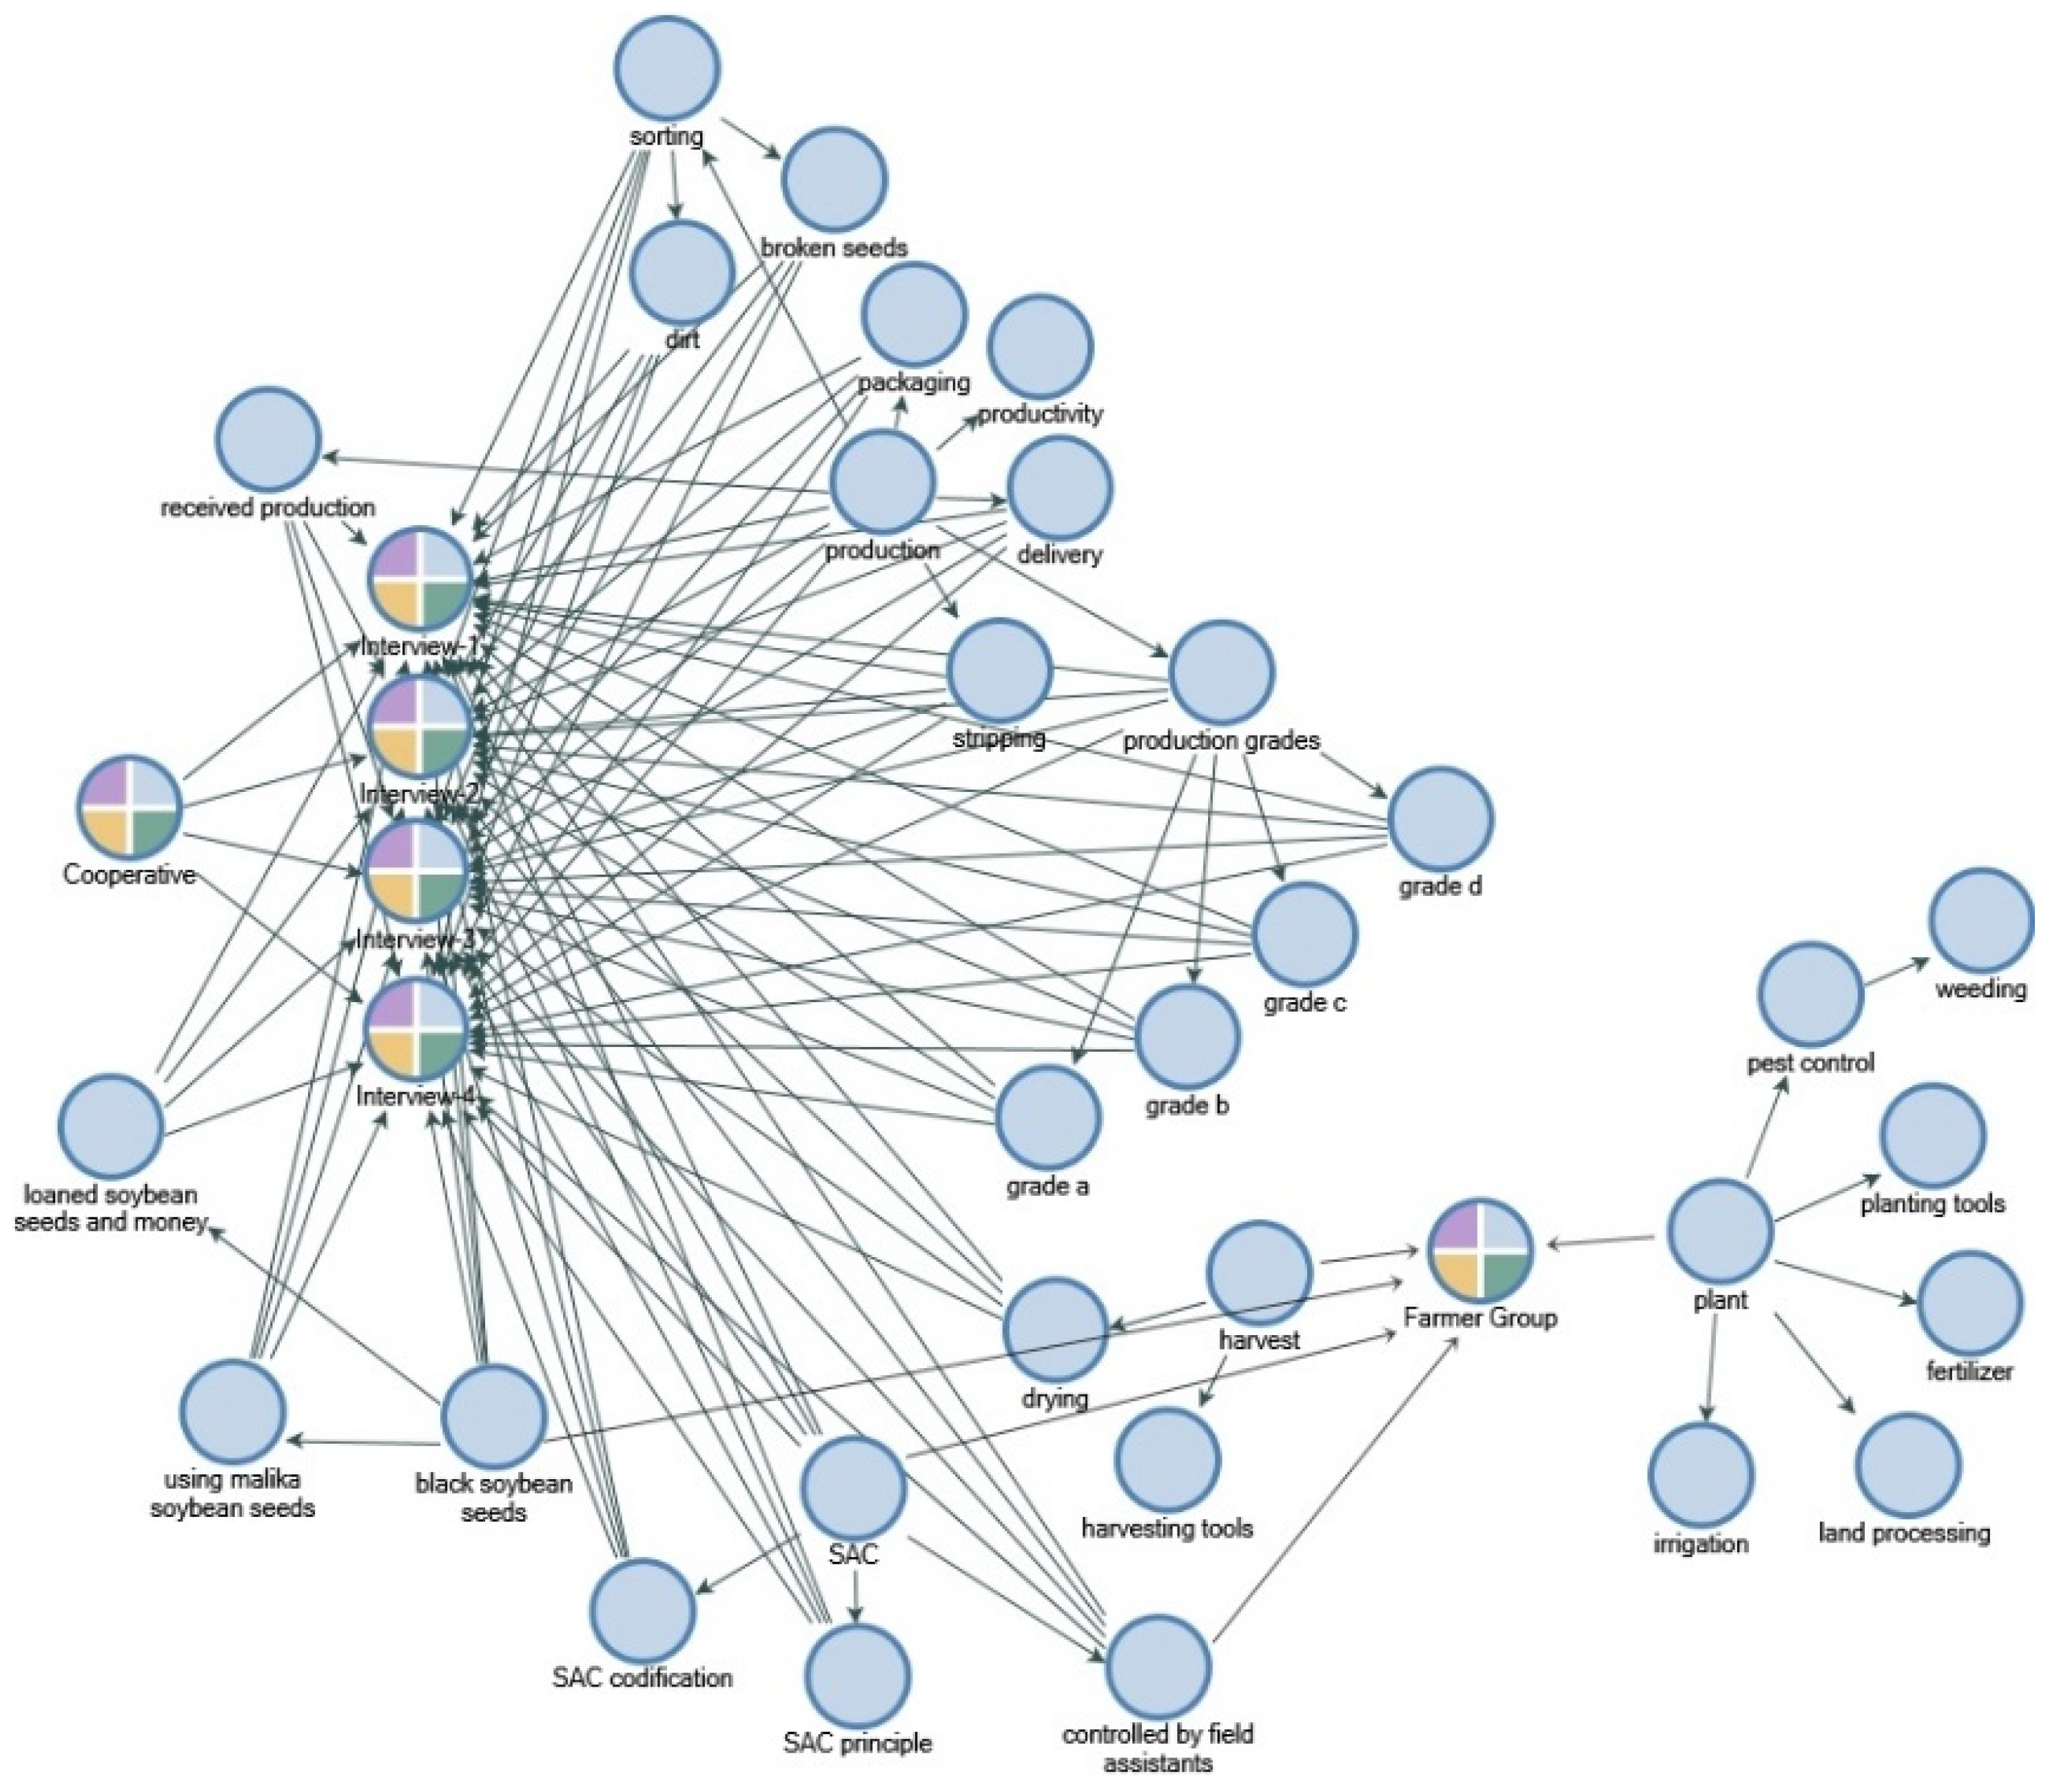
The visualization results of the project map for cooperatives and farmer groups are shown in Figure 8. From this, it is known that the groups who planted black soybeans used Mallika soybean seeds (grade A) that were lent by the cooperative, with a spacing of 35 cm (cm) × 10 cm, 35 cm × 15 cm, 40 cm × 10 cm, or 40 cm × 15 cm, and two Mallika seeds were given per hole, with a planting hole size of ±10–15 cm. Before planting black soybeans, the farmer groups carried out soil processing using hoes because the land was hard and the group members did not have mechanized tools such as hand tractors. On average, Mallika soybean land is rainfed lowland owned by farmer group members, with an average land area of 0.25 hectares (ha). In cultivating this land, members of the farmer groups use family labor.
The average irrigation conditions for Mallika soybeans are those of nontechnical irrigation. Farmer groups irrigate 1–4 times per month, depending on climatic conditions and soil type. There is an irrigation fee that must be paid by each farmer group: on average, IDR 705,574 per month, or specifically, IDR 10,000 per month from each member of the group. This irrigation fee is for electricity costs because a pumping machine is used. From this pump, irrigation is carried out on each farmer group member’s land using a water pump hose that flows to the tertiary network (made by the group itself) or to the land directly.
The fertilization of Mallika soybeans was carried out by the farmer groups twice (during planting and 2 weeks after planting), and the group members only used family labor. The types of fertilizers given by the groups were the fertilizers made by the groups themselves (sugar cane, water used to wash rice, and probiotics) and manure/compost. This manure/compost came from fertilizer collected by the groups themselves (animal manure or organic waste around the groups’ environment) and manure/compost purchased directly. The money for the purchase of manure/compost was money lent by the cooperative and returned at harvest. Fertilizer is an important ingredient in farming systems to improve the quality and quantity of the harvest [63].
To control pests, diseases, and weeds on Mallika soybeans, farmer groups do not use pesticides because they are prohibited by the SAC team from the Netherlands (this team conducts surveillance once a year), and pest problems often arise namely rats. The information conveyed by the SAC team to the farmer groups was that pesticides had been applied to rice plants, so they did not cross the threshold. The farmer groups’ way of controlling rats is through social service; they call it ‘gropyokan’, and plant corn on the outskirts of the Mallika soybean fields. For weed control, weed cleaning is carried out 15, 30, and 55 days (if there is still a lot of grass/weeds) after planting, and members of the farmer group use family labor.
Mallika soybean harvesting is carried out when the plants have fallen off and the pods are yellow/brown and dry. The average harvest starts at around 9 a.m., or when the dew is gone. Harvesting is performed by scything plant stems. Mallika soybeans are harvested by farmer groups from the land, tied with fine twigs/bark, and collected at the edge of the land or put in woven baskets. After that, they are carried on their backs to a cart tied to a motorbike or to a pick-up truck to be taken to the cooperative.
The activities from planting to harvesting Mallika soybeans are carried out by farmer groups and controlled by field assistants according to the SAC document. Mallika soybeans are brought by the groups to the cooperative for weighing. After that, payments are made directly to the groups by calculating the loans of seeds and money that have been given by the cooperative. The cooperative uses tarpaulin to reduce the water content of the soybean harvest.
Mallika soybeans are purchased by the cooperative from farmer groups; after drying, the next stage is cleaning with a blower to separate impurities such as dry stems, dry leaves, gravel, and used soybean pods that were stripped with a power thresher. In this blower machine, a large bucket/sack/tarpaulin is placed to reduce losses. After that, sorting is performed to separate the damaged seeds or dirt; it is carried out manually with an average workforce of young men/women.
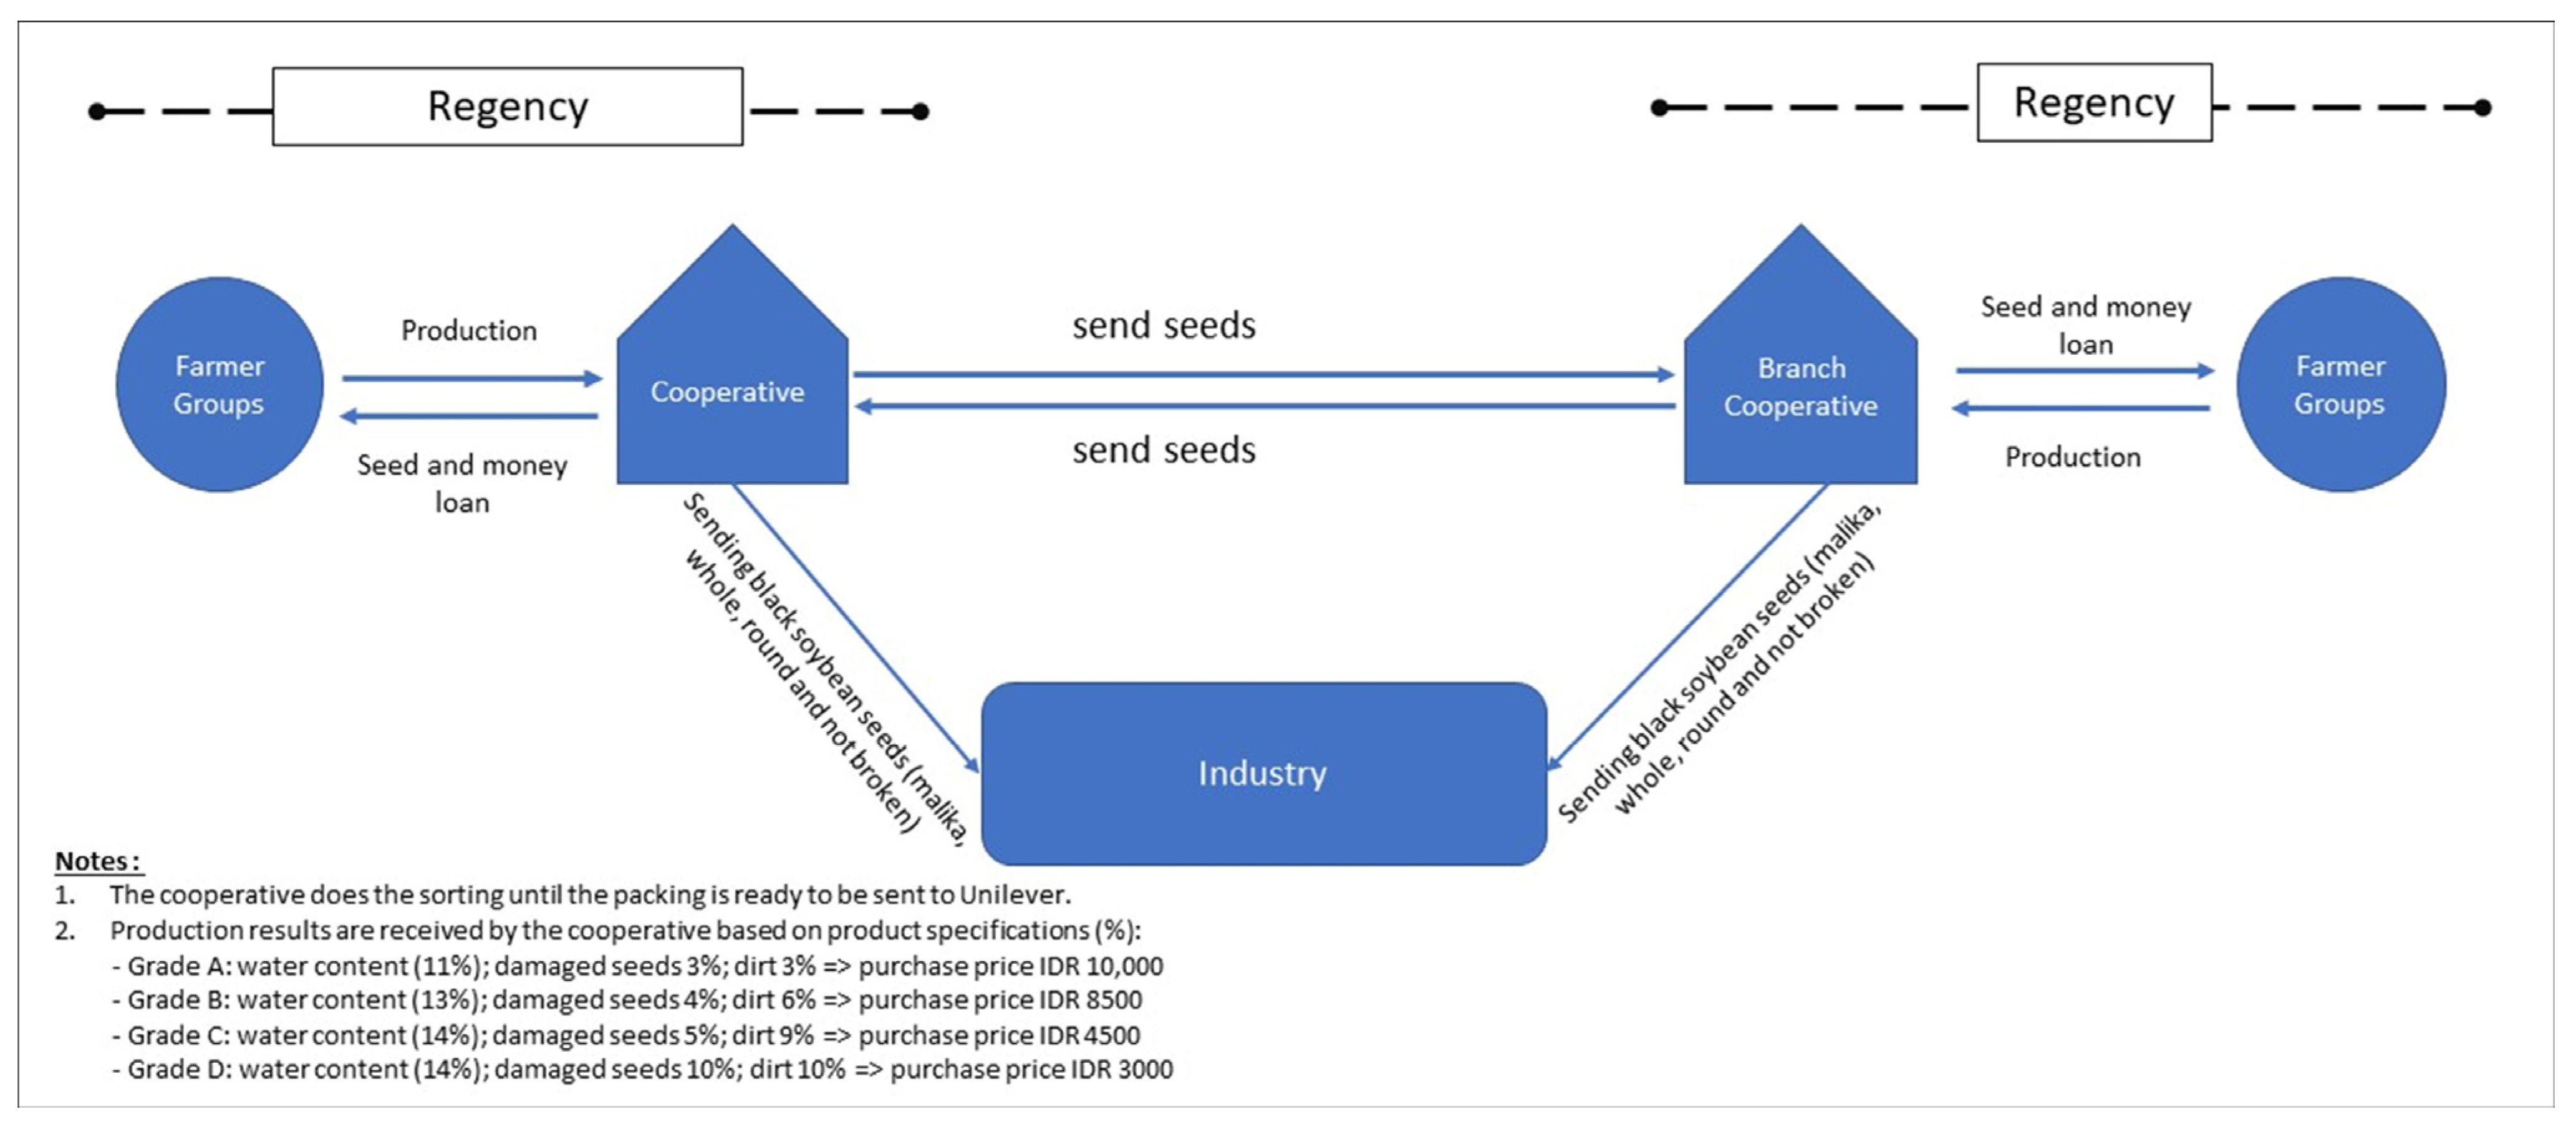
The Mallika soybeans received by the cooperative are based on product specifications, namely grades A, B, C, and D. Grade A products are 11% water, 3% damaged seeds, and 3% dirt, with a purchase price of IDR 10,000, and are lent to farmer groups for use as seed. For grade B, the water content is 13%, damaged seeds are 4%, and dirt is 6%, with a purchase price of IDR 8500. Grade C is 14% water, 5% damaged seeds, and 9% dirt, with a purchase price of IDR 4500. Grade D is 14% water, 10% damaged seeds, and 10% impurities, with a purchase price of IDR 3000. The cooperative writes to farmer groups every year regarding the purchase of Mallika soybeans.
Damaged seeds from sorting are collected to be used as animal feed in the surrounding environment or sold to feed traders or others. The manure is collected and used as fertilizer or feed. The sorted Mallika soybeans are collected in new sacks rather than used ones at the client company’s request. The soybeans received by the company are black, whole/round, and unbroken/damaged Mallika seeds. The cooperative carries out these activities according to the SAC, and they are controlled by field assistants.
Based on this information, the traceability of black soybeans is shown in Figure 9. Cooperatives that have branches, such as Mekar Mas Lendah and Agro Bina Mandiri, will send Mallika black soybeans directly to client companies with the aim of being more effective and efficient in terms of cost, time, and effort since Mallika black soybeans have a dormancy period. Companies demand whole/round, unbroken soybeans. The cooperative sorts through the packaging, using new sacks, and sends them to the companies. In addition to lending Mallika soybean seeds to farmer groups, cooperatives lend money to purchase manure/compost, and the groups return the loan at harvest time in the form of money.

3.3. Sustainability for the Black Soybean Supply Chain

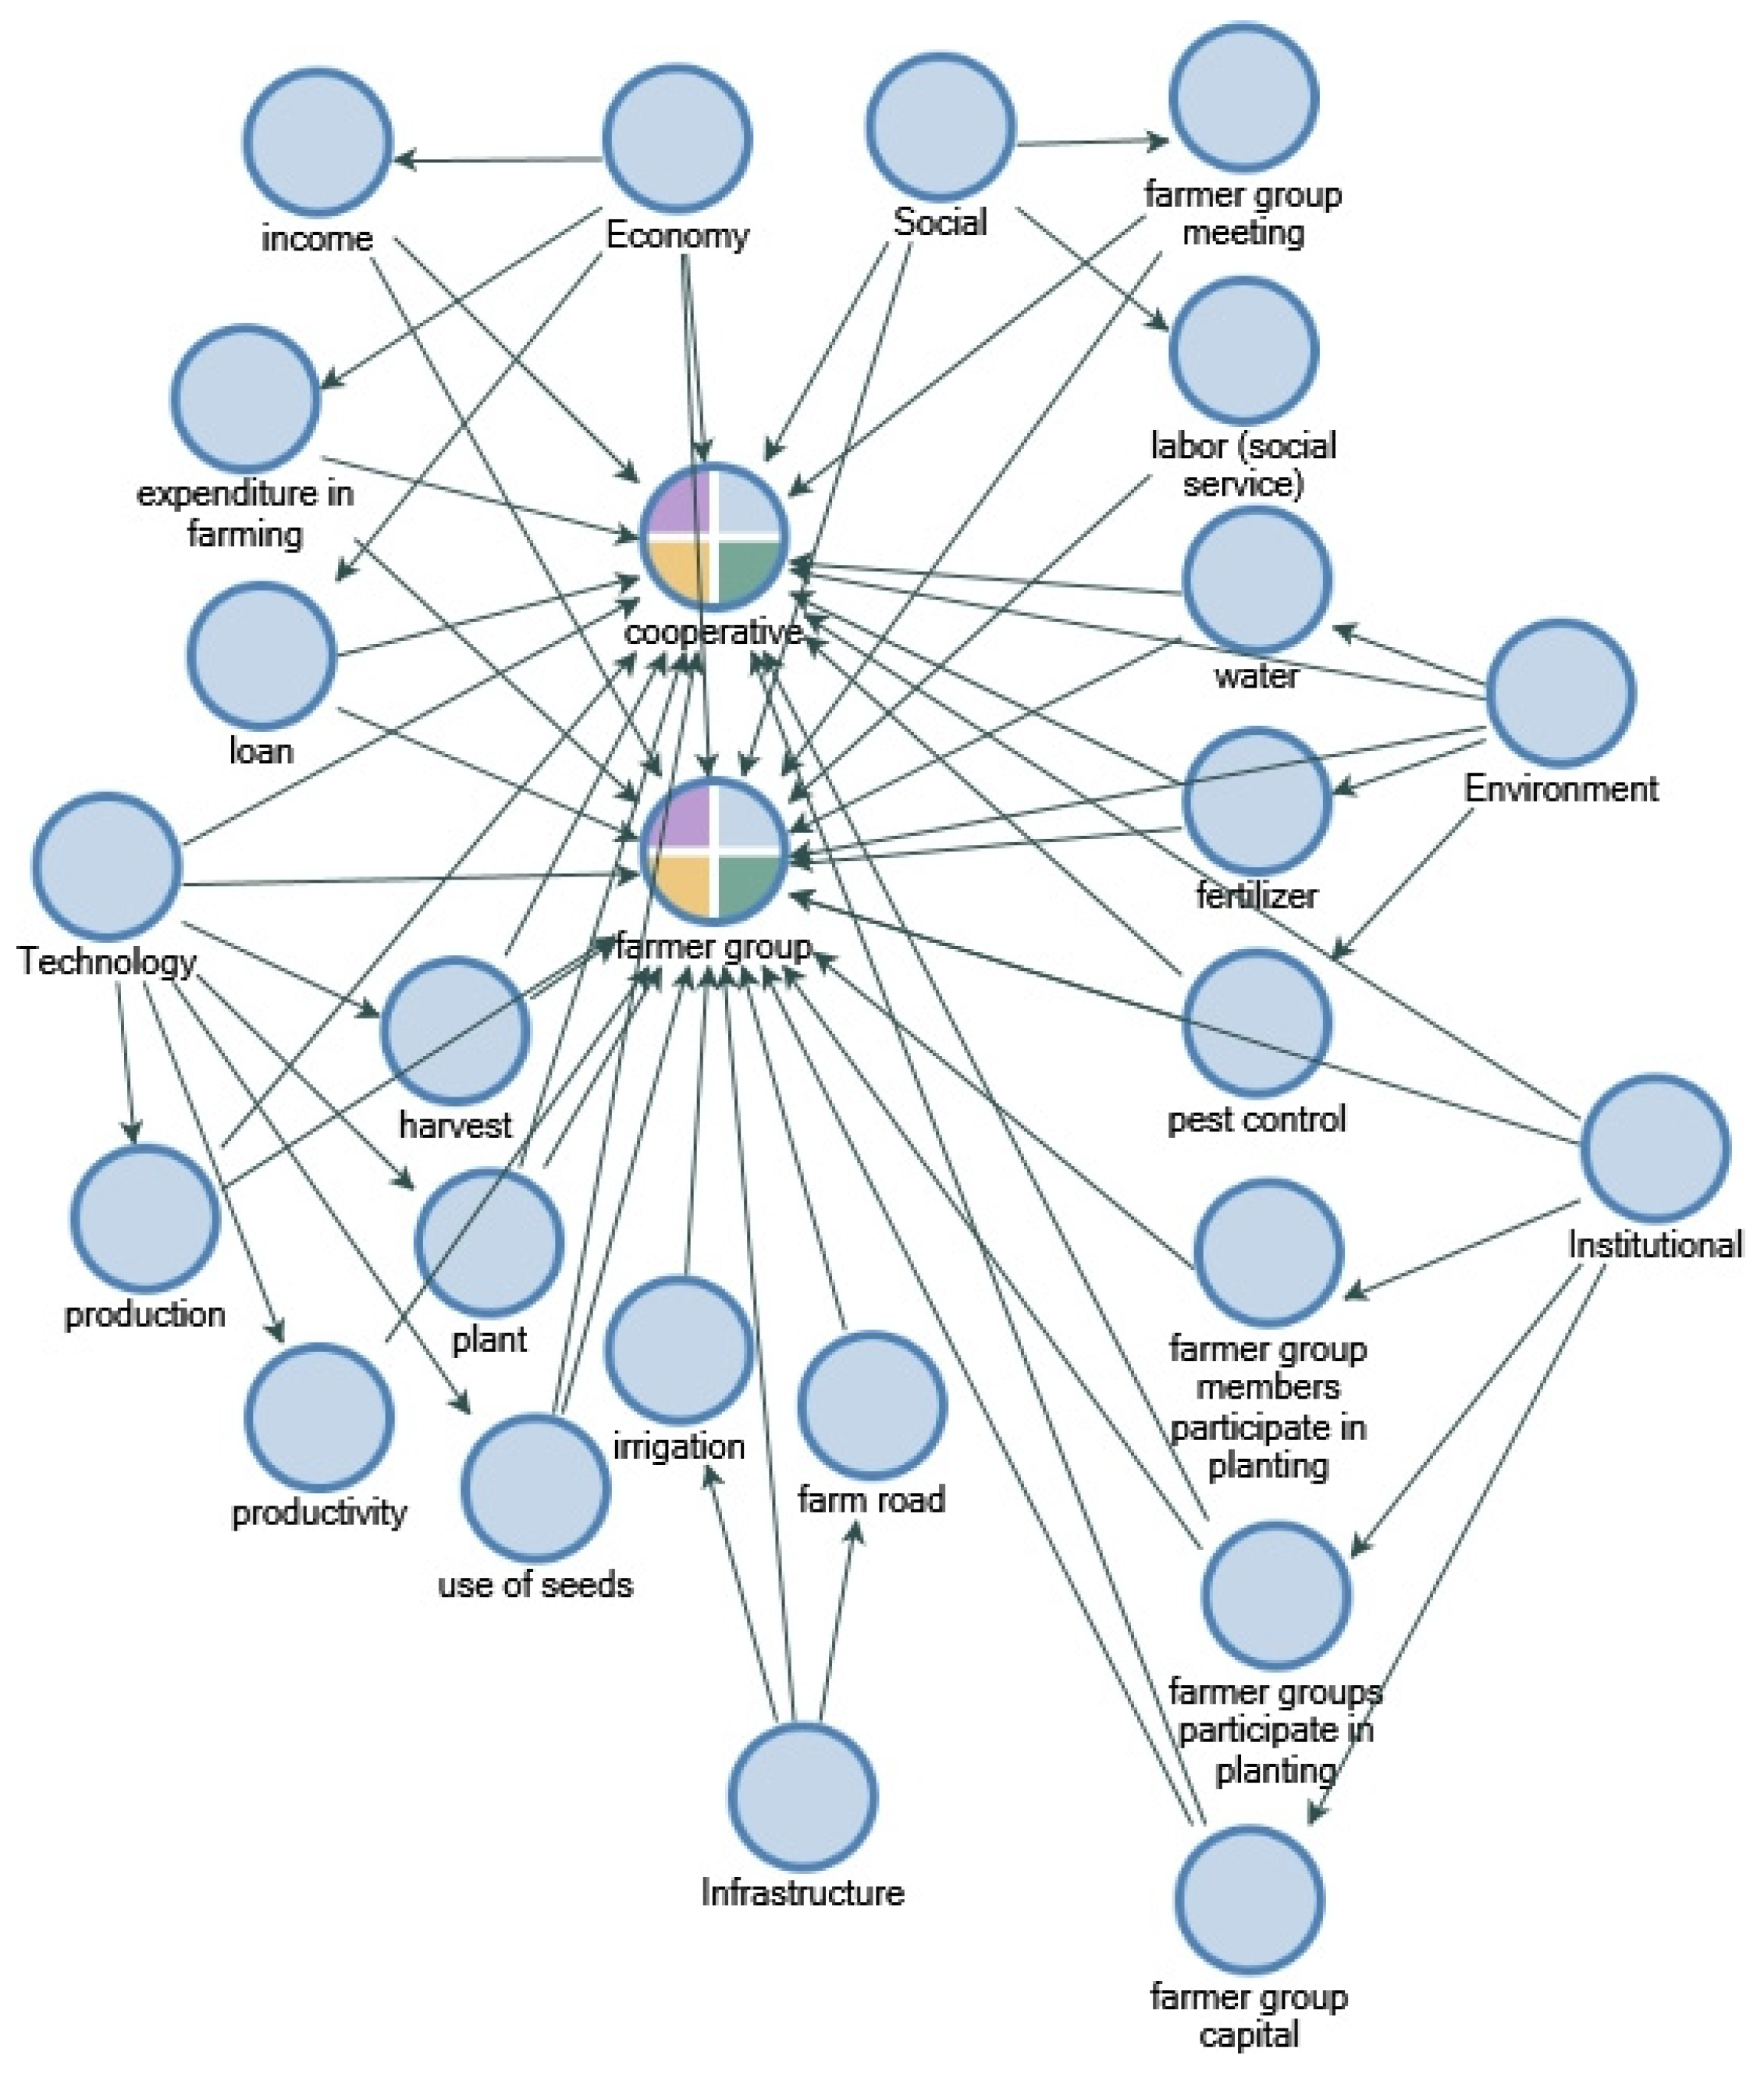
In the black soybean supply chain that occurs between farmer groups and cooperatives, there are interrelated dimensions of sustainability, namely economic, social, environmental, technological, institutional, and infrastructural dimensions (Figure 10). All of these dimensions exist in farmer groups, but in cooperatives, the infrastructural dimension does not exist, as it concerns farming roads and irrigation.
The determinants of the dimensions of supply chain sustainability are in line with the opinion of Anwar et al. [40], who say that traceability in supply chain sustainability can affect these dimensions. The economic, social, environmental, and technological dimensions are among the determinants of an effective, sustainable supply chain [26]. In the institutional dimension, stakeholders make governance arrangements for internal and external agencies seeking to influence supply chain activities [46]. An increase in infrastructural dimensions such as road repairs, product storage areas, irrigation, and ports can determine a better supply chain [46].
In line with another opinion, sustainability that is not followed up will have the risk of affecting the economic, environmental, and social dimensions [64]. Traceability in the economic dimension can reduce losses, increase income, and minimize risks [36,37]. The technological dimension can track products in the supply chain [65]. Institutional governance is an important factor in adjusting consumer perceptions [27]. Institutional developments and regulatory innovations for supply chain sustainability include labeling, codes of conduct, procedures, product information systems, procurement guidelines, and brands [66]. Infrastructural support is needed in the soybean supply chain network [67].
The black soybean supply chain occurs between farmer groups and cooperatives in the economic dimension, i.e., loans and income, while expenditures in farming only occur in farmer groups. The cooperative lends money and seeds to the farmer groups, and later, when the black soybeans are harvested, the groups will return them in the form of money, where the soybeans are given a price of IDR 10,000 per kilogram. The farmer group’s income is obtained after the black soybean harvest is purchased by the cooperative according to production specifications, of which there are four: the production price for grade A—IDR 10,000; grade B—IDR 8500; grade C—IDR 4500; and grade D—IDR 3000.
The economic dimension refers to the economic value of an organization, and the main long-term focus is economic prosperity [68]. An indicator of the economic dimension of sustainability is that there are profits/income derived from an organization’s expenses, whether these expenses are for the purchase of capital raw materials or providing loans to members to improve the quality of organizational services [69]. In implementing sustainable supply chains, the economic dimension takes the form of benefits derived from organizational expenditure and has an impact on the quality of the organization [70].
The soybean supply chain is a complex network for creating economic benefits, and there are expenditure risks in soybean farming [67]. Stakeholders in an organization improve supply chain performance by providing loans [71]. Companies must achieve good performance to obtain maximum profit by minimizing expenses to reduce losses and minimize risk [36,37,72] or by allocating resources efficiently [19,27].
The environmental dimension includes pest control, water availability, and fertilizer availability, as well as waste management and emission control [69]. In pest control, farmer groups carry out ‘gropyokan’ to overcome rat pests. Cooperatives inform and monitor farmer groups’ efforts to control pests to comply with the SAC and minimize negative environmental risks. Groups that work with cooperatives must comply with the rules listed in the SAC, namely the procedures for controlling pests, diseases, and weeds and the application of plant protection products.
For water availability, farmer groups use water pumps because rain is difficult to predict. Irrigation conditions on the land used by black soybean farmer groups are nontechnical. If there is a damaged pump hose, the group repairs/buys it using their capital or by borrowing money from the cooperative. The group’s crops are purchased by the cooperative based on the availability (content) of water in the black soybeans, namely 11% for grade A, 13% for grade B, and 14% for grades C and D. If more than 14% is not accepted by the cooperative, the farmer group must first dry the soybeans. The soybeans are dried in the sun to reduce the water content to 11%, producing good black soybean seeds to send to companies.
With regard to providing fertilizer, farmer groups use manure/compost or self-made fertilizers (‘water used to wash rice’, molasses, and probiotics). For the availability of fertilizer, groups are given loans by the cooperative; these will be returned when the black soybeans are harvested. Fertilizers used by farmer groups must comply with the SAC’s principles. The SAC document mentions integrated fertilization management with codifications F1–F7 and the application of fertilizers, manure, compost, and other plant nutrients with codifications F8–F10. Cooperatives, as suppliers of industrial raw materials, are required to follow the SAC so that they can inform and monitor black soybean farmer groups.
The social dimension includes group meetings and labor (social service). In farmer groups, there are farmer and labor group meetings (social service), but in cooperatives, there are only farmer group meetings. Farmer group meetings among members are held two or three times a month to discuss Mallika black soybean planting. Meetings between cooperatives and farmer groups are held twice a year: at the beginning of planting and during the harvesting of black soybeans. When planting is about to start, an agreement is made with the cooperative regarding the ability to plant and the needs of the farmer groups related to harvest yields and farmer group loan repayments. The alignment of the social dimension with sustainability is realized because there are stakeholder meetings at the upstream level to produce safe and quality raw materials [73].
Meetings are also held when there are field assistants or when the SAC team checks the condition of the farmer group’s land. The meetings are attended by cooperatives, field assistants, extension workers, and farmer groups at the start of planting. Meetings attended by the SAC team, cooperatives, field assistants, extension workers, and farmer groups are held when the SAC team visits Indonesia and monitors the groups’ land, which is usually every two years, but during the COVID-19 pandemic, there was no visit from the SAC team.
Labor (social service) carried out by farmer groups starts with land preparation, followed by planting, fertilizing, weeding, pest control, irrigation, harvesting, stripping, drying, and sorting. The workforce uses family labor. Social service is carried out for pest control, namely ‘gropyokan’ to reduce rat pests or repair irrigation. The company establishes sustainable supply chain governance in the social dimension to encourage the production workforce of upstream actors, namely farmers [73].
The technological dimension occurs in farmer groups; there are planting areas, harvest areas, the use of seeds, productivity, and production, but only productivity is absent in cooperatives. The cooperative instructs the farmer groups to adjust to the SAC principles, which can produce planting areas while maintaining the lowest possible quality of product and input and reducing the adverse effects of soil fertility. The cooperative knows about the planting, so the total area and black soybean harvest schedule that will occur in the future are known. The cooperative lends black soybean seeds—specifically of the Mallika variety, in accordance with requests from within the industry—to farmer groups. Governments and nongovernmental institutions have implemented various technological innovations to improve the sustainability of the soybean supply chain [74], such as planting technology, harvesting, productivity, production, and the use of seeds [18,37,46,48,62].
The institutional dimension occurs in farmer groups; specifically, farmer group members participate in planting and the use of capital, but cooperatives do not. The company’s internal stakeholders in supply chain sustainability make governance arrangements for their agencies and for external stakeholders seeking to influence supply chain activities [46]. Companies provide capital assistance or loans to strengthen institutions for supply chain sustainability [62,69,75]. Cooperatives provide capital loans to farmer groups in the form of Mallika black soybean seeds and money to buy production inputs such as fertilizer. Farmer groups that work with cooperatives have production targets so that the number of groups participating in planting will be known by the cooperative, achieving production and meeting the need for production facilities.
The infrastructural dimension occurs only in farmer groups and includes farm roads and irrigation. The soybean supply chain requires many supporting services, such as infrastructure and processing [67]. Infrastructure is used as an indicator of sustainability that can trigger production growth [69]. The infrastructural dimension of supply chain sustainability includes roads, product storage conditions, irrigation construction, and port repair [47]. Improvements to farm roads and irrigation are carried out by farmer groups using their capital. Farming roads and irrigation canals support Mallika black soybean cultivation by farmer groups. Farmer groups carry out repairs to farm roads and irrigation channels in cooperation with fellow group members. Irrigation routes in the eight research districts are in good condition and include nontechnical irrigation. For farming roads, namely, those in Bantul, Kulonprogo, Nganjuk, Madiun, and Banyuwangi Regencies, the land and roads for transporting cars are not too far away. Meanwhile, Pacitan, Trenggalek, and Blitar regencies need motorbikes to transport crops from the fields.

4. Discussion

Traceability information improves data collection, flow control production, and product quality assurance [40]. Product supply chain traceability is defined as the capability to trace the history of a product, from the production chain, planting, and harvesting to transportation, storage, processing, distribution, and sale [14]. Companies have three objectives that are key for using a food product traceability system: to facilitate traceability for food safety and quality, to differentiate and market foods with subtle or quality attributes that are not detected, and to improve supply chain management [36,62,69,75]. Regattieri, Gamberi, and Manzini [14] describe a traceability system product based on four pillars: product identification, data to track, product routing, and tracking tools.
Local farmers supply raw materials to Unilever [9,10]. To ensure the continuity of this raw material supply, Unilever collaborated with local farmers in the provinces of Yogyakarta, Central Java, and East Java in 2017 and developed SAC-certified Mallika black soybean seeds in 2019 [76,77]. This step was taken as a form of preparing for the supply of products sustainably and maintaining quality because the sustainability of an industry is achieved by managing the supply chain of a product it sells [78,79,80], and the product requires the availability of stable raw materials in quantity and quality to maintain its safety [81,82,83]. The solution offered by Pancino et al. [84] is a vertical agreement (upstream to downstream) and a feasible contractual formula. Horton et al. [85] added that a new approach is needed that integrates aspects from planting and harvesting to processing. Therefore, the continuity of the producer’s business is maintained by increasing the number of consumers who want to buy agricultural products from a sustainable supply chain [86,87].
Unilever has a policy of purchasing black soybean raw materials from local sources and complying with procurement standards set out in the responsible sourcing policy (RSP), good agricultural practice (GAP) guidelines, and the SAC [88]. This SAC has been carried out by Unilever from 2010 until now in order to codify important aspects of sustainability in agriculture and implement them in Unilever’s supply chain. Unilever’s SAC principles are: (1) producing high-yielding plants, maintaining quality, and keeping input resources as low as possible; (2) minimizing adverse effects on soil fertility, water quality, air quality, and biodiversity; (3) optimizing the use of renewable resources and minimizing the use of nonrenewable resources; and (4) encouraging local (farmer) communities to protect and improve welfare and the environment. These SAC principles are the sustainability standards handled by Unilever, as well as the right combination of economic development, environmental protection, and social improvement [88]. SAC 2017, which was published by Unilever, codifies groups as follows: (1) planting and fertilizing management; (2) control of pests, diseases, and weeds; (3) land management; (4) water management; (5) biodiversity and ecosystems; (6) energy and greenhouse gases; (7) waste management; (8) society; (9) animal husbandry; (10) the value chain; (11) continuous improvement; and (12) Unilever’s responsible sourcing policy [88].
Suppliers and farmers are responsible for implementing the SAC in a manner that is consistent with the criteria applied to it. There are three types of SAC criteria: (1) mandatory, meaning that non-compliance with these requirements cannot be accepted by Unilever; (2) expected, meaning that requirements are expected to be complied with and noncompliance can only be accepted for certain requirements, even though in early 2010, the SAC was classified as mandatory to comply; and (3) leading, meaning that it has the potential to become a mandatory requirement (expected) in the future, even though in the initial 2010 SAC, it was classified as expected to comply. In addition, there are also criteria for farmers (code F) and suppliers (code S). Criteria with the keywords “business”, “environment”, and “people” are coded in blue, green, and red, respectively [88].
In the SAC codification of agriculture, there are three groups: (1) supply and fertilization management; (2) control of pests, diseases, and weeds; and (3) land management [80]. There are two subgroups of cultivation and fertilization management, namely (1) integrated fertilization management (codification F1–F7) and (2) the application of fertilizer, manure, compost, and other plant nutrients (codification F8–F10). There are two subgroups of pest, disease, and weed control: (1) pest, disease, and weed control (codification F11–F19); and (2) the application of plant protection products (codification F20–F24). Soil management has no subgroups (codification F25–F35) [88].
Mallika black soybeans, which are raw materials for making soy sauce, are produced in collaboration with cooperatives. Initially, Unilever collaborated with several cooperatives to supply these soybeans, but in 2016, it only collaborated with four cooperatives, namely Mekar Mas Lendah, Agro Bina Mandiri, Bina Usaha, and Sinar Agro Solusi. Each cooperative has a farmer group that always supplies the soybeans. Production of these soybeans in the Bantul and Kulonprogo Regency farmer groups is managed by the Mekar Mas Lendah cooperative in Kulonprogo, through which the soybeans are sent to Unilever. Soybean seeds that are lent to farmer groups are produced in Pacitan Regency, or vice versa. Soybean production in the Trenggalek Regency farmer group is managed by the Agro Bina Mandiri cooperative in Trenggalek, through which the soybeans are sent to Unilever. Soybean seeds that are lent to farmer groups are produced in Blitar Regency, or vice versa. Soybeans in Nganjuk and Madiun Regencies are sent directly to Unilever from the Bina Usaha cooperative in Nganjuk Regency. The supply of soybeans in Banyuwangi Regency is a supporting area of the Bina Usaha cooperative in Nganjuk Regency. In November 2014, Banyuwangi Regency started a Mallika black soybean partnership involving only eight farmers. This partnership continued to develop until March 2016, when Banyuwangi Regency was asked to form and register an independent partnership with Unilever. Finally, Sinar Agro Solusi was formed by applying social enterprise principles. Currently, Sinar Agro Solusi has 10 permanent employees and 16 casual employees, 637 active sorting mothers, and ±1200 Mallika black soybean farmers [89].
The results of this study are also supported by correlations that fall into the moderate-to-high category. The fourteen pairs of nodes are technology with infrastructure (correlation value 0.79), institutions with infrastructure (correlation value 0.77), group meetings with several members (correlation value 0.77), environment and economy (correlation value 0.76), environment with infrastructure (correlation value 0.72), infrastructure with the economy (correlation value 0.70), productivity and production (correlation value 0.68), technology and environment (correlation value 0.67), society and environment (correlation value 0.67), a planted area with the harvested area (correlation value 0.66), technology with institutions (correlation value 0.66), loans with the use of seeds (correlation value 0.56), fertilizer availability with water availability (correlation value 0.54), and labor (social service) with pest control (correlation value 0.53). Hamrouni and Akkari [90] state that if there is no correlation, then the Pearson coefficient is 0. A value of 1 is a perfect correlation; 0.75–0.99 is a very strong correlation; 0.50–0.75 is a strong correlation; 0.25–0.50 is a moderate correlation; and 0.00–0.25 is a very weak correlation.
The correlation information indicates that (1) the dimensions of black soybean supply chain sustainability, namely the technological, infrastructural, institutional, environmental, economic, and social dimensions, are very influential; (2) there are group meetings that are often held by black soybean farmer groups of to inform each other; (3) black soybean productivity is maximized by farmer groups to achieve the desired production, (4) the availability of fertilizer and water for black soybean planting is maintained; (5) there are loans given by cooperatives to black soybean farmer groups to use Mallika seeds; and (6) workers help each other (social service) among black soybean farmer groups for pest control. In addition, it can also be indicated that (1) the tracking of soybean production was adjusted to the grade of the soybeans; (2) the tracking of soybean production was known from the Mallika variety seeds lent by the cooperative; (3) the tracking of black soybean production was known from planting and harvesting black soybeans; and (4) the tracking of black soybean production was carried out by the SAC codification on Mallika provided by Unilever.

5. Conclusions

This study investigates the traceability of black soybeans that are used as raw materials for making soy sauce, with the requirements demanded by the industry of being round/whole, unbroken Mallika black soybeans. The process from planting to harvest is controlled by field assistants and farmer groups, according to the SAC. The cooperative loans black soybean seeds to farmer groups with grade A seed quality. The loan is repaid at harvest time and returned in the form of money, where the price is IDR 10,000/kg.
Product traceability can determine the dimensions of sustainability of the black soybean supply chain by looking at income, farming costs, and loans (the economic dimension); the availability of water, fertilizers, and pest control (the environmental dimension); group meetings and labor (the social dimension); the use of seeds, planted areas, harvested areas, productivity, and production (the technological dimension); the number of farmer groups and members participating in planting, as well as group capital (the institutional dimension); and farming roads and irrigation (the infrastructural dimension).
Based on the correlation value, the sustainability of the black soybean supply chain, which is very influential, starts with the technological, infrastructural, institutional, environmental, economic, and social dimensions.
The implications of the research results for management are that product traceability is necessary to maintain safety, quality, and sustainability. Product traceability requires monitoring and regulatory systems established by the industry and must be followed by all stakeholders, starting with farmers and cooperatives that supply the industry. A good supervisory system places employees from the industry as field assistants. Regulations are made by the industry from the upstream to the downstream level. Thus, this can have an impact on the economic, social, environmental, technological, institutional, and infrastructural dimensions of sustainability.
The limitations of this article are that it does not review the actions of government and consumer stakeholders. Regarding the distribution of seeds and finished products, there are regulations made by the government that can track the safety and quality of products made by the industry, from seeds to finished products. Therefore, the government’s political policies also need to be reviewed in terms of traceability to ensure the sustainability of a product. In addition, government regulations regarding good processing are also regulated to produce safe products. Consumer perceptions are needed regarding food nutrition as a product safety control. This research also has a weakness, namely that the cooperative is a provider of seeds for farmer groups and distributors who send them directly to the industry. The processing and distribution stages need to be detailed based on existing stakeholders’ concerns about product quality and safety issues.

Author Contributions

Conceptualization, S.A.; methodology, S.A., T.P., M.R. and T.I.N.; software, S.A.; validation, T.P., M.R. and T.I.N.; formal analysis, S.A.; investigation, S.A.; resources, S.A.; data curation, S.A.; writing—original draft preparation, S.A.; writing—review and editing, S.A., T.P., M.R. and T.I.N.; visualization, S.A.; supervision, T.P., M.R. and T.I.N.; project administration, S.A.; funding acquisition, S.A. All authors have read and agreed to the published version of the manuscript.

Funding

This research was funded by the Agency for Extension and Development of Agricultural Human Resources, the Ministry of Agriculture of the Republic of Indonesia, and Universitas Padjadjaran through the International Open Access Programs (IOAP).

Institutional Review Board Statement

Ethical institutional review and approval were waived for this study because neither the institution nor the government were involved. In this study, there were no respondents on behalf of an institution or government. Therefore, this research can be validated only with the consent of the respondents. This is also following the regulations of Law Number 14 of 2008 concerning openness of public information (document/UU/14/2008, accessed on 7 August 2023) and Law Number 11 of 2008 Articles 5 and 6 concerning the ratification of agreed information electronically in print media (document/UU/11/2008, accessed on 7 August 2022).

Informed Consent Statement

All subjects gave their informed consent for inclusion before they participated in the study.

Data Availability Statement

Not applicable.

Acknowledgments

We acknowledge support from the Agency for Extension and Development of Agricultural Human Resources through a scholarship fund and a doctoral program for civil servants of the Ministry of Agriculture of the Republic of Indonesia to support this research as part of the doctoral thesis program, and Universitas Padjadjaran through the International Open Access Program (IOAP) in the preparation of this paper.

Conflicts of Interest

The authors declare no conflict of interest.

References

  1. Teuscher, P.; Grüninger, B.; Ferdinand, N. Risk Management in Sustainable Supply Chain Management (SSCM): Lessons Learnt from the Case of GMO-Free Soybeans. Corp. Soc. Responsib. Environ. Manag. 2006, 13, 1–10. [Google Scholar] [CrossRef]
  2. Jia, F.; Peng, S.; Green, J.; Koh, L.; Chen, X. Soybean Supply Chain Management and Sustainability: A Systematic Literature Review. J. Clean. Prod. 2020, 255, 120254. [Google Scholar] [CrossRef]
  3. Oliveira, G.D.L.T.; Schneider, M. The politics of flexing soybeans: China, Brazil, and global agroindustrial restructuring. J. Peasant. Stud. 2015, 43, 167–194. [Google Scholar] [CrossRef]
  4. Fearnside, P.M. Soybean cultivation as a threat to the environment in Brazil. Environ. Conserv. 2001, 28, 23–38. [Google Scholar] [CrossRef]
  5. Ercin, A.E.; Aldaya, M.M.; Hoekstra, A.Y. The water footprint of soy milk and soy burger and equivalent animal products. Ecol. Indic. 2012, 18, 392–402. [Google Scholar] [CrossRef]
  6. Susilowati, I.; Kirana, M. Re-evaluation of value-chain and the strategy to secure soybeans as the main input for Javanese indigenous dish of “Tahu-Tempe-Kecap” (With a pilot project in Central Java Province). Rev. Espac. 2018, 39, 27–31. [Google Scholar]
  7. Wiloso, E.I.; Sinke, P.; Muryanto; Setiawan, A.A.R.; Sari, A.A.; Waluyo, J.; Putri, A.M.H.; Guinee, J. Hotspot identification in the Indonesian tempeh supply chain using life cycle assessment. Int. J. Life Cycle Assess. 2019, 24, 1948–1961. [Google Scholar] [CrossRef]
  8. Ginting, E.; Yulifianti, R.; Mulyana, H.I.; Tarmizi, d. Varietas Unggul Kedelai Hitam Sebagai Bahan Baku Kecap. In Proceedings of the Seminar Agroindustri dan Lokakarya Nasional FKPT—TPI; Trunojoyo University: Madura Regency, Indonesia, 2015; ISBN 978-602-7998-92-6. [Google Scholar]
  9. Sjauw-Koen-Fa, A.R.; Blok, V.; Omta, O.S.W.F. Exploring the applicability of a sustainable smallholder sourcing model in the black soybean case in Java. Int. Food Agribus. Manag. Rev. 2017, 20, 709–728. [Google Scholar] [CrossRef]
  10. Sjauw-Koen-Fa, A.R.; Blok, V.; Omta, O.S.W.F. Exploring the integration of business and CSR perspectives in smallholder souring: Black soybean in Indonesia and tomato in India. J. Agribus. Dev. Emerg. Econ. 2018, 8, 656–677. [Google Scholar] [CrossRef]
  11. Storøy, J.; Thakur, M.; Olsen, P. The TraceFood Framework—Principles and guidelines for implementing traceability in food value chains. J. Food Eng. 2013, 115, 41–48. [Google Scholar] [CrossRef]
  12. Wang, X.; Wang, C.; Wang, X.; Zhuang, W. Study for organic soybean production information traceability system based on the web. In Computer and Computing Technologies in Agriculture IV, CCTA 2010; IFIP Advances in Information and Communication Technology; Li, D., Liu, Y., Chen, Y., Eds.; Springer: Berlin/Heidelberg, Germany, 2011; Volume 345, pp. 567–572. [Google Scholar]
  13. Folinas, D.; Manikas, I.; Manos, B. Traceability data management for food chains. Br. Food J. 2006, 108, 622–633. [Google Scholar] [CrossRef]
  14. Regattieri, A.; Gamberi, M.; Manzini, R. Traceability of food products: General framework and experimental evidence. J. Food Eng. 2007, 81, 347–356. [Google Scholar] [CrossRef]
  15. Wang, X.; Li, D.; Li, L. Adding value of food traceability to the business: A supply chain management approach. Int. J. Serv. Oper. Inform. 2009, 4, 232–257. [Google Scholar] [CrossRef]
  16. Thakur, M.; Donnelly, K.A.-M. Modeling traceability information in soybean value chains. J. Food Eng. 2010, 99, 98–105. [Google Scholar] [CrossRef]
  17. Aung, M.M.; Chang, Y.S. Traceability in a food supply chain: Safety and quality perspectives. Food Control 2014, 39, 172–184. [Google Scholar] [CrossRef]
  18. Godar, J.; Persson, U.M.; Tizado, E.J.; Meyfroidt, P. Towards more accurate and policy relevant footprint analyses: Tracing fine-scale socio-environmental impacts of production to consumption. Ecol. Econ. 2015, 112, 25–35. [Google Scholar] [CrossRef]
  19. Morales, V.; Vendrametto, O.; Rois, J.G.M.D.; Toloi, R.G.; Canuto, S.A. Information Systems in the Soybean Brazilian Supply Chain: An Analysis from the Trading Companies Perspective. In Proceedings of the ILS Conference, Bordeaux, France, 1–4 June 2016; pp. 1–7. [Google Scholar]
  20. Gardner, T.A.; Benzie, M.; Börner, J.; Dawkins, E.; Fick, S.; Garrett, R.; Godar, J.; Grimard, A.; Lake, S.; Larsen, R.K.; et al. Transparency and sustainability in global commodity supply chains. World Dev. 2018, 121, 163–177. [Google Scholar] [CrossRef]
  21. Mao, D.; Hao, Z.; Wang, F.; Li, H. Innovative Blockchain-Based Approach for Sustainable and Credible Environment in Food Trade: A Case Study in Shandong Province, China. Sustainability 2018, 10, 3149. [Google Scholar] [CrossRef]
  22. Salah, K.; Nizamuddin, N.; Jayaraman, R.; Omar, M. Blockchain-Based Soybean Traceability in Agricultural Supply Chain. IEEE Access 2019, 7, 73295–73305. [Google Scholar] [CrossRef]
  23. Creydt, M.; Fischer, M. Blockchain and more-Algorithm driven food traceability. Food Control 2019, 105, 45–51. [Google Scholar] [CrossRef]
  24. Haleem, A.; Khan, S.; Khan, M.I. Traceability implementation in food supply chain: A grey-DEMATEL approach. Inf. Process. Agric. 2019, 6, 335–348. [Google Scholar] [CrossRef]
  25. You, N.; Dong, J. Examining earliest identifiable timing of crops using all available Sentinel 1/2 imagery and Google Earth Engine. ISPRS J. Photogramm. Remote Sens. 2020, 161, 109–123. [Google Scholar] [CrossRef]
  26. Demestichas, K.; Peppes, N.; Alexakis, T.; Adamopoulu, E. Blockchain in Agriculture Traceability Systems: A Review. Appl. Sci. 2020, 10, 4113. [Google Scholar] [CrossRef]
  27. Paliwal, V.; Chandra, S.; Sharma, S. Blockchain Technology for Sustainable Supply Chain Management: A Systematic Literature Review and a Classification Framework. Sustainability 2020, 12, 7638. [Google Scholar] [CrossRef]
  28. Sanjaya, S.; Perdana, T. Logistics system model development on supply chain management of tomato commodities for structured market. Procedia Manuf. 2015, 4, 513–520. [Google Scholar] [CrossRef]
  29. Utami, H.N.; Sadeli, A.H.; Perdana, T. Customer Value Creation of Fresh Tomatoes Through Branding and Packaging as Customer Perceived Quality. J. ISSAAS 2016, 22, 123–136. [Google Scholar]
  30. Li, L.; Li, T. Traceability model based on improved witness mechanism. CAAI Trans. Intell. Technol. 2022, 7, 331–339. [Google Scholar] [CrossRef]
  31. Verma, R.; Kumari, A.; Anand, A.; Yadavalli, V.S.S. Revisiting Shift Cipher Technique for Amplified Data Security. J. Comput. Cogn. Eng. 2022, 1–7. [Google Scholar] [CrossRef]
  32. Agrawal, D.; Minocha, S.; Namasudra, S.; Gandomi, A.H. A robust drug recall supply chain management system using hyperledger blockchain ecosystem. Comput. Biol. Med. 2022, 140, 105100. [Google Scholar] [CrossRef]
  33. Gutub, A. Boosting image watermarking authenticity spreading secrecy from counting-based secret-sharing. CAAI Trans. Intell. Technol. 2023, 8, 440–452. [Google Scholar] [CrossRef]
  34. Namasudra, S.; Nath, S.; Majumder, A. Profile based access control model in cloud computing environment. In Proceedings of the International Conference on Green Computing Communication and Electrical Engineering (ICGCCEE), Coimbatore, India, 6–8 March 2014; pp. 1–5. [Google Scholar]
  35. Das, S.; Namasudra, S. Multiauthority CP-ABE-based Access Control Model for IoT-enabled Healthcare Infrastructure. IEEE Trans. Ind. Inform. 2023, 19, 821–829. [Google Scholar] [CrossRef]
  36. Zhang, M.; Fan, Y.; Chen, C.; Cao, J.; Pu, H. Consumer perception, mandatory labeling, and traceability of GM soybean oil: Evidence from Chinese urban consumers. GM Crops Food 2021, 12, 36–46. [Google Scholar] [CrossRef]
  37. Medina, G.; Thomé, K. Transparency in Global Agribusiness: Transforming Brazil’s Soybean Supply Chain Based on Companies’ Accountability. Logistics 2021, 5, 58. [Google Scholar] [CrossRef]
  38. Nurgazina, J.; Pakdeetrakulwong, U.; Moser, T.; Reiner, G. Distributed Ledger Technology Applications in Food Supply Chains: A Review of Challenges and Future Research Directions. Sustainability 2021, 13, 4206. [Google Scholar] [CrossRef]
  39. Dasaklis, T.K.; Voutsinas, T.G.; Tsoulfas, G.T.; Casino, F.A. A Systematic Literature Review of Blockchain-Enabled Supply Chain Traceability Implementations. Sustainability 2022, 14, 2439. [Google Scholar] [CrossRef]
  40. Anwar, S.; Perdana, T.; Rachmadi, M.; Noor, T.I. Traceability Information Model for Sustainability of Black Soybean Supply Chain: A Systematic Literature Review. Sustainability 2022, 14, 9498. [Google Scholar] [CrossRef]
  41. Moe, T. Perspectives on traceability in food manufacture. Trend Food Sci. Technol. 1998, 9, 211–214. [Google Scholar] [CrossRef]
  42. Kurniawan, M.; Pramono, D.; Amalia, F. Design of a website-based traceability information system on subsidized fertilizer supply chain. In Proceedings of the IOP Conference Series: Earth and Environmental Science, Malang, Indonesia, 6–7 July 2021; Volume 924, p. 012050. [Google Scholar]
  43. Hinkes, C.; Peter, G. Traceability matters: A conceptual framework for deforestation-free supply chains applied to soy certification. Sustain. Account. Manag. Policy J. 2020, 11, 1159–1187. [Google Scholar] [CrossRef]
  44. Ding, Q.; Gao, S.; Zhu, J.; Yuan, C. Permissioned Blockchain-Based Double-Layer Framework for Product Traceability System. IEEE Access 2020, 8, 6209–6225. [Google Scholar] [CrossRef]
  45. Duan, Y.; Miao, M.; Wang, R.; Fu, Z.; Xu, M. A framework for the successful implementation of food traceability systems in China. Inf. Soc. 2017, 33, 226–242. [Google Scholar] [CrossRef]
  46. Ekawati, R.; Arkeman, Y.; Suprihatin, S.; Sunarti, T.C. Proposed Design of White Sugar Industrial Supply Chain System based on Blockchain Technology. Int. J. Adv. Comput. Sci. Appl. 2021, 12, 459–465. [Google Scholar] [CrossRef]
  47. Ng, H.; Ker, A.P. On the Changing Nature of Canadian Crop Yield Distributions. J. Agric. Resour. Econ. 2021, 46, 101–125. [Google Scholar]
  48. Monteiro, E.S.; Righi, R.D.R.; Barbosa, J.L.V.; Alberti, A.M. APTM: A Model for Pervasive Traceability of Agrochemicals. Appl. Sci. 2021, 11, 8149. [Google Scholar] [CrossRef]
  49. Anders, S.; Cowling, W.; Pareek, A.; Gupta, K.J.; Singla-Pareek, S.L.; Foyer, C.H. Gaining Acceptance of Novel Plant Breeding Technologies. Trends Plant Sci. 2021, 26, 575–587. [Google Scholar] [CrossRef]
  50. Barma, M.; Modibbo, U.M. Multiobjective Mathematical Optimization Model for Municipal Solid Waste Management with Economic Analysis of Reuse/Recycling Recovered Waste Materials. J. Comput. Cogn. Eng. 2022, 1, 122–137. [Google Scholar] [CrossRef]
  51. Pranto, T.H.; Noman, A.A.; Mahmud, A.; Haque, A.B. Blockchain and smart contract for IoT enabled smart agriculture. PeerJ Comput. Sci. 2021, 7, e407. [Google Scholar] [CrossRef]
  52. Hizbi, M.S.; Ghulamahdi, M. Pertumbuhan dan Produksi Kedelai Hitam dengan Pemberian Jenis Biomassa dan Dosis Pemupukan Kalsium pada Budidaya Jenuh Air di Lahan Pasang Surut. Bul. Agrohorti 2019, 7, 153–161. [Google Scholar] [CrossRef]
  53. Sampurna, A.; Tandian, M.; Huang, V.; Simanjuntak, R.F.; Marta, R.F. Implementasi Total Branding Dalam Perspektif Semiotika Pemasaran. J. Strateg. Commun. 2020, 10, 59–73. [Google Scholar] [CrossRef]
  54. Fitry, N.; Herdiansah, D.; Hardiyanto, T. Analisis Nilai Tambah Agroindustri Kecap (Studi Kasus pada Pengusaha Kecap Cap Jago di Desa Cibenda Kecamatan Parigi Kabupaten Pangandaran). J. Ilm. Mhs. Agroinfo Galuh 2017, 4, 352–359. [Google Scholar]
  55. Badan Pusat Statistik. Analisis Profil Penduduk Indonesia: Mendeskripsikan Peran Penduduk dalam Pembangunan; Badan Pusat Statistik: Jakarta, Indonesia, 2022. [Google Scholar]
  56. Rungkat, J.S.; Kindangen, P.; Walewangko, E.N. Pengaruh Pendidikan, Jumlah Anggota Keluarga dan Pengalaman Kerja Terhadap Pendapatan Rumah Tangga di Kabupaten Minahasa. J. Pembang. Ekon. Dan. Keuang. Drh. 2020, 21, 1–15. [Google Scholar]
  57. Falo, M.; Nubatonis, A. Partisipasi Anggota Kelompok Tani dalam Berusahatani Bawang Putih di Desa Sallu Kecamatan Miomaffo Barat Kabupaten Timor Tengah Utara. Agrimor J. Agribisnis Lahan Kering 2017, 2, 17–22. [Google Scholar] [CrossRef]
  58. Bandur, A. Penelitian Kualitatif: Studi Multi-Displin Keilmuan Dengan NVivo 12 Plus; Mitra Wacana Media: Jawa, Indonesia, 2019. [Google Scholar]
  59. Spartano, S.; Grasso, S. Consumers’ Perspectives on Eggs from Insect-Fed Hens: A UK Focus Group Study. Foods 2021, 10, 420. [Google Scholar] [CrossRef] [PubMed]
  60. Sohel, M.S.; Shi, G.; Zaman, N.T.; Hossain, B.; Halimuzzaman, M.; Akintunde, T.Y.; Liu, H. Understanding the Food Insecurity and Coping Strategies of Indigenous Households during COVID-19 Crisis in Chittagong Hill Tracts, Bangladesh: A Qualitative Study. Foods 2022, 11, 3103. [Google Scholar] [CrossRef] [PubMed]
  61. Bazeley, P.; Jackson, K. Qualitative Data Analysis with Nvivo; Sage Publications: Los Angeles, CA, USA, 2013. [Google Scholar]
  62. Andajani, W.; Sidhi, E.Y. Efisiensi Usahatani Kedelai Hitam melalui Pola Kemitraan dengan Koperasi (Studi Kasus di Desa Sumberagung Kecamatan Gondang Kabupaten Nganjuk). J. Agrinika 2019, 3, 120–133. [Google Scholar] [CrossRef]
  63. Perdana, T.; Renaldy, E.; Utami, H.N.; Sadeli, A.H.; Heryanto, M.A.; Ginanjar, T.; Ajeng, S.N.P.; Hermiatin, F.R.; Sanjaya, S. Farmers Behavior on Using Fertilizer in West Java. AIP Conf. Proc. 2018, 1927, 030011. [Google Scholar]
  64. Bashiri, M.; Tjahjono, B.; Lazell, J.; Ferreira, J.; Perdana, T. The Dynamics of Sustainability Risks in the Global Coffee Supply Chain: A Case of Indonesia–UK. Sustainability 2021, 13, 589. [Google Scholar] [CrossRef]
  65. Gayialis, S.P.; Kechagias, E.P.; Papadopoulos, G.A.; Masouras, D. A Review and Classification Framework of Traceability Approaches for Identifying Product Supply Chain Counterfeiting. Sustainability 2022, 14, 6666. [Google Scholar] [CrossRef]
  66. Boström, M.; Jönsson, A.M.; Lockie, S.; Mol, A.P.; Oosterveer, P. Sustainable and responsible supply chain governance: Challenges and opportunities. J. Clean. Prod. 2015, 107, 1–7. [Google Scholar] [CrossRef]
  67. Garrett, R.D.; Lambin, E.F.; Naylor, R.L. The new economic geography of land use change: Supply chain configurations and land use in the Brazilian Amazon. Land. Use Policy 2013, 34, 265–275. [Google Scholar] [CrossRef]
  68. Delai, I.; Takahashi, S. Sustainability measurement system: A reference model proposal. Soc. Responsib. J. 2011, 7, 438–471. [Google Scholar] [CrossRef]
  69. Allaoui, H.; Guo, Y.; Sarkis, J. Decision support for collaboration planning in sustainable supply chains. J. Clean. Prod. 2019, 229, 761–774. [Google Scholar] [CrossRef]
  70. Jia, F.; Zuluaga-Cardona, L.; Bailey, A.; Rueda, X. Sustainable supply chain management in developing countries: An analysis of the literature. J. Clean. Prod. 2018, 189, 263–278. [Google Scholar] [CrossRef]
  71. Hossan Chowdhury, M.M.; Quaddus, M.A. Supply chain sustainability practices and governance for mitigating sustainability risk and improving market performance: A Dynamic capability Perspective. J. Clean. Prod. 2020, 278, 123521. [Google Scholar] [CrossRef]
  72. Hong, J.; Guo, P.; Chen, M.; Li, Y. The adoption of sustainable supply chain management and the role of organisational culture: A Chinese perspective. Int. J. Logist. Res. Appl. 2020, 25, 52–76. [Google Scholar] [CrossRef]
  73. Humphrey, J.; Schmitz, H. How does insertion in global value chains affect upgrading in industrial clusters? Reg. Stud. 2002, 36, 1017–1027. [Google Scholar] [CrossRef]
  74. Newton, P.; Agrawal, A.; Wollenberg, L. Enhancing the sustainability of commodity supply chains in tropical forest and agricultural landscapes. Glob. Environ. Chang. 2013, 23, 1761–1772. [Google Scholar] [CrossRef]
  75. Seuring, S.; Müller, M. From a literature review to a conceptual framework for sustainable supply chain management. J. Clean. Prod. 2008, 16, 1699–1710. [Google Scholar] [CrossRef]
  76. Unilever. Building a Sustainable Future Every Day; PT Unilever Indonesia Tbk: Jakarta, Indonesia, 2017. [Google Scholar]
  77. Unilever. Sustainability Report: Purpose-Led, Future-Fit; PT Unilever Indonesia Tbk: Jakarta, Indonesia, 2019. [Google Scholar]
  78. Fleiss, J.; Levin, B.; Paik, M. Statistical Methods for Rates and Proportions; Wiley: New York, NY, USA, 2003. [Google Scholar]
  79. QSR International. NVivo 12 for Windows Help; QSR International: Burlington, MA, USA, 2022. [Google Scholar]
  80. Rajesh, R. Sustainable supply chains in the Indian context: An integrative decision-making model. Technol. Soc. 2020, 61, 101230. [Google Scholar] [CrossRef]
  81. Flores, H.; Villalobos, J.R. A stochastic planning framework for the discovery of complementary, agricultural systems. Eur. J. Oper. Res. 2020, 280, 707–729. [Google Scholar] [CrossRef]
  82. Saberi, S.; Kouhizadeh, M.; Sarkis, J. Blockchain technology: A panacea or pariah for resources conservation and recycling? Resour. Conserv. Recycl. 2018, 130, 80–81. [Google Scholar] [CrossRef]
  83. He, L.; Wu, Z.; Xiang, W.; Goh, M.; Xu, Z.; Song, W.; Ming, X.; Wu, X. A novel Kano-QFD-DEMATEL approach to optimise the risk resilience solution for sustainable supply chain. Int. J. Prod. Res. 2020, 59, 1714–1735. [Google Scholar] [CrossRef]
  84. Pancino, B.; Blasi, E.; Rappoldt, A.; Pascucci, S.; Ruini, L.; Ronchi, C. Partnering for sustainability in agri-food supply chains: The case of Barilla Sustainable Farming in the Po Valley. Agric. Food Econ. 2019, 7, 13. [Google Scholar] [CrossRef]
  85. Horton, P.; Bruce, R.; Reynolds, C.; Milligan, G. Food Chain Inefficiency (FCI): Accounting Conversion Efficiencies Across Entire Food Supply Chains to Re-define Food Loss and Waste. Front. Sustain. Food Syst. 2019, 3, 79. [Google Scholar] [CrossRef]
  86. Sadeli, A.H.; Perdana, T.; Deliana, Y.; Onggo, B.S. Consumers’ purchase behavior in short food supply chains using social commerce in Indonesia. J. Clean. Prod. 2022, 2023, 135812. [Google Scholar] [CrossRef]
  87. Perdana, T.; Onggo, B.S.; Sadeli, A.H.; Chaerani, D.; Achmad, A.L.H.; Hermiatin, F.R.; Gong, Y. Food supply chain management in disaster events: A systematic literature review. Inter. J. Disaster Risk Reduct. 2022, 79, 103183. [Google Scholar] [CrossRef]
  88. Unilever. Sustainable Agriculture Code 2017; PT Unilever Indonesia Tbk: Jakarta, Indonesia, 2017. [Google Scholar]
  89. Unilever. Transformasi Untuk Masa Depan Berkelanjutan; PT Unilever Indonesia Tbk: Jakarta, Indonesia, 2018. [Google Scholar]
  90. Hamrouni, A.D.; Akkari, I. The Entrepreneurial Failure: Exploring Links between the Main Causes of Failure and the Company life Cycle Qualitative Analysis using NVivo 7 Software. Int. J. Bus. Soc. Sci. 2012, 3, 4. [Google Scholar]
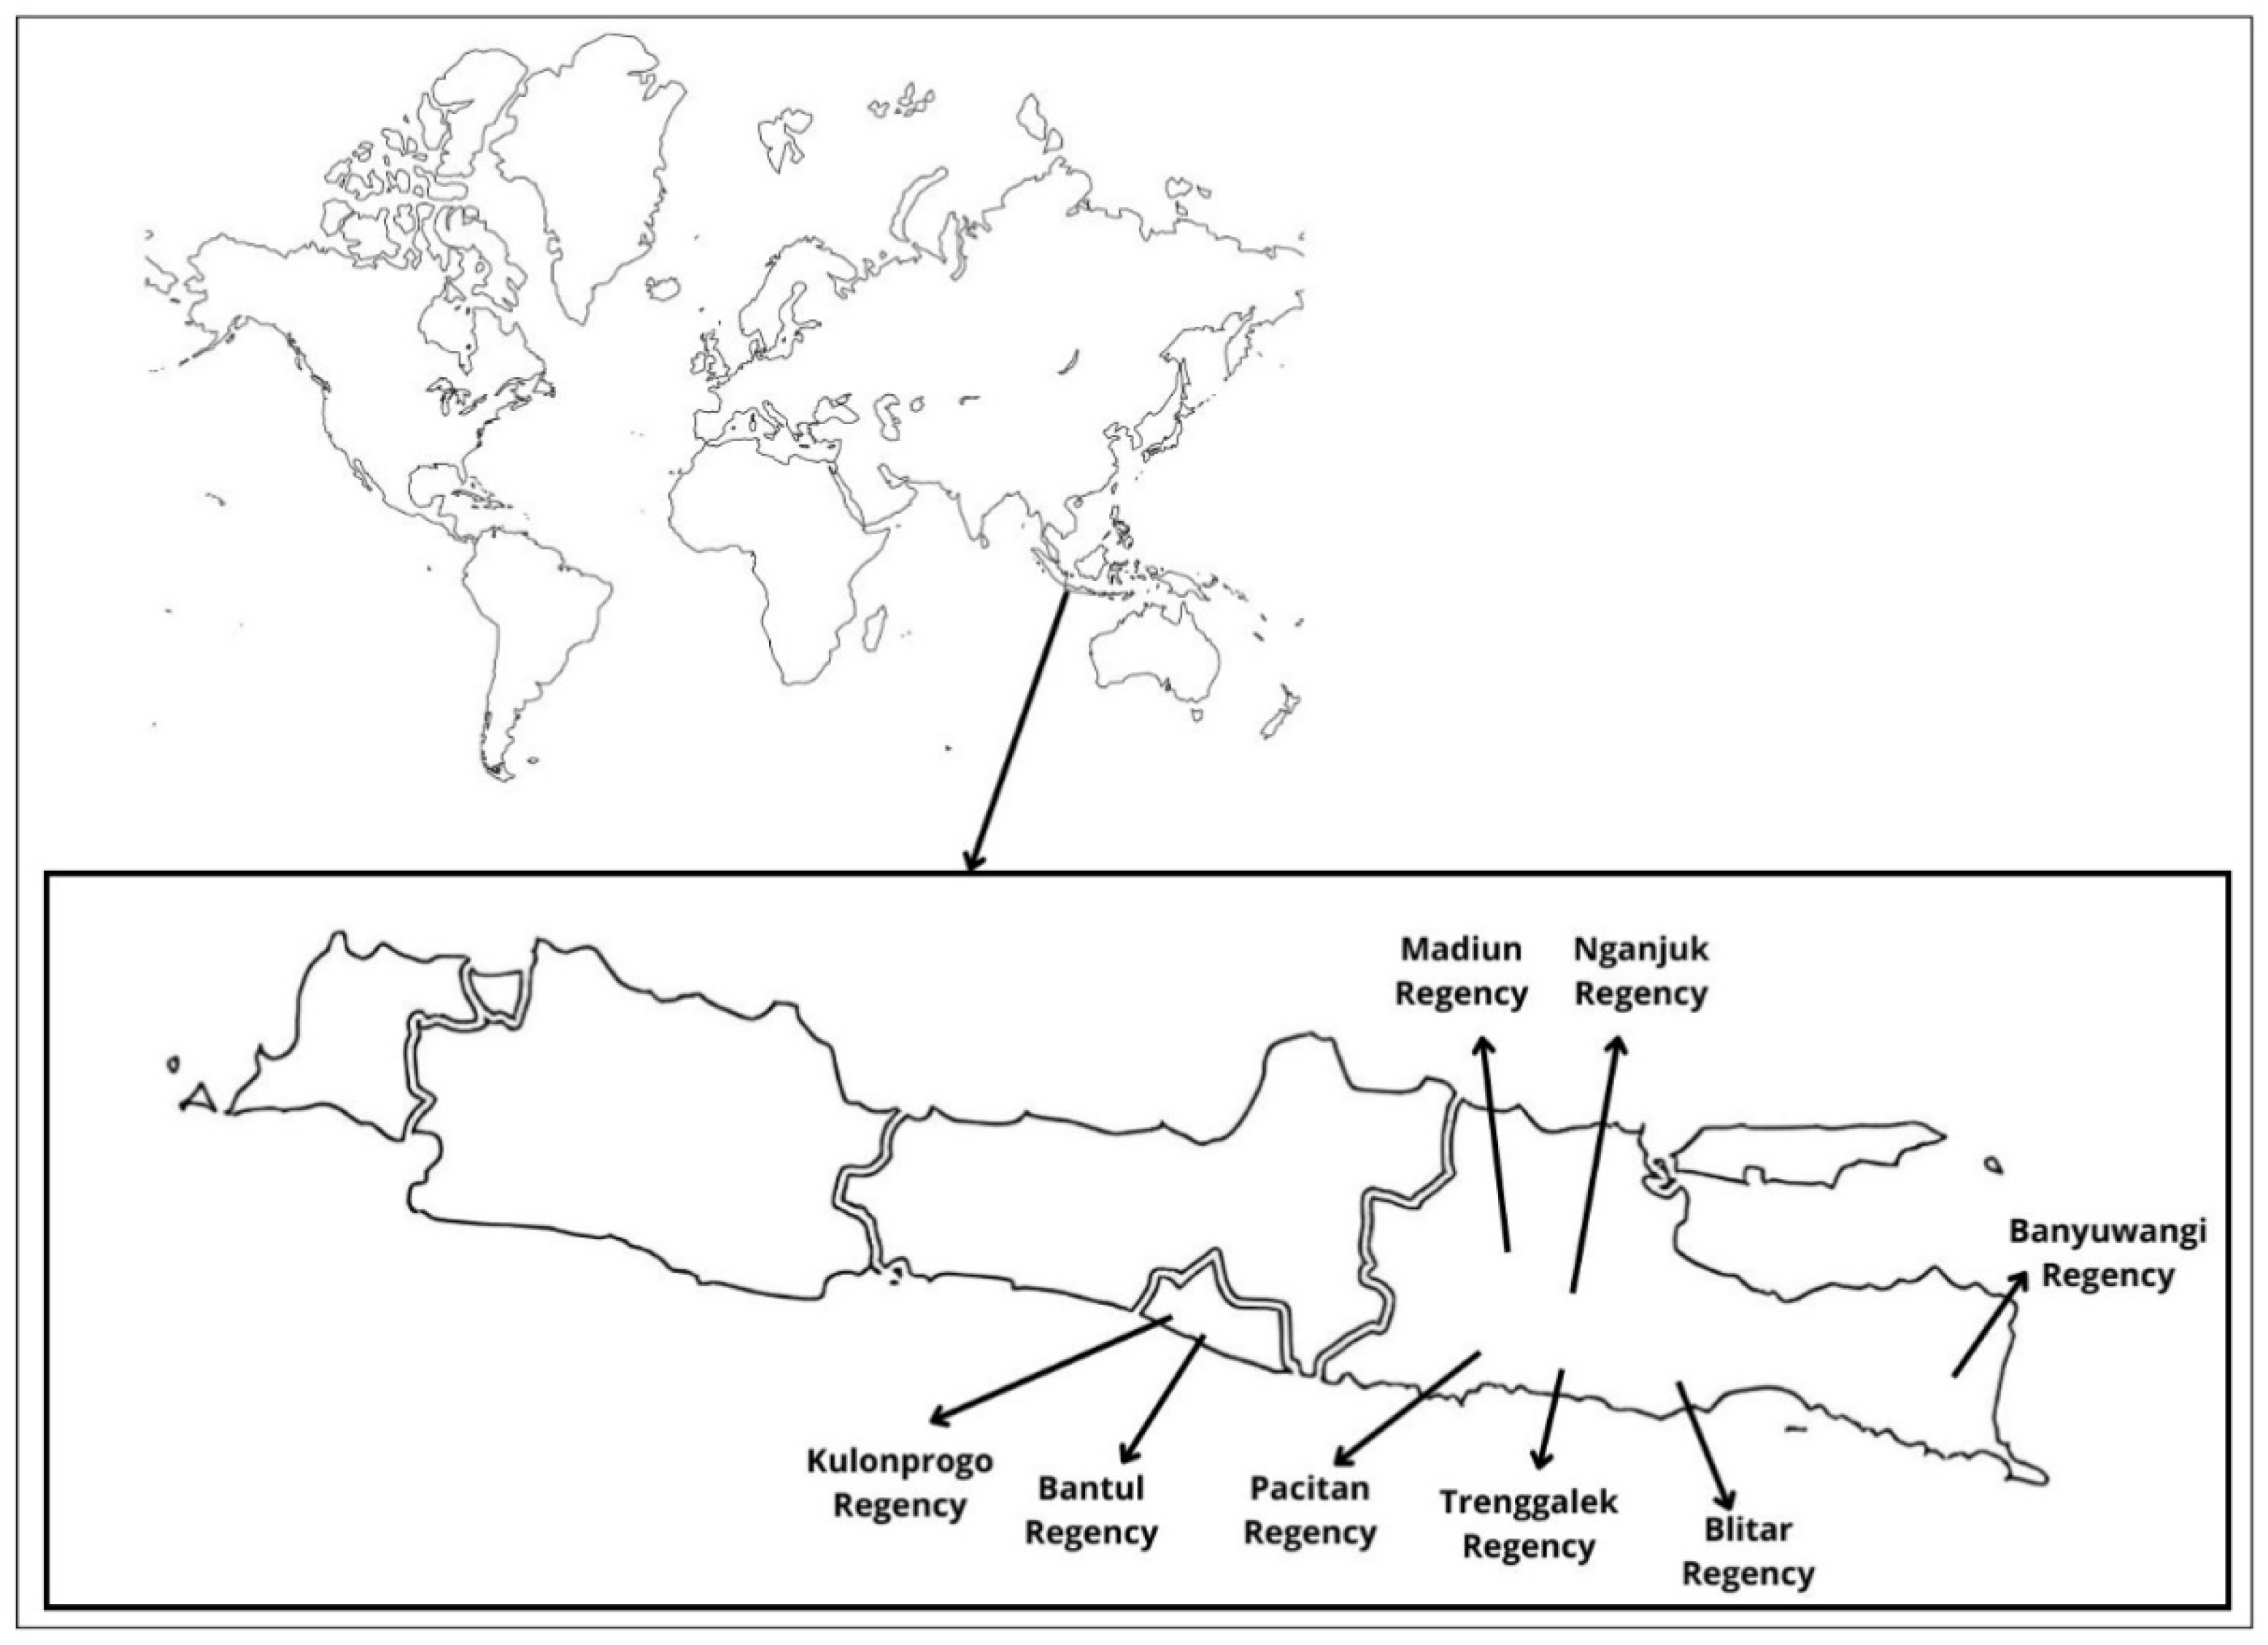
Figure 1. The research study area in Indonesia.
Sustainability 15 13453 g001
Figure 2. Age, family dependents (FD), and members of farmer group (MFG) informants.
Sustainability 15 13453 g002
Figure 3. References nodes on the sustainability of the black soybean supply chain.
Sustainability 15 13453 g003
Figure 4. Imported research data to QSR NVivo version 12 Plus.
Sustainability 15 13453 g004
Figure 5. Matrix coding query for traceability of black soybeans (a) and sustainability of the black soybean supply chain (b).
Sustainability 15 13453 g005
Figure 6. Hierarchy diagrams for traceability of black soybeans (a) and sustainability of the black soybean supply chain (b).
Sustainability 15 13453 g006
Figure 7. Cohen’s Kappa coefficient value for traceability of black soybeans (a) and sustainability of the black soybean supply chain (b).
Sustainability 15 13453 g007
Figure 8. Traceability of black soybeans (result of NVivo version 12 Plus).
Sustainability 15 13453 g008
Figure 9. Mallika black soybean supply chain flow.
Sustainability 15 13453 g009
Figure 10. Sustainability in the black soybean supply chain (result of NVivo version 12 Plus).
Sustainability 15 13453 g010
Table 1. Summary of existing works and this article.
SourceArticle Period (Year)Product
Traceability
Discussion of Product TraceabilitySustainabilityApproachModel
Food (Y/N)Soy (Y/N)Seed (Y/N)Plant (Y/N)Harvest (Y/N)Pest and Diseases (Y/N)Eco (Y/N)Soc (Y/N)Env (Y/N)Tech (Y/N)Inst (Y/N)Infra (Y/N)
[11]1998–2009YNNNNNNNNNNNQuanXML
[12]2001–2007NYNYYYNNNYNNQuanWebsite
[13]1995–2005YNNNNNNNNNNNQualXML-PML
[14]1973–2003YNNNNNNNNNNNQuanRFID
[15]1989–2009YNNNNNNNNNNNQuanWebsite
[16]1998–2009NYYYNNNNNNNNQuanUML
[17]1994–2013YNNNNNNNNNNNQuanRFID TQM
[18]2007–2014NYNNNNYYYNNNQuanSEI-PCS
[19]2008–2016NYNYYNNNNNNNQuanERP
[20]1998–2017YYNYYNYYYNNNQualN
[21]2005–2018YNNNNNNNYNNNQuanBlockchain
[22]2001–2018NYYYYNNNNNNNQuanBlockchain
[23]2009–2018YNNNNNNNYYNNQualBlockchain
[24]2009–2018YNNNNNNYNNNNQuanDematel
[25]2000–2019YYNYYNNNNNNNQuanGEE
[26]2002–2020YNNNNNYNNNNNQuanBlockchain
[27]1967–2020YNNNNNYYYYNNQuanBlockchain
[36]2005–2019NYNNNNYNNNYNQualLogit
[37]1989–2021NYNNNNYYYNYYQuanN
[38]2003–2021YNNNNNYNNNNNQuanBlockchain-IoT
[39]1992–2022YNNNNNYYYYNNQuanBlockchain
This Article1998–2023NYYYYYYYYYYYQualNVivo 12 Plus
Table 2. Defined themes, and coding derived from thematic analysis.
CodingThemeReference Code from NVivo Version 12 PlusDescriptive Coding
Nodesblack soybean seeds89We use black soybean seeds that were recognized by the Ministry of Agriculture
Parent Nodesloaned soybean seeds and money47Farmer groups were given black soybean seed loans and money to buy agricultural production facilities
Parent Nodesusing Mallika soybean seeds231We use the Mallika variety of black soybean seeds
NodesPlant323We empower local farmers to plant black soybeans
Parent Nodesland processing124Before planting, we cultivate the land for black soybeans
Parent NodesFertilizer266Farmer groups use fertilizers that do not damage the environment
Parent NodesIrrigation215Black soybeans are irrigated using pumps due to erratic rainfall
Parent Nodespest control286Pest control does not use chemicals because it is not allowed by the industry
Child Nodescarry out weed122To reduce weeds, we carry out weed clearing so that the black soybean plants grow well
Parent Nodesplanting tools99We use planting tools
NodesHarvest263The farmer group harvests black soybeans
Parent NodesDrying132The farmer group is drying the black soybean yields to reduce the water content
Parent Nodesharvesting tools371We use harvesting tools
NodesProduction203We use Mallika black soybean production from local farmer groups
Parent Nodesproduction grades119Black soybean production has a grade that will be accepted
Child Nodesgrade A89Grade A has a moisture content of 11%, 3% damaged seeds, and 3% dirt for IDR 10,000/kg. The production of Mallika soybeans with grade A is used as seeds
Child Nodesgrade B15Grade B has a moisture content of 13%, 4% damaged seeds, and 6% dirt for IDR 8500/kg
Child Nodesgrade C8Grade C has a moisture content of 14%, 5% damaged seeds, and 9% dirt for IDR 4500/kg
Child Nodesgrade D9Grade D has a moisture content of 14%, 10% damaged seeds, and 10% dirt for IDR 3000/kg
Parent NodesProductivity100Black soybean productivity according to planting treatment
Parent NodesSorting144For black soybean production from farmer groups, we do the sorting and cleaning with a blower machine
Child Nodesbroken seeds4Damaged seeds from the sorting results are collected to be used as animal feed in the surrounding environment or sold to feed traders or others
Child NodesDirt6The dirt is collected and used as fertilizer or feed
Parent NodesStripping128We separate the pods and seeds by machine
Parent NodesPackaging5We pack the black soybeans that are sent to the industry. The sacks must be good, with no traces of fertilizer or anything else
Parent Nodesreceived production8Soybean production received by industry is black, Mallika, whole/round seeds, and unbroken/damaged seeds
Parent NodesDelivery9Delivery of black soybeans using a truck with a load of sixteen tons, and costs one thousand rupiahs per kilo
NodesSAC149The SAC must be followed by black soybean suppliers
Parent Nodescontrolled by field assistants8Black soybean suppliers are controlled by field assistants
Parent NodesSAC codification16There are 3 groups of SAC codification in agriculture, namely planting and fertilizing management; control of pests, diseases, and weeds; and land management
Parent NodesSAC principle6The SAC principles as sustainability standards handled by the soy sauce industry
Disclaimer/Publisher’s Note: The statements, opinions and data contained in all publications are solely those of the individual author(s) and contributor(s) and not of MDPI and/or the editor(s). MDPI and/or the editor(s) disclaim responsibility for any injury to people or property resulting from any ideas, methods, instructions or products referred to in the content.