Article

Optimization and Comparative Analysis of Different CCUS Systems in China: The Case of Shanxi Province

1
Business School, University of Shanghai for Science and Technology, Jungong Road 516, Yangpu District, Shanghai 200093, China
2
Shanghai Future Office Park Development & Operation Co., Ltd., Shanghai 200949, China
*
Author to whom correspondence should be addressed.
Sustainability 2023, 15(18), 13455; https://doi.org/10.3390/su151813455
Submission received: 2 August 2023 / Revised: 30 August 2023 / Accepted: 5 September 2023 / Published: 8 September 2023

Abstract

:
As an effective technology to reduce carbon dioxide emissions, carbon capture, utilization, and storage (CCUS) technology has been a major strategic choice and has received widespread attention. Meanwhile, the high cost and strict requirements of carbon dioxide storage and utilization on geographical conditions, industrial equipment, and other aspects limit large-scale applications of CCUS. Taking Shanxi Province as an example, in this paper, we study the economic and environmental characteristics of carbon dioxide capture, storage, and utilization under different combinations of technical routes. Steel, power, cement, and chemical industries are considered. Deep saline aquifers and CO2-enhanced coalbed methane (CO2-ECBM) recovery are selected as the two types of sequestration sinks. Urea production, methanol production, microalgae cultivation, and cement curing are selected as the four potential utilization methods. Then, a mixed-integer linear programming (MILP) model is used to optimize the CO2 utilization pathway based on the principle of least cost, to select the best emission sources, CO2 pipelines, intermediate transportation nodes, utilization, and storage nodes to achieve reasonable deployment of CCS/CCU projects in Shanxi Province. The results show that CCU with urea production has the lowest cost and is the most economically viable with over 50% reduction in emissions. The second option is CCS which includes CO2-ECBM and achieves a 50% reduction in emissions. In addition, there is little difference between the cost of cement-cured CCU and that of methanol-produced CCU. CCU for microalgae cultivation has the highest cost. Therefore, the latter three utilization pathways are currently not economical.

1. Introduction

Since the industrial revolution, energy consumption has contributed to economic growth, whereas, the massive burning of fossil fuels has caused an increase in greenhouse gas emissions that has exceeded the earth’s digestion capacity [1]. One of the gases most affected by humans is carbon dioxide. It has been reported that CO2 emissions increased from about 22.7 billion tons in 1990 to approximately 35.3 billion tons in 2013 (56% higher) [2]. Excessive CO2 concentrations have led to a global temperature increase of nearly 1 °C compared with the pre-industrial level [3]. To mitigate the adverse effects of climate change on human productive life, several measures have been taken internationally. More than 130 countries and regions worldwide have proposed “zero carbon” or neutral carbon climate goals. China responded positively as the world’s largest energy consumer and CO2 emitter [4]. In September 2020, China proposed a clear goal of reaching peak carbon emissions by 2030 and carbon neutrality by 2060, making China the first developing country among the world’s major emitters to set a deadline for carbon neutrality. The energy reserves of China are characterized by “more coal, less oil, and less gas” [5], and coal has been the main energy source in the country. Therefore, CO2 emissions mainly come from traditional industrial enterprises that use coal as their main energy source, for example, the steel, chemical, cement, and power generation industries. According to statistics, the CO2 emissions from coal-fired power generation in China currently account for one third of the total emissions. These large stationary sources offer the possibility of achieving CO2 emission reduction.
Carbon dioxide emissions can be reduced by (1) using cleaner and renewable low-carbon energy sources (e.g., gas hydrate will be an essential resource for sufficient energy supply in the near future [6,7]); (2) improving energy use efficiency; (3) utilizing carbon capture, utilization, and storage (CCUS) technology for GHG control of energy activities; and (4) controlling greenhouse gas emissions from non-energy activities [8]. Improving energy efficiency and developing renewable energy sources are long-term strategic goals. Consequently, in recent years, CCUS technology has been internationally recognized as the most effective and promising method for reducing greenhouse gas emissions. A schematic representation of the CCUS process is presented in Figure 1. It involves the following three primary components: (a) capturing CO2 from carbon-intensive industries, such as the power generation, cement, and steel sectors; (b) transporting CO2 by pipelines or tanks; and (c) injecting CO2 into storage sites (deep saline seams, depleted oil and gas seams, and depleted non-cleanable coal seams) or utilizing CO2 (chemical utilization and mineralized utilization).
The development and promotion of CCUS technology will support the realization of low-carbon development of fossil energy, and will help China to achieve coordinated development of the environment. According to the International Energy Agency (IEA), achieving net-zero global emissions by 2070, where CCUS technologies sequester 15% of cumulative CO2 reductions, is crucial in carbon neutrality [9].
However, the current CCUS infrastructure faces a major challenge regarding the high investment costs in the early stages of deployment. CCUS is a complex industrial system in which CO2 emission sources and sinks are often located in different regions, and building separate infrastructure at different nodes leads to higher total costs. Therefore, here, we plan an overall CO2 pipeline network to improve the cost-effectiveness of CCUS.
In recent years, owing to the high cost of CO2 emission reduction, related studies have focused on economic evaluations of the technology. As research progresses, optimizing the CCUS model and utilizing CO2 have successively become the focus.
Several publications have reviewed a series of studies on the technoeconomic aspects of CCUS systems. Huang et al. [10] analyzed the technoeconomic performance of wind and coal-fired plants in terms of the net present value (NPV), cost of electricity and heat (COE), CO2 avoidance cost, and CO2 emissions. Hong et al. [11] evaluated the technological maturity, technical performance, energy requirements, and costs of CCUS systems, and they concluded that a solution to the technical challenges of CCUS required developing a hybrid CCUS system that included multiple technologies. Lee [12] proposed a hybrid energy system model to describe the macroeconomic effects, and investigated the impact of technological learning on the economic viability of CCS in the Korean steel industry. The results showed that CCS was economically feasible in the long run. Bellotti et al. [13] evaluated the annual fixed and variable costs and the annual cost of electricity and heat (COE) of coal-fired power plants with CCS or methanol units, and the authors analyzed future scenarios through the impact of European policies on the cost of CO2 emissions.
Optimization techniques are the key to optimizing a CCUS system, which is important for every aspect of a CCUS system. One optimization technology is a pinch analysis. Abdul et al. [14] used a pinch analysis to construct a CCS network planning framework for low-carbon industrial parks. Tan [15] combined a Monte Carlo simulation with a pinch point analysis to plan a carbon management network to minimize CO2 emissions throughout an entire network. However, this method lacked a cost analysis. With the deepening of research, some scholars have attempted to treat CCUS system optimization as a mixed-integer linear programming (MILP) problem, using creative constraints and decision variables. This method expands the applicability of the model and supports the reuse of pipelines between nodes to achieve efficient matching of multiple sources and sinks. It improves the accuracy of cost calculation, and the solution is also globally optimal. Leonzio et al. [16] developed different mixed-integer linear programming (MILP) models based on three different storage sites to determine the minimum cost of a CCUS system and the optimal configuration of CO2 storage and utilization. Zhang et al. [17] proposed a multi-objective MILP model to minimize the cost and environmental impact from environmental and economic perspectives and applied it to the northeast region. The above MILP models are mostly practical engineering applications that require micro data as support. Therefore, they have been mostly validated in the form of case studies, and are not suitable for conducting research on macro issues in situations where data are relatively scarce.
In terms of CO2 utilization, CO2 can be used to produce high-value-added chemical products under low energy consumption and low cost, thereby achieving efficient utilization of CO2 as a resource. Chauvy et al. [18] used a multi-criteria decision analysis (MCDA) to evaluate the best CO2 utilization pathway. The results showed that methanol (a6), dimethyl carbonate (a2), and methane (a5) were optimal choices. Cui et al. [19] designed a screening framework by combining MCDA methods with chemical process design. The proposed thermodynamic process model was also simulated, optimized, and evaluated to obtain the screening criteria and CO2 utilization rate, from which the most promising CO2 utilization method was selected. Cheng Lee et al. [20] evaluated potential direct CO2 conversion processes by systematic screening and process simulation. Then, based on their physical properties, they screened 15 direct pathways for converting carbon dioxide to carbonates or carbamates. Do et al. [21] developed optimization models to determine the optimal CO2 utilization strategy and evaluated its feasibility based on four criteria: energy efficiency (EEF), yield, production cost (UPC), and net CO2 emissions (NCE).
On the one hand, as shown above, previous studies in the literature on CCUS have considered only one product in the utilization section, most of which are about CO2-EOR. On the other hand, the development and application of optimization models have focused more on optimizing a particular technology and analyzing the interactions and complex relations between various links within the whole CCUS system. These studies ignore the differences in the costs of various CO2 utilization pathways. They lack a detailed comparative analysis of matching different emission sources with varying carbon sinks, failing to provide theoretical guidance for selecting the optimal carbon sink for each industry.
Therefore, this study aims to fill this gap and develops a MILP model to minimize the total annual cost (TAC) of CCS and CCU. This work involved the following: four emission sources, i.e., steel, power, cement, and chemicals; two storage sinks of deep saline layer and CO2-ECBM; and four potential utilization methods of urea production, methanol production, microalgae cultivation, and cement curing. In general, most CCUS systems feature direct source–sink connections, which can lead to excessive pipelines, and thus, high costs. The study area was divided into grids of equal size using the grid division method, and the obtained intersections were used as additional potential intermediate points. In this way, CO2 can first be pooled to a closer intermediate node and then uniformly transported from the intermediate node to the carbon sink, thus effectively reducing costs.
Finally, the model was applied to Shanxi Province. Shanxi Province was chosen for the following reasons: First, Shanxi Province is an important coal and energy province in China, and its economic structure is dominated by resource-intensive industries using coal as the raw material. As a result, Shanxi has formed a typical high-carbon economy. Second, there is great potential for sequestering CO2 in deep coal seams in Shanxi Province. According to the spatial distribution of coal resources and geological structure patterns in Shanxi Province, coalbed methane resources are consistent with the distribution of coal resources. At the same time, Shanxi Province has implemented the “Shanxi Action” to achieve peak carbon and carbon neutrality. The first “carbon neutral” research institute was established to play the role of a high-end think tank in reaching the peak, helping Shanxi’s “30.60” target.
There are also several reasons for considering the steel, power, cement, and chemical industries. First, coal-fired power generation accounts for 50% of the country’s total power generation. In 2020, CO2 emissions from the power generation sector accounted for 39.6% of China’s total CO2 emissions [22]. Second, the coal-based energy structure (coal accounts for 70% of energy consumption in the steel industry and is the main source of carbon emissions) is one of the typical characteristics of the steel industry [23]. In addition, approximately 60% of the CO2 emissions in the cement industry have also been generated by the calcination process [24]. Finally, Shanxi’s chemical enterprises are large in number and scale, and their CO2 emissions account for approximately one tenth of the country’s chemical industry.
This paper is structured as follows: Section 2 presents a detailed description of the CCUS system optimization model. Section 3 demonstrates the application of the proposed model to Shanxi province. Section 4 illustrates the results and discussions of the study. Finally, Section 5 presents the conclusions and policy suggestions.

2. Methodology

2.1. Problem Statement

The main objective of this study was to develop a CCUS system optimization model. This is essentially a transportation network planning issue. The model consisted of different CO2 emission sources, potential intermediate nodes, sequestration nodes, and utilization nodes. The captured CO2 from the source is transported to a suitable sink for sequestration or utilization during the planned life cycle, and the total cost of the entire system is minimized. We assessed its economic feasibility in Shanxi Province.
To facilitate the study of this problem, the following assumptions were made for the model:
(1)
One-to-one coupling, i.e., an emission source corresponds to only one capture node, and a capture node can only receive CO2 from one emission source [17].
(2)
Capture plants are located near the sources of CO2 emissions to avoid increased transportation costs.
(3)
In the system, CO2 is transported in a supercritical state via a pipeline without considering ship or tanker truck transportation. This is because pipelines are the most established infrastructure that is capable of transporting high flows of CO2 at low cost [25].
(4)
The transportation process was relatively safe and closed, and no additional losses were incurred.
(5)
An emission source corresponds to a unique sequestration sink or utilization sink; however, a sink can receive CO2 from multiple sources [25].
(6)
The sink, source, and pipeline in the system had the same life cycle, with a planned cycle of 20 years [26]. This limits the amount of CO2 transported to the sequestration sink each year.
(7)
Stable demand, i.e., over time, the market demand for products converted from carbon dioxide is constant and can be sold at a stable price [27].
Based on the above assumptions, the model was formulated as follows,
given the following inputs:
(1)
Emission sources, including type, location, annual emissions;
(2)
CO2 capture and compression, as cost per unit of CO2 capture and compression;
(3)
CO2 transport, as transport distance and associated cost;
(4)
CO2 sequestration, including type, location, amount sequestered, and related costs;
(5)
CO2 utilization, including options, location, and associated cost;
(6)
CO2 reduction targets.
The goal of the mathematical model is to minimize the total cost, which includes dehydration, capture and compression, transportation, sequestration, and utilization costs or benefits. The following section describes the model constraints and objective functions in more detail. The solution procedure for the model is described briefly.

2.2. CCUS System Model

In this subsection, a MILP model is developed to solve the optimization problem of CCUS. This model consists of CO2 emission sources, source sink distance, and CO2 storage/utilization nodes. The model determines the optimal amount of captured CO2 to be utilized or sequestered and finds the optimal connection between the CO2 source and the utilization and storage site by targeting the lowest cost. As shown in Figure 2, the sets, parameters, variables, constraints, and objective functions used in the model are defined.

2.2.1. Sets

An index represents each node in the model. The CO2 emission source nodes are represented by i, the storage and utilization nodes are represented by j, the potential intermediate nodes delineated in this study are denoted by t, G and g’ denote the set of all nodes as follows:
i ∈ (1, …, I), carbon dioxide emission sources
j ∈ (1, …, J), carbon sink nodes
t ∈ (1, …, T), intermediate nodes
g, g’ ∈ G, all the nodes (including I, J, and T)

2.2.2. Parameters

Set the following parameters:
  • Minimum reduction target (million tons per year);
  • Total CO2 emissions per source (million tons per year);
  • Maximum capacity of storage or utilized nodes (million tons);
  • CCUS life cycle (years);
  • CO2 avoidance cost.

2.2.3. Variables

The following 0/1 binary variables were used to determine the choice of storage or utilization site:
z g g = 1 i f   C O 2   i s   t r a n s p o r t e d   f r o m   g   t o   g 0 o t h e r w i s e

2.3. Mathematical Formulas

2.3.1. Constraints

CO2 is captured from the emission source using existing capture devices. Each capture device has its capture capacity limit; therefore, each source node should not capture more CO2 than the maximum capture capacity. In Equation (1), c i denotes the annual capture of carbon dioxide at source node i and E i represents the annual emission of carbon dioxide at source node i. To simplify the calculations, in this study, it is assumed that the capacity limit of each capture device does not exceed 80% of the emissions [27]. The total emissions of CO2 suppliers cannot be fully captured. Equation (1) is:
c i E i × 0.8 i I
The model should meet the minimum CO2 reduction targets. In Equation (2), C M m i n is the minimum target for the reduction of CO2. Equation (2) is:
i c i C M m i n i I
where the emissions from all source nodes are summed to obtain the total emissions from each industry.
The CO2 flowing from one node can only be transported to another node and is prohibited from being transported to multiple other nodes simultaneously, that is, one-to-one coupling is achieved. Equation (3) is applied:
g z g g 1
z g g = 1 i f   C O 2   i s   t r a n s p o r t e d   f r o m   g   t o   g 0 o t h e r w i s e
where z has been defined in the previous section, and z = 1 if there is a conveying pipeline between g’ and g; thus, the decision to install pipelines and carbon capture devices needs to be made simultaneously during the planning period.
There is a limit to the transport capacity of the pipeline that cannot exceed the maximum capacity that can be carried. In addition, the transport of CO2 between the two nodes must correspond to the value of z g g . That is, if z g g = 1, then the CO2 flow between g’ and g should be positive, and if z g g = 0, then at the same time, the CO2 flow between g’ and g should also be 0. Equation (4) ensures that this constraint holds [17]:
F L g g < M × z g g g g
where F L g g denotes the CO2 flow rate transported from node g’ to g and M is an auxiliary constant of infinity.
All the nodes in the model must follow the mass balance law. We must ensure that the sum of the total CO2 flow into node g and the amount of CO2 captured at node g in the model must equal the total CO2 flow out of node g plus the total CO2 flow rate utilized or sequestered at node g. Thus, we define the constraint as Equation (5):
g F L g g + c g = g F L g , g + u g g g
where c g denotes the CO2 captured at node g and u g denotes the amount of CO2 utilized or sequestered at node g.
Each carbon sink has a limited capacity. The following constraint ensures that the CO2 flow rate delivered to this node does not exceed its power, as shown in (6):
u j S j T H j J
where S j denotes the maximum capacity of the carbon sink, u j denotes the CO2 flow rate at storage nodes, and TH denotes the system planning period. In addition, because this model minimizes the TAC, what is delivered to the carbon sink is the yearly CO2 emissions and S j represents the total capacity of the carbon sink. It must be divided by the planning period to obtain the annual capacity limit.
The CO2 flow rate at each storage or utilization node is equal to the sum of the flow rate delivered from the intermediate nodes to the sink and the flow rate delivered directly from the source to the sink. Equation (7) is then introduced as:
u j = t F L t , j + i F L i , j
where F L t , j denotes the CO2 flow rate delivered from node t to j.
In this study, we only consider that CO2 can be handled at the storage and utilization nodes, and neither the intermediate nor the source nodes can be stored or utilized locally. Thus, there is the following constraint, see Equation (8):
u t 0 , u i 0
The non-negative constraints for the variables in the model are given by Equation (9):
F L g g > 0 c i > 0 u j > 0

2.3.2. Cost and Revenue Accounting Equation

The model gives the cost of dehydration, CO2 capture and compression, transportation, storage, and the revenue generated from CO2 utilization.
(1)
Dehydration cost
Flue gas from emission sources carries a certain amount of liquid water (approximately 5–15%). The presence of liquid water reduces the adsorption capacity of the adsorbent, corrodes the pipeline, and reduces pipeline transport capacity. Therefore, the flue gas emitted from the source node is pretreated using the triethylene glycol (TEG) absorption process to reduce the water content of the flue gas to 0.1% and below, which has a unit cost (including capital cost as well as operating cost) of 10.22 USD/ton CO2 [28].
(2)
Capture and compression costs
Two widely used cost criteria for the capture process are (i) the cost of capturing 1 ton of CO2 and (ii) the avoided cost of 1 ton of CO2. The CO2 capture cost includes the capital and operating costs of installing the carbon capture devices. CO2 avoidance cost is a measure that compares the economic value of different technology types in terms of reducing GHG emissions [29]. The CO2 avoided cost is the minimum CO2 tax required for a CO2 emitting source to begin considering CCS. The main difference between these two standards is that the cost of capturing 1 ton of CO2 is not given as a reference plant and does not reflect the cost change. Considering a coal-fired power plant as an example, the calculation formula is as follows [30]:
C O 2   a v o i d a n c e   c o s t = P C c P C b C S b C S c
where P C c indicates the product cost of the plant with CCS installed, P C b is the product cost of the plant without CCS established, C S b indicates the CO2 emissions of the plant without CCS installed, and C S c suggests the CO2 emissions of the plant with CCS installed. In addition, CO2 avoidance cost was calculated based on CO2 reduction to the atmosphere per unit of net product. The goal of CCS/CCU is to reduce CO2 emissions to the atmosphere; therefore, the choice of CO2 avoidance cost in this study has some practical value.
According to the Global CCS Institute [31], the avoided cost of 1 ton of CO2 is shown in Table 1 and should be deducted from this indicator by USD 11, including transportation and storage costs.
Hence, the capture cost is calculated as follows:
C C i = C c a p i × c i
where C C i denotes the carbon capture cost at source node i, C c a p i denotes the unit capture cost at source node i, and c i denotes the CO2 captured at the source node i.
(3)
Transportation cost
In this study, pipelines were chosen as the means for transporting CO2. A linear cost model proposed by Serpa [32] et al. was used in this study, which facilitated the analysis. The model is divided into pipeline capital and operating costs as functions of the CO2 flow and transport distance. Equations (11) and (12) are as follows:
P I C g g = ( β t × F L g g + α t × z g g ) × F T × ( D g g + 16 )
P O C g g = O & M p i p e l i n e × P I C g g
Equation (11) represents the capital cost of pipeline construction between two nodes, and α t and β t are constants of 0.533 and 0.019, respectively [32]. F T is the terrain factor. When a pipeline passes through a densely populated area, it must be managed better for better safety, and the cost will be slightly higher, with a value of F T equal to 1.4. When a pipeline passes through remote areas, the value of F T is 1. Therefore, the average of the two can be obtained, and the terrain factor is 1.2 [33]. D g g is the distance between two nodes, which is the distance calculated from the latitude and longitude and not the actual distance; 16 KM can also be regarded as a correction for distance [34].
The formula for calculating the distance between two points is given by (13):
D g g = cos ( L a t g ) × cos ( L a t g ) × cos L o n g g L o n g g + sin ( L a t g ) × sin ( L a t g )
where L a t and L o n g epresent the latitude and longitude of the node.
Equation (12) is the annual O&M cost, including the monitoring and maintenance costs [26]. Knoope [35] et al. proposed the annual O&M cost as a percentage of the investment cost to be between 1.5% and 4%; 4% was used in this study.
(4)
Storage cost
This study considers two CO2 geological storage methods: deep saline aquifers and CO2-ECBM. The unit gain of CO2-ECBM is 5.59 USD/ton CO2 [36]. According to the analysis given by zero emission platform [37], this paper treats the storage cost as a linear function of the amount of carbon buried, where the variable unit cost of the deep saline aquifer is USD 10. Moreover, for this case study, we assume that the government pays the fixed cost of the buried node; thus, the fixed cost is equal to zero [29]:
S C j = F C j + V C j
(5)
Utilization revenue
Captured CO2 can be converted into various commercial products, thus, offsetting the cost of CCUS. The most promising utilization pathways are chemical utilization, CO2 conversion to fuel, microalgae cultivation, and mineralization. Currently, the most common path for chemical utilization is urea production. It has become a widely used and mature technology (TRL 9) [38]. The conversion of CO2 to fuels (e.g., methane and methanol) will help to reduce reliance on fossil fuels. Microalgae can fix carbon dioxide directly from waste gases, increasing biomass productivity by 30% compared with injecting pure carbon dioxide [39]. CO2 is used as a cement curing agent in the precast concrete market and 70% of the fillable cement market [40]. Therefore, we selected the above four options as the CO2 utilization methods.
In this study, break-even costs were used to measure CO2 utilization. This represents the incentive or subsidy necessary to make a pathway economically viable. The defining equation is as follows [40]:
β = ( c p ) × Q V
where β represents the break-even cost; p is the price per unit of product; c is the cost per unit of product, which excludes any subsidies for CO2 and any payments incurred to obtain CO2; Q is the quantity of product; v is the quantity of CO2 utilized; and Q V represents the quantity of product produced using one ton of CO2. Equation (15) indicates that if β < 0 utilization is profitable without subsidies, subsidies are required to make the production process of the utilization break even.

2.3.3. Objective Function

The model is designed to minimize the annual net cost, which includes dehydration, capture, transportation, and storage costs, as well as the revenue generated during utilization, where the utilization revenue is subtracted as a negative term from the total cost. The objective function is as follows:
M i n i , j T A C = i ( C D C i + C C i ) + g , g ( P I C g g + P O C g g ) + j F C j + V C j j C R j
where C D C i is the dehydration cost, C C i is the CO2 capture cost, P I C g g is the CO2 pipeline annual investment cost, P O C g g is the CO2 pipeline operating cost, F C j is the CO2 burial fixed cost, V C j is the burial variable cost, C R j and is the CO2 utilization benefit. Moreover, constructing intermediate nodes is economically negligible to simplify the study because the investment in creating intermediate nodes is lower than the investment in pipelines [41]. Therefore, this construction cost does not appear in the objective function.

3. Case Study

In this section, we apply the above model to optimize CCUS systems in Shanxi Province. Large stationary sources of CO2 emissions, such as steel plants and coal-fired power plants, which account for the largest share of carbon emissions in the country, were targeted for study. Residential consumption with low emissions was excluded from the study. Ten CO2 source nodes were selected for each sector, with a reduction target of 50% of the total emissions for each industry. The CCUS model also included four storage and four CO2 utilization nodes. Among the geological storage systems, two systems are for deep saline aquifers, and the other two systems use CO2-ECBM to recover coalbed methane and achieve CO2 storage. There are the following reasons for choosing storage and CO2-ECBM. On the one hand, the deep saltwater layer near Shanxi Province is widely distributed and the technology is feasible. The storage time of CO2 can reach millions of years, which has huge storage potential. In addition, it is not a coastal city, and therefore does not consider ocean sequestration. On the other hand, coal production in Shanxi has an absolute advantage, while oil and gas fields account for a relatively small proportion, with limited CO2 storage capacity. Moreover, the geological conditions for the development of coalbed methane in Shanxi Province are generally better than those in other provinces with generally shallow burial and structural integrity of the coal body [42]. Zhang Bing [43] et al. gave an approximate range of values for the storage capacity of the northern Shanxi slope and the Yimeng uplift as a deep saline aquifer. In addition, in this study, two coal fields, Datong-Ningwu and Qinshui, were selected as nodes for using CO2-ECBM. Effective sequestration was estimated by Wang Zhong [36] et al. The specific geographic locations and capacity information are shown in Table 2. Table 3 gives the geographic location information and the break-even costs for each utilization method. Based on the geographic location information of the source and sink, Shanxi is divided into 6 × 8 grids of equal size, where the interval of each grid is set to 1 degree to obtain 48 cross nodes, and the cross nodes are used except for potential intermediate sites. In summary, this model includes 40 source nodes, consisting of large stationary emission sources, four storage nodes, four utilization nodes, and 48 intermediate nodes, for a total of 96 nodes.

4. Results and Discussions

In this section, the validity of the proposed model is verified. We compared different CO2 disposal methods to show the cost differences and suggest that companies choose a better disposal method. The model is a MILP model developed in the General Algebraic Modeling System (GAMS version 37.1.0) with a computer processor of 2.1 GHz and 16 GB of memory. The model was solved optimally using CPLEX 20.1.0.1. The CCS model has 15,659 equations and 3844 discrete variables with a solution time of approximately 1.735 s. The CCU model has 14,185 equations and 3481 discrete variables, with a solution time of 0.579 s.

4.1. Results Analysis of CCS Optimization

The steel, power, cement, and chemical industries are considered to emit 116.5 Mt, 91.35 Mt, 83.74 Mt, and 77.41 Mt of CO2 per year, respectively, and are required to meet at least 50% of the reduction targets.
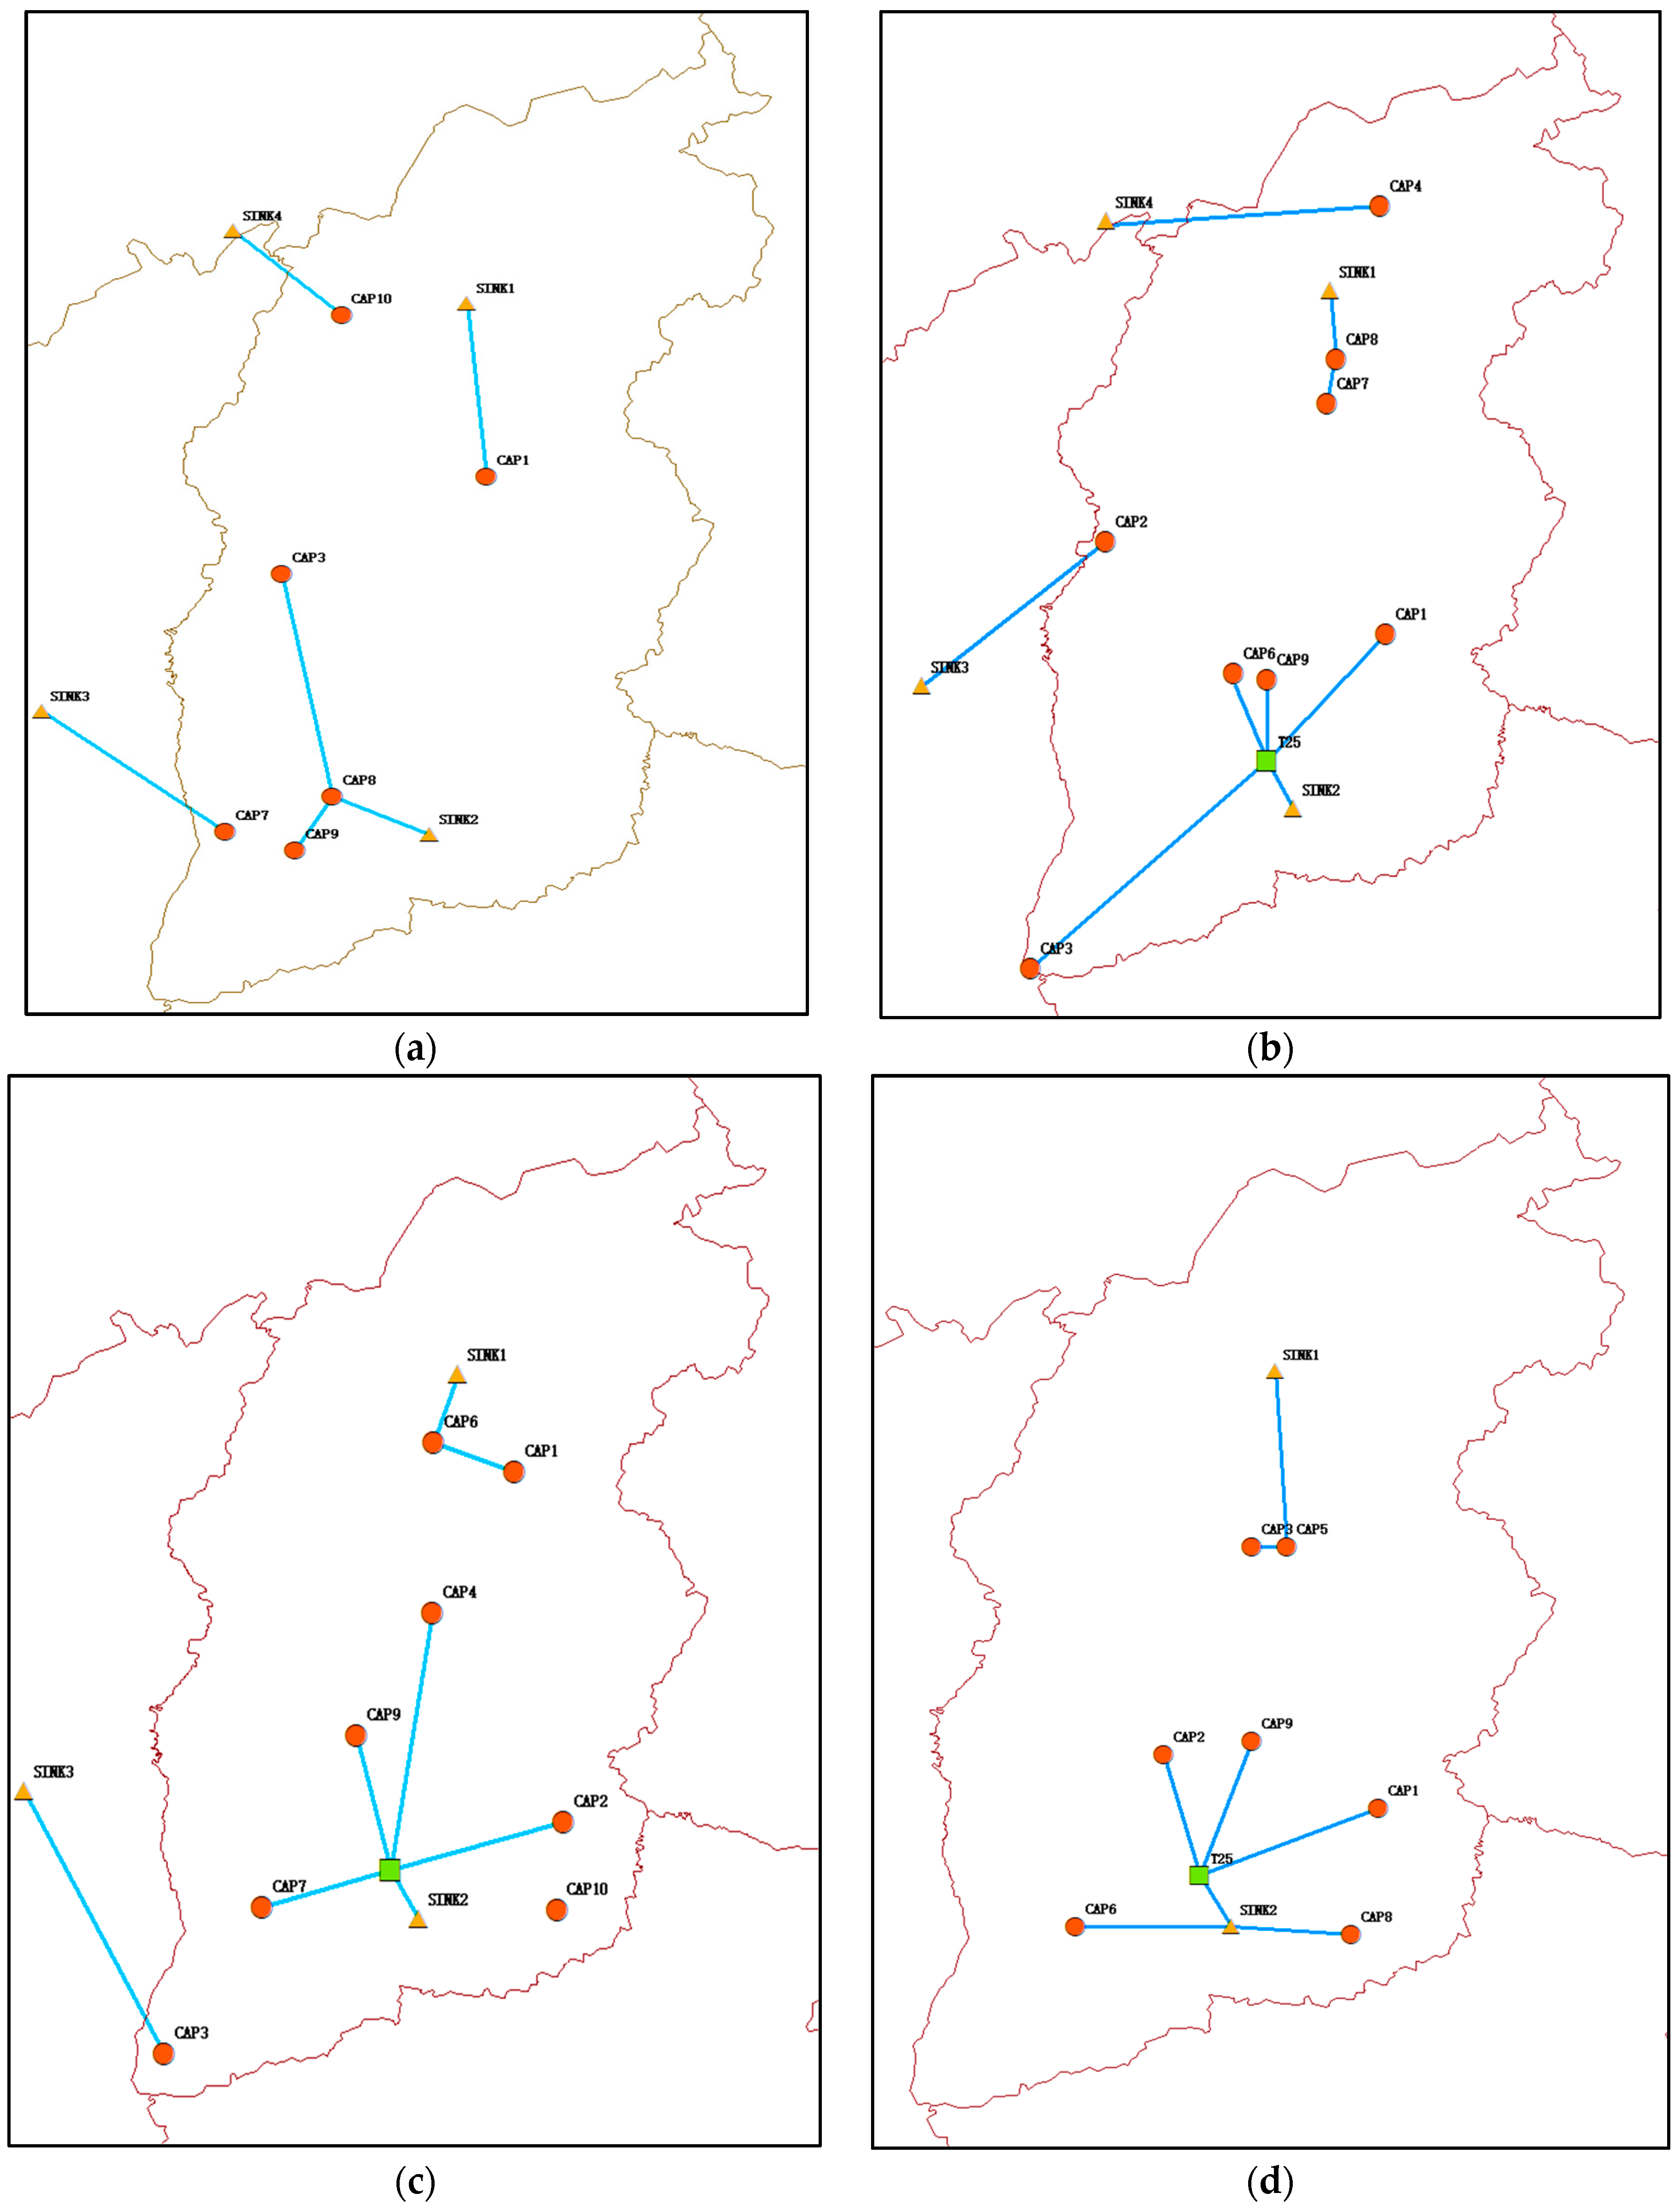
Figure 3 illustrates the network topology of the CCS for these four industries. In the figure, the red circles represent the source of CO2 emissions, the yellow triangles represent the storage sites, and the green squares are the CO2 utilization sites. The blue lines denote the CO2 pipelines. From the pipeline network layout, supercritical CO2 from different nodes can be optionally pooled to an intermediate node and transported to the sequestration node via a trunk line, thereby connecting distant source sinks at a lower transportation cost. This has been verified in other areas [26]. For example, in Figure 3a, CAP8 is both a source and an intermediate node, which receives CO2 from CAP3 and CAP9 for combined transport to SINK2. T25 in Figure 3b is the newly built intermediate node that receives CO2 from CAP1, CAP3, CAP6, and CAP9 and transports it to SINK2 via T25. CAP6 and T25 are the intermediate nodes in Figure 3c, and T25 is an intermediate node in Figure 3d. Without these intermediate nodes, each source can only be delivered directly to the sink through a single pipeline, reducing the economics of the entire CCS system. From the selection of sequestration sinks, CO2 from emission sources in all four figures was preferentially transported to sinks used for CO2-ECBM (SINK1 and SINK2), because of the proximity and reduced transportation costs. Hence, the transit connection pipeline network layout scheme and CO2-ECBM contribute to cost savings in the CCS system.
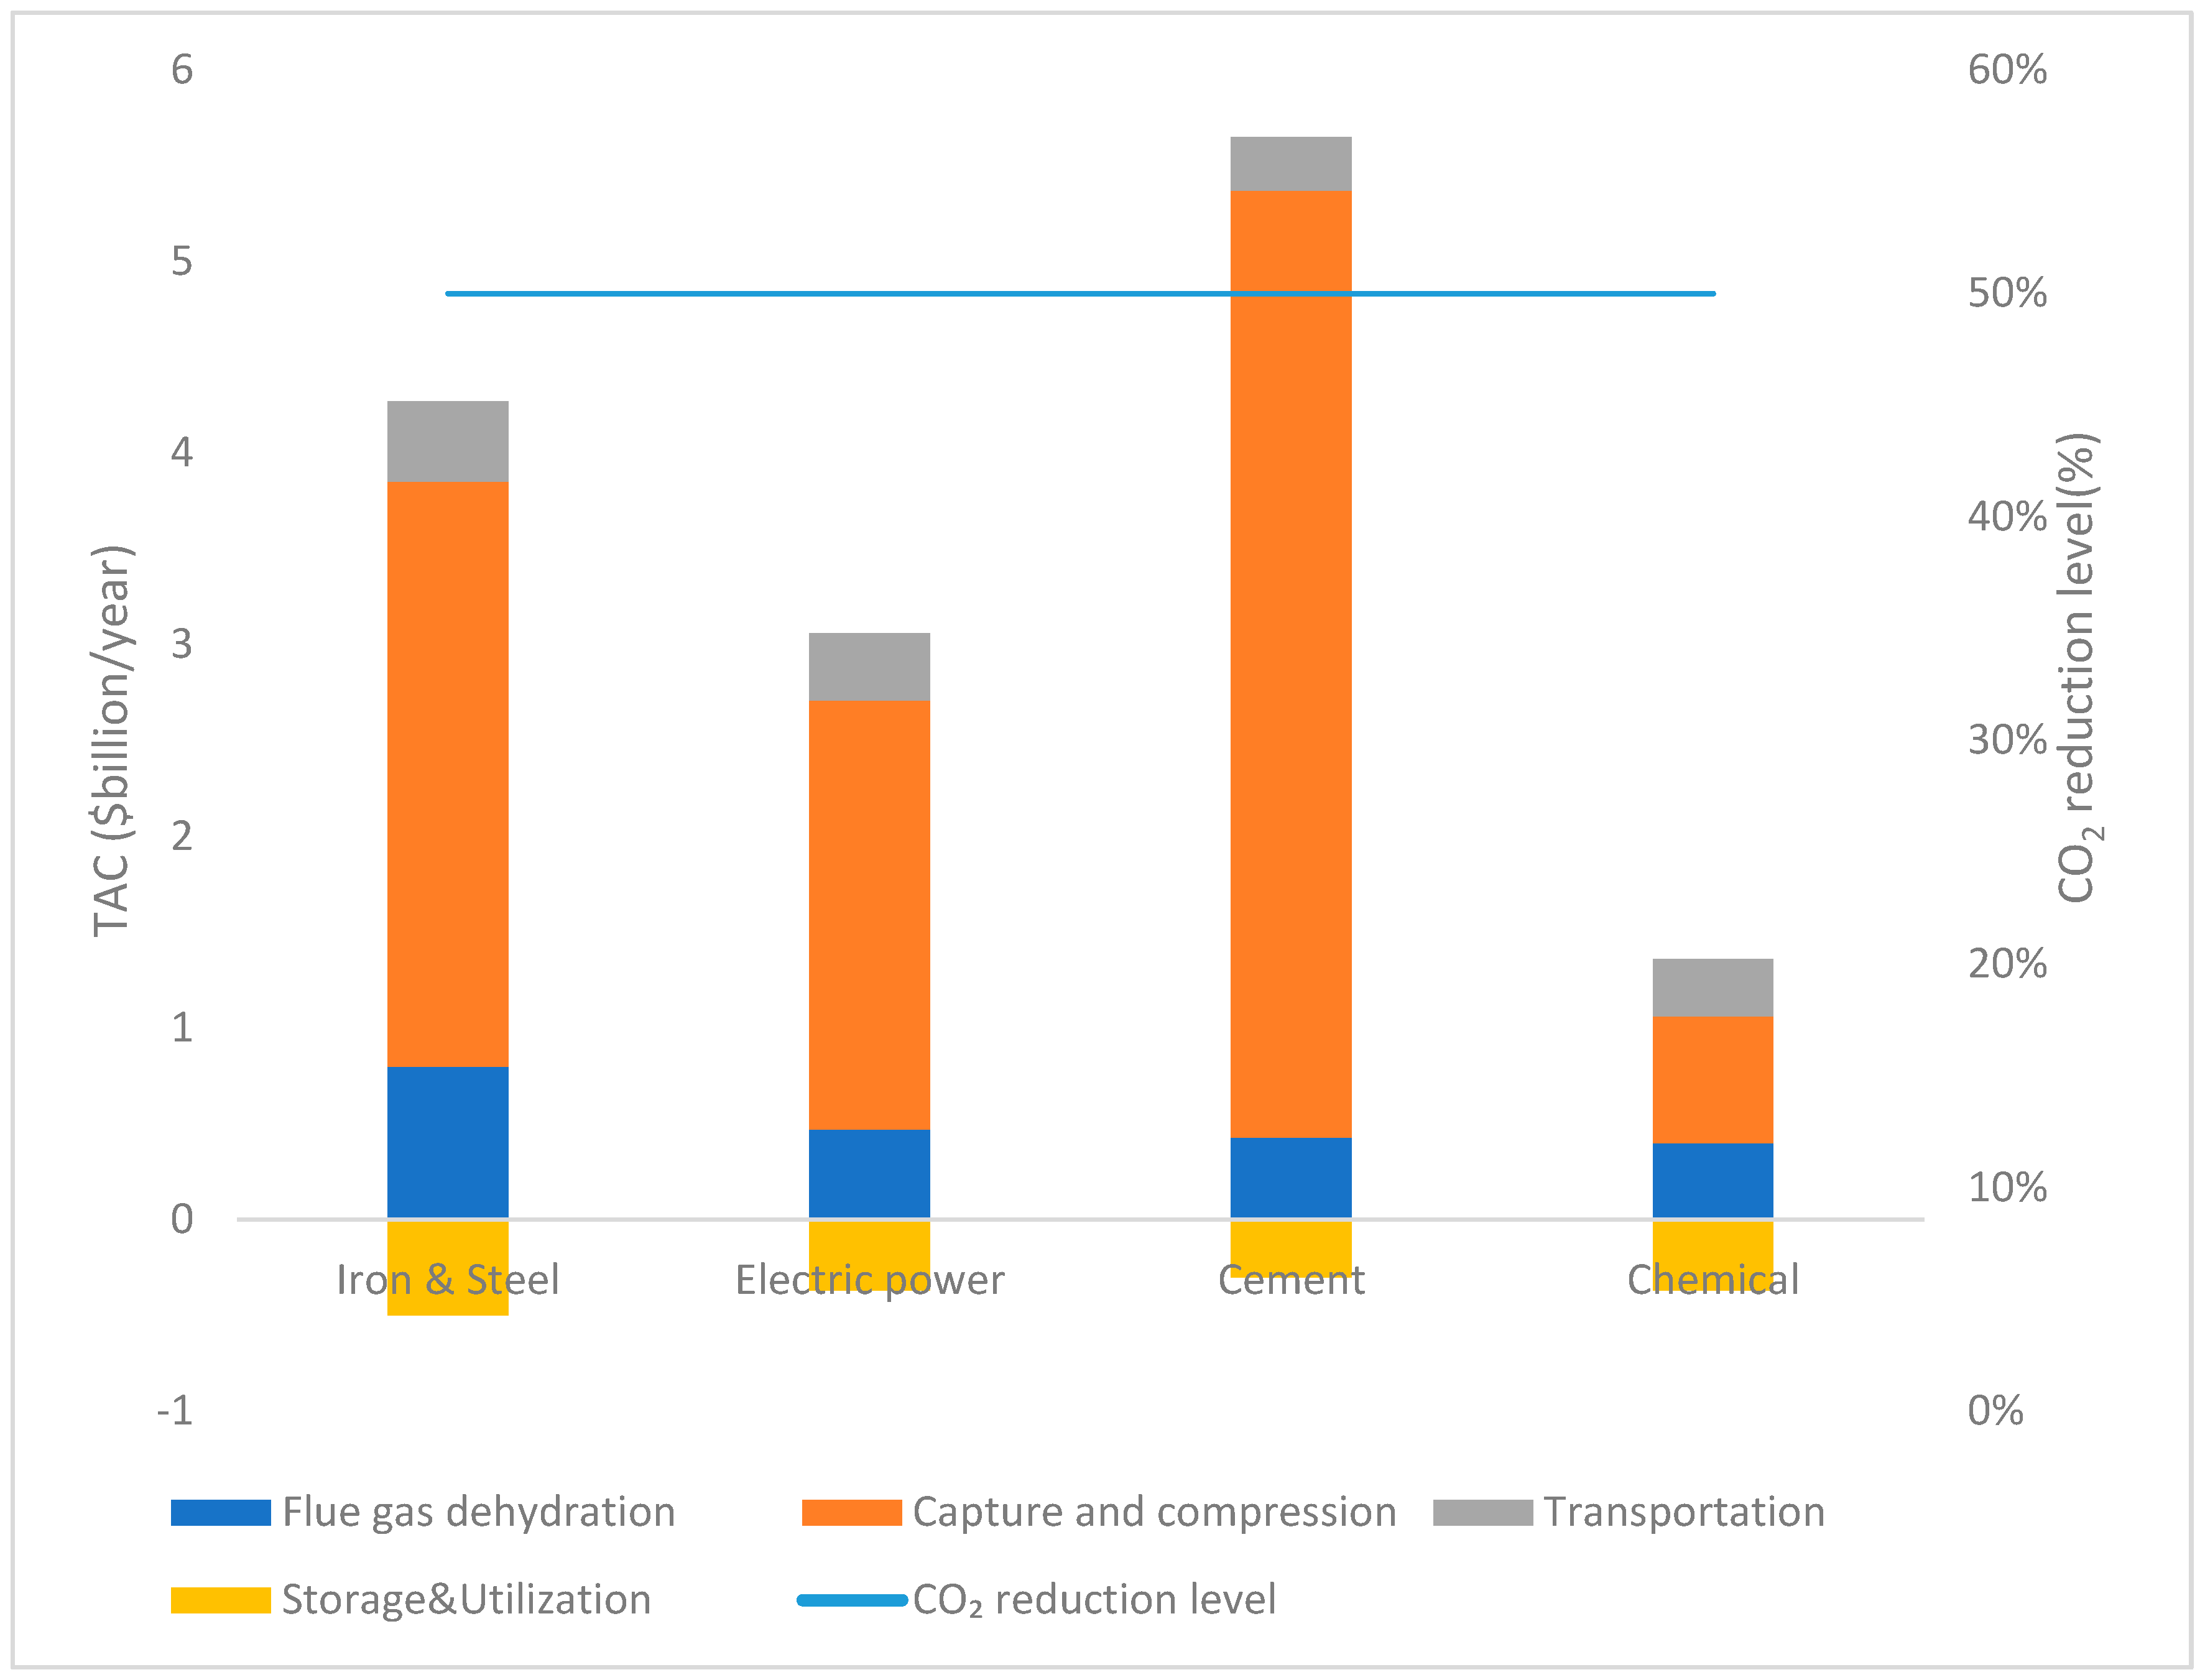
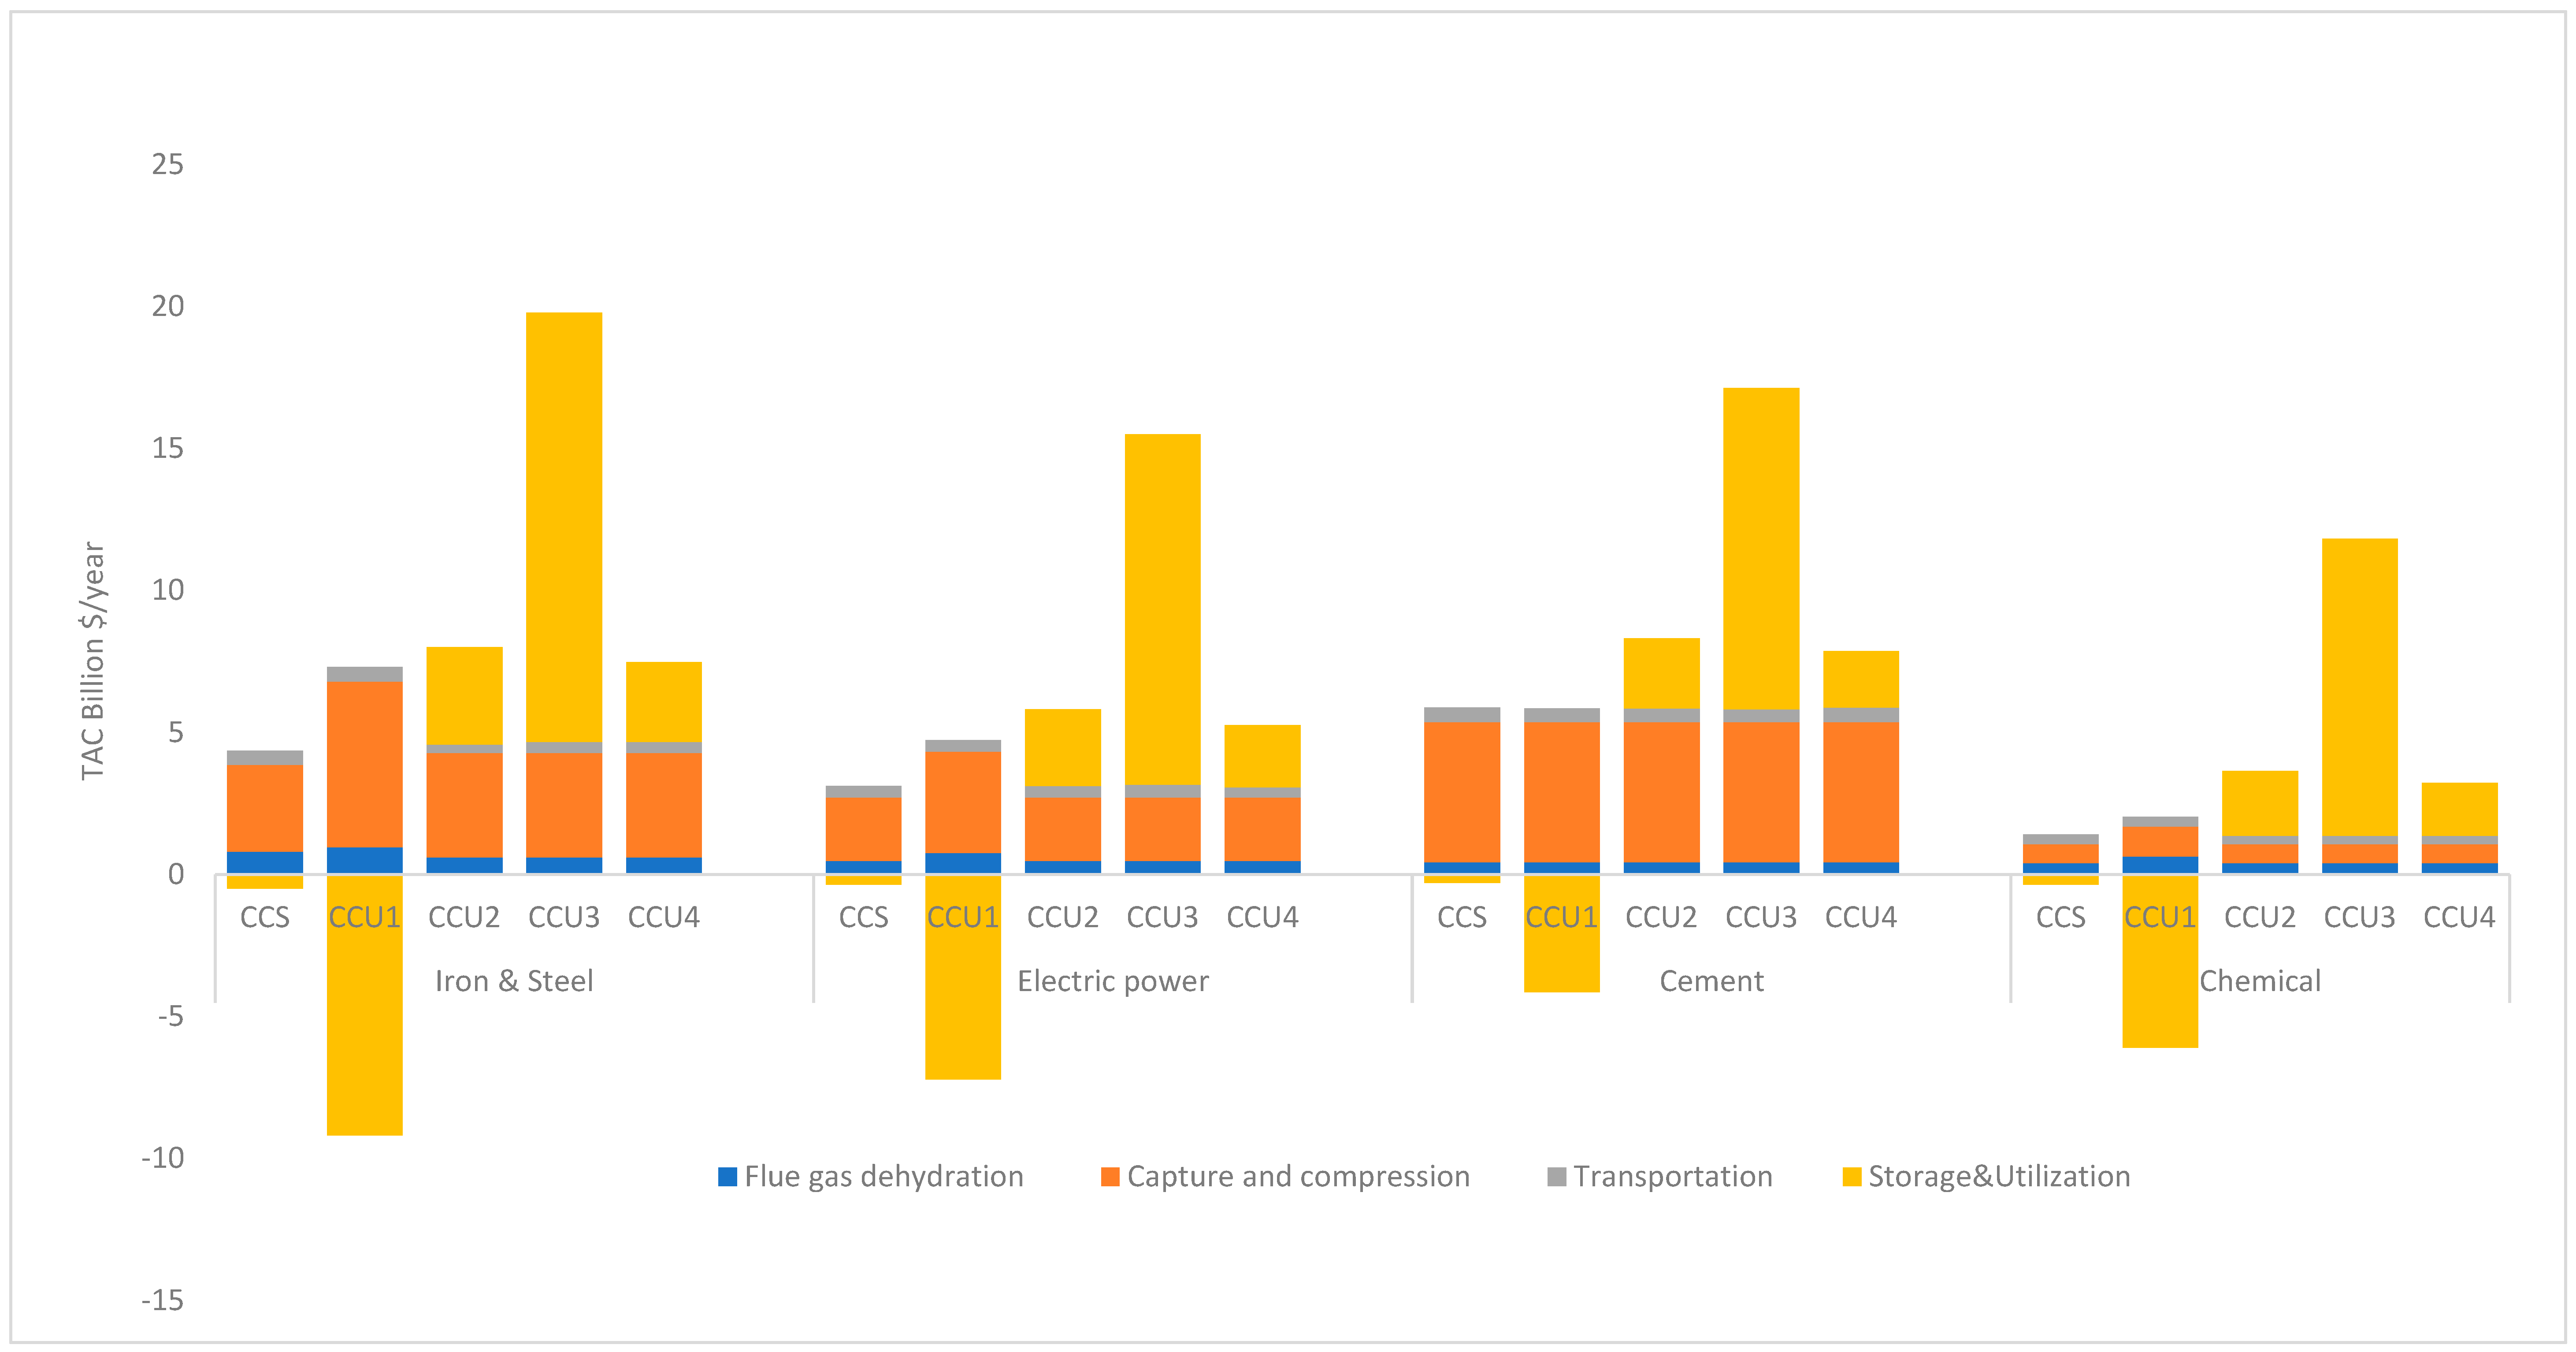
Figure 4 shows the total cost of optimizing the CCS system for the four industries and the percentage reduction in CO2. Capture and compression costs had the greatest impact on total costs regarding cost structure, as found in other literature studies [17,25]. Capture and compression costs were USD 3.05 billion for the steel industry, USD 2.23 billion for the power industry, USD 4.94 billion for the cement industry, and USD 0.66 billion for the chemical industry. This is mainly because carbon capture technologies are still in the early stages of the market, and their high energy consumption still results in high costs. The dehydration and transportation costs constitute a relatively small part of the total costs. As for sequestration, 38.85 Mt of CO2 captured in each of the three industries—steel, power, and chemical—was used for CO2-ECBM, generating about USD 0.2 billion in revenue, and 38.71 Mt of CO2 captured by the chemical industry was used for CO2-ECBM, generating USD 0.21 billion in revenue. All of the above offsets a portion of the cost of the entire CCS system. In terms of the emission reduction effect, all industries can achieve 50% of the emission reduction target if CCS projects are deployed, indicating that CCS has favorable environmental benefits. Overall, although capture and compression costs are high in CCS, transportation costs can be significantly reduced if emission sources are allowed to be transported to intermediate nodes first. The benefits of CO2-ECBM technology can offset some of the costs of CCS, making CCS implementation possible for every industry.

4.2. Results Analysis of CCU Optimization

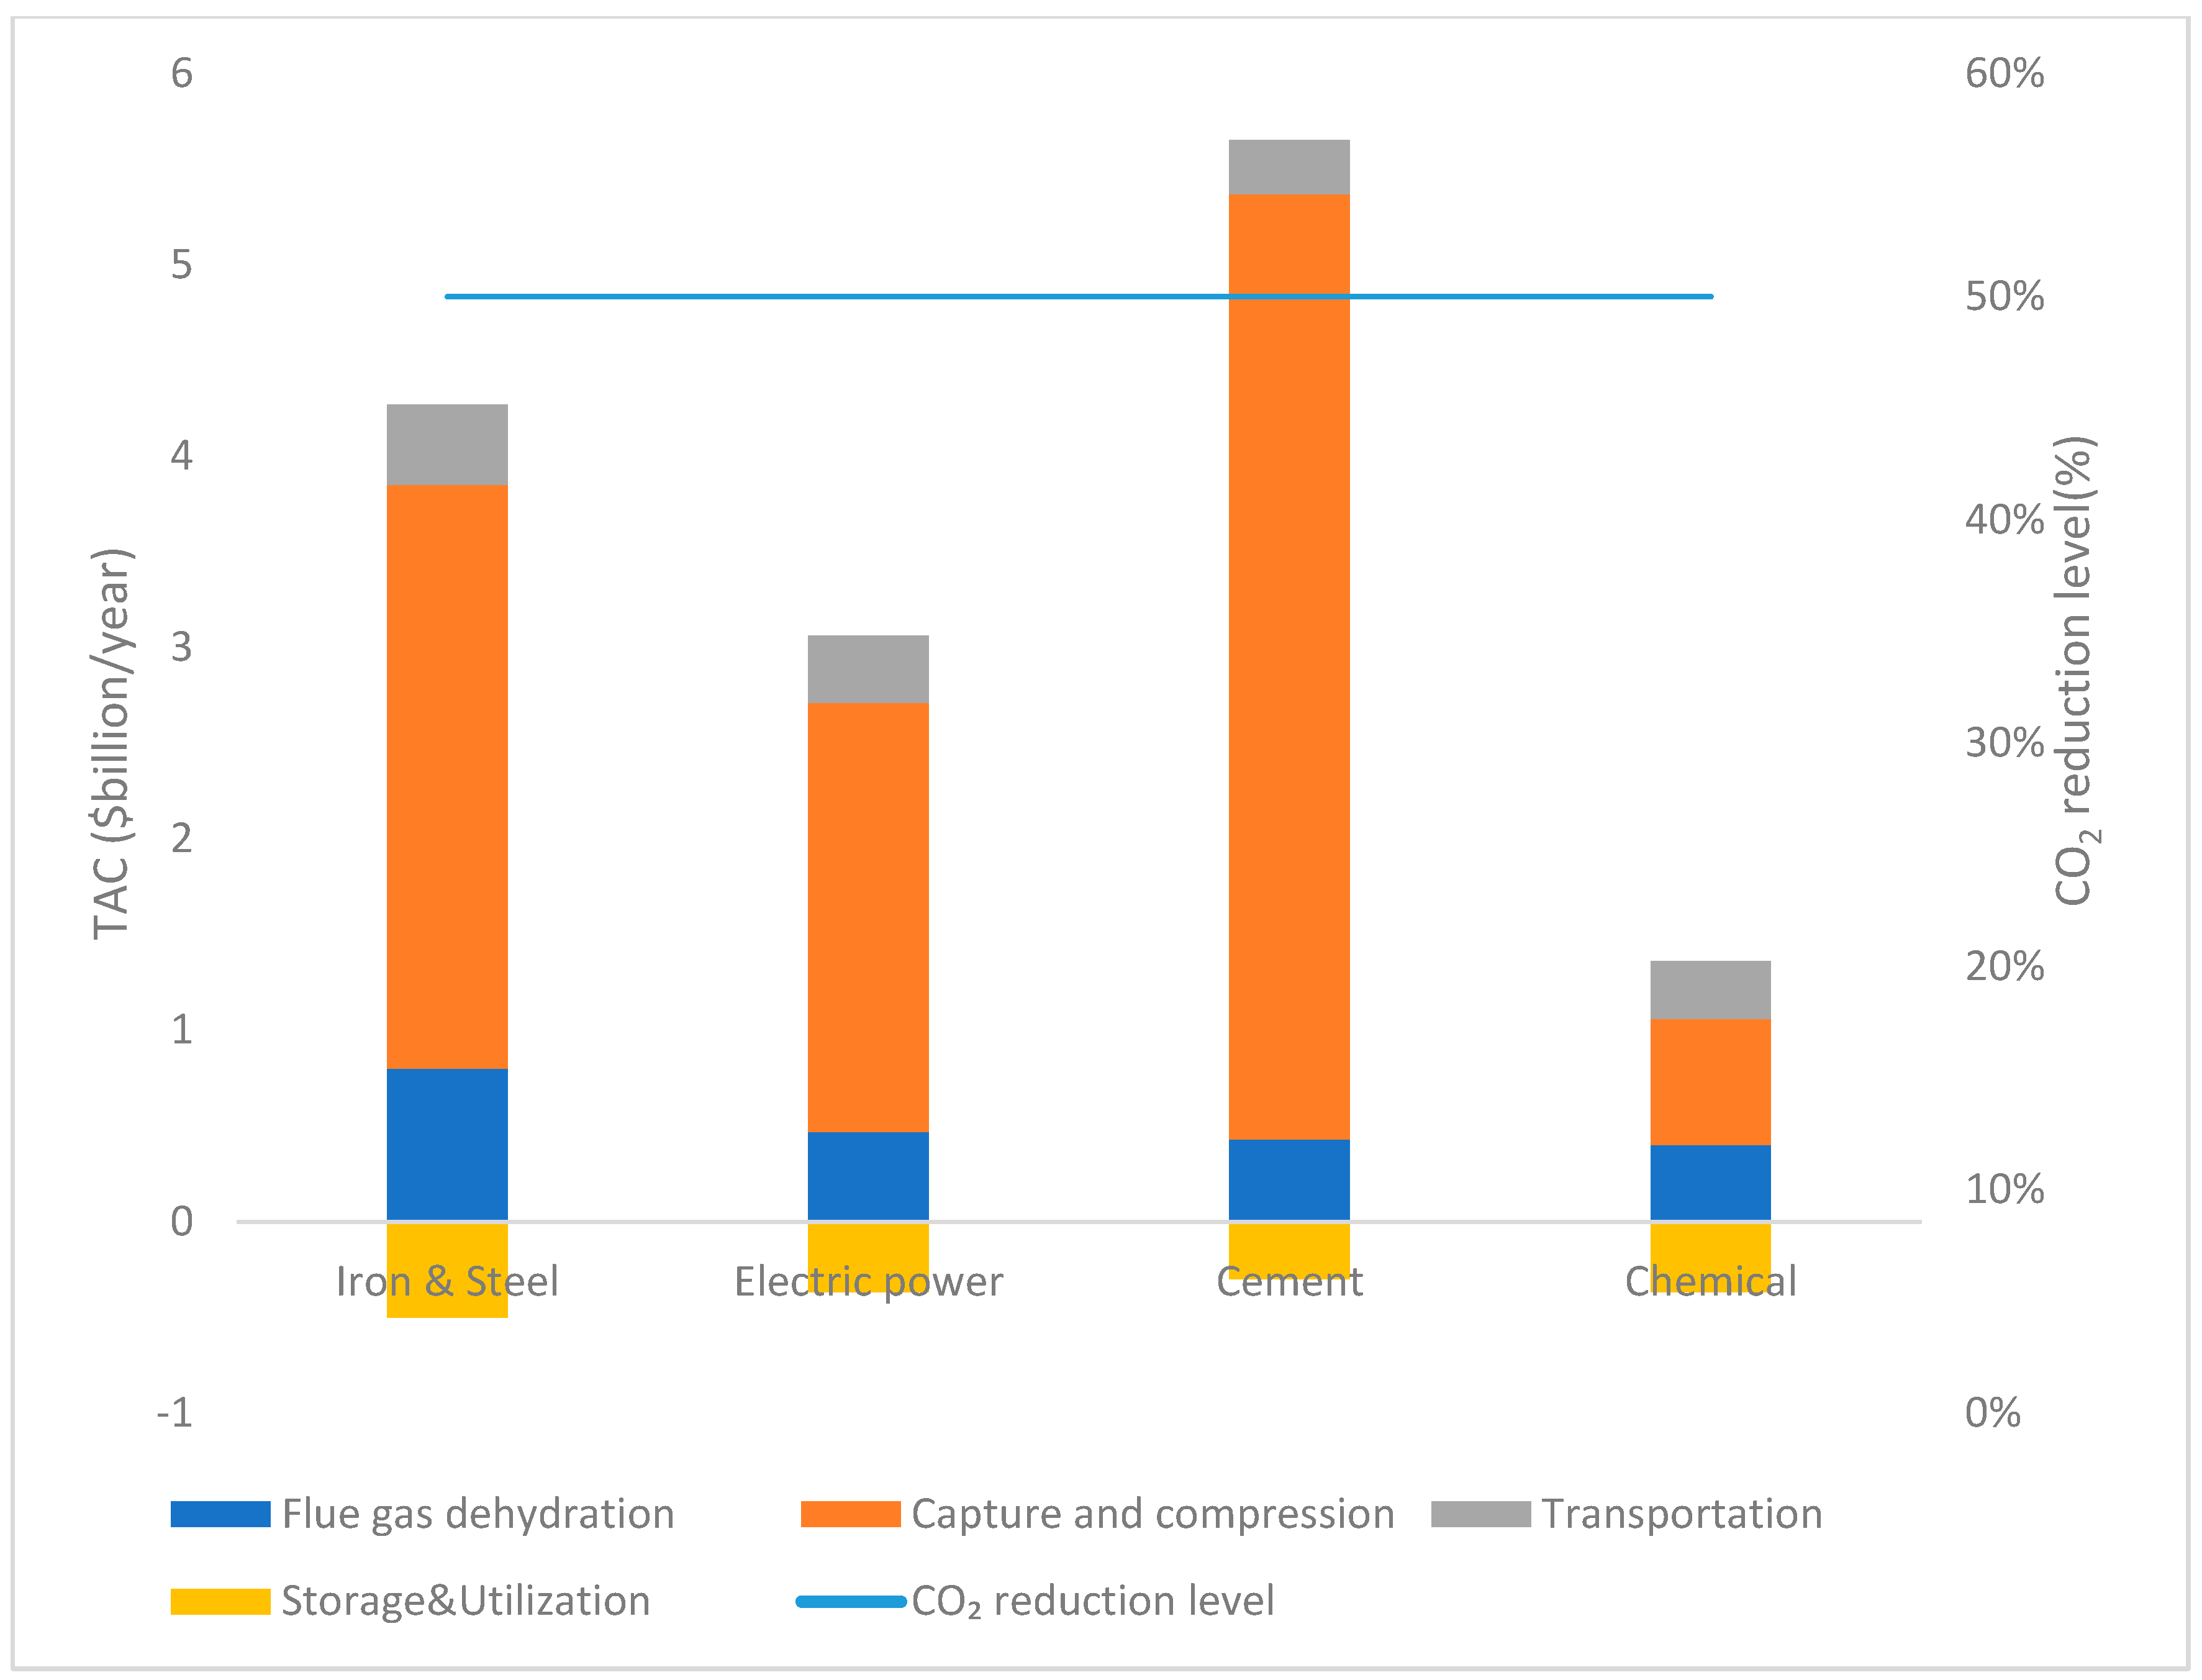
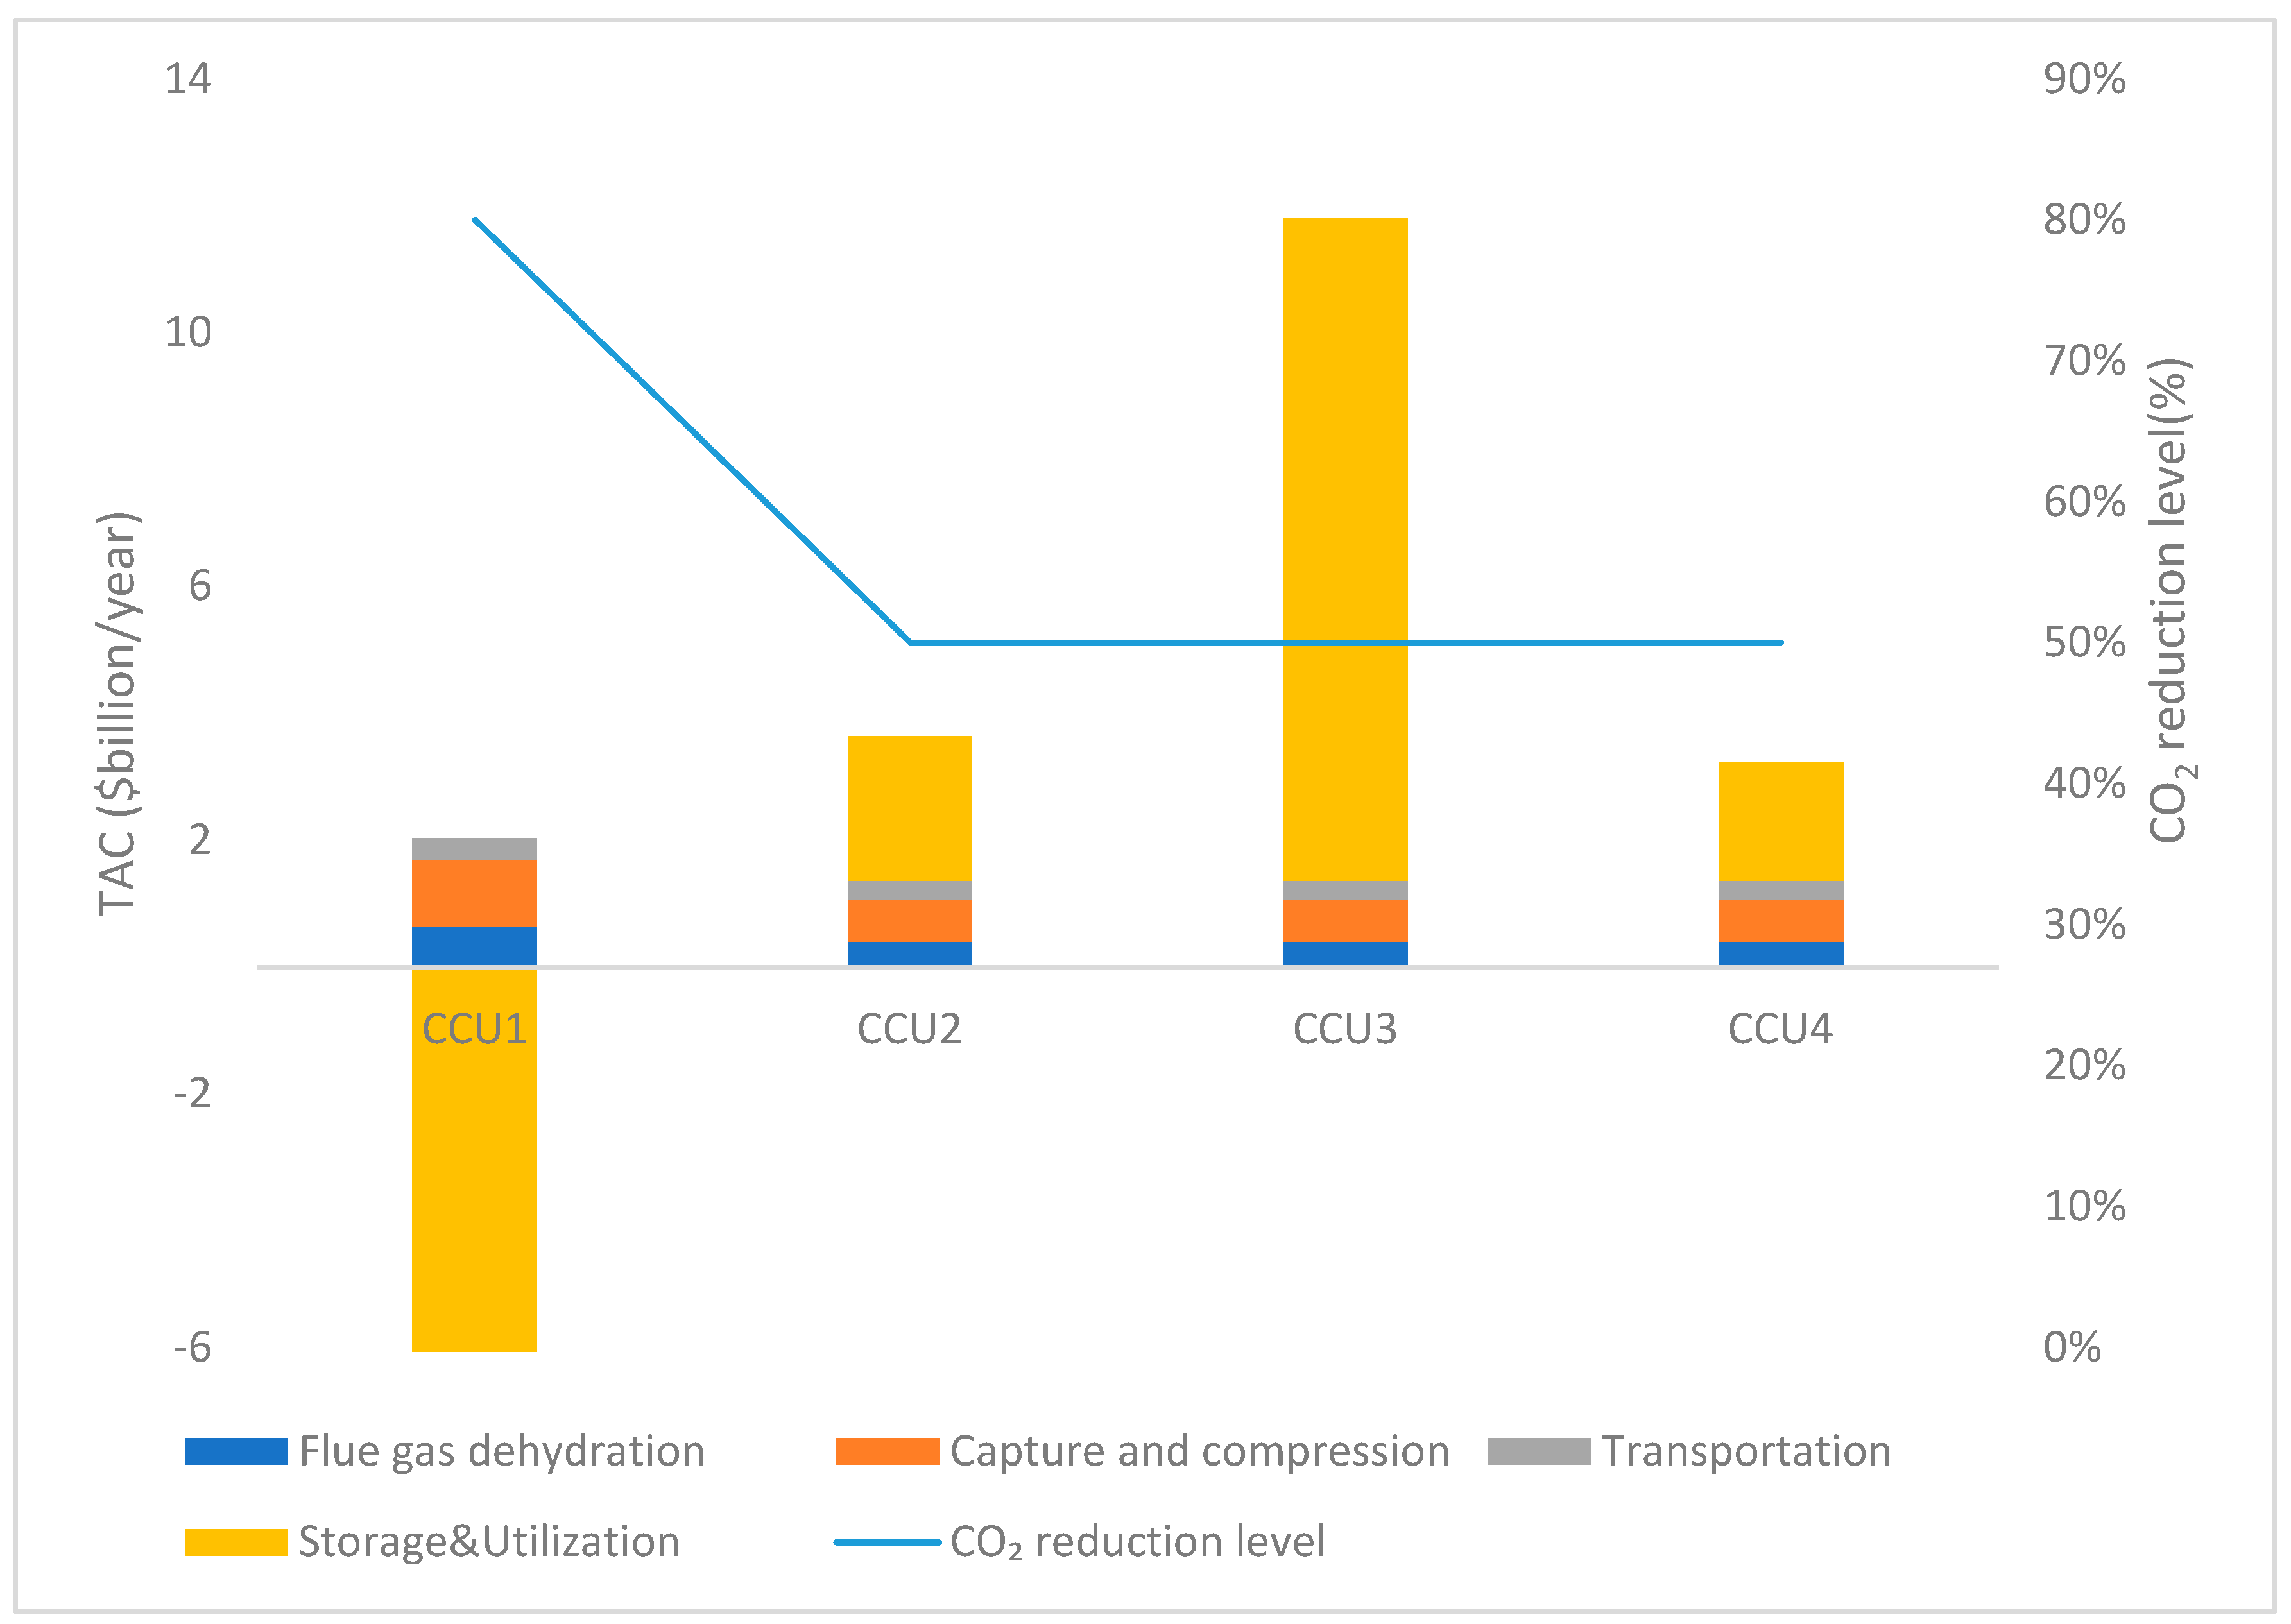
For CCU, 10 carbon sources and four utilization methods were considered for each industry, and a total of four CCU systems, CCU1, CCU2, CCU3, and CCU4, were designed and optimized separately to achieve at least 50% of the emission reduction target. The optimized cost structure and emission reduction effects are shown in Figure 5, Figure 6, Figure 7 and Figure 8.
Regarding cost structure, dehydration, and transportation costs were low in all industries. For capture and compression, the cost of this stage constitutes a major part of the total cost of CCU. Capture costs in the four CCU systems are from USD 3.67 to 5.85 billion for the steel industry, from USD 2.24 to 3.58 billion for the power industry, USD 4.94 billion for both cement industries, and from USD 0.66 to 1.05 billion for the chemical industry. The cost of capture compression varies from industry to industry mainly because the cost of capture is proportional to the purity of the gas, as reported elsewhere in the literature [27]. The chemical industry is a high-concentration emission source with the lowest capture costs. Steel, power, and cement are all low-concentration emission sources. The capture process is complex, and the capture cost is high. On the utilization side, utilization costs in the steel industry ranged from USD −9.2 to USD 15.1 billion, in the power industry from USD −7.2 to USD 12.3 billion, in the cement industry from USD −4.2 to USD 11.3 billion, and in the chemical industry from USD −6.1 to USD 10.5 billion. We can see that the steel industry has the highest utilization cost, and the chemical industry has the lowest utilization cost, mainly because of the difference in their emissions. From the emission reduction effect perspective, the steel, power, and chemical industries’ emission reduction effects are similar. The CCU1, mainly used for urea production, achieved an 80% reduction, and the CCU2, CCU3, and CCU4 achieved 50% reductions. From the above analysis, it is clear that the various uses of CO2 are also options for multiple industries and that some mature technologies will reduce costs and meet minimum reduction targets, increasing the incentive for companies to invest [44].

4.3. Comparison of CCS and CCU Optimization Results

Figure 9 shows the cost comparison of the five CO2 utilization pathways for each industry.
As can be seen from the graph, the CCU1 with urea production as the CO2 utilization method is the best choice for all industries. The cost range for the CCU1 in the steel, power, and chemical industries, where urea production is utilized, is from USD −4.45 billion to USD −2.4 billion, indicating a positive gain for the system. The cement industry did not achieve a positive gain; however, it reduced the unit emission reduction cost from USD 123.72 to USD 29.14. This is because urea production is currently at a high level of technological maturity with 140 metric tons of CO2 available to produce 200 metric tons of urea per year [45]. In addition, CCS also achieves great economics and can be used as a second option, with unit emission reduction costs ranging from USD 21.7 to USD 123.72 and with all four sectors achieving 50% of their emission reduction targets. This is because the CCS project is not overly technically challenging and is supported by the scientific and technical achievements of modern chemical engineering and geological mining engineering. Otherwise, the costs of the CCU2 for methanol production and the CCU4 for cement curing are not very different, with average prices ranging from USD 86.28to USD 187.25, and from USD 75.17 to USD 176.26, respectively, because the methanol production and cement curing technologies have the same maturity level (TRL7-8) [40]. Finally, the CCU3, based on microalgae cultivation, has the highest costs in each sector, with average prices ranging from USD 297.34 to USD 398.14. This is because cultivating microalgae requires large amounts of land, and wet microalgae require high energy during harvesting and drying, increasing production costs.
Based on the above analysis, the CCU1 with urea production is the best-recommended solution for each industry for Shanxi. Although CCS is currently the second choice, it is not sustainable; regardless of the capacity of the storage node, the storage sites will be filled up at a certain time and, in any case, utilization will be required [44]. Therefore, with the development of carbon utilization technology, Shanxi is more likely to achieve the dual carbon target as soon as possible.

5. Conclusions and Policy Suggestion

5.1. Conclusions

This paper proposes a mixed-integer linear programming (MILP) model based on CO2 emission sources, CO2 pipeline transportation, CO2 intermediate nodes, and CO2 storage and utilization nodes. We selected four sectors, i.e., steel, power, cement, and chemical, and we considered four types of CO2 utilization for urea production, methanol production, microalgae cultivation, cement curing, and two types of storage methods. The model compared five cost-effective CCS and CCU systems designed and optimized for each industry. The main findings are as follows:
(1)
The lowest unit abatement cost was urea production compared to other utilization methods, ranging approximately from 71.86 USD/ton CO2 to 29.14 USD/ton CO2, and all four sectors achieved 50% of their abatement targets. Therefore, this utilization pathway is the primary choice for all industries.
(2)
CCS projects can also achieve helpful economic and environmental returns until other CO2 utilization technologies mature.
(3)
The costs of the CCU2, CCU3, and CCU4 systems are much higher than those of the CCS and CCU1 systems. It was also found that there is little difference between the cost of CCU4 and that of CCU2, and the CO2 utilization pathway of microalgae cultivation is most costly, which faces several challenges in terms of capital, technology, and land.

5.2. Policy Recommendations

Governments must work to build a CCUS project and facilitate its commercial deployment.
(1)
Improve process equipment and explore new cutting-edge technologies in capture, such as negative emission technology of CCS/CCU coupled with new energy and new technology systems combined with hydrogen energy technology.
(2)
The CO2 utilization industry requires clear government guidance and industrial policy support. The government must set up a national industry-academia-research technology demonstration platform, increase scientific and technological research and financial support for CO2 utilization technology, and improve the CO2 utilization rate.
(3)
Further promotion of the CCUS projects integration demonstration is an important part of its scale development. The government should accelerate cluster infrastructure construction for CCUS and support the construction of CCUS industrial demonstration zones in high-carbon industries such as steel, cement, and chemical industries.
The findings of this paper provide theoretical guidance for other regions with the same characteristics to deploy CCUS programs in various industries. In the future, the CCUS program can be evaluated from a more integrated perspective by focusing on social benefits (e.g., employment), environmental benefits (e.g., CO2 reduction efficiency), and sustainable benefits (e.g., annual growth rate of research funding).

Author Contributions

Conceptualization, W.Z. and L.P.; methodology, W.Z.; software, W.Z.; analysis and interpretation of the results, W.Z.; data curation, W.Z.; writing—original draft preparation, W.Z.; writing—review and editing, L.P. and X.M.; supervision, L.P. and X.M. All authors have read and agreed to the published version of the manuscript.

Funding

The authors gratefully acknowledge the funding from the Science and Technology Commission of Shanghai Municipality (Grant No. 23ZR1444300, 21692105000) and the National Natural Science Foundation of China (Program No. 71704110).

Institutional Review Board Statement

Not applicable.

Informed Consent Statement

Not applicable.

Data Availability Statement

Not applicable.

Conflicts of Interest

The authors declare no conflict of interest.

Nomenclature

Acronyms D g g Distance from node g’ to g
CCUS Carbon capture, utilization, and storage L a t g  Latitude of site g
CCS Carbon capture and storage L o n g g  Longitude of site g
CCU Carbon capture and utilization F T  Terrain factor
CO2-ECBM CO2-enhanced coalbed methane recovery C c a p i  Unit capture cost at source node i
CO2-EOR CO2-enhanced oil recoveryVariables
GHG  Greenhouse gas c i  CO2 captured at the source node i
30.60 Peak carbon emissions by 2030 and carbon neutrality by 2060 F L g g  Flow rate of CO2 transported from node g’ to node g
Sets u j  CO2 flow rate at storage node j
I Set of carbon dioxide emission sources C C i  Carbon capture cost at source node i
J Set of carbon sink nodes P I C g g  Pipeline capital costs between node g’ and node g
T Intermediate nodes P O C g g  Pipeline operating costs between node g’ and node g
G Set of all the nodes (including I, J, and T) S C j  Storage cost at storage node j
Parameters V C j  Variable unit cost at storage node j
C M min  Minimum reduction target (million tons per year) F C j  Fixed cost at storage node j
E i  Total CO2 emissions per source (million tons per year) C R j  CO2 utilization benefit
S j  Maximum capacity of storage or utilized nodes (million tons) C D C i  Dehydration cost at source node i
T H  CCUS life cycle (years) u g  Amount of CO2 utilized or sequestered at node g
O & M p i p e l i n e  Pipeline operation and maintenance percentage factor for CO2 c g  CO2 captured at node g
z g g  1 if CO2 is transported from g to g’, 0 otherwise

References

  1. Wen, H.W.; Liang, W.T.; Lee, C.-C. China’s progress toward sustainable development in pursuit of carbon neutrality: Regional differences and dynamic evolution. Environ. Impact Assess. Rev. 2023, 98, 106959. [Google Scholar] [CrossRef]
  2. Van der Hoeven, M. CO2 Emissions from Fuel Combustion Highlights; International Energy Agency: Paris, France, 2014; pp. 1–134. [Google Scholar]
  3. IEA. CO2 Emissions from Fuel Combustion—Highlights; IEA: Paris, France, 2016. [Google Scholar]
  4. Li, Z.; Lin, B.; Luan, R. Impact assessment of clean air action on total factor energy productivity: A three-dimensional analysis. Environ. Impact Assess. Rev. 2022, 93, 106745. [Google Scholar] [CrossRef]
  5. Bu, Y.; Wang, E.; Qiu, Y.; Möst, D. Impact assessment of population migration on energy consumption and carbon emissions in China: A spatial econometric investigation. Environ. Impact Assess. Rev. 2022, 93, 106744. [Google Scholar] [CrossRef]
  6. Li, Q.; Zhao, D.; Yin, J.; Zhou, X.; Li, Y.; Chi, P.; Han, Y.; Ansari, U.; Cheng, Y. Sediment Instability Caused by Gas Production from Hydrate-bearing Sediment in Northern South China Sea by Horizontal Wellbore: Evolution and Mechanism. Nat. Resour. Res. 2023, 32, 1595–1620. [Google Scholar] [CrossRef]
  7. Li, Q.; Zhang, C.; Yang, Y.; Ansari, U.; Han, Y.; Li, X.; Cheng, Y. Preliminary experimental investigation on long-term fracture conductivity for evaluating the feasibility and efficiency of fracturing operation in offshore hydrate-bearing sediments. Ocean Eng. 2023, 281, 114949. [Google Scholar] [CrossRef]
  8. Sepehri, A.; Sarrafzadeh, M.H. Activity enhancement of ammonia-oxidizing bacteria and nitrite-oxidizing bacteria in activated sludge process: Metabolite reduction and CO2 mitigation intensification process. Appl. Water Sci. 2019, 9, 131. [Google Scholar] [CrossRef]
  9. IEA. Energy Technology Perspectives 2020; IEA: Paris, France, 2020. [Google Scholar]
  10. Huang, X.; Sun, Y.; Xu, Z.; Xue, Y.; Wang, Z.; Cai, H. Techno-economic Performance of Wind and Coal-fired Power with CCS Joint Planning. J. Energy Procedia 2017, 114, 6677–6684. [Google Scholar]
  11. Hong, W.Y. A techno-economic review on carbon capture, utilisation and storage systems for achieving a net-zero CO2 emissions future. Carbon Capture Sci. Technol. 2022, 3, 100044. [Google Scholar] [CrossRef]
  12. Lee, H.; Lee, J.; Koo, Y. Economic impacts of carbon capture and storage on the steel industry—A hybrid energy system model incorporating technological change. Appl. Energy 2022, 317, 119–208. [Google Scholar] [CrossRef]
  13. Bellotti, D.; Sorce, A.; Rivarolo, M.; Magistri, L. Techno-economic analysis for the integration of a power to fuel system with a CCS coal power plant. J. CO2 Util. 2019, 33, 262–272. [Google Scholar] [CrossRef]
  14. Aziz, E.A.; Alwi, S.R.W.; Lim, J.S.; Manan, Z.A.; Klemeš, J.J. An integrated Pinch Analysis framework for low CO2 emissions industrial site planning. J. Clean. Prod. 2017, 146, 125–138. [Google Scholar] [CrossRef]
  15. Tan, R.R.; Aviso, K.B.; Foo, D.C.Y. P-graph and Monte Carlo simulation approach to planning carbon management networks. Comput. Chem. Eng. 2017, 106, 872–882. [Google Scholar] [CrossRef]
  16. Leonzio, G.; Bogle, D.; Foscolo, P.U.; Zondervan, E. Optimization of CCUS supply chains in the UK: A strategic role for emissions reduction. Chem. Eng. Res. Des. 2020, 155, 211–228. [Google Scholar] [CrossRef]
  17. Zhang, S.; Zhuang, Y.; Tao, R.; Liu, L.; Zhang, L.; Du, J. Multi-objective optimization for the deployment of carbon capture utilization and storage supply chain considering economic and environmental performance. J. Clean. Prod. 2020, 270, 122481. [Google Scholar] [CrossRef]
  18. Chauvy, R.; Lepore, R.; Fortemps, P.; De Weireld, G. Comparison of multi-criteria decision-analysis methods for selecting carbon dioxide utilization products. Sustain. Prod. Consum. 2020, 24, 194–210. [Google Scholar] [CrossRef]
  19. Cui, X.; Zhuang, Y.; Dong, H.; Du, J. Multi-criteria screening of carbon dioxide utilization products combined with process optimization and evaluation. Fuel 2022, 328, 125319. [Google Scholar] [CrossRef]
  20. Lee, C.T.; Tsai, C.C.; Wu, P.J.; Yu, B.Y.; Lin, S.T. Screening of CO2 utilization routes from process simulation: Design, optimization, environmental and techno-economic analysis. J. CO2 Util. 2021, 53, 101722. [Google Scholar] [CrossRef]
  21. Do, T.N.; Chung, H.; Lee, Y.; Kim, C.; Kim, B.; Kim, J. Optimization-based framework for technical, economic, and environmental performance assessment of CO2 utilization strategies. IFAC-PapersOnLine 2022, 55, 412–417. [Google Scholar] [CrossRef]
  22. Zhao, X.; Lu, W.; Wang, W.; Hu, S. The impact of carbon emission trading on green innovation of China’s power industry. Environ. Impact Assess. Rev. 2023, 99, 107040. [Google Scholar]
  23. Zhang, J.; Shen, J.; Xu, L.; Zhang, Q. The CO2 emission reduction path towards carbon neutrality in the Chinese steel industry: A review. Environ. Impact Assess. Rev. 2023, 99, 107017. [Google Scholar] [CrossRef]
  24. Yang, Q.; Sun, Y.Q.; Zhou, H.W.; Ling, C. Research review of carbon capture, utilization and storage technology in China’s typical industries. Huazhong Univ. Sci. Technol. (Nat. Sci. Ed.) 2023, 51, 101–110+145. (In Chinese) [Google Scholar]
  25. Ravi, N.K.; Annaland MV, S.; Fransoo, J.C.; Grievink, J.; Zondervan, E. Development and implementation of supply chain optimization framework for CO2 capture and storage in The Netherlands. Comput. Chem. Eng. 2017, 102, 40–51. [Google Scholar] [CrossRef]
  26. Zhang, S.; Liu, L.; Zhang, L.; Zhuang, Y.; Du, J. An optimization model for carbon capture utilization and storage supply chain: A case study in Northeastern China. Appl. Energy 2018, 231, 194–206. [Google Scholar] [CrossRef]
  27. Hasan, M.F.; First, E.L.; Boukouvala, F.; Floudas, C.A. A multi-scale framework for CO2 capture, utilization, and sequestration: CCUS and CCU. Comput. Chem. Eng. 2015, 81, 2–21. [Google Scholar] [CrossRef]
  28. Hasan, M.F.; Boukouvala, F.; First, E.L.; Floudas, C.A. Nationwide, Regional and Statewide CO2 Capture, Utilization and Sequestration Supply Chain Network Optimization. Ind. Eng. Chem. Res. 2014, 53, 7489–7506. [Google Scholar] [CrossRef]
  29. Ağralı, S.; Üçtuğ, F.G.; Türkmen, B.A. An optimization model for carbon capture & storage/utilization vs. carbon trading: A case study of fossil-fired power plants in Turkey. J. Environ. Manag. 2018, 215, 305–315. [Google Scholar]
  30. Simbeck, D.; Beecy, D. The CCS Paradox: The Much Higher CO2 Avoidance Costs of Existing versus New Fossil Fuel Power Plants. Energy Procedia 2011, 04, 1917–1924. [Google Scholar] [CrossRef]
  31. GCCSI. Global Costs of Carbon Capture and Storage; Global CCS Institute: Melbourne, VIC, Australia, 2017. [Google Scholar]
  32. Serpa, J.; Morbee, J.; Tzimas, E. Technical and Economic Characteristics of a CO2 Transmission Pipeline Infrastructure; Publications Office of the European Union: Luxembourg, 2011. [Google Scholar]
  33. Broek, M.V.D.; Brederode, E.; Ramírez, A.; Kramers, L.; Kuip, M.V.D.; Wildenborg, T.; Turkenburg, W.; Faaij, A. Environmental modelling & software designing a cost-effective CO2 storage infrastructure using a GIS based linear optimization energy model. Environ. Modell. Softw. 2010, 25, 1754–1768. [Google Scholar]
  34. Dahowski, R.; Dooley, J.; Davidson, C.; Bachu, S.; Gupta, N. A CO2 Storage Supply Curve for North America.upta, N. In Proceedings of the 7 International Conference on Greenhouse Gas Control Technologies, Vancouver, BC, Canada, 5–9 September 2004. [Google Scholar]
  35. Knoope, M.M.J.; Ramírez, A.; Faaij, A.P.C. A state-of-the-art review of techno-economic models predicting the costs of CO2 pipeline transport. Int. J. Greenh. Gas Control 2013, 16, 241–270. [Google Scholar] [CrossRef]
  36. Wang, Z.; Luo, Y.Y.; Kuang, J.C.; Mao, Y.N. Source-sink matching and optimization of CCS for large coal-fired power plants in China. Ind. Eng. Manag. 2016, 21, 75–83+89. (In Chinese) [Google Scholar]
  37. Zero Emission Platform. The Costs of CO2 Capture, Transport and Storage; Post-Demonstration CCS in the EU; European Technology Platform for Zero Emission Fossil Fuel Power Plants: Brussels, Belgium, 2011. [Google Scholar]
  38. Patricio, J.; Angelis-Dimakis, A.; Castillo-Castillo, A.; Kalmykova, Y.; Rosado, L. Method to identify opportunities for CCU at regional level—Matching sources and receivers. J. CO2 Util. 2017, 22, 330–345. [Google Scholar] [CrossRef]
  39. Douskova, I.; Doucha, J.; Livansky, K.; Machat, J.; Novak, P.; Umysova, D.; Zachleder, V.; Vitova, M. Simultaneous flue gas bioremediation and reduction of microalgal biomass production costs. Environ. Biotechnol. 2009, 82, 179–185. [Google Scholar] [CrossRef] [PubMed]
  40. Hepburn, C.; Adlen, E.; Beddington, J.; Carter, E.A.; Fuss, S.; Mac Dowell, N.; Minx, J.C.; Smith, P.; Williams, C.K. The technological and economic prospects for CO2 utilization and removal. Nature 2019, 575, 87–97. [Google Scholar] [CrossRef] [PubMed]
  41. D’Amore, F.; Mocellin, P.; Vianello, C.; Maschio, G.; Bezzo, F. Economic optimisation of European supply chains for CO2 capture, transport and sequestration, including societal risk analysis and risk mitigation measures. Appl. Energy 2018, 223, 401–415. [Google Scholar] [CrossRef]
  42. Hou, L.; Niu, Y.; Wu, G.; Tian, J.; Zhang, Y.; Liu, J.; Zhang, X.; Jiang, J.; Cheng, S.; Pei, Z. Site Selection of Carbon Capture, Utilization and Storage Technology Application in Shanxi. Environ. Sustain. Dev. 2016, 41, 83–85. [Google Scholar]
  43. Zhang, B.; Liang, K.Q.; Wang, W.B.; Chen, L.L.; Wang, H. Evaluation of Effective CO2 Geological Sequestration Potential of Deep Saline Aquifer in Ordos Basin. Unconv. Oil Gas 2019, 6, 15–20. (In Chinese) [Google Scholar]
  44. Leonzio, G.; Foscolo, P.U.; Zondervan, E. Sustainable utilization and storage of carbon dioxide: Analysis and design of an innovative supply chain. Comput. Chem. Eng. 2019, 131, 106569. [Google Scholar] [CrossRef]
  45. Jarvis, S.M.; Samsatli, S. Technologies and infrastructures underpinning future CO2 value chains: A comprehensive review and comparative analysis. Renew. Sustain. Energy Rev. 2018, 85, 46–68. [Google Scholar] [CrossRef]
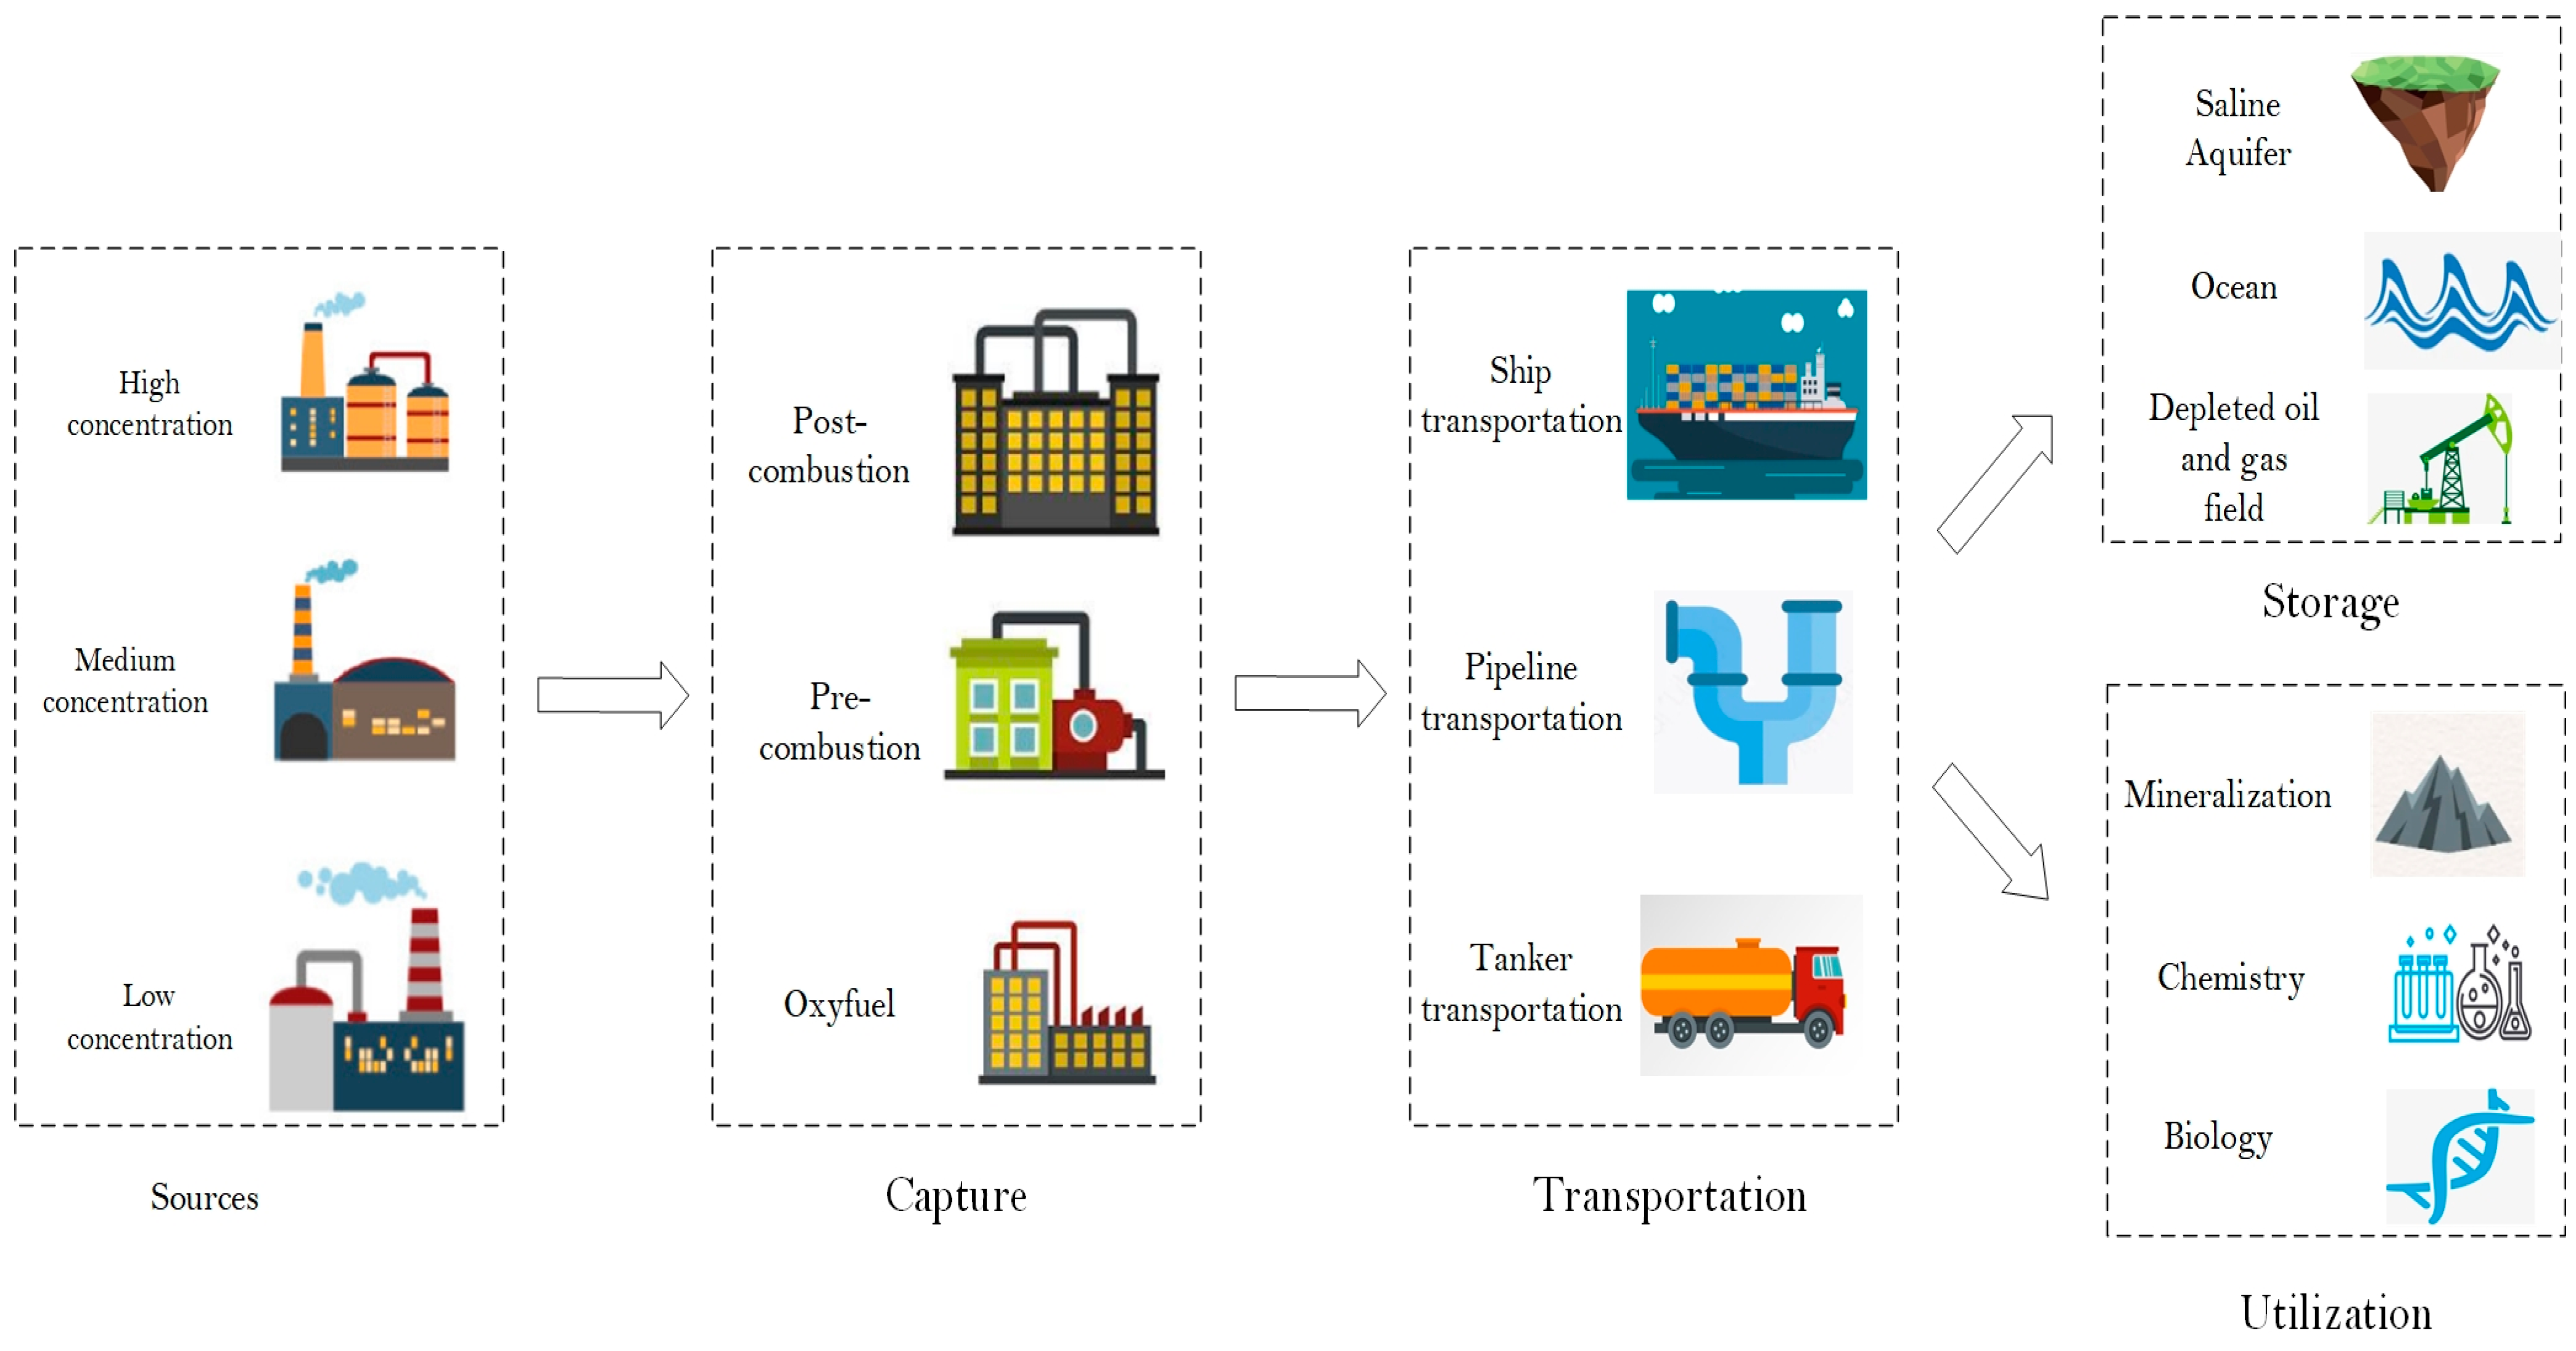
Figure 1. CCUS process.
Sustainability 15 13455 g001
Figure 2. CCUS system model.
Sustainability 15 13455 g002
Figure 3. CCS network optimization for different industries: (a) CCS network optimization for the steel industry; (b) CCS network optimization for the power industry; (c) CCS network optimization for the cement industry; (d) CCS network optimization for the chemical industry.
Sustainability 15 13455 g003
Figure 4. CCS cost structure and reduction effect in various industries.
Sustainability 15 13455 g004
Figure 5. CCU cost structure and reduction effect in the steel industry.
Sustainability 15 13455 g005
Figure 6. CCU cost structure and reduction effect in the power industry.
Sustainability 15 13455 g006
Figure 7. CCU cost structure and reduction effect in the cement industry.
Sustainability 15 13455 g007
Figure 8. CCU cost structure and reduction effect in the chemical industry.
Sustainability 15 13455 g008
Figure 9. Cost comparison of different CO2 utilization pathways by industry.
Sustainability 15 13455 g009
Table 1. Cost of CO2 avoided.
FactoryCost (USD/Ton CO2)
Power60
Iron and steel74
Cement 129
Fertilizer28
Table 2. Reservoirs for storage: type, location, and capacity.
NumberTypeLongitudeLatitudeCapacity
(Million Tons)
1CO2-ECBM112.4539.07164
2CO2-ECBM112.1935.69613
3Saline aquifer109.5336.497883.24
4Saline aquifer110.8539.523315.12
Table 3. Reservoirs for utilization: type, location, and capacity.
NumberTypeLongitudeLatitudeBreak-Even Cost (USD/Ton)
1Urea111.2536.31−99
2Methanol111.0235.6659
3Microalgae11237.09270
4Concrete curing 112.5537.7848
Disclaimer/Publisher’s Note: The statements, opinions and data contained in all publications are solely those of the individual author(s) and contributor(s) and not of MDPI and/or the editor(s). MDPI and/or the editor(s) disclaim responsibility for any injury to people or property resulting from any ideas, methods, instructions or products referred to in the content.