Article

A Comprehensive Study of Assessing Sustainable Agricultural Water Management under Changing Climate Scenarios—A Regional Basis Study in the Western Ghats, India

1
Department of Civil Engineering, Indian Institute of Technology Bombay, Mumbai 400076, India
2
Interdisciplinary Program in Climate Studies, Indian Institute of Technology Bombay, Mumbai 400076, India
*
Author to whom correspondence should be addressed.
Sustainability 2023, 15(18), 13459; https://doi.org/10.3390/su151813459
Submission received: 17 June 2023 / Revised: 4 September 2023 / Accepted: 5 September 2023 / Published: 8 September 2023

Abstract

:
The Western Ghats (WG) in South India is a biological hotspot with a cluster of small river basins and heterogeneous climate and vegetation patterns, and it is categorized under the water stress region by Central Water Commission (CWC). This study aims to evaluate the effects of climate change and land use/land cover (LULC) transformations on water balance components and irrigation water demand (IWD) across different regions of WG for a future period (2020–2050). The variable infiltration capacity model has been calibrated separately for the upper, middle, and lower regions of WG. Further, climate projections from the CMIP6 experiment (SSP2 45/SSP5 85) have been used for future projections of water balance components. The land use change shows an increase in built-up (5.79%) and a decrease in cultivable land (1.24%) by the end of 2030 from 1995. The combined impact due to climate and LULC change shows that the future rainfall/runoff increases in the lower regions of the basin by 100/36.5 mm/year through SSP 4.5. However, the summer months show an increasing water requirement in the future for the Ghats and Nilgiri regions of the basin. The present regional-based study will be useful for future agriculture water management practices in the region for sustainable development and the study can be extended to other similar regions.

1. Introduction

Agriculture has served as the foundation of the Indian economy, and its significance is expected to persist for a considerable duration. In India, the major rainy season is the southwest monsoon season which normally starts in June and ends in September. Additionally, there are several regions where water is not stored effectively during the monsoon season due to several issues like lack of storage infrastructures, maintaining minimum flow, irrigation supply, etc. Other than this, in regions like the Western Ghats with high annual rainfall, often water is released from reservoirs to reduce the chances of floods [1]. However, it is interesting to note that damage caused by droughts increases due to over-dependence on reservoirs, making them vulnerable [2]. If the atmospheric temperature increases by 1 °C with increasing CO2 concentration, it will cause a significant reduction in crop production for Indian agriculture [3]. Thus, it is highly important to focus on future irrigation water requirements regarding increasing population and changing the climate scenarios.
According to prior research, climatic variables such as precipitation and temperature have a significant impact on the growth and progression of vegetation [4]. The comprehensive examination of the extreme climate conditions and vegetation patterns in the present study can aid other researchers in gaining a deeper understanding of the effects of extreme climate on vegetation dynamics. Additionally, this analysis can assist decisionmakers in formulating effective strategies to safeguard vegetation and mitigate the negative consequences associated with extreme climatic conditions. The onset and retreat of the southwest monsoon, along with the restricted inland reach of precipitation, generate pronounced gradients in rainfall intensity and seasonality from south to north and west to east. These factors also impact the duration of the dry season throughout western South India.
In addition to climate change, human-induced land use and land cover (LULC) changes also exert a substantial influence on the hydrological characteristics of river basins [5,6,7,8]. These alterations affect water resource availability and the overall hydrological cycle. Urbanization and agricultural expansion disrupt soil integrity, nutrient fluxes, and irrigation demand, leading to changes in watershed hydrology [9,10]. Factors such as canopy interception, surface roughness, soil properties, infiltration, albedo, and evapotranspiration play a role in the complex interactions that affect surface runoff [11,12]. Additionally, land use changes can affect groundwater levels, leading to reduced groundwater recharge and soil water content, thereby contributing to a decrease in evapotranspiration [13]. Furthermore, the conversion of forests to agricultural lands, driven by population growth, can result in land degradation, soil erosion, reduced productivity, and increased vulnerability to drought [14,15]. Climate change can have significant impacts on the hydrological response of catchments, leading to changes in water availability, streamflow, groundwater recharge, and overall water balance. Understanding the hydrological response of catchments to land use changes is crucial for effective water resource planning and management, especially in the face of increasing water scarcity and increasing crop water demands.
In this paper, the major objective is to estimate the impact of climate change at a regional scale along with its effect on the changing irrigation demand. Apart from the standard studies in this field, the aim is to incorporate the influence of future changing LULC in the hydrology of a region of Western Ghats (WG), South India (Figure 1). The results will give a comprehensive understanding of the seasonal distribution of water demand at a coarser grid scale. By pinpointing the critical areas, decision makers can prioritize and focus their efforts on specific regions that may be more vulnerable to water-related challenges or have higher water demand stresses and adaptation strategies to cope with the changing hydrological conditions. Figure 2 represents the flowchart of the methodology used to obtain the irrigation water demand for the present study for WFRB-2 using the Food and Agriculture Organization (FAO) study report. Further, the paper also tries to estimate the change in water demand for the irrigation needs in the basin on a grid scale for the entire region. Even though the estimates are made on a coarser 25 km spatial grid scale, this will help effective water management practices in the region.

2. Materials and Methods

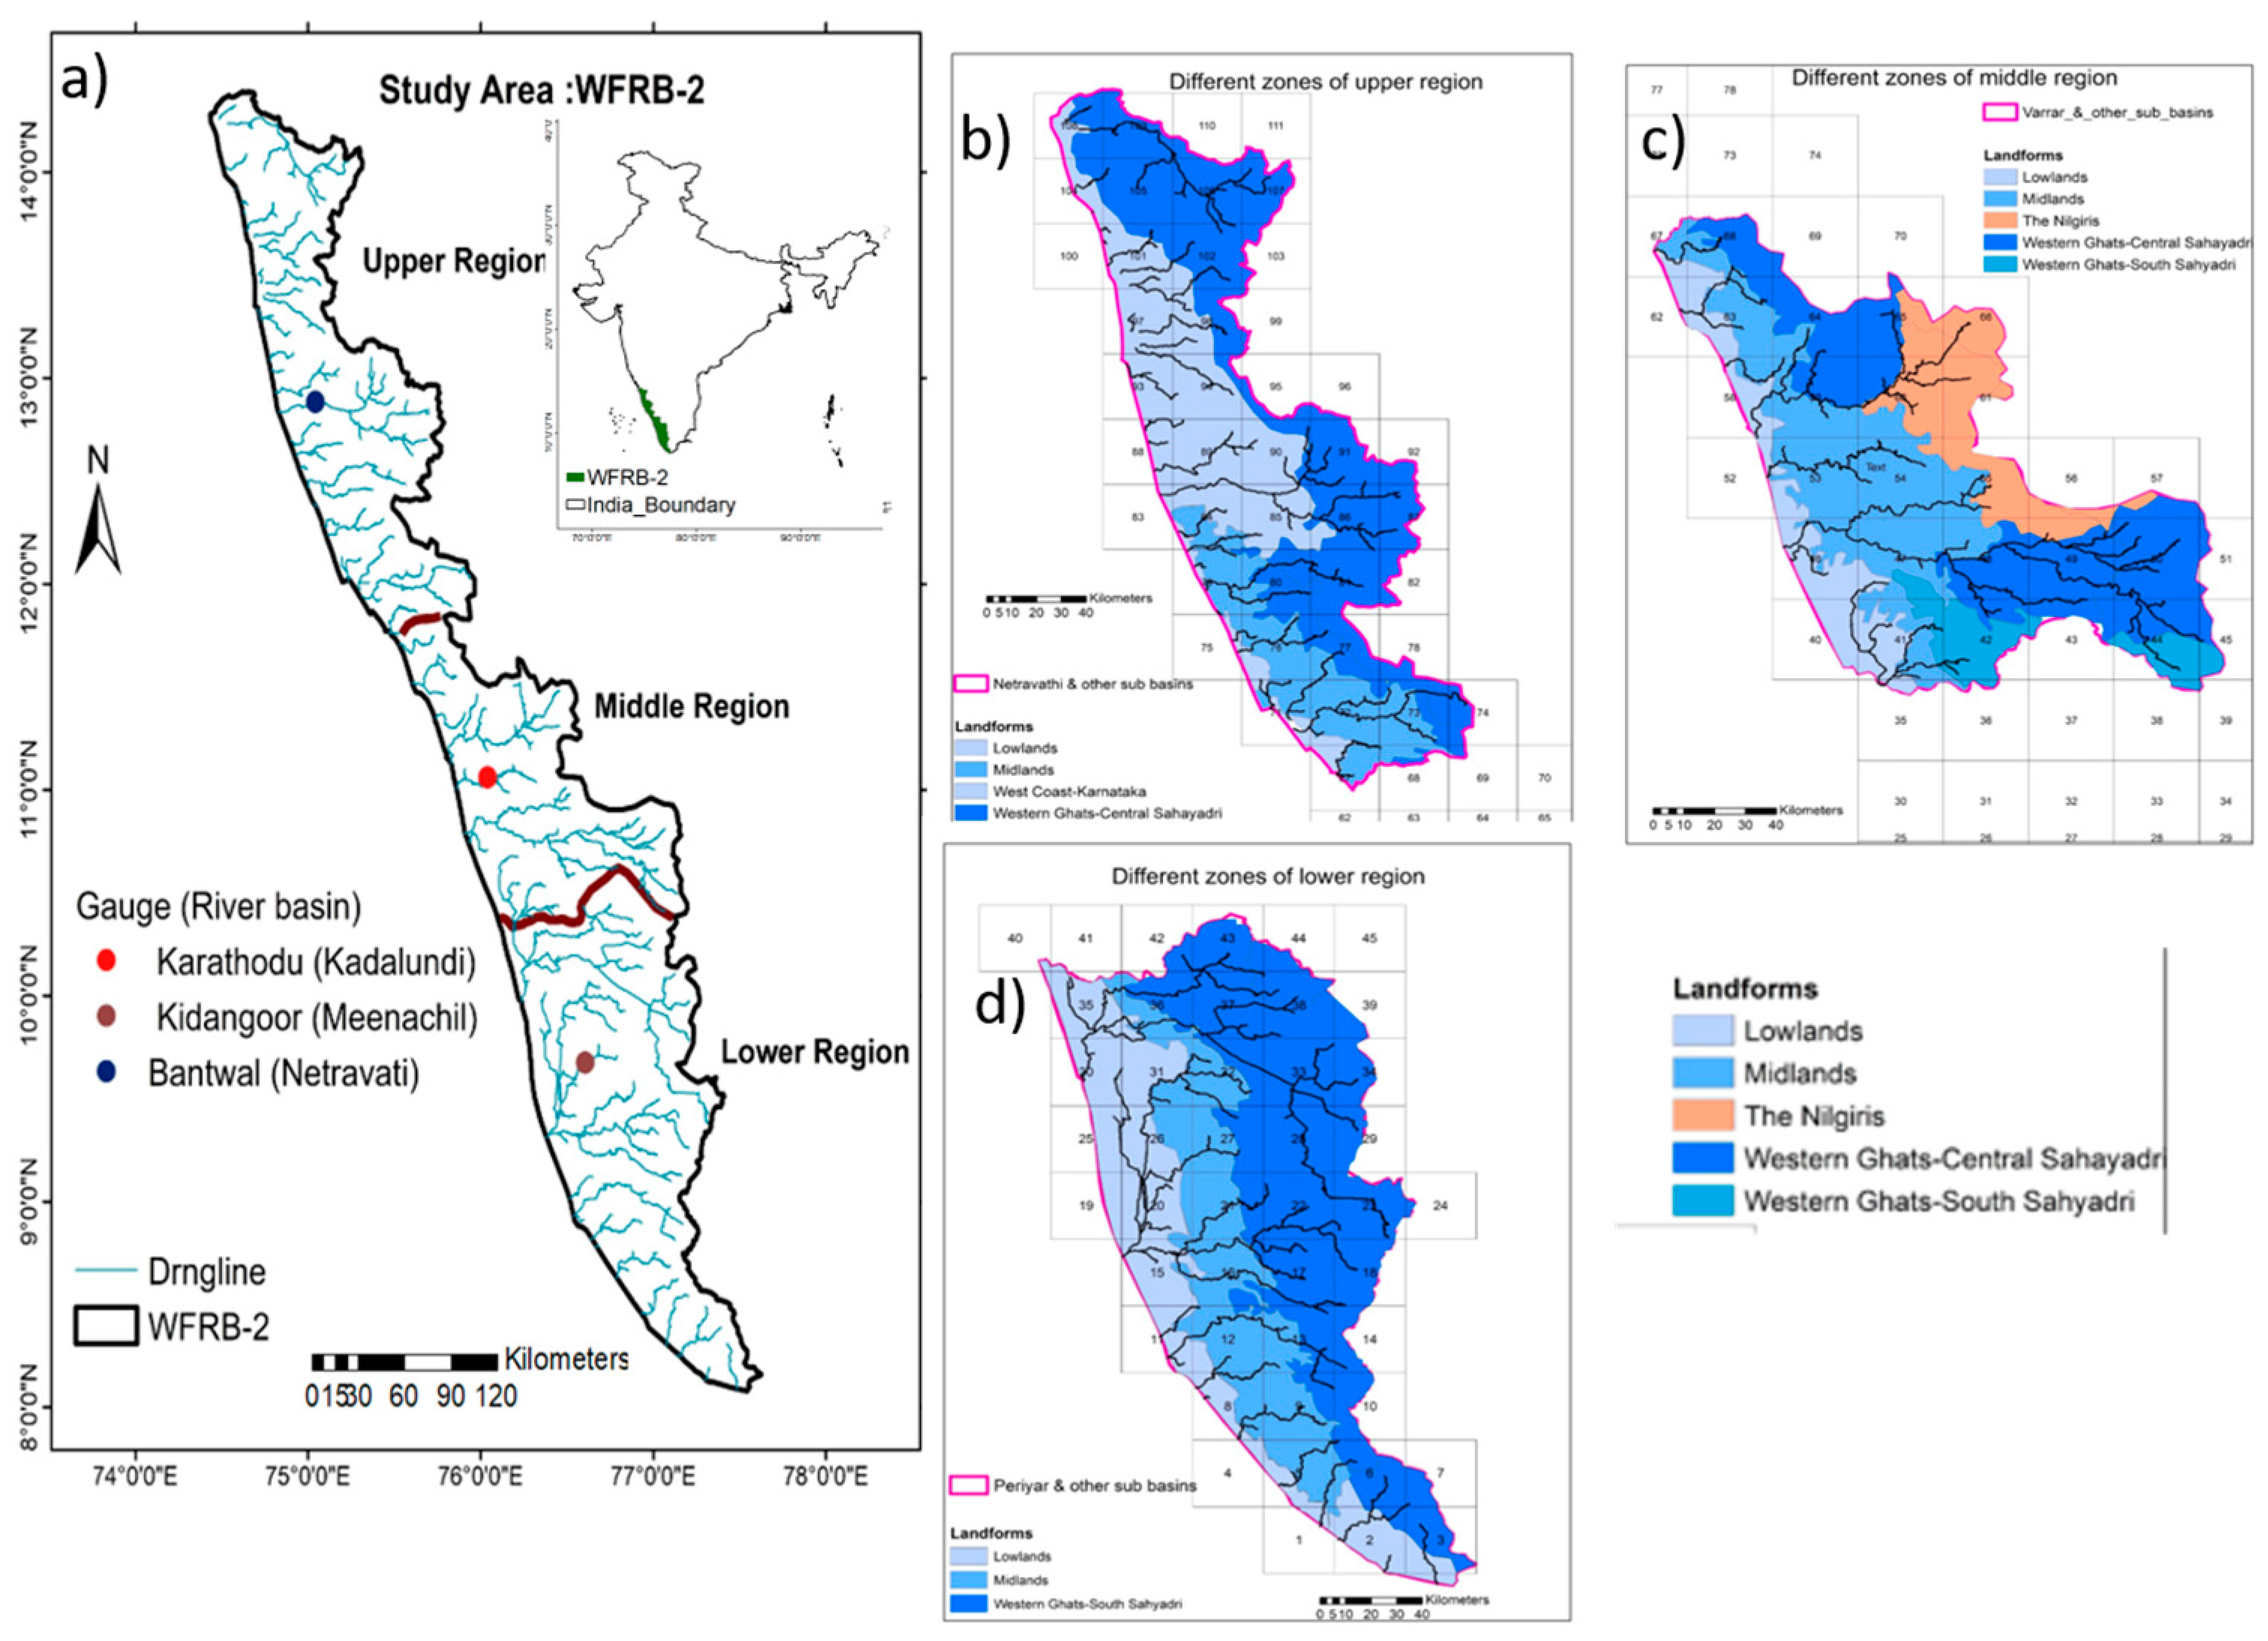
2.1. Study Area and Inputs

The Tadri to Kanyakumari (west flowing river basin—WFRB-2) region is situated from latitudes 8°3′ N to 14°24′ N and longitudes 74°25′ E to 77°36′ E. It is parallel to the Arabian Sea coast and has an extended north–south orientation with a slender east–west profile. The Western Ghats, positioned near India’s western coastline, is recognized as one of the most prominent biodiversity “hotspots” in the tropical regions of the world. Despite covering less than 6% of the country’s land area, it accommodates over 30% of India’s plant and vertebrate species [16]. Due to these remarkable statistics, the biodiversity in the Western Ghats is more vulnerable to human-induced pressures. In addition to this, a macro-level assessment in the Western Ghats has revealed that the species are influenced by seasonal variations [17] and a strong correlation between biodiversity and rainfall patterns has also been reported [18]. The dominant land uses are plantations (P), followed by forest (F), croplands (CL), built-up areas (BUL), wasteland (WL), and water bodies (WB). Around 48% of the basin is covered by plantations, with forests accounting for approximately 28% and croplands around 10%.
The study focuses on the 5.617 million hectares of land falling in the states of Kerala (66.4%), Karnataka (25.42%), Tamil Nadu (8.17%), and Puducherry (0.01%) (Figure 1), where the climate classification is tropical monsoon and tropical savannah with significant spatial and temporal variability in rainfall and temperature. Vast amounts of tea, coffee, and rubber estates are present in the WG regions. There are other plantations and spices which are commonly cultivated as intercrops and other annual crops such as pulses, paddy, vegetables, millets, etc. [19]. Tea, coffee, and rubber plantations are mainly confined to Ghats regions. Coconut, areca nut, and cashew plantations dominate in the lowlands and valleys of WG.
The input data used to analyze the impact of climate change and LULC change are weather data, soil properties, and LULC information. The historical climate variables, such as rainfall and temperature, were obtained from the India Meteorological Department (IMD) for the purpose of calibration and validation of the model. Similarly, the weather data for the future were obtained from Coupled Model Intercomparison Project Phase 6 (CMIP6) general circulation models (GCMs) that were further statistically downscaled for a future period (2020–2050). The elevation data from CARTOSAT DEM and other soil characteristics from the NBSS soil map are used to create the soil parameter file in a variable infiltration capacity (VIC) model. The LULC classification and albedo and leaf area index values are used to prepare the vegetation library file. Similarly, the percentage of LULC classes in each grid and the fraction of roots in the soil zones are used to prepare the vegetation parameter file. The LULC in the WG mainly comprised plantations (52.02%), followed by forests (33.31%), built-up areas (5.21%), water bodies (3.673%), croplands (3.06%), and barren land (2.62%), as observed from the Landsat satellite images (30 m resolution) of the year 2016 (www.earthexplorer.usgs/, accessed on 10 January 2020) post-processed using a supervised maximum likelihood classification technique [8] with a classification accuracy of 92% and a kappa coefficient of 0.87. These results are favorable and within the limits given [20]. The details of the classification method are discussed by Lu and Weng (2007) [21]. Further, the soil types in the WG, based on the classification by the National Bureau of Soil Survey and Land Use Planning (NBSS & LUP), include loamy clay, loamy sand, sandy clay, forest loam, clay, and loam. Table 1 shows the details of the datasets used.

2.2. LULC Projection

The Markov chain-cellular automata (MC-CA) method, known for its effectiveness in capturing trends [13,22,23], was utilized to make future projections about land use and land cover (LULC) patterns. The Land Change Modeler (LCM) is a tool collection within Terrset software version 2018 that enables LULC analysis and modeling, incorporating Markov chain matrices and transition susceptibility maps [24]. The MC-CA model, integrated into LCM, has been widely employed for simulating and forecasting LULC changes.
By comparing two images, the MC-CA algorithm identifies change patterns among land cover types. Analyzing prior and future LULC maps, the Markov model predicts land transitions based on transition potentials. It utilizes the Markovian process to estimate system order and transition probabilities between different land states [24]. To forecast the LULC in 2016, the MC-CA algorithm was applied to the LULC data between 1995 and 2005, using the Land Change Modeler. The LULC data for 1995 and 2005 were obtained from [25] and extracted for the study area. Further, the LCM model was trained using the driving variables that influence land cover changes, along with a multi-layer perceptron artificial neural network (MLP-ANN) to generate the final transition potential maps. The transition potential maps were used to project future scenarios. To validate the model and refine the driving factors, the predicted LULC for 2016 was compared with the classified LULC of 2016. The projection for the future LULC of 2030 was based on the same combination of driver variables used in the LULC of 2005 and 2016.

2.3. VIC Model Description

The variable infiltration capacity model, also known as the VIC model, is essentially a semi-distributed, physically based macroscale hydrological model used on both global and regional scales [26,27,28]. The VIC model finds multiple wide-ranging applications in hydrological studies, which include assessing the impact of climate change, impact studies for LULC change, and simultaneous solving of the energy budget and water budget equations [29].
The present study utilizes the latest version of the VIC model, i.e., VIC-4.2.d with three layers (3L). The consideration of variability in sub-grid soil moisture and baseflow non-linear regression in the study/analysis highlights the advantage of using the VIC model when compared to other available models for such analyses. Furthermore, an explicit description of vegetation obtained in the variable infiltration capacity models by closing the modes for water balance and surface energy acts as an added benefit. Based on a linear transfer function used to extract runoff amounts, the VIC model outputs are applied as inputs in a stand-alone model developed for routing [30].
The calibration of VIC models in the current work pertains to five sensitive parameters [31], i.e., Binf, Dsmax, Ds (fraction), Ws, and soil depths (m). The shape of the infiltration capacity curve is expressed by Binf, the value of which lies between 0 and 0.4. The high runoff infiltration is inversely proportional to Binf and vice versa. The maximum baseflow velocity in the third layer of soil fluctuates between 0 and 40 and is expressed by Dsmax (mm/day). In the case of the start of a non-linear baseflow, the fraction of Dsmax is represented by Ds (fraction), which ranges from 0 to 1. In the regions of non-linear baseflow, i.e., the lowest layer, the maximum soil moisture is denoted by Ws. The value of Ws lies between 0 and 1 but is usually greater than 0.5. When the second and third layers of soil are considered as parameters for calibration, soil depths (m) ranging from 0.1–4.5 m are used.
The calibrated VIC model developed for the entire WFRB-2 [32] is employed to analyze the impacts of climate change and LULC change in the basin region for near-future times. This analysis has been conducted based on specific datasets and related time periods (1981–2010) as follows:
(1)
Baseline: The period 1981–2010 has been taken as the base period for meteorological data of wind, precipitation, and Tmin and the year 2016 has been taken as the base period for LULC data.
(2)
Future Scenario 1: CMIP6 meteorological variable (2020–2050) and LULC data during 2030.
The methodology adopted is shown in the flowchart in Figure 2.

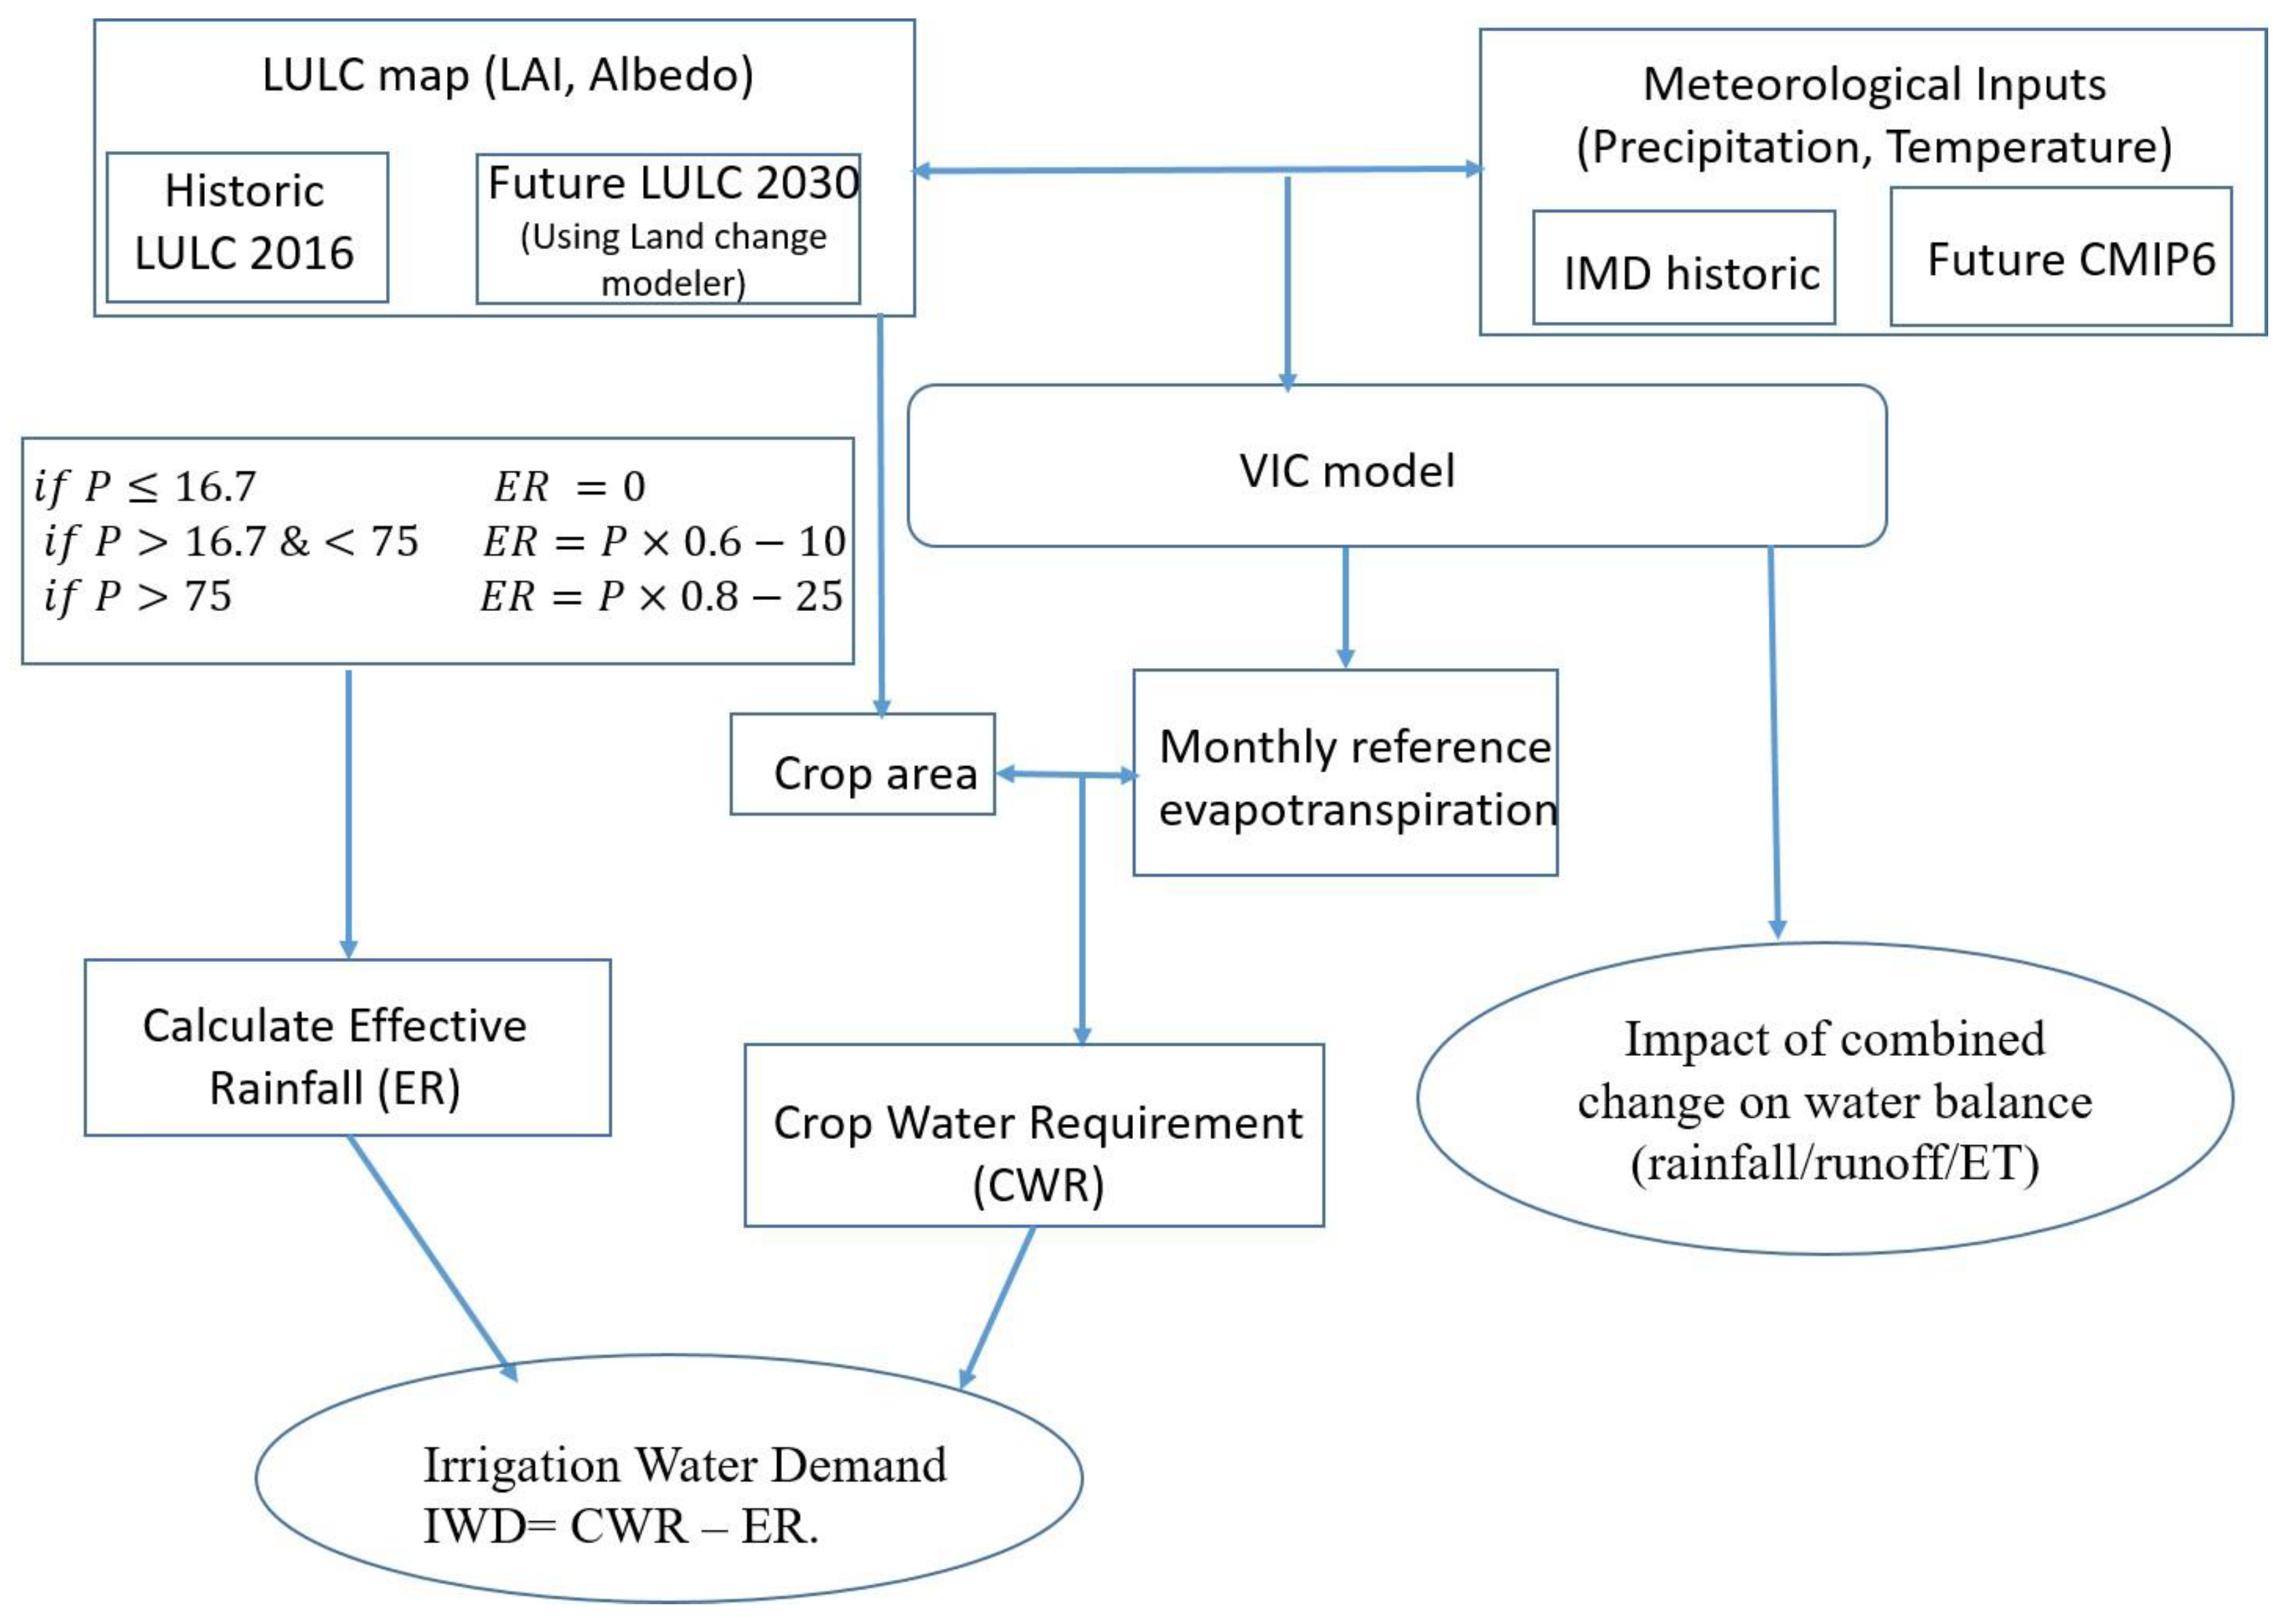
2.4. Estimation of Monthly Water Availability

Rainfall is the prominent source of groundwater and storage water. The rainfall water availability for crop area depends on grid-wise crop area and effective rainfall. Effective rainfall is estimated as the ratio of rainfall which can be made available to plants and crops. In other words, the part of rainfall stored in the root zone and that can be used by plants is called effective rainfall. In this study, the monthly mean water availability has been estimated grid-wise for the entire WFRB-2.
According to the Soil Conservation Service of USDA-SCS (1967), effective rainfall is available during the growing period of a crop and is to meet consumptive water requirements. Consequently, by managing ineffective rainfall, regions can make better use of their water resources and improve agricultural productivity, especially in areas with unreliable or limited rainfall patterns. Effective rainfall is the balance of precipitation remaining after all losses such as infiltration, deep percolation, and runoff. Effective rainfall was estimated by using Dastane’s (1978) equation. Effective rainfall was estimated by the following formulae [33].
W A r a i n = E R × c r o p   a r e a  
i f   P 16.7   m m / m o n t h E R = 0  
i f   P > 16.7   & < 75   m m / m o n t h E R = P × 0.6 10
i f   P > 75   m m / m o n t h E R = P × 0.8 25  
where, W A r a i n is effective rainfall corresponding to a particular crop area, ER is effective rainfall in mm, and P is total rainfall in millimeters (mm). These formulae are used in a monthly scheme.

2.5. Estimation of Monthly Crop Water Requirement

Irrigation water requires the reference evapotranspiration and rainfall data. In the present study, we estimate the reference evapotranspiration, which represents the evapotranspiration under standard crop management practices and environmental conditions using the VIC model. The VIC model estimates grid-wise evaporation from canopy storage and transpiration from the vegetation separately. In the VIC model, the Penman–Monteith equation has been used for estimating the monthly reference evapotranspiration as it is considered to be a standard method [34].
E T o = 0.408 Δ R n G + γ 900 T + 273 U 2 ( e a e d ) Δ + γ ( 1 + 0.34 U 2 )
where E t o is reference evapotranspiration (mm/day), R n is net radiation at crop surface (MJm−2 d−1), G is soil heat flux (MJ m−2 d−1), T is average temperature ((Tmax + Tmin)/2) (°C), U 2 is wind speed measured at 2 m height (m/sec), e a e d is vapor pressure deficit (VPD) for measurement at 2 m height (kPa), and it depends on relative humidity, e a is saturation vapor pressure (kPa), e d is actual vapor pressure (kPa), ∆ is the slope vapor pressure curve (kPaC-1), γ is psychometric constant, 900 and 0.34 are coefficients for reference crop and the wind, respectively.
In this study, historical decadal and future projected land use land cover maps are used. We use the LULC map to find the agricultural area in the watershed. The amount of water required to compensate for the evapotranspiration loss from cropping fields is defined as the crop water requirement (CWR) [34]. CWR depends on reference evapotranspiration and crop area which can be expressed as:
C W R = E T 0 × c r o p   a r e a  
where CWR is the monthly crop water requirement. The crop area under each grid has been estimated by overlaying the prepared LULC data of the baseline and the VIC model grids in a GIS environment. The ratio of each crop to the total crop is calculated for each grid.

3. Results

3.1. Performance of GCM Data

The monthly and annual IMD as well as GCM projected rainfall data were compared, and climatology is presented in Figure 3. The three models (Table 1) in the model cluster show a good correlation between the observed and downscaled GCM variables. The high-intensity rainfall region is Netravati and other sub-basins with an annual average of 3000–4500 mm/year whereas Periyar and other sub-basins receive less than an average of 2500 mm/year as per the CWC reports. It is difficult to predict rainfall accurately in Western Ghats on both leeward and windward sides. Figure 3i(a) represents the spatial contour plots showing the correlation coefficient between the observed IMD and historical CMIP6 GCM simulated monthly mean climate rainfall for about 27 years (1979–2005). GCM MIPLR shows a better correlation over a larger area in the basin. The majority of the region falls in a range with a rainfall coefficient of greater than 0.6. All three parts of the basin show three distinct behaviors in projecting the IMD rainfall. The result of the upper region projects the rainfall better with a higher range of correlation. The middle region with an average rainfall intensity of 2500 mm/year shows slightly less correlation compared to the upper region. In some of the rainfall-scarce lower region (southern grids), the lowest correlation with observed data is visible (0.3–0.4). Maximum and minimum temperatures (Figure 3i(b,c)) simulated by GCMs show a better projection of IMD gridded temperature after the seasonal bias correction. All three GCMs show a good correlation with temperature. The lower region of the basin shows less correlation compared to upper and middle regions in replicating the actual observed temperature of WFRB-2. The future climatology plots of rainfall show a gradual increasing trend by GCM CNRM and CCCMA from 2015 to 2100. The shared socioeconomic pathways (SSP5 8.5) show a higher gradient increase in rainfall projection in the region. An average 5 mm/year increase is projected due to climate change in the basin through the SSP5 8.5 scenario.

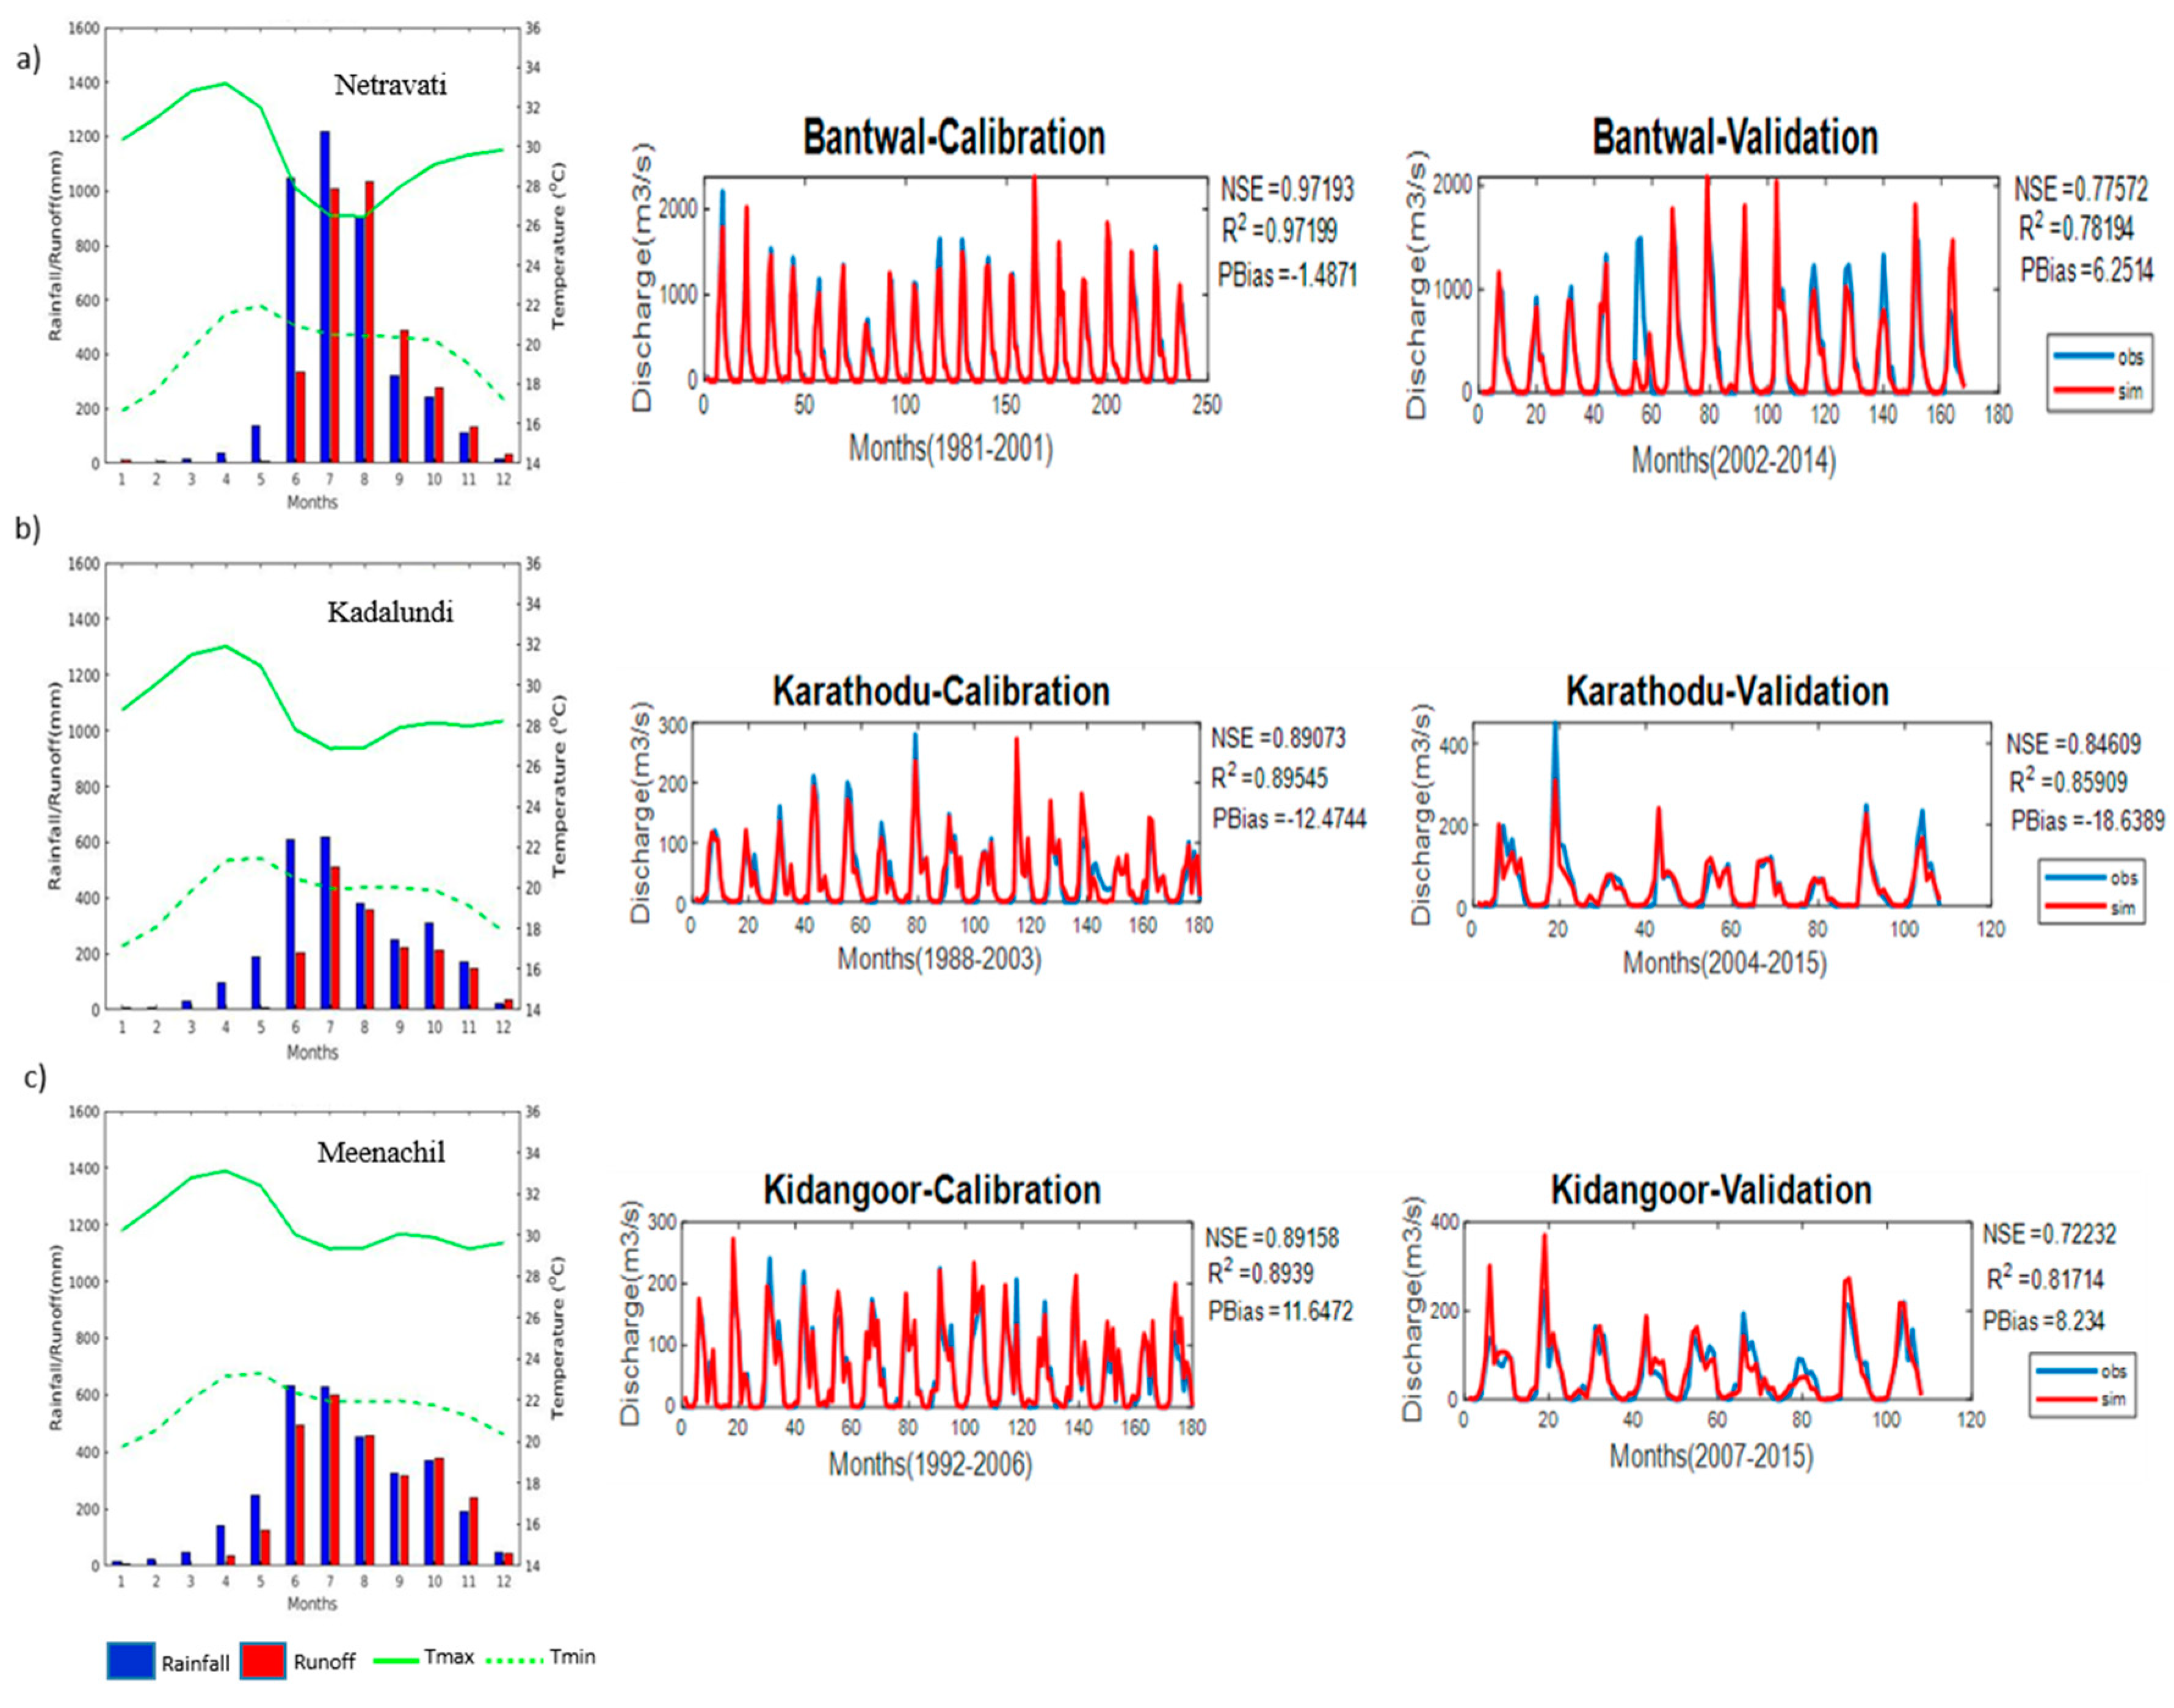
3.2. Calibration and Validation of VIC Model
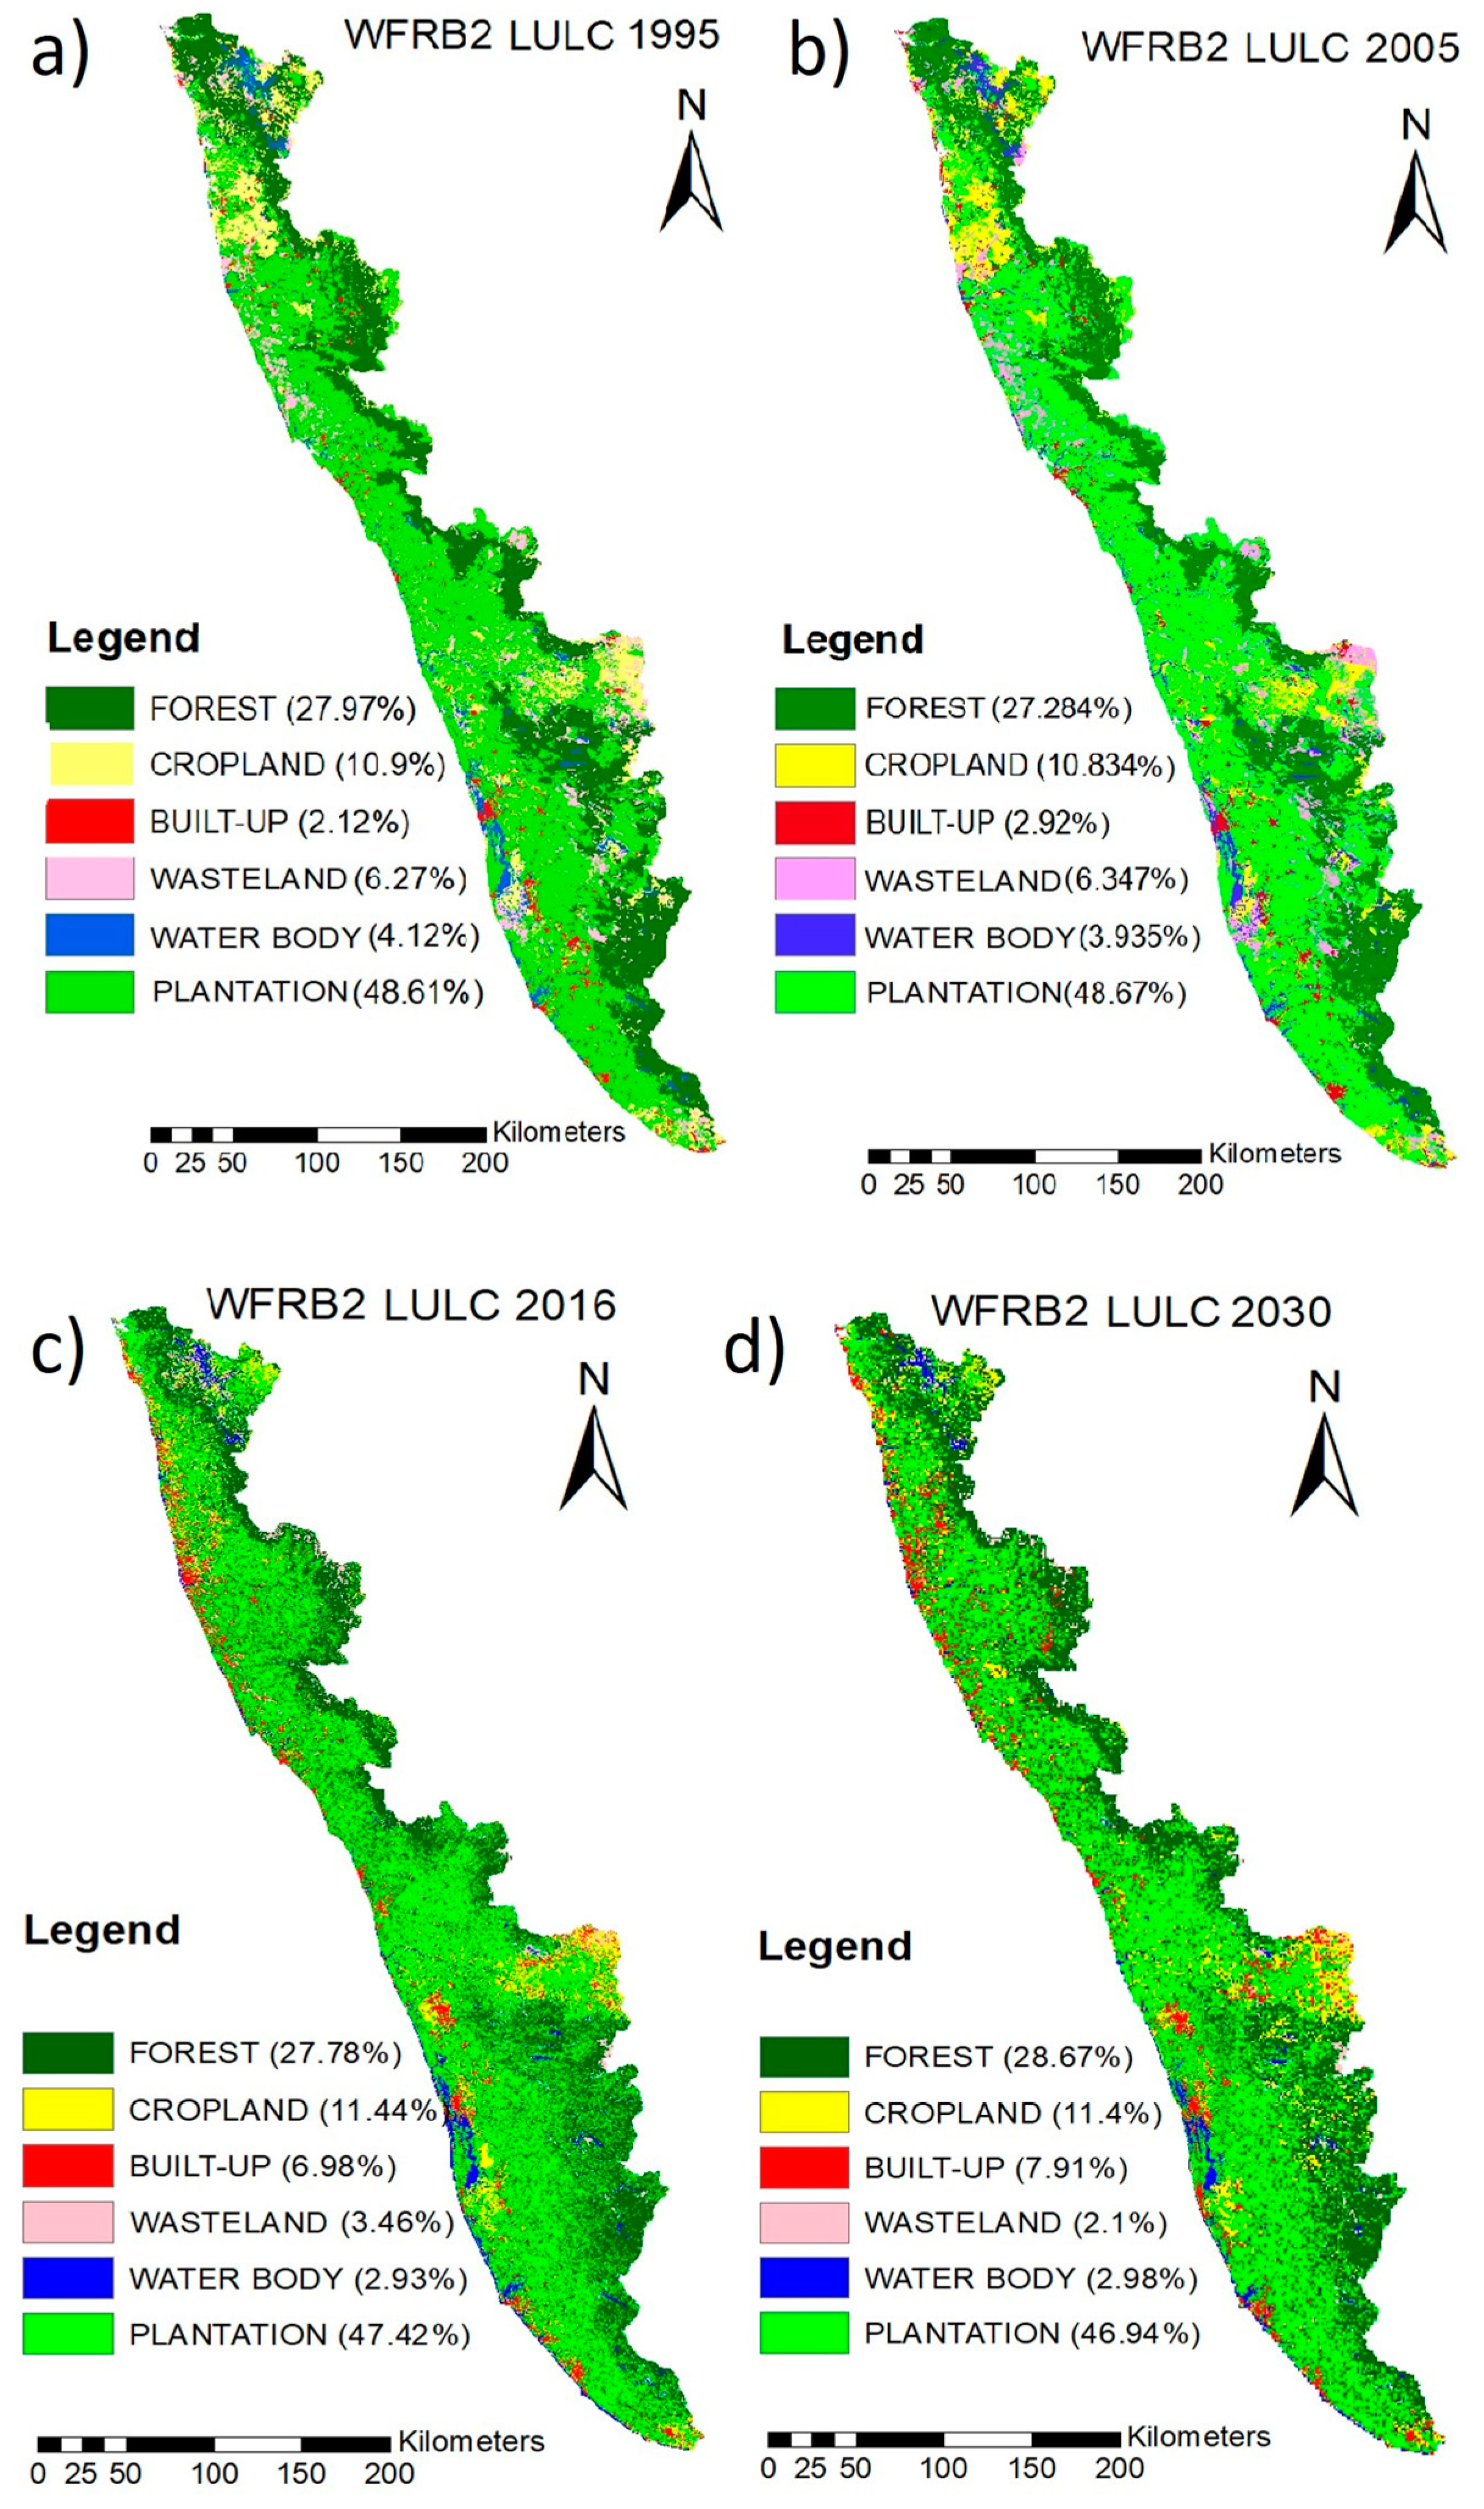
The VIC three-layer-based macroscale model estimates the surface runoff, baseflow, and other water balance components on a grid basis. These water balance fluxes are taken as input into the stand-alone routing model to simulate the streamflow at given locations taking flow direction, flow fraction, etc. as inputs. Initially, for the calibration, we choose three gauging stations at different geographical locations in WFRB-2 [32]. These three river basins are least affected by reservoirs and are from upper, middle, and lower regions of WFRB-2, respectively. The calibration and validation of the three gauging stations at a monthly scale are represented in Figure 4 along with the climatology of the river basins. The three gauging stations are in the Netravati river basin which lies in the upper region, Kadalundi in the middle region, and Meenachil in the lower region of the basin. Automated calibration using Shuffle Complex Evolution by the University of Arizona (SCE-UA) is used [35] since the WFRB-2 contains several small rivers with variation in soil and vegetation parameters. The SCE-UA algorithm strikes a balance between exploring different regions of the parameter space and exploiting promising regions, which helps avoid getting stuck in local optimum solutions. These three basins are calibrated separately, and nearby grids are assigned with similar parameters to cover the whole basin. Percent bias (PBIAS) [36], the coefficient of determination (R2), and Nash–Sutcliffe coefficient (NSE) [37] are used to assess the accuracy between the modeled streamflow and observed values.
N S E = 1 i = 1 n O i S i 2 i n O i O a v g 2
R 2 = i = 1 n O i O a v g × S i S a v g i = 1 n O i O a v g 2 × i = 1 n S i S a v g 2 0.5 2
P B I A S = i = 1 n O i S i i = 1 n O i × 100
where n—number of data records, Oi—observed hydrological parameters, Oavg—mean of observed values, Si—simulated value, and Savg—mean of simulated values. For both calibration as well as validation periods, NSE, R2, and PBIAS (equations above) values lie within the permissible limits as shown in Figure 4.

3.3. LULC Change

The different LULC maps of WFRB-2 are presented in Figure 5 for the period of 1995 to 2030. Plantation and forest lands are the two major classes of land use present in the Western Ghats region. Almost 50% of the land is covered by plantations and the entire Western Ghats hilly region is covered with forest land.
The LCM model trained with LULC of 1995 and 2005 to generate LULC of 2016 was validated by comparison with the classified LULC of 2016. The results matched well with accuracy greater than 80% and the comparison is shown in Table 2. However, certain spatial inconsistencies were observed but the model was able to capture the overall LULC change. The driving variables identified were elevation, distance from road, water bodies, cropland, population density, slope, and built-up area. Using the same combination of driver variables, the LULCs of the year 2005 and 2016 were used to project the LULC pattern for 2030. The details of the percentage cover for each land cover type are mentioned in Table 2 and the spatial variation is represented in Figure 5. The major changes from 2016 to 2030 are observed in built-up areas and wasteland with built-up areas increasing up to 7.91% (+1.27%) and wasteland reducing to 2.1% (−1.47%) as per LULC 2030 projections. Cropland and water show little change with land cover up to 11.4% (+0.11%) and 2.98% (−0.31%), respectively. Forests are projected to show an increase up to 28.74% (+1.7%) whereas plantations show a decrease to 46.87% (−1.27%). Overall, the combined forest and plant cover remains about the same and a matching trend is observed in historical land cover distributions (Table 2).

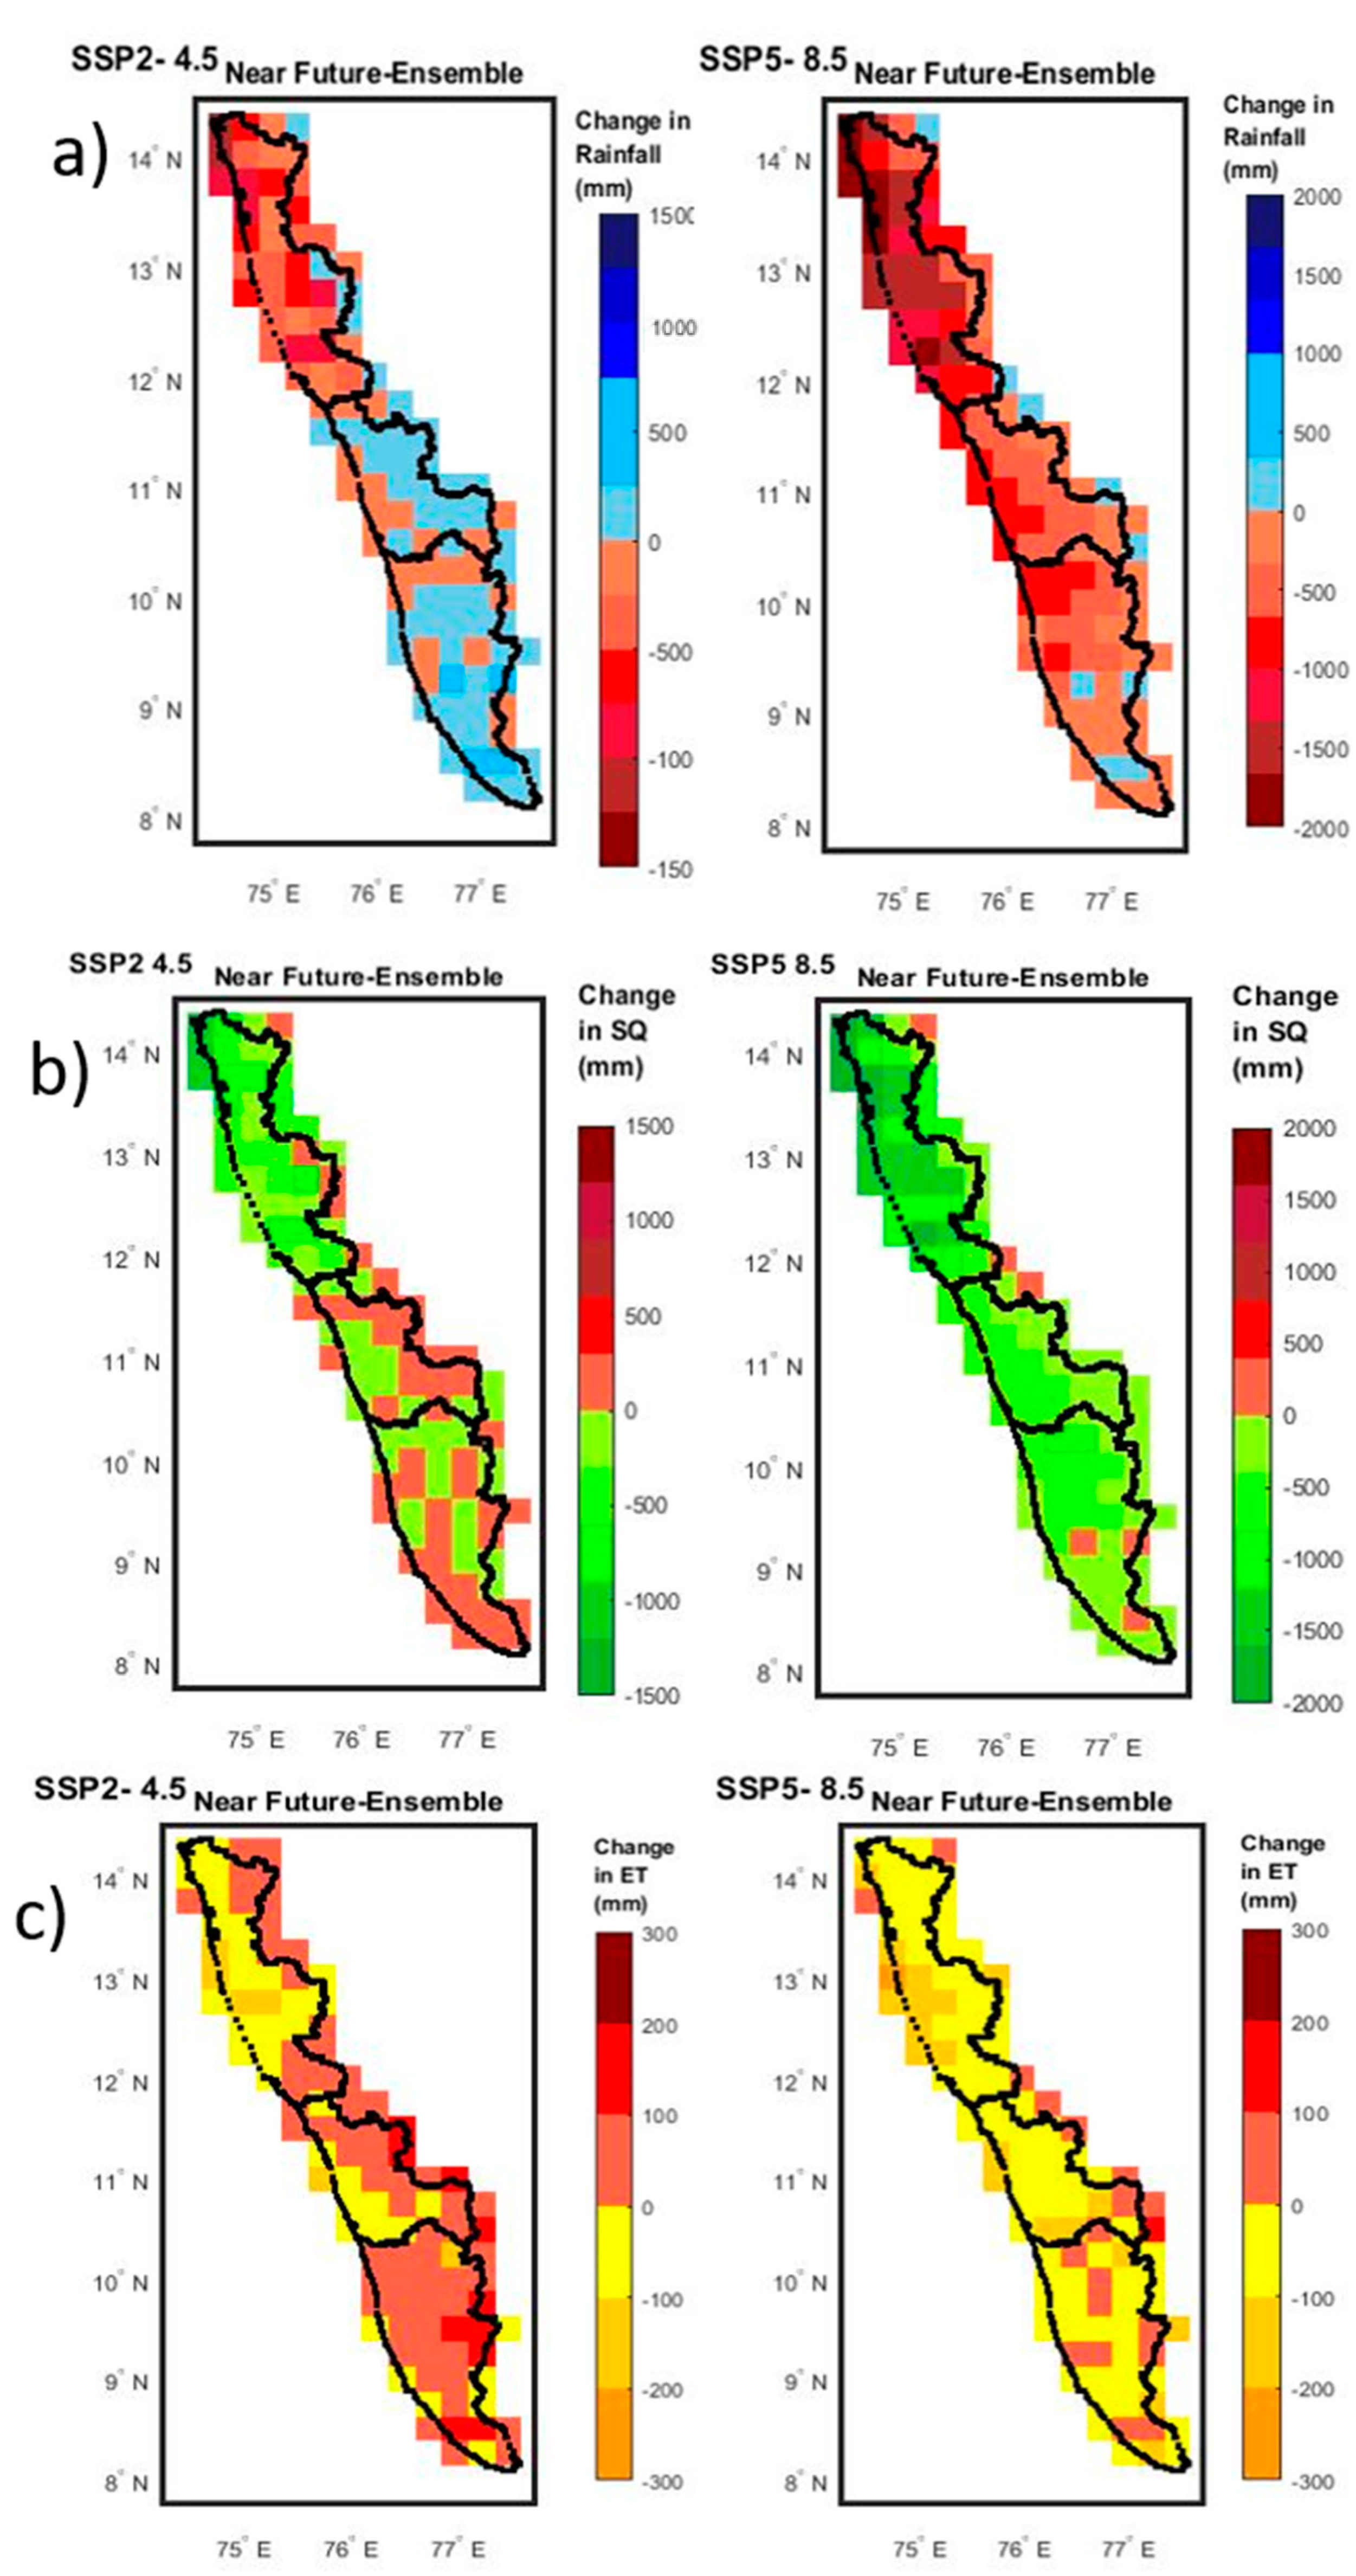
3.4. Impact of Combined Change on Water Balance Components

3.4.1. Rainfall

From the temporal variation analysis of ensemble CMIP6 GCM rainfall data, we can see a clear decreasing rainfall trend in upper regions (Netravati and other sub-basins) of WFRB-2 for both medium- and high-emission scenarios in the future compared to the historical period (baseline) (Figure 6a). The 30-year annual average difference (decrease from baseline) is about 500 mm and 1200 mm through SSP 4.5 and 8.5 in the upper region (Figure 6a). Similarly, in the lower regions of WFRB-2, the overall change from the past to the future takes place with a magnitude of (+) 100 mm. In the future, for the SSP 4.5 scenario, an overall increase in rainfall is observed in the lower region of the basin which resembles the CMIP5 analysis [38]. This projection by CMIP6 models validates the recent flooding events in lower regions of Kerala. SSP 8.5 shows a decreasing trend in rainfall all over the region in the future. The average forcing scenario SSP 4.5 in the middle region shows an increasing rainfall in the Ghats and Nilgiri regions of the basin.

3.4.2. Surface Runoff

Simulated surface runoff (SR) for the future for both the SSP scenarios is plotted in Figure 6b below. The combined impact on SR is primarily dominated by climate change as compared to LULC change. Netravati and other sub-basins show a higher magnitude of decrease in SR in the future by both SSP 4.5 and 8.5 by 250 mm and 750 mm, respectively. In the middle region, Varrar, and other river basins, SSP 8.5 projects a decreasing surface runoff (SR) in the future by 100 mm, whereas SSP 4.5 simulates increasing magnitudes in the future near the Ghats region. The SSP 4.5 scenario in the future projects an increase in SR in coastal regions and a decrease in SR near the Ghats region. The future projection shows an increase in SR by +36.5 mm/year through SSP 4.5. For the upper region, Netravati, and the river basin, the decrease in SR is prominent through both the SSP scenarios. The magnitude of change in annual mean SR and rainfall is high through SSP 8.5 compared to the average emission scenario SSP 4.5 in the entire region.

3.4.3. Evapotranspiration (ET)

Evapotranspiration rates increase in the future from SSP 4.5 to SSP 8.5 scenarios for all three regions in WFRB-2 as shown in Figure 6c. Only the upper region in the future shows an overall decreasing ET for both SSP 4.5 and 8.5 by −26 mm/year and −9.7 mm/year, respectively. This is reflected in comparatively lesser variation in temperature in this region. The middle region exhibits an increase in ET in the future by 112 mm and 219 mm/year through SSP 4.5 and SSP 8.5. Even though the spatial average in the lower region shows increasing ET, it shows distinct variations near coastal regions and the Ghats region.

3.4.4. Regional Impacts

The upper region (Netravati and other sub-basins), middle region (Varrar and other sub-basins), and lower region (Periyar and other sub-basins) are distinct in climatic, LULC, and terrain properties. The upper region (34.2% of total basin area (TBA)), middle region (25.8% of TBA), and lower region (39.9% of TBA) have population densities of 330 people per km2, 999 people per km2, and 509 people per km2, respectively, according to the Indian Census 2011 [39]. To comment on the adaptive measures to be adopted in each region, these three regions are further classified based on the landforms present in the region such as lowlands, midlands, and Western Ghats. The lowland coastal regions of WG are made up of mainly sandy alluvium whereas the midlands, with an average elevation of 100 m, contain thick laterite soil. The highlands are mostly covered with hard rocks, periodically with laterite cover.
In the upper region, 50% of the total area is hilly Western Ghats, 25% midlands, and 25% lowlands. Most of the urbanization is happening in the lowland regions. At the same time, the upper region has the highest percentage of forest, mostly in the Ghats region. The lowlands experience an annual average of 4026 mm/year rainfall followed by 3703 mm/year in the midlands and 2546 mm/year in the Ghats region for the baseline period. Comparing the change with respect to historical and future (2020–2050) periods, in the Ghats region, the percentage change in rainfall is −0.21%/−0.23% through SSP 4.5/8.5, respectively.
In Varrar and other sub-basins, the annual average rainfall is lower compared to the upper region for the baseline period (Table 3). The lowlands in this sub-basin experience 2930 mm/year annual mean rainfall followed by 2548 mm/year in the midlands and 1501 mm/year in the Ghats region. The Ghats and Nilgiri regions expect an increasing change in rainfall/runoff in the middle region of 3.77% and 5.29% though SSP 4.5. Similarly, in the middle region through SSP 4.5, the rainfall/runoff pattern shows increasing change due to the combined impact of climate and LULC change. In the lower part of the WFRB-2, i.e., Periyar and other sub-basins, the rainfall experienced is the lowest compared to the upper and middle regions. It is the least in the Ghats region (1357 mm/year).

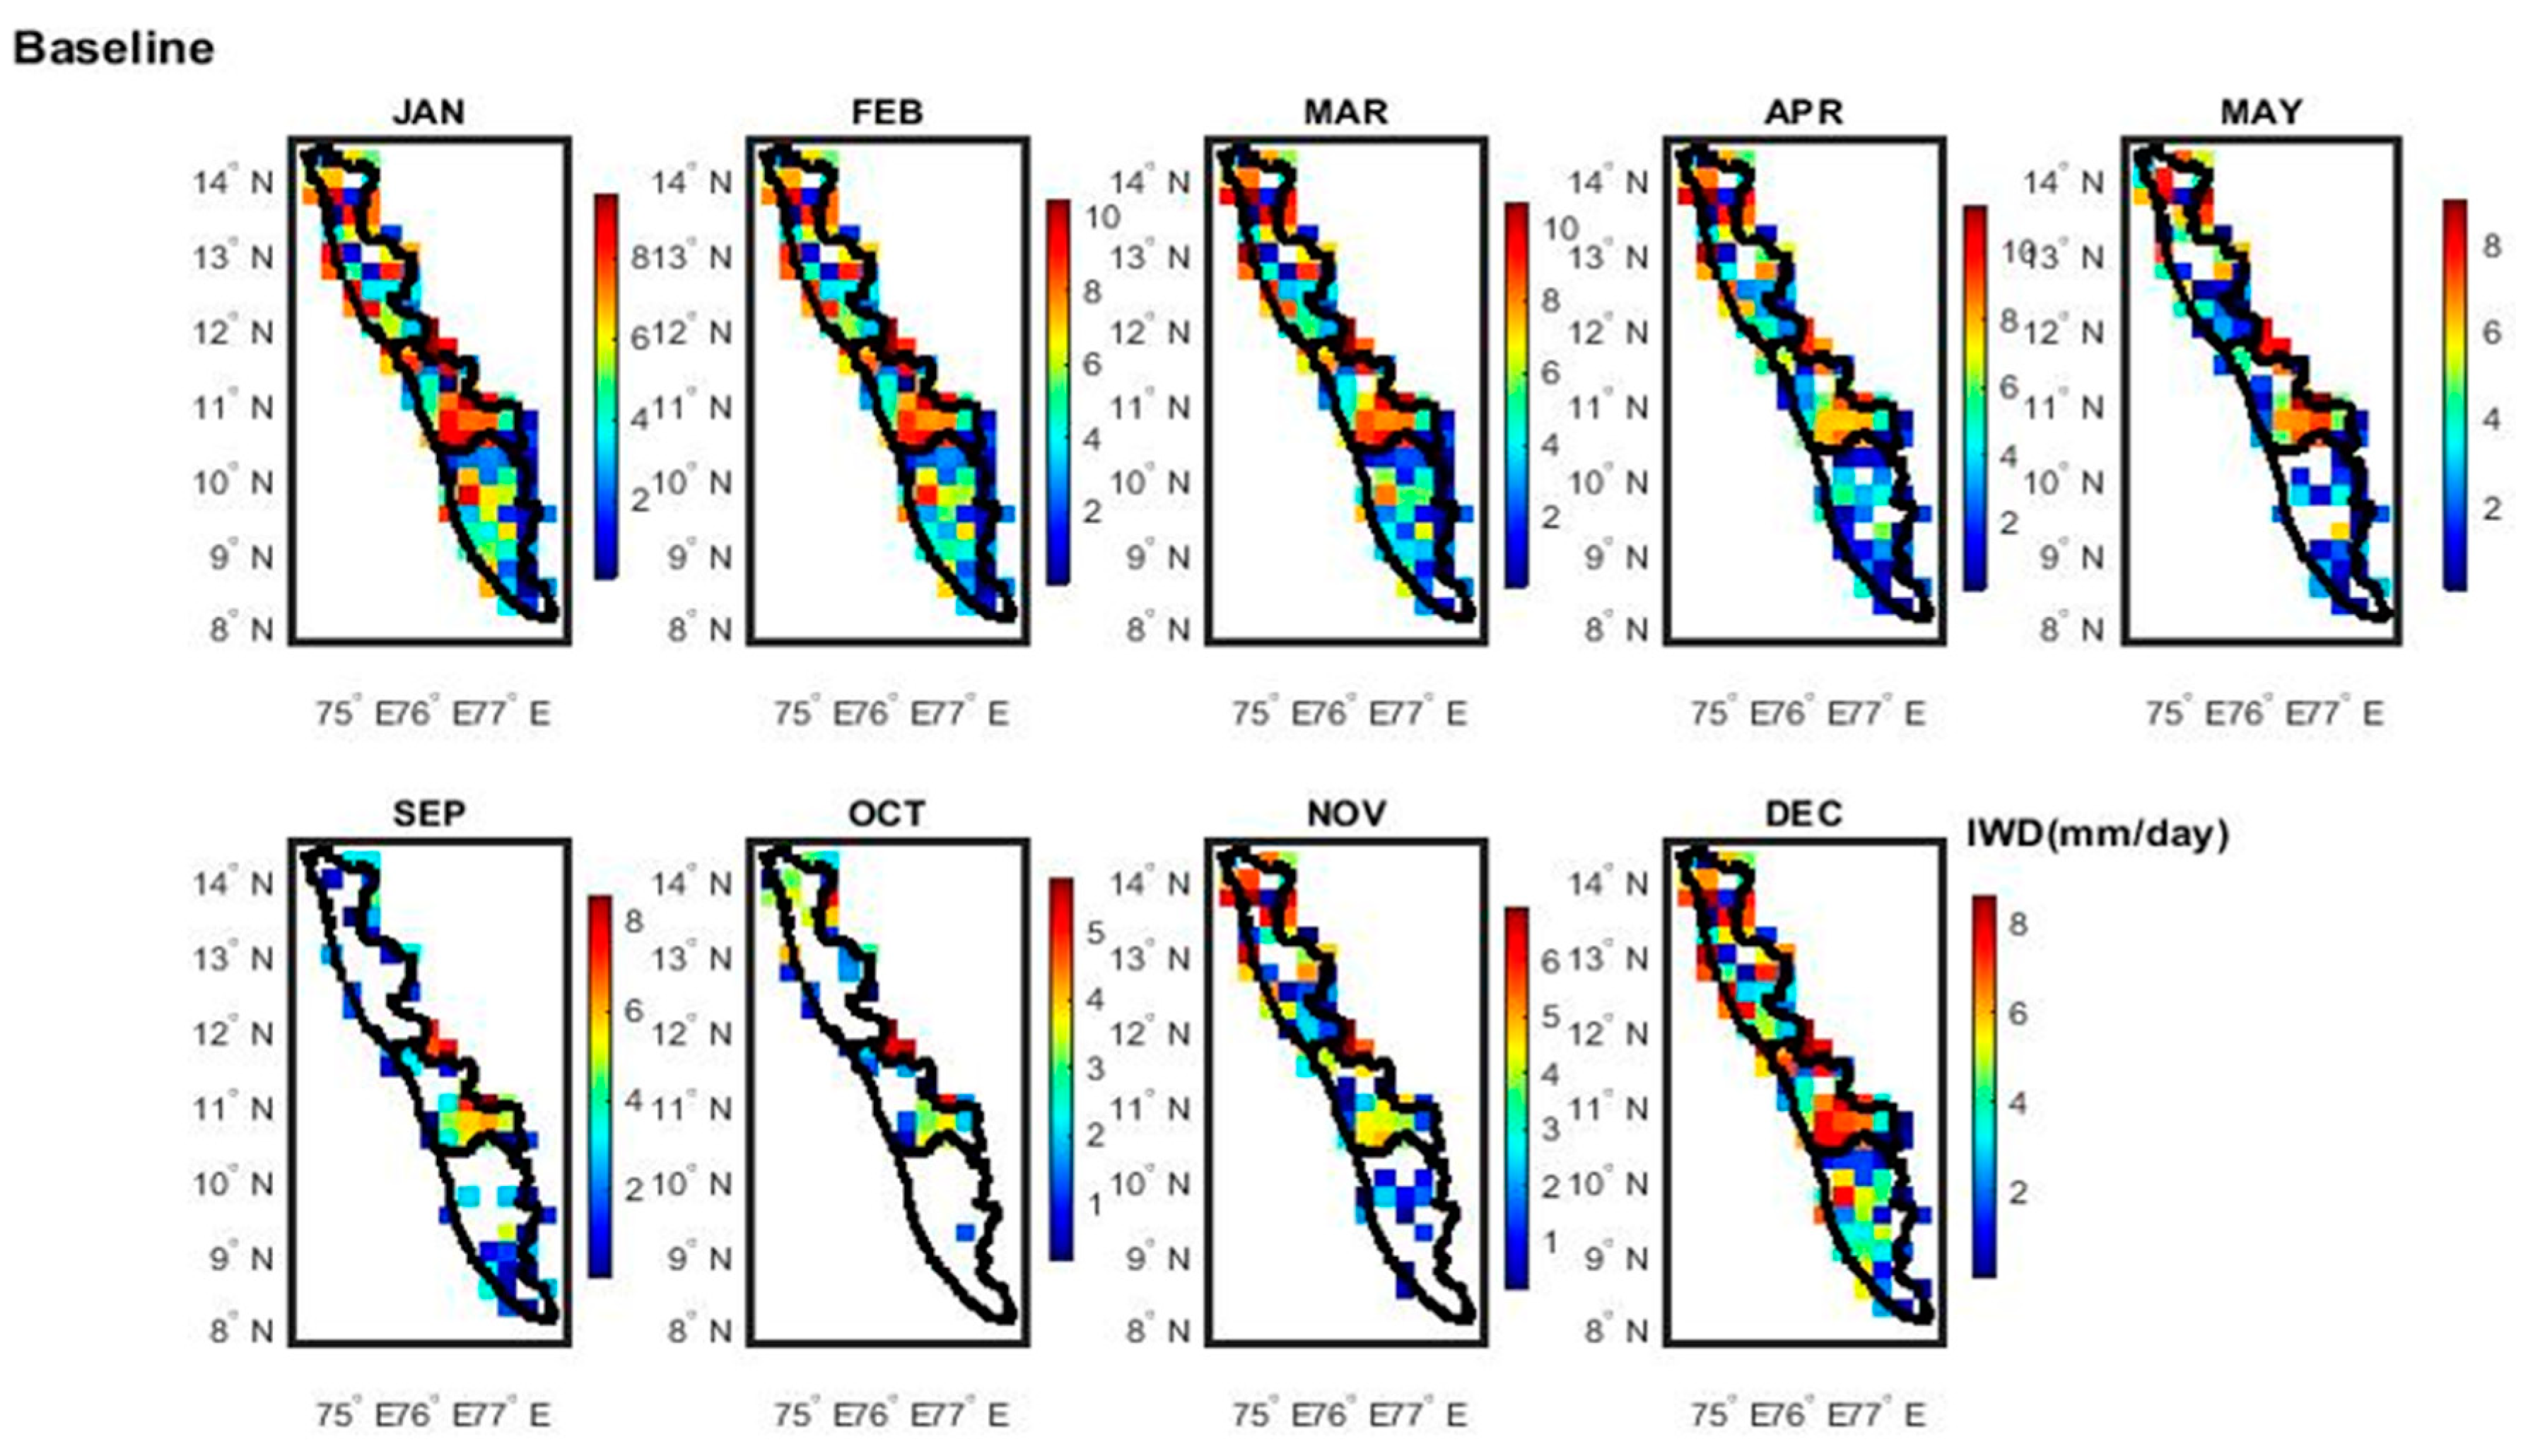
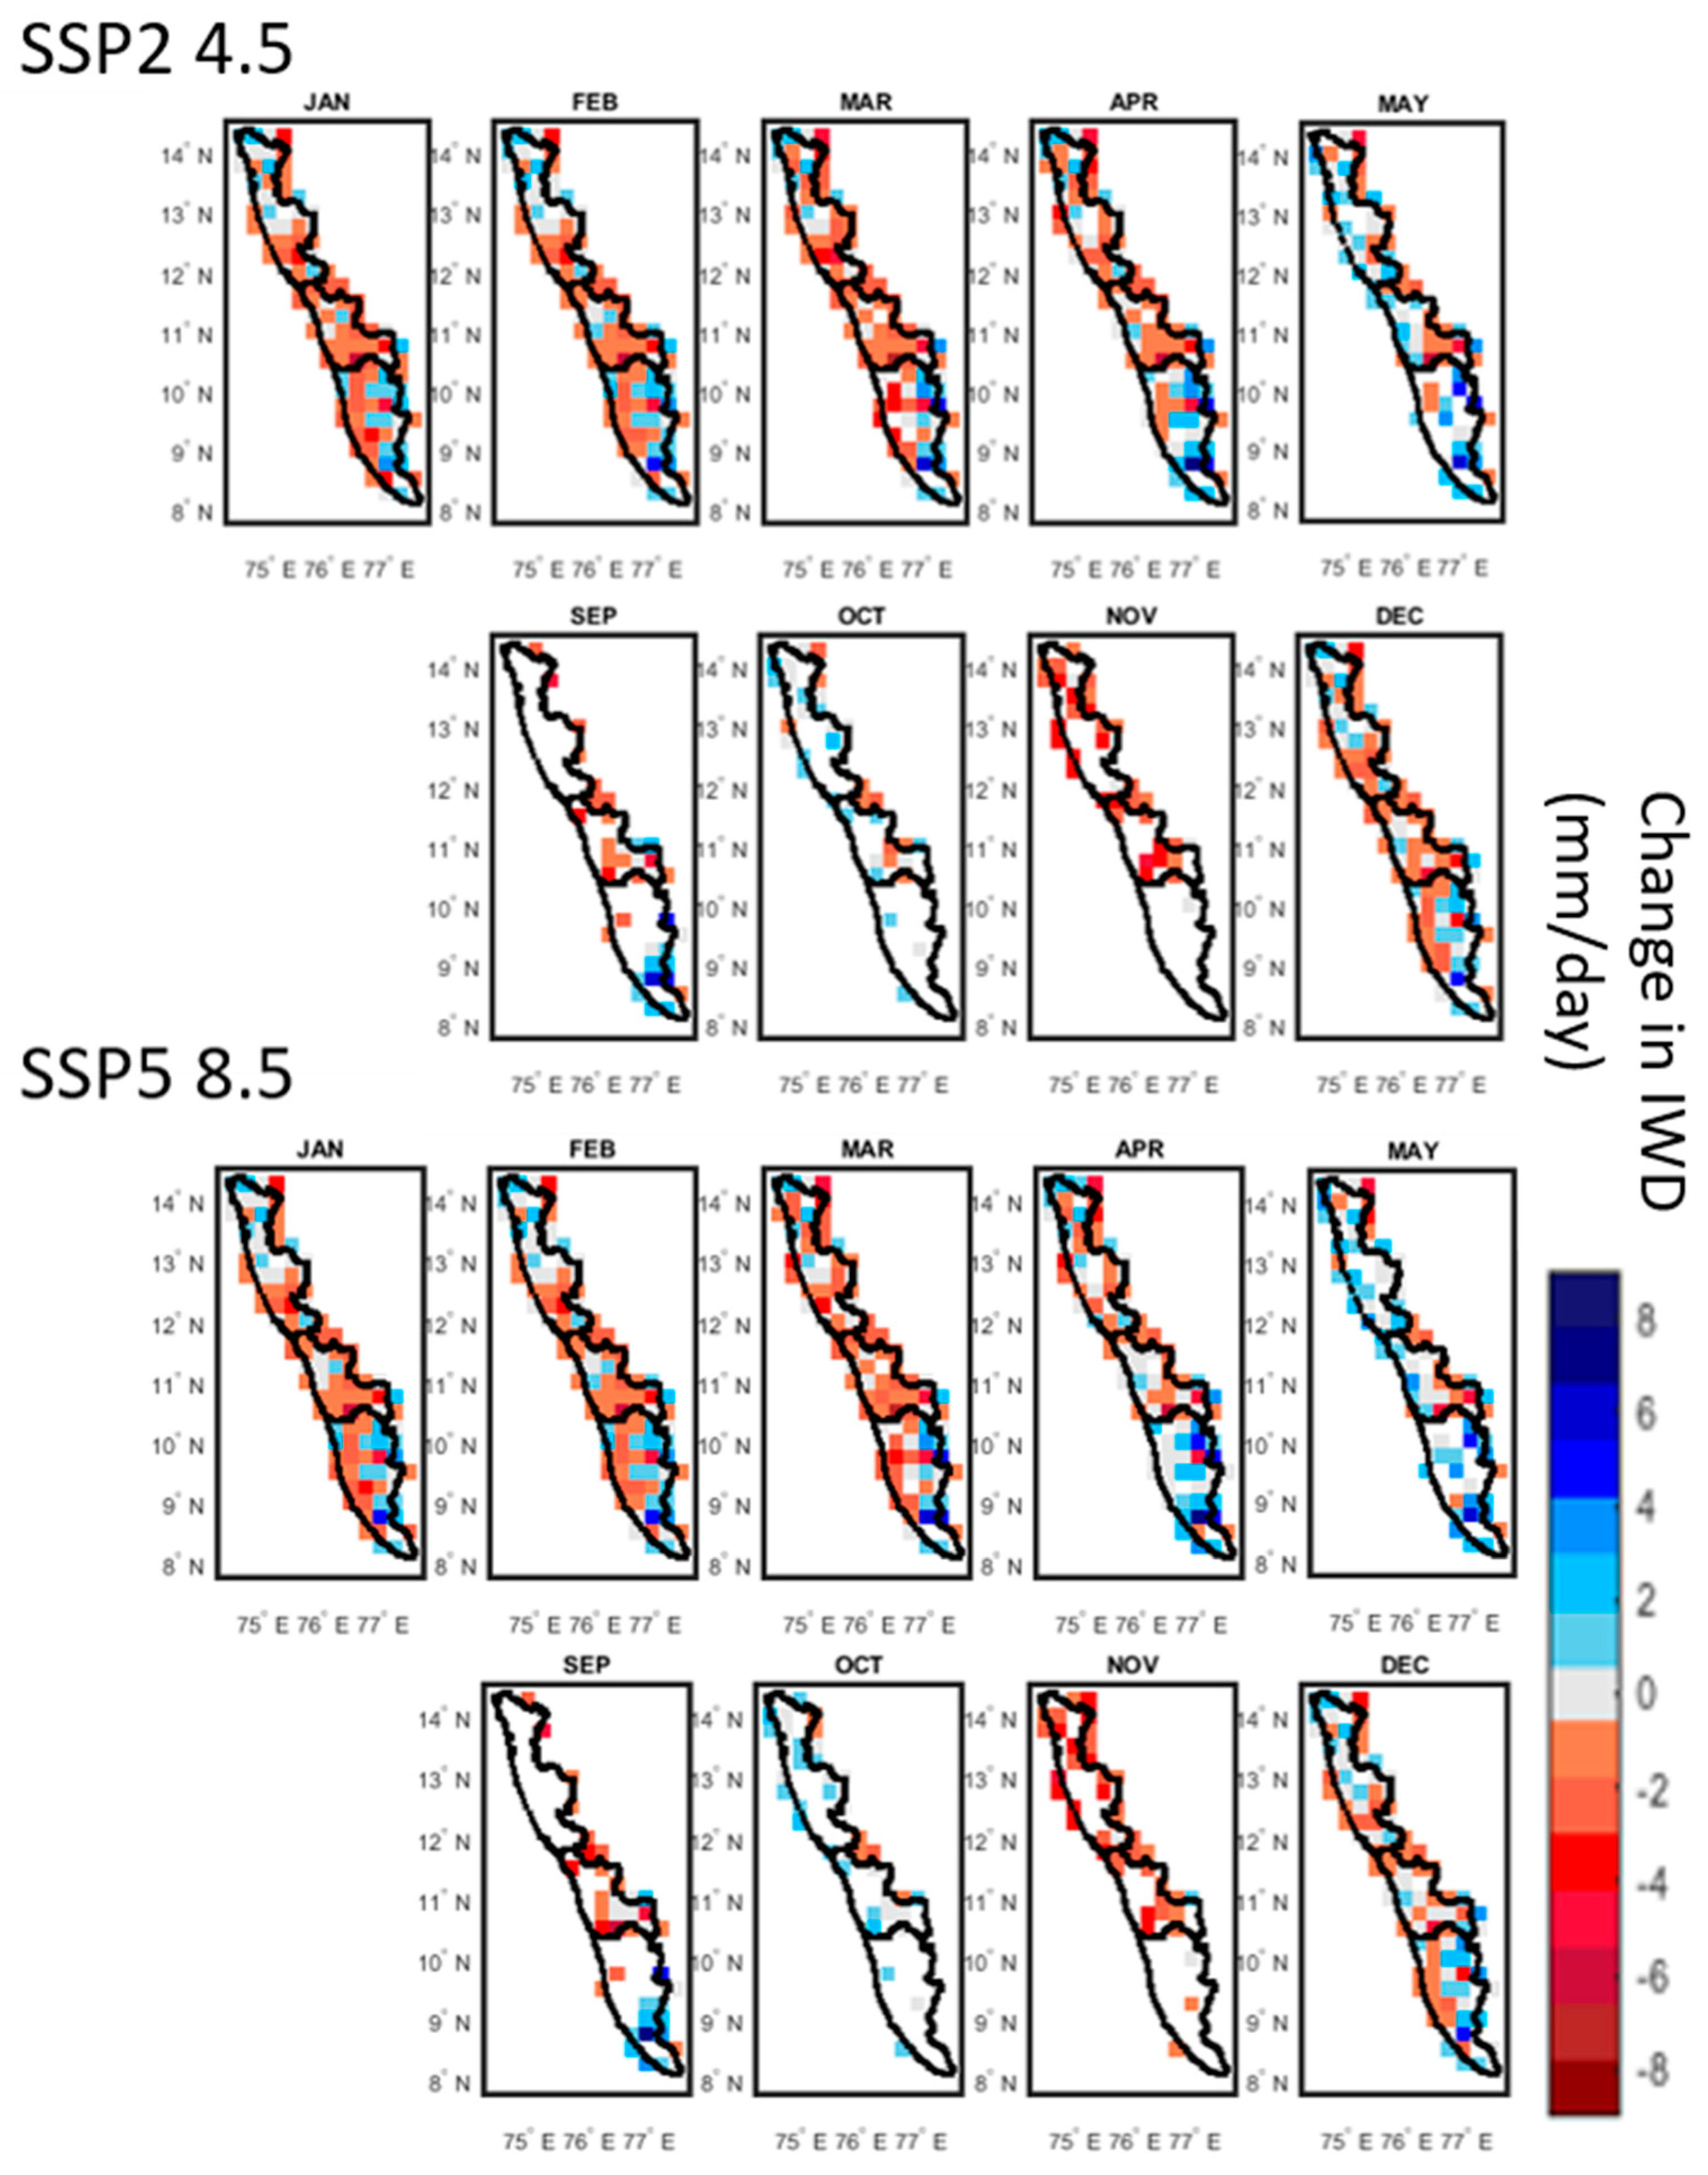
3.5. Comparison of Future Irrigation Demand

The VIC model was already calibrated and validated for WFRB-2 using the SCE-UA algorithm. Therefore, we obtain grid-wise surface runoff, baseflow, evapotranspiration, etc. for historical and future time periods. Using Equations (5) and (6), effective rainfall in each grid was computed. Monthly crop water requirement was estimated using grid-wise crop evapotranspiration from the VIC model output and the crop fraction area from the LULC classifications. The irrigation water demand (IWD) was plotted monthly grid-wise for baseline (historical; 1981–2010) and future time periods (2020–2050).
In this section, the change in irrigation water demand in the future was compared for ensemble GCM data with respect to the baseline demand for the region. The historical period shows the highest irrigation demand in the middle region and upper Tadri region in pre-monsoon and winter months (8–10 mm/day) (Figure 7). The IWD is the least in the months of September and October in the basin. The least demand is visible in the Ghats regions of Periyar and other river basins. Even in the coastal regions of the lower part of the basin, the demand is comparatively less, up to 2 mm/day.
Using the future rainfall projections of GCMs of VIC models, the IWD for the future was estimated for SSP 4.5 and 8.5 scenarios monthly for ensemble data. Figure 8 shows the change in IWD for the future period with respect to the baseline period. For the future, the highest irrigation demands are shown in winter and pre-monsoon seasons. The demand is high in the middle and upper regions. In the months of March and April, the IWD exceeds 8 mm/day in some grids in the future for both the SSP scenarios.
In the future, the overall change in IWD is decreasing in most of the upper and middle regions of the basin. Only a few grids in the lower regions show an increase in water demand up to 8 mm/day (Figure 8). Even though the middle part of the basin shows higher irrigation demand in historical as well as future time periods, the change in IWD values shows there is a gradual increase in water demand in some regions of the lower part of the basin in the month of May. Also, coastal regions of the middle part of the basin show increasing irrigation demand, which indicates proper planning for irrigation is required in the basin to meet the future requirements. The lower region of WG shows a higher rate of increase in IWD in the future due to the rise in temperature through SSP scenarios. The midlands in all three parts of the basins are broad and fertile and most suitable for cultivation (cropland). The irrigation water demand is to be managed properly in this region compared to other regions of the basin. Local governments may initiate plans and schemes to increase agricultural production with effective utilization of water and other natural resources available in the region.

4. Discussion

The Western Ghats consists of 42 river basins and is one of the global hotspots where the distinguishable impact of climate change takes place in different regions of the basin. The three regions of WFRB-2 show distinct climatic and vegetation characteristics. The present study shows a better performance of MPILR GCM of the CMIP6 model in this region. An overall decrease in rainfall and runoff is observed in the future by the future projected climate and LULC change in the region. However, for the future under the SSP 4.5 scenario, there is an overall increase in rainfall observed in the lower region of the basin. Studies have separately analyzed and shown that the impact of climate change on water balance components is huge compared to the changing LULC in the WG regions [32]. Also, studies have been carried out to analyze the impact of climate change alone using CMIP5 GCMs for the future for WG river basins and the results show a rise in temperature and increasing extreme events in this region [38]. Chandu et al., 2023 [38] estimated a few rainfall indices such as annual average rainfall, the total number of rainy days, and annual one-day maximum using CMIP-5 GCMs for river basins in WG. Among all five GCMs considered, MPILR GCM predicts the mean and maximum rainfall patterns in the region well. Similarly, the present study also shows the better performance of MPILR GCM of the CMIP6 model in the same region. Almazroui et al., (2020) [40] used an ensemble of 27 CMIP6 GCM models to project the seasonal and annual variation in temperature and precipitation over South Asian countries. The study projects an increase in annual mean temperature by 2.1 °C/4.3 °C through SSP 4.5/8.5, respectively. Moreover, the analysis also projects a 27% increase in precipitation by the end of 2100 through SSP8.5 for Indian regions. In addition to these findings, the present work has undertaken some additional steps to downscale the rainfall data to a finer resolution of 0.25 degrees and the baseline and future timespans are different. Additionally, there are differences in the baseline and future timespans used in both studies. Therefore, the results from our study differ significantly for the future SSP 8.5 scenario specifically for the Western Ghats (WG) regions. Further, at the river basin scale, SSP 4.5 scenarios have shown an increase in precipitation resulting in increased (25%/50%) runoff/streamflow in the Periyar river basin [41]. The percentage of cropland is highest in the middle region (4%) compared to the upper (3.2%) and lower regions (3%). Apart from the cropland class, plantations such as rubber, coconut etc. which have the highest percentage in the middle region (12.5%) also require irrigation in WG. This increase in croplands and plantations in certain regions of WG can also lead to increasing irrigation water demand in the region. Studies have indicated that hydro-meteorological conditions determine the irrigation requirements of a region [42,43]. The present study indicates an overall increase in irrigation water demand in the WG (regarding surface water and groundwater) from past to future periods. In the future (2020–2050), specifically during the months of March, April, and May, the irrigation water demand surpasses 8 mm/day in certain areas for both the shared socioeconomic pathways (SSP) scenarios. The increase in future annual mean temperature and precipitation due to SSP scenarios results in an increase in ET in the Congo River watersheds and high drought conditions [44]. The WG case is similar. The rise in temperature due to global warming has resulted in the shortening of the wheat-growing season and changes in the crop water requirement in European regions [45]. In WG, the increase in IWD may affect the wide range of major crop cultivation such as tea, coffee, spices, rubber, and coconut plantations.
Moreover, the study has shown the importance of rice yield growth required in the country to meet the rise in population [46]. Studies have validated that in countries like Nigeria, the change in monthly rainfall has a great impact on food production [47]. Similarly, the increase in IWD in the summer months in the basin and population density can affect food production in the region. In the US, studies have shown that climate change has a positive effect on crop production in the northern regions whereas a negative impact in the southern areas [48]. Further, countries like Iran where most of the river basins are semi-arid [49] and water stressed are different from Western Ghats which is a humid tropic region. The intensity of rainfall is high to medium in WG, whereas Iran is a low-intensity drought-prone region. Studies show that a prominent decrease in precipitation and an increase in ET in water-scarce regions like Iran prompt more sustainable use of water for water-scarce seasons and appropriate drought-resistant crop practices to optimize yield [49]. However, the same is applicable to regions like WG, where certain water stress zones are to be critically examined and redistribution of irrigation water through canals and dams from nearby zones can be carried out. WG also receives abundant rain in the monsoon season, which can be stored in water-scarce regions for the rest of the seasons. In our study, most of the upper and middle regions are showing reduced irrigation water demand compared to the baseline period. In areas where groundwater depletion is high, the Indian government has taken initiatives to plant less water-intensive crops [50]. Therefore, the optimization of cropping patterns can be crucial for effective management of water resources.

5. Conclusions

The following are the major conclusions from this study.
  • The MPILR GCM of the CMIP6 model performs better in capturing the annual mean rainfall and gives reliable projections of future rainfall change for all three regions of the WG region compared to other GCMs.
  • The future projected LULC map for 2030 shows an increase in built-up areas (+1.27%) and wasteland reducing to 2.1% (−1.47%). Also, the land class that requires irrigation was reduced by 1.16%.
  • For the future under the SSP 4.5 scenario, there is an overall increase in rainfall observed in the lower region of the basin. This projection aligns with recent flooding events that occurred in the lower regions of Kerala.
  • The study indicates increasing IWD (~8 mm/day), particularly in the months of March, April, and May, in different parts of the WG region from historical to future periods. The IWD values show a decreasing trend in most of the upper and middle regions of the basin but an increasing trend in the lower region.
The WG is a region with a cluster of 42 medium to small river basins spread across different states such as Kerala, Karnataka, and Tamil Nadu. The spatial variation in seasonal IWD across the basin gives an overall idea for better future planning of sustainable irrigation water usage. In regions with water surpluses, interregional water transfer projects can be established to transport water to water-deficient regions. Moreover, this process also requires cooperation and information sharing among different administrative entities and stakeholders. This can involve sharing data on water availability, consumption patterns, and climate projections by collectively addressing water-related challenges and devising adaptive strategies to achieve sustainable water management, enhance water availability, and address water demand challenges in a changing climate.

Author Contributions

Conceptualization, N.C., K.S. and T.I.E.; methodology: N.C., K.S. and T.I.E.; software, N.C. and K.S.; validation, N.C. and K.S.; formal analysis, N.C. and K.S.; writing and editing, N.C., K.S. and T.I.E.; supervision, T.I.E. All authors have read and agreed to the published version of the manuscript.

Funding

This research received no external funding.

Institutional Review Board Statement

Not applicable.

Informed Consent Statement

Not applicable.

Data Availability Statement

The datasets analyzed in the study are available from the corresponding author on request.

Acknowledgments

The authors would like to express their gratitude to INCCC, the Ministry of Water Resources (now known as the Ministry of Jal Shakti), and the Government of India for the project titled “Impact of Climate Change on Water Resources in River Basins from Tadri to Kanyakumari.” Additionally, we would like to acknowledge the Central Water Commission, the National Bureau of Soil Survey and Land Use Planning, and the India Meteorological Department for providing us with valuable hydrological, soil, and meteorological data.

Conflicts of Interest

The authors declare no conflict of interest.

References

  1. Saranya, P.; Krishnakumar, A.; Kumar, S.; Krishnan, K.A. Isotopic study on the effect of reservoirs and drought on water cycle dynamics in the tropical Periyar basin draining the slopes of Western Ghats. J. Hydrol. 2020, 581, 124421. [Google Scholar] [CrossRef]
  2. Di Baldassarre, G.; Wanders, N.; AghaKouchak, A.; Kuil, L.; Rangecroft, S.; Veldkamp, T.I.E.; Garcia, M.; van Oel, P.R.; Breinl, K.; Van Loon, A.F. Water shortages worsened by reservoir effects. Nat. Sustain. 2018, 1, 617–622. [Google Scholar] [CrossRef]
  3. DeFries, R.; Liang, S.; Chhatre, A.; Davis, K.F.; Ghosh, S.; Rao, N.D.; Singh, D. Climate resilience of dry season cereals in India. Sci. Rep. 2023, 13, 9960. [Google Scholar] [CrossRef]
  4. Suzuki, R.; Xu, J.; Motoya, K. Global analyses of satellite-derived vegetation index related to climatological wetness and warmth. Int. J. Climatol. A J. R. Meteorol. Soc. 2006, 26, 425–438. [Google Scholar] [CrossRef]
  5. Chanapathi, T.; Thatikonda, S. Investigating the impact of climate and land-use land cover changes on hydrological predictions over the Krishna river basin under present and future scenarios. Sci. Total Environ. 2020, 721, 137736. [Google Scholar] [CrossRef]
  6. Sharannya, T.M.; Mudbhatkal, A.; Mahesha, A. Assessing climate change impacts on river hydrology–A case study in the Western Ghats of India. J. Earth Syst. Sci. 2018, 127, 1–11. [Google Scholar] [CrossRef]
  7. Sharannya, T.M.; Venkatesh, K.; Mudbhatkal, A.; Dineshkumar, M.; Mahesha, A. Effects of land use and climate change on water scarcity in rivers of the Western Ghats of India. Environ. Monit. Assess. 2021, 193, 820. [Google Scholar] [CrossRef]
  8. Sadhwani, K.; Eldho, T.I.; Karmakar, S. Investigating the influence of future landuse and climate change on hydrological regime of a humid tropical river basin. Environ. Earth Sci. 2023, 82, 210. [Google Scholar] [CrossRef]
  9. Hao, L.; Sun, G.; Liu, Y.; Wan, J.; Qin, M.; Qian, H.; Liu, C.; Zheng, J.; John, R.; Fan, P.; et al. Urbanization dramatically altered the water balances of a paddy field-dominated basin in southern China. Hydrol. Earth Syst. Sci. 2015, 19, 3319–3331. [Google Scholar] [CrossRef]
  10. Anand, J.; Gosain, A.K.; Khosa, R. Prediction of land use changes based on Land Change Modeler and attribution of changes in the water balance of Ganga basin to land use change using the SWAT model. Sci. Total Environ. 2018, 644, 503–519. [Google Scholar] [CrossRef] [PubMed]
  11. Dwarakish, G.S.; Ganasri, B.P. Impact of land use change on hydrological systems: A review of current modeling approaches. Cogent Geosci. 2015, 1, 1115691. [Google Scholar] [CrossRef]
  12. Oswald, C.J.; Kelleher, C.; Ledford, S.H.; Hopkins, K.G.; Sytsma, A.; Tetzlaff, D.; Toran, L.; Voter, C. Integrating urban water fluxes and moving beyond impervious surface cover: A review. J. Hydrol. 2023, 618, 129188. [Google Scholar] [CrossRef]
  13. Sadhwani, K.; Eldho, T.I.; Jha, M.K.; Karmakar, S. Effects of Dynamic Land Use/Land Cover Change on Flow and Sediment Yield in a Monsoon-Dominated Tropical Watershed. Water 2022, 14, 3666. [Google Scholar] [CrossRef]
  14. Schilling, K.E.; Jha, M.K.; Zhang, Y.-K.; Gassman, P.W.; Wolter, C.F. Impact of land use and land cover change on the water balance of a large agricultural watershed: Historical effects and future directions. Water Resour. Res. 2008, 45, 6644. [Google Scholar] [CrossRef]
  15. Wheater, H.; Evans, E. Land use, water management and future flood risk. Land Use Policy 2009, 26 (Suppl. 1), S251–S264. [Google Scholar] [CrossRef]
  16. Reddy, C.S.; Jha, C.S.; Dadhwal, V.K. Assessment and monitoring of long-term forest cover changes (1920–2013) in Western Ghats biodiversity hotspot. J. Earth Syst. Sci. 2016, 125, 103–114. [Google Scholar] [CrossRef]
  17. Davidar, P.; Arjunan, M.; Mammen, P.C.; Garrigues, J.P.; Puyravaud, J.P.; Roessingh, K. Forest degradation in the Western Ghats biodiversity hotspot: Resource collection, livelihood concerns and sustainability. Curr. Sci. 2007, 93, 1573–1578. [Google Scholar]
  18. Ramesh, B.R.; Venugopal, P.D.; Pélissier, R.; Patil, S.V.; Swaminath, M.H.; Couteron, P. Mesoscale patterns in the floristic composition of forests in the central Western Ghats of Karnataka, India. Biotropica 2010, 42, 435–443. [Google Scholar] [CrossRef]
  19. Kumar, S.N.; Aggarwal, P.K.; Rani, S.; Jain, S.; Saxena, R.; Chauhan, N. Impact of climate change on crop productivity in Western Ghats, coastal and northeastern regions of India. Curr. Sci. 2011, 101, 332–341. [Google Scholar]
  20. Kalkhan, M.A.; Reich, R.M.; Czaplewski, R.L. Variance estimates and confidence intervals for the Kappa measure of classification accuracy. Can. J. Remote Sens. 1997, 23, 210–216. [Google Scholar] [CrossRef]
  21. Lu, D.; Weng, Q. A survey of image classification methods and techniques for improving classification performance. Int. J. Remote Sens 2007, 28, 823–870. [Google Scholar] [CrossRef]
  22. Adhikari, S.; Southworth, J. Simulating forest cover changes of bannerghatta national park based on a CA-Markov model: A remote sensing approach. Remote Sens. 2012, 4, 3215–3243. [Google Scholar] [CrossRef]
  23. Liping, C.; Yujun, S.; Saeed, S. Monitoring and predicting land use and land cover changes using remote sensing and GIS techniques—A case study of a hilly area, Jiangle, China. PLoS ONE 2018, 13, e0200493. [Google Scholar] [CrossRef]
  24. Muller, M.R.; Middleton, J. A Markov model of land-use change dynamics in the Niagara Region, Ontario, Canada. Landsc. Ecol. 1994, 9, 151–157. [Google Scholar] [CrossRef]
  25. Roy, P.S.; Roy, A.; Joshi, P.K.; Kale, M.P.; Srivastava, V.K.; Srivastava, S.K.; Dwevidi, R.S.; Joshi, C.; Behera, M.D.; Meiyappan, P.; et al. Development of Decadal (1985–1995–2005) Land Use and Land Cover Database for India. Remote. Sens. 2015, 7, 2401–2430. [Google Scholar] [CrossRef]
  26. Chawla I, Mujumdar PP Isolating the impacts of land use and climate change on streamflow. Hydrol. Earth Syst. Sci. 2015, 19, 3633–3651. [CrossRef]
  27. Garg, V.; Nikam, B.R.; Thakur, P.K.; Aggarwal, S.P.; Gupta, P.K.; Srivastav, S.K. Human-induced land use land cover change and its impact on hydrology. HydroResearch 2019, 1, 48–56. [Google Scholar] [CrossRef]
  28. Nandi, S.; Manne, J.R. Spatiotemporal Analysis of Water Balance Components and Their Projected Changes in Near-future Under Climate Change Over Sina Basin, India. Water Resour. Manag. 2020, 34, 2657–2675. [Google Scholar] [CrossRef]
  29. Liang, X.; Lettenmaier, D.P.; Wood, E.F. One-dimensional statistical dynamic representation of subgrid variability of precipitation in the two-layer variable infiltration capacity model. J. Geophys. Res. Atmos. 1996, 101, 21403–21422. [Google Scholar] [CrossRef]
  30. Lohmann DA, G.; Nolte-Holube RA LP, H.; Raschke, E. A large-scale horizontal routing model to be coupled to land surface parametrization schemes. Tellus A 1996, 48, 708–721. [Google Scholar] [CrossRef]
  31. Nijssen, B.; Lettenmaier, D.P.; Liang, X.; Wetzel, S.W.; Wood, E.F. Streamflow simulation for continental-scale river. Water Resour. Res. 1997, 33, 711–724. [Google Scholar] [CrossRef]
  32. Chandu, N.; Eldho, T.I.; Mondal, A. Hydrological impacts of climate and land-use change in Western Ghats, India. Reg. Environ. Chang. 2022, 22, 32. [Google Scholar] [CrossRef]
  33. Siderius, C.; Boonstra, H.; Munaswamy, V.; Ramana, C.; Kabat, P.; van Ierland, E.; Hellegers PJ, G.J. Climate-smart tank irrigation: A multi-year analysis of improved conjunctive water use under high rainfall variability. Agric. Water Manag. 2015, 148, 52–62. [Google Scholar] [CrossRef]
  34. Allen, R.G.; Pereira, L.S.; Raes, D.; Smith, M. Crop Evapotranspiration-Guidelines for Computing Crop Water Requirements-FAO Irrigation and Drainage Paper 56; FAO: Rome, Italy, 1998; Volume 300, p. D05109. [Google Scholar]
  35. Duan, Q.; Sorooshian, S.; Gupta, V.K. Optimal use of the SCE-UA global optimization method for calibrating watershed models. J. Hydrol. 1994, 158, 265–284. [Google Scholar] [CrossRef]
  36. Moriasi, D.N.; Arnold, J.G.; Van Liew, M.W.; Bingner, R.L.; Harmel, R.D.; Veith, T.L. Model evaluation guidelines for systematic quantification of accuracy in watershed simulations. Trans. ASABE 2007, 50, 885–900. [Google Scholar] [CrossRef]
  37. Nash, J.E.; Sutcliffe, J.V. River flow forecasting through conceptual models part I—A discussion of principles. J. Hydrol. 1970, 10, 282–290. [Google Scholar] [CrossRef]
  38. Chandu, N.; Eldho, T.I.; Mondal, A. A regional scale impact and uncertainty assessment of climate change in the Western Ghats in India. Environ. Monit. Assess. 2023, 195, 555. [Google Scholar] [CrossRef]
  39. Census of India Population Enumeration Data (Final Population). 2011. Available online: http://www.censusindia.gov.in/2011census/population_enumeration.html (accessed on 21 October 2021).
  40. Almazroui, M.; Saeed, S.; Saeed, F.; Islam, M.N.; Ismail, M. Projections of precipitation and temperature over the South Asian countries in CMIP6. Earth Syst. Environ. 2020, 4, 297–320. [Google Scholar] [CrossRef]
  41. Sadhwani, K.; Eldho, T.I. Assessing the Vulnerability of Water Balance to Climate Change at River Basin Scale in Humid Tropics: Implications for a Sustainable Water Future. Sustainability 2023, 15, 9135. [Google Scholar] [CrossRef]
  42. Du, P.; Xu, M.; Li, R. Impacts of climate change on water resources in the major countries along the belt and road. PeerJ 2021, 9, e12201. [Google Scholar] [CrossRef]
  43. Khelifa, R.; Mahdjoub, H.; Baaloudj, A.; Cannings, R.A.; Samways, M.J. Effects of both climate change and human water demand on a highly threatened damselfly. Sci. Rep. 2021, 11, 7725. [Google Scholar] [CrossRef]
  44. Karam, S.; Zango, B.S.; Seidou, O.; Perera, D.; Nagabhatla, N.; Tshimanga, R.M. Impacts of Climate Change on Hydrological Regimes in the Congo River Basin. Sustainability 2023, 15, 6066. [Google Scholar] [CrossRef]
  45. Supit, I.; Van Diepen, C.A.; Boogaard, H.L.; Ludwig, F.; Baruth, B. Trend analysis of the water requirements, consumption and deficit of field crops in Europe. Agric. For. Meteorol. 2010, 150, 77–88. [Google Scholar] [CrossRef]
  46. Kumar, M.; Savita Singh, H.; Pandey, R.; Singh, M.P.; Ravindranath, N.H.; Kalra, N. Assessing vulnerability of forest ecosystem in the Indian Western Himalayan region using trends of net primary productivity. Biodivers. Conserv. 2019, 28, 2163–2182. [Google Scholar] [CrossRef]
  47. Adejuwon, O.J. Food crop production in Nigeria. I. Present effects of climate variability. Clim. Res. 2005, 30, 53–60. [Google Scholar] [CrossRef]
  48. Tubiello, F.N.; Rosenzweig, C.; Goldberg, R.A.; Jagtap, S.; Jones, J.W. Effects of climate change on US crop production: Simulation results using two different GCM scenarios. Part I.; Wheat. potato, maize and citrus. Clim. Res. 2002, 20, 259–270. [Google Scholar] [CrossRef]
  49. Rafiei-Sardooi, E.; Azareh, A.; Shooshtari, S.J.; Parteli, E.J. Long-term assessment of land-use and climate change on water scarcity in an arid basin in Iran. Ecol. Model. 2022, 467, 109934. [Google Scholar] [CrossRef]
  50. Sharma, C.P. Overdraft in India’s Water Banks: Studying the Effect of Production of Water Intensive Crops on Ground Water Depletion. Master’s Thesis, Georgetown University, Washington, DC, USA, 2016. [Google Scholar]
Figure 1. (a) Study area: WFRB-2 region with three sub-regions of (b) Netravati and other river basins (upper); (c) Varrar and other river basins (middle); and (d) Periyar and other river basins (lower).
Sustainability 15 13459 g001
Figure 2. Proposed methodology flowchart for assessing the impact of climate change on water balance and irrigation water demand in the basin.
Sustainability 15 13459 g002
Figure 3. (i) Correlation plots of GCMs with respect to IMD (observed) climatology from 1979–2005 for monthly mean: (a) rainfall; (b) maximum temperature; and (c) minimum temperature. (ii) Comparison of rainfall climatology of GCMs with respect to observed (IMD) climatology from 1979–2005 for daily mean: (a) upper region; (b) middle region; and (c) lower region of WFRB-2.
Sustainability 15 13459 g003
Figure 4. Comparison of Climatology, streamflow calibration and validation for three river basins (gauging station): (a) Netravati (Bantwal), (b) Kadalundi (Karathodu), and (c) Meenachil (Kidangoor).
Sustainability 15 13459 g004
Figure 5. LULC maps for WFRB-2 for the year (a) 1995, (b) 2005, (c) 2016, and (d) 2030 (projected).
Sustainability 15 13459 g005
Figure 6. Spatial variation in change in (a) rainfall, (b) runoff, and (c) ET values from baseline (1981–2010) to future (2020–2050) ensemble GCM for SSP 4.5 and SSP 8.5.
Sustainability 15 13459 g006
Figure 7. Grid-wise monthly mean (mm/day) irrigation water demand (IWD) for the historical period (1981–2005).
Sustainability 15 13459 g007
Figure 8. Grid-wise change in monthly mean (mm/day) irrigation water demand (IWD) for future period (2020–2050) with respect to historic period (1981–2005).
Sustainability 15 13459 g008
Table 1. Details of the datasets.
Data TypeTime PeriodResolution Post-ProcessingSource
Meteorological data
Historical
Precipitation1981–20110.25° × 0.25°India Meteorological Department (IMD)
Temperature1981–20111.0° × 1.0°
Future GCM (CanESM5, CNRM-CM6-1, and MPI-ESM1-2-LR)
Precipitation2020–20500.25° × 0.25°
Temperature2020–20500.5° × 0.5°
Digital elevation model 200530 m × 30 mCartoDEM (bhuvan.nrsc.gov.in)
National Bureau of Soil Survey and Land Use Planning (NBSS & LUP)
Soil map 201230 arc second
Historical LULC
Future LULC
2016
2030
30 m × 30 m
30 m × 30 m
Landsat (earthexplorer.usgs.gov)
LULC projection
Gauge discharge1979–2015DailyCentral Water Commission (CWC)
Table 2. Percentage cover of different LULC classes over WFRB-2.
LULC1995200520162016 Predicted2030
Forest 27.9727.28427.0427.8528.74
Cropland10.910.83411.2911.411.4
Built-up2.122.926.646.987.91
Wasteland6.276.3473.573.462.1
Water4.123.9353.292.982.98
Plantation48.6148.6748.1447.3546.87
Table 3. Percentage Change in rainfall and total runoff due to combined impacts in three different regions of WFRB-2 for the future period (2020–2050).
SSP 4.5SSP 8.5
Netravati and Other Sub-BasinsLowlandsMidlandsGhatsLowlandsMidlandsGhats
Baseline rainfall
(mm/year)
402637032546402637032546
Rainfall (% change)−1.47−1.22−0.21−1.48−1.05−0.23
TR (% change)−0.03−2.28−0.15−0.24−2.16−0.16
Varrar and Other Sub-basinsLowlandsMidlandsGhatsLowlandsMidlandsGhats
Baseline rainfall
(mm/year)
293125481501293125481501
Rainfall (% change)−0.042.53.77−1.67−3.2−5.29
TR (% change)−2.111.42.81−2.63−2.53−3.66
Periyar and Other Sub-basinsLowlandsMidlandsGhatsLowlandsMidlandsGhats
Baseline rainfall
(mm/year)
240025831357240025831357
Rainfall (% change)0.9−1.92−0.28−0.39−2.6−0.31
TR (% change)1.3−1.62−3.06−1.71−2.0−0.93
Disclaimer/Publisher’s Note: The statements, opinions and data contained in all publications are solely those of the individual author(s) and contributor(s) and not of MDPI and/or the editor(s). MDPI and/or the editor(s) disclaim responsibility for any injury to people or property resulting from any ideas, methods, instructions or products referred to in the content.

