Article

Trace Element (As, Cd, Cr, Cu, Pb, Se, U) Concentrations and Health Hazards from Drinking Water and Market Rice across Lahore City, Pakistan

by
Wania Imran
1 and
Justin B. Richardson
1,2,*
1
Environmental Science Program, University of Massachusetts Amherst, Amherst, MA 01003, USA
2
Department of Earth, Climate, and Geographic Sciences, University of Massachusetts Amherst, Amherst, MA 01003, USA
*
Author to whom correspondence should be addressed.
Sustainability 2023, 15(18), 13463; https://doi.org/10.3390/su151813463
Submission received: 7 August 2023 / Revised: 29 August 2023 / Accepted: 4 September 2023 / Published: 8 September 2023
(This article belongs to the Special Issue Environmental and Health Risk Assessment of Heavy Metal Pollution)

Abstract

:
Exposure to toxic concentrations of trace elements in rice and drinking water is a serious issue for millions of South Asians, due to rice serving as a large portion of their diets and the geochemical enrichment of trace elements in groundwaters. The overall goal of this study was to evaluate and compare the hazards posed from toxic trace elements through the consumption of commercially available basmati rice and public drinking water sources across Lahore, Pakistan. Drinking water samples (n = 36) were collected from publicly accessible drinking taps from eight administrative towns and the cantonment. Rice samples were obtained from 11 markets (n = 33) across Lahore between December and February 2022–2023. Market rice concentrations exceeded the World Health Organization’s (WHO) limits and the Total Hazard Quotient (THQ) values exceeded 1.0 for As, Cu, and Pb, thus indicating multielement contamination. Market rice trace element concentrations and price were not correlated. As, Se, and U concentrations in drinking water were above the WHO’s drinking water guidelines and had THQ values exceeding 1.0, showing multielement contamination. Cr, Se, and U concentrations in drinking water were greater for impoverished administrative towns compared to middle and wealthy administrative towns, highlighting socioeconomic inequities in exposure to hazardous concentrations. We conclude that the citizens of Lahore are exposed to rice and drinking water that are hazardous to human health, including As and other lesser studied trace elements.

1. Introduction

Rice is a staple food for more than half of the global population, particularly in Asia, where it serves as a primary dietary component for billions of people. The cultivation of rice is an integral part of the South Asian diet and is a staple grain crop for food security [1]. Among the nations in this region, Pakistan ranks at 10th place in rice production, dedicating 3.034 million hectares of land with an overall 7.410 million tonnes of the crop produced, thus making it a prominent rice-producing nation. which is beneficial for both the provision of food within the country and the country’s economy [2]. However, concerns continue to mount about the safety of consuming domestic rice in light of toxic levels of trace elements present [3]. In the context of Pakistan, the possible effects of rice crops as the second most consumed grain in the country are pressing [4]. As a significant portion of the population relies on rice as a dietary staple, there is an increased likelihood of exposure to these elements, with ingestion being the primary cause of harmful exposure to toxic trace elements [5]. Furthermore, the water used to grow and irrigate rice crops as well as domestically used drinking water to cook the rice pose additional potential risks to human health [6]. The United States Food and Drug Administration (FDA) notes that cooking and rinsing rice in clean water is an effective way of limiting arsenic exposure. However, when the water itself contains elevated levels of trace elements, the risk of exposure amplifies. For example, prolonged exposure to arsenic can result in a multitude of severe health risks including but not limited to hypertension, skin lesions, neurodegeneration, cancer and cardiovascular disease [7].
Though essential trace elements are required by plants in small quantities for growth and development, they can be considered a double-edged sword when their concentrations exceed the permissible limits [8]. Toxic trace elements in soils and drinking water in Pakistan can originate from various anthropogenic activities such as mining, industrial production, and municipal consumption and refuse [9,10]. Coal mining, synthetic industries, and burning waste are all anthropogenic sources of trace elements that may lead to them seeping into agricultural production [11,12]. However, one of the dominant sources of trace elements to agricultural soils and drinking water resources is natural sources [10,11]. Alluvial plain deposits in eastern Pakistan originated from the erosion and transport from the Himalayas during the Holocene Period contain elevated trace element concentrations [13]. Trace elements of specific concern, particularly As, Cd, Pb, Ni, U, are found in background to elevated concentrations in soils and near surface aquifers across the region of Punjab [10,13,14]. This is particularly true for the Punjab and Sindh regions, which are the top agricultural-commodity-producing regions within Pakistan [7,10]. As a prime example, of the 110 groundwater samples collected across Punjab in 2017, 40% exceeded the WHO’s guideline limit of >50 µg/L for As, and 41% exceeded the WHO’s guideline limit of >15 µg/L for U [7]. Though some trace elements serve benefit to human health at lower doses such as Cu, Se, Cr, elevated levels of these elements in rice pose potential health risks when they enter the food chain through an essential part of the diet for millions of Pakistani people [10,14].
The overall goal of this study was to evaluate and compare the hazards posed from toxic trace elements through the consumption of commercially available basmati rice and public drinking water sources across Lahore, Pakistan. First, we hypothesized that basmati rice does not contain hazardous concentrations of trace elements. We expected that commercially available rice would meet international health standards and that hazardous concentrations would not be related to the price of the rice. Second, we hypothesized that drinking water would not contain hazardous concentrations of trace elements as it should be treated and originate from aquifers with permissible trace element concentrations, unlike groundwater resources in rural areas. We expected elevated concentrations of As but that not other trace elements would reach or exceed the World Health Organization’s (WHO) limits. Moreover, we expected that water quality would be comparable among administrative towns despite varying socioeconomic levels within Lahore. This information is needed to characterize the daily hazard related to trace element exposure by the denizens of the administrative districts of Lahore and highlight the need for personal safety practices.

2. Materials and Methods

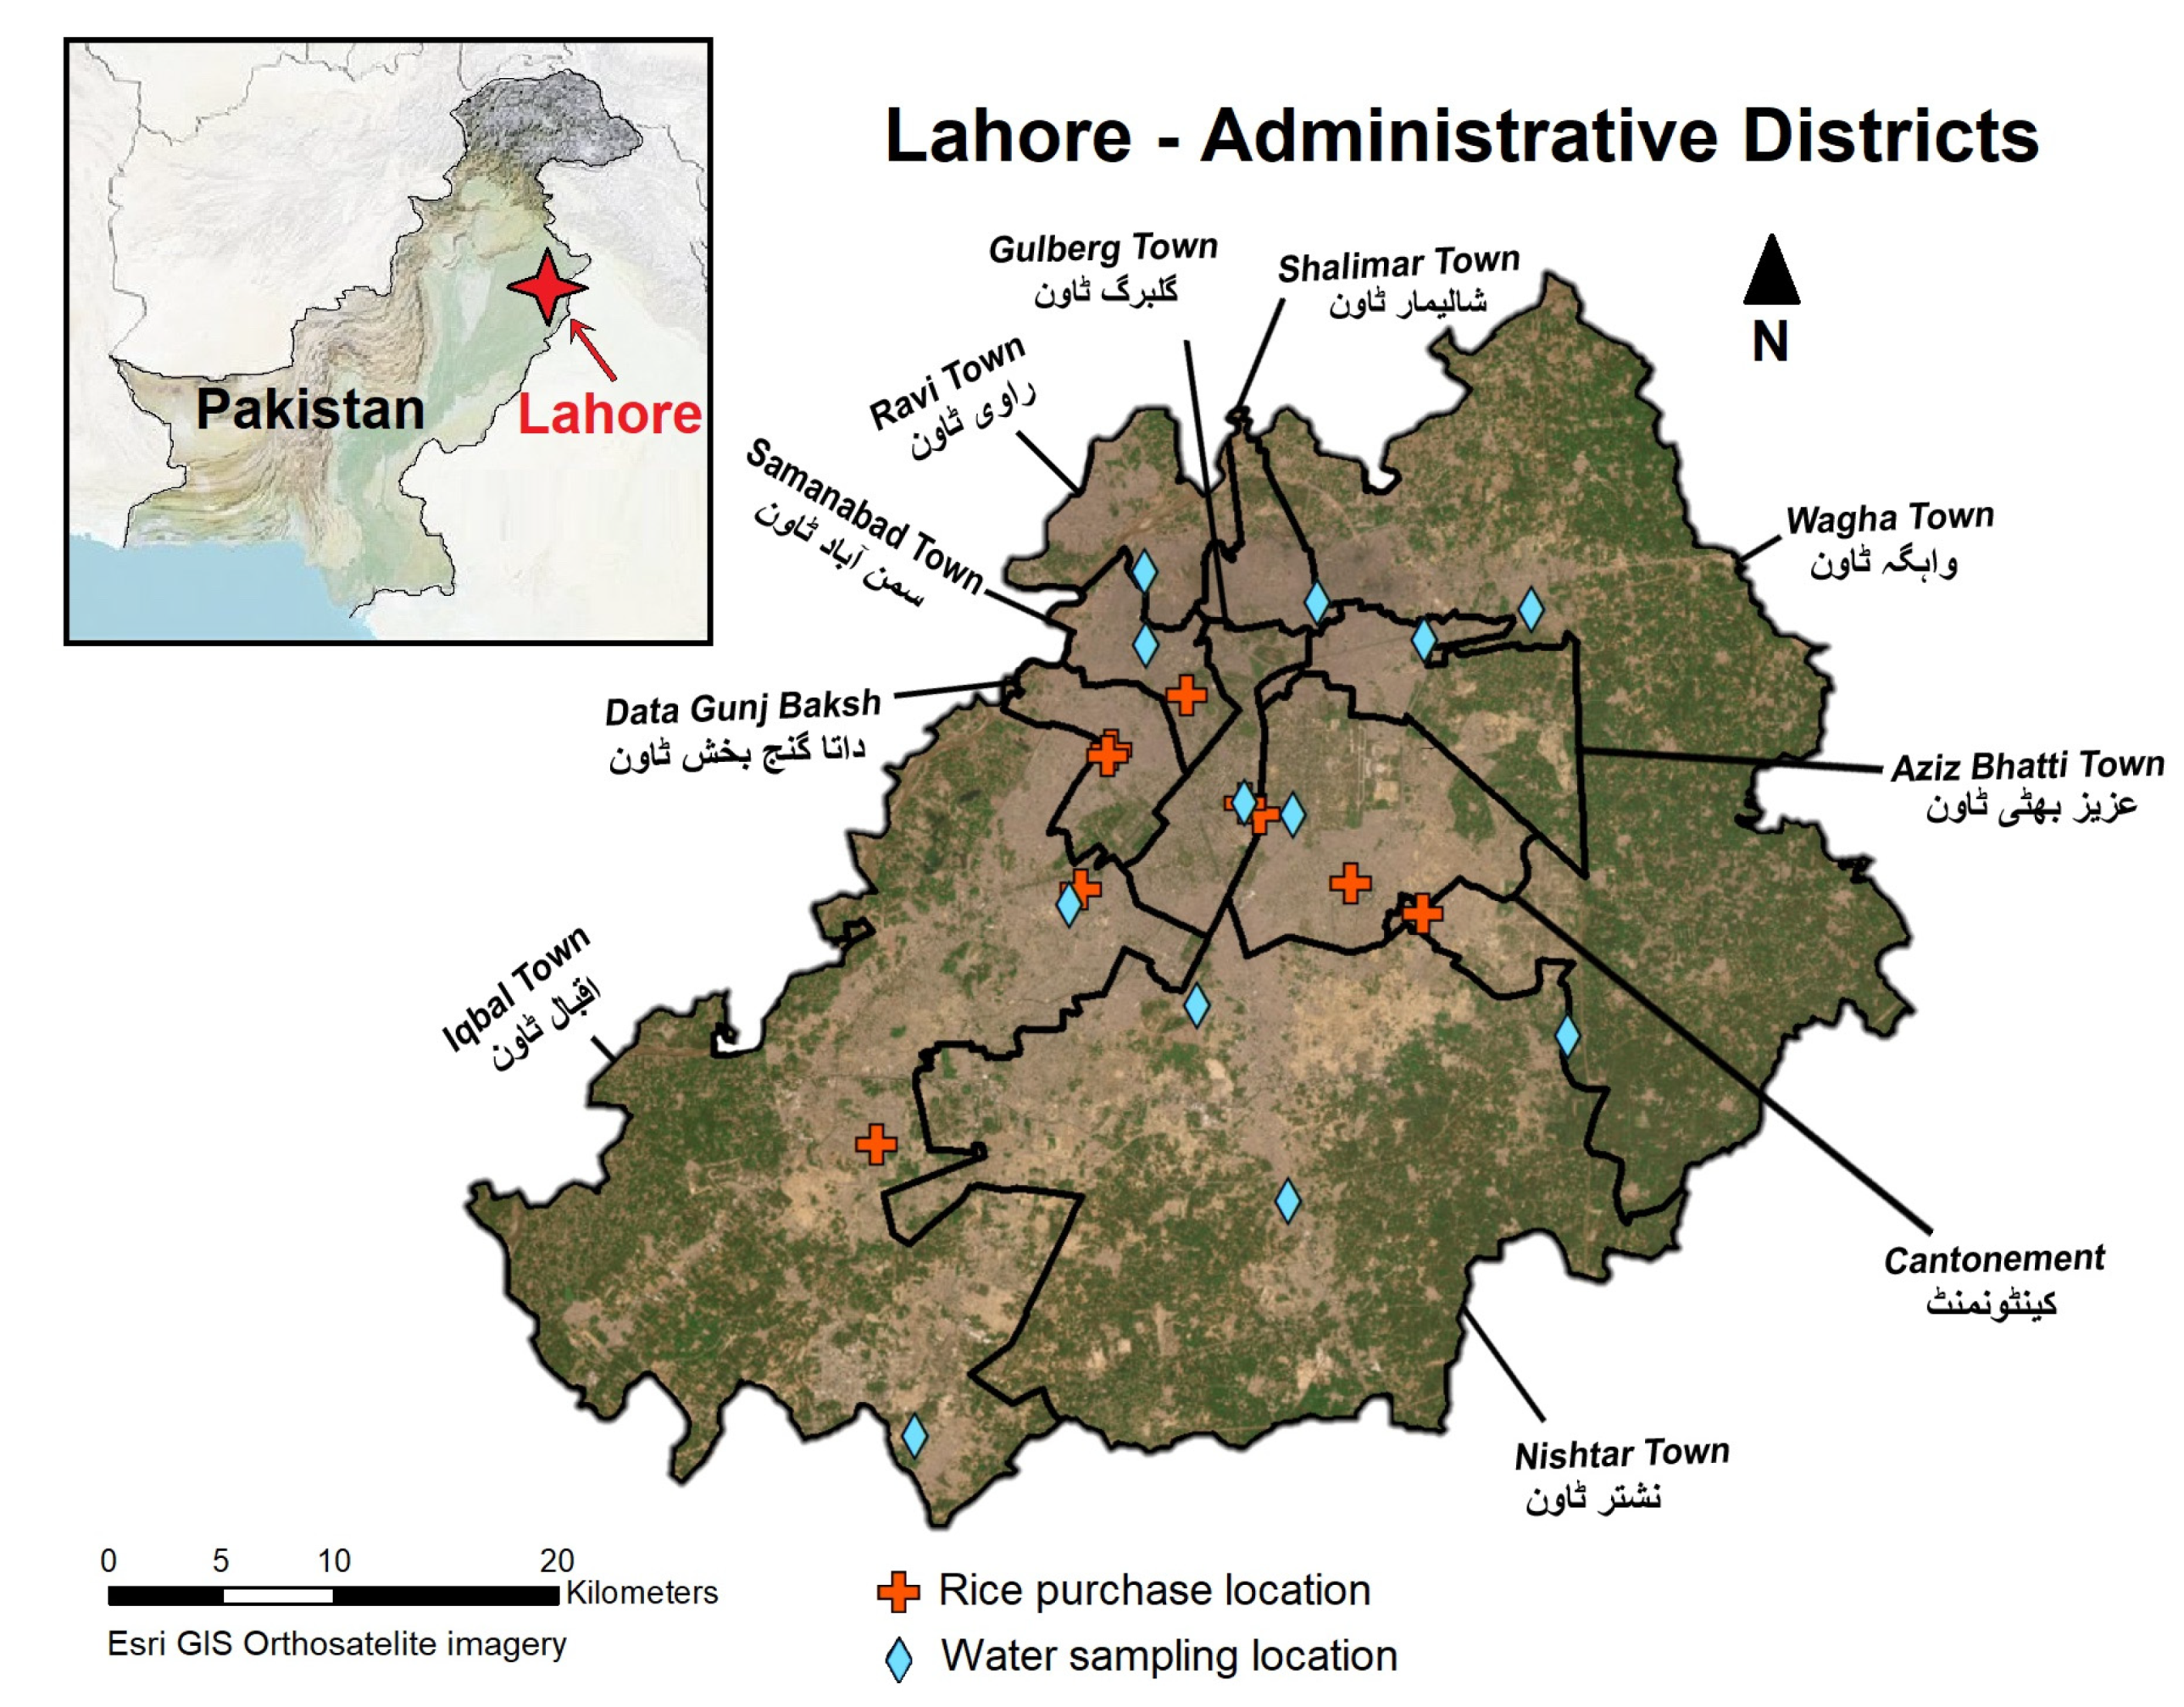
2.1. Description of Lahore, Pakistan Study Area

This study was conducted in the capital of Pakistan’s Punjab province, Lahore, which is the second largest city in Pakistan with a population of 11.1 million residents. Lahore presents a great socio-economic divide between administrative areas based on many factors such as unemployment rates, asset possession, literacy rate and contribution to the gross domestic product (GDP). The city of Lahore comprises nine administrative towns and a cantonment (Figure 1). These towns can be divided into three broad socioeconomic status (SES) categories, wealthy class, middle-class and impoverished class based on non-standardized indices (NSI). According to the classification through results from a component matrix, Cantonment and Aziz Bhatti town are classified as wealthy, Gulberg, Samanabad, Data Gunj Baksh and Ravi towns are classified as middle-class, and Shalimar, Wagah, Nishtar and Iqbal towns are classified as impoverished. Middle-class towns present the highest population density, with Ravi having an approximate 1.0 million residents. The north of the city presents the lowest population size, with Wagha and Aziz Bhatti town both having an approximate 0.62 million residents [14].

2.2. Drinking Water and Market Rice Grain Collection and Processing

Drinking water samples were collected from 12 public locations in triplicate (36 samples total) between December and February 2022–2023. The samples were collected in acid-washed 250 mL polyethylene bottles. During the sample collection of drinking water, each bottle was filled from the tap, dumped out, and re-filled without gaseous headspace. This was repeated within the same day but not in tandem. Water samples were collected from publicly accessible water drinking taps from eight administrative towns and the cantonment. The three towns with an area greater than 100 km2, Wagha Town, Iqbal Town and Nishtar Town, were divided into north and south regions, with a sample being collected from each.
Market rice was obtained from 11 large commercial markets (giving a total of 33 rice samples) spatially distributed across Lahore between December and February 2022–2023, a product of the kharif season (May–June plantation, harvested in October–December). Only Pusa basmati rice (Oryza sativa Linn) varieties were purchased to avoid varietal differences. These rice samples were dehulled and came from one of two rice growing zones in Pakistan: Zone-II in Punjab, located between the Ravi and Chenab rivers, and Zone-III in Sindh, located right at the bank of the Indus River.

2.3. Digestion and Analyses

The drinking water samples were analyzed for pH, electrical conductivity (EC), and oxidation reduction potential (ORP) using Atlas Scientific probes (Ixian industrial kits, Atlast Scientific, Long Island City, NY, USA). The drinking water samples were shipped to the University of Massachusetts Amherst, then acidified with 67% trace metal grade HNO3 to pH 1 and analyzed for trace elements following the EPA method 3005 (Cr, Ni, Cu, Zn, As, Se, Sr, Cd, Sn, Sb, W, Pb, Th, U) with an Agilent 7700x Inductively Coupled Plasma—Mass Spectrometer (ICP-MS; Agilent Technologies, Santa Clara, California, USA) under no gas mode, pentuplet measurement replicates, check standards at every 10 samples, 12 point calibration curves, and power calibration curves. The limit of detection (LOD) were 0.006 µg/L for As, 0.002 µg/L for Cd, 0.07 µg/L for Cr, 0.001 µg/L for Cu, 0.02 µg/L for Pb, 0.007 µg/L for Se, and 0.001 µg/L for U. Macroelements (Al, Fe, Ca, K, Mg, Na, Mn, P) were measured using an Agilent 5110 Inductively Coupled Plasma Optical Emission Spectrometer (ICP-OES) under axial mode, pentuplet replicates, nine point calibration curves, and power calibration curves. The limit of detection (LOD) for macroelements was 5 µg/L.
Market rice samples were shipped to the University of Massachusetts Amherst and crushed to <0.1 mm diameter using an agate mortar. Rice powder subsamples were digested and analyzed following a modified EPA method 3050B. First, the rice powder was ashed in a muffle furnace at 550 °C for 14 h to remove carbon prepared for digestion using 5 mL of aqua regia (9:1 trace metal grade HNO3:HCl from Fisher Scientific) in 50 mL centrifuge tubes. The digestate was then heated to 90 °C using a tube rack heater for 1 h. Each sample was then diluted to 50 g and diluted to a 1:3 ratio using 18.2 MΩ de-ionized water. The mass of each sample digest and dilution steps were recorded. Batches of samples included certified reference materials, procedural blanks, and sample duplicates. NIST (National Institute of Standards and Technology) standards were used: peach leaves SRM 1547 and wheat flour SRM 1567b were used as certified reference materials for As, Cd, Cu, Cr, Pb, Se, and U concentrations (National Institute of Standards and Technology Gaithersburg, MD). Like water samples, rice dilutions were analyzed for trace elements using an Agilent 7700x ICP-MS and macroelements Agilent 5110 ICP-OES. Measured macro and trace element concentrations for Peach Leaves SRM 1547 and wheat flour SRM 1567b were 87 to 103% of their certified concentrations. The blanks for macro elements were <LOD and blanks for trace elements were <0.010 µg/L.

2.4. Exposure Risk Assessment

To determine the exposure and risk from trace elements (As, Cd, Cr, Cu, Pb, U, Se) from the market rice and drinking water, the total hazard quotient (THQ) and lifetime cancer risk (LCR) were calculated (for example, see Ali et al. [15]). First, we determined the estimated daily intake (EDI) of rice and water separately, which was calculated using Eq 1. EDI (mg/kg/bw/day) is the amount of trace element consumed by an individual; C (mg/kg) is the concentration of trace element concentration in each rice and water sample; CR (kg/day) is the consumption rate of water and rice in a day; bw is the mean body weight of an adult Pakistani individual (male and female adults). The consumption rate for water was 2 L/capita/day and the consumption rate for rice was calculated to be 46.6 g/day using the annual rice consumption rate provided at 17 kg/capita for Pakistan in the 2022 Annual Country Report—Pakistan by the World Food Program (WFP) [16].
EDI = (C × CR)/bw
The EDI was then used to calculate the target hazard quotient (THQ) using Equation (2). Reference oral doses (RfDs) set for trace elements by the US EPA were used for THQ calculations.
THQ = EDI/RfD
THQ < 1 indicates no significant risk of non-carcinogenic effects.
To calculate the risk of consumption over time, especially in terms of Uranium content in water, the lifetime cancer risk (LCR) was also calculated using the EDI and the slope factor (SF = 1.5 mg/kg/day for As, 6.1 mg/kg/day for Cd, 0.5 mg/kg/day for Cr, 0.004 mg/kg/day for Cu, 0.0085 mg/kg/day for Pb, 0.04 mg/kg/day for Se, and 1.5 mg/kg/day for U) based upon values set by the US EPA [17]. The acceptable upper limit set for the LCR is 1.0 × 10⁻⁴.
LCR = EDI × SF

2.5. Data and Statistical Analysis

ArcGIS Pro software was used to map field sites. Matlab R2022b (MATLAB 9.13) was used for data analysis and figure production. Comparisons among towns were calculated using the Kruskal–Wallis test and linear regressions were used to assess significant correlations among the elemental data. Statistical tests between results in our study and other studies utilized two sample t-tests. Market rice and trace element concentrations are available in Table S1 and S2 in Supplementary Materials.

3. Results and Discussion

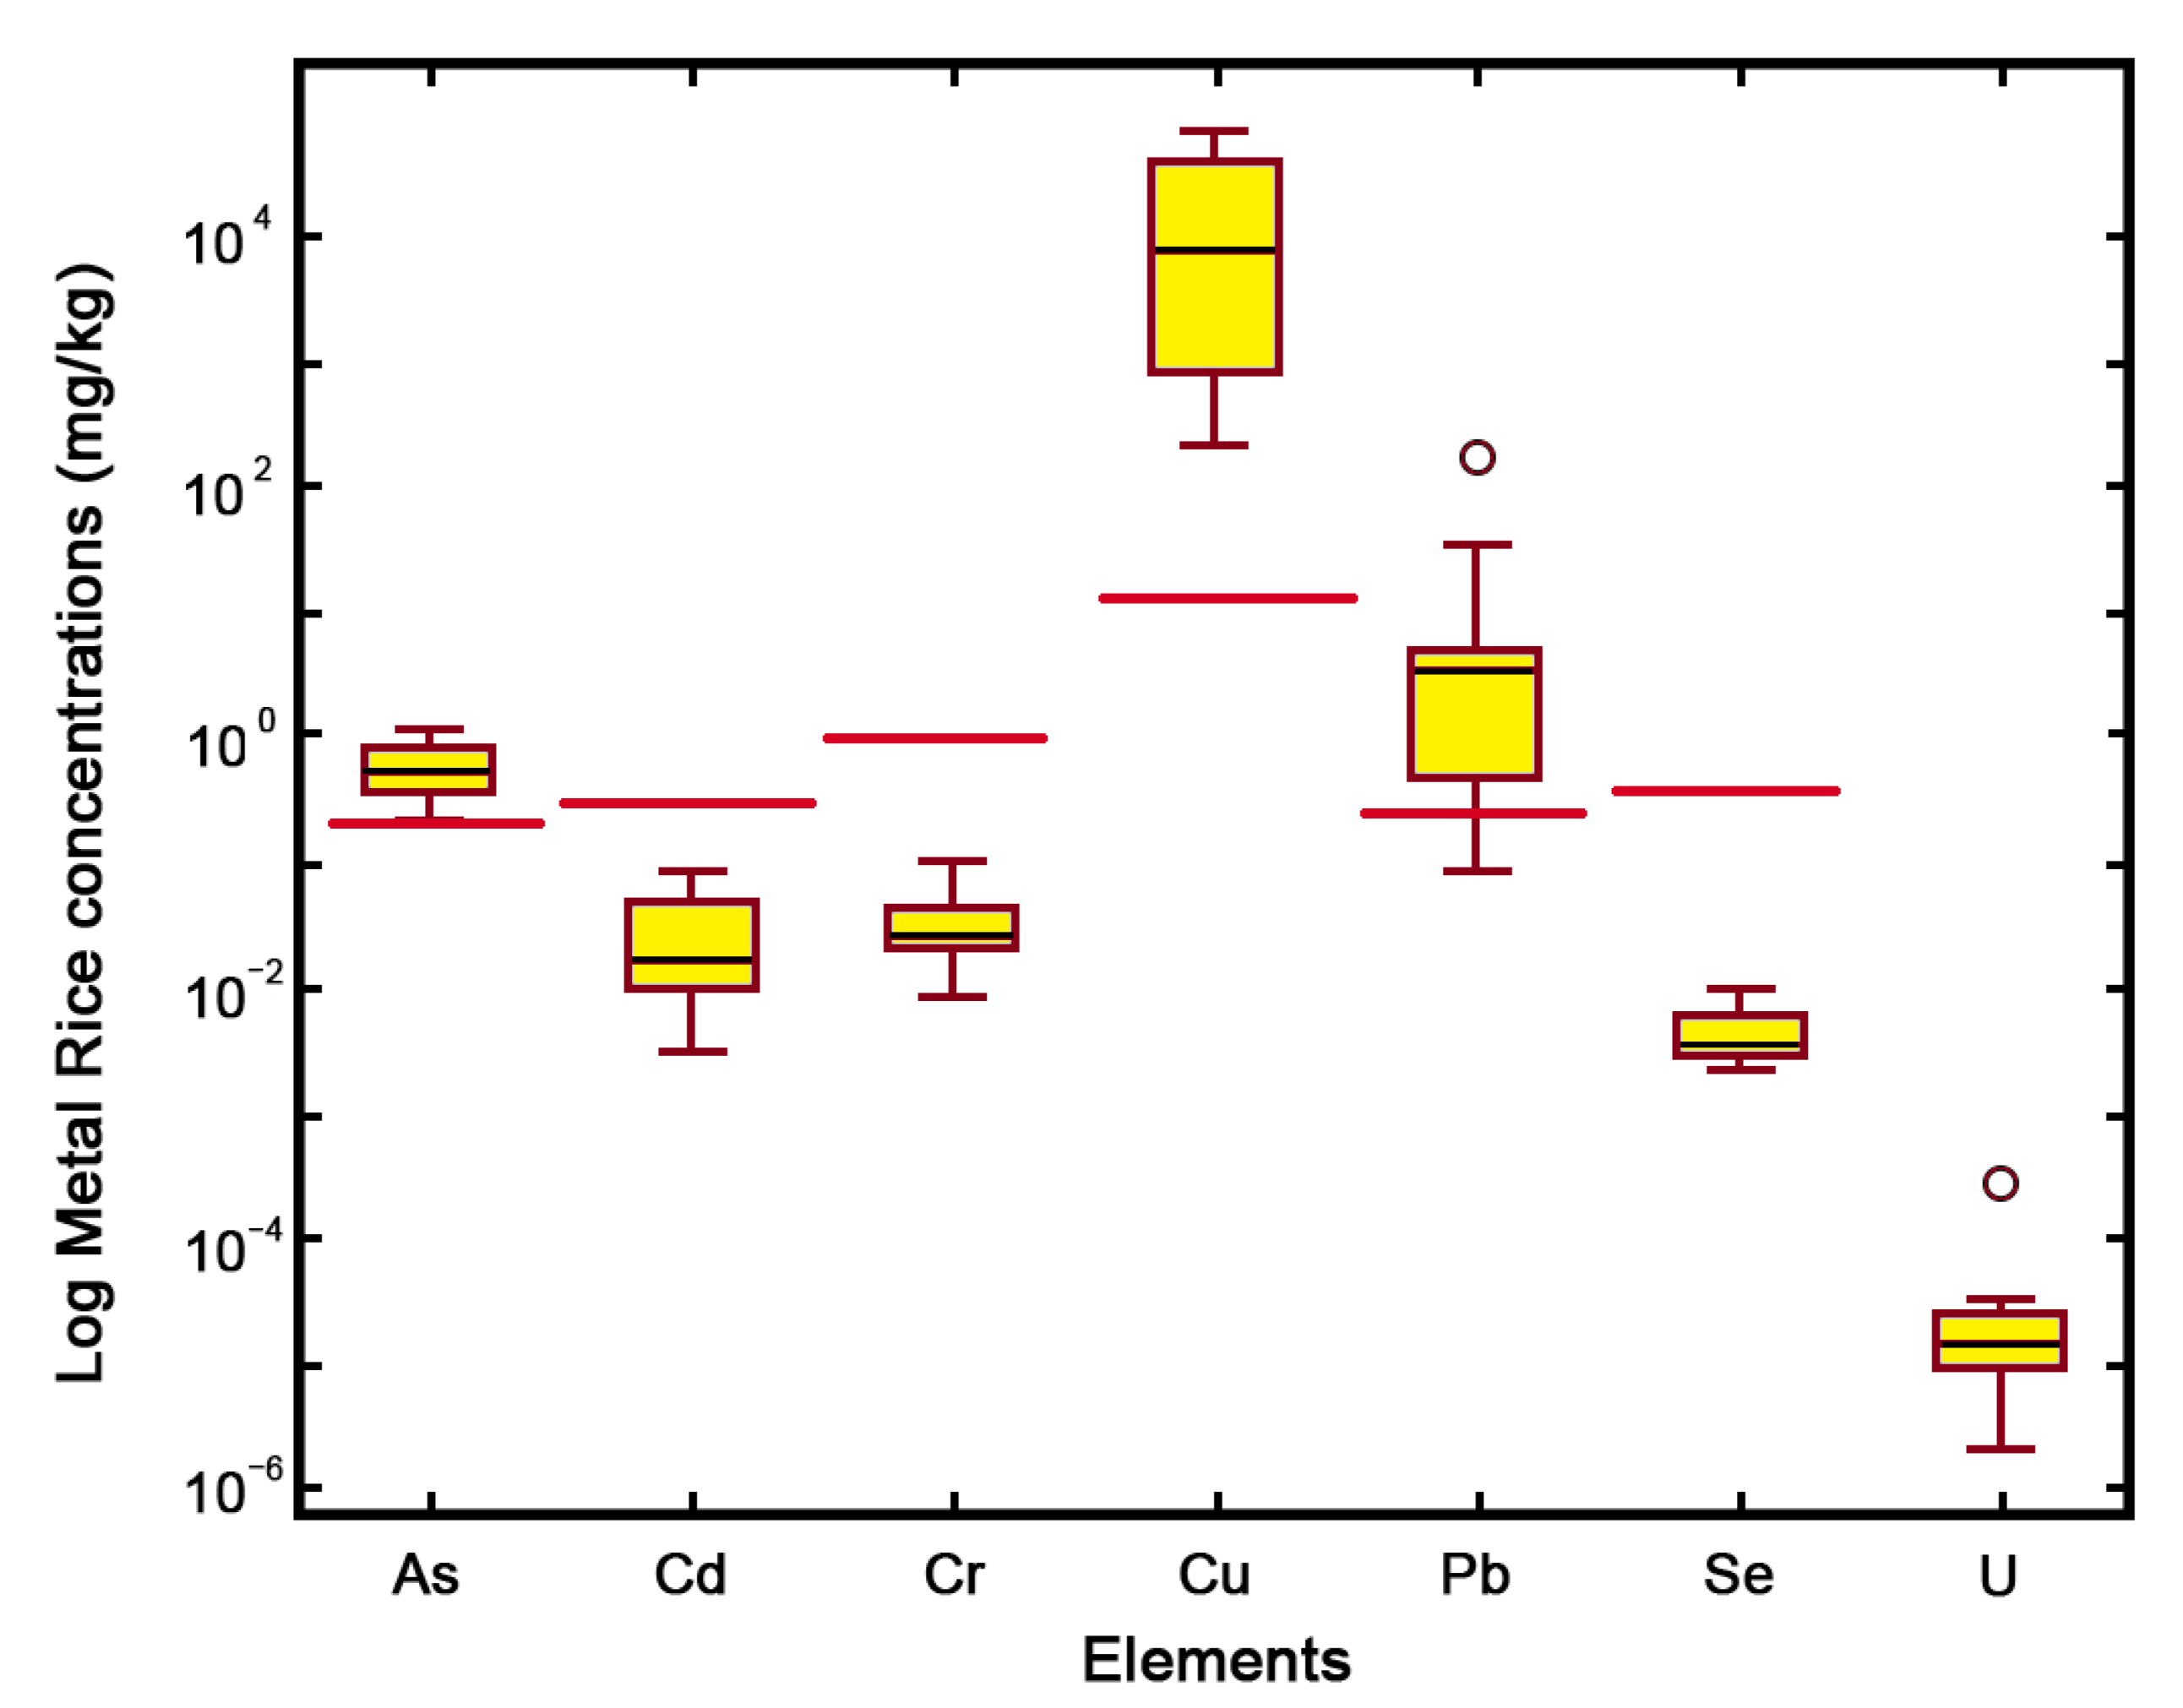
3.1. Market Rice Grain Trace Elements and Risk Assessment

Market rice’s mean trace element concentrations were calculated to be 0.77 ± 0.09 mg/kg As, 0.20 ± 0.07 mg/kg Cd, 0.22 ± 0.03 mg/kg Cr, 57 ± 16 mg/kg Cu, 2.3 ± 0.9 mg/kg Pb, 0.09 ± 0.01 mg/kg Se, 0.009 ± 0.003 mg/kg U. The market rice concentrations of As, Cr, and Se exhibited the lowest variation within a factor of 2x (Figure 2). Hence, the exposure rates to trace element concentrations of As, Cr, and Se were consistent across the market rice. Conversely, Cd, Cu, Pb, and U had variability of 3x to an order of magnitude (Figure 2). Thus, there was brand dependence on exposure to Cd, Cu, Pb, and U. Our results match observations noted in previous studies conducted in other regions of Pakistan: Bibi et al. [18] conducted research in Gujranwala, Hafizabad, Vehari, Mailsi, and Burewala within the Punjab region of Pakistan, Sarwar et al. [3] conducted studies across Lahore, Faislabad, Gujranwala, Sargodha, Rawalpindi, Multan, Okara, Swat, Batkhela, Peshawar, Mardan, Shergarh, Karachi and Quetta, and Nawab et al. [19] conducted research in Khyber Pakhtunkhwa, Pakistan. Market rice grain concentrations in our study exceeded the WHO’s concentration limitations for As (0.2 mg/kg), Cu (10 mg/kg), and Pb (0.20 mg/kg) [20].
Figure 2 shows that these concentrations were significantly lower than concentrations from other regions in developed nations but were in the range of other studies conducted in Pakistan. These concentrations were significantly higher than those found in white rice grown in California, Louisiana, and Texas in the United States, which presented trace element concentrations of As 0.13 mg/kg, Cd 0.011 mg/kg, Cu 2.5 mg/kg, and Pb 0.006 mg/kg [21]. Similarly, our results were significantly higher than those found for rice grown in Korea, as Jung et al. [22] measured Cd 0.021 mg/kg, Cu 1.9 mg/kg, and Pb 0.21 mg/kg. Our market rice grain concentrations were within the ranges of previous studies in Pakistan but there were significant differences. Market rice grain As concentrations were significantly higher than those reported in Bibi et al.’s [18] (0.4 mg/kg) and Nawab et al.’s work [19] (0.41 ± 0.11 mg/kg). Market rice grain Cd concentrations were significantly lower than those measured by Tariq and Rashid [23] (0.86 ± 0.37 mg/kg) but comparable with those from Bibi et al.’s [18] (0.12 mg/kg) and Nawab et al.’s work [19] (0.09 ± 0.03 mg/kg). Market rice grain Cr concentrations were significantly lower than those found in Tariq and Rashid’s [23] (6.9 ± 1.7 mg/kg), Bibi et al.’s [18] (8.0 mg/kg) and Nawab et al.’s research [19] (2.44 ± 1.71 mg/kg). Lastly, market rice grain Pb concentrations were significantly greater than those measured by Nawab et al. [19] (0.26 ± 0.07 mg/kg), comparable with those found in Bibi et al.’s work [18] (4.3 mg/kg), but significantly lower than Tariq and Rashid’s reports [23] (46 ± 2 mg/kg).
To investigate whether market rice quality affected trace element concentrations, we compared their concentrations with prices in Pakistani rupees at the market at the time of purchase. We expected a negative correlation between the market price and the trace element concentrations owing to higher standards of agricultural practices commanding higher prices in Pakistani rupees. However, we did not find a significant correlation between the rice market price and As, Cd, Cu, Cr, Pb, Se, or U concentrations (Figure 3). This suggests that rice quality for potentially toxic trace element concentration exposures is not related to the market price. Instead, the market price of rice is typically controlled by costs for transportation from field to market, communication and business expenses, credit for capital and equipment, and storage facilities [24].
The consumption of rice containing potential toxic trace elements by the millions of denizens is a critical health issue in the developing country of Pakistan. The mean EDI was calculated by taking the mean rice trace element concentrations, annual rice consumption rate provided as 17 kg/capita for Pakistan and 63 kg for the mean body mass for an adult Pakistani. The EDI was further contextualized by using the trace element-specific reference oral dose to determine the THQ and HI, which suggests it is hazardous to consume. Our results show that, as expected, market rice generated As THQ values far exceeding 1.0, indicating that the consumption of rice poses a direct risk to human health. More interestingly, market rice THQ values for Cd, Cu, and Pb also exceeded 1.0 for several market rice samples (Table 1). These results match observations noted by Bibi et al. [18], who posit that the consumption of market rice grains poses a direct hazard to consumer health. These results highlight that market rice at the point of purchase for regular consumers poses a hazard to human health.
Similar to THQ, the consumption of rice containing potential toxic trace elements also poses risk for cancer in Lahore, Pakistan. The trace element-specific cancer slope factor to determine the LCR, which suggests that the rice poses a hazard to cancer development when LCR > 10−4 and is thus considered an unacceptable risk for cancer by the US EPA [17]. Our results show that market rice generated As LCR values far exceeding the 1.0 × 10⁻⁴ threshold, indicating that the consumption of market rice poses a direct risk to cancer formation (Table 2). Fortunately, the other trace elements, Cd, Cu, Pb, Se, and U, did not exceed the LCR values of 1.0 × 10⁻⁴ threshold, implying that only As and Cr may be a cancer risk in the market rice.
As described in previous soil–plant field studies in this region of Pakistan and beyond, such as Iran [25], Bangladesh [23,26], and India [27], these high trace element concentrations in crops are most likely due to irrigation water (both wastewater/groundwater) containing elevated trace element concentrations [28]. As reported by previous studies, the quality of irrigation water needs to be monitored during rice cultivation in the study area [18].

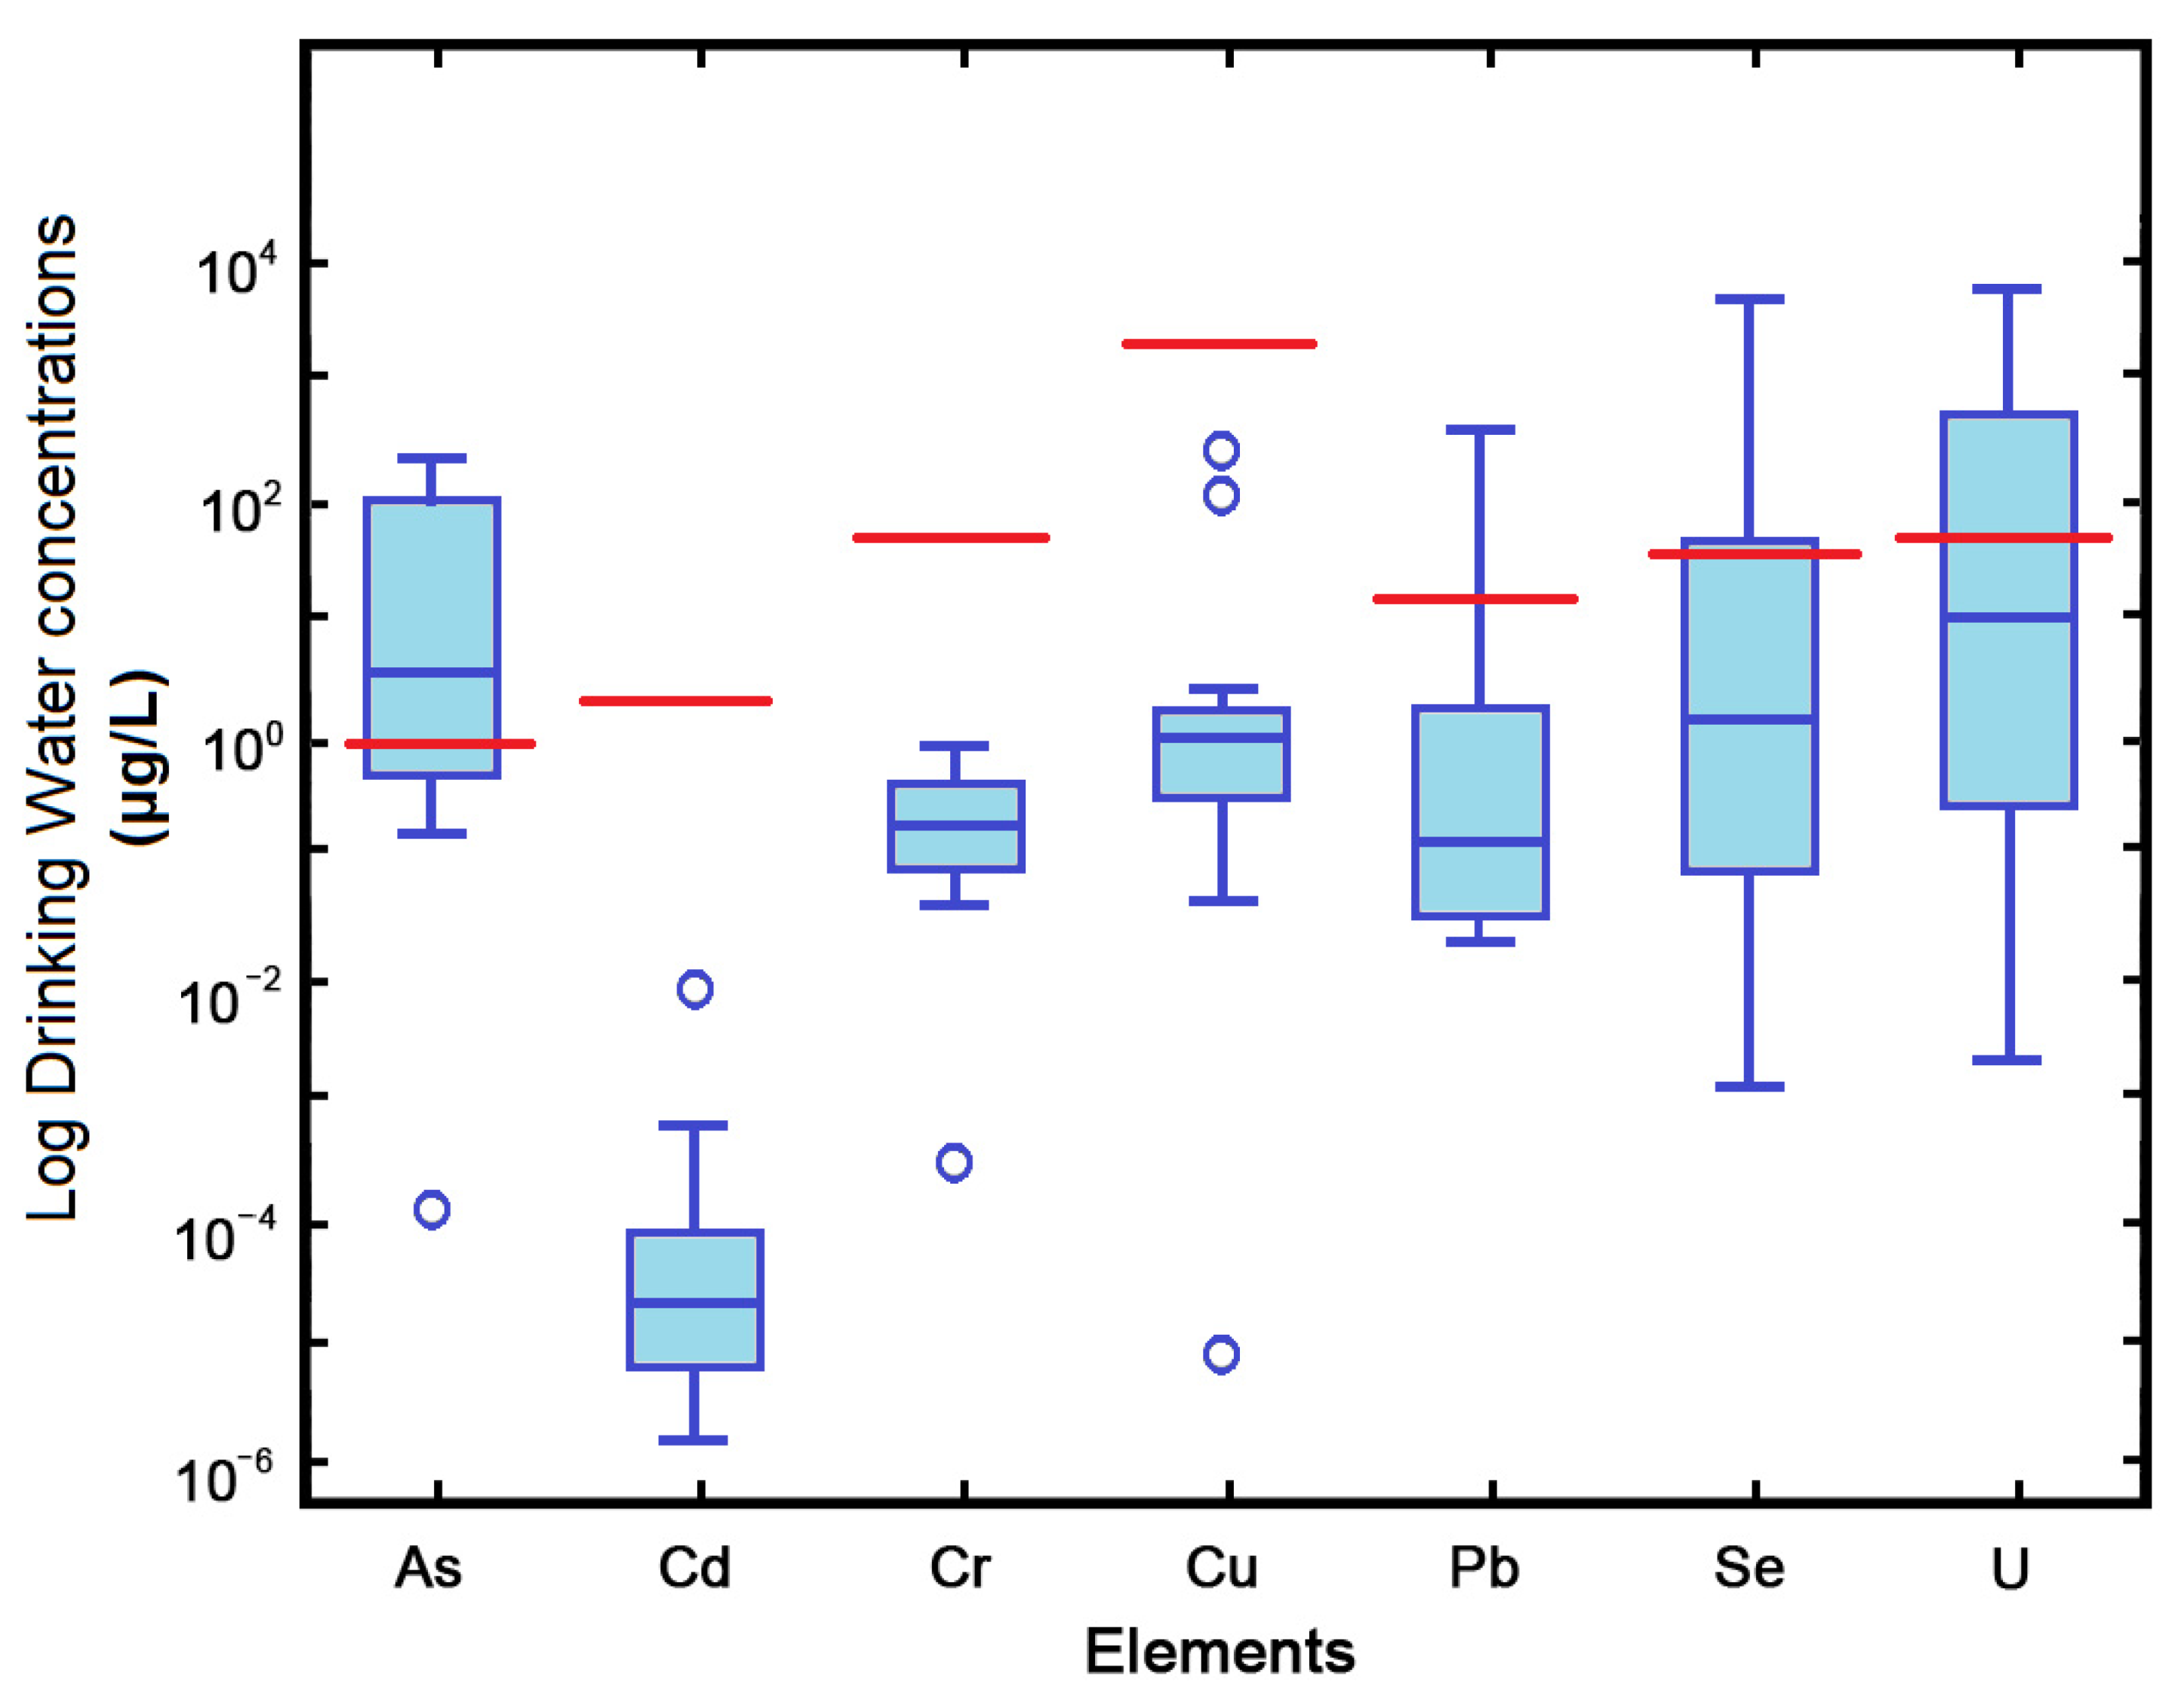
3.2. Drinking Water Trace Elements and Risk Assessment

Drinking water samples had mean trace element concentrations of 20.5 ± 6.1 µg/L As, 0.02 ± 0.01 µg/L Cd, 0.12± 0.02 µg/L Cr, 2.3 ± 1.0 µg/L Cu, 0.11 ± 0.07 µg/L Pb, 25 ± 14 µg/L Se, 32.1 ± 12.7 µg/L U. Cr and Cu drinking water concentrations exhibited the lowest variation within a factor of 3x (Figure 4). Thus, the exposure to trace element concentrations of Cr and Cu was consistent across the drinking water of Lahore. Conversely, As, Cd, Pb, Se, and U had variability of one or two orders of magnitude (Figure 4). Thus, there was an administrative town- and location-specific dependence on exposure to As, Cd, Pb, Se, and U. Several drinking water concentrations in our study exceeded the WHO’s concentration limitations for As (10 µg/L), Se (40 µg/L) and U (30 µg/L) concentrations, but were far below those set for Cd (3 µg/L), Pb (10 µg/L), and Cu (3000 µg/L) [29]. The drinking water in our study should meet the WHO’s standards, unlike rural, shallow wells in other studies carried out in the Punjab region of Pakistan [29], but our results highlight that drinking water poses a hazard to human health.
Our results, shown in Figure 4, were significantly lower than the concentrations reported in other regions in developed nations. The drinking water samples exceeded the US EPA’s drinking water standards for As (50 µg/L), Se (50 µg/L), and U (30 µg/L) concentrations, but were far below those set for Cd (5 µg/L), Pb (15 µg/L), and Cu (1300 µg/L). The As concentrations in drinking water in our study were greater than those found in 4547 water samples throughout Punjab as measured by Toor and Tahir [30] (6 to 12 µg/L); however, this study’s concentrations were comparable to 48 drinking water samples researched in Lahore, Pakistan, by Akhter et al. [31] for As (36 ± 3 µg/L). The Cd, Cr, and Cu concentrations in the drinking water samples in our study were comparable to ranges observed in shallow and deep drinking water groundwaters across Pakistan, as reviewed by Waseem et al. [32]. The Pb concentrations measured in our drinking water were significantly lower than those found in the 48 drinking water samples in Lahore, Pakistan, by Akhter et al. [31] for Pb (1.8 ± 0.5 µg/L).
To investigate whether socioeconomic factors leading to inequity in drinking water quality affected trace element concentrations, we compared their concentrations across socioeconomic classifications for each town: Middle+Wealthy class and Impoverished class (Aziz et al. [33] defined these as Rich, Middle, Poor). These classes were defined according to literacy, access to education, unemployment, gross domestic production, and household possessions. We expected wealthier areas to have lower trace element concentrations owing to higher standards of water treatment and improved infrastructure for providing water within Lahore, Pakistan. We found significantly lower drinking water concentrations of Cr, Se, and U for drinking water in middle+wealthy administrative towns than those reported for impoverished administrative towns (Figure 5). However, the toxic concentrations of As were not significantly different among the socioeconomic groups, suggesting that As in drinking water is ubiquitous and not associated with lesser treatment of water for consumption. However, our data suggest that Cr, Se, and U toxic trace element concentration exposures are related to factors that vary among socioeconomic areas, such as the quality of groundwater resources, the post-extraction treatment of groundwater, and infrastructure for delivering water to residences and public places (as mentioned by Waseem et al. [32]). As described by Aziz et al. [33], combating inequality in education and income is only part of the building blocks of a successful life, as health and sanitation are also required. While these results show that socioeconomic class does not protect against the consumption of toxic concentrations of trace elements, wealthier individuals can obtain items to further decrease their consumption of this drinking water, while those in lower socioeconomic positions cannot. Even worse, those in more impoverished areas receive the burden of concentrations of Se and U higher by an order of magnitude in their drinking water. In addition to the natural bedrock sources, historical and legacy urban pollution may also be negatively impacting drinking water as emissions and leakages from mine/smelter wastes, phosphate sewage sludge, and municipal waste landfills can contaminate groundwater resources [11,32,34,35].
We leveraged the THQ to examine whether trace element concentrations would pose a health hazard for Lahore residents at the noted consumption rates. Our results show that, as expected, the drinking water As THQ values far exceeded 1.0, indicating there is a direct risk to human health (Table 3). More interestingly, the drinking water THQ values for Se, and U also exceeded 1.0 for several drinking water collection sites. These results agree with those of Ali et al. [15], who found As and U THQ in groundwater in the Punjab and Sindh province exceeded the THQ threshold values of 1.0. Our results match the observations noted by Ahmed et al. [36] of Cd and Pb concentrations far below toxic levels for individuals in the Sindh region of Pakistan, who studied school-aged children.
Furthermore, LCR was calculated to estimate whether the consumption of drinking water containing elevated trace elements also poses a risk for cancer in Lahore, Pakistan. The trace element-specific cancer slope factor was used to determine the LCR, which suggests it poses a hazard to cancer development when LCR > 10−4, and is thus considered an unacceptable risk for cancer by the US EPA [17]. Our results show that the drinking water contained high enough As, Se, and U LCR values, which exceeded the 1.0 × 10⁻⁴ threshold, indicating there is a direct risk to cancer formation from drinking water consumption (Table 4). Fortunately, the other trace elements did not exceed the LCR values of the 1.0 × 10⁻⁴ threshold. These results agree with those of Ali et al. [15], who found that the As and U LCR values in groundwater in the Punjab and Sindh province exceeded the LCR cancer threshold of 1.0 × 10⁻⁴ as well. Our results match observations noted by Ahmed et al. [36] of Cd and Pb concentrations levels in the Sindh region of Pakistan far below hazard level for cancer development.

4. Conclusions

Our study found further evidence that market rice for consumption by the millions of residents across the major city of Lahore, Pakistan, contains trace element concentrations that are above the concentrations considered to be safe for humans. The market rice THQ values for As, Cd, Cu, and Pb also exceeded the hazardous guidelines across several markets and only the LCR values for As suggest a potential hazard for developing cancer over a lifetime of market rice consumption. The widespread contamination of rice in Lahore, Pakistan, is a public health hazard and adds burdens onto communities dealing with potential food insecurity issues. Washing can remove a portion of trace elements, from 3 to 38% [25], but the drinking water also contained elevated trace elements and may be an additional source of trace elements when cooking rice. We assert that the problem begins in the agricultural soils and can be improved with mitigating procedures including safe agrochemical use [22] and safe irrigation water use [32]. Our findings also dispel speculation that more expensive rice is of higher quality and less likely to contain toxic trace element concentrations. There was no correlation between the market price of rice and its concentration of trace elements.
Our study also found that drinking water contained elevated concentrations of As, Se, and U across the administrative towns of Lahore, Pakistan. The THQ and LCR values for As, Se, and U exceeded the thresholds for toxicity to humans and pose a hazard for developing cancer over a lifetime of consumption. Although not addressed explicitly in our study, children who have lower body mass values are likely to be more greatly impacted as, in this study, we only utilized adult body mass. We hypothesized that drinking water quality would be higher in wealthier administrative towns and found some evidence that partially supports this hypothesis. The Cr, Se, and U concentrations in drinking water were higher in impoverished towns, which follows global inequity problems in which individuals living in lower socioeconomic areas hold less economic and sociopolitical power and are subjected to greater environmental health hazards in Pakistan and beyond [37]. As outlined by Waseem et al. [32], ensuring the use of safe aquifers, improvements in post-extraction treatment of groundwater, and a safe infrastructure for transporting the drinking water are needed to address this health hazard.

Supplementary Materials

The following supporting information can be downloaded at: https://www.mdpi.com/article/10.3390/su151813463/s1, Table S1: Market rice element concentrations; Table S2: Drinking water element concentrations.

Author Contributions

Conceptualization, J.B.R. and W.I.; methodology, J.B.R. and W.I.; analysis, J.B.R. and W.I.; writing—original draft preparation, J.B.R. and W.I.; writing—review and editing, J.B.R. and W.I. All authors have read and agreed to the published version of the manuscript.

Funding

This research was funded by University of Massachusetts Amherst, College of Natural Science grant number 11-01 to J.B.R.

Institutional Review Board Statement

Not applicable.

Informed Consent Statement

Not applicable.

Data Availability Statement

All data used in analyses are available in the figures and tables included in the study and in the supplemental materials provided, as well as on the author’s website: soilbiogeochemist.com.

Acknowledgments

We would like to thank Mariam Imran, Haider Dawood Khan, and Abbas Khan for aiding in sample collection and support for the project.

Conflicts of Interest

The authors declare no conflict of interest. The funders had no role in the design of the study; in the collection, analyses, or interpretation of data; in the writing of the manuscript, or in the decision to publish the results.

References

  1. Chandrasiri, G.U.; Mahanama, K.R.R.; Mahatantila, K.; Arachchige, P.S.P.; Liyanage, R.C.M. An assessment on toxic and essential elements in rice consumed in Colombo, Sri Lanka. Appl. Biol. Chem. 2022, 65, 24. [Google Scholar] [CrossRef]
  2. Khan, N.A.; Gao, Q.; Abid, M.; Shah, A.A. Mapping farmers’ vulnerability to climate change and its induced hazards: Evidence from the rice-growing zones of Punjab, Pakistan. Environ. Sci. Pollut. Res. 2021, 28, 4229–4244. [Google Scholar] [CrossRef]
  3. Sarwar, T.; Khan, S.; Yu, X.; Amin, S.; Khan, M.A.; Sarwar, A.; Muhammad, J.; Nazneen, S. Analysis of Arsenic concentration and its speciation in rice of different markets of Pakistan and its associated health risk. Environ. Technol. Innov. 2020, 21, 101252. [Google Scholar] [CrossRef]
  4. Malik, N.; Aboidullah, M.; Chaudhry, M.N. Habits and Practices Regarding Domestic Water Usage in Lahore City. Pak. Vis. 2016, 17, 244–258. [Google Scholar]
  5. Karalliedde, L.; Brooke, N. Toxicity of heavy metals and trace elements. In Essentials of Toxicology for Health Protection; Oxford Academic: Oxford, UK, 2012; pp. 168–186. [Google Scholar] [CrossRef]
  6. Javed, A.; Farooqi, A.; Baig, Z.U.; Ellis, T.; van Geen, A. Soil arsenic but not rice arsenic increasing with arsenic in irrigation water in the Punjab plains of Pakistan. Plant Soil 2020, 450, 601–611. [Google Scholar] [CrossRef]
  7. Ali, W.; Mao, K.; Zhang, H.; Junaid, M.; Xu, N.; Rasool, A.; Feng, X.; Yang, Z. Comprehensive review of the basic chemical behaviours, sources, processes, and endpoints of trace element contamination in paddy soil-rice systems in rice-growing countries. J. Hazard. Mater. 2020, 397, 122720. [Google Scholar] [CrossRef]
  8. Cannas, D.; Loi, E.; Serra, M.; Firinu, D.; Valera, P.; Zavattari, P. Relevance of Essential Trace Elements in Nutrition and Drinking Water for Human Health and Autoimmune Disease Risk. Nutrients 2020, 12, 2074. [Google Scholar] [CrossRef]
  9. Adriano, D.C. Adriano, Trace Elements in Terrestrial Environments. In Biogeochemistry, Bioavailability, and Risks of Metals; Springer: New York, NY, USA, 2001. [Google Scholar]
  10. Shakir, S.K.; Azizullah, A.; Murad, W.; Daud, M.K.; Nabeela, F.; Rahman, H.; Rehman, S.U.; Häder, D.-P. Toxic Metal Pollution in Pakistan and Its Possible Risks to Public Health. Rev. Environ. Contam. Toxicol. Vol. 2017, 242, 1–60. [Google Scholar] [CrossRef]
  11. Alengebawy, A.; Abdelkhalek, S.T.; Qureshi, S.R.; Wang, M.-Q. Heavy Metals and Pesticides Toxicity in Agricultural Soil and Plants: Ecological Risks and Human Health Implications. Toxics 2021, 9, 42. [Google Scholar] [CrossRef]
  12. Heikens, A. Arsenic Contamination of Irrigation Water, Soil and Crops in Bangladesh: Risk Implications for Sustainable Agriculture and Food Safety in Asia; Rap Publication (FAO): Rome, Italy, 2006. [Google Scholar]
  13. Husain, V.I.Q.A.R.; Nizam, H.I.N.A.; Arain, G.M. Arsenic and fluoride mobilization mechanism in groundwater of Indus Delta and Thar Desert, Sindh, Pakistan. Int. J. Econ. Environ. Geol. 2012, 3, 15–23. [Google Scholar]
  14. Pakistan Bureau of Statistics; Government of Pakistan. Available online: https://www.pbs.gov.pk/ (accessed on 6 June 2023).
  15. Ali, W.; Aslam, M.W.; Feng, C.; Junaid, M.; Ali, K.; Li, S.; Chen, Z.; Yu, Z.; Rasool, A.; Zhang, H. Unraveling prevalence and public health risks of arsenic, uranium and co-occurring trace metals in groundwater along riverine ecosystem in Sindh and Punjab, Pakistan. Environ. Geochem. Health 2019, 41, 2223–2238. [Google Scholar] [CrossRef] [PubMed]
  16. World Food Program (WFP). Annual Country Reports—Pakistan. Available online: https://www.wfp.org/publications/annual-country-reports-pakistan (accessed on 11 July 2023).
  17. USEPA. Exposure Factors Handbook: 2011 Edition; US Environmental Protection Agency: Washington, DC, USA, 2011.
  18. Natasha; Bibi, I.; Niazi, N.K.; Shahid, M.; Ali, F.; Hasan, I.M.U.; Rahman, M.M.; Younas, F.; Hussain, M.M.; Mehmood, T.; et al. Distribution and ecological risk assessment of trace elements in the paddy soil-rice ecosystem of Punjab, Pakistan. Environ. Pollut. 2022, 307, 119492. [Google Scholar] [CrossRef] [PubMed]
  19. Nawab, J.; Farooqi, S.; Xiaoping, W.; Khan, S.; Khan, A. Levels, dietary intake, and health risk of potentially toxic metals in vegetables, fruits, and cereal crops in Pakistan. Environ. Sci. Pollut. Res. 2018, 25, 5558–5571. [Google Scholar] [CrossRef]
  20. WHO. Trace Elements in Human Nutrition and Health; WHO: Geneva, Switzerland, 1996; p. 361.
  21. TatahMentan, M.; Nyachoti, S.; Scott, L.; Phan, N.; Okwori, F.O.; Felemban, N.; Godebo, T.R. Toxic and essential elements in rice and other grains from the United States and other countries. Int. J. Environ. Res. Public Health 2020, 17, 8128. [Google Scholar] [CrossRef]
  22. Jung, M.C.; Yun, S.T.; Lee, J.S.; Lee, J.U. Baseline study on essential and trace elements in polished rice from South Korea. Environ. Geochem. Health 2005, 27, 455–464. [Google Scholar] [CrossRef] [PubMed]
  23. Tariq, S.R.; Rashid, N. Multivariate Analysis of Metal Levels in Paddy Soil, Rice Plants, and Rice Grains: A Case Study from Shakargarh, Pakistan. J. Chem. 2013, 2013, 539251. [Google Scholar] [CrossRef]
  24. Ghafoor, A.B.D.U.L.; Aslam, M.A.N.A.N. Market Integration and Price Transmission in Rice Markets of Pakistan; Working Paper; South Asia Network of Economic Research Institute: Dhaka, Bangladesh, 2012. [Google Scholar]
  25. Sharafi, K.; Yunesian, M.; Mahvi, A.H.; Pirsaheb, M.; Nazmara, S.; Nodehi, R.N. Advantages and disadvantages of different pre-cooking and cooking methods in removal of essential and toxic metals from various rice types-human health risk assessment in Tehran households, Iran. Ecotoxicol. Environ. Saf. 2019, 175, 128–137. [Google Scholar] [CrossRef]
  26. Panaullah, G.M.; Alam, T.; Hossain, M.B.; Loeppert, R.H.; Lauren, J.G.; Meisner, C.A.; Ahmed, Z.U.; Duxbury, J.M. Arsenic toxicity to rice (Oryza sativa L.) in Bangladesh. Plant Soil 2009, 317, 31–39. [Google Scholar] [CrossRef]
  27. Baruah, S.G.; Ahmed, I.; Das, B.; Ingtipi, B.; Boruah, H.; Gupta, S.K.; Nema, A.K.; Chabukdhara, M. Heavy metal(loid)s contamination and health risk assessment of soil-rice system in rural and peri-urban areas of lower brahmaputra valley, northeast India. Chemosphere 2021, 266, 129150. [Google Scholar] [CrossRef]
  28. Natasha Bibi, I.; Shahid, M.; Niazi, N.K.; Younas, F.; Naqvi, S.R.; Shaheen, S.M.; Imran, M.; Wang, H.; Hussaini, K.M.; Zhang, H.; et al. Hydrogeochemical and health risk evaluation of arsenic in shallow and deep aquifers along the different floodplains of Punjab, Pakistan. J. Hazard Mater. 2021, 402, 124074. [Google Scholar] [CrossRef]
  29. WHO. Guidelines for Quality Drinking-Water, 4th ed.; World Health Organization: Geneva, Switzerland, 2011.
  30. Toor, I.A.; Tahir, S.N.A. Study of arsenic concentration levels in Pakistani drinking water. Pol. J. Environ. Stud. 2009, 18, 907–912. [Google Scholar]
  31. Akhter, G.; Ahmad, Z.; Iqbal, J.; Shaheen, N.; Shah, M.H. Physicochemical characterization of groundwater in urban areas of Lahore, Pakistan, with special reference to arsenic. J. Chem. Soc. Pak. 2010, 32, 306–312. [Google Scholar]
  32. Waseem, A.; Arshad, J.; Iqbal, F.; Sajjad, A.; Mehmood, Z.; Murtaza, G. Pollution Status of Pakistan: A Retrospective Review on Heavy Metal Contamination of Water, Soil, and Vegetables. BioMed Res. Int. 2014, 2014, 813206. [Google Scholar] [CrossRef]
  33. Aziz, A.; Mayo, S.M.; Ahmad, I.; Hussain, M.; Nafees, M. Determining town base socioeconomic indices to sensitize development in Lahore, Pakistan. Tech. J. UET TAxila Pak. 2014, 19, 22–29. [Google Scholar]
  34. Rehman, W.; Zeb, A.; Noor, N.; Nawaz, M. Heavy metal pollution assessment in various industries of Pakistan. Environ. Geol. 2008, 55, 353–358. [Google Scholar] [CrossRef]
  35. Mary, R.; Nasir, R.; Alam, A.; Tariq, A.; Nawaz, R.; Javied, S.; Zaman, Q.U.; Islam, F.; Khan, S.N. Exploring hazard quotient, cancer risk, and health risks of toxic metals of the Mehmood Booti and Lakhodair landfill groundwaters, Pakistan. Environ. Nanotechnol. Monit. Manag. 2023, 20, 100838. [Google Scholar] [CrossRef]
  36. Ahmed, J.; Wong, L.P.; Chua, Y.P.; Channa, N.; Memon, U.-U.; Garn, J.V.; Yasmin, A.; VanDerslice, J.A. Heavy metals drinking water contamination and health risk assessment among primary school children of Pakistan. J. Environ. Sci. Health Part A 2021, 56, 667–679. [Google Scholar] [CrossRef] [PubMed]
  37. Perveen, S.; Haque, A.U. Drinking water quality monitoring, assessment and management in Pakistan: A review. Heliyon 2023, 9, e13872. [Google Scholar] [CrossRef] [PubMed]
Figure 1. Map of Lahore administrative districts and location of drinking water sampling locations and locations of rice purchases from markets.
Sustainability 15 13463 g001
Figure 2. Boxplots of log market rice trace element concentrations collected across Lahore. N = 33 and the red lines are the WHO’s limits [20]. Boxes represent the interquartile range, bars represent minimum and maximum range and circles represent outliers.
Sustainability 15 13463 g002
Figure 3. XY plot comparison of mean trace element concentrations and market price (December 2022) for each rice sample with linear regressions. Error bars are standard errors.
Sustainability 15 13463 g003
Figure 4. Boxplots of drinking water samples collected across the nine locations of Lahore. N = 33 and the red lines are the WHO’s limits [20]. Boxes represent the interquartile range, bars represent minimum and maximum range and circles represent outliers.
Sustainability 15 13463 g004
Figure 5. Drinking water samples compared across socioeconomic classes: Middle+Wealthy class administrative towns compared to impoverished class administrative towns [33]. (*) represent a significant difference in drinking water concentrations between socioeconomic groups of administrative towns.
Sustainability 15 13463 g005
Table 1. Rice target hazard quotients (THQ)s, where any value >1.0 is considered a lifetime health hazard from rice consumption. See Section 2.4 for the calculation method.
Market As Cd CrCuPbSeUHazard Index (HI)
16.820.310.191.330.190.390.0069.26
27.020.490.176.240.980.310.00315.2
34.220.660.080.491.150.280.0056.91
44.980.500.125.422.610.520.00414.2
55.320.740.112.400.310.430.0079.35
65.791.340.160.650.460.310.0078.74
76.251.330.246.105.240.310.00419.5
84.330.560.143.560.390.380.0029.38
94.651.170.122.991.060.310.00510.4
103.480.800.121.040.790.280.0196.55
113.390.650.130.850.950.430.0066.43
Mean5.110.780.142.831.290.360.00610.53
Table 2. Market rice life cancer risk (LCR) values where any value >1.0 × 10⁻⁴ is considered a lifetime hazard for developing cancer. See Section 2.4 for calculation method.
MarketAs Cd CrCuPbSeU
×10−4×10−4×10−4×10−4×10−4×10−4×10−4
1120.01.10.10.00.00.1
2120.01.00.30.10.00.0
370.00.50.00.30.00.1
480.00.70.30.00.00.1
590.10.70.20.10.00.1
6100.10.90.00.60.00.1
7110.11.40.40.00.00.1
870.00.80.20.00.00.0
980.10.70.20.10.00.1
1060.10.70.10.10.00.3
1160.00.80.10.10.00.1
Table 3. Drinking water THQs, where any value >1.0 is considered a lifetime health hazard. See Section 2.4 for the calculation method. Socioeconomic classifications were M+R, indicating middle and wealthy and impoverished towns, based on [33].
Town SE ClassAsCdCrCuPbSeUHazard Index (HI)
Aziz BhattiM+W5.20.0000.320.0010.0010.010.0015.565
CantonmentM+W0.70.0000.530.0010.0010.040.0441.39
RaviM+W3.30.0000.620.0010.0010.020.1306.11
GulbergM+W0.020.0000.760.0000.0000.010.0000.77
ShalimarIMP5.50.0080.170.0010.0010.010.0015.70
Data Gunj BakshM+W5.90.0010.730.0010.0010.010.0126.71
Nishtar (North)IMP0.70.0000.380.0010.0001.580.4653.09
Nishtar (South)IMP1.40.0010.870.0020.0091.650.4514.37
Wagah (North)IMP0.40.0000.330.0020.0013.811.2775.76
Wagah (South)IMP2.40.0000.510.0010.0000.030.0532.94
Iqbal (North)IMP0.30.0000.820.0020.0010.041.2549.78
Iqbal (South)IMP0.50.0020.630.0020.00612.10.42114.33
Mean 2.20.0010.560.0010.0021.60.3425.54
Table 4. Water LCR values, where any value >1.0 × 10⁻⁴ is considered a lifetime hazard for developing cancer. See Section 2.4 for description.
AsCdCrCuPbSeU
Town×10−4×10−4×10−4×10−4×10−4×10−4×10−4
Aziz Bhatti240.000.000.000.000.000.04
Cantonment 30.000.000.000.000.012.2
Ravi150.000.000.000.000.005.9
Gulberg0.00.000.000.000.000.000.01
Shalimar250.000.000.000.000.000.002
Data Gunj Baksh270.000.000.000.000.000.53
Nishtar (North)30.000.000.000.000.0220.9
Nishtar (South)60.000.000.000.000.33820.3
Wagah (North)110.000.000.000.000.012.4
Wagah (South)20.000.000.000.000.7657.5
Iqbal (North)10.000.000.000.000.0156.4
Iqbal (South)20.000.000.000.002.418.9
Disclaimer/Publisher’s Note: The statements, opinions and data contained in all publications are solely those of the individual author(s) and contributor(s) and not of MDPI and/or the editor(s). MDPI and/or the editor(s) disclaim responsibility for any injury to people or property resulting from any ideas, methods, instructions or products referred to in the content.

