Article

A Life-Cycle Carbon Emissions Evaluation Model for Traditional Residential Houses: Applying to Traditional Dong Dwellings in Qandongnan, Guizhou Province, China

1
College of Architecture and Urban Planning, Guizhou University, Guiyang 550025, China
2
Department of Urban and Rural Planning, Tianjin University, Tianjin 300072, China
3
School of Architecture, Southwest Jiaotong University, Chengdu 611756, China
*
Authors to whom correspondence should be addressed.
Sustainability 2023, 15(18), 13468; https://doi.org/10.3390/su151813468
Submission received: 28 June 2023 / Revised: 15 August 2023 / Accepted: 30 August 2023 / Published: 8 September 2023
(This article belongs to the Section Sustainable Urban and Rural Development)

Abstract

:
In recent years, due to the low energy utilization of the whole life-cycle of buildings, the diminished indoor and outdoor comfort of buildings, and the impact on the surrounding environment caused by the carbon emissions of the building life-cycle, the establishment of a whole life- cycle carbon emission evaluation model for buildings to improve their energy utilization at all stages of their life-cycle has received unprecedented attention. In China, the construction industry has become a major carbon emitter, and traditional houses, as a green development building type, are an effective way to achieve carbon neutrality in buildings; however, the existing green building evaluation system lacks quantitative indicators of carbon emissions in the building life-cycle. The exclusive evaluation indexes for regional and characteristic buildings, such as traditional houses, are neglected. This study explored the formula for calculating the life-cycle carbon emissions model of traditional residential houses under a carbon emission intervention and used real measurements of the physical environment. Based on the results of indoor and outdoor heat and humidity environmental tests of residential houses due to locality, four important factors affecting local green buildings in terms of energy utilization, site ecology and landscape, land saving, and material saving were extracted; on this basis, the whole life-cycle carbon emission evaluation model of traditional residential houses was constructed by combining the existing green building evaluation standards with the carbon emission indexes of the life-cycle of traditional residential houses.

1. Introduction

At the 75th UN General Assembly, China proposed an initiative to strive to reach its carbon peak by 2030 and achieve carbon neutrality by 2060 [1,2]. With current global warming, Climate Change 2023, the synthesis report of the Sixth Assessment Report released by the IPCC, points out that the average global surface temperature will rise by 1.1 °C from 2011 to 2020 compared with the period from 1850 to 1900 [3], whereby the main influence on climate change is the emission of carbon dioxide [4]; in the context of global warming, extreme heat events have been frequently observed [5,6]. Some studies demonstrate that extreme heat events pose a serious threat to human health and that they are even life-threatening and fatal in severe cases [7,8]. The total global CO2 emissions from the construction sector were 5.7 billion tons in 2009, accounting for 23% of the total CO2 emissions from global economic activities [9], and among the various strategies developed to meet energy demand and reduce CO2 emissions, improving the energy efficiency of buildings has proven to be the best option [10,11,12]. According to data from the China Building Energy Consumption Research Report (2020), the total energy consumption of the whole life-cycle of buildings in China was 2.147 billion tons of standard coal equivalent in 2018, accounting for 46.5% of the total national energy consumption. The total carbon emissions of the whole building process in China were 4. 93 billion tce in 2018, accounting for 51.2% of the national carbon emissions, and the energy consumption of building materials accounted for more than 20%. The energy consumption and carbon emissions of the construction industry were much higher than those of other industries. A study showed that with the development of urbanization and the investment in rural revitalization, the total carbon emissions in rural areas of China increased from 408.53 Mt in 1997 to 619.57 Mt in 2015 [13]. Rural residential buildings and household appliances such as air conditioners and hot water supply in daily life and their time of use have increased significantly, and rural areas are becoming the second largest source of greenhouse gas emissions [14], of which residential living systems have become the main source of greenhouse gas emissions [15]. Therefore, the country started to promote the low-carbon transition of rural residential buildings more thoroughly to reduce CO2 emissions [16]. This is essential to deal with reducing energy consumption and safeguarding residents’ health [17,18]. There is a certain internal logical relationship between green building and achieving the carbon peak carbon neutrality goal. Green building development (GBD) has an important role in improving the carbon emission reduction efficiency (CEEOCI) of the construction industry and accelerating the achievement of the carbon neutrality goal in the construction industry [19].
In order to develop and improve China’s green building evaluation system and promote the development of green buildings, early studies by Chinese scholars focused on the comparison of international mainstream green building evaluation systems. Scholars explored the advantages and disadvantages of the evaluation scope, evaluation indexes, control items, and the current development status [20] and found the problems encountered in the implementation of each stage of the building [21]. By analyzing these problems and proposing improvement measures, the green building evaluation system in China is continuously improved. On the other hand, using the definition of green building, some scholars have established a multi-objective evaluation model (OPT) of green building under the three dimensions of goal, specialty, and time [22] and verified the constructed model through examples, which put forward a new idea for the construction of evaluation indexes of green building. Considering the regional nature of the evaluation system, some scholars have addressed the limitations of the existing national and provincial green building evaluation standards and proposed important regional green building factors by combining the unique topography, ecological environment, and architectural culture of each region; based on this, they have established an evaluation model to construct a green building evaluation system that conforms to the characteristics of the local region [23,24]. At this stage, under the guidance of Chinese policies and relevant standards, China’s green building evaluation standards have developed to the relatively mature third generation of green building evaluation standards after two revisions. The new standard is more concerned with life-specific green technology to improve the living environment. Green buildings pay more attention to the deep-seated demand for the human living environment and healthy buildings and pay more attention to the health of personnel [25].
At present, multi-criteria decision-making (MCDM) is a commonly used method to deal with decision criteria problems, and almost all MCDM models are proposed based on the behavior of decision problems. MCDM is a comparative method of quantitative and qualitative analysis based on a set of different criteria, which is more efficient, improves the quality of decision-making, and aims to help decision-makers choose the best option. Moreover, the method can classify feasible options and rank their performance in descending order. MCDM methods include analytic hierarchy processes, fuzzy analytic hierarchy processes, approximate ideal solution sorting, multi-criterion compromise solution sorting, and multi-objective programming. The fuzzy Delphi method is a good way to predict the results. In contrast, the fuzzy Delphi method can overcome the ambiguity and uncertainty problems of the Delphi method in the investigation when constructing green building evaluation indexes [26], and the constructed building evaluation indexes are more objective and scientific. In terms of practical application, the use of hierarchical analysis can be used to simplify and draw conclusions that are scientific and accurate. Second, the solution process of using hierarchical analysis is clear and makes it easy to organize ideas, which can ensure the accuracy of the results [27] and build a green building evaluation system that is optimized for the country, province, and city as well as the region [28].
Various geographical areas require different evaluation systems to support them from the national to the traditional residential building levels [29]. Currently, green buildings, as sustainable buildings, are an effective way to achieve the dual carbon goal. However, the latest version of the GB/T50378-2019 “Green Building Evaluation Standard” lacks a calculation model and quantification method for the evaluation index of carbon emissions in each stage of the building life-cycle. Although China promulgated the national standard [30], the “Building Carbon Emission Calculation Standard”, in 2019 to make up for the deficiency in this regard, the new version of the “Green Building Evaluation Criteria” does not have the relevant hard requirements of the “Building Carbon Emission Calculation Standard” and lacks targeted calculation data, and thus it cannot meet the existing requirements for constructing green building evaluation indexes. With the low-carbon and dual-carbon policies, domestic scholars began to establish carbon calculation models for typical green civil buildings based on life-cycle theory for different regions [31]; the use of wood, wall thickness, insulation materials, and metal components has a great impact on the life-cycle carbon emissions of wood-framed buildings with different structural systems. The existing research results at home and abroad have not made a quantitative comparative study of different systems of wood structure buildings and cannot give reasonable suggestions on the selection of structural systems of wood structure buildings from the perspective of carbon emission [31]. In general, due to different research purposes, different scholars have great differences in research boundaries, accounting scopes, and accounting models when they conduct building carbon emission accounting. Therefore, it is necessary to unify and standardize the research boundaries and accounting scopes of the carbon emission accounting [31].
DLCA (Diffusion Limited Cluster Aggregation) mainly establishes the evaluation model from the operation stage of the building so as to improve the optimization performance, reduce the carbon emission at each stage, and achieve the purpose of low-carbon buildings. Since most studies are based on specific research purposes rather than systematic dynamic evaluation studies based on the overall needs of DLCA evaluation construction, most studies focus on the dynamics of specific energy, materials, or a certain life-cycle stage [31], such as the analysis of energy input changes in steel and aluminum production DLCA. Or carry out a dynamic change study on CO2 emissions from steel bar production [31], focusing on changes in energy consumption during building operation [31]. The DLCA evaluation method has significant regional adaptability, and all kinds of dynamic evaluation factors considered by DLCA, and their influencing factors must be studied, analyzed, and determined based on dynamic change rules. As can be seen from the literature review, most of the relevant studies on DLCA are carried out outside of China, and the relevant research results and data are not applicable to Chinese residential buildings to a large extent [31]. Therefore, it is of great practical significance to incorporate building life-cycle carbon emission indexes and calculation models into green building evaluations.
The objectives of this study under carbon emissions intervention were as follows: (1) establishing a life-cycle carbon emission accounting model for traditional residential houses; (2) exploring the construction of a building life-cycle carbon emission evaluation model for traditional residential buildings in the context of carbon emissions. The research results can improve the building life-cycle carbon emission system in China and provide a scientific evaluation method for quantitative research on zero-carbon and low-carbon buildings. The carbon emission calculation model of wood structure buildings with a typical structural system is established, the carbon emission calculation boundary of wood buildings is delimited, and the carbon emission calculation of wood structure buildings with the same plane layout is carried out.

2. Research Areas and Information

2.1. Research Areas

The energy saving of rural residential buildings is a key field and an important link for China to achieve the goal of “2030 carbon emission reduction”. China’s “Carbon Peak in Urban and Rural Construction Implementation Plan” proposes to promote the construction of green and low-carbon rural housing, promote the large-scale development of low-carbon buildings, and encourage the construction of zero-carbon buildings in rural areas. There are many minority-characteristic villages in Guizhou Province, and from the distribution of national and provincial minority-characteristic villages, Qiandongnan Prefecture occupies the first position of minority villages in the province; the Dong ethnic group is an important part of the minority in Qiandongnan, and the number of characteristic villages ranks among the top three in the state. Most are distributed in nine counties, such as Congjiang, Rongjiang, and Liping, as marked in the green block of Figure 1. To ensure that the residential physical environment was measured with sufficient sample size, the sample was selected from five representative Dong traditional villages: Biapa Village, Xiage Village, Tangan Village, Gaozeng Village, and Zhaoxing Village from the official website of Chinese Traditional Villages, http://www.chuantongcunluo.com/ (accessed on 5 February 2023). The Dong people’s residence adopts a cross-shaped structure to relieve the constraints of land conditions and form a way of space utilization that does not occupy the sky. The building is surrounded by a vertical arrangement of cedar boards, a shingle-style roof, and a roof laid with green tiles, which have a strong ethnic color.

2.2. Physical Environment Measurements of Civil Houses

Over time, there have been many studies on the physical environment of buildings, and the thermal environment of buildings is the most important part of the physical category of buildings; thus, the thermal environment received the earliest human research and attention. Domestic and foreign scholars of the physical environment have also focused more on the thermal environment of buildings. The main factors affecting the thermal environment of buildings are determined by the indoor and outdoor thermal environments of buildings, namely, the indoor air temperature, humidity, heat emitted from production and life, outdoor air temperature, humidity and wind, and rain and snow. Using relevant instruments to take actual measurements, the indoor and outdoor air temperatures (Ta), the relevant humidity (RH), and the black bulb temperature (Tg) were selected for actual measurement in this study.
Actual measurement time: When conducting the actual measurement, the local winter and summer representative extreme weather times were selected as follows: winter: 15 January 2022, continuous temperature testing time of 24:00 h; summer: 24 July 2022, continuous temperature testing time of 24:00 h. Method: indoor and outdoor halls and bedroom layer measurement points were located for 24 h of continuous testing of temperature and humidity; the outdoor air temperature and humidity measurement points 1 were arranged 1 m from the wall; for the indoor air temperature and humidity measurement points 2, hall and bedroom, the instrument was arranged in the center of the room, 1 m from the ground; every hour the instrument automatically collected a set of data, and the measured meteorological parameters included the air temperature (Ta), relative humidity (RH), and black ball temperature (Tg). Table 1 shows the basic information such as the accuracy and range of the measurement instruments. Therefore, the instruments were in compliance with the ASHRAE Standard 55-2017 [31], as shown in Table 1. ASHRAE stands for the American Society of Heating, Refrigerating, and Air-Conditioning Engineers.

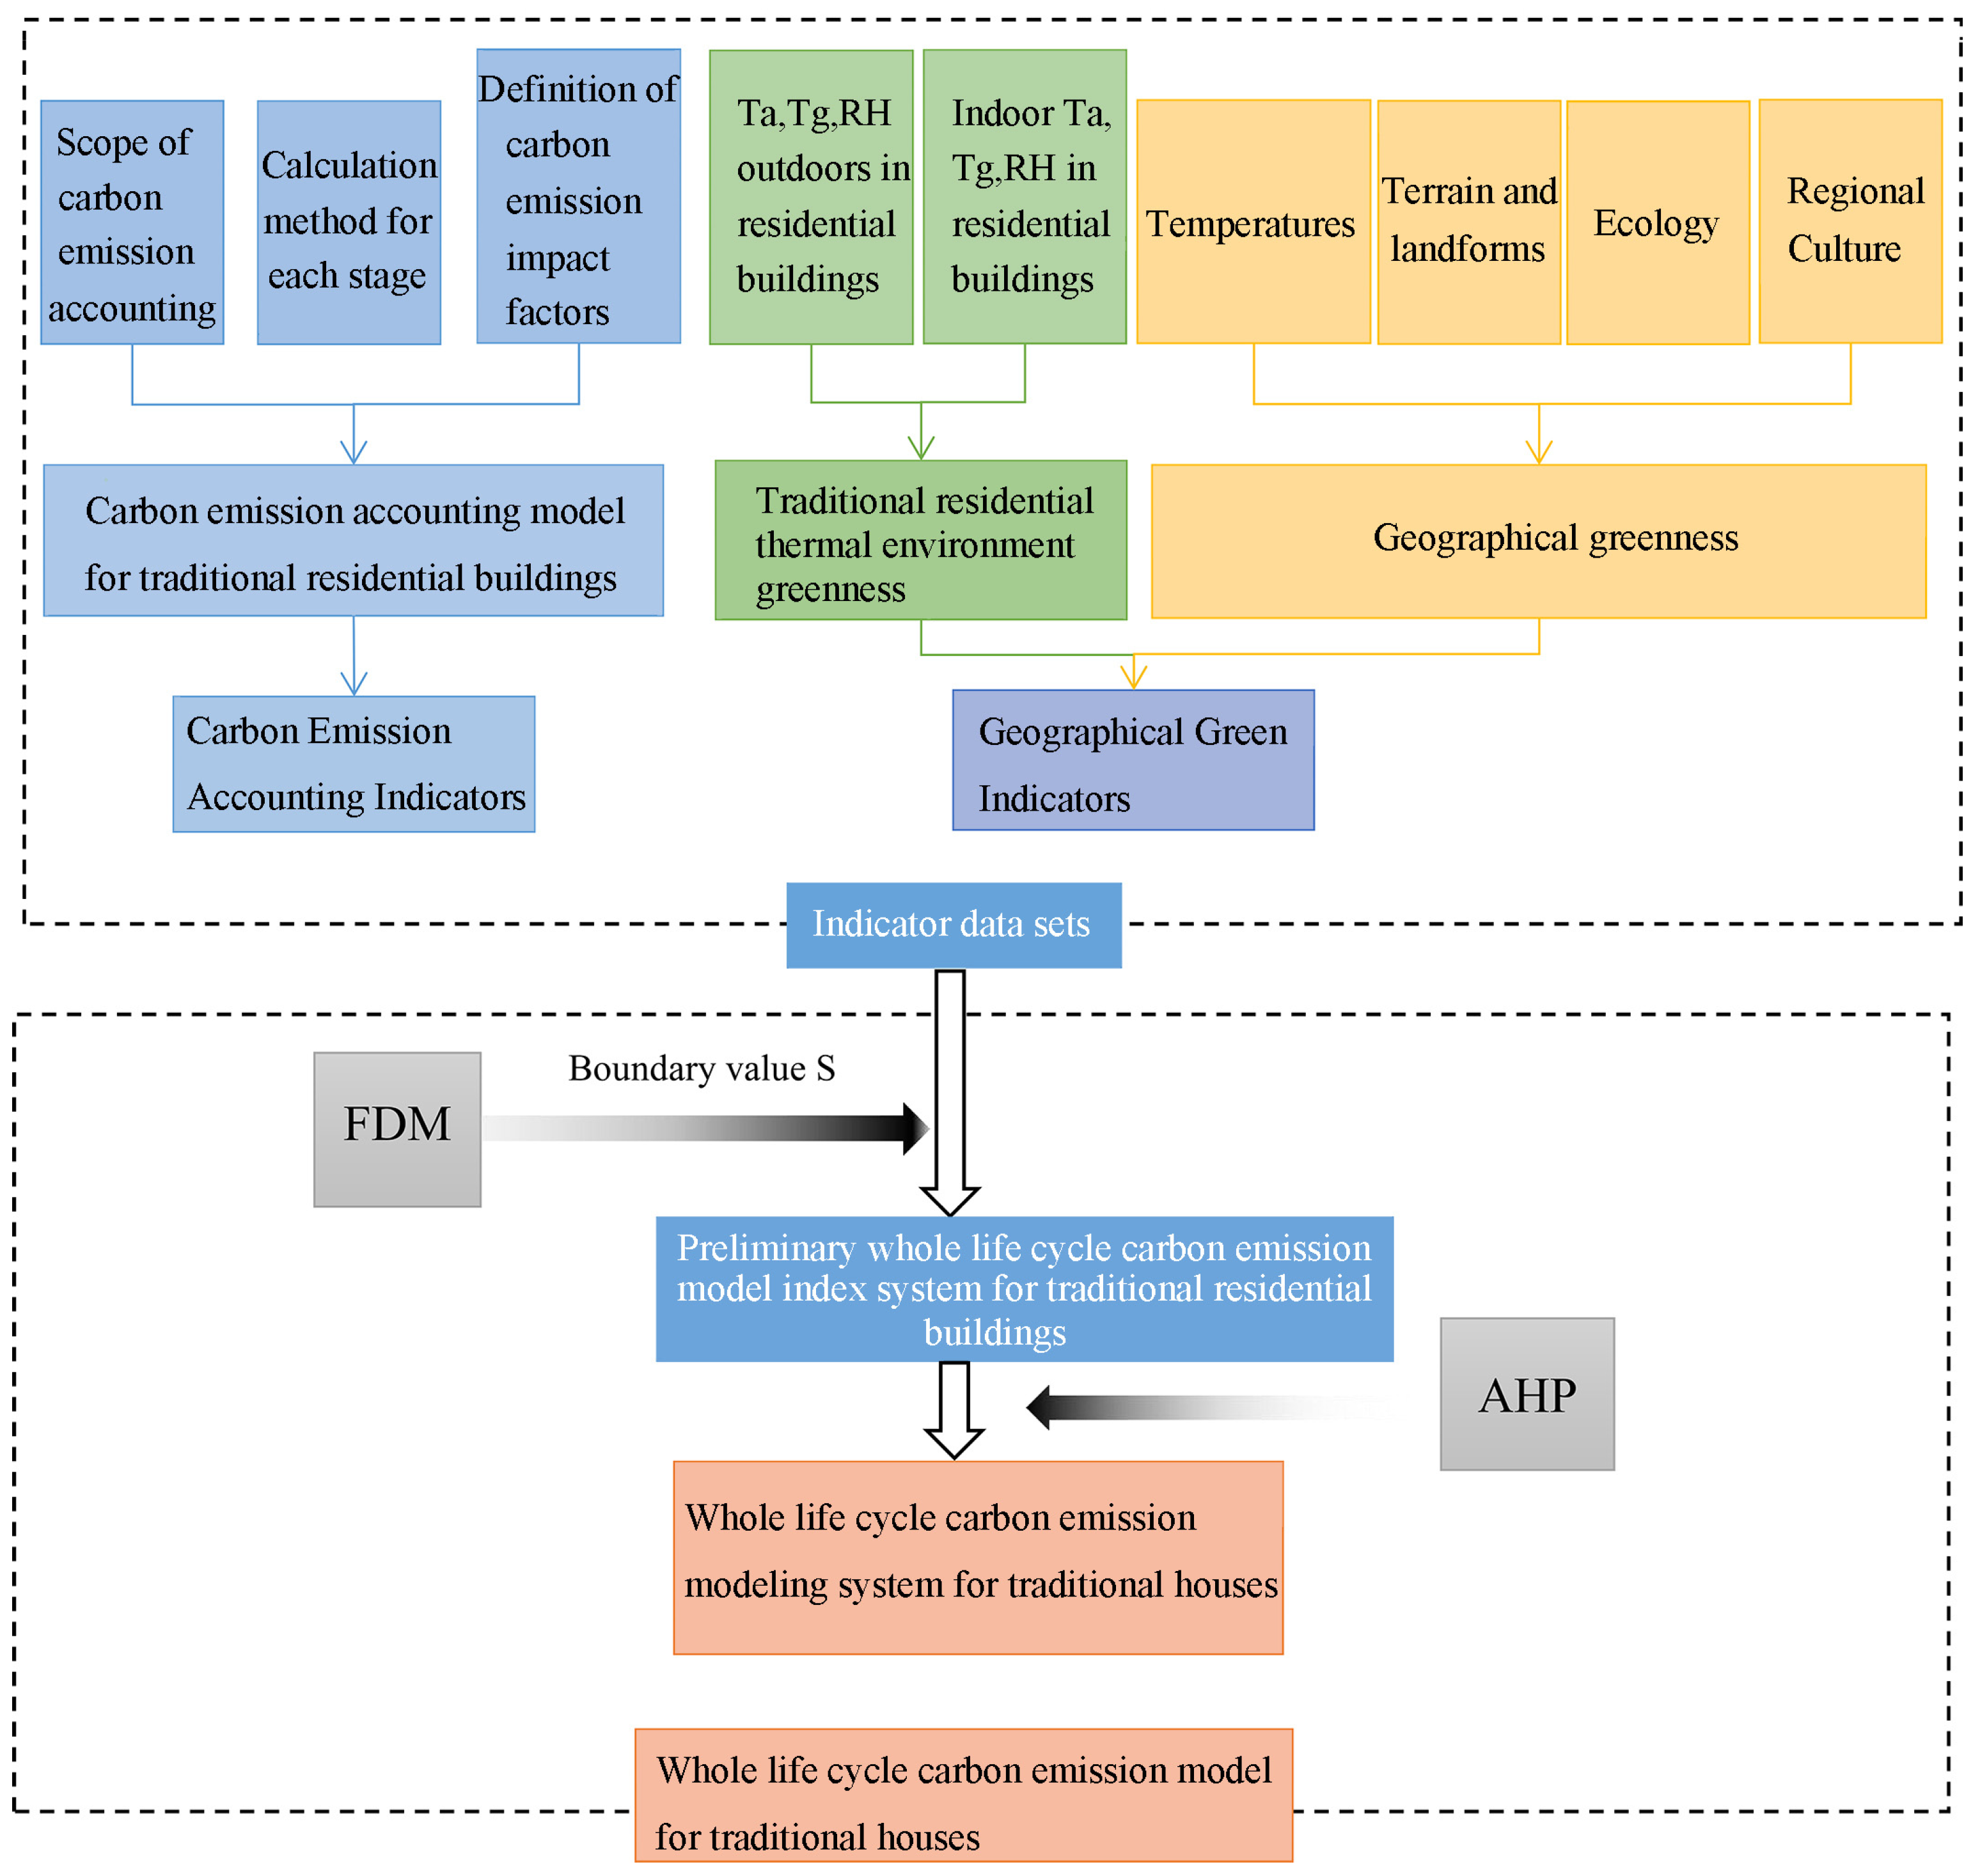
2.3. Scope of Carbon Emissions Accounting for Traditional Residential Buildings

From a large number of studies in the literature, it was found that the scope of carbon emissions accounting for buildings still differed to some extent. The current research on carbon emissions accounting in the field of construction is mainly divided into two levels: one is the micro level, i.e., the longitudinal life-cycle carbon emissions accounting of single building units, and the other is the macro level, i.e., the accounting of global, national, provincial, and municipal regional building carbon emissions. The measurement of microscopic single-building carbon emissions is mainly used for the determination of single-building carbon emission levels when carrying out green building evaluation and building carbon emissions trading. This paper focused on the carbon emissions of the life-cycle of traditional residential buildings, combining China’s GB/T50378-2019 “Building Carbon Emission Calculation Standard” and the CECS 374:2014 “Building Carbon Emission Measurement Standard” [32], from a microscopic single building life-cycle carbon emission perspective. It is proposed that the life-cycle carbon emissions of traditional residential buildings should include the sum of the carbon emissions from four aspects: the production and transportation stage of building materials, the construction stage, the operation stage, and the demolition and disposal stage.

2.4. Carbon Emission Calculation Methods for Each Stage of the Life-Cycle of Traditional Residential Buildings

At present, the commonly used methods in carbon emissions accounting research are the actual measurement method, carbon emissions factor method, and mass balance method. After comparing and analyzing the three methods in terms of their characteristics, advantages, limitations, applicable scales, and application statuses, the carbon emissions factor method was found to be the most suitable for carbon emissions accounting in the construction field. The carbon emissions factor method is the most dominant method used for calculating carbon emissions and is also the method used in the Standard for Carbon Emission Calculation in Buildings (from the GB/T50378-2019 Standard for Carbon Emission Calculation in Buildings). Therefore, the carbon emissions factor method was used in the study for carbon emissions accounting of traditional residential buildings. The functional unit for carbon emissions accounting of the life-cycle of traditional residential buildings is the carbon emissions per square meter of a building per year, and the unit of measurement is kgCO2eq/(a·m2), which is calculated using the carbon emissions factor method in the 2006 IPCC Guidelines for National Greenhouse Gas Inventories. It is calculated by multiplying the materials, energy, and machinery used in each stage of the building life-cycle with their corresponding carbon emissions factors to find the sum.
That is,
total   carbon   emissions = total   building   life - cycle   ( T W )   ×   emission   factor   ( E F )
where the total building life-cycle ( T W ) is the amount of building materials consumed and the total amount of energy consumed in each activity, and the emission factor ( E F ) is the amount of carbon dioxide equivalent produced per unit of building activity data, also known as the carbon emissions factor.
According to the definition of the scope of carbon emissions accounting for the life-cycle of traditional residential buildings, the whole life-cycle of residential buildings has four stages: production and transportation of building materials, construction, operation, and demolition and disposal. Combined with the evaluation requirements of the national standard, the GB/T50378-2019 “Green Building Evaluation Standard”, and factors such as the geographic location and natural environment of Qiandongnan, the total carbon emissions of the building life-cycle are the sum of the carbon emissions of each stage, and the calculation formula is as follows.
E q = E s y + E s g + E y y + E c c
Type:  E q —the total carbon emissions over the lifetime of the traditional dwelling (kgCO2eq).
E s y —the carbon emissions during the production and transportation phase of the building materials (kgCO2eq).
E s g —the carbon emissions during the construction phase of the building (kgCO2eq).
E y y —the carbon emissions during the operational phase (kgCO2eq).
E c c —the carbon emissions from the dismantling and disposal phase (kgCO2eq).

2.5. Selection of Carbon Emissions Impact Factors for Traditional Residential Buildings

The Dong traditional dwellings in Qiandongnan still retain wood as the main building support and maintenance structure from ancient times to the present. In this study, the building types involved refer only to traditional residential dwellings, while the energy used in the operation of residential dwellings mainly refers to the energy consumed by rural households for cooking and heating. The main types of energy used in operation are electricity and biomass (straw and fuel wood). Among them, biomass energy consumption is an important part of rural residential energy use. Building construction activities involve many energy-use aspects, and this study considered mainly the energy consumption involved in the production of building materials and the transportation and construction of building materials. The production of building materials refers to the process from the entry of raw materials into the factory to the delivery of finished building materials. The transportation of building materials refers to the process from the delivery of building materials to the arrival of building materials at the construction site. The energy consumption of the construction stage mainly includes the energy consumption of construction personnel and on-site construction equipment, and the demolition and disposal stage is the energy consumption of on-site construction personnel carbon emissions caused by the energy consumption of the demolition of buildings and that of various machinery, the carbon emissions from the transportation and disposal of construction waste, and the carbon emissions from the recycling of construction materials. In this study, the carbon emissions factors were selected from four aspects: energy and fuel, building materials, transportation, and human and mechanical equipment.

3. Methods

The technical framework of this study is shown in Figure 2, which outlines the research structure, data sources, and methods of this study.

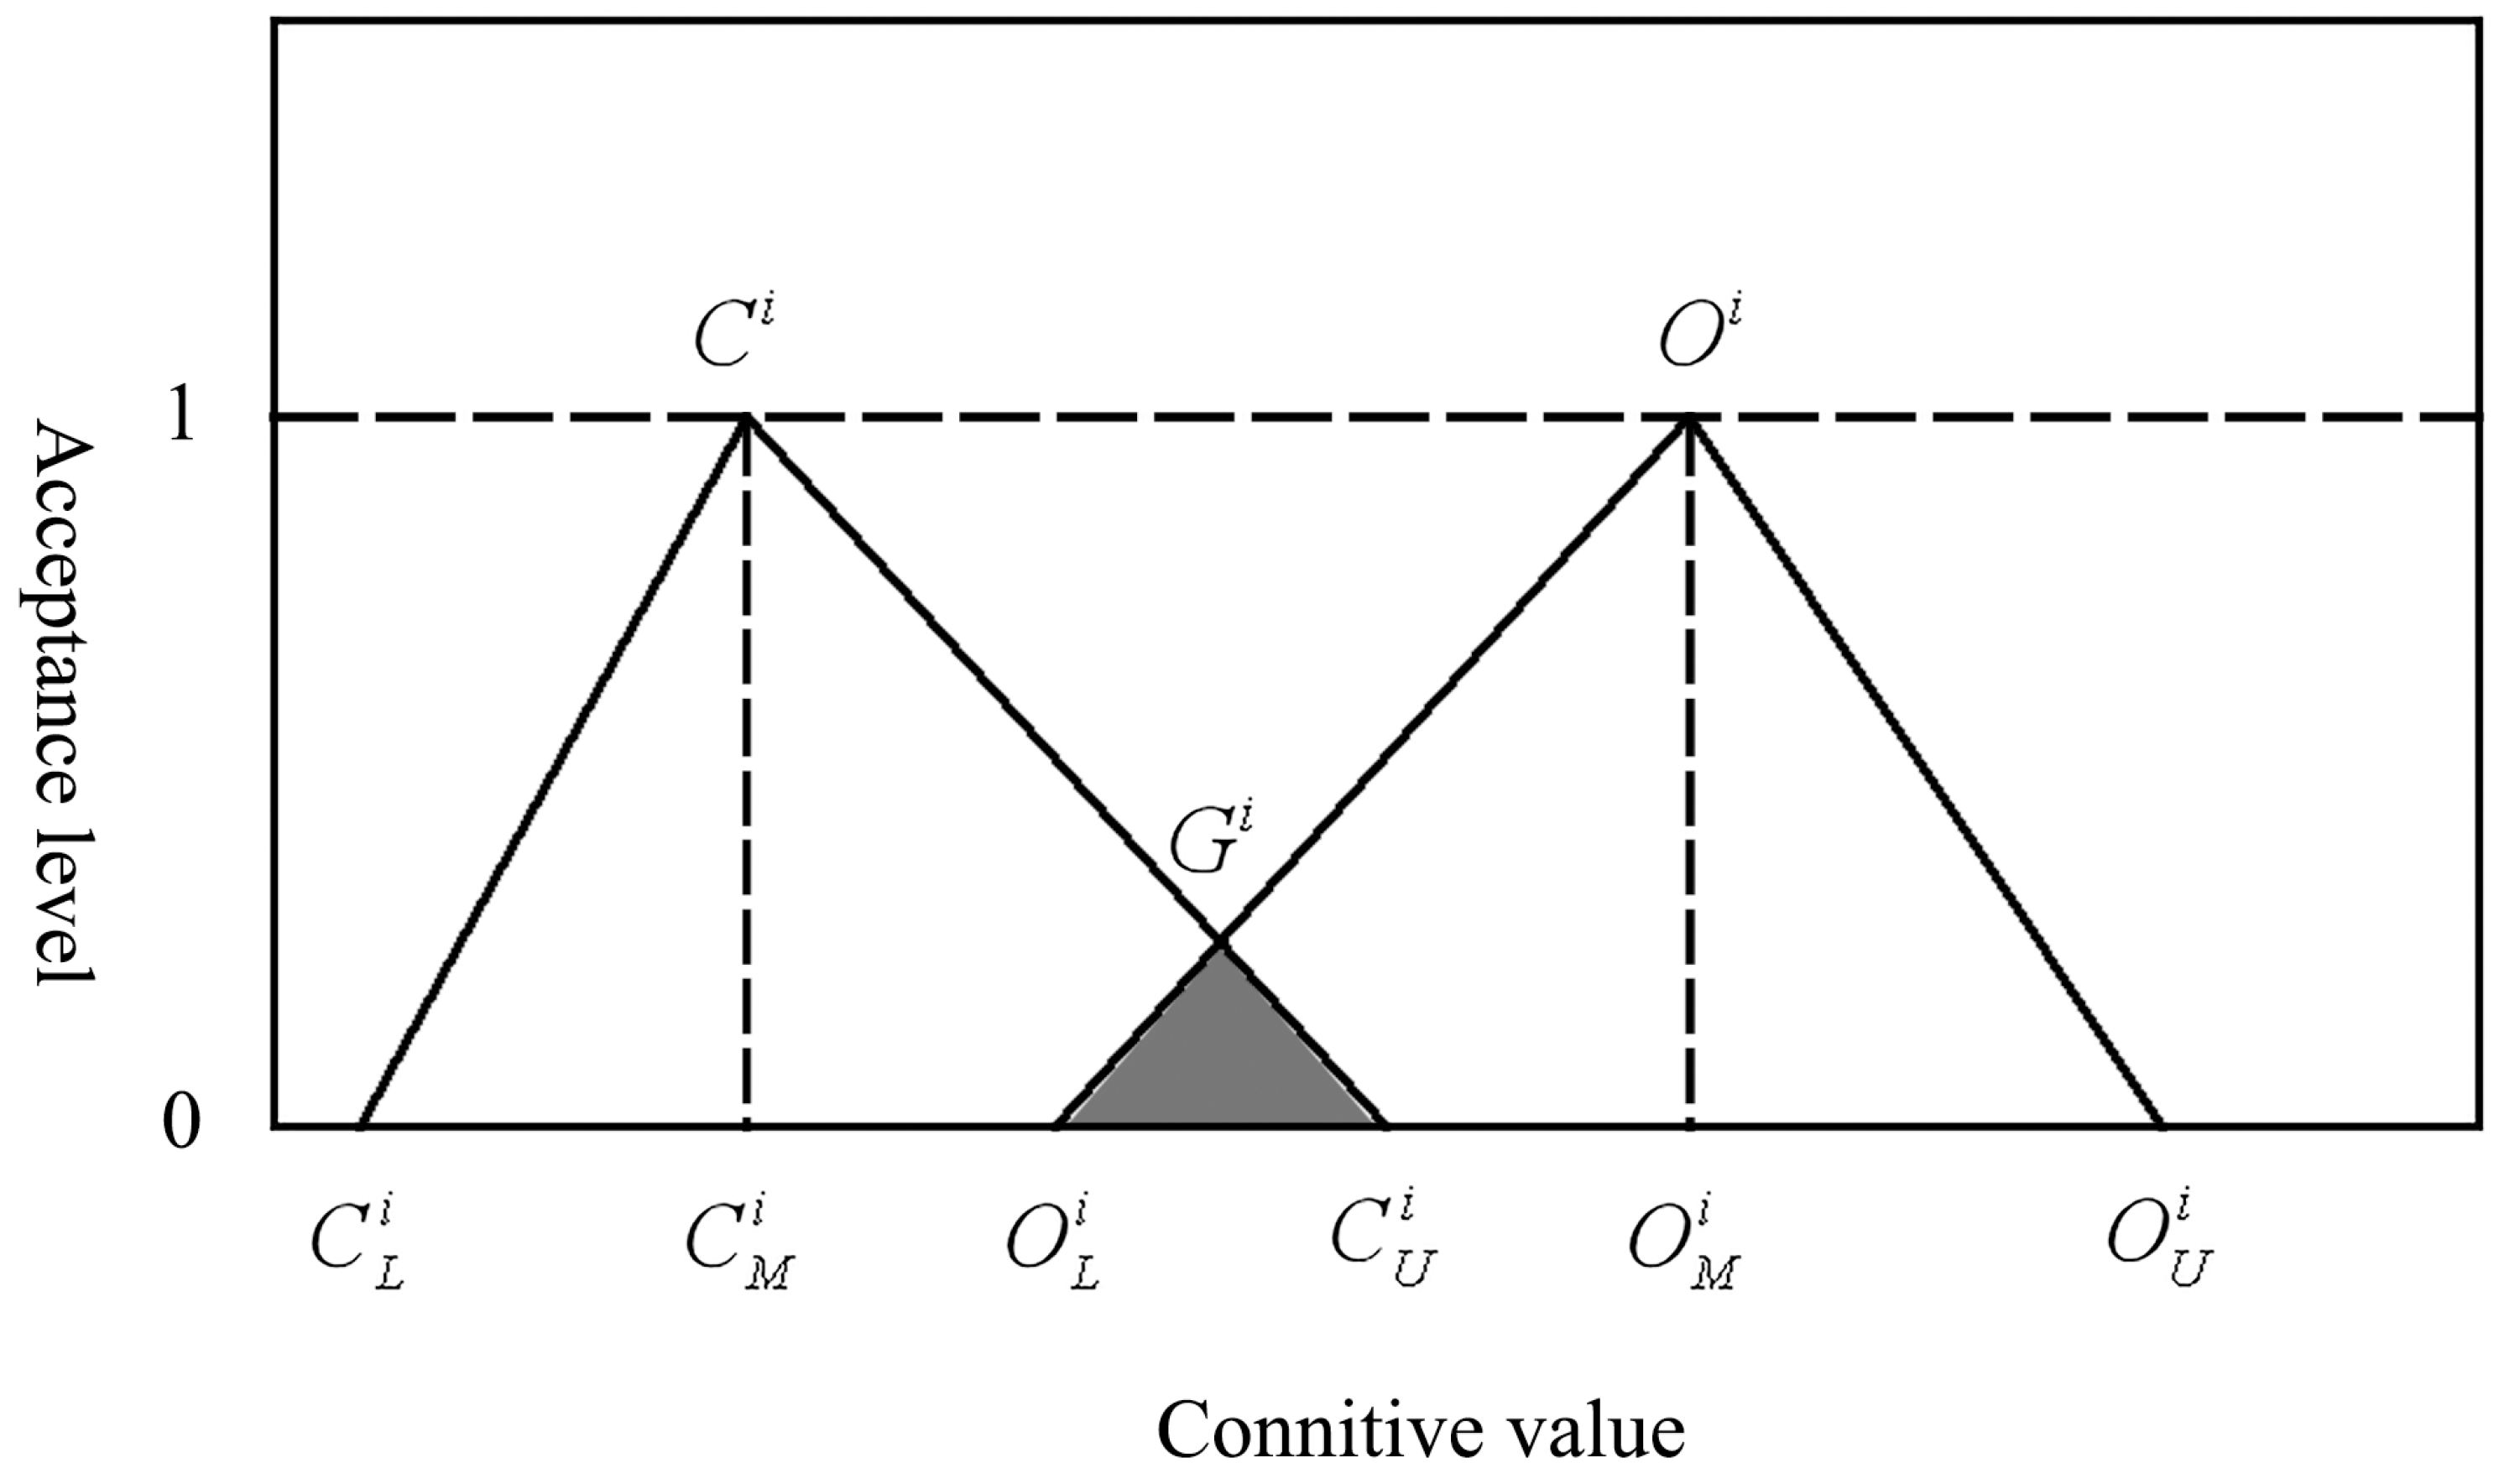
3.1. Fuzzy Delphi Method (FDM)

Combining fuzzy mathematical theory (FT) with the Delphi method (Delphi), statistical analysis and fuzzy calculations were used to transform the uncertainty and vagueness of subjective expert opinions into quasi-objective data to achieve the desired research objectives [26]. The fuzzy Delphi method starts by asking experts’ opinions in the form of an expert questionnaire based on qualitative and quantitative methodological indicators, each of which contains two important components, namely, the importance level indicator and the acceptable range indicator. The importance degree is used to assess the importance of this indicator to the previous level of evaluation and fill in a single value representing the importance of this indicator. The acceptable range for evaluating the importance of this indicator to the previous level of evaluation is expressed as the maximum value  O i  and the minimum value  C i . Each indicator has three key values: “most conservative perception”, “most optimistic perception”, and “single value” [33]. After removing any extreme values that are greater than two times the standard deviation value for each indicator, the minimum, maximum, and geometric mean values of the remaining three key values were calculated, i.e., the minimum value  C L i , the geometric mean  C M i , and the maximum value  C U i  for the “most conservative perception value” and the “most optimistic perception value”  O L i , and the geometric mean  O M i , maximum  O U i , and minimum, maximum, and geometric mean for the “single value”. The fuzzy triangular number method and the gray correlation analysis method were used to integrate the expert opinions and judge whether the expert opinions reached convergence, and only after the opinions converged were we able to calculate the expert opinion leveling degree and evaluate whether it was rigorous and reasonable. The fuzzy triangular numbers of the “most conservative perception value” and “most optimistic perception value” of each index i were established as follows:
C i = ( C L i , C M i , C U i ) ,   O i = ( O L i , O M i , O U i )
M i Z i = M i O M i C M i Z i C U i O L i
Formula (3) is used to calculate the gray area. If the result of  M i Z i  is positive, then the experts’ opinions are converging and the evaluation index has reached convergence; the opposite indicates that the experts’ opinions are not convergent and have not reached convergence and a second questionnaire survey is needed. The higher the value is, the higher the degree of consensus among experts and the higher the importance of the index, as shown in Figure 3.
By setting the threshold value s, the indicators with insufficient importance are excluded. The threshold value s can be set according to the expert opinion or the related literature, or the geometric mean of the three key values of all the indicators to be screened can be calculated by taking the geometric mean of the three key values of all the indicators to be screened and screening out the appropriate number of indicators that are considered important by experts. In this study, the threshold s was set by using the geometric mean of the three key values of all the assessment indicators to be screened and then calculating the geometric mean of s.

3.2. Analytical Hierarchy Process (AHP) Analysis

3.2.1. Construction of a Hierarchical Model Based on the Structure of Indicators

First, based on life-cycle carbon emissions modeling indexes of green buildings of traditional residential houses discussed in this study, for the purpose of relying on each evaluation index of traditional residential houses, the evaluation indexes involved the whole information of the evaluated target, and the indexes involved different levels and were divided into several levels to construct a hierarchical model.

3.2.2. Construction of the Judgment Matrix

According to the constructed hierarchical model, the indicators at the same level were compared with each other to determine the weight that an indicator received at the same level, and, based on this quantification of importance, a judgment matrix was constructed. To determine the degree of weight that a certain indicator occupies in the whole criterion layer, the weight of the indicator in the whole criterion layer was determined by comparing the indicator with each indicator under the criterion layer in turn.  u i j  denotes the importance of element  i  and element  j , and the constructed judgment matrix is denoted by  A = u i j m × n . That is,
A = u i j m × n = u 11 u 12 u 1 n u 21 u 22 u 2 n u m 1 u n 2 u m n
u = u 1 , u 2 , u i , , u n u i U , i = 1 , 2 , , n .
Using the Saaty nine scale method [33], the results obtained by comparing the indicators within the criterion layer of the same hierarchy were quantified to obtain nine scales, and the importance of a single indicator relative to another was obtained by describing these scales in detail, as shown in Table 2.
When the judgment matrix  A = u i j m × n , satisfying the conditions that (1) s  u i j > 0 , (2)  u i j = 1 u i j , and (3)  u i j = 1 , is constructed, then the matrix  A = u i j m × n  becomes a positive mutual inverse matrix.

3.2.3. Weight Calculation Method

After constructing the judgment matrix  A = u i j m × n , the weight value of each individual index was calculated by the sum and product method or the square root method.
For the judgment matrix
A = u i j m × n = u 11 u 12 u 1 n u 21 u 22 u 2 n u m 1 u n 2 u m n
Normalizing each column of the vector of A yields
w i j = a i j i = 1 n a i j ;
w i j  will be summed by row to obtain
w i j = a i j j = 1 n w i j ;
Finally, it was normalized, that is, the exact value of the weight value vector for the one-criterion layer of
w i = w i / i = 1 n w i , w = w 1 , w 2 , , w n

3.2.4. Calculation of the Approximate Value of the Maximum Characteristic Root  w i

The approximate value of the maximum characteristic root is obtained by calculating the following:
λ = 1 n i = 1 n A w i w i
A w = u 11 u 12 u 1 n u 21 u 22 u 2 n u m 1 u n 2 u m n w 1 w 2 w n = a i 1 w 1 + a i 2 w 2 + + a i n w n

3.2.5. Consistency Test

The established model was tested to see if it passed the consistency test by judging a specific value. The test formula is as follows:  C R = C I R T . When  C R < 0.1 , the model achieves the required consistency. Conversely, when  C R 0.1 , the model does not meet the consistency test and needs to be adjusted to meet the required values.

3.2.6. Calculation of Weights for Each Level of Indicators of Traditional Residential Buildings

The detailed calculation of each index was carried out by yaahp12.7 software, and according to the model that was established in this paper, the respective weight values of each index was calculated so that different weight tables for different index layers were derived.

3.3. Carbon Emission Calculation Method of Wood Structure Building

3.3.1. Building Material Production and Transportation Stage

Qiandongnan prefecture of Guizhou has special topography and geography, and the forest area of the whole region occupies more than 67% of the national forest area from Qiandongnan Forestry Bureau, http://ly.qdn.gov.cn/ (accessed on 10 June 2022), but the state has strict requirements for the cutting of forest trees to protect the Dong architecture with ethnic characteristics. Thus, according to the Forest Law of the People’s Republic of China and the State Council Management Measures for the Renewal of Forest Harvesting Sites, related regulations in the Qiandongnan state such as “Measures for the Renewal of Harvesting Sites in Qiandongnan Prefecture” were formulated. After residents cut down the needed timber according to their requirements, the harvesting sites should be completed for reforestation in the current year or the following spring. The production and transportation of materials were divided into two parts: production of building materials and transportation of building materials:
E s y = C s + C y
Type:  E s y —carbon emissions from the production and transportation phase of building materials (kgCO2eq).
C s —indicates the carbon emissions from the production of construction materials (kgCO2eq).
C y —indicates the carbon emissions from the transportation of construction materials (kgCO2eq).
Carbon emissions are calculated for each phase as follows:
Carbon emissions from the production of construction materials  C s : the carbon emissions from the production of construction materials refer to the carbon emissions from the development of raw construction materials; the transportation to processing plants and the energy consumed in the production of materials, which can be obtained from the product of the consumption of construction materials; and the carbon emissions factor per unit of construction materials are calculated as follows:
C s = i = 1 n m i × E F i
Type:  n —the type of building materials.
m i —the amount of building materials used in category  i .
E F i —the carbon emissions factor for the building materials of category  i .
Carbon emissions from the transportation of construction materials  C y : the carbon emissions from material transportation are mainly related to factors such as the mode of transportation, transportation distance, and transportation volume of materials. The road traffic situation is complicated by high mountains, narrow roads, sharp curves, and the poor resistance of road foundations in the territories of Qiandongnan Miao and Dong Autonomous Prefecture. According to relevant studies, generally for roads with large slopes and poor road surfaces, transporting the same weight of goods by the same transport mode consumes more energy than when transportation occurs on roads with small slopes and good levelness; therefore, when calculating the amount of energy consumed by the road conditions for transportation into villages in the state, statistics can be made according to the actual situation and fuel consumption, and the calculation formula is as follows:
C y = i = 1 n M i × D i × E F i + j = 1 m M j × E F j
Type:  n —the number of types of building materials.
M i —the consumption of building materials from category  i .
D i —the average transport distance of the transport of building materials from category  i .
E F i —the carbon emissions factor per unit weight of transportation distance for the  i  type of building material.
m —the number of transport mode categories.
M j —the actual amount of energy consumed by each mode of transport.
E F j —the carbon emissions factor per unit mass per unit transport distance for transport mode  j .

3.3.2. Construction Phase

The construction of rural houses is through self-building, and a construction team basically builds each house. The team mainly relies on manpower, and the workers start the construction with their years of accumulated experience. This construction method can start quickly to improve the project’s progress and shorten the construction period; therefore, there are few opportunities to use machinery and equipment during the construction process, and the carbon emissions at this stage come from the CO2 emitted by the construction personnel on-site due to concentration and the carbon emissions generated during the use of machinery and equipment. The carbon emissions released from the process of construction machinery are mainly generated by the energy consumption of diesel, gasoline, and electricity consumed by the operation of machinery. The calculation formula is as follows:
E s g = i = 1 n T B i × E F i + j = 1 m P j × E F j + k = 1 d B k × E F k
Type:  n —the number of mechanical types.
T B i —the number of machinery units used for the machinery of the category  i  during the construction phase of the building.
E F i —the carbon emissions factors released by construction machinery of category  i .
m —the number of types of construction methods in the construction process.
P j —the amount of construction for each construction method.
E F j —the carbon emissions factor for each construction method.
d —the number of construction workers.
B k —the number of working days.
E F k —the artificial carbon emissions factor, taken as 7.30 kgCO2/(man-working day).

3.3.3. Operation Phase

The carbon emissions in the building operation phase mainly involve the comprehensive calculation of carbon emissions from energy consumed by air conditioning, heating, domestic hot water, lighting, and ventilation, as well as carbon reductions from renewable energy systems and building carbon sinks. However, the operational energy consumption of rural buildings is influenced not only by local climatic conditions and economic factors but also by many uncertain factors, such as ethnic background, cultural quality, and behavior of indoor occupants. Furthermore, a hot summer and cold winter building climate is typical in Qiandongnan, Guizhou. However, the rural areas in the state seldom use air conditioning for cooling in summer and still retain the habit of burning charcoal for heating in winter; therefore, burning charcoal for heating in winter is the main energy consumed by residential dwellings. With the development of society, although household appliances have become popular, only televisions are used every day, with the exception of lamps and lanterns for lighting, which are necessary for daily life. In addition, high-grade household appliances such as refrigerators, air conditioners, and computers have not yet become popular.
With the deepening of China’s awareness of the ecological environment, rural dwellings are added to green building technology or renewable energy systems when new and existing dwellings are reconstructed to improve the living environment of residents and the protection of the natural environment. In Qiandongnan, as a forest resource with more than 67% of the national forest area, the local dwelling buildings are still mainly made of wood, which is a renewable green material and has the function of long-term carbon storage. In summary, the carbon emissions of the building operation stage are calculated as follows:
E y y = i = 1 n m i × E F i + M × E F m i = 1 n R i × E F i L H × Y
Type:  n —the number of energy types.
m i —the annual consumption of energy in  i .
E F i —the carbon emissions factor of the  i th energy source.
M —the annual consumption of charcoal.
E F m —the carbon emissions factor for charcoal.
R i —the annual savings of the  i th energy source.
L H —the annual carbon reduction of the green system.
Y —the life of the building.
(1)
Calculation of energy consumption and carbon emissions
Energy consumption data in the operation phase of buildings can be obtained through actual surveys and statistics, and when specific values are not available, they can be calculated using relevant energy consumption simulation software. Statistical data for domestic surveys were mainly obtained from the China Energy Statistical Yearbook, the China Rural Statistical Yearbook, and statistics from government authorities at all levels from 2001 to 2019. Among the more mature energy consumption simulation software both at home and abroad, DeST has a strong geographic presence, and this energy consumption software can be used to simulate the building operation phase and calculate the carbon emissions in this phase.
(2)
Carbon reductions from renewable energy, plants, and building wood carbon sinks
At present, renewable energy systems include solar domestic hot water systems, photovoltaic systems, ground source heat pump systems, and wind power generation systems combined with the current national standard, the “Green Building Evaluation Standard” GB/T 50378-2019, for renewable energy in three forms: renewable energy to provide domestic hot water, cold and hot air conditioning, and electricity. These three forms correspond to the solar photo thermal system, ground source heat pump system (including the buried pipe type and water source type), solar photovoltaic power generation system, etc. (from GB/T51366-2019 “Carbon Emission Calculation Standard for Buildings” [34]). The pristine green mountains and water and farming crops in Qiandongnan have provided abundant biomass for many years. The development of rural renewable energy in Qiandongnan over time has been based mainly on the utilization of biomass energy supplemented by micro-hydropower and solar energy. The utilization of biomass energy is also based mainly on the burning and utilization of fuel wood (called fuel wood in rural areas) and on crop straw, which comes from forestry biomass and agricultural biomass. Fuel wood does not contain harmful elements such as sulfur and does not pollute the atmosphere when burned, making it a clean fuel; in contrast, the direct burning of straw will produce many harmful gases, such as carbon dioxide, which cause atmospheric pollution. Thus, there must be a method of turning straw into clean energy, e.g., a special boiler inside the combustion, so that the waste can be converted to clean fuel or straw processing called clean energy fuel. However, in the territory of Qiandongnan, due to various factors such as transportation and economics, the region does not currently have the ability to turn straw into clean energy. Therefore, this study in the residential area focused on the following: applying the energy system of renewable energy directly deducted from the consumption of fuel wood; giving the solar thermal system energy and photovoltaic power generation system an energy calculation formula and installing the method in rural areas using these systems; and calculating the annual energy provided according to the local climate, the amount of sunshine, and the relevant design information and product parameters using the calculation formula reference GB/T51366-2019 “Building carbon emissions calculation standards”.
The annual carbon reduction (LH) of the greening system is the amount of CO2 in the atmosphere that is reduced by the vegetation at the building site through photosynthesis, which absorbs CO2 from the atmosphere and fixes it in the vegetation and soil. There are abundant plant species in Qian, southeast China; thus, the intensity of photosynthesis varies among different plant types, and the amount of carbon reduction varies. The amount of carbon reduction of vegetation is affected by the climate, growth environment, species, and other factors. Currently, the agriculture and forestry industries have developed relevant calculation methods, such as the Methodology of Carbon Sink Measurement and the Monitoring for Bamboo Forestry Projects issued by the State Forestry Administration. However, no official methodology has been issued for the carbon sink methodology of green vegetation in residential buildings. In this paper, we refer to the relevant algorithm in the Technical Assessment Manual for Green Low-carbon Settlements in China for calculation, and the calculation formula is as follows [9]:
L H = i = 1 n G e , i × A e , i 600 × R × A s 40
Type:  n —the different planting methods in the greening system.
G e , i —the carbon sequestration per unit area of 40 years for the  i th planting method.
A e , i —the green area of the  i th planting method.
R —the green space ratio, %.
A s —the total land area of the building.

3.3.4. Dismantling and Disposal Stage

The stage of building demolition is equivalent to the reverse process of building construction. After the demolition of residential houses in Qiandongnan, the building materials were divided into two methods of treatment, namely, recycling and disposal. Metal materials such as steel and aluminum alloy used in residential buildings are recycled, and building materials such as wood and glass, which have been exposed for a long time and are no longer suitable for the recycling of building materials, are processed with certain technologies and used for household items or other objects. For abandoned building materials such as bricks that have lost their load-bearing capacity, a general simple treatment is used as roadbed filling. The calculation formulas are as follows:
E c c = Q C C + Q f y + Q c l
Q c c = i = 1 n T B i × E F i + j = 1 m P j × E F j
Type:  n —the number of types of machinery
Q c c —the carbon emissions from building demolition.
T B i —the amount of machinery shifts used for machinery of category  i  in the construction demolition phase.
E F i —the carbon emissions factors released by the construction machinery of category  i .
m —the number of types of demolition methods in the demolition process.
P j —the amount of construction for each demolition method.
E F j —the carbon emissions factors for each demolition method.
Q f y = i = 1 n M i × D i × E F i + j = 1 m M j × E F j × 1 R r e c , i × D w + R r e c , i × D r
Type:  Q f y —the carbon emissions from construction waste transportation.
n —the number of types of building materials.
M i —the consumption of building materials of category  i .
D i —the average transport distance of the transport of building materials category  i .
E F i —the carbon emissions factor per unit weight of transport distance for the  i th type of building material.
m —the number of transport mode categories.
M j —the actual amount of energy consumed by each mode of transport.
E F j —the carbon emissions factor per unit mass per unit transport distance for transport mode  j .
D w —the average transport distance of no recyclable waste from the demolition site to the waste treatment plant.
D r —the average transport distance of recyclable waste from the demolition site to the recycling station.
Q c l = i = 1 n W i × E F l a , i × R l a , i + E F i n c , i × R i n c , i
Type:  Q c l —the carbon emissions from construction waste disposal (including landfill and incineration).
W i —the total mass of waste of category  i .
R l a , i R i n c , i R r e c , i —the proportion of category  i  waste that is landfilled, incinerated, and recycled, respectively.
E F l a , i E F i n c , i —the carbon emissions factors for landfill and incineration of category  i  waste, respectively.

4. Results

4.1. Selection of Carbon Emissions Factors

4.1.1. Selection of the Energy Fuel Factor

Energy carbon emissions factors can be subdivided into fossil energy carbon emissions factors corresponding to direct carbon emissions and electricity and heat carbon emissions factors corresponding to indirect carbon emissions. According to the energy balance sheet data of Guizhou Province in previous years, heat accounts for a relatively small proportion of domestic consumption, mostly concentrated in industrial consumption, and heat data were missing from 2009 to 2014. Therefore, in the calculation of carbon emissions from secondary energy consumption in residential life, only carbon emissions from electricity were calculated.
CO2 emissions from fossil fuel combustion are the most important source of greenhouse gases, and accurate accounting of CO2 emissions from fossil fuel combustion is the basis for emission reduction policy formulation and implementation. The accuracy of building carbon emissions accounting comes from the selection of carbon emissions factors. Though the analysis of the current domestic and foreign selection of building carbon emissions factors varies, there are some differences. This paper mainly selected China in 2019 to develop the “building carbon emission calculation standards” in carbon emission factors.
Concerning the electricity carbon emissions factor, different regions of China have different grid structures. At present, there is no unified standard for calculating electricity carbon emissions in China, and there are two main electricity carbon emissions factors in the process of accounting for electricity carbon emissions: one is the baseline emissions factor of the regional grid, and the other is the average carbon emissions factor of the regional grid. China has vigorously developed clean energy generation in recent years, and the energy structure in the building operation phase has changed significantly, which has reduced the electricity carbon emissions factor. Therefore, the latest published weighted average of OM and BM in 2019, was chosen in this study to calculate the electricity carbon emissions of southern residential buildings. The baseline emission factors of the regional power grid include the power marginal emission factor (OM) and capacity marginal emission factor (BM). OM refers to the weighted average emission factor per unit of power generation per year for the power plant groups that are preferentially dispatched and laid off in the dispatching sequence of the grid system. Because the emphasis is related to power grid operation and dispatching, it is also called the operation marginal emission factor. Among them, the base-load and must-operate power plants in the grid with zero or low operating costs, such as hydropower, low-cost biomass, nuclear power, and solar power, are not affected and are therefore excluded from the operating margin. BM is the marginal part of the development of the installed capacity of the entire power grid; it is weighted by its annual generating capacity to calculate the average emission factor per unit of power generation. Because the emphasis is related to power grid construction, it is also called the construction marginal emission factor.

4.1.2. Carbon Emissions Factor of Building Materials

The acquisition of carbon emissions factors for building materials requires the analysis of the whole process of building material production, which is difficult to calculate because of the wide variety of building materials and the different production and processing processes of different building materials. Currently, there are mature building material databases for building material carbon emissions factors at home and abroad, but the authoritative database in China is preferred in consideration of the study site. At present, the main Chinese building foundation databases are the China Material Environment Database (Sino center), the China Life-cycle Foundation Database (CLCD), and the CTC-Green Building Materials Evaluation System. The carbon emissions factors of building materials in China’s Standard for Calculating Building Carbon Emissions (GB/T 51366-2019) were all from the China Life-cycle Foundation Database, and considering the accessibility of data, the relevant data from the China Life-cycle Foundation Database were also selected for the carbon emissions factors of building materials in this study.

4.1.3. Transportation Carbon Emissions Factor

Since there are many types of transportation vehicles and the types and amounts of energy consumed when transporting construction materials vary from one vehicle to another [35], the carbon emissions generated are also different, but the data are difficult to obtain. Thus, this study used the carbon emissions factors for the transportation of building materials given in the Standard for Calculating Carbon Emissions from Buildings (GB/T 51366-2019).

4.1.4. Carbon Emissions Factors for Machinery and Equipment

The machinery and equipment involved in this study were mainly construction machinery and equipment used in the building construction and demolition stages, such as cranes, bulldozers, and excavators. Considering the availability and accuracy of data, the carbon emissions factors of machinery and equipment given in the Standard for Calculation of Carbon Emission of Construction (GB/T 51366-2019) were used.

4.2. Empirical Analysis of the Physical Environment of the Dong Traditional Dwellings in Qiandongnan

4.2.1. Regional Ambient (Alleyway) Air Temperature and Wet and Black Bulb Temperature Analysis

As shown in Table 3, the average air temperature (Ta 35.5 °C in summer and Ta 6.9 °C in winter) and the average black bulb temperature (Tg 38.6 °C in summer and Tg 7.0 °C in winter) of Gaozeng Village were the highest compared to the other four villages in winter and summer because Biapa, Xiage, and Tangan Village are mountainous villages built on sunny slopes near water sources. The forest vegetation around the villages can regulate the physical environment of the villages and the external environment of the dwellings, and the microclimate of the areas with a large amount of vegetation can be effectively improved. Although Gaozeng Village and Zhaoxing Village are both flat dam-type villages formed by the impact of rivers causing flat dams, Zhaoxing Village is 180 m higher in elevation than Gaozeng Village, making the maximum Ta and Tg in summer lower than those in Gaozeng Village.
Table 3 shows that the average Ta, the highest Ta, and the lowest Ta of Lane 1 are higher than those of Lane 2 in winter, and the average Ta, the highest Ta, and the lowest Ta of Lane 1 Ta are lower than those of Lane 2 Ta in summer because although Lane 1 and Lane 2 are parallel east–west, Lane 1 is wider than Lane 2, and Lane 1 (D/H > 1) and Lane 2 (D/H < 1). In winter, as Lane 2 is narrow, the cold wind passes through and makes Ta fluctuate greatly compared with Lane 1. Therefore, under the condition that the wind direction is certain and the road is built downwind, a suitable lane size can change the Ta value of the environment at the building site to a certain extent.
Table 4 displays the monthly average, maximum, and minimum values. The highest temperature is in August and the lowest is in January. The hot season is from June to August. The average humidity is unstable throughout the year, and the maximum humidity varies greatly from the minimum humidity. In this study, the hottest month in summer (August) and the coldest month in winter (January) were selected for field investigation to investigate the temperature and humidity of traditional residential houses under extreme weather conditions in Qiandongnan.

4.2.2. Analysis of the Internal Environment of Traditional Houses

Table 5 shows that the summer village dwelling Ta is as follows: Gaozeng Village (35.5 °C) > Biapa Village (34.6 °C) > Xiage Village (34.5 °C) > Zhaoxing Village (34.3 °C) > Tangan Village (32.9 °C); the bedroom Ta of Xiage Village (34.5 °C) > Gaozeng Village (34.1 °C) > Biapa Village (34.0 °C) > Zhaoxing Village (33.2 °C) > Tangan Village (32.3 °C). This is because many factors determine the indoor Ta, mainly because these two dwellings have a common feature: the opening ratio of doors and windows in the building is small and some walls do not have windows. The maximum, minimum, and average RH values of the dormitory and bedroom of Gaozeng Village were the lowest among the five residential measurement points of RH in winter and summer because the vegetation cover of the Gaozeng Village residential site is small compared with the other four measurement points, and plants have the function of moisture retention. The shielding effect of plants reduces the transpiration of water, making the indoor RH of the other four residential houses higher than that of Gaozeng Village at the five points.
In winter, excluding the influence of the altitude factor, the average indoor Ta of the selected village residential buildings, except for Xiage Village, was as follows: bedroom Ta > hall Ta > outdoor Ta. This is mainly because the outdoor open space is directly affected by the external climate, while the building envelope of residential buildings can delay the rapid change of indoor temperature with the change of outdoor temperature. Thus, the indoor temperature is higher than the outdoor temperature, and the bedroom is a relatively small space; as a result, the bedroom loses the least amount of heat during the day. The average indoor/outdoor Ta of Xiage Village in winter follows the order of living room > bedroom > outdoor because the Dong people have implemented the habit of “fire ward” in winter since ancient times, and fire pits are usually placed in the hall, making the average temperature of the hall higher than that of the bedroom during the day.

4.3. Constructing Locality Model Evaluation Indicators Provides Important Indicator Choices

Combined with the field research of Dong traditional dwellings in Qiandongnan and the quantitative analysis of the thermal environment inside and outside the dwellings and villages using relevant instruments, we provide important index choices for the construction of a regional traditional dwelling whole life-cycle carbon emission model evaluation index system.

4.3.1. Energy Use

Village street building D/H (width to height ratio): When the village street building D/H (width to height ratio) ≥ 1, the outdoor environment of residential houses uses the street ratio to form artificial wind ducts in summer to remove the excess heat brought by solar radiation in the street; in winter, it reduces the air circulation of cold outdoor air in the street.
Indoor air circulation: The dominant summer wind direction is used to remove excess heat from the room and increase the comfort of the indoor thermal environment. This further reduces the input of related energy and saves energy.

4.3.2. Site Ecology and Landscape

Application of plants in the landscape: Using the characteristics of plants themselves, the natural landscape of the village building is shaped by plants, and the visual, physical, and psychological comforts of the site around the building are enhanced by the planting techniques with horizontal and vertical layers.
Use of plants in the physical environment: The rational use of plants’ own ability to sequester carbon, maintain the humidity of the surrounding air, and block solar radiation from affecting the physical environment of residential buildings optimizes the overall quality of the building’s indoor and outdoor environments.

4.3.3. Land Saving

Building site selection and safety: The all-round use of the local geographical environment for building site selection and safety considerations can reduce economic losses due to natural disasters, save resources, and reduce the investment of human and material resources.
Building orientation: A reasonable building orientation can reduce the comfort because of cold air entering the room in winter and can form a wind tunnel with doors and windows in summer to remove excess heat from the room and improve the overall thermal stability and comfort of the room.
Building window and door hole ratio: The proportion of the window and door openings in the envelope directly affects the thermal stability of the building’s interior, and a reasonable window and door hole ratio largely affects the natural ventilation of the building’s interior in summer and the intake of indoor light in winter.

4.3.4. Material Saving

Envelope materials: Choosing the right building envelope can improve the indoor thermal environment and enhance the comfort of residents indoors.

4.4. Life-Cycle Carbon Emission Evaluation Model of Traditional Dong Houses in Qiandongnan

4.4.1. Composition of the Indicator System

The selection of evaluation indicators cannot be separated from the study of the existing system, and the evaluation of traditional residential buildings involves three dimensions of inheritance, comfort, and authenticity, as well as three thematic elements of design users, architecture, and environment. Therefore, this paper takes this as a basis, and on the basis of translating the characteristics of Dong traditional residential buildings in southeastern Guizhou, draws on the existing evaluation standards and index elements in the system at home and abroad. Through scientific, objective, and reasonable analysis of information and data, the evaluation indexes suitable for Dong traditional dwellings in Qiandongnan were finally selected, as shown in Table 6.

4.4.2. Determination of Evaluation Model Indicators for the Whole Life-Cycle Carbon Emissions of Traditional Houses

Using the fuzzy Delphi expert questionnaire method, a detailed survey was completed with relevant personnel in three fields: construction experts, architectural designers, and building constructors. The preliminary whole life-cycle carbon emission model index system for traditional residential buildings was established by determining the weight scores of each index through the AHP method.
A hierarchical analysis method was used to construct a recursive hierarchical structure model of multilevel indicators, and the importance of each indicator was quantified using the hierarchical structure model. Its importance was divided into nine scales, and the importance of the indicators was judged based on the size of the numbers derived from each indicator. After that, a judgment matrix was constructed to compare the weights of two indicators, and then a consistency test was conducted by calculating the maximum eigenvalue and related parameters. Under the condition of passing the consistency test, the weight coefficient of each indicator was calculated, upon which a complete evaluation system was finally constructed. The multilevel structure model was established, the hierarchical structure model used in this paper referred to the typical AHP method, and the model was divided into four levels in total, as shown in Table 7.
Since there were four primary indicators, seven secondary indicators, and fifteen tertiary indicators in this study, using the professional calculation software of AHP, yaahp12.7, reduced both the workload and the errors of software calculation. A complete model was created using yaahp12.7 software, and the software was used to calculate all the indicators of the study by itself, i.e., as shown in Table 8.

4.5. Evaluate and Score the Carbon Emission of Traditional Residential Buildings

4.5.1. Evaluation Criteria Grading and Quantification

To deal with the qualitative, disordered, and fuzzy indicators in the evaluation system has become the focus of this stage. In the same evaluation system, the evaluation of qualitative indicators and the evaluation of quantitative indicators need to choose a compromised evaluation method to improve work efficiency and ensure the authenticity of data. Quantitative indicators: (1) Temperature, window-to-ground ratio, and other directly quantifiable indicators can be measured by the instrument to obtain specific data. (2) For data requiring qualitative analysis, such as ethnic belief and culture, the quantification of these indicators generally relies on the long-term practical experience of experts to subjectively judge and estimate the indicators. There are certain uncertainties in this method of quantifying qualitative indicators. It is generally believed that the higher the seniority and experience of experts, the higher the reliability of the obtained qualitative analysis data.
For the evaluation of carbon emissions of traditional dwellings in Guizhou, it is necessary to integrate the cultural characteristics of regional architecture, take into account the rigid demand for traditional dwellings as housing, and blindly pursue data quantification and ranking, which will reduce the authority of the evaluation system. According to the above principles, the evaluation method of carbon emission evaluation of traditional residential houses in Guizhou is defined as follows: (1) In the evaluation process, the evaluation value is set into five levels for qualitative indicators, which respectively represent “very good, good, average, bad, very bad”. After the evaluation level is determined, the corresponding level is quantified. (2) For quantifiable indicators, the evaluation value is also set at five levels, that is, “1, 2, 3, 4, 5” respectively represent “highly inconsistent, inconsistent, consistent, superior, highly superior” and “bad, poor, average, better, good” in a one-to-one correspondence. In this evaluation setting, the scores of qualitative and quantitative indicators can be balanced, which is similar in meaning, and the evaluation content of qualitative and quantitative indicators can be taken into account, which is convenient for data sorting.

4.5.2. Evaluation Level Interpretation

According to the above principles, the evaluation and interpretation of the carbon emission evaluation indicators of traditional residential houses in Guizhou were carried out, as shown in Table 9, in order to achieve more intuitive results in the evaluation scores.
According to the field survey data mentioned above, the relevant problems existing in residential buildings and the evaluation index system constructed through the questionnaire extracted by experts and local residents can be seen to a certain extent that the constructed system conforms to the whole of local residential buildings, which has certain reference significance. Compared with the original green building evaluation standard, it is more in line with the local index requirements.

5. Discussion

5.1. The Influence of Multidimensional Indexes on the Construction of Different Degrees of Carbon Emission Model Indexes for the Whole Life-Cycle of Residential Buildings

In Table 8, the weight of the ecological quality index is 0.5209, occupying the first position, and its first-level index was the life-cycle carbon emissions of residential buildings, which was the trend of gradually increasing energy consumption by rural buildings in China since rural revitalization began and the economic level and the living standard of residents improved, and the government increased the importance of carbon emissions of rural buildings. According to the analysis of the Qiandongnan Statistical Yearbook, the per capita disposable income of rural permanent residents in 2020 was RMB 11,082, a nominal increase of 8.3% in comparison to 2019. The per capita living consumption expenditure of rural permanent residents grew from RMB 6963 in 2016 to RMB 10,639 in 2020, with an average annual growth rate of 13.2% (data from Qiandongnan Statistical Yearbook, 2020). With the improvement of the economic level and living standards, farmers’ requirements for their own living environments have increased, the use and renewal of living equipment have accelerated, and farmers have improved the indoor comfort of residential buildings by adding air conditioning and heating equipment, which has increased the carbon emissions of the building life-cycle and further increased the energy-saving requirements for rural buildings. As seen in Table 8, the production and transportation phase of building materials and the operation phase of traditional residential buildings each occupied weight scores of 0.2489 and 0.1605, which were higher than the carbon emissions scores of the building construction and demolition and disposal phases because the building materials of traditional residential buildings are mainly wood-based, and wood, the main building material of wood-frame buildings, as well as engineered wood materials have carbon sequestration properties [31]. The carbon emissions flow of wood-frame residential buildings is minimal compared to other structural residential buildings, and the carbon emissions flow in the abandonment and recycling phase is mainly negative, which occupies an important position in the stage of enhancing the carbon emission of optimized residential buildings [31]. Further investment in a range of green building technologies, such as local building materials, solar hot water, and greening systems, in the building operation phase has carbon reduction potential [31]. From Table 7, it was found that the weight of the demolition and disposal stage was higher than that of the building construction stage, mainly because the demolition and disposal stage had more carbon emissions consumed by waste removal, transportation, and recycling than the construction stage, so more attention should be given to the carbon emissions of this stage and we should invest in optimizing and upgrading more green technologies in this stage.
From Table 8 it was found that the index weights of healthy livability occupied the second position, mainly because the health and livability indexes were related to both the feeling and the health of people’s outdoor activities and ecological protection and affected the indoor environmental quality of buildings and energy savings [31]. Green plants, as an important factor affecting the microclimate of outdoor activity space, can regulate the microclimate of courtyard space to a certain extent and play a role in improving the outdoor thermal comfort of residents. The plant landscape influences the built environment at the level of spatial construction, experiential perception, and cultural cues [31]. The unavoidable effects of environmental changes caused by development activities can be compensated for by outdoor site greening and the three-dimensional greening of buildings [31]. The outdoor microclimate, air circulation, and humidity all affect the outdoor physical environment, and the physical environment can enhance the livability and comfort of traditional villages and improve the outdoor thermal environment of residential areas [31]. According to the Qiandongnan Statistical Yearbook, the Dong population in Qiandongnan increased by 48,000 people from 2016 to 2020, which is an increase of 3.4%, and the increase in the Dong population requires more attention in terms of planning the environment of rural settlements to create a livable and comfortable outdoor working environment. It is difficult to have good climate adaptability if the regulation of the building monolith itself is detached from the overall environment of the village.
As seen in Table 8, the weight of 0.2008 was given to resource-saving indicators in the first level, and the reason for this phenomenon was related to the fact that rural areas have started to pay attention to building energy efficiency [31]. With the residents’ demand to improve their habitat and the country’s energy shortage in the context of continuing the traditional style and improving building energy efficiency for the sustainable development of traditional villages, rural buildings designed using energy-efficient building methods consume less energy than ordinary energy-efficient buildings. Among the factors considered for energy-efficient building design, the high energy consumption and crude energy utilization methods of rural houses have become important constraints on their environmental protection, so it is important to focus on rural ecology, environmental protection, and building energy conservation. We can see that among the indicators of resource conservation, energy conservation, and energy use indicators were weighted close to twice that of the other indicators and occupied a very important position. This result is because in the “energy conservation and energy use” section of the 2019 edition of the standard, compared with the basic content of the 2014 edition, further optimization of building energy consumption was encouraged in the improvement and innovation items. At the courtyard level, the choice of a south–north orientation layout, a reasonable enclosure method, and the layout form indicators could regulate the natural climate and reduce the use of energy. Under the condition that the building orientation prioritized topography, the indoor thermal environment of new residential buildings and the thermal insulation of buildings could be effectively improved by optimizing the construction practices of residential facades [31].
The culture of ethnic characteristics is also an important part of the construction of building carbon emission model indexes, and at the level of monolithic construction, the adaptability of building monoliths to the terrain, the building components in response to solar radiation, the building envelope, and the building roof slope in response to the climate environment affect the adaptation to the climate natural geographical environment [31]. The construction materials and building shapes of the southwestern dwellings have the characteristics of the low technical, regional, and ecological construction techniques of the southwestern traditional dwellings [31]. In addition to the airtightness of the envelope structure and the law of indoor temperature fluctuation, the preservation of the style and architectural decoration details are important objects of attention for the renewal and renovation of traditional houses [31].

5.2. Limitations and Applicability

There are still some shortcomings in this study. First, the service life of residential buildings is long, and the technical skills of residential construction, the characteristics of building energy equipment, and the behavior of occupants will change over time. Thus, the environmental impact of greenhouse gas emissions has a time lag. To achieve a closer assessment of the long-term environmental performance of residential buildings, a dynamic life-cycle assessment method should be considered. However, the research on dynamic life-cycle theory is still immature, and the calculation itself is complicated; therefore, the life-cycle carbon emissions accounting model of traditional residential buildings established in this paper did not consider the time dimension, which should be studied in subsequent work. Second, for the extraction of local evaluation indexes using physical environment measurements, the measurement time is only one day for the local extreme climate, and the thermal and humid environment is only the measured indoor and outdoor temperature and humidity, so future research should not only increase the measurement time of the local extreme climate but also increase the thermal environment influencing factors to construct more comprehensive green evaluation indexes for traditional houses.
Despite these shortcomings, this study has strong use and application value. The building carbon emissions can be applied to residential houses in regions other than Southwest China to further account for the carbon emissions of residential houses, which has practical significance for the conservation and development of traditional residential houses.

6. Conclusions

To implement the concept of green development, promote the green development of construction, and better achieve the goals of energy saving and carbon reductions in the construction industry, building a carbon emission evaluation index and a green building evaluation system can not only ensure the authenticity of green building energy saving and carbon reduction but also help promote energy saving and carbon reductions in the construction industry. Combined with the regional characteristics of the Dong traditional dwellings in Qiandongnan, the “Whole Life-cycle Carbon Emission Model of Traditional Houses in Qiandongnan” was constructed. (1) The life-cycle carbon emission calculation model of residential buildings was divided into four stages: production and transportation of building materials, construction, operation, and demolition and disposal. (2) Analyzing the limitations of the existing local standards in China and the actual measurement of the physical environment of the Dong traditional dwellings in Qiandongnan, the 2019 national version of the Green Building Evaluation Criteria was combined with the reorganization and construction of an index system suitable for the Dong traditional dwellings in Qiandongnan, with the primary indicators resource conservation, environmental livability, culture of ethnic characteristics, and ecological quality, and the following special feature: increasing the primary indicators. Under the people-oriented main theme, the new indicators could better reflect the construction of the local environment and regional characteristics. (3) The carbon emissions generated by construction workers during the construction phase were an important part of the total carbon emissions in this phase, so carbon emissions generated by construction workers cannot be ignored. In this paper, carbon emissions from construction personnel activities were considered in the calculation of the life-cycle carbon emissions of residential buildings, and a corresponding calculation method was proposed. In addition, due to the difference in building types and regions, the carbon sink capacity of wood in the operation stage of the building was not emphasized in previous studies, which will result in errors in the carbon emissions calculation of traditional residential buildings with wood as the main building material; thus, this paper included the carbon sink capacity of wood in the operation stage of the building. In this paper, the carbon emissions reduction from the production stage of building materials was underestimated. To address this issue, this paper considered the carbon emissions of building material recycling in the demolition and disposal stage, which was more in line with the actual situation.

Author Contributions

Conceptualization, S.W.; methodology, S.W. and H.Z.; software, H.Z.; validation, M.G.; formal analysis, Y.G.; investigation, H.Z.; resources, S.W.; data curation, H.Z.; writing—original draft preparation, S.W. and H.Z.; writing—review and editing, S.W.; visualization, M.G.; supervision, Y.G.; project administration, S.W. and M.G. All authors have read and agreed to the published version of the manuscript.

Funding

This research was co-funded by the “National Nature Science Foundation of China (52368004)”; “National Nature Science Foundation of China (52368002)”; “Guizhou Provincial Science and Technology Projects (Qian Ke He Ji Chu-ZK [2022] General 234)”.

Institutional Review Board Statement

The study was conducted in accordance with the Declaration of Helsinki, and approved by the Institutional Review Board from Faculty of Architecture and Urban Planning, Guizhou University.

Informed Consent Statement

Informed consent was obtained from all subjects involved in the study.

Data Availability Statement

Not applicable.

Acknowledgments

We are grateful to Qiandongnan Meteorological Bureau for providing data on the temperature, humidity and wind speed of Dong folk houses from 2020 to 2022.

Conflicts of Interest

The authors declare no conflict of interest.

References

  1. Liu, Z.; Deng, Z.; He, G.; Wang, H.; Zhang, X.; Lin, J.; Qi, Y.; Liang, X. Challenges and opportunities for carbon neutrality in China. Nat. Rev. Earth Environ. 2021, 3, 141–155. [Google Scholar] [CrossRef]
  2. Wei, D.; Yang, L.; Bao, Z.; Lu, Y.; Yang, H. Variations in outdoor thermal comfort in an urban park in the hot-summer and cold-winter region of China. Sustain. Cities Soc. 2022, 77, 103535. [Google Scholar] [CrossRef]
  3. IPCC. IPCC Global Warming of 1.5 °C. Available online: https://www.ipcc.ch/sr15/ (accessed on 12 March 2022).
  4. Ahmed Ali, K.; Ahmad, M.I.; Yusup, Y. Issues, impacts, and mitigations of carbon dioxide emissions in the building sector. Sustainability 2020, 12, 7427. [Google Scholar] [CrossRef]
  5. Wei, D.; Zhao, G.; Liu, S.; Yang, L. Indoor thermal comfort in a rural dwelling in southwest China. Front. Public Health 2022, 10, 1029390. [Google Scholar] [CrossRef]
  6. Chen, Y.; Amani-Beni, M.; Chen, C.; Liang, Y.; Li, J.; Yang, L. Projection of urban land surface temperature: An inter-and intra-annual modeling approach. Urban Clim. 2023, 51, 101637. [Google Scholar] [CrossRef]
  7. He, B.-J.; Wang, J.; Zhu, J.; Qi, J. Beating the urban heat: Situation, background, impacts and the way forward in China. Renew. Sustain. Energy Rev. 2022, 161, 112350. [Google Scholar] [CrossRef]
  8. He, B.-J.; Zhao, D.; Xiong, K.; Qi, J.; Ulpiani, G.; Pignatta, G.; Prasad, D.; Jones, P. A framework for addressing urban heat challenges and associated adaptive behavior by the public and the issue of willingness to pay for heat resilient infrastructure in Chongqing, China. Sustain. Cities Soc. 2021, 75, 103361. [Google Scholar] [CrossRef]
  9. Huang, L.; Krigsvoll, G.; Johansen, F.; Liu, Y.; Zhang, X. Carbon emission of global construction sector. Renew. Sustain. Energy Rev. 2018, 81, 1906–1916. [Google Scholar] [CrossRef]
  10. Dakwale, V.A.; Ralegaonkar, R.V. Review of carbon emission through buildings: Threats, causes and solution. Int. J. Low-Carbon Technol. 2012, 7, 143–148. [Google Scholar] [CrossRef]
  11. Wang, S.; Sun, P.; Sun, F.; Jiang, S.; Zhang, Z.; Wei, G. The direct and spillover effect of multi-dimensional urbanization on PM2. 5 concentrations: A case study from the Chengdu-Chongqing urban agglomeration in China. Int. J. Environ. Res. Public Health 2021, 18, 10609. [Google Scholar] [CrossRef]
  12. Liu, S.; Wang, Y.; Liu, X.; Yang, L.; Zhang, Y.; He, J. How does future climatic uncertainty affect multi-objective building energy retrofit decisions? Evidence from residential buildings in subtropical Hong Kong. Sustain. Cities Soc. 2023, 92, 104482. [Google Scholar] [CrossRef]
  13. Cao, M.; Kang, W.; Cao, Q.; Sajid, M.J. Estimating Chinese rural and urban residents’ carbon consumption and its drivers: Considering capital formation as a productive input. Environ. Dev. Sustain. 2020, 22, 5443–5464. [Google Scholar] [CrossRef]
  14. Zhou, Q.; Liu, Y.; Qu, S. Emission effects of China’s rural revitalization: The nexus of infrastructure investment, household income, and direct residential CO2 emissions. Renew. Sustain. Energy Rev. 2022, 167, 112829. [Google Scholar] [CrossRef]
  15. Ma, X.-W.; Wang, M.; Lan, J.-K.; Li, C.-D.; Zou, L.-L. Influencing factors and paths of direct carbon emissions from the energy consumption of rural residents in central China determined using a questionnaire survey. Adv. Clim. Chang. Res. 2022, 13, 759–767. [Google Scholar] [CrossRef]
  16. Chen, X.; Shuai, C.; Wu, Y.; Zhang, Y. Analysis on the carbon emission peaks of China’s industrial, building, transport, and agricultural sectors. Sci. Total Environ 2020, 709, 135768. [Google Scholar] [CrossRef] [PubMed]
  17. Liu, S.; Kwok, Y.; Lau, K.; Ng, E. Applicability of different extreme weather datasets for assessing indoor overheating risks of residential buildings in a subtropical high-density city. Build. Environ. 2021, 194, 107711. [Google Scholar] [CrossRef]
  18. Zong, H.; Wang, J.; Zhou, T.; Sun, J.; Chen, X. The Influence of Transient Changes in Indoor and Outdoor Thermal Comfort on the Use of Outdoor Space by Older Adults in the Nursing Home. Buildings 2022, 12, 905. [Google Scholar] [CrossRef]
  19. Liao, B.; Li, L. How can green building development promote carbon emission reduction efficiency of the construction industry?--Based on the dual perspective of industry and space. Environ. Sci. Pollut. Res. 2022, 29, 9852–9866. [Google Scholar] [CrossRef]
  20. Wang, S.; Lu, F.; Wei, G. Direct and Spillover Effects of Urban Land Expansion on Habitat Quality in Chengdu-Chongqing Urban Agglomeration. Sustainability 2022, 14, 14931. [Google Scholar] [CrossRef]
  21. Ye, L.; Cheng, Z.; Wang, Q.; Lin, H.; Lin, C.; Liu, B. Developments of Green Building Standards in China. Renew. Energy 2015, 73, 115–122. [Google Scholar] [CrossRef]
  22. Li, Y.; Yu, W.; Li, B.; Yao, R. A multidimensional model for green building assessment: A case study of a highest-rated project in Chongqing. Energy Build. 2016, 125, 231–243. [Google Scholar] [CrossRef]
  23. Li, C.H. Regional Characteristics on Green Building and the Development of Assessment System in China. Adv. Mater. Res. 2010, 113–116, 598–601. [Google Scholar] [CrossRef]
  24. Zhao, P.; Niu, Y.T.; Xie, L.N.; Wang, Z. Green Building Technology of Regional Suitability Evaluation System Research and Case Study. Appl. Mech. Mater. 2013, 357–360, 478–481. [Google Scholar] [CrossRef]
  25. Zhang, Y.; Kang, J.; Jin, H. A review of green building development in China from the perspective of energy saving. Energies 2018, 11, 334. [Google Scholar] [CrossRef]
  26. Tseng, M.-L.; Li, S.-X.; Lin, C.-W.R.; Chiu, A.S. Validating green building social sustainability indicators in China using the fuzzy delphi method. J. Ind. Prod. Eng. 2023, 40, 35–53. [Google Scholar] [CrossRef]
  27. Vaidya, O.S.; Kumar, S. Analytic hierarchy process: An overview of applications. Eur. J. Oper. Res. 2006, 169, 1–29. [Google Scholar] [CrossRef]
  28. Sun, Z.J. Apply Analytic Hierarchy Process in Green Building Evaluation. Appl. Mech. Mater. 2012, 174–177, 3352–3355. [Google Scholar] [CrossRef]
  29. Zhang, Y.; Wang, H.; Gao, W.; Wang, F.; Zhou, N.; Kammen, D.M.; Ying, X. A survey of the status and challenges of green building development in various countries. Sustainability 2019, 11, 5385. [Google Scholar] [CrossRef]
  30. GB/T 50378-2019; Assessment Standard for Green Building. China Architecture & Building Press: Beijing, China, 2019.
  31. Yang, S.; Liu, J.; Wang, M. Study on influencing factors of carbon emission of civil buildings based on regional differences. IOP Conf. Ser. Earth Environ. Sci. 2021, 647, 012194. [Google Scholar]
  32. CECS 374:2014; Standard for Measuring, Accounting and Reporting of Carbon Emission from Buildings. China Planning Press: Beijing, China, 2014.
  33. Ocampo, L.; Ebisa, J.A.; Ombe, J.; Escoto, M.G. Sustainable ecotourism indicators with fuzzy Delphi method—A Philippine perspective. Ecol. Indic. 2018, 93, 874–888. [Google Scholar] [CrossRef]
  34. GB/T 51366-2019; Standard for Building Carbon Emission Calculation. China Architecture & Building Press: Beijing, China, 2019.
  35. Zhou, Y.; Yu, Y.; Wang, Y.; He, B.; Yang, L. Mode substitution and carbon emission impacts of electric bike sharing systems. Sustain. Cities Soc. 2023, 89, 104312. [Google Scholar] [CrossRef]
Figure 1. (a) Location of Guizhou Province in China. (b) The geographical location of Qiandongnan Prefecture. (c) The main distribution areas of Dong traditional dwellings in Qiandongnan. (dh) The current situation of Dong traditional dwellings in Qiandongnan.
Sustainability 15 13468 g001
Figure 2. The technical framework of this study.
Sustainability 15 13468 g002
Figure 3. Schematic diagram of a double triangular fuzzy number.
Sustainability 15 13468 g003
Table 1. Experimental equipment information.
ParametersUnitInstrument ModelInstrument ParametersParameter ValueFunctionTime
Temperature°CJT2011 Black Ball ThermometerTemperature range0~50 °C (32~122 °F)Air temperature1 h
Accuracy±0.8 °C
Black ball sizeDiameter 75 mmWet bulb temperature
AT-380 infrared thermometerTemperature range−50~380 °CGround temperature1 h
Precision±2%Wall temperature
JTR08 Temperature and Humidity MeterPrecision±0.3 °C
±1.5%
Indoor and outdoor air temperature1 h
Humidity%JT2011 Black Ball ThermometerMeasurement Range0~100% RHAir relative humidity1 h
Accuracy±3%
Table 2. Importance differentiation scale.
Scale ValueDefinition
1Same importance
3The former is slightly more important than the latter
5The former is clearly important compared to the latter
7The former is strongly important compared to the latter
9The former is absolutely important compared to the latter
2, 4, 6, 8denotes the middle value of the above two adjacent scales
Table 3. Ambient (alleyway) air temperature and wet and black bulb temperature data in the region.
SeasonSiteTa (°C)Tg (°C)RH (%)
MeanMaxMinMeanMaxMinMeanMaxMin
WinterGaozeng Village, Gaozeng Township6.99.93.97.010.63.374.580.266.7
Zhaoxing Village, Zhaoxing Town6.37.35.26.77.95.575.483.966.9
Biapa Village, Gaozeng TownshipLane 14.45.83.04.85.54.183.387.678.9
Lane 24.15.62.6
Xiage Village, Zhaoxing Town3.24.51.93.84.92.684.089.978.1
Tangan Village, Zhaoxing Town3.86.21.44.46.91.877.887.268.4
SummerGaozeng Village, Gaozeng Township35.544.526.438.648.928.357.872.343.3
Zhaoxing Village, Zhaoxing Town32.436.728.132.737.927.571.182.160.1
Biapa Village, Gaozeng TownshipLane 130.533.927.131.736.327.170.183.556.7
Lane 232.834.927.7
Xiage Village, Zhaoxing Town29.934.825.030.735.126.267.080.353.6
Tangan Village, Zhaoxing Town29.233.524.829.734.325.173.082.363.7
Table 4. The monthly mean value, maximum value, and minimum value of temperature and humidity of residential buildings.
SeasonSiteMonthTa (°C)RH (%)
MeanMaxMinMeanMaxMin
WinterGaozeng Village, Gaozeng Township129.916.95.57610018
18.411.56.58410038
Zhaoxing Village, Zhaoxing Town121015.36.98110027
18.210.76.69010045
Biapa Village, Gaozeng Township128.714.94.87710021
16.59.14.98910036
Xiage Village, Zhaoxing Town127.713.93.38110023
168.44.49110041
Tangan Village, Zhaoxing Town129.114.45.78310025
17.610.15.99010041
SummerGaozeng Village, Gaozeng Township728.736.1247710035
828.736.423.87710030
Zhaoxing Village, Zhaoxing Town728.535.723.87710028
828.335.1247710039
Biapa Village, Gaozeng Township728.53523.67610033
828.535.623.37310035
Xiage Village, Zhaoxing Town72732.922.88110039
826.934227910037
Tangan Village, Zhaoxing Town727.134.422.98310041
826.833.822.68310038
Table 5. Indoor air temperature and humidity and related humidity data of traditional residential houses.
SeasonSiteSpaceTa (°C)Tg (°C)RH (%)
MeanMaxMinMeanMaxMinMeanMaxMin
WinterGaozeng Village, Gaozeng TownshipHall7.510.44.57.910.94.871.880.463.1
Zhaoxing Village, Zhaoxing TownHall6.87.66.07.38.16.577.485.968.9
Biapa Village, Gaozeng TownshipHall4.96.03.85.16.24.084.390.877.8
Xiage Village, Zhaoxing TownHall4.76.82.54.66.82.484.690.878.3
Tangan Village, Zhaoxing TownHall5.07.22.85.67.93.277.787.068.4
Gaozeng Village, Gaozeng TownshipBedroom8.711.65.79.112.25.973.582.764.2
Zhao Xing Village, Zhaoxing TownBedroom6.87.85.87.07.86.175.585.265.7
Biapa Village, Gaozeng TownshipBedroom5.16.23.95.16.33.985.387.283.4
Xiage Village, Zhaoxing TownBedroom4.05.62.34.45.83.085.589.981.1
Tangan Village, Zhaoxing TownBedroom5.37.33.25.57.63.483.488.977.8
SummerGaozeng Village, Gaozeng TownshipHall30.535.525.531.836.627.067.376.757.8
Zhao Xing Village, Zhaoxing TownHall30.834.327.331.234.727.774.984.365.4
Biapa Village, Gaozeng TownshipHall29.934.625.130.134.325.872.285.259.2
Xiage Village, Zhaoxing TownHall30.434.526.330.734.526.873.481.465.3
Tangan Village, Zhaoxing TownHall29.032.925.029.232.725.672.882.463.2
Gaozeng Village, Gaozeng TownshipBedroom30.134.126.131.035.726.367.077.856.1
Zhao Xing Village, Zhaoxing TownBedroom30.133.227.031.935.927.973.385.461.2
Biapa Village, Gaozeng TownshipBedroom30.034.026.030.234.326.170.381.359.3
XiageVillage, Zhaoxing TownBedroom30.034.525.430.334.9.625.671.080.461.5
Tangan Village, Zhaoxing TownBedroom28.732.325.129.133.125.073.782.365.0
Table 6. Preliminary whole life-cycle carbon emission model index system for traditional residential buildings.
Target LayerTier 1 IndicatorsSecondary IndicatorsTertiary Indicators
Life-cycle carbon emission model of traditional Dong houses in QiandongnanResource
Conservation
Land saving and land useVillage building site selection
Site safety performance
Energy saving and energy useBuilding orientation
Building window and door opening ratio
Village street building D/H
Internal air circulation of residential houses
Livable
Environment
Site ecology and landscapeUse of plants in the physical environment of buildings
Outdoor physical
environment
Outdoor ventilation conditions
Regional heat island intensity
Ethnic CultureEthnic architectural featuresBuilding form design
Building interior space design
Building layout design
Ethnic beliefsArchitectural decoration
Ecological
Quality
Whole life-cycle carbon emissions of buildingsBuilding materials production and transportation
Construction
Operation and maintenance
Dismantling and disposal
Table 7. Index weights of the whole life-cycle carbon emission model of traditional houses.
Target LayerTier 1 IndicatorsSecondary IndicatorsTertiary Indicators
Life-cycle carbon emission model of traditional Dong houses in QiandongnanResource
Conservation
Land saving and land useVillage building site selection
Site safety performance
Energy saving and energy useBuilding orientation
Building window and door opening ratio
Village street building D/H
Internal air circulation of residential houses
Livable
Environment
Site ecology and landscapeUse of plants in the physical environment of buildings
Outdoor physical
environment
Outdoor ventilation conditions
Ethnic CultureEthnic architectural featuresBuilding form design
Building interior space design
Ethnic beliefsArchitectural decoration
Ecological
Quality
Whole life-cycle carbon emissions of buildingsBuilding materials production and transportation
Construction
Operation and maintenance
Dismantling and disposal
Table 8. Weighting score of whole life-cycle carbon emission evaluation index of traditional houses.
Target LayerTier 1
Indicators
Secondary IndicatorsTertiary IndicatorsWeight
Life-cycle carbon emission model of traditional Dong houses in QiandongnanResource
Conservation
Land saving and land useVillage building site selection0.0308
Site safety performance0.0521
Energy saving and energy useBuilding orientation0.0521
Building window and door opening ratio0.0363
Village street building D/H0.0289
Internal air circulation of residential houses0.0182
Livable
Environment
Site ecology and landscapeUse of plants in the physical environment of buildings0.0769
Outdoor physical environmentOutdoor ventilation conditions0.1312
Ethnic
Culture
Ethnic architectural featuresBuilding form design0.0311
Building interior space design0.0272
Ethnic beliefsArchitectural decoration0.0119
Ecological
Quality
Whole life-cycle carbon emissions of buildingsBuilding materials production and transportation0.2489
Construction0.0450
Operation and maintenance0.1605
Dismantling and disposal0.0665
Table 9. A life-cycle carbon emissions evaluation model for traditional residential houses.
Target LayerTier 1 IndicatorsSecondary IndicatorsEvaluation Score Decomposition (Good, Bettter, Average, Poor and Bad)Tertiary IndicatorsAppraisal InterpretationScore (1, 2, 3, 4, 5)
Life-cycle carbon emission model of traditional Dong houses in QiandongnanResource
Conservation
Land saving and land use Village building site selectionThe building site should have topographic availability; the location of the building should have a certain connection with the surrounding road traffic; the location of the site building should be kept at a certain distance from the larger shelter.
Site safety performanceGood measures should be taken against natural disasters caused by various factors such as natural environment in the building site; fire prevention measures should be taken on the site.
Energy saving and energy use Building orientationThe orientation of residential buildings should be consistent with the local sunshine orientation;
the opening direction of the door of the village building should be kept at a certain angle with the prevailing local wind direction throughout the year.
Building window and door opening ratioThe indoor space (except the traffic space) should ensure that at least one wall has an external window, and the window should be combined with the roof and chimney to improve indoor ventilation; the window area ratio of the wall should meet the local requirements in the range of 25–40%; window glass shading coefficient SC should be selected with a smaller coefficient material.
Village street building D/HThe width of streets and alleys should meet the requirements of normal residential buildings. Streets and residential buildings need to ensure certain aesthetics in the aspect ratio D/H. By using the D/H ratio, the pressure of the passing wind direction is formed. Main streets should be oriented towards the prevailing wind direction throughout the year
Internal air circulation of residential housesThe internal partition of the residential building should not affect the opening direction and position of the door with draft circulation conditions. Ventilation corridors in residential buildings should not be blocked by other objects. Under certain circumstances, holes should be strengthened in the partition wall so that the two rooms before and after are shaped into drafts.
Livable
Environment
Site ecology and landscape Use of plants in the physical environment of buildingsIndoor plant construction should be built; the plants around the outdoor buildings form air ducts to increase the mobility of indoor air; the plants built around the building should not affect the lighting of the building, and dense evergreen trees or shrubs should be planted in the direction of the prevailing winter monsoon to shield the cold wind through greening. Two rows of wind-guiding trees should be built in the direction of the summer monsoon to guide the wind into the house. The external environment (within 10 M), including the greening rate of the interior of the building, should not be less than 18%.
Outdoor physical environment Outdoor ventilation conditionsThe building site should be selected in a place conducive to ventilation; the layout of the building group, windward orientation, and water surface layout should form good ventilation. The advantage of the local valley wind should be used and good natural ventilation thought of.
Ethnic
Culture
Ethnic architectural features Building form designThe original Dong architectural appearance to retain the characteristics of Baiyue ethnic “ganlan” architecture or improve the original architectural form should be countinued, the airflow at the bottom of the house strengthend, and the ventilation effect enhanced. The appearance of the enclosure structure should be of local cultural or historical or national character.
Building interior space designThe Dong people’s original architectural space culture should be respected; reasonable layout of functional space.
Ethnic beliefs Architectural decorationSimple architectural color to maintain the original characteristics of wood, the roof in use of cold stall tile (small green tile), and the focus of decoration is still in the capital.
Ecological
Quality
Whole life-cycle carbon emissions of buildings Building materials production and transportation
Construction
Operation and maintenance
Dismantling and disposal
Disclaimer/Publisher’s Note: The statements, opinions and data contained in all publications are solely those of the individual author(s) and contributor(s) and not of MDPI and/or the editor(s). MDPI and/or the editor(s) disclaim responsibility for any injury to people or property resulting from any ideas, methods, instructions or products referred to in the content.

