Article

Analysis of Debonding Failures of the Screen and Case during Tablet Drop

Department of Mechanical Engineering, Xinjiang University, Urumqi 830017, China
*
Author to whom correspondence should be addressed.
Sustainability 2023, 15(18), 13475; https://doi.org/10.3390/su151813475
Submission received: 3 August 2023 / Revised: 30 August 2023 / Accepted: 6 September 2023 / Published: 8 September 2023

Abstract

:
In recent years, due to the increasingly powerful functions of tablets, more and more people have used tablets. The failure of the screen caused by debonding failure between the screen and the case of the tablet due to drops will affect the normal use of the tablet. However, there have been few studies on the debonding methods of the screen and the case of the tablet, as well as the factors influencing the debonding between the screen and the case of the tablet. Numerical analysis software was used in this paper to simulate the iPad Air (Air) drop process, and the cohesive zone model and tiebreak contact were used to simulate the debonding process between the screen and case of the Air tablet, respectively. When the results are compared to the experiments, the results show that the cohesive zone model is superior. The effects of various rounded corner radii, drop postures in the XY plane, materials of the outer case, and strain rates of PC/ABS on the localized debonding between the outer case and outer glass of the Air during the drop process were investigated. The degree of debonding between the Air model’s outer case and outer glass is defined by t, which is the ratio of the area of the deleted cohesive elements to the total area of the cohesive elements. The results show that the rounded corner radius and the strain rate of PC/ABS have less influence on t; the t of the Air model dropped at 45° in the XY plane is 37.7% of that dropped at 0° and 90°; and the t of the Air model with glass as the outer case material is 48% of that with aluminum alloy as the outer case material. These studies serve as a foundation for tablet design and material selection.

1. Introduction

With the rapid development of science and technology, more and more people are using tablets and mobile phones for study, entertainment, and work due to the multiple functions, large screens, and light weight of tablets and mobile phones. Damage to mobile phones and tablets due to drops can be seen everywhere. The most important types of damage to tablets and mobile phones are mechanical and functional damages caused by drop impacts, such as screen failure, case deformation, chip desoldering, and cracking [1,2,3,4]. Screen failure because of a drop is consistently the highest-frequency failure of handheld devices [5]. The screen is one of the most important components of a tablet, and as the screen size of the tablet increases, so does the likelihood of screen failure. Screen failures include screen breakage and screen-to-case debonding. The aesthetics and usability of the tablet will suffer if the screen fails, and repairing the screen can be expensive. The repair of screens and the production of tablets pollute the environment and waste materials. It is very important to investigate the debonding failure between the screen and the case of the tablet during the drop process to reduce environmental pollution and material waste, as well as to promote sustainable development.
Mobile phones and tablets have complex structures and many parts, and the forces between the screen and case of mobile phones and tablets during the drop process are also complex. Akano TT et al. [6] investigated the impact properties of laminated mobile phone cases. Impact tests were performed on laminated mobile phone cases with single, double, triple, and quadruple layers under a drop of 0.5 m~2.5 m and a step of 0.5 m. The number of laminations is inversely proportional to the maximum stress, strain energy, and displacement of the mobile phone screen caused by the impact load. The phone model is overly simplified, and the forces exerted on the screen and case by the phone’s internal components cannot be calculated. Hagara et al. [7] investigated smartphone drop tests using high-speed digital image correlation methods to address this issue. The phone was dropped from a height of one meter in five different postures under laboratory conditions. When the smartphone was dropped on the upper edge, the Von Mises stress in the touch screen region was approximately 138 MPa. The experiment only uses three Von Mises stress points, and determining the stress and damage-prone areas of the entire mobile phone screen is difficult. Cao et al. [8] used ABAQUS/CAE to perform a free-fall simulation analysis on a full-screen smartphone to analyze the force on the mobile phone’s screen. The phone was freely dropped from a height of one meter to the ground in seven different positions. When the smartphone was dropped in the upper and lower right corners, the maximum Von Mises stress on the screen was greater, but the force between the screen and the case could not be determined. Kevin et al. [9] studied the local debonding failure between the screen and case of the tablet through experiments combined with simulation, used the finite element method to model the adhesive layer between the screen and case, used the deletion of the adhesive layer elements to simulate the debonding between the screen and case, and designed a protective casing using the concept of protection. However, removing the elements causes energy loss. Therefore, it is necessary to find a good method to simulate the debonding between the screen and the case of the tablet during the drop process.
The debonding between the screen and the case of the tablet can link to the delamination failure of the composite material. To simulate adhesion and delamination failure in composites, the cohesive zone model and *CONTACT_AUTOMATIC_ONE_WAY_SURFACE_TO_SURFACE_TIEBREAK (tiebreak contact) can both be used [10,11,12,13,14,15]. Mukherjee et al. [16] used the cohesive zone model to analyze the phenomenon of wave-like debonding when a confined/sandwiched elastomeric layer is pulled off from a stiff adherend; Guo et al. [17] used a coupled mixed-mode cohesive zone model to analyze the effect of thermal stress on the debonding failure of FRP-strengthened steel beams; Ye et al. [18] used a cohesive zone model to predict the tensile failure behavior of adhesive-bonded composite single-lap joints. Cohesive zone models are usually utilized for intra-layer damage due to the difficulties of placing cohesive elements between two contacting parts and the mesh size limitations of cohesive elements. The tiebreak contact differs from the cohesive zone model in that the surface-based cohesive behavior is a contact property rather than a material property. The tiebreak contact does not involve using finite elements but exploits the nodes between the upper and lower sublayer elements to mimic interlayer bonding. Sy et al. [19] used tiebreak contact to simulate the delamination failure of flax-based laminates at low-velocity impact; Wang et al. [20] used tiebreak contact to simulate the delamination failure of laminated aluminum composite structures during three-point bending simulation; McGregor et al. [21] used tiebreak contact to simulate delamination failure in an axial crush simulation of braided composite tubes. Based on the above cohesive zone model and tiebreak contact in composites, this paper will use the cohesive zone model and tiebreak contact to simulate the localized debonding process between the screen and case of the tablet during the drop process and then choose a preferred method for the subsequent study.
Many numerical analysis software programs successfully incorporate cohesive zone models and tiebreak contacts. In this paper, we will introduce the basic principles of the cohesive zone model and tiebreak contact, use the tiebreak contact and cohesive zone model to simulate the local debonding between the outer case and outer glass of the Air, compare the experimental results to confirm the validity of the Air model and simulation method, consider computational accuracy and efficiency, and ultimately choose the cohesive zone model to simulate the debonding between the outer case and outer glass of the Air. In order to serve current protective research and practical application of tablets, the cohesive zone model is used for the subsequent study of the effects of different rounded corner radii, drop postures in the XY plane, materials of the outer case, and strain rates of PC/ABS on the debonding failure between the outer glass and outer case during the drop process of the Air.

2. Theory and Methodology

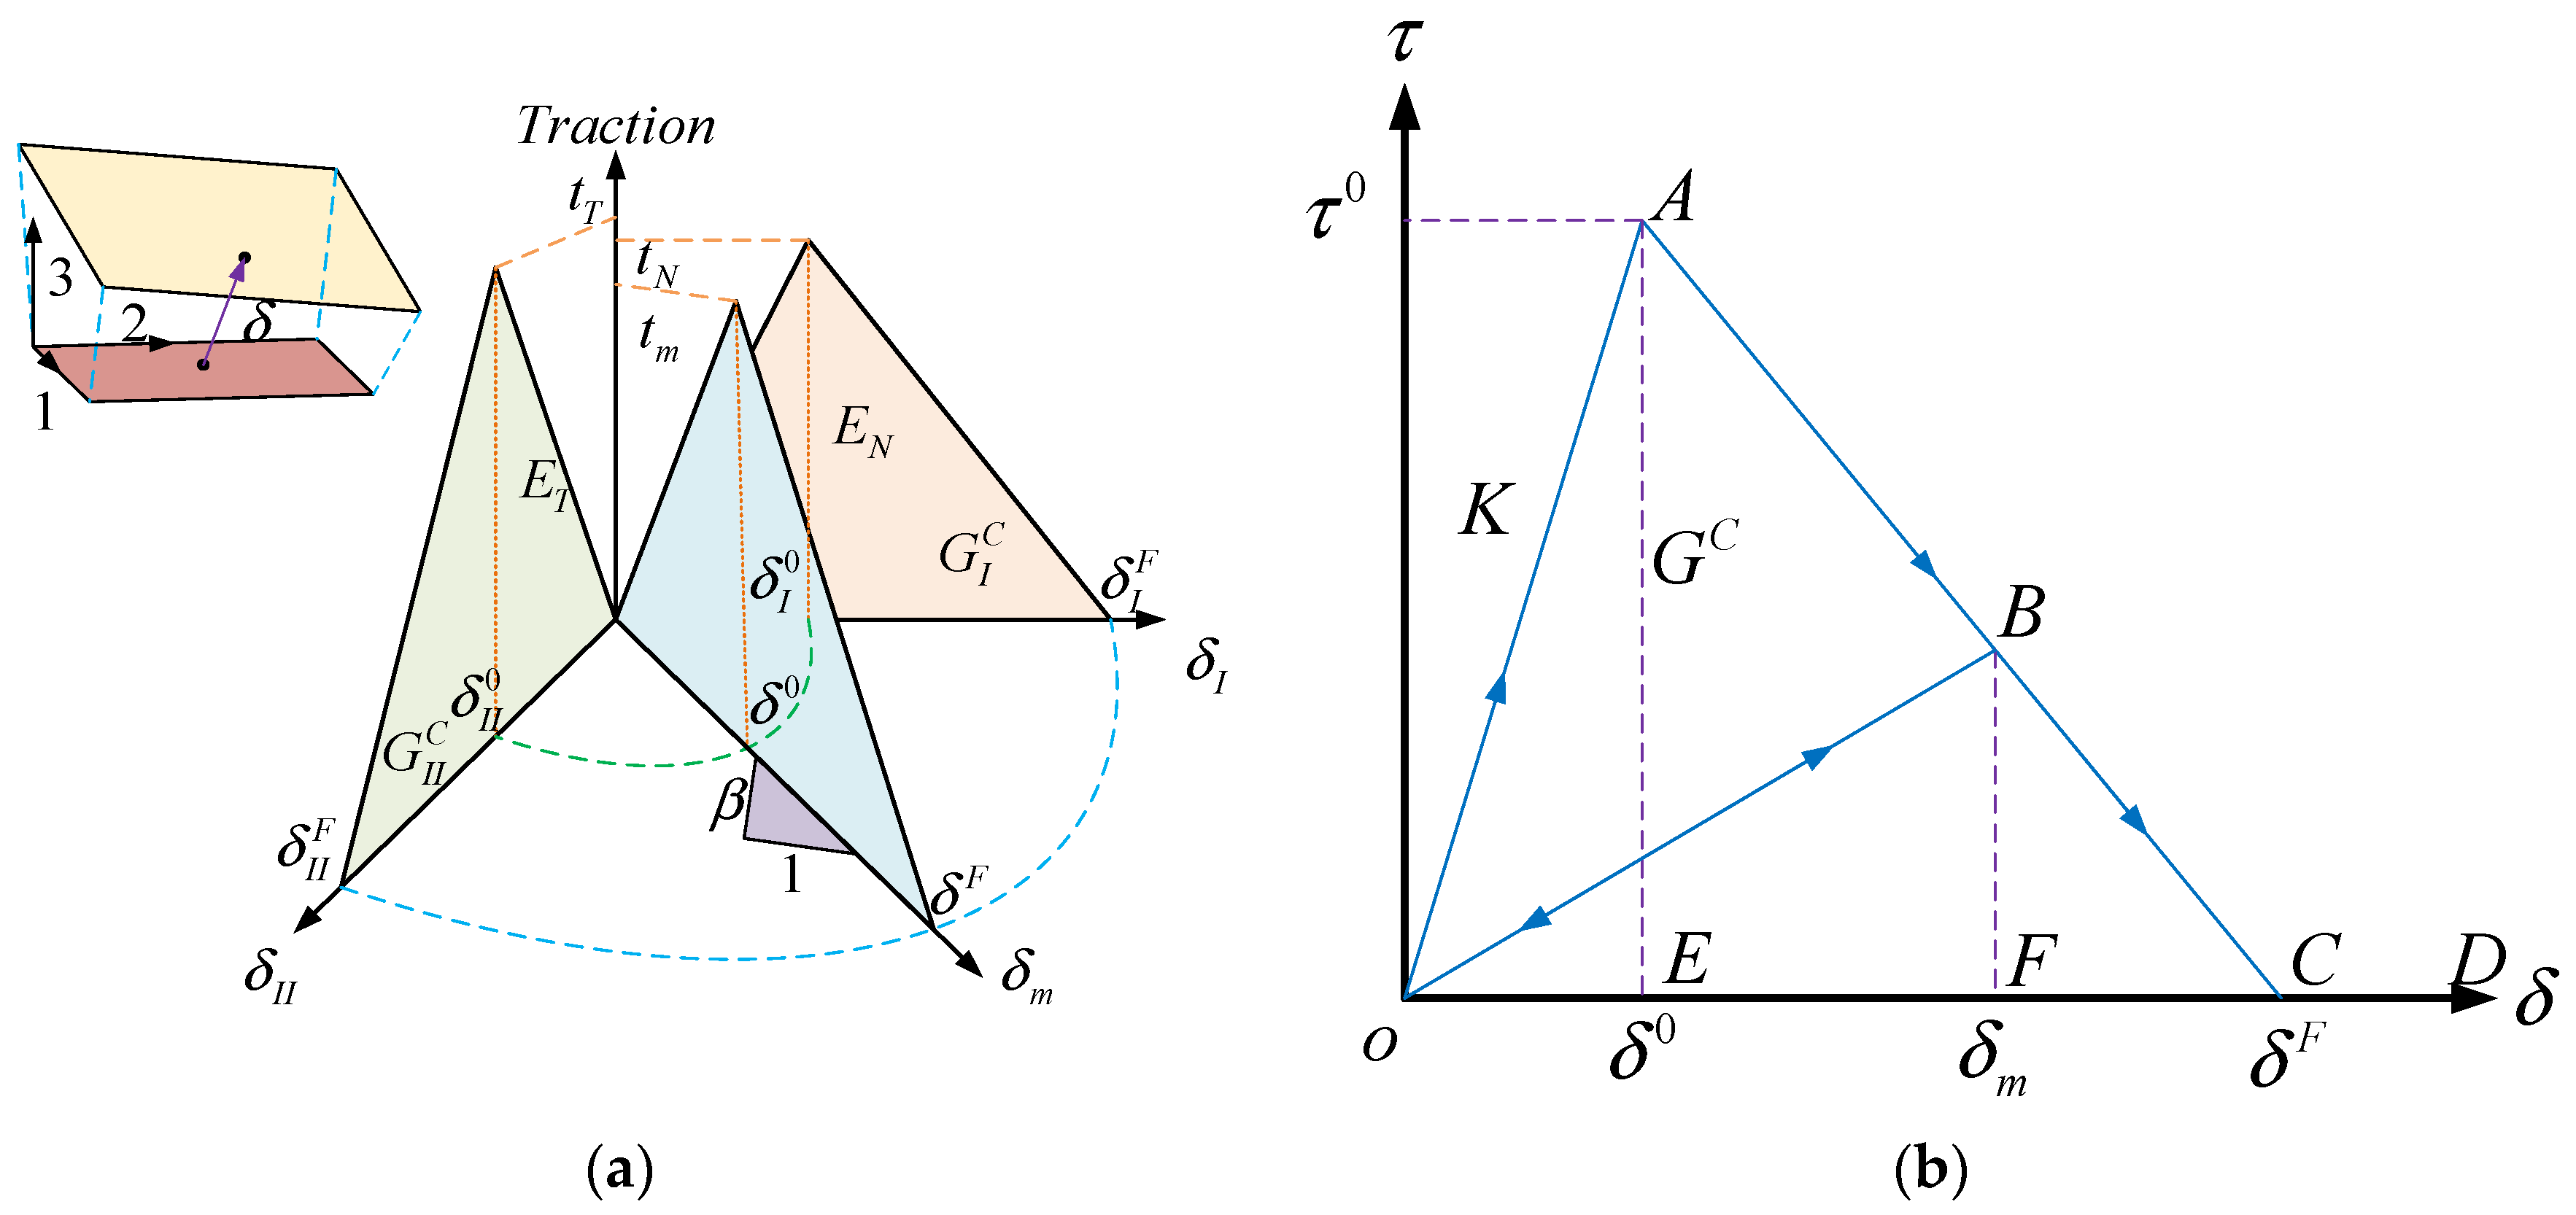
2.1. Cohesive Zone Model

Barenblatt and Dugale initially proposed the cohesive zone model based on damage mechanics [22,23]. The cohesive zone model is essentially an atomic or molecular interaction force [24]. The cohesive zone model, when compared to elastic fracture mechanics, avoids the problem of stress singularity at the crack tip and is also consistent with the law of force interaction between material substances.
In this paper, an 8-node, zero-thickness cohesive element is used to simulate the debonding failure between the outer glass and outer case during the drop process of the Air. It should be noted that the order of the nodes of the cohesive element is critical, as it affects computation time and storage space. The commonly used cohesive zone models are bilinear, trapezoidal, exponential, and parabolic, depending on the traction–separation law [15]. The bilinear cohesive zone model is depicted in Figure 1b, which is divided into three stages based on the material failure process: the elastic deformation stage (OA), the damage evolution stage (AC), and the complete failure stage (CD). The surface tension of the cohesive element increases linearly with the total relative displacement δ m during the elastic deformation process. At this stage, the cohesive element exhibits the linear elastic property with the slope of the penalty stiffness K, which characterizes the degree of “softness” and can prevent surface separation. That is to say, the penalty function approximation ensures displacement compatibility between the elements during the elastic phase [25]. When δ m reaches the damage initiation displacement δ 0 , the material enters the damage evolution phase and appears damaged. When δ m reaches the complete failure displacement δ F , the material is completely damaged, and the cohesive element is completely removed.
In this paper, the *MAT 138 COHESIVE_MIXED_MODE material model is used to describe the mechanical behavior of the cohesive elements, as shown in Figure 1a. The normal and tangential complete failure displacements are δ I F and δ I I F , δ I 0 and δ I I 0 are the displacements corresponding to the peak traction forces t N and t T ; E N is the stiffness normal to the plane of the cohesive element; and E T is the stiffness in the plane of the cohesive element.
(1) For the mixed-mode loading conditions, the total mixed-mode relative displacement δ m is calculated as follows:
δ m = δ I 2 + δ I I 2
where δ I = δ 3 is the normal separation of mode I and δ I I = δ 1 2 + δ 2 2 is the tangential separation of mode II.
(2) The mathematical equation for the initial damage separation δ 0 of the mixed mode is as follows:
δ 0 = δ I 0 δ I I 0 1 + β 2 ( δ I I 0 ) 2 + ( β δ I 0 ) 2
where δ I 0 = t N / E N and δ I I 0 = t T / E T ; β = δ I I / δ I denotes the mixing degree.
(3) In this paper, the commonly used BENZEGGAGH-KENANE (BK) criterion in the mixed model is used as the entity cohesive element failure criterion [26]; the mathematical equation of the complete failure displacement δ F is as follows:
δ F = 2 δ 0 ( 1 1 + β 2 E N γ + β 2 1 + β 2 E T γ ) 1 / γ [ G I C + ( G I I C G I C ) ( β 2 × E T E N + β 2 × E T ) | X U M | ]
where γ is a reasonable choice based on GAMMA, an additional index to the BK criterion, GAMMA = 1 (default), or GAMMA = 2; XMU is the mixed-mode criterion index, G I C = 1 2 × t N × δ I F ; G I I C = 1 2 × t T × δ I I F .

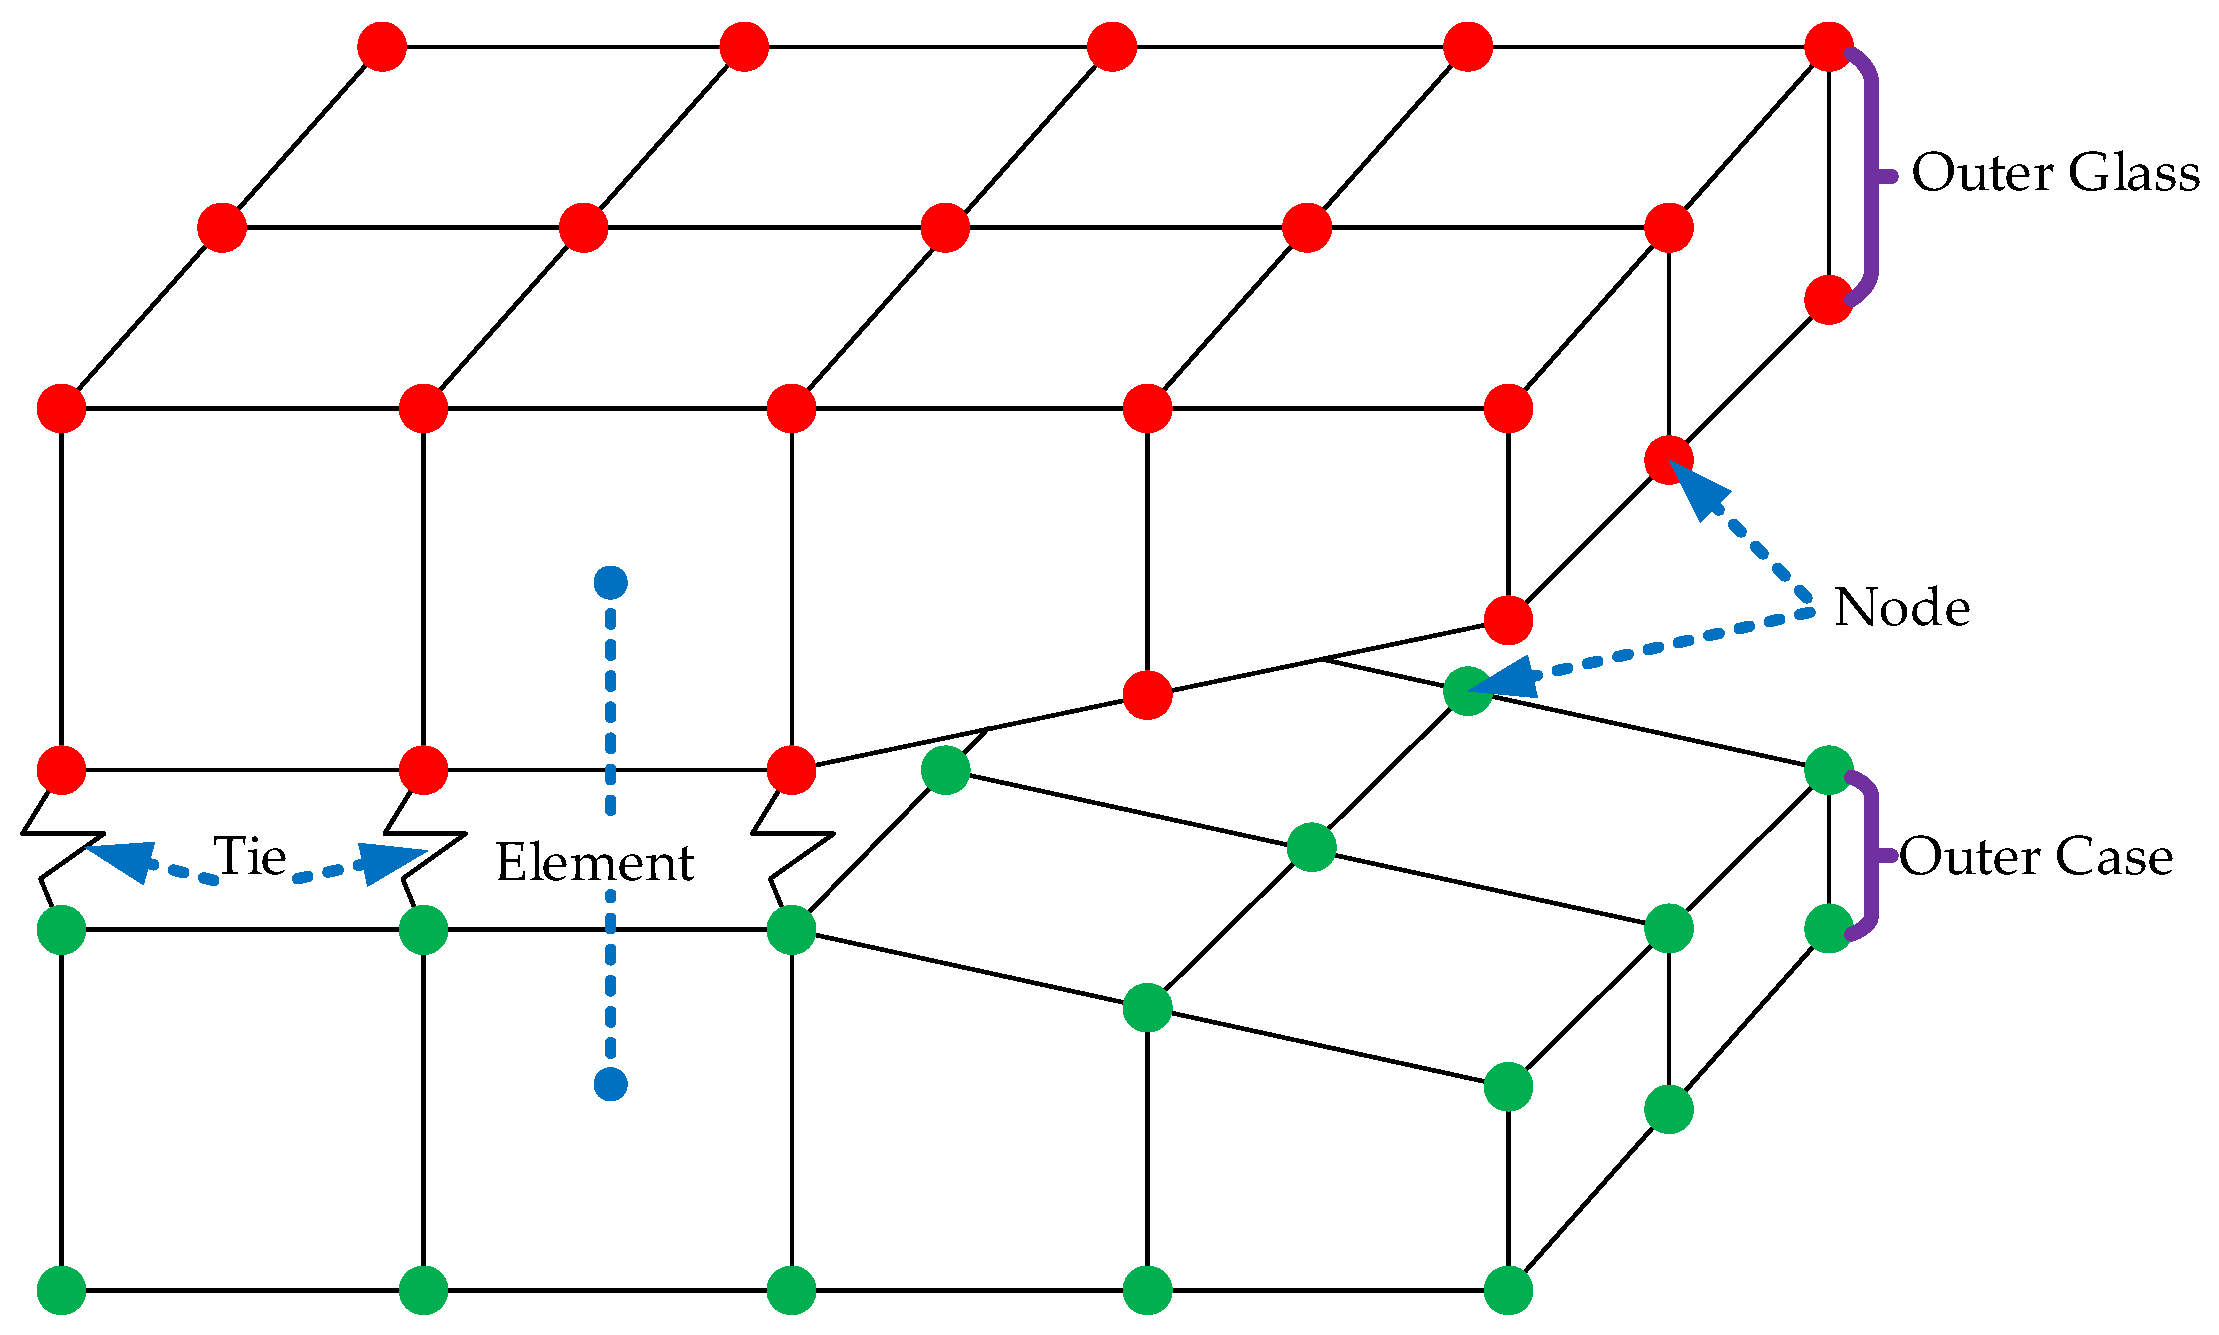
2.2. Tiebreak Contact

Glued surfaces use tiebreak contact to transfer compression and tension until the bond fails [27], as shown in Figure 2. Tiebreak contact is the contact with a failure criterion that transfers compression and tension. When the tiebreak contact fails, it behaves as a face-to-face contact with thickness offset. Tiebreak contact OPTION = 9 is based on the fracture model in the cohesive material model *MAT_COHESIVE_MIXED_MODE [28]. Section 2.1 describes the cohesive zone model’s principle.

3. Debonding Failure Simulations

In this section, we simulate the local debonding behavior between the outer glass and outer case during the drop process of the Air using the cohesive zone model and tiebreak contact, respectively, and then validate the simulation results by comparing the simulation results to published experimental results to choose a better method to simulate the debonding behavior between the outer glass and outer case of the Air.

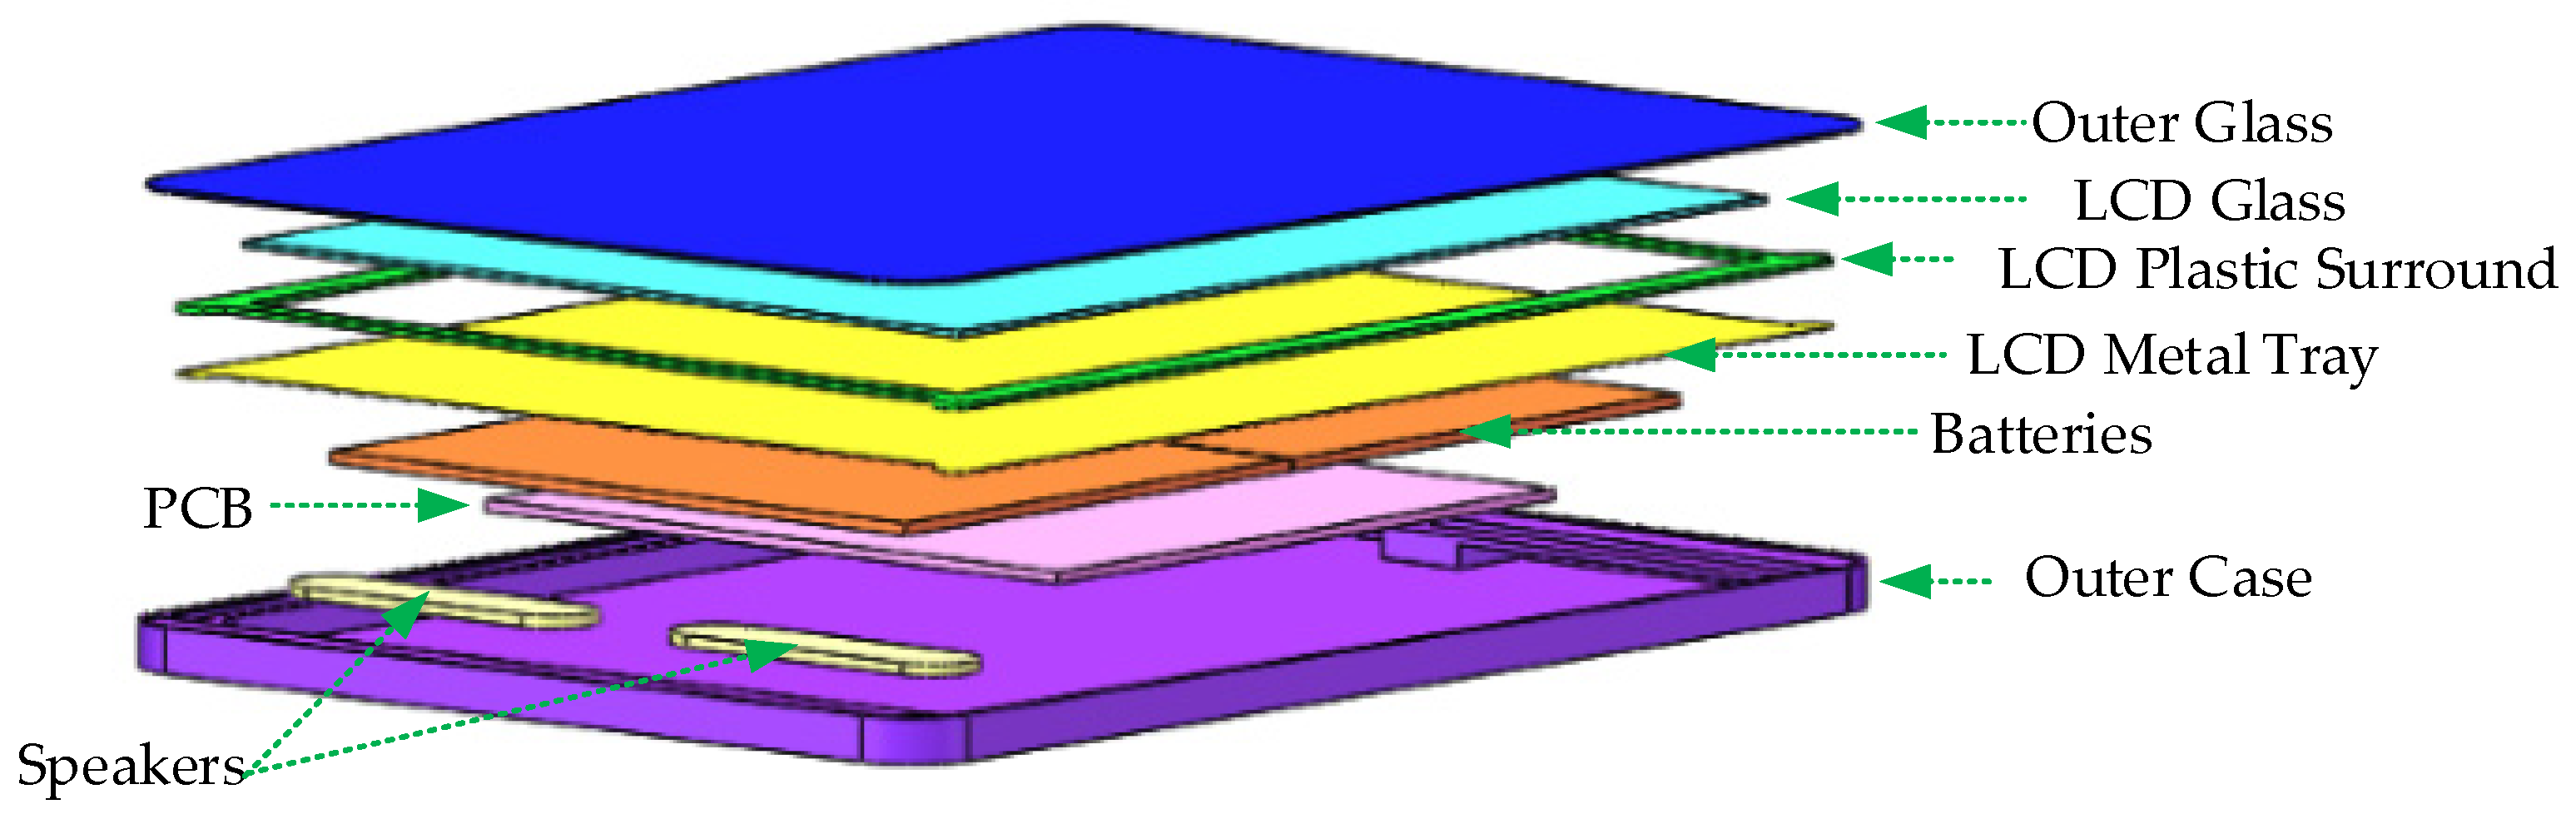
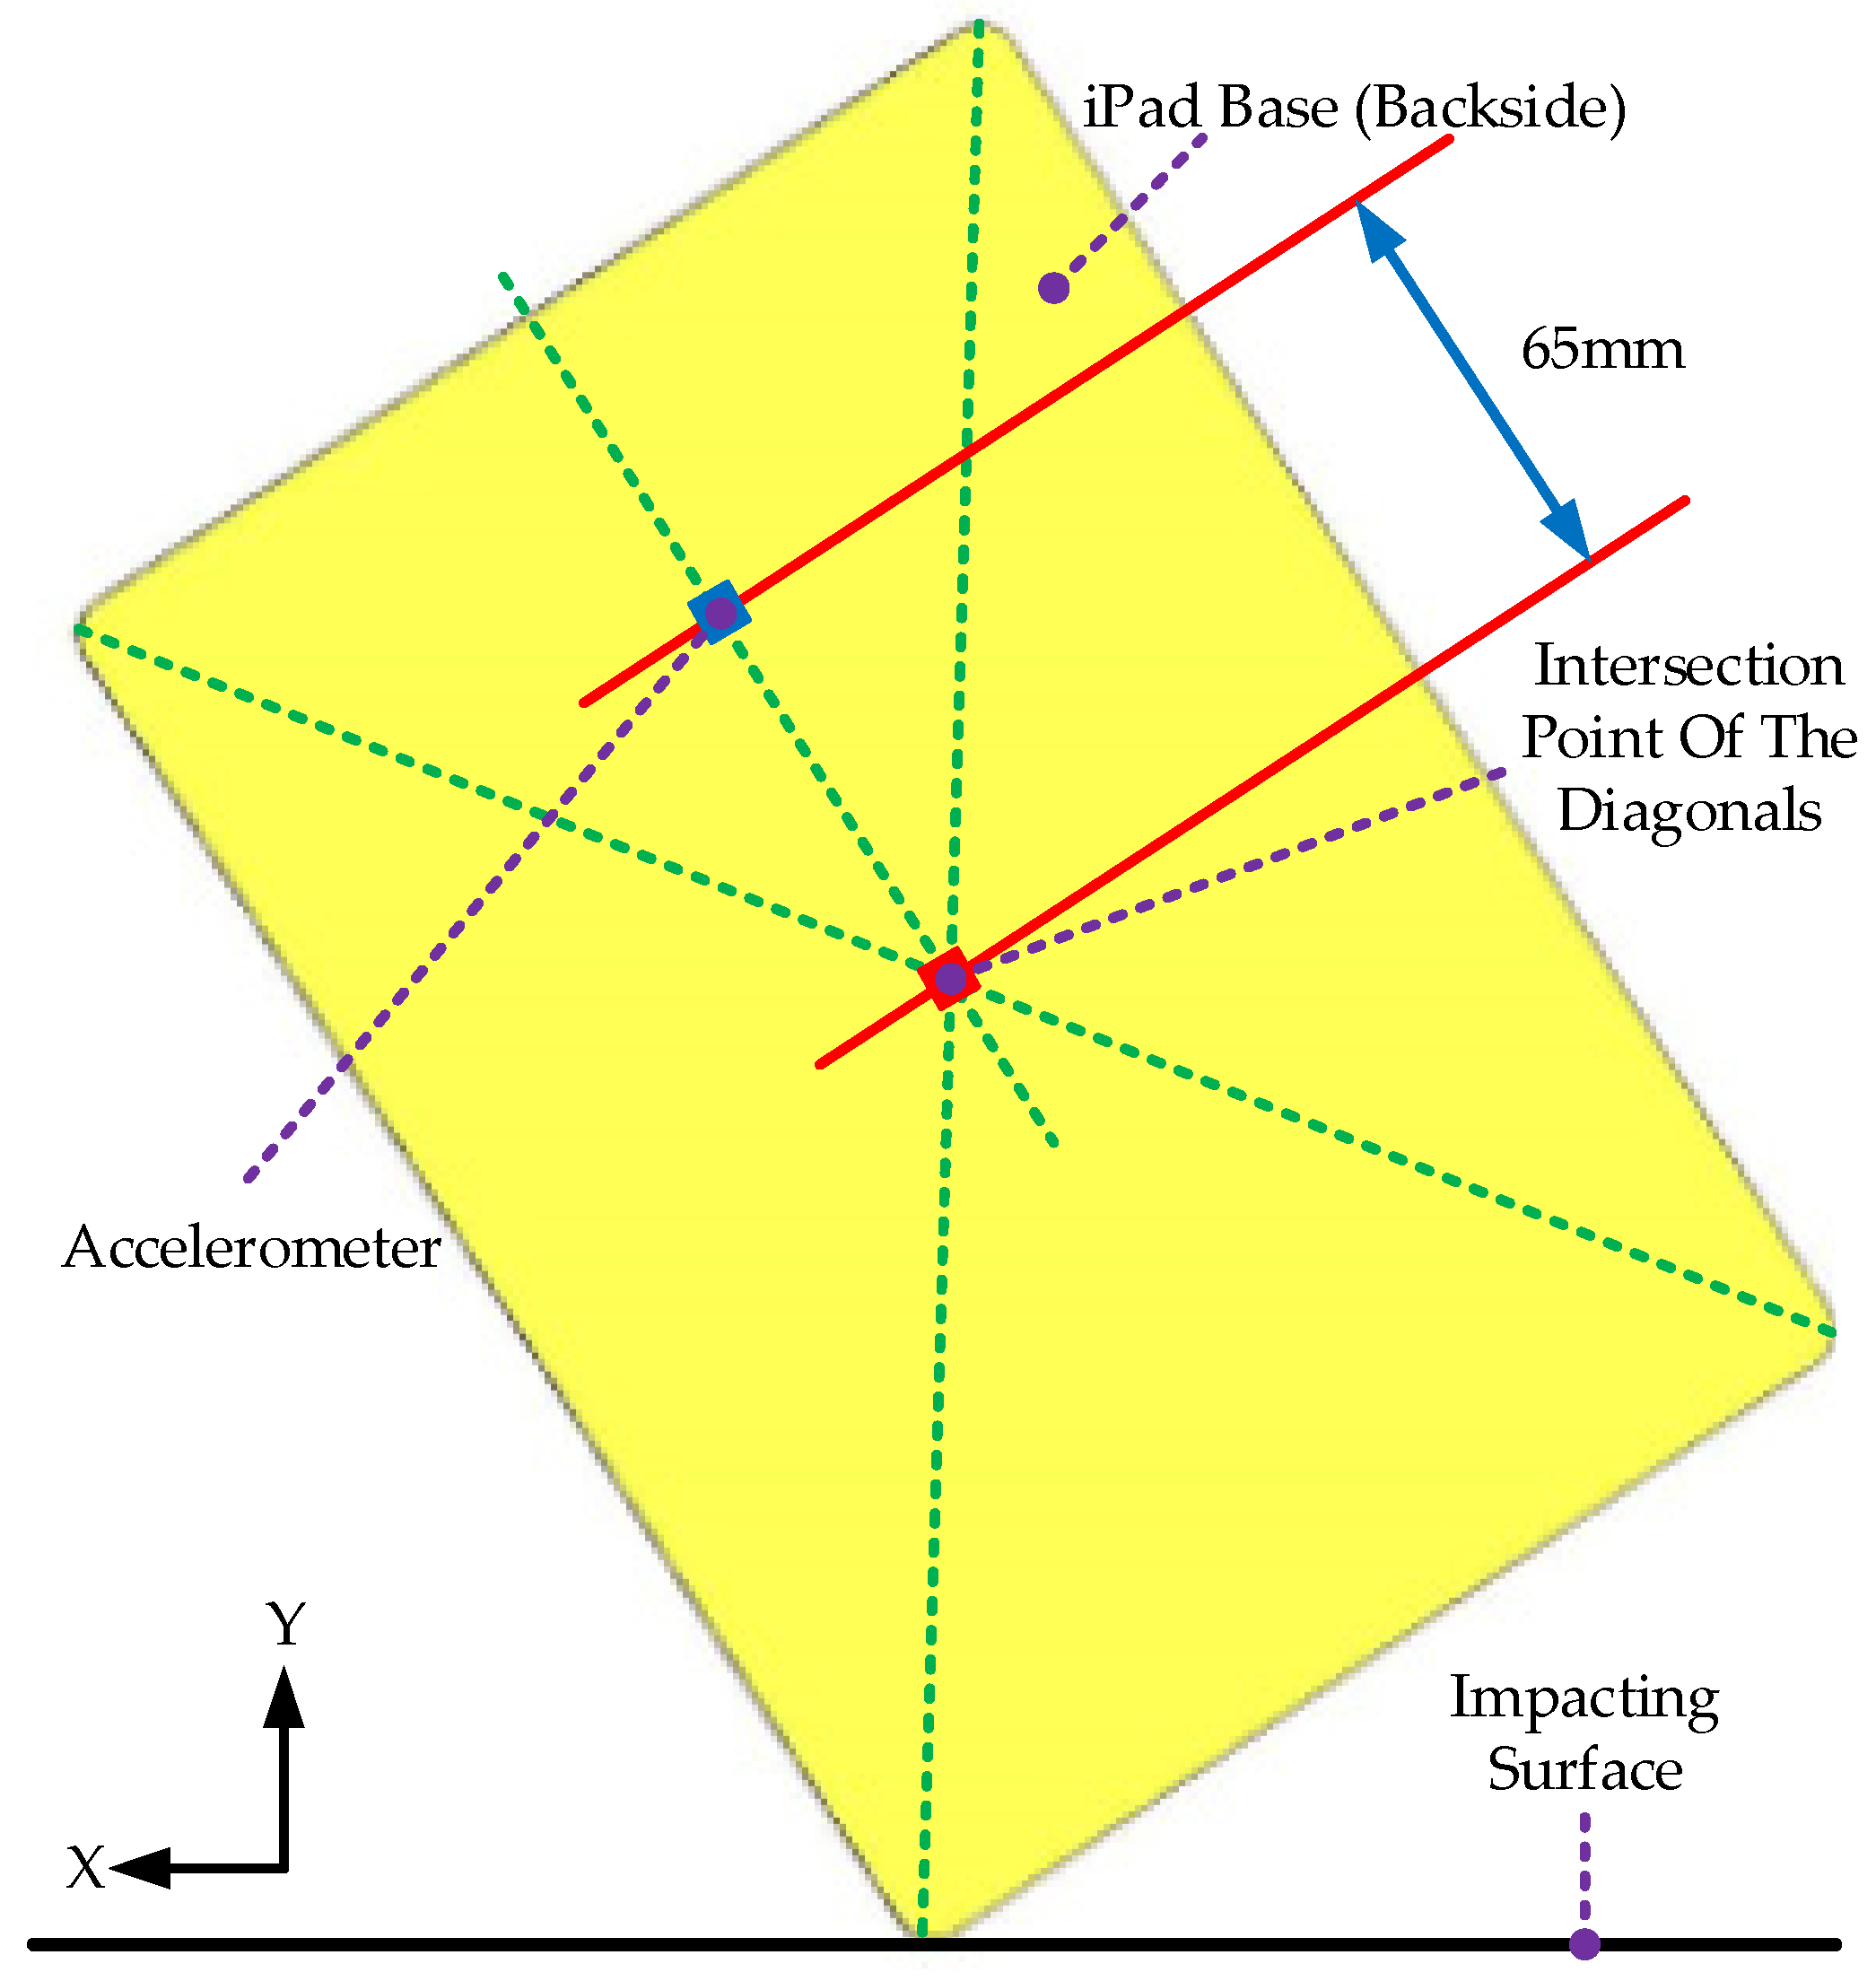
3.1. Finite Element Model

The exterior dimensions of the Air are 240 mm × 169.5 mm × 7.5 mm (length × width × height) because some small part features must be divided into a relatively tiny mesh, resulting in abysmal computational efficiency. The Air model must be simplified in order to improve computation efficiency. The Air, as shown in Figure 3, consists of the outer glass, LCD glass, LCD metal tray, LCD plactic surround, batteries, PCB, speakers, outer case 8 components, and 10 parts. Figure 4a depicts the finite element model of the Air. From a height of 1.8 m, the Air drops freely to the rigid floor. Table 1 shows the element type, element size, and number of elements for each component, with the LCD metal tray and PCB using thick shell elements, the LCD plactic surround and floor using shell elements, and the others using solid elements. As shown in Figure 4c, the rounded corners of the outer case are subjected to local mesh refinement to improve calculation accuracy. The outer glass defines the local coordinate system XZ, as shown in Figure 4b. An accelerometer is used in the experiment to measure the acceleration during the drop process of the Air. The numerical simulations must also define a numerical accelerometer to measure the acceleration during the drop process of the Air to reduce error and facilitate the acquisition of acceleration time course curves. The location of the numerical accelerometer is shown in Figure 5, at the point where the long symmetry axis of the outer case of Air is 65 mm away from the intersection of the diagonal of the outer case away from the floor.

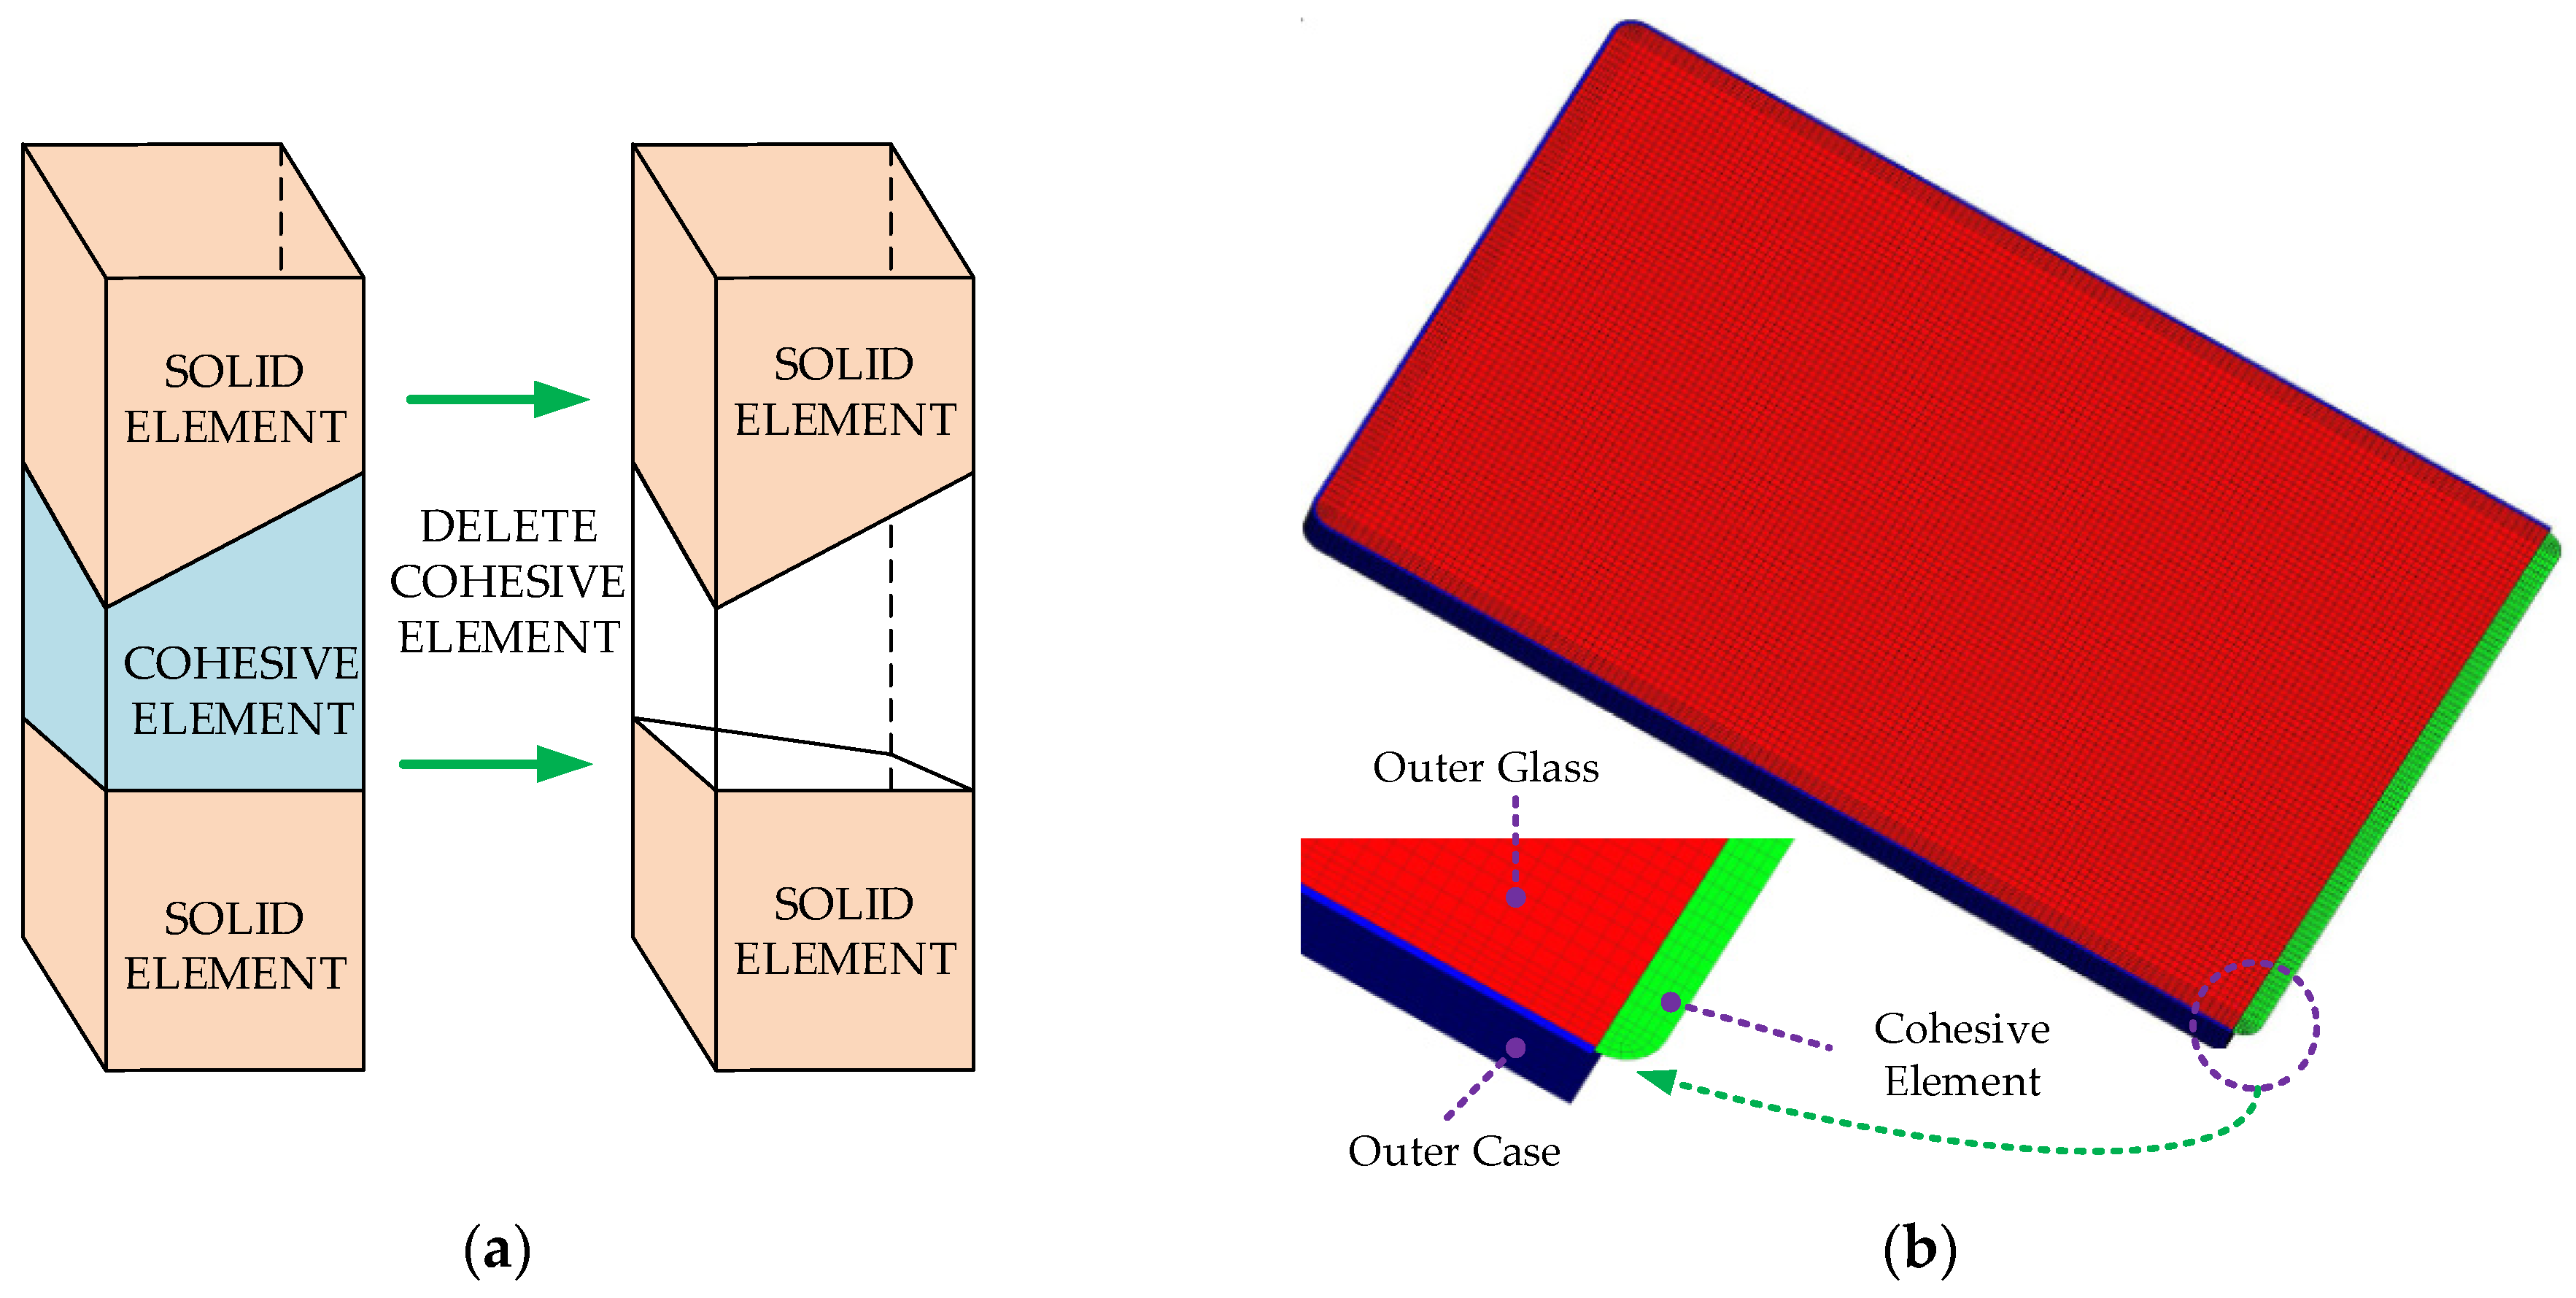
3.2. Definition of the Cohesive Zone Model and Tiebreak Contact

3.2.1. Definition of the Cohesive Zone Model

Figure 6a shows that the cohesive zone model simulates the cracking process at the serial interface of two adjacent elements by inserting cohesive elements within the standard interface of continuous elements. Because the starting location and area size of the debonding on the outer glass and outer case in the Air drop experiment cannot be predicted, zero-thickness cohesive elements were inserted at the connection between the outer glass and outer case, as shown in Figure 6b, to meet the generality of debonding on the outer glass and outer case occurring during the drop process of the Air.
Currently, two ways exist to connect the cohesive element and adjacent elements: bound contact and the standard node connection, as shown in Figure 6a, with the common node connection between the cohesive elements and the outer glass and outer case.

3.2.2. Definition of Tiebreak Contact

Tiebreak contact simulates the bonding and debonding processes of the outer case and outer glass by setting up Segments on the contact surfaces of the outer case and outer glass, respectively, and binding the two Segments together using the contact algorithm. For OPTION = 9, PARAM is the exponent in the damage model. A positive value invokes the power law, while a negative one invokes the BK model [28]. The cohesive zone model employs the BK criterion, and PARAM = −1 corresponds to the cohesive zone model, while the other parameters are consistent with the *MAT_COHESIVE_MIXED_MODE material model described in Section 3.3.

3.3. Definition of the Model Material

Table 2 displays the material models of each component in the Air model and the physical parameters of the relevant materials. The Air experiment drop process caused local debonding failure between the outer glass and outer case, as well as plastic deformation of the outer case. The PCB, batteries, LCD metal tray, LCD plastic surround, and speaker(s) all deform without producing damage and are classified as elastic–plastic materials with the property *MAT_PIECEWISE_LINEAR_PLASTICITY [29,30]. The floor and numerical acceleration are not damaged or deformed and can be considered rigid bodies assigned *MAT_RIGID. Because the floor is restricted to all degrees of freedom, we set CMO to 1 and CON1 and CON2 to 7. Because the outer case produces a large plastic deformation, *MAT_SIMPLIFIED_JOHNSON_COOK is given to more accurately simulate the plastic deformation process of the outer case, where A = 174.02 Mpa, B = 142.07 Mpa, N = 0.2196, and C = 0 [9]. The LCD glass and outer glass are assigned *MAT_ELASTIC. *MAT_COHESIVE_MIXED_MODE is assigned to the cohesive elements inserted between the outer glass and outer case, with energy release rates of 20 N/m for mode I and 100 N/m for mode II [31]; t N = 15.1 Mpa and t S = 14.6 Mpa [32,33]; E N = E T = 100,000 N/mm3 [34].

3.4. Contact Algorithm and Other Definitions

*CONTACT_TIEBREAK_SURFACE_TO_SURFACE was used between the LCD glass and outer case, with NLFS = 12.4 MPa and SFLS = 7.16 MPa [39]. The contact between the other parts is *CONTACT_TIED_SURFACE_TO_SURFACE or *CONTACT_SURFACE_TO_SURFACE, and the contact between the Air and the floor is *CONTACT_AUTOMATIC_SURFACE_TO_SURFACE. Table 3 displays the friction coefficients of various materials. The numerical accelerometer is linked to the Air model via *CONSTRAINED_EXTRA_NODES_SET, which fixes the accelerometer to the outer case. In Section 3.3, the floor limitation was mentioned. We can define the global gravitational acceleration g = 9.8 m/s2 in the y-negative direction, and use ELFORM with the value 19 to define the cohesive elements with 4-point integration. A stiffness hourglass control is added to parts with large deformations to ensure the calculation’s validity.
The Air falls freely from a height of 1.8 m in the drop experiment. According to Equation (4), H = 1.8 m is equated to an initial velocity of V = 5.9 m/s to shorten the computation time.
V = 2 g H
where H is the fall height, and g is the gravity acceleration.

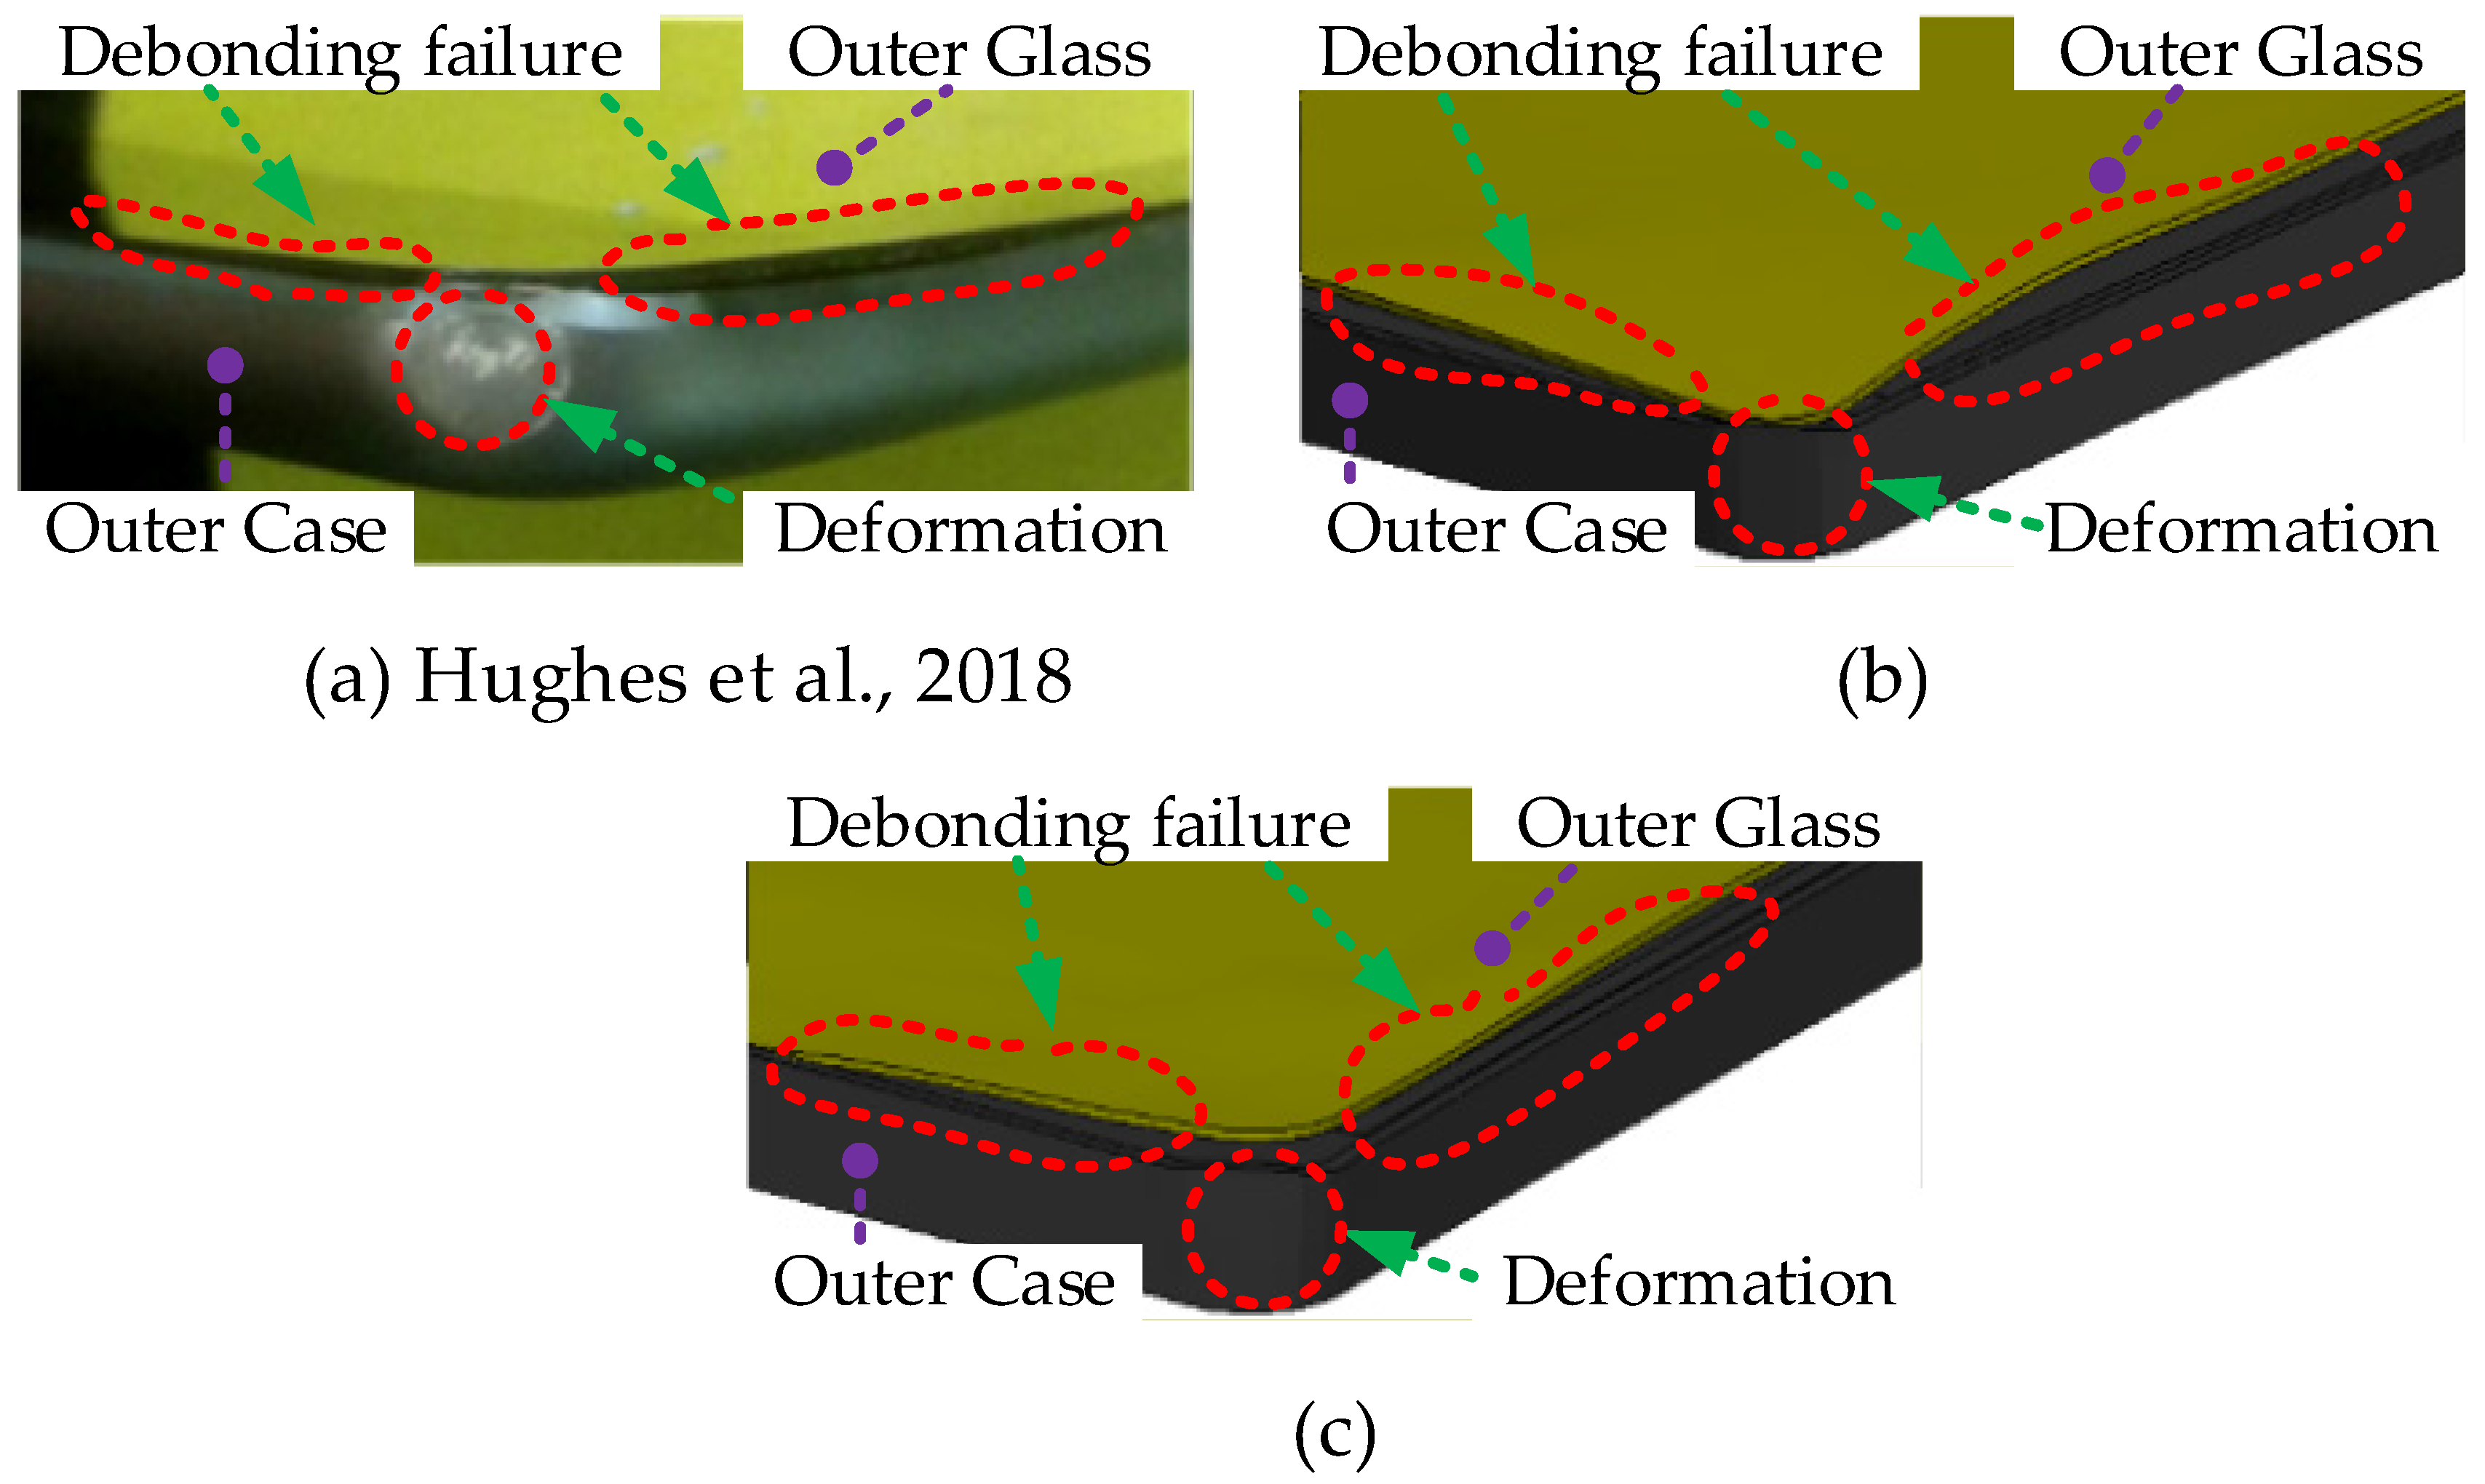
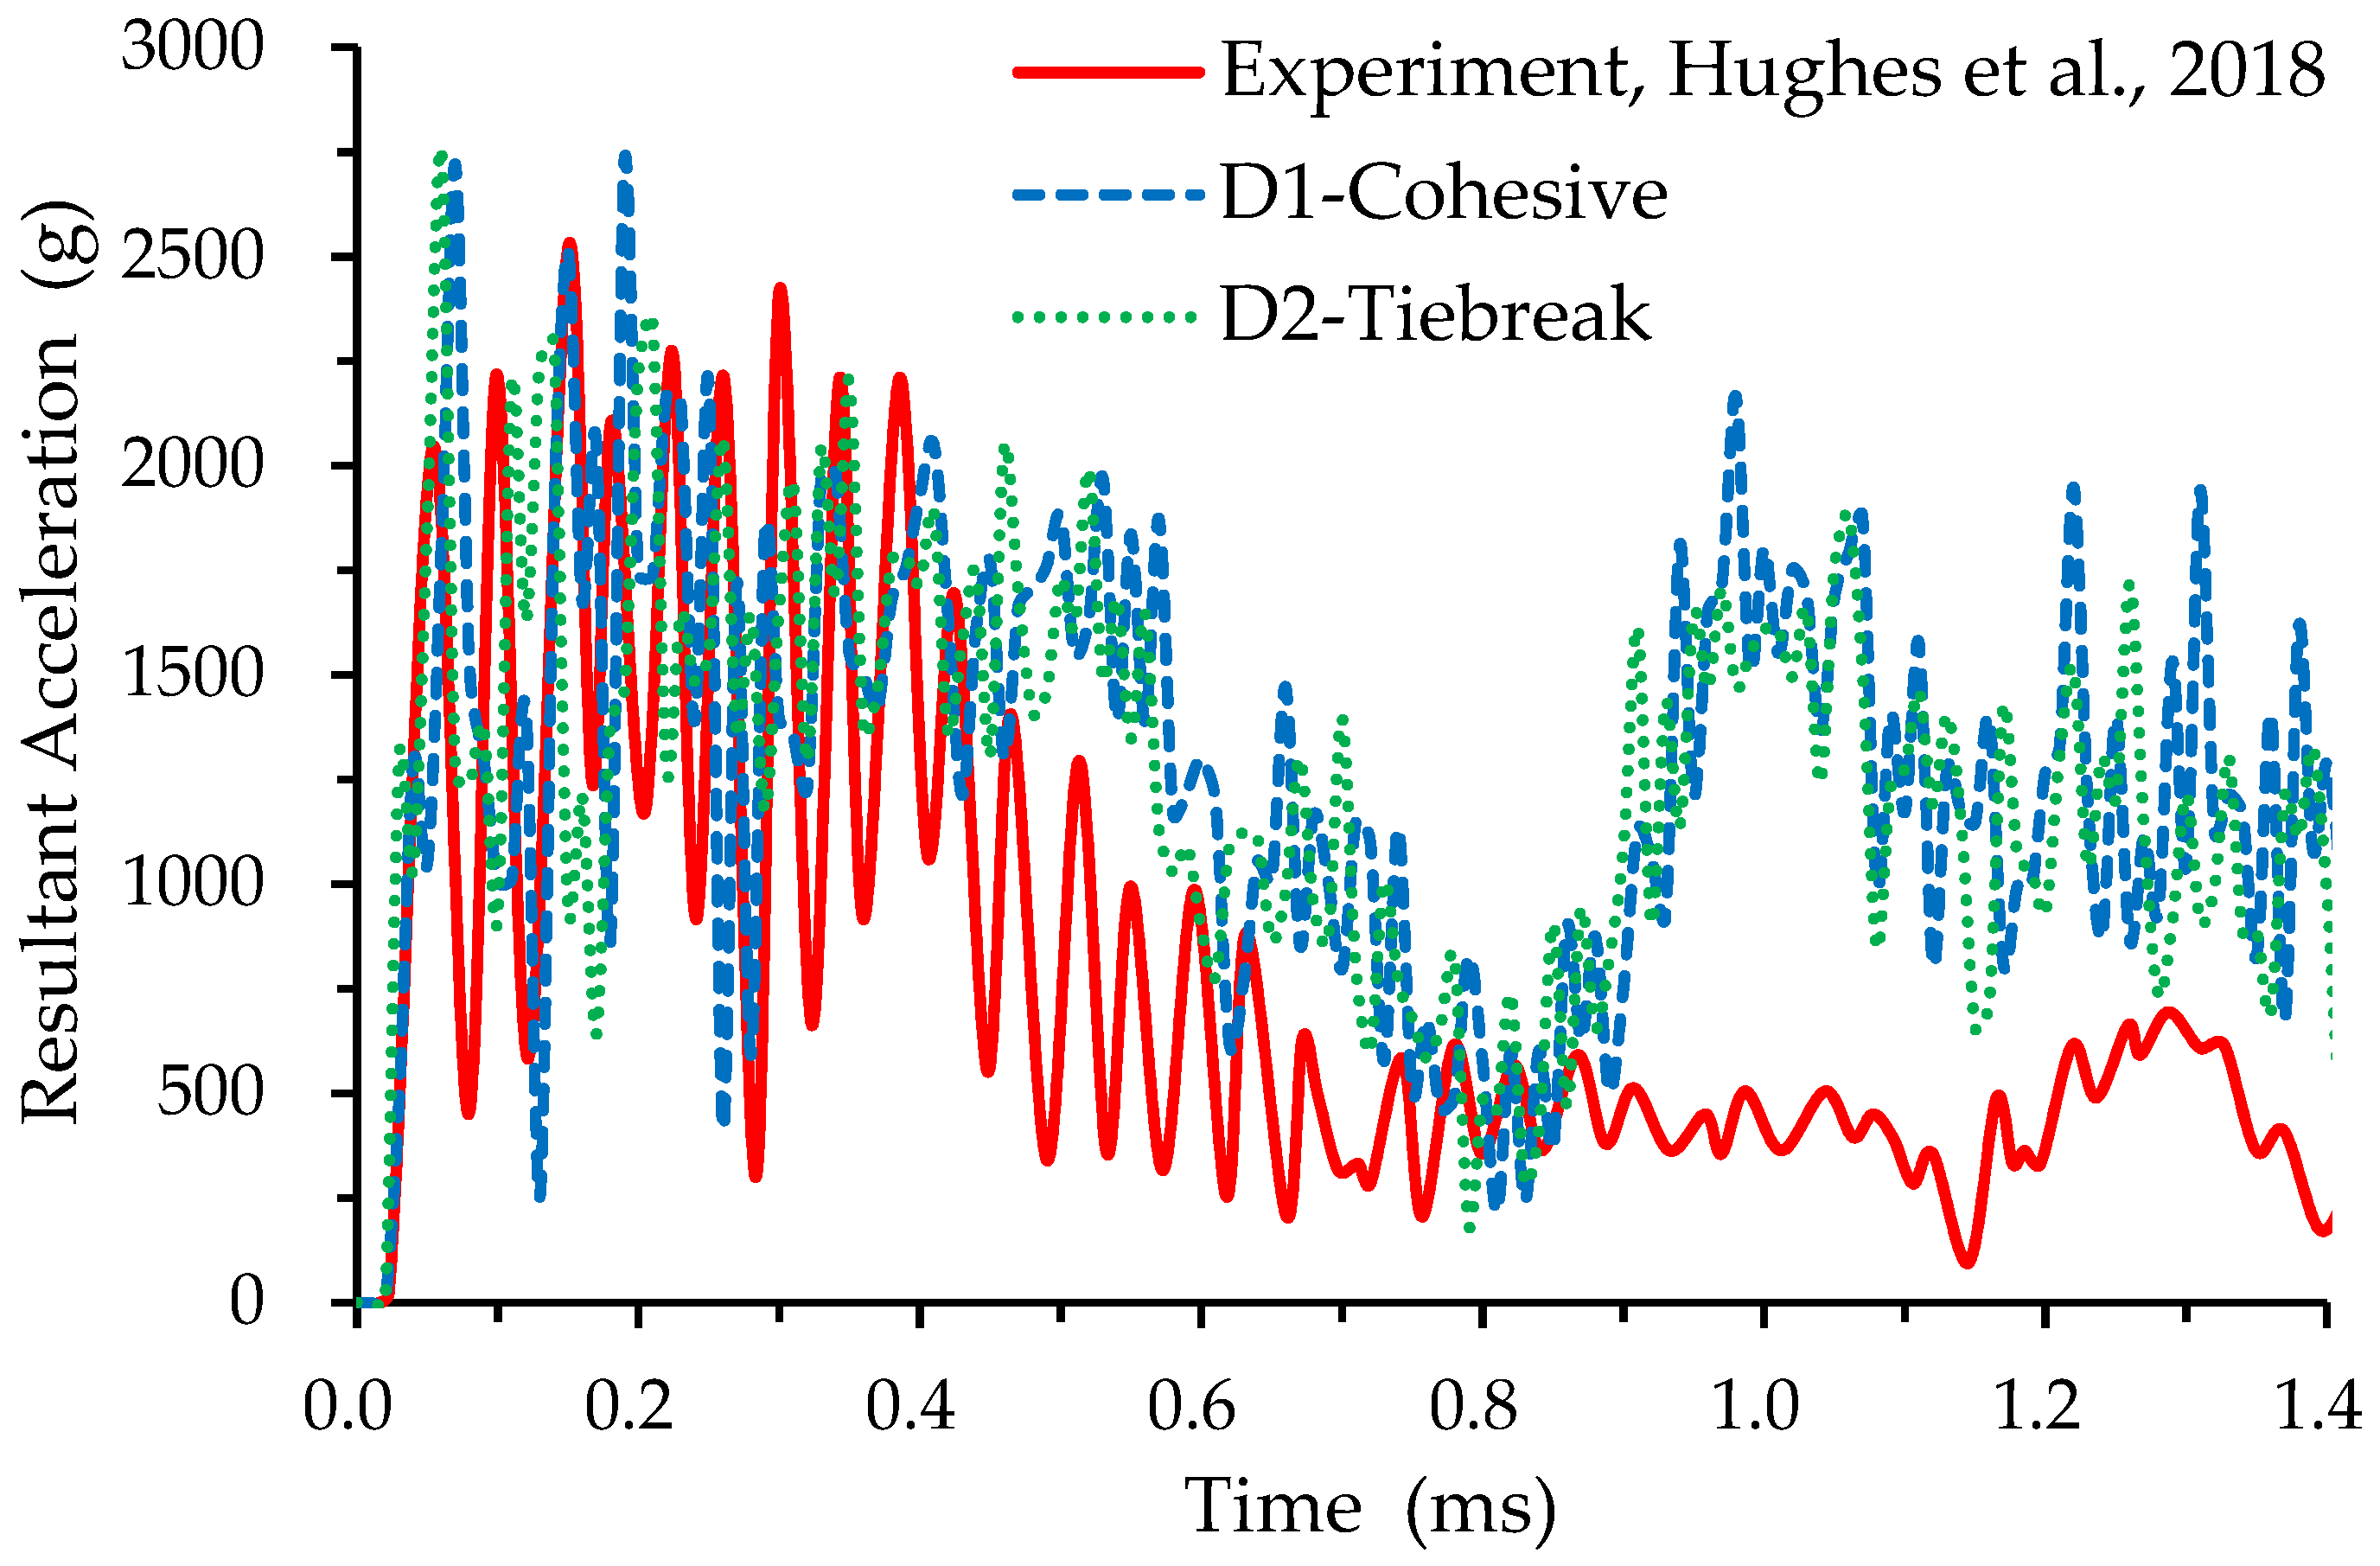
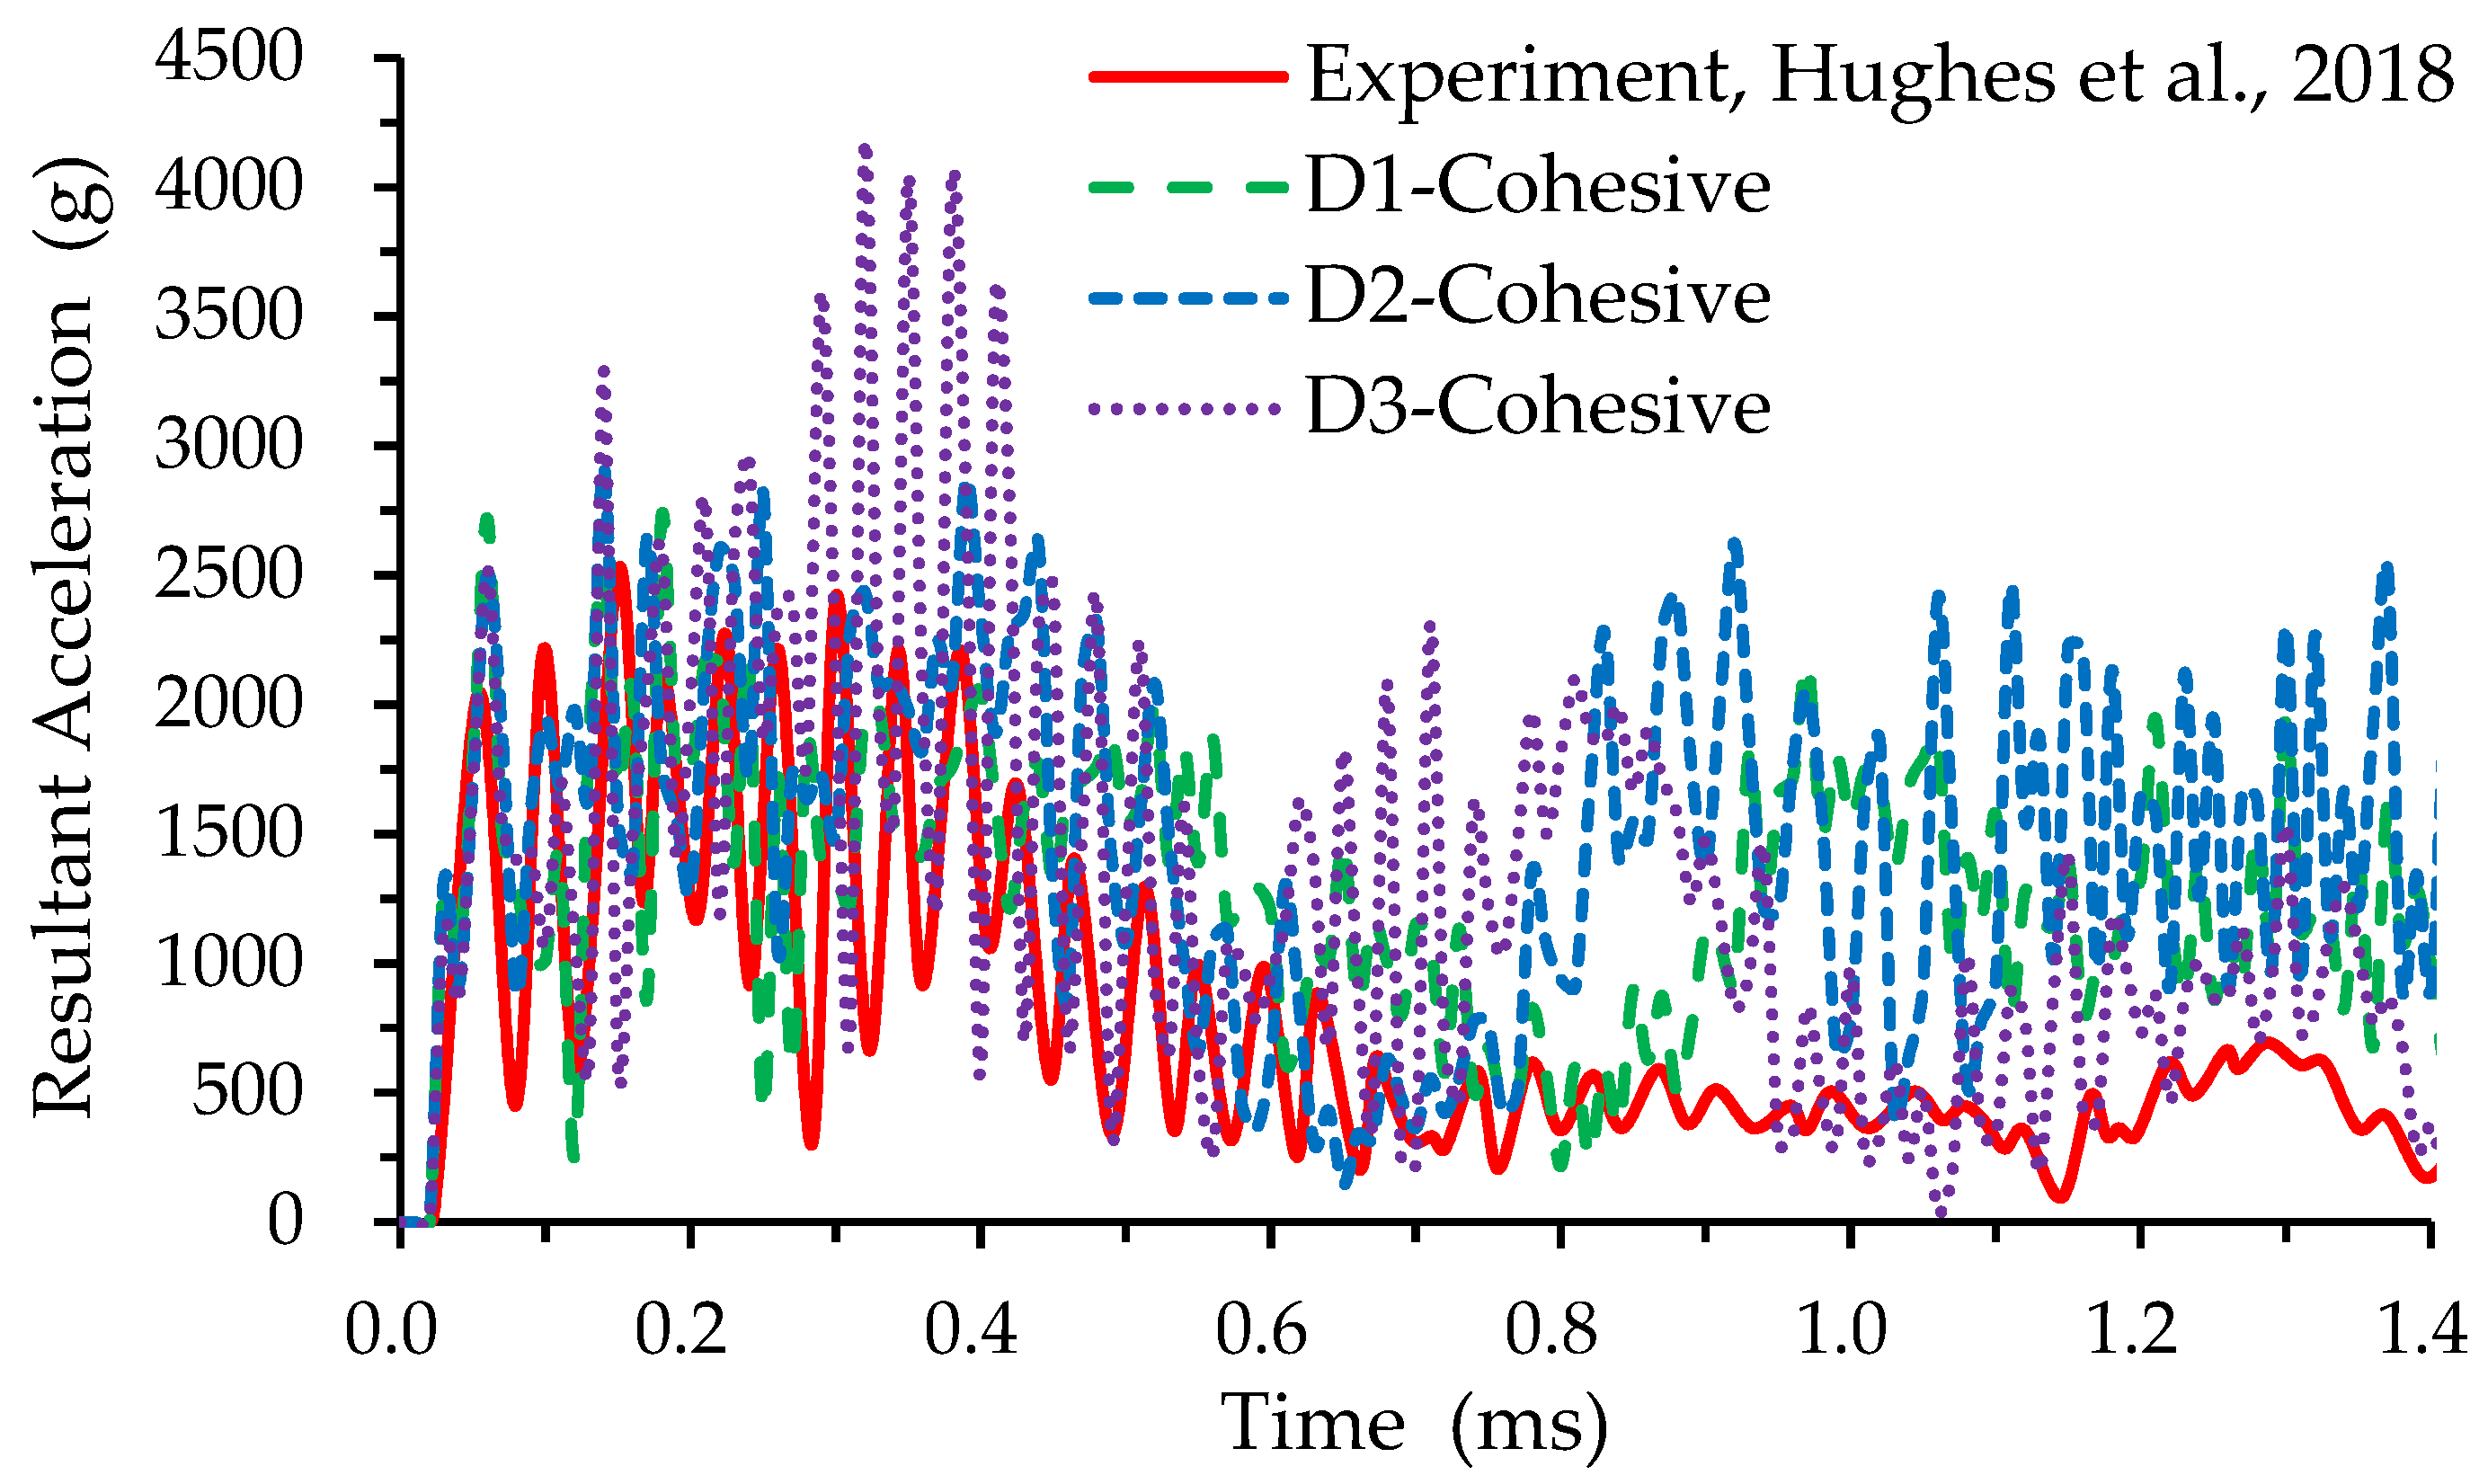
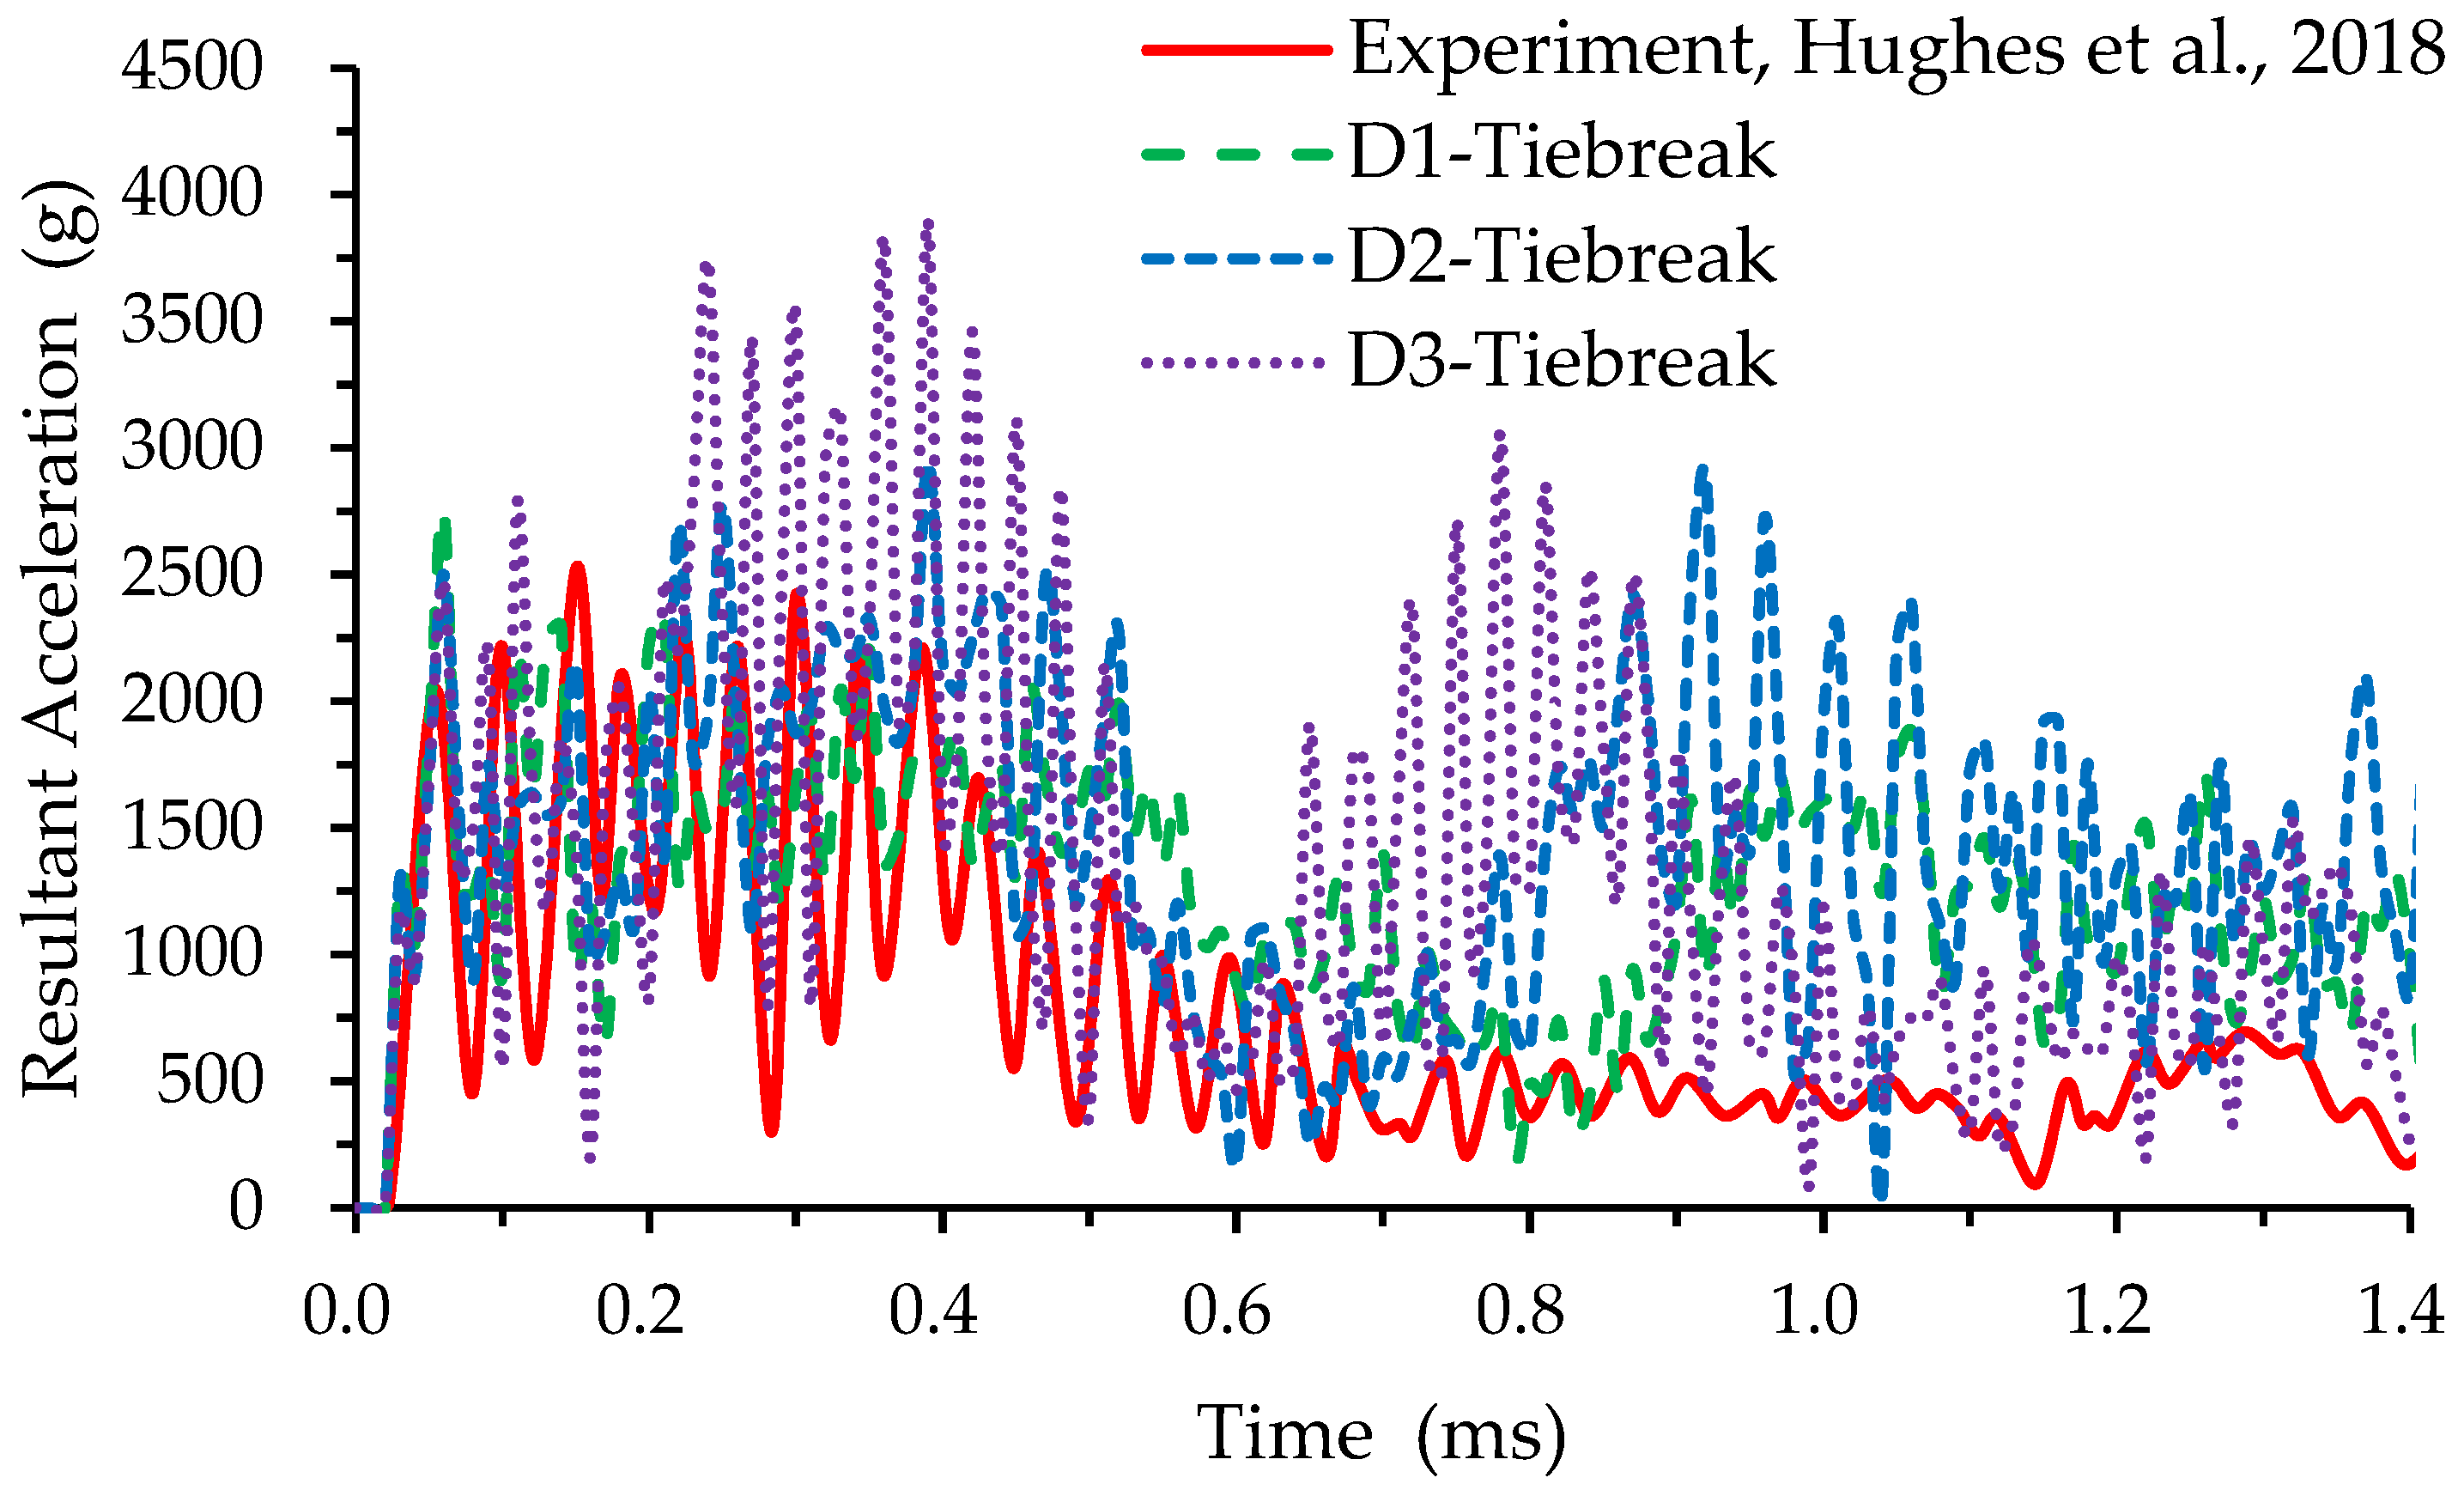
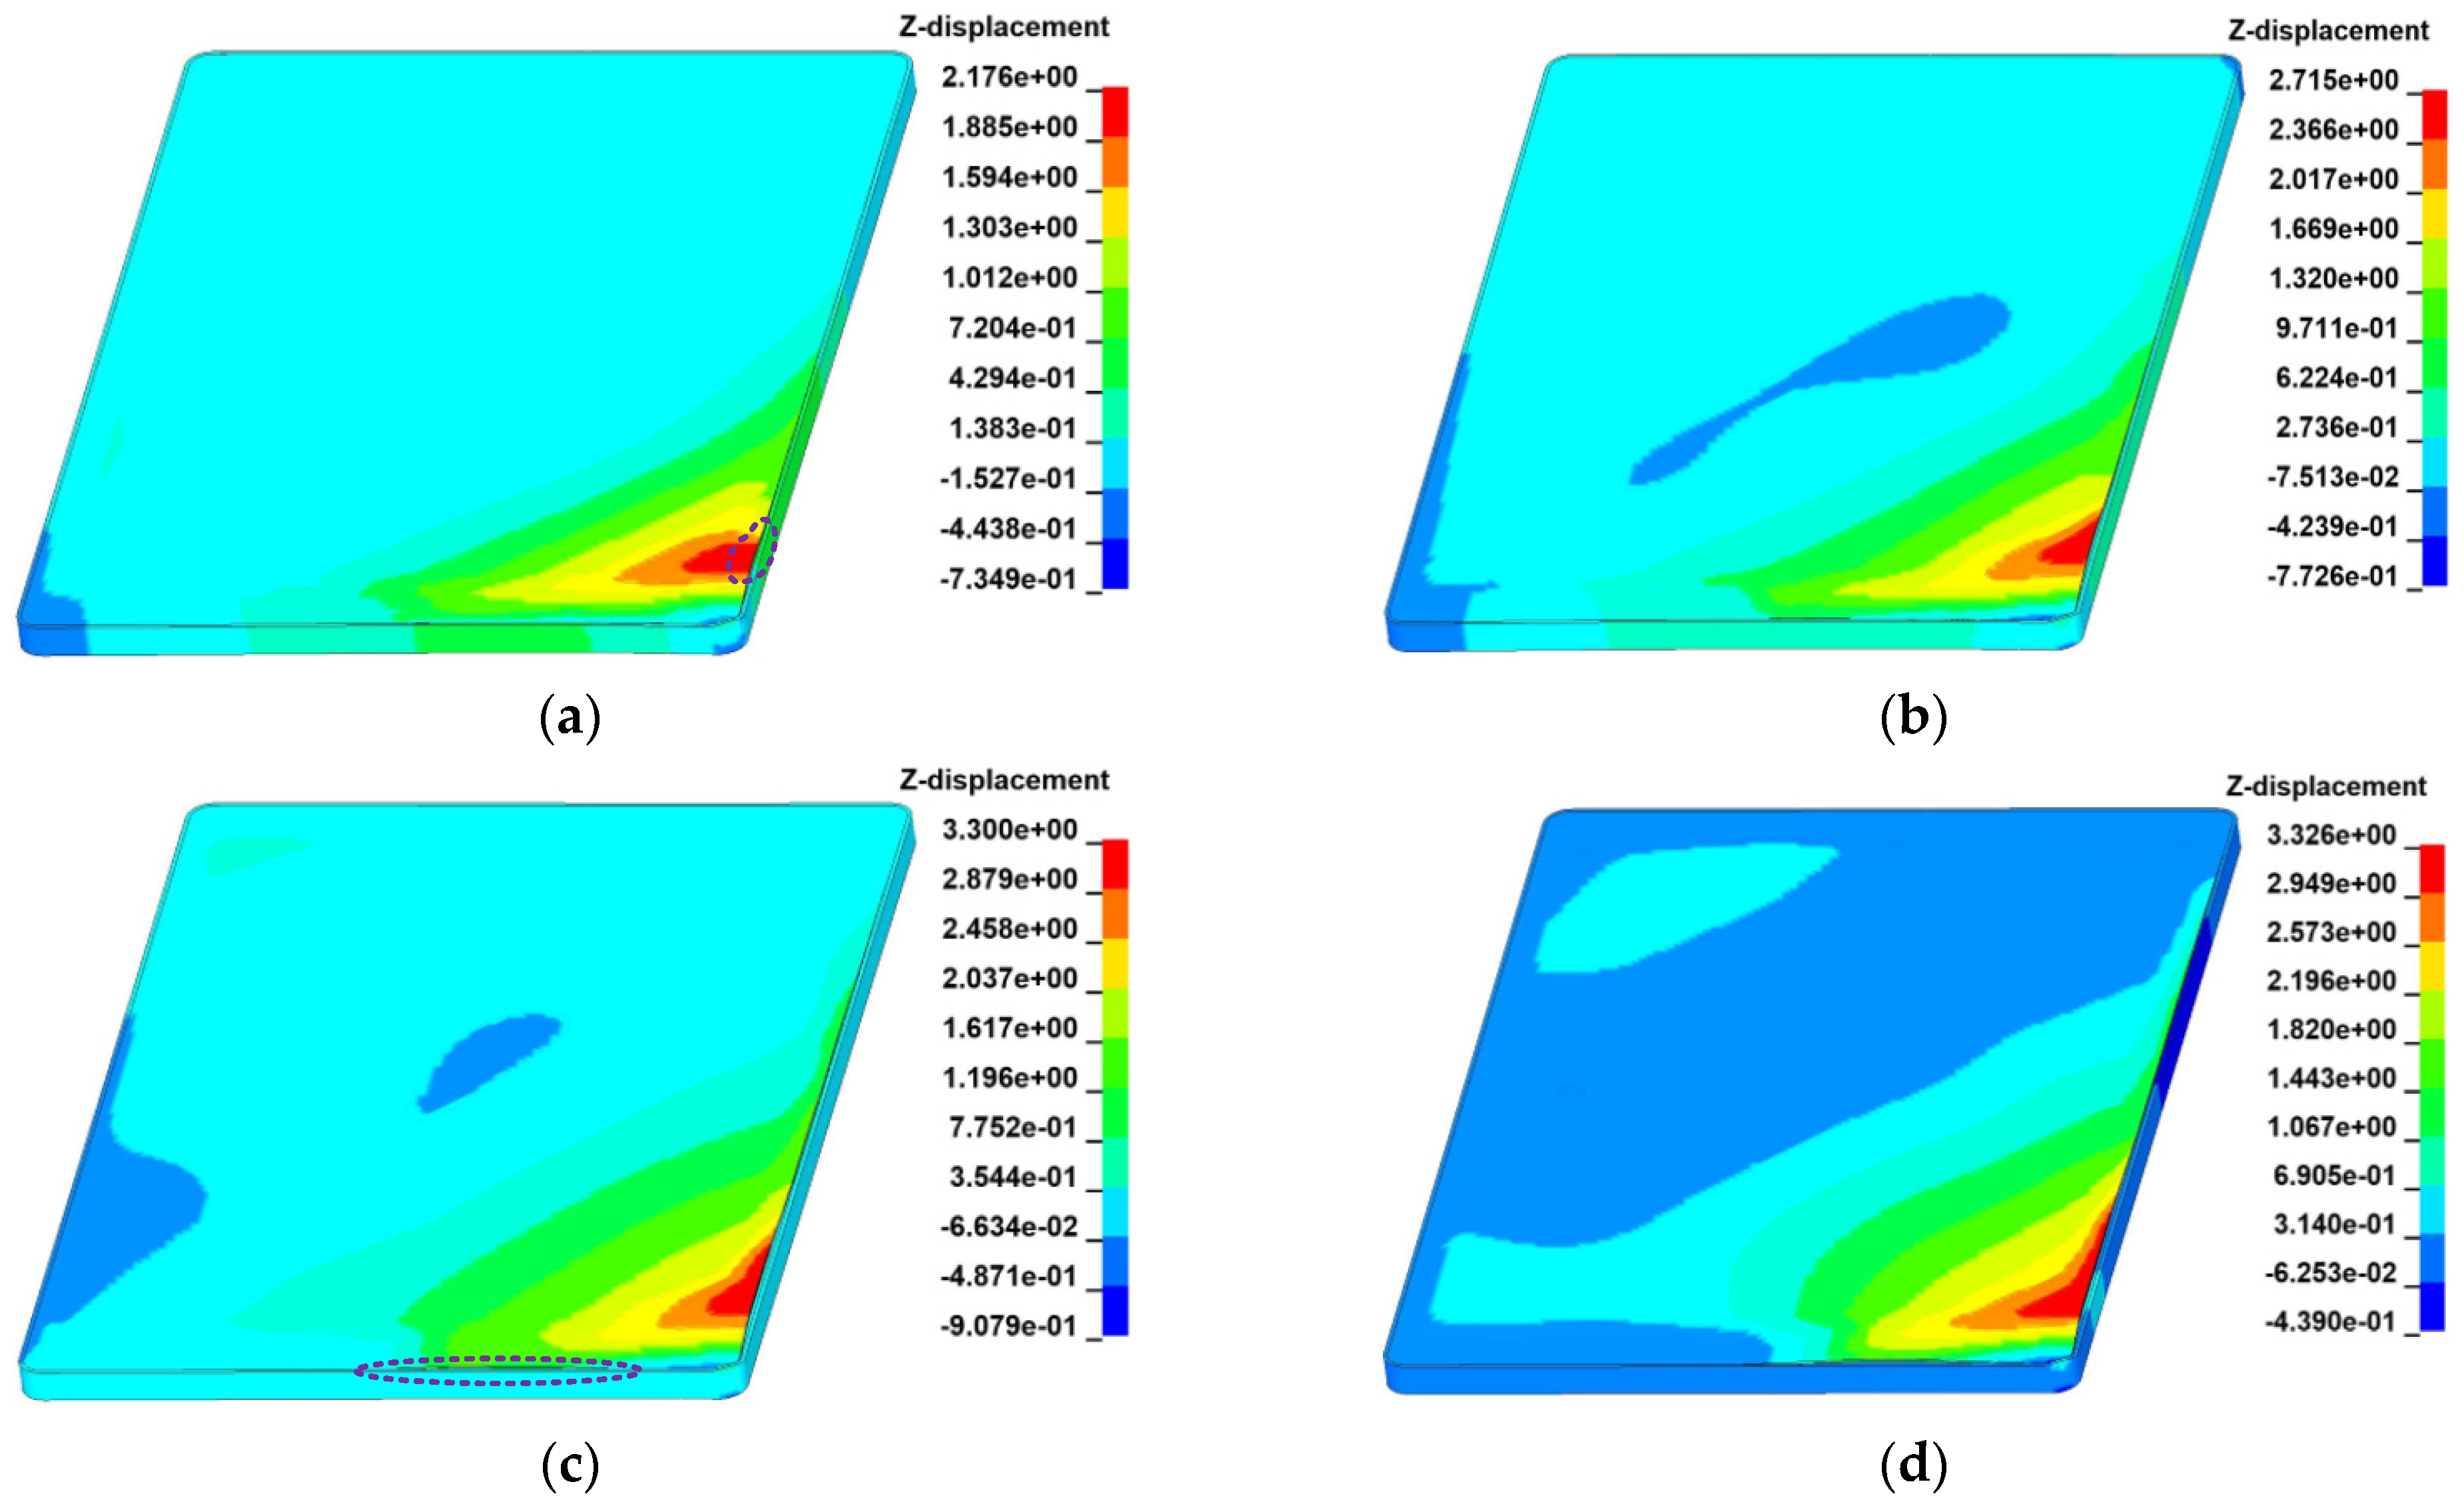
3.5. Results and Discussions

According to the Air drop experiment by Hughes et al., the experimental phenomena and acceleration time course curves of the Air drop were obtained for subsequent validation of the validity of the Air model and selection of the debonding failure method, as shown in Figure 7a and Figure 8, respectively.
Despite the complex forces between the outer glass and the outer case during the drop process of the Air, the cohesive zone model and tiebreak contact were used to simulate the local debonding between the outer glass and the outer case during the drop process of the Air, taking into account calculation accuracy and efficiency. At the same time, a better method was selected for the subsequent investigation based on the cohesive zone model and tiebreak contact.
A smaller mesh size can improve model accuracy but will increase calculation time. In this case, it is necessary to analyze the convergence of the model’s mesh to ensure the model’s calculation accuracy while also performing the calculation efficiently. As illustrated in Figure 9a–c, the Air model is meshed in three sizes: D1, D2, and D3. Assuming that each part in D2 has a mesh size of d with a total of 58,981 elements, each part in D1 has a mesh size of 0.75 d with a total of 98,255 elements, and each part in D3 has a mesh size of 1.25 d with a total of 39,006 elements. The Air model for the cohesive zone model and tiebreak contact were calculated separately using numerical analysis software. Figure 10 and Figure 11 show the resultant acceleration time course curves for the Air model with the cohesive zone model and tiebreak contact for different mesh sizes, and it is clear that the peak resultant acceleration for the Air model with the cohesive zone model and tiebreak contact gradually approaches the experimental peak as the mesh size decreases. The peak experimentally obtained resultant acceleration was 2526.24 g. The peak resultant acceleration of the Air model for the cohesive zone model was 2726.53 g, 2928.73 g, and 4166.84 g for the D1, D2, and D3, respectively, with relative errors of 7.93%, 15.93%, and 64.94%. The Air model’s peak resultant accelerations for tiebreak contact at D1, D2, and D3 are 2749.68 g, 2946.43 g, and 3987.36 g, respectively, with relative errors of 8.84%, 16.6%, and 57.84%. Meshing at the size of D1, the peak resultant acceleration of the Air model with the cohesive zone model and tiebreak contact is within reasonable limits. However, the Air model with the cohesive zone model has a minor relative error and is more accurate. Table 1 shows the mesh size of each part of D1. The Air model with the cohesive zone model and the tiebreak contact using the mesh size of D1 are computed on the same computer. The Air with the cohesive zone model takes 15 min and 11 s. In comparison, the Air model with the tiebreak contact takes 15 min and 21 s, indicating that the Air model with the cohesive zone model is more efficient. The experimental phenomena of the Air drop are depicted in Figure 7a: plastic deformation of the outer case and localized debonding between the outer glass and outer case; the simulation phenomena of the Air drop with the cohesive zone model and tiebreak contact is depicted in Figure 7b,c: plastic deformation of the outer case and localized debonding between the outer glass and outer case. The simulation phenomena of the Air model with the cohesive zone model and tiebreak contact are more consistent with the experimental phenomena.
To better investigate the effect of the cohesive zone model and tiebreak contact on the debonding between the outer glass and outer case of the Air model with the same mesh size D1, the resultant acceleration time course curves of the Air model with the cohesive zone model and tiebreak contact are shown in Figure 8. The experimentally obtained resultant acceleration time course curve, which peaks at 0.15 ms, fluctuates up from 0 to 0.15 ms, fluctuates down between 0.15 ms and 0.6 ms, and stabilizes after 0.6 ms. Until 0.8 ms, the resultant acceleration time course curves of the Air model with the cohesive zone model and tiebreak contact agree well with the experimental curves. There is a sudden increase in the resultant acceleration between 1.0 and 1.4 ms; then, the oscillation decreases because the Air impacts the floor and causes the outer case to deform plastically. The plastic deformation of the outer case, like the force, propagates in a wave-like manner. The wave-like deformation of the outer case gradually decreases when the Air leaves the floor, which results in a sharp increase followed by an oscillatory decrease in the resultant acceleration between 1.0 and 1.4 ms, which shows that the simulation results of this paper are superior compared to those of Hughes et al.
When the calculation time, debonding phenomenon, and resultant acceleration time course curve of the Air model using the cohesive zone model and tiebreak contact are compared, taking computational accuracy and efficiency into account, the cohesive zone model was ultimately chosen to simulate the local debonding failure of the outer glass and outer case during the drop process of the Air and subsequent studies.
Although the experiment can obtain a more accurate debonding phenomenon and resultant acceleration time course curve, the drop time of the experiment is very short, even if the high-speed camera has difficulty capturing the starting position of debonding between the outer glass and outer case and the entire debonding process. This problem can be solved using the numerical simulation method. We can obtain the cohesive zone model shown in Figure 12 via numerical simulation to simulate the local debonding process between the outer glass and outer case. The debonding starting position appears near the collision rounded corner of the Air, as shown in Figure 12a. When Air hits the floor, the rounded corner of the outer case first contacts the floor; the outer case produces plastic deformation and squeezes the outer glass so that the outer glass produces elastic deformation and the cohesive elements between the outer glass and outer case are stretched or compressed. When the total relative displacement δ m reaches damage initiation displacement δ 0 , the material begins to be damaged. As the Air continues to drop and hit the floor, the outer glass and outer case deformation increases, the stress applied to the cohesive elements increases, and the total relative displacement of the cohesive elements increases. The material is destroyed, and the cohesive elements are deleted when δ m reaches the complete failure displacement δ F . The start position of debonding between the outer glass and the outer case appears at 0.50 ms, as shown in Figure 12a, and as the Air continues to hit the floor, the outer glass and outer case deformation increases. As shown in Figure 12b,c, many cohesive elements are deleted at 0.60 ms, and the other side of the debonding initiation point also appears at 0.8 ms. When the velocity of the Air in the Y direction is zero, the Air is not dropping and hitting the floor, and the outer glass and outer case are no longer deformed. When δ m is less than δ F , the cohesive elements are no longer removed, and finally, a local debonding between the outer glass and the outer case is formed at 1.00 ms, as shown in Figure 12d.

4. Analysis of Influential Factors

In this section, the finite element model of Air is used to conduct a series of numerical simulations to investigate the effects of different radii of the rounded corners, dropping with various positions in the XY plane, materials of the outer case, and strain rates of the PC/ABS on the debonding between the outer glass and outer case of the Air.

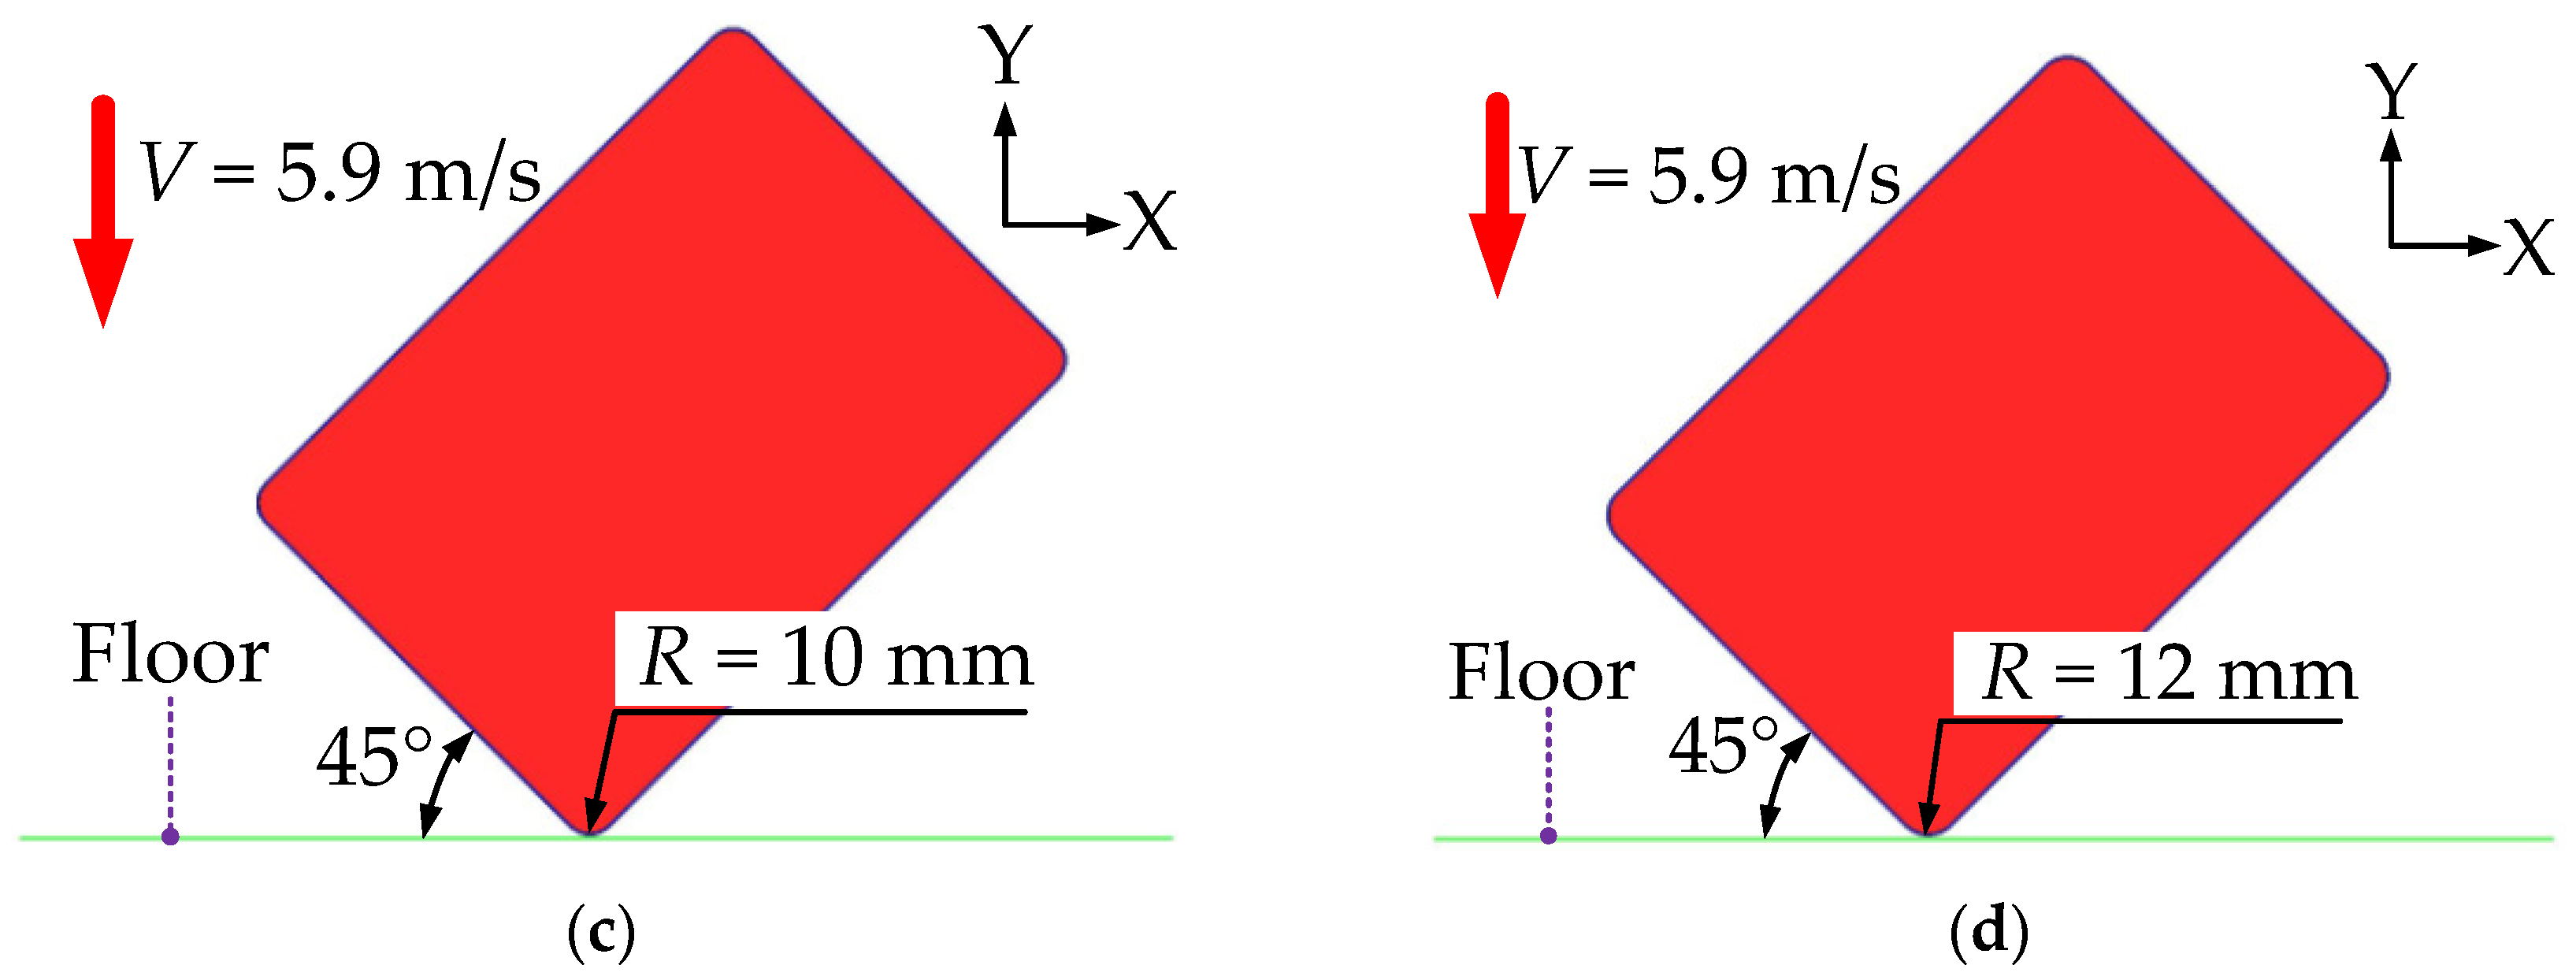
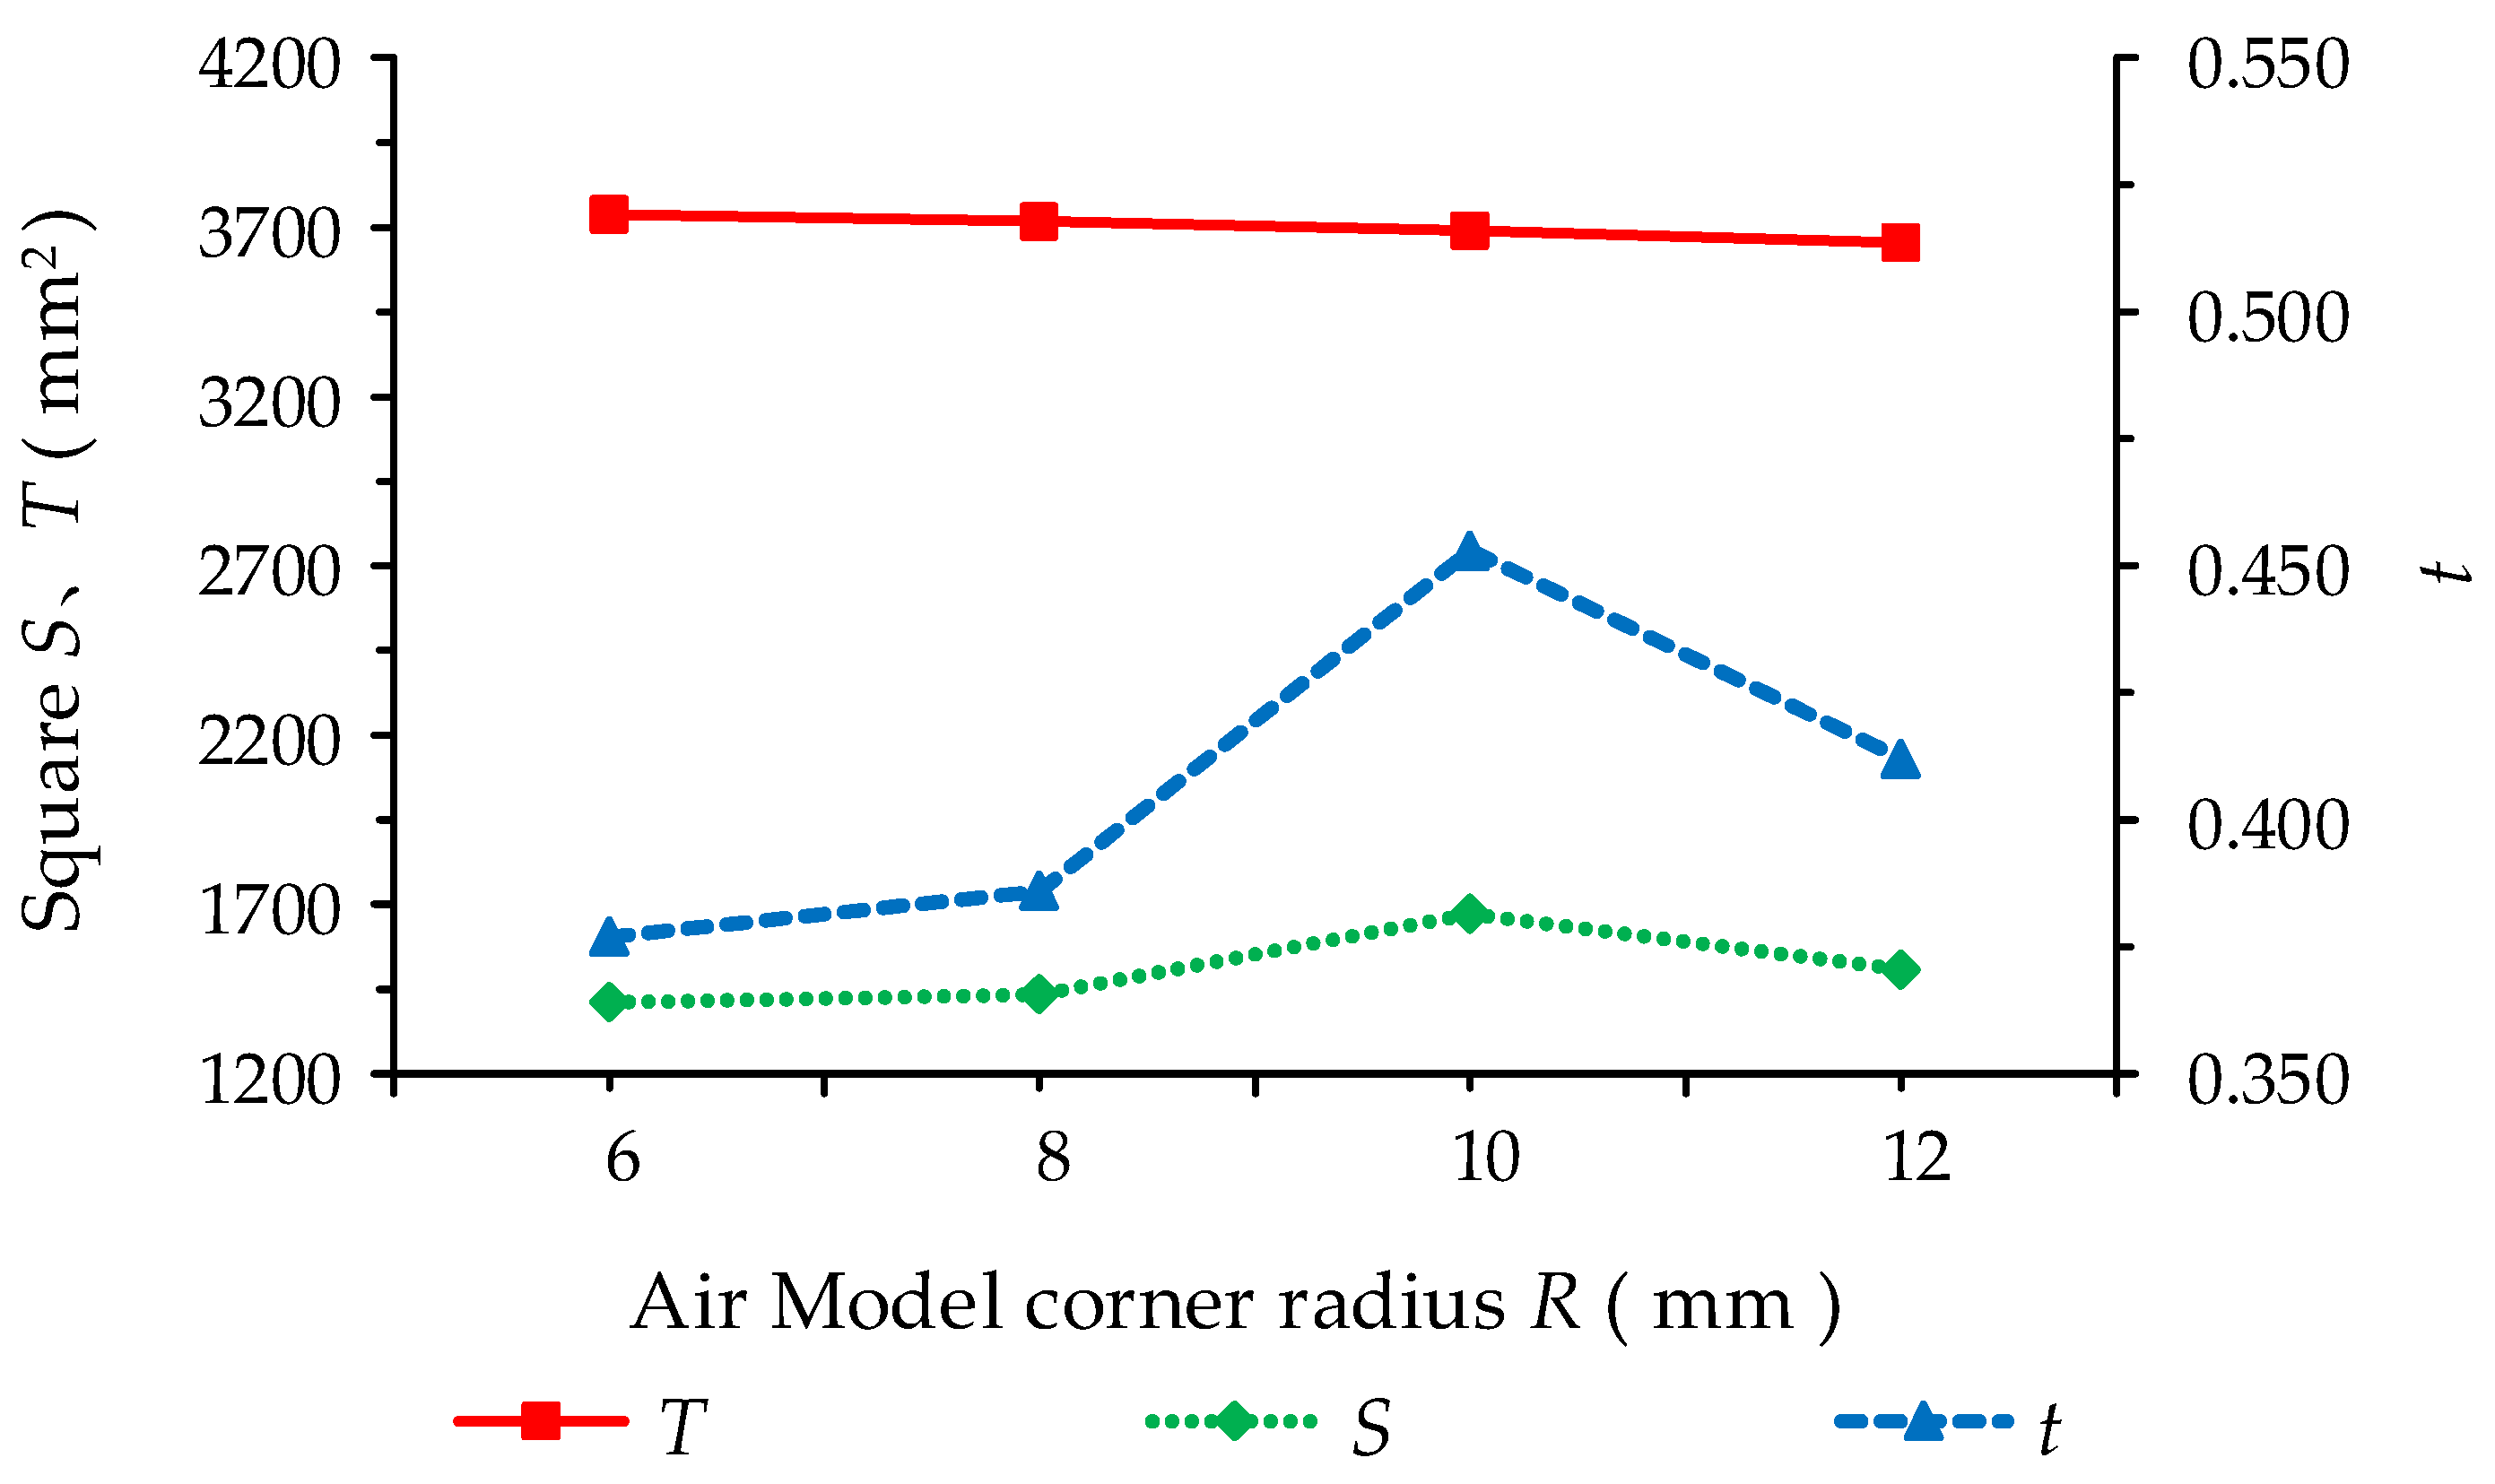
4.1. The Effect of Different Radii of Rounded Corners on Debonding

The degree of plastic deformation of the Air model’s outer case and outer glass will be affected during the drop process by changing the rounded corner radii of the Air, which will result in a change in the force within the cohesive element and thus affect the debonding operation between the outer glass and outer case of the Air model. As a result, four Air drop models in the XY plane with rounded corner radii of 6 mm, 8 mm, 10 mm, and 12 mm are established, as shown in Figure 13a–d. t characterizes the effect of different round corner radii on the debonding between the Air model’s outer case and outer glass.
The total area of the cohesive elements, as well as the deleted cohesive elements, were measured and calculated via post-processing in order to better investigate the effect of different rounded corner radii on the debonding between the outer case and outer glass of the Air model, and the results are shown in Table 4. To analyze the trend of S, T, and t with R more intuitively, R is plotted against S, T, and t as a combined curve, as shown in Figure 14. The total area of the cohesive elements T decreases as the rounded corner radius R of the Air model increases from 6 mm to 12 mm in 2 mm steps. The gap between the maximum and minimum of T is 82.4 mm2, which is 2.2% of the total area of the cohesive elements of the Air model with R = 6 mm, and the effect of T can be ignored. The area of the deleted cohesive elements S increases and then decreases, with the maximum and minimum of S achieved when the radius of the Air model’s rounded corners is R = 10 mm and R = 6 mm, respectively. S is primarily responsible for the variation in t. As a result, the t trend is consistent with S. When the Air model’s rounded corner radii are R = 10 mm and R = 6 mm, the maximum and minimum of t are obtained, and the maximum of t is 1.2 times the minimum. It can be concluded that when the rounded corner radius of the Air model R = 10 mm, t is the largest, which is 1.2 times the t of the Air model with R = 6 mm; thus, the Air model’s rounded corner radius should not be designed to be near 10 mm.

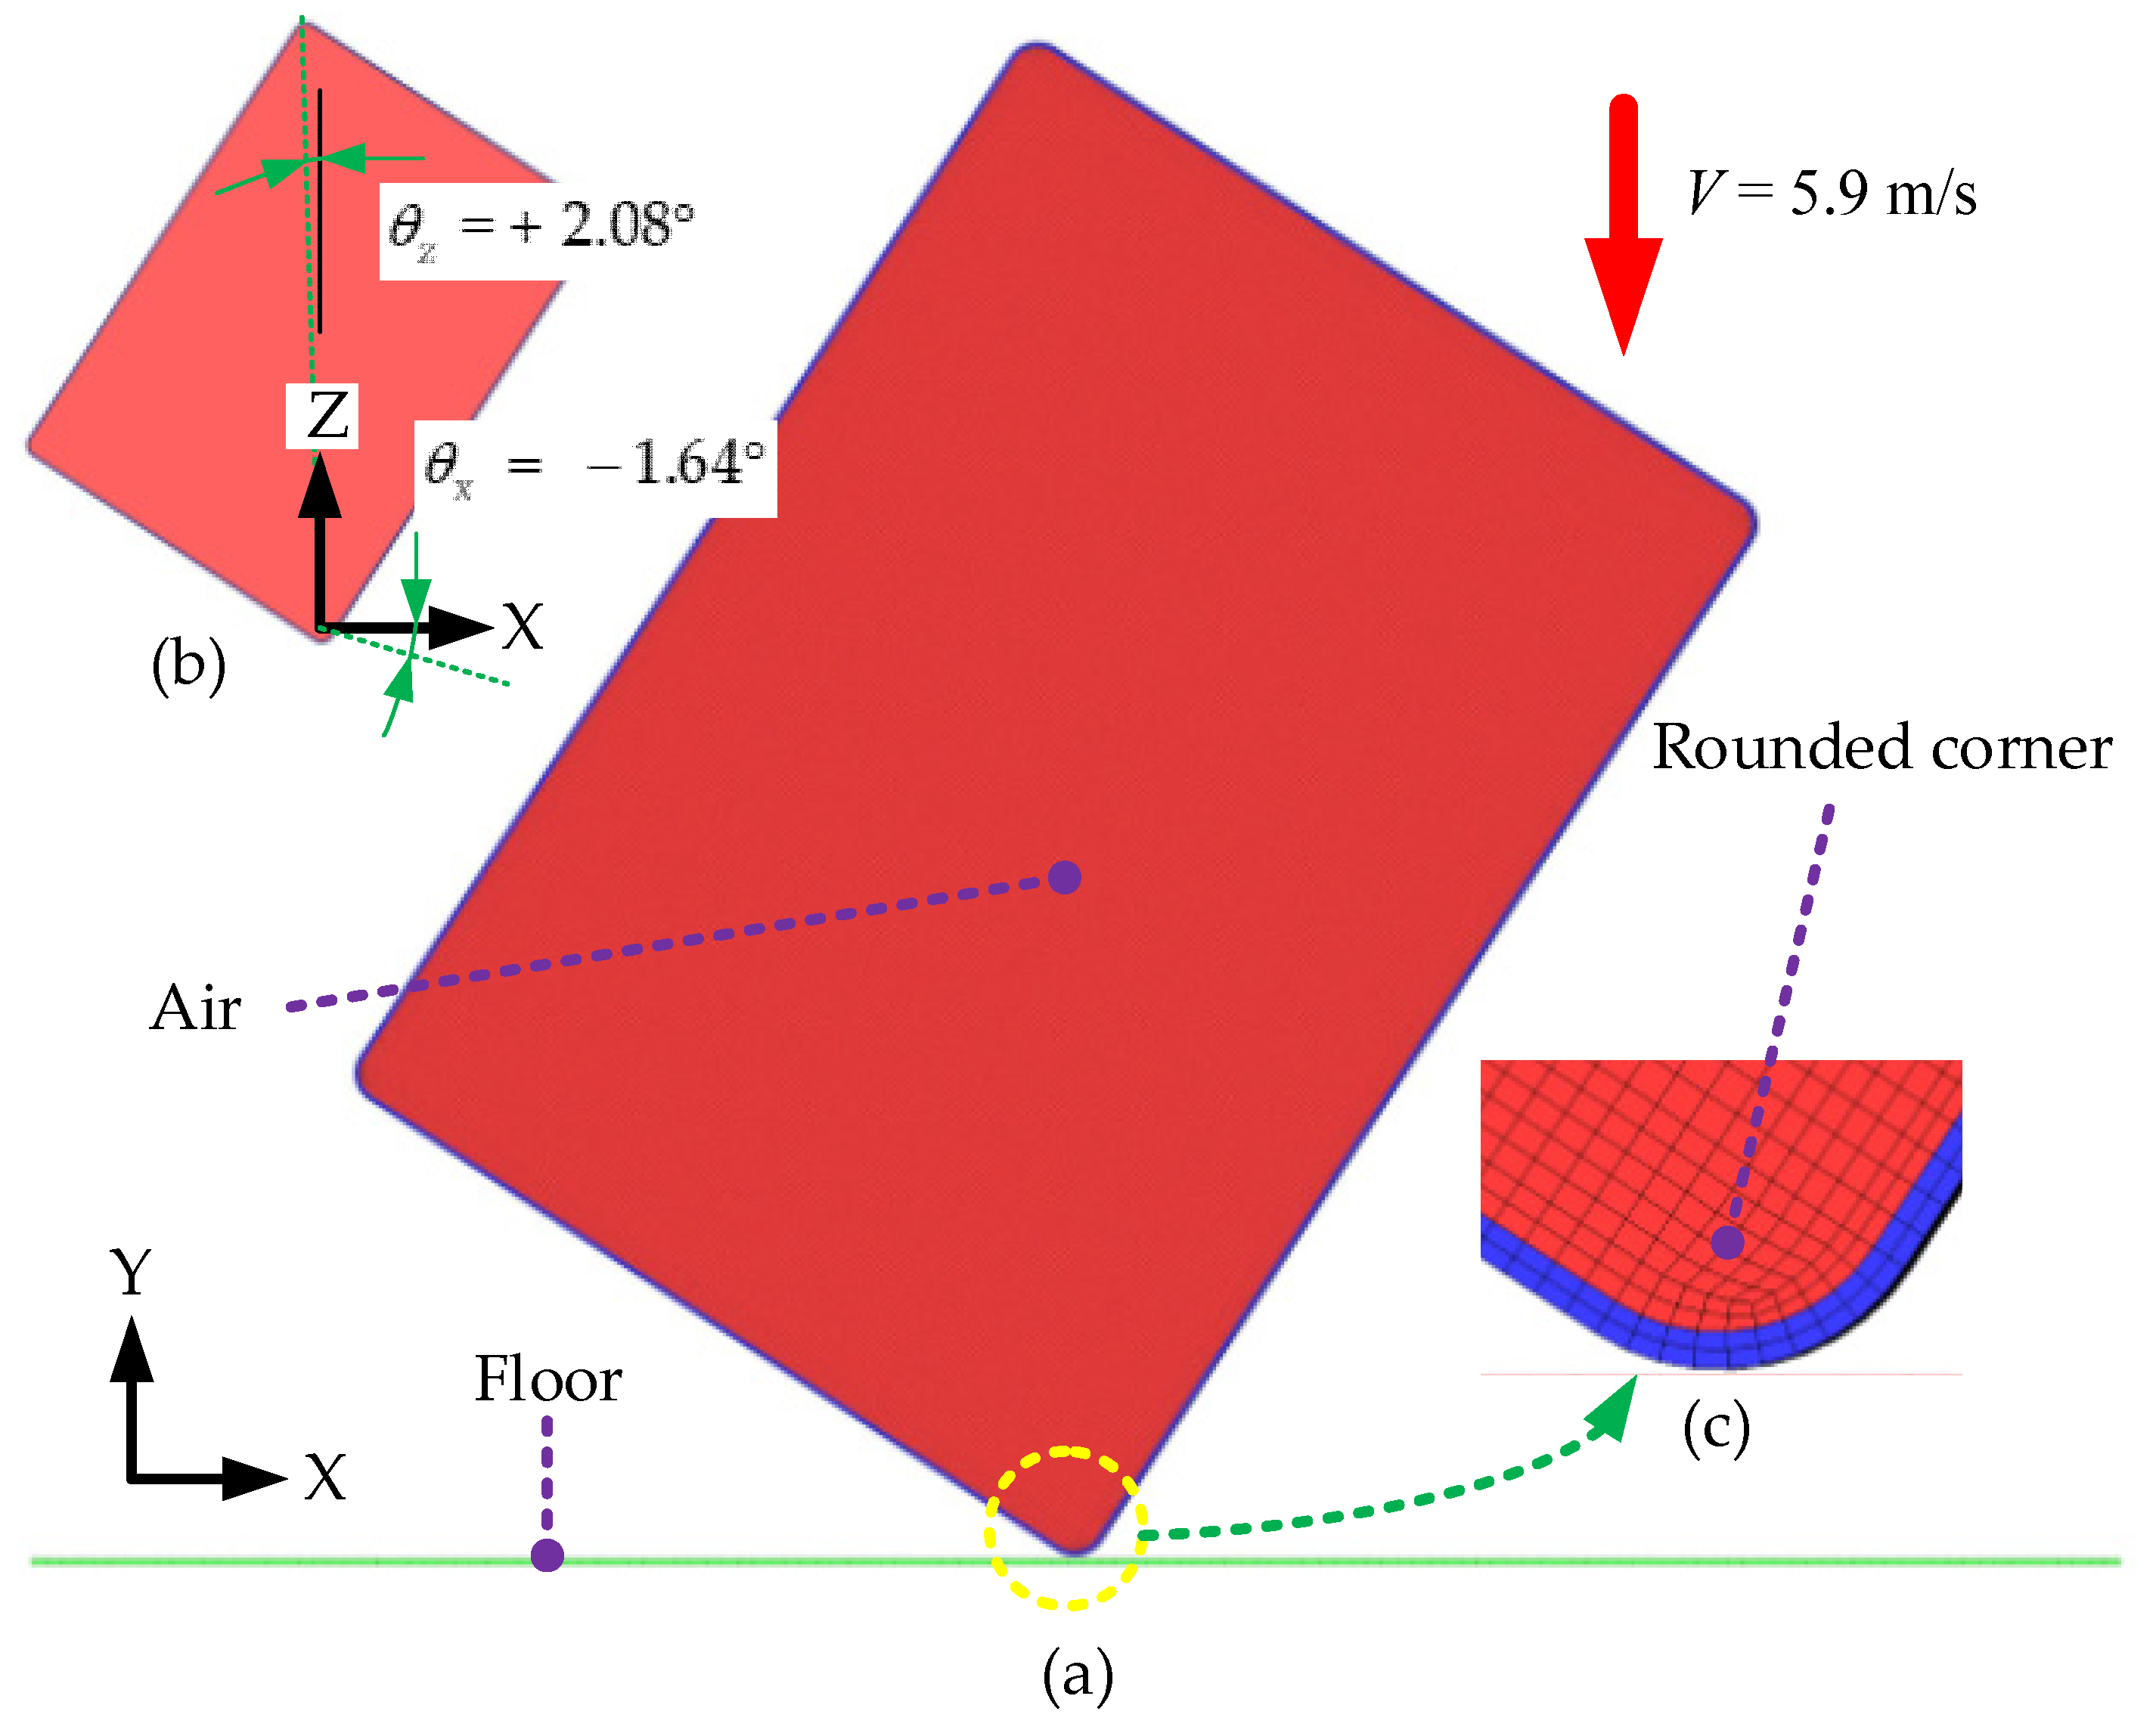
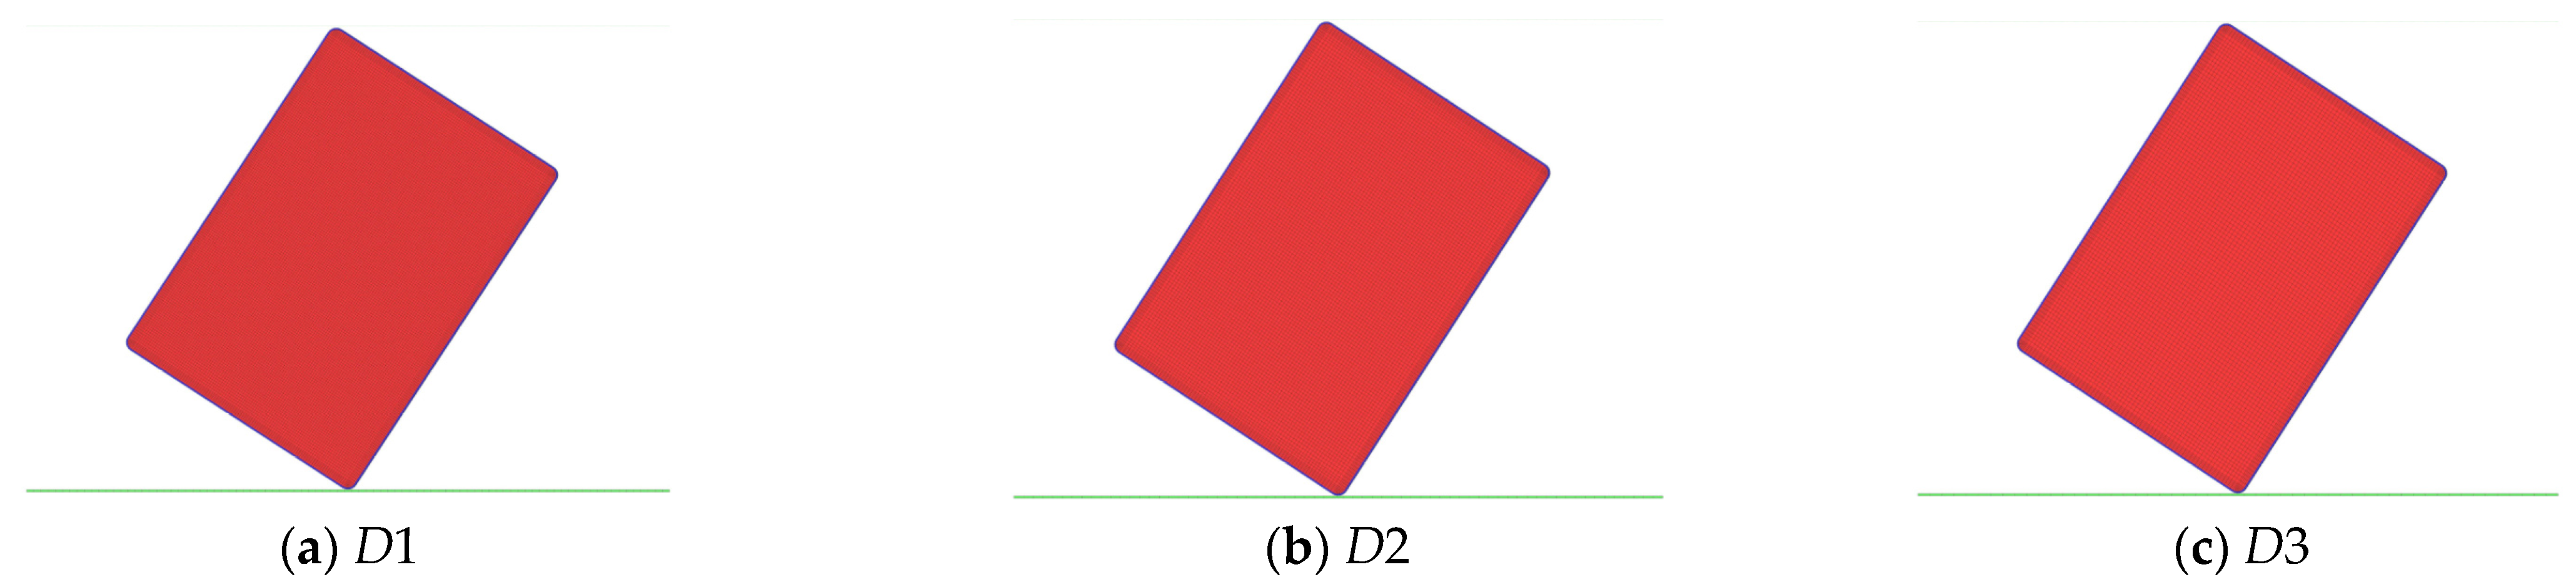
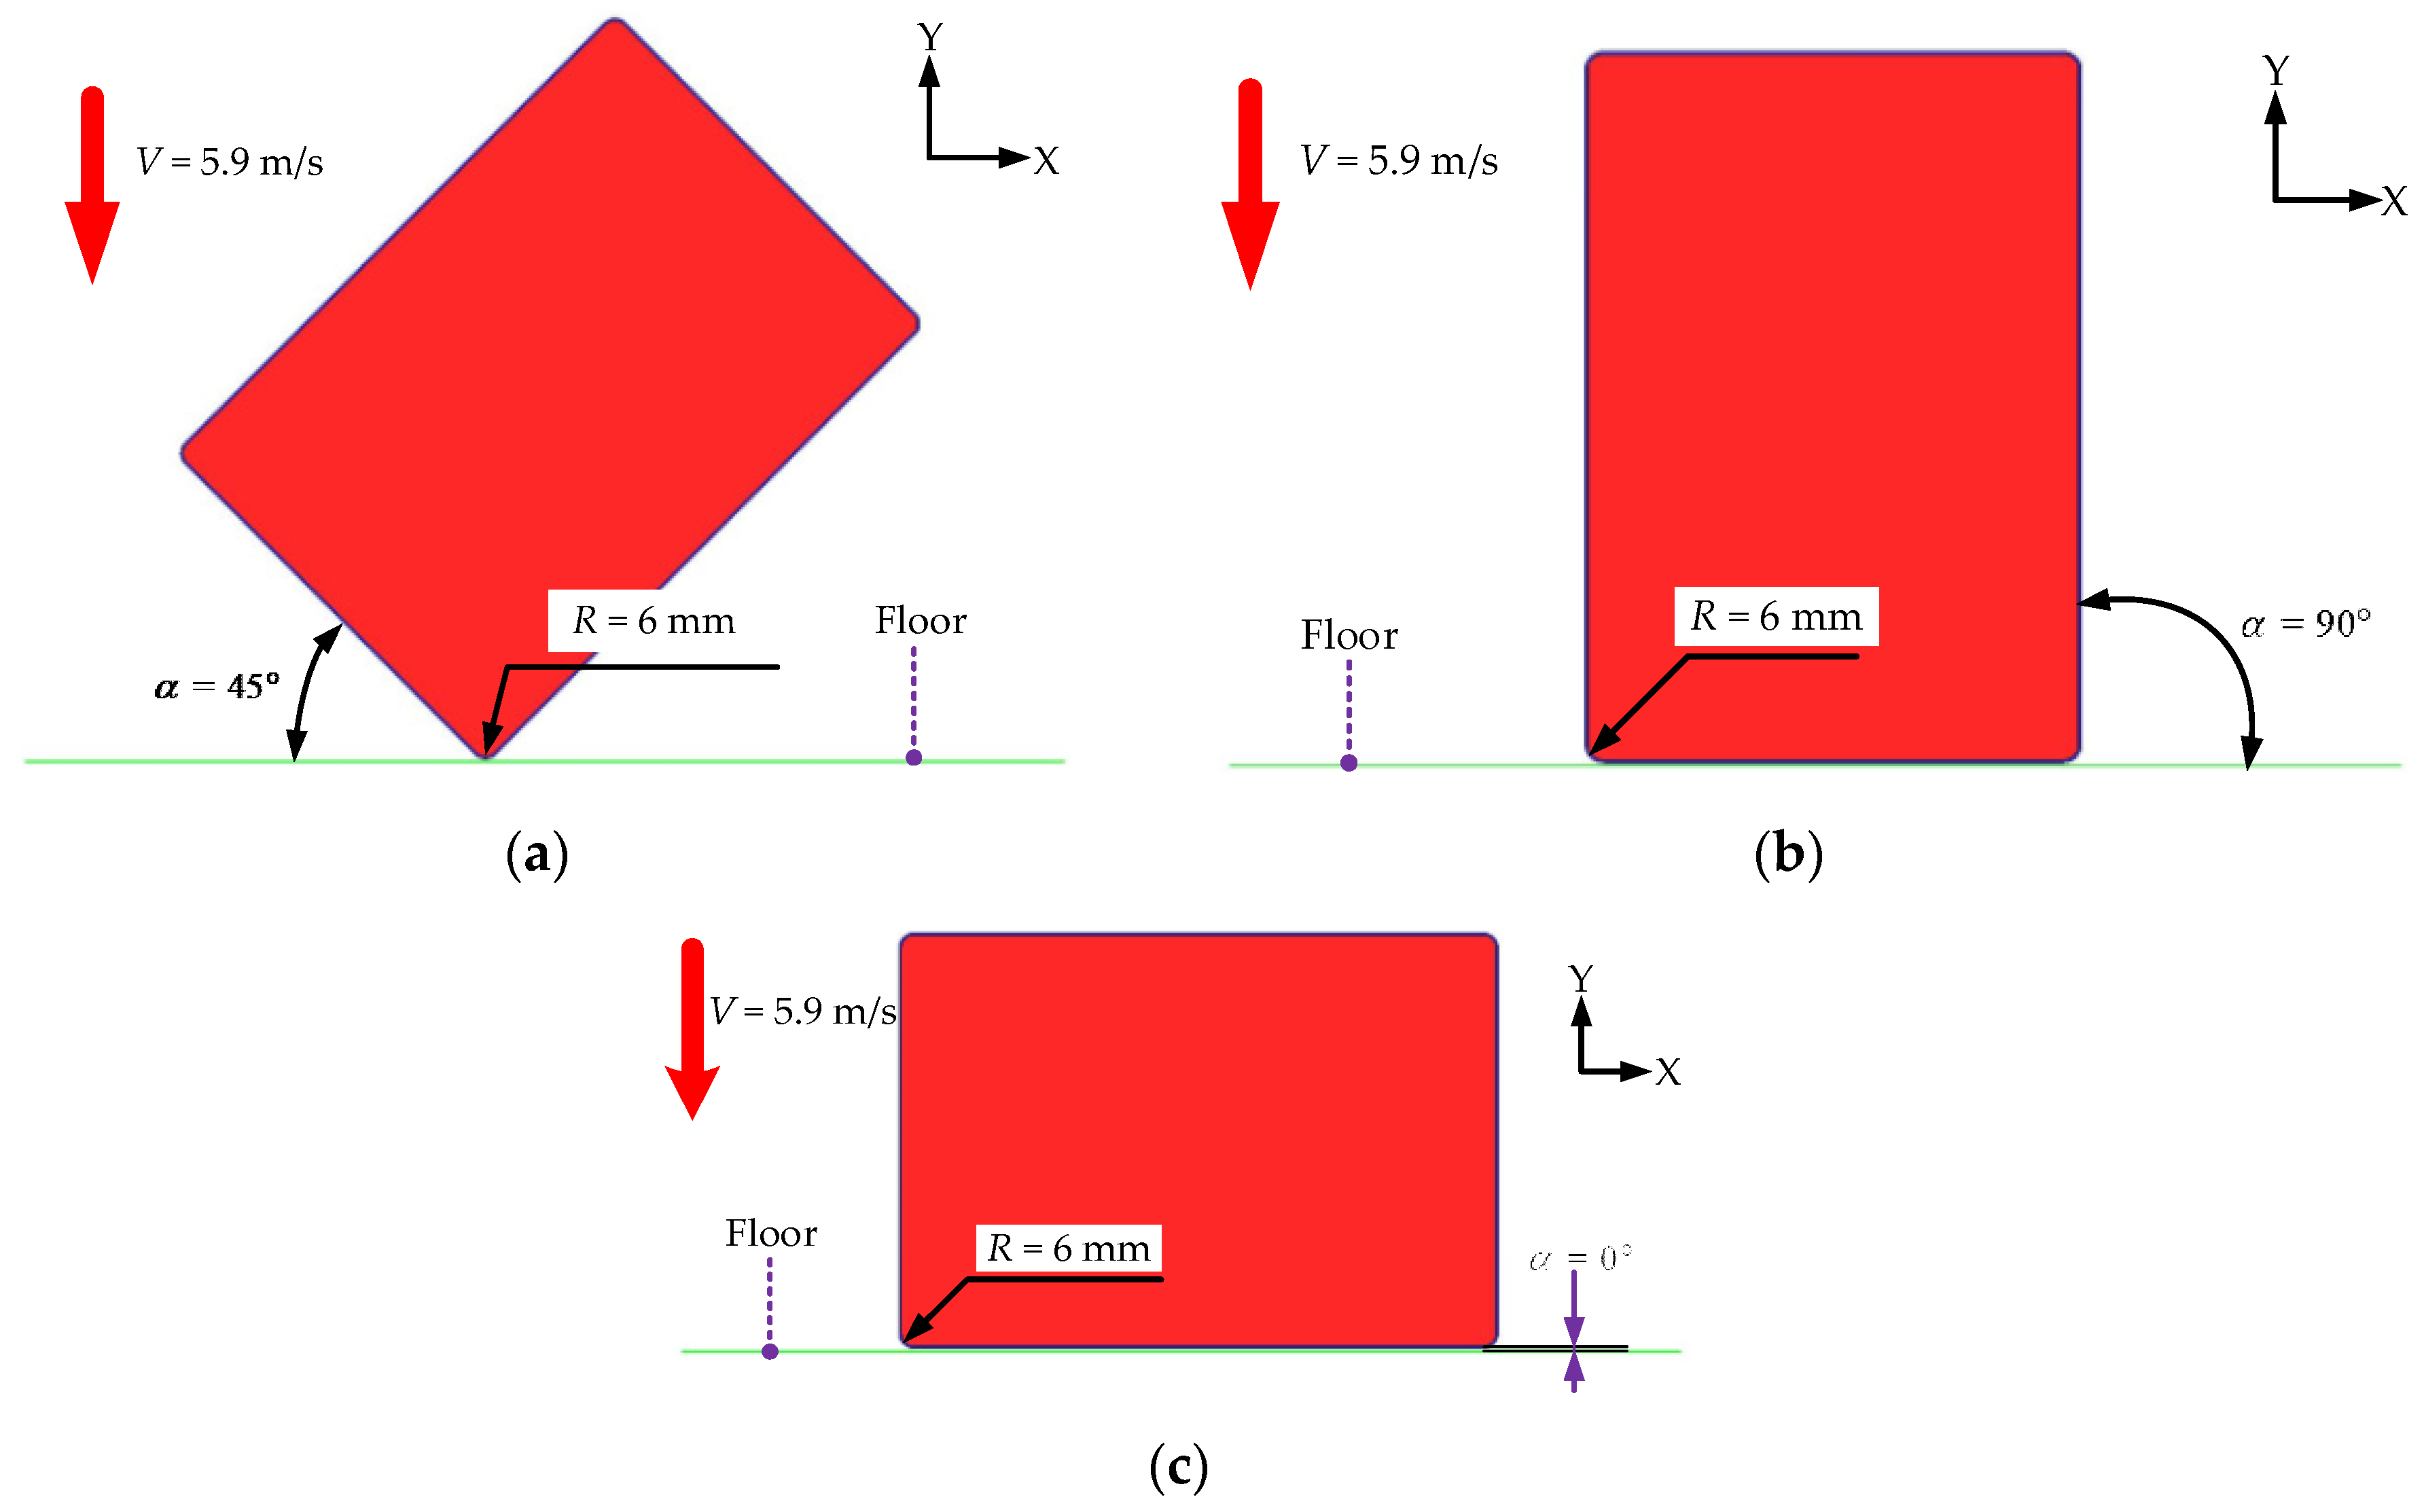
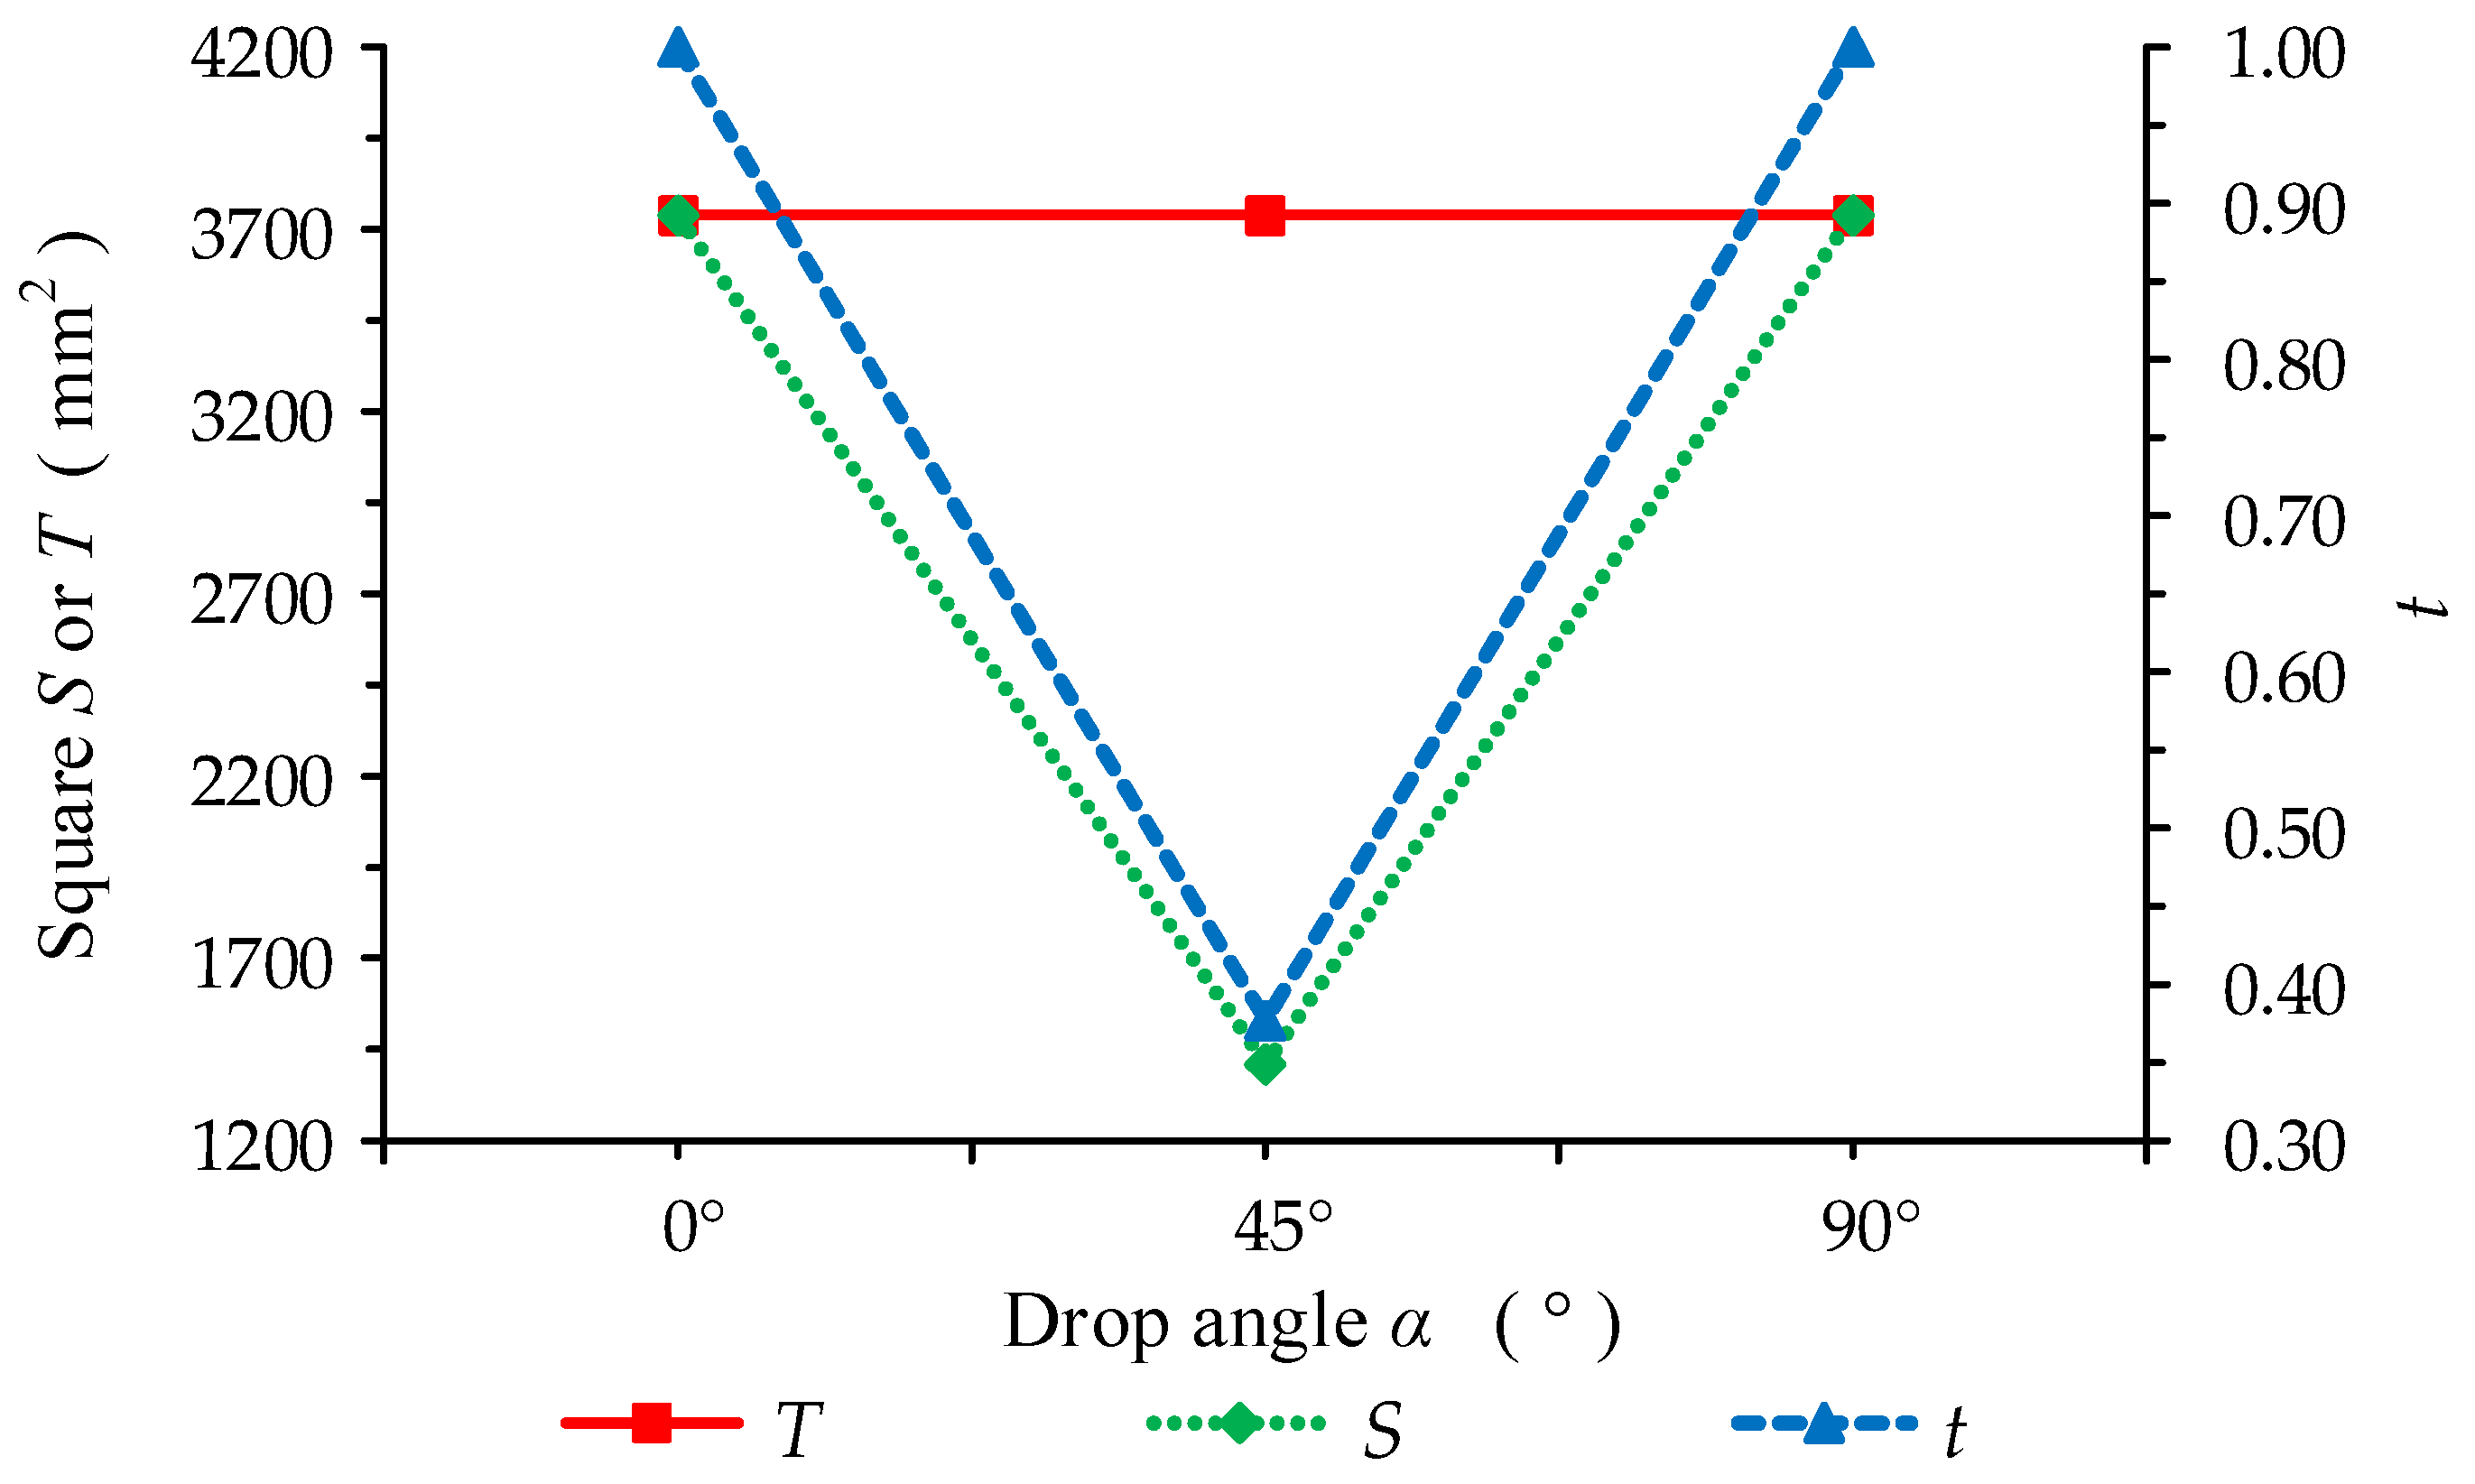
4.2. Effect of Dropping with Different Positions on Debonding in the XY Plane

The Air model drops to the floor at various angles in the XY plane, with varying contact areas and contact times with the floor, resulting in varying degrees of deformation of the outer case and outer glass, which affect the force on the cohesive element and thus the debonding of the Air model’s outer case and outer glass. As a result, the angles of the drop of the Air model in the XY plane with the floor are established as α = 0°, α = 45°, and α = 90°, respectively, as shown in Figure 15a–c. t characterizes the effect of different drop angles on the debonding between the outer case and outer glass of the Air model.
The total area of the cohesive elements, as well as the deleted cohesive elements, are measured and calculated via post-processing in order to better study the effect of different drop angles on the debonding between the outer case and outer glass of the Air model in the XY plane, and the results are shown in Table 5. To analyze the correlation trend between α and T, S, and t more intuitively, α, T, S, and t are plotted as a combined curve in Figure 16. The total area of cohesive elements, T, remains constant as α increases from 0° to 45° and then to 90°. The area of deleted cohesive elements, S, follows the same trend as t, decreasing and then increasing, with both t and S reaching their maximum at α = 0° and α = 90°. The von Mises stress of the screen is more significant when the mobile phone is dropped at 0° and 90°, which is consistent with the results of mobile phone drop tests performed by Hwan [1] and Hagara [7] et al. The minimum t and S are obtained at α = 45°, the maximum S is 3738.1 mm2, the maximum t is 1, and all cohesive elements are deleted. The minimum of t is 0.377 times the maximum of t. Under the same conditions, it can be concluded that the Air model with α = 45° has the smallest t, which is 0.377 times the t for α = 0° and α = 90°. As a result, when using mobile phones or tablets, it is critical to avoid dropping the device at an angle of 0° or 90° between the long side of the mobile phones or tablets and the floor.

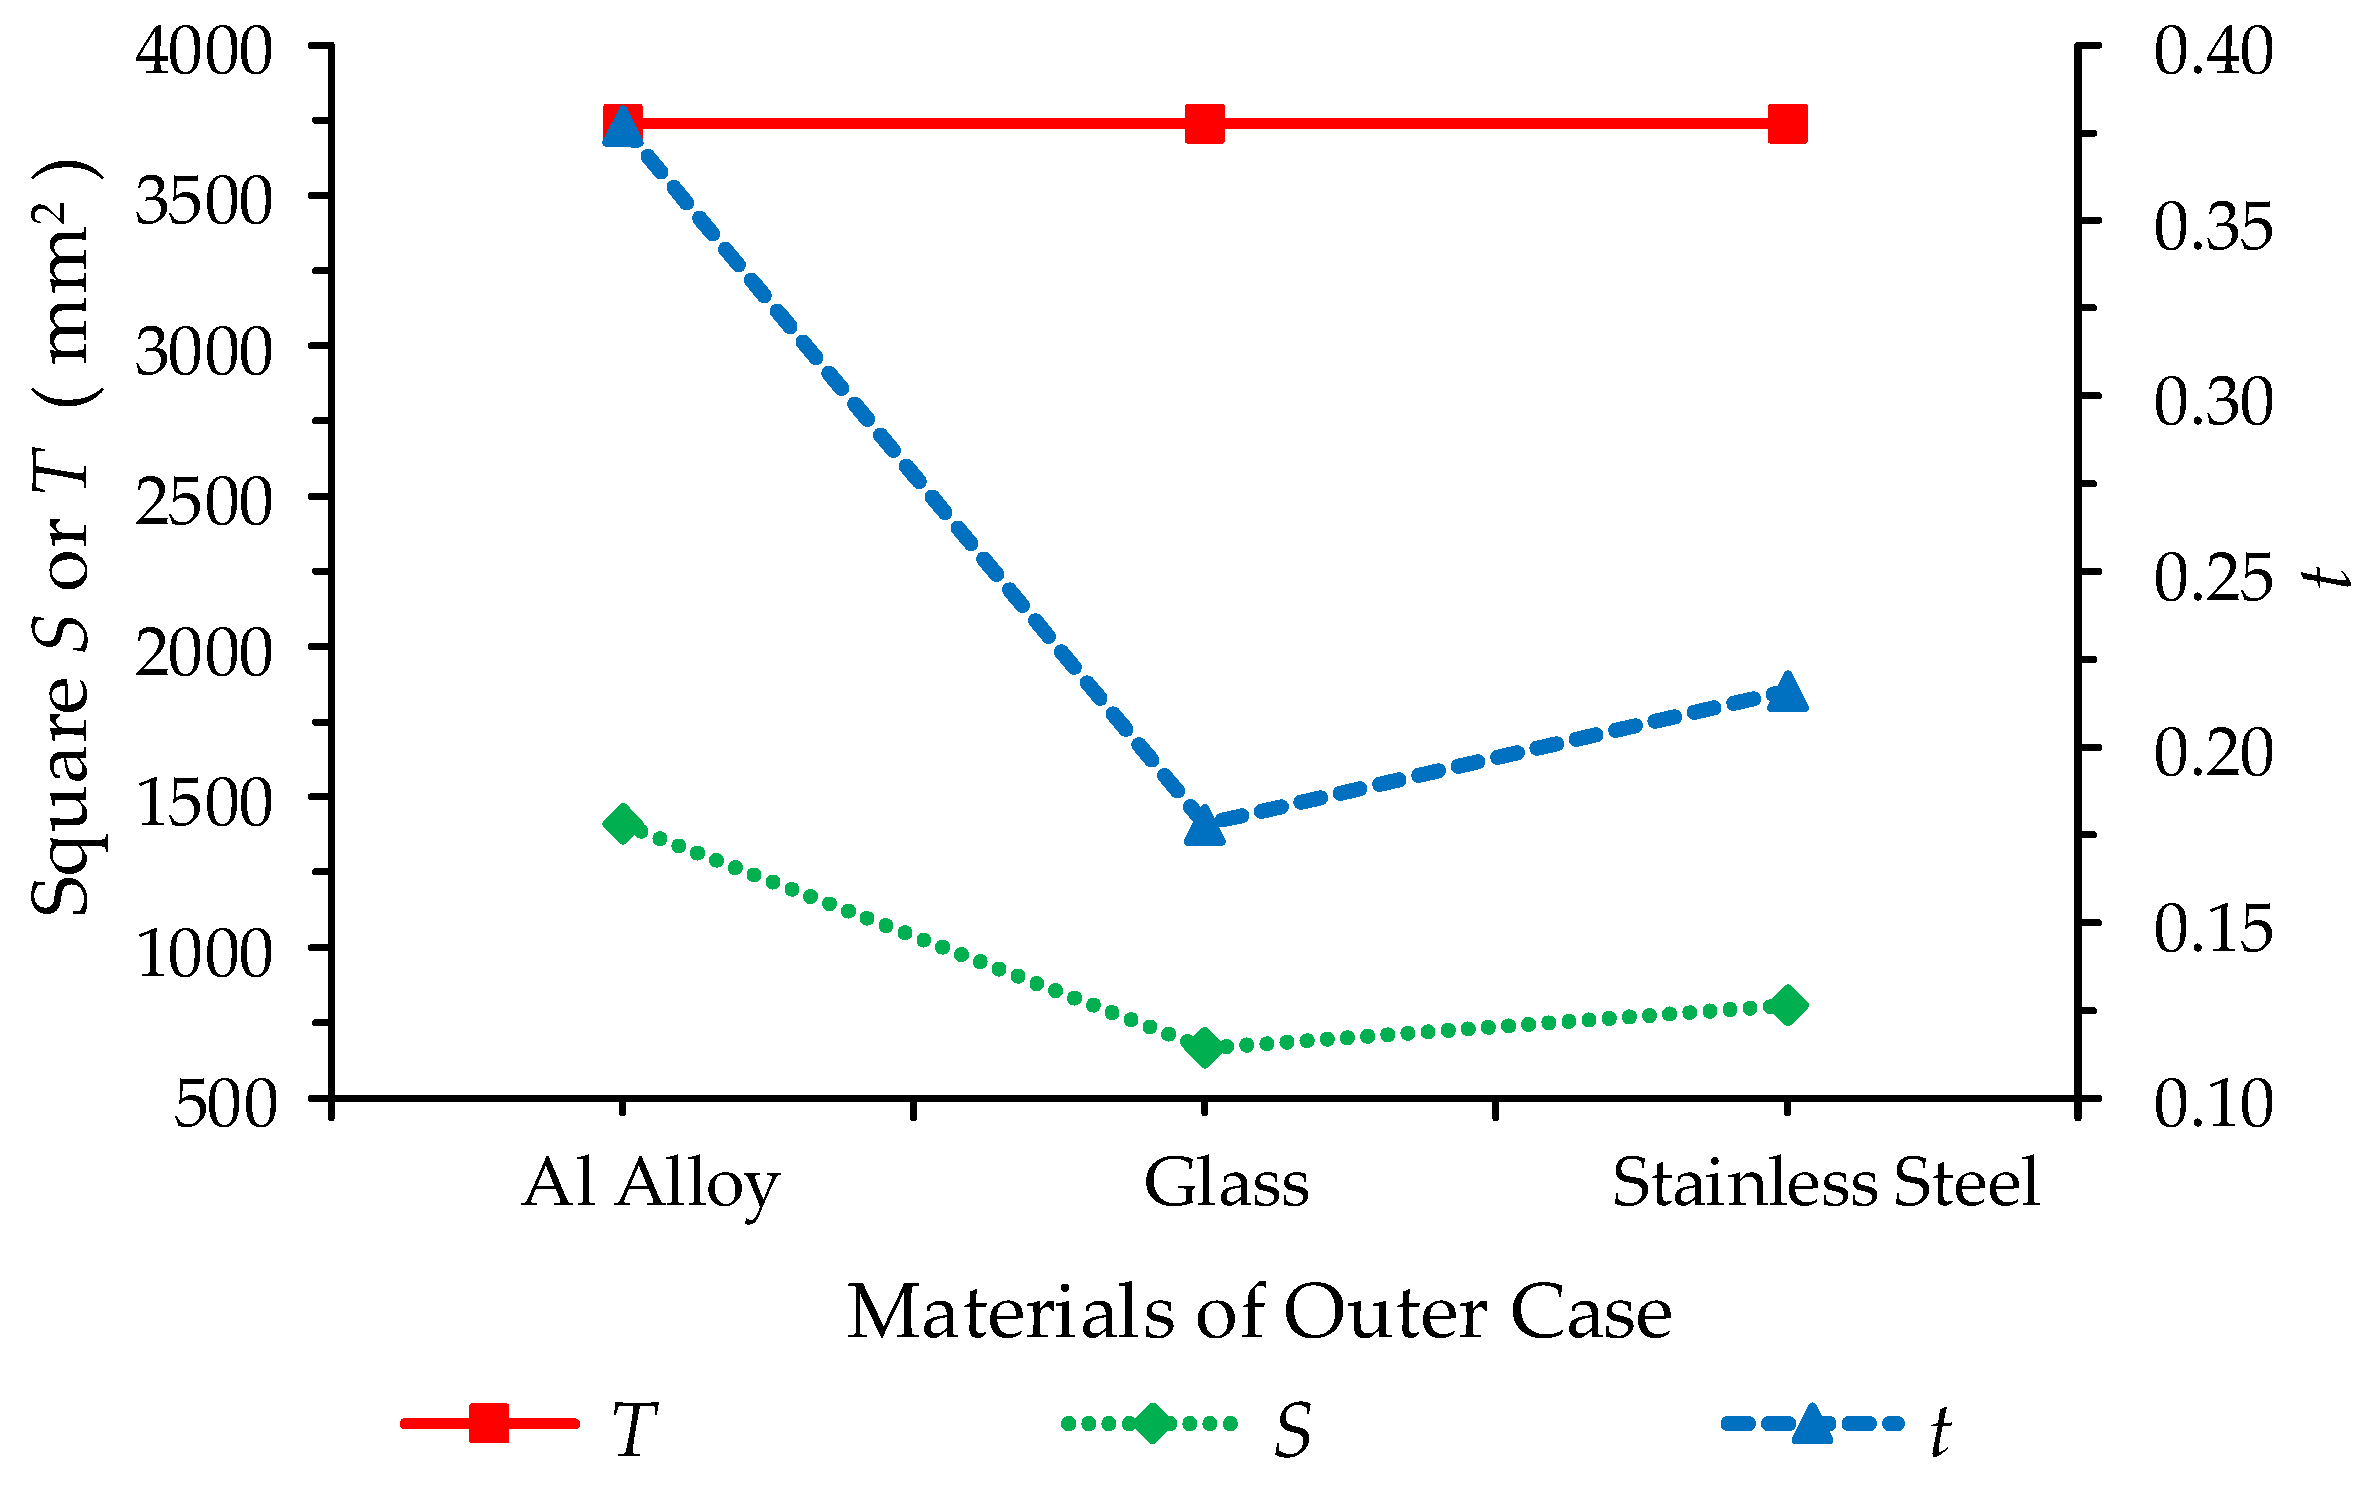
4.3. Effect of Various Materials of Outer Case on Debonding

According to a survey, different materials can be used for the cases of mobile phones, such as the iPhone 5 with a case of aluminum alloy, the Galaxy S6 with a case of glass, and the Galaxy S5 with a case of plastic (polycarbonate as the main ingredient) [44]. The Air can also use materials other than aluminum alloy for the outer case, such as glass and stainless steel, which have high yield strength and good wear resistance. As a result, as shown in Figure 15a, the outer case for the Air was made of aluminum alloy, glass, and stainless steel, with *MAT_PIECEWISE_LINEAR_PLASTICITY for glass and stainless steel and *MAT_SIMPLIFIED_JOHNSON_COOK for aluminum alloy [9,45,46]. Table 6 displays the material types and physical parameters that characterize the effect of different materials in the outer case on the debonding between the outer case and the outer glass of the Air model via t.
The total area of the cohesive elements, as well as the deleted cohesive elements, were measured and calculated via post-processing in order to better compare the effect of different materials of the outer case on the debonding between the outer case and outer glass of the Air model, and the results are shown in Table 7. To analyze the correlation trend between different materials of the outer case and T, S, and t more intuitively, the different materials of the outer case are plotted against T, S, and t as a combined curve shown in Figure 17. The total area of cohesive elements T remains constant as the material of the Air model’s outer case changes from aluminum alloy to glass to stainless steel, while the area of deleted cohesive elements S and t change in the same way, with both reaching a maximum when the material of the Air model’s outer case is aluminum alloy and a minimum when the material of the Air model’s outer case is glass. The minimum of t is 0.48 times the maximum. It can be concluded that when the outer case is glass, the Air model has a minor t, which is 0.48 times the t of the Air model for the aluminum alloy outer case under the same conditions. This conclusion is consistent with the fact that glass is frequently used as the case material for mobile phones and tablets due to stainless steel’s high density and heavy mass for the same volume, which makes it difficult to carry.

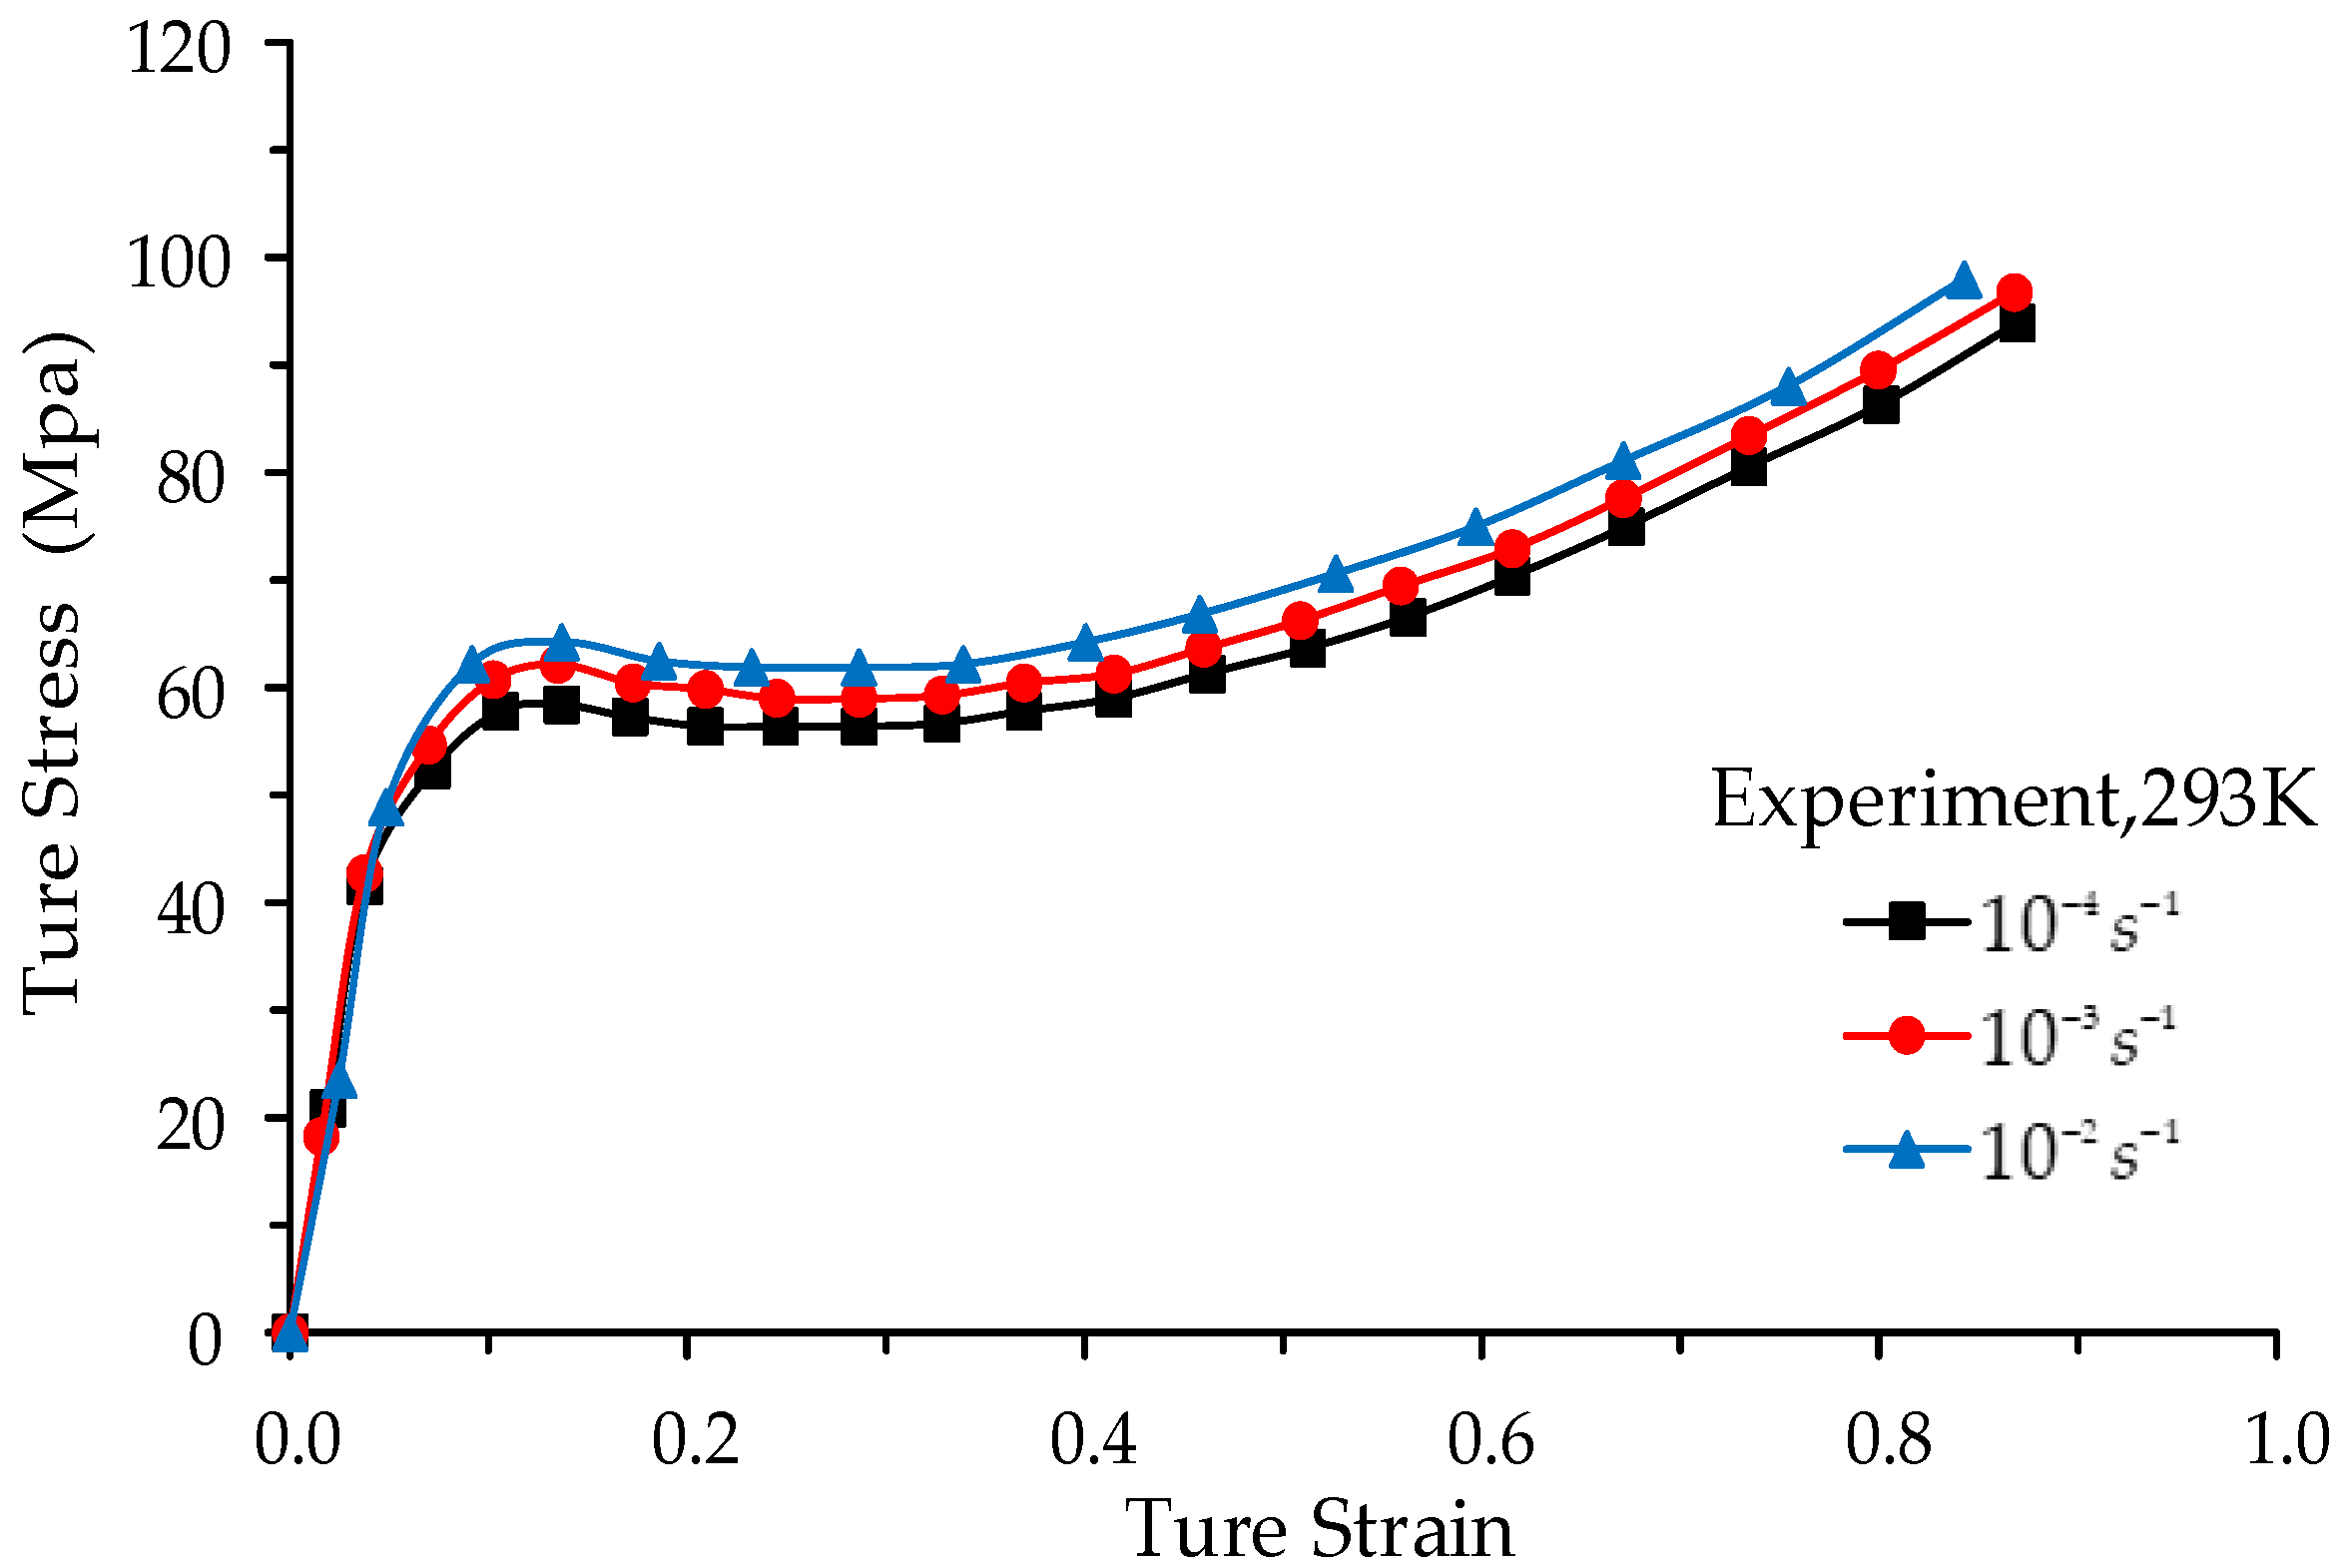
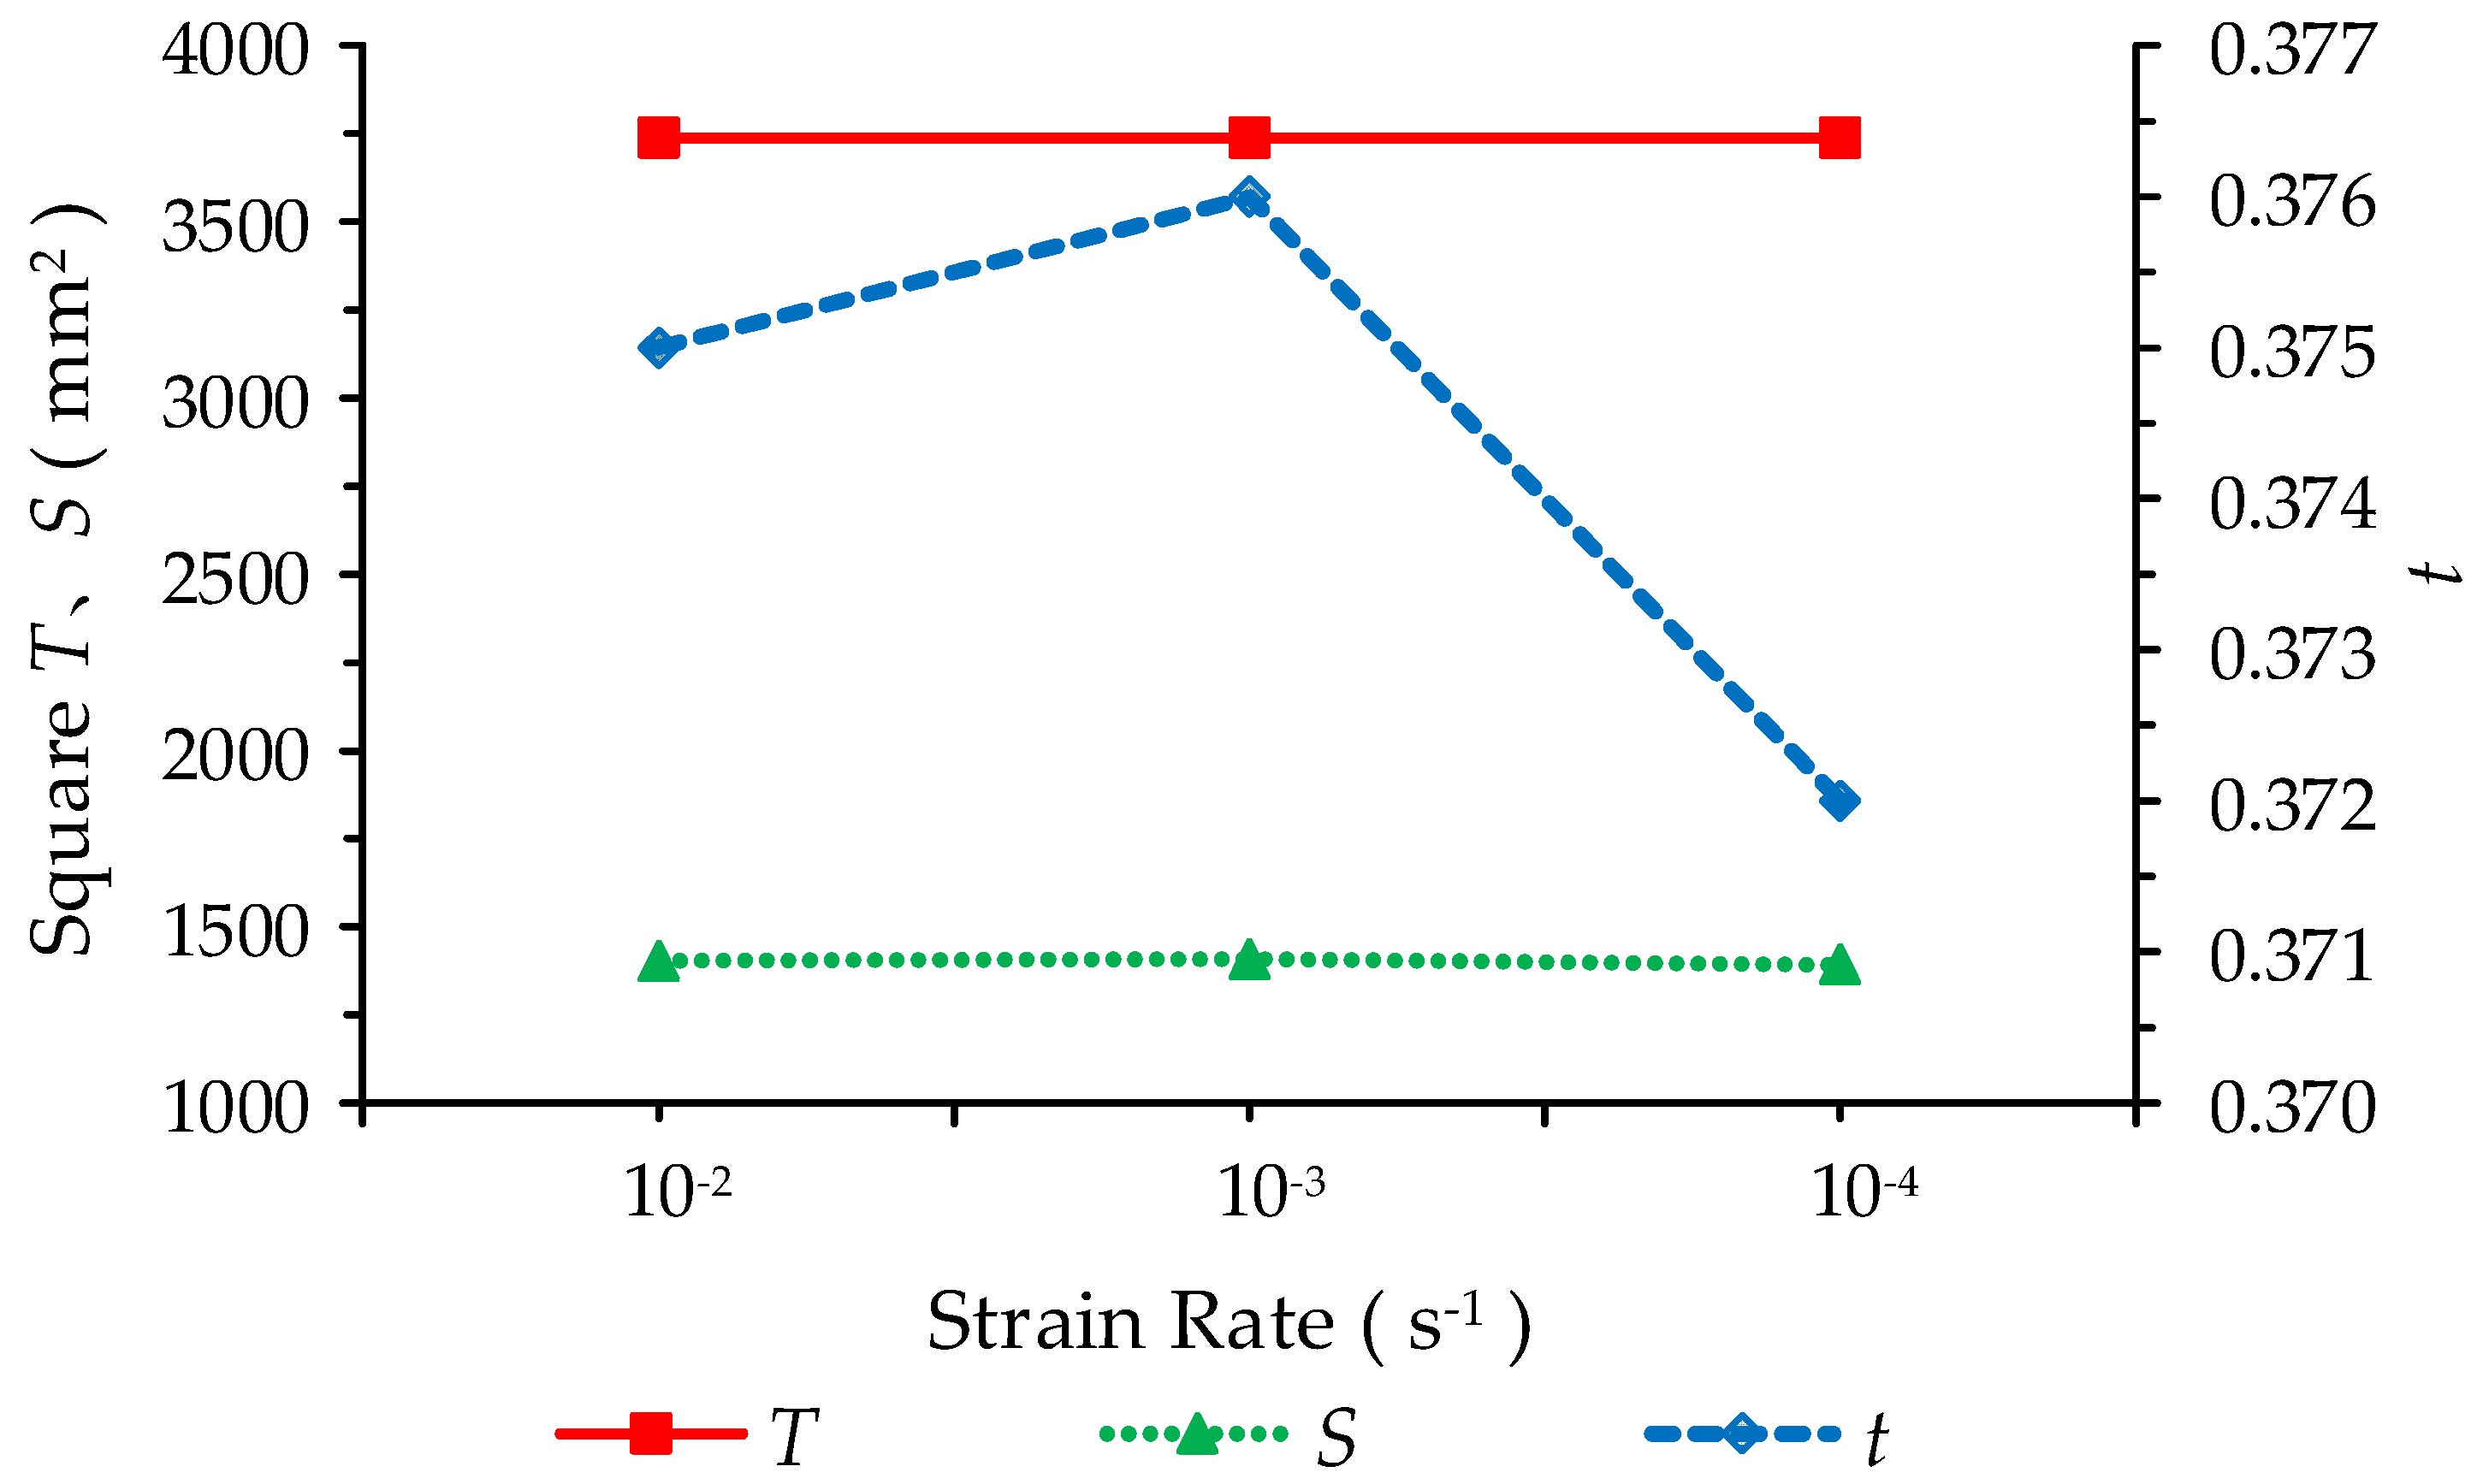
4.4. Effect of Debonding on Different Strain Rates of PC/ABS

As shown in Figure 18, PC/ABS corresponds to different stress–strain curves at different strain rates. The LCD plastic surround of the Air is made of PC/ABS, and the stress–strain characteristics of PC/ABS change the stress situation of the cohesive element, which affects the debonding between the outer case and outer glass of the Air model. As a result, as shown in Figure 15a, the effect of PC/ABS strain rate on debonding between the outer case and outer glass of the Air model must be investigated. Because the LCD plastic surround’s material model is *MAT_PIECEWISE_LINEAR_PLASTICITY, eight points can be entered to determine the stress–strain curve. The stress–strain curves in Figure 18 were used to select eight characteristic points with strain rates of 10−2 s−1, 10−3 s−1, and 10−4 s−1, respectively, and the characteristic points were entered into the *MAT_PIECEWISE_LINEAR_PLASTICITY material model, which was used to determine the strain rate of PC/ABS. t characterizes the effect of different PC/ABS strain rates on the debonding between the outer case and outer glass of the Air model.
To better compare the effect of PC/ABS strain rate on debonding between the outer case and outer glass of the Air model, the total area of the cohesive elements, as well as the deleted cohesive elements, were measured and calculated using post-processing and the results are shown in Table 8. To analyze the correlation trend of different strain rates of PC/ABS with T, S, and t more intuitively, the different strain rates of PC/ABS are plotted against T, S, and t as a combined curve in Figure 19. The total area of cohesive elements T remains constant as the strain rate decreases from 10−2 s−1 to 10−4 s−1. The total area of deleted cohesive elements S follows the same trend as the t-transformation, with the maximum and minimum obtained at strain rates of 10−3 s−1 and 10−4 s−1, respectively, with a difference of 0.004 between the t-maximum and t-minimum, indicating that the strain rate has a relatively small effect on t.

5. Conclusions

The cohesive zone model and tiebreak contact are used in this paper to simulate the local debonding between the outer case and outer glass of the Air model, respectively. The simulation results are compared to the experimental results, which show that the cohesive zone model is better suited than tiebreak contact for simulating the local debonding between the outer case and outer glass of the Air model. Finally, a parametric study is conducted, with the following results summarized:
(1)
Different Air model rounded corner radii and PC/ABS strain rates have less effect on debonding between the outer case and outer glass of the Air model; t has a maximum difference of 0.004 for the PC/ABS strain rate from 10−2 s−1 to 10−4 s−1, and t has a maximum difference of 0.076 for the increase in R from 6 mm to 12 mm.
(2)
The Air model drops in the XY plane at various angles, and different outer case materials have a greater effect on the debonding of the Air model’s outer case and outer glass. When the Air model is dropped at α = 45°, t is the smallest, 0.377 times that of the Air model dropped at α = 0° or α = 90°; when the Air model’s outer case material is glass, t is the smallest, 0.48 times that of the Air model with an aluminum alloy outer case.
In this paper, we focus on the cohesive zone model’s capability in failure analysis and factors influencing debonding between the outer case and outer glass of the Air. In the future, more emphasis should be placed on the development of new materials with improved adhesive properties and impact energy absorption, which will aid in the protection of Air tablets.

Author Contributions

Conceptualization, Z.Z. and D.W.; methodology, Z.Z.; software, Z.Z., X.J. and F.M.; validation, Z.Z., X.J. and D.W.; formal analysis, Z.Z.; investigation, Z.Z.; resources, Z.Z.; data curation, Z.Z.; writing—original draft preparation, Z.Z.; writing—review and editing, D.W.; visualization, Z.Z., X.J., and F.M.; supervision, D.W.; project administration, D.W.; funding acquisition, D.W. All authors have read and agreed to the published version of the manuscript.

Funding

This research was funded by the Natural Science Foundation of the Xinjiang Uygur Autonomous Region (No. 2021D01C115).

Institutional Review Board Statement

Not applicable.

Informed Consent Statement

Not applicable.

Data Availability Statement

Not applicable.

Conflicts of Interest

We declare no conflict of interest.

References

  1. Hwan, C.-L.; Lin, M.-J.; Lo, C.-C.; Chen, W.-L. Drop tests and impact simulation for cell phones. J. Chin. Inst. Eng. 2011, 34, 337–346. [Google Scholar] [CrossRef]
  2. Liu, Z.; Shi, L.; Chen, Z.; Zhu, W. Effect of design factors of a mobile phone on the reliability risks of on-board packages under product-level drop conditions. In Proceedings of the 2020 21st International Conference on Electronic Packaging Technology (ICEPT), Guangzhou, China, 12–15 August 2020; pp. 1–5. [Google Scholar]
  3. Gorelchenko, P.; Zhang, B.; Hu, G. Cover glass behavior in handheld device drop: Modeling; validation and design evaluation. In Proceedings of the 2016 IEEE Accelerated Stress Testing & Reliability Conference (ASTR), Pensacola Beach, FL, USA, 28–30 September 2016; pp. 1–7. [Google Scholar]
  4. Liu, Z.; Fang, M.; Shi, L.; Chen, Z.; Li, J.; Long, H.; Zhu, W. Numerical and Experimental Analyses of Component Failure Risk in a Mobile Phone Under Drop Test. IEEE Trans. Compon. Packag. Manuf. Technol. 2022, 12, 69–79. [Google Scholar] [CrossRef]
  5. Zhang, B.; Gorelchenko, P.; Hu, G. A study of 3D cover glass design that improves handheld device drop reliability. J. Soc. Inf. Disp. 2016, 24, 721–725. [Google Scholar] [CrossRef]
  6. Akano, T.T.; Olayiwola, P.S. Numerical Investigation into the Effect of Laminated Casing on the Impact Resistance of Smartphone Screens. Comput. Eng. Phys. Model. 2019, 2, 58–77. [Google Scholar]
  7. Hagara, M.; Huňady, R.; Lengvarský, P.; Bocko, J. The Methodology for Realization of Smartphone Drop Test Using Digital Image Correlation. Am. J. Mech. Eng. 2016, 4, 423–428. [Google Scholar]
  8. Cao, Z.; Li, W.; Chen, Z.; Wang, F.; Shang, W. Free-drop simulation and analysis of Full-screen smartphone based on ABAQUS/CAE. J. Phys. Conf. Ser. 2021, 1786, 012015. [Google Scholar] [CrossRef]
  9. Hughes, K.; Vignjevic, R.; Corcoran, F.; Gulavani, O.; De Vuyst, T.; Campbell, J.; Djordjevic, N. Transferring momentum: Novel drop protection concept for mobile devices. Int. J. Impact Eng. 2018, 117, 85–101. [Google Scholar] [CrossRef]
  10. Jang, J.; Sung, M.; Han, S.; Yu, W.-R. Prediction of delamination of steel-polymer composites using cohesive zone model and peeling tests. Compos. Struct. 2017, 160, 118–127. [Google Scholar] [CrossRef]
  11. Pisavadia, H.; Toussaint, G.; Dolez, P.; Hogan, J.D. Cohesive zone failure modeling of polymeric adhesives used in ceramic/metal armor. Int. J. Impact Eng. 2022, 170, 104364. [Google Scholar] [CrossRef]
  12. Shen, Y.; Wang, Y.; Du, S.; Yang, Z.; Cheng, H.; Wang, F. Effects of the adhesive layer on the multi-hit ballistic performance of ceramic/metal composite armors. J. Mater. Res. Technol. 2021, 13, 1496–1508. [Google Scholar] [CrossRef]
  13. Xu, Y.; Guo, Y.; Liang, L.; Liu, Y.; Wang, X. A unified cohesive zone model for simulating adhesive failure of composite structures and its parameter identification. Compos. Struct. 2017, 182, 555–565. [Google Scholar] [CrossRef]
  14. Fang, H.; Wang, D. Simulation Analysis of Delamination Damage for the Thick-Walled Composite-Overwrapped Pressure Vessels. Materials 2022, 15, 6880. [Google Scholar] [CrossRef] [PubMed]
  15. Dogan, F.; Hadavinia, H.; Donchev, T.; Bhonge, P. Delamination of impacted composite structures by cohesive zone interface elements and tiebreak contact. Open Eng. 2012, 2, 612–626. [Google Scholar] [CrossRef]
  16. Mukherjee, B.; Dillard, D.A.; Moore, R.B.; Batra, R.C. Debonding of confined elastomeric layer using cohesive zone model. Int. J. Adhes. Adhes. 2016, 66, 114–127. [Google Scholar] [CrossRef]
  17. Guo, D.; Zhou, H.; Wang, H.-P.; Dai, J.-G. Effect of temperature variation on the plate-end debonding of FRP-strengthened steel beams: Coupled mixed-mode cohesive zone modeling. Eng. Fract. Mech. 2022, 270, 108583. [Google Scholar] [CrossRef]
  18. Ye, J.; Yan, Y.; Li, J.; Hong, Y.; Tian, Z. 3D explicit finite element analysis of tensile failure behavior in adhesive-bonded composite single-lap joints. Compos. Struct. 2018, 201, 261–275. [Google Scholar] [CrossRef]
  19. Sy, B.L.; Fawaz, Z.; Bougherara, H. Numerical simulation correlating the low velocity impact behaviour of flax/epoxy laminates. Compos. Part A Appl. Sci. Manuf. 2019, 126, 105582. [Google Scholar] [CrossRef]
  20. Wang, J.; Bihamta, R.; Morris, T.P.; Pan, Y.-C. Numerical and Experimental Investigation of a Laminated Aluminum Composite Structure. Appl. Compos. Mater. 2019, 26, 1177–1188. [Google Scholar] [CrossRef]
  21. McGregor, C.; Zobeiry, N.; Vaziri, R.; Poursartip, A.; Xiao, X. Calibration and validation of a continuum damage mechanics model in aid of axial crush simulation of braided composite tubes. Compos. Part A Appl. Sci. Manuf. 2017, 95, 208–219. [Google Scholar] [CrossRef]
  22. Barenblatt, G. The formation of equilibrium cracks during brittle fracture. General ideas and hypotheses. Axially-symmetric cracks. J. Appl. Math. Mech. 1959, 23, 622–636. [Google Scholar] [CrossRef]
  23. Dugdale, D.S. Yielding of steel sheets containing slits. J. Mech. Phys. Solids 1960, 8, 100–104. [Google Scholar] [CrossRef]
  24. Lin, D.; Wang, D.; Chen, S.; Zang, M. Numerical simulations of impact fracture behavior of an automotive windshield glazing: An intrinsic cohesive approach. Compos. Struct. 2018, 186, 79–93. [Google Scholar] [CrossRef]
  25. Gao, W.; Xiang, J.; Chen, S.; Yin, S.; Zang, M.; Zheng, X. Intrinsic cohesive modeling of impact fracture behavior of laminated glass. Mater. Des. 2017, 127, 321–335. [Google Scholar] [CrossRef]
  26. Benzeggagh, M.L.; Kenane, M. Measurement of mixed-mode delamination fracture toughness of unidirectional glass/epoxy composites with mixed-mode bending apparatus. Compos. Sci. Technol. 1996, 56, 439–449. [Google Scholar] [CrossRef]
  27. Livermore Software Technology. Tie-Break Contacts in LS-DYNA. Available online: https://www.d3view.com/tiebreak-contact-in-ls-dyna (accessed on 4 September 2007).
  28. Livermore Software Technology. LS-DYNA® Keywords User’s Manual; LS-DYNA R13; Livermore Software Technology: Livermore, CA, USA, 2021. [Google Scholar]
  29. Jayakumar, S.; Hajdarevic, A.; Anand, S.; Fang, X. Experimental and FE analyses of the crushing and bending behaviors of GMT and hybrid-formed Al-GMT structures. Thin-Walled Struct. 2023, 186, 110648. [Google Scholar] [CrossRef]
  30. Liping, Z. Modeling technique for reliability assessment of portable electronic product subjected to drop impact loads. In Proceedings of the 53rd Electronic Components and Technology Conference, New Orleans, LA, USA, 27–30 May 2003; pp. 100–104. [Google Scholar]
  31. Freed, Y.; Salviato, M.; Zobeiry, N. Implementation of a probabilistic machine learning strategy for failure predictions of adhesively bonded joints using cohesive zone modeling. Int. J. Adhes. Adhes. 2022, 118, 103226. [Google Scholar] [CrossRef]
  32. Fernando, D.; Yu, T.; Teng, J.G. Behavior of CFRP Laminates Bonded to a Steel Substrate Using a Ductile Adhesive. J. Compos. Constr. 2014, 18, 04013040. [Google Scholar] [CrossRef]
  33. Wang, Z.; Xian, G. Cohesive zone model prediction of debonding failure in CFRP-to-steel bonded interface with a ductile adhesive. Compos. Sci. Technol. 2022, 230, 109315. [Google Scholar] [CrossRef]
  34. Peng, X.; Yong, H.; Zhang, X.; Zhou, Y. Analysis of delamination and heat conductivity of epoxy impregnated pancake coils using a cohesive zone model. Eng. Fract. Mech. 2021, 245, 107555. [Google Scholar] [CrossRef]
  35. Fang, Q.-Z.; Wang, T.; Beom, H.; Li, H. Effect of cyclic loading on tensile properties of PC and PC/ABS. Polym. Degrad. Stab. 2008, 93, 1422–1432. [Google Scholar] [CrossRef]
  36. Mura, A.; Adamo, F.; Wang, H.; Leong, W.S.; Ji, X.; Kong, J. Investigation about tribological behavior of ABS and PC-ABS polymers coated with graphene. Tribol. Int. 2019, 134, 335–340. [Google Scholar] [CrossRef]
  37. Pandouria, A.K.; Kumar, S.; Tiwari, V. Determination of static and dynamic fracture initiation toughness and numerical simulation of dynamic 3-point bend experiments of Al6063-T6. Mech. Res. Commun. 2023, 128, 104070. [Google Scholar] [CrossRef]
  38. Xu, X.; Liu, B.; Li, Y. Investigation on Dynamic Propagation Characteristics of In-Plane Cracks in PVB Laminated Glass Plates. Adv. Mater. Sci. Eng. 2016, 2016, 4082926. [Google Scholar] [CrossRef]
  39. Chen, C.; Wang, X.; Hou, H.; Cheng, Y.; Zhang, P.; Liu, J. Effect of strength matching on failure characteristics of polyurea coated thin metal plates under localized air blast loading: Experiment and numerical analysis. Thin-Walled Struct. 2020, 154, 106819. [Google Scholar] [CrossRef]
  40. Chakherlou, T.; Razavi, M.; Abazadeh, B. Finite element investigations of bolt clamping force and friction coefficient effect on the fatigue behavior of aluminum alloy 2024-T3 in double shear lap joint. Eng. Fail. Anal. 2013, 29, 62–74. [Google Scholar] [CrossRef]
  41. Panait, A.; He, Q.-C.; Saada, R.A.; Bary, B.; Cossavella, M.; Morcant, K. Experimental investigation of the time-dependent dry frictional behaviour of glass and aluminium. Wear 2004, 257, 271–278. [Google Scholar] [CrossRef]
  42. Suhr, B.; Six, K. On the effect of stress dependent interparticle friction in direct shear tests. Powder Technol. 2016, 294, 211–220. [Google Scholar] [CrossRef]
  43. Yu, G.-C.; Wu, L.-Z.; Ma, L.; Xiong, J. Low velocity impact of carbon fiber aluminum laminates. Compos. Struct. 2015, 119, 757–766. [Google Scholar] [CrossRef]
  44. Setyobudi, R.H.; Gan, S.S.; Anggono, J.; Wahjudi, D.; Tanoto, Y.; Randy; Hutasoit, N.; Suprianto, F.D.; Mel, M.; Anne, O.; et al. A Feasibility Study of Mobile Phone Casings Remanufacturing. In E3S Web of Conferences; EDP Sciences: Les Ulis, France, 2019; Volume 130. [Google Scholar]
  45. Liu, B.; Xu, T.; Xu, X.; Wang, Y.; Sun, Y.; Li, Y. Energy absorption mechanism of polyvinyl butyral laminated windshield subjected to head impact: Experiment and numerical simulations. Int. J. Impact Eng. 2016, 90, 26–36. [Google Scholar] [CrossRef]
  46. Zhang, Y.; Zhou, Y. Investigation of bird-strike resistance of composite sandwich curved plates with lattice/foam cores. Thin-Walled Struct. 2023, 182, 110203. [Google Scholar] [CrossRef]
  47. Gao, Y.; Wu, Q.; Wei, X.; Zhou, Z.; Xiong, J. Composite tree-like re-entrant structure with high stiffness and controllable elastic anisotropy. Int. J. Solids Struct. 2020, 206, 170–182. [Google Scholar] [CrossRef]
  48. Zheng, C.; Yu, W. Effect of low-temperature on mechanical behavior for an AISI 304 austenitic stainless steel. Mater. Sci. Eng. A 2018, 710, 359–365. [Google Scholar] [CrossRef]
  49. Wang, H.; Zhou, H.; Huang, Z.; Zhang, Y.; Qiao, H.; Yu, Z. Experimental investigation and modeling of the mechanical behavior of PC/ABS during monotonic and cyclic loading. Polym. Test. 2016, 50, 216–223. [Google Scholar] [CrossRef]
Figure 1. (a) Mixed-mode traction-separation law; (b) The bilinear cohesive zone model.
Sustainability 15 13475 g001
Figure 2. The tiebreak contact algorithm schematic diagram.
Sustainability 15 13475 g002
Figure 3. Air model enhanced view [9].
Sustainability 15 13475 g003
Figure 4. (a) Air finite element model; (b) Definition of the outer glass local coordinate system XZ; (c) Local refinement of the rounded corners of the outer case.
Sustainability 15 13475 g004
Figure 5. Definition of accelerometer (65 mm above Apple™ logo) [9].
Sustainability 15 13475 g005
Figure 6. (a) Cohesive element simulating cracking; (b) Cohesive element inserted between the outer glass and outer case.
Sustainability 15 13475 g006
Figure 7. Failure modes from a 1.8 m Air drop onto steel. Damage includes plastic deformation and partial glass debonding: (a) Experiment [9], (b) Cohesive zone model, and (c) Tiebreak contact.
Sustainability 15 13475 g007
Figure 8. The cohesive zone model, the tiebreak contact, and the experimental resultant acceleration time course curves [9].
Sustainability 15 13475 g008
Figure 9. Air model with three different mesh sizes: (a) D1, (b) D2, and (c) D3.
Sustainability 15 13475 g009
Figure 10. The acceleration time course curves for the Air model with different grid sizes for the cohesive zone model [9].
Sustainability 15 13475 g010
Figure 11. The acceleration time course curves for the Air model with different grid sizes for the tiebreak contact [9].
Sustainability 15 13475 g011
Figure 12. Displacement clouds of Air at (a) 0.50 ms, (b) 0.60 ms, (c) 0.80 ms, and (d) 1.00 ms for the outer glass and outer case along the z-direction.
Sustainability 15 13475 g012
Figure 13. Air model with rounded corner radii of (a) 6 mm, (b) 8 mm, (c) 10 mm, and (d) 12 mm.
Sustainability 15 13475 g013aSustainability 15 13475 g013b
Figure 14. Combined curves of R with T, S, and t.
Sustainability 15 13475 g014
Figure 15. The Air model in the XY plane, free fall, and the angle of the floor are (a) α = 45°, (b) α = 90°, and (c) α = 0°.
Sustainability 15 13475 g015
Figure 16. Combined curves of α with T, S, and t.
Sustainability 15 13475 g016
Figure 17. Combination curves of the Air model with different materials used for the outer case, T, S, and t.
Sustainability 15 13475 g017
Figure 18. Stress–strain curves of PC/ABS at different strain rates [49].
Sustainability 15 13475 g018
Figure 19. Combined curves of different strain rates of PC/ABS with T, S, and t.
Sustainability 15 13475 g019
Table 1. Element type, average element size, and the number of elements for each component of the Air.
ComponentsElement TypeElement Average Size (mm)Element Number
Outer caseImpactor CornerSOLID0.97536,885
Main Case1.5
Outer glassImpactor CornerSOLID0.97518,499
Main Glass1.5
PCBTSHELL3.3751260
BatteriesSOLID3.3752016
LCD metal trayTSHELL3.04015
LCD plastic surroundSHELL1.56984
LCD glassSOLID1.513,200
Speaker(s)SOLID3.0198
Rigid floorSHELL4.516,198
Accelerometer---
Total--99,255
Table 2. Material models and physical parameters of the Air model [9,35,36,37,38].
ComponentsMaterials ModelDensity (kg/m3)Youngs’ Modulus (GPa)Poisson’s RatioYield Stress (Mpa)
Outer caseMAT0982700 [37]70.2 [37]0.33-
PCBMAT024270070.20.34156.3 [37]
BatteriesMAT024270070.20.33156.3
LCD matel trayMAT0017800210.00.33-
LCD plastic surroundMAT0241150 [36]2.20.4457.77 [35]
LCD glassMAT0012500 [38]72.0 [38]0.22-
Speaker(s)MAT024270070.20.34156.3
Outer glassMAT001250072.00.22-
Rigid floorMAT0207800210.00.33-
Table 3. Friction coefficient of different materials [40,41,42,43].
MaterialsFriction Coefficient
Aluminum Alloy–Aluminum Alloy0.40 [40]
Aluminum Alloy–Steel0.17 [43]
Glass–Glass0.20 [42]
Glass–Steel0.13 [42]
Aluminum Alloy–Glass0.25 [41]
Table 4. The area of deleted cohesive elements and total area of cohesive elements for the Air model with different radii of rounded corners.
The Radius of Corner R (mm)Total Area of Cohesive Element T (mm2)The Area of Deleted Cohesive Element S (mm2)t
63738.11410.80.377
83717.51434.90.386
103690.01672.60.453
123655.71507.70.412
Table 5. The area of deleted cohesive elements and total area of cohesive elements for different drop angles of the Air model.
Different Drop Angles α (°)Total Area
of Cohesive Element T (mm2)
The Area of Deleted Cohesive Element S (mm2)t
3738.13738.11.000
45°3738.11410.80.377
90°3738.13738.11.000
Table 6. Material model and physical parameters of the Air model’s outer case [9,37,38,45,47,48].
Materials of the Outer CaseMaterial ModelsDensity
(kg/m3)
Youngs’ Modulus (GPa)Poisson’s RatioYield Stress (Mpa)
Aluminum AlloyMAT982700 [37]70.2 [37]0.33 [9]-
GlassMAT242500 [38]72.0 [38]0.22 [9]143.2 [45]
Stainless SteelMAT247930 [47]196.0 [47]0.33 [47]263.0 [48]
Table 7. The area of deleted cohesive elements and the total area of cohesive elements for the Air model with different materials used for the outer case.
Materials of the Outer CaseTotal Area
of Cohesive Element T (mm2)
The area of Deleted Cohesive Element S (mm2)t
Aluminum Alloy3738.11410.80.377
Glass3738.1666.10.178
Stainless Steel3738.1808.70.216
Table 8. The area of deleted cohesive elements and the total area of cohesive elements for the PC/ABS with different strain rates.
The Strain Rate of PC/ABS (s−1)Total Area
of Cohesive Element T (mm2)
The Area of Deleted Cohesive Element S (mm2)t
10−23738.11403.00.375
10−33738.11408.50.376
10−43738.11392.00.372
Disclaimer/Publisher’s Note: The statements, opinions and data contained in all publications are solely those of the individual author(s) and contributor(s) and not of MDPI and/or the editor(s). MDPI and/or the editor(s) disclaim responsibility for any injury to people or property resulting from any ideas, methods, instructions or products referred to in the content.

