Article

Impacts of Human Activities on Urban Sprawl and Land Surface Temperature in Rural Areas, a Case Study of El-Reyad District, Kafrelsheikh Governorate, Egypt

1
Geography Department, Faculty of Arts, Kafrelsheikh University, Kafrelsheikh 33516, Egypt
2
Geology Department, Faculty of Science, Kafrelsheikh University, Kafrelsheikh 33516, Egypt
3
National Authority for Remote Sensing and Space Sciences (NARSS), Cairo 11769, Egypt
4
Department of Environmental Management, Institute of Environmental Engineering, RUDN University, 6 Miklukho-Maklaya St, Moscow 117198, Russia
5
Joint Laboratory on Low-Carbon Digital Monitoring, Guangdong Institute of Carbon Neutrality (Shaoguan), Shaoguan 512029, China
*
Author to whom correspondence should be addressed.
Sustainability 2023, 15(18), 13497; https://doi.org/10.3390/su151813497
Submission received: 11 May 2023 / Revised: 23 August 2023 / Accepted: 28 August 2023 / Published: 8 September 2023

Abstract

:
Anthropogenic activities affect the surrounding environment dynamically in different ways. In the arid and hyper arid, agriculture is concentrated in rural communities, which are cooling surfaces that help mitigate surface temperature increases. Recently, rural communities are suffering from increasing urban sprawl. The current work focuses on evaluating the changes in land cover and their impacts on land surface temperature (LST) during (1988–2022) and predicting the changes until 2056 in El-Reyad District, Kafrelsheikh Governorate, Egypt. For achieving this purpose, Landsat images (TM, ETM+, and OLI) were used. The support vector machine (SVM) was applied using Google Earth Engine (GEE) to monitor changes in land use/cover and LST. The prediction of land use until 2056 was achieved using the CA-Markov simulation model. The results showed six land cover classes: agricultural lands, bare lands, urban areas, natural vegetation, Lake Burullus, and fish farms. The results showed the effects of human activity on the conversion of agricultural land to other activities, as agricultural lands have decreased by about 3950.8 acres, while urban areas have expanded by 6283.2 acres, from 1988 to 2022. Fish farms have increased from 3855.6 to 17,612 acres from 1988 to 2022. While the area of bare land decreased from 28.3% to 0.7% of the total area, it was converted to urban, agricultural, and fish farms. The spatiotemporal change in land cover affected the balance of LST in the study area, although the average temperature increased from 32.4 ± 0.5 to 33.6 ± 0.2 °C. In addition, it is expected to reach 36 ± 0.5 °C in 2056, and there are some areas with decreased LST where it is converted from bare areas into fish farms and agricultural uses. The prediction results show that the agricultural area will decrease by −11.38%, the urban area will increase by 4.6%, and the fish farms area will increase by 6.1%. Thus, preserving green spaces and reducing urban sprawl in rural communities are very important objectives.

1. Introduction

Land cover change resulting from the escalating impact of human activities is a prevalent occurrence worldwide. However, its severity is particularly pronounced in developing countries. Uncontrolled urbanization in developing countries like Egypt has led to various environmental and social issues [1]. According to a United Nations report [2], urbanization in rural areas is rapidly increasing, and it is projected that the world’s urban population will grow from 3.9 billion to 6.4 billion by 2050. Africa, on the other hand, has the world’s largest rural population, but urbanization is occurring at an even faster pace than in any other region. Urban expansion results in the depletion of agricultural land, which significantly affects agricultural ecosystems. To address this issue, remote sensing images can be utilized at various intervals to monitor these changes and develop urban planning strategies [3]. Agriculture is a crucial contributor to Egypt’s economy, with activities concentrated in the Nile Valley and Delta regions which have some of the most fertile soils and account for around 4% of the country’s land area. However, population density is rising in these areas due to urbanization, which has caused a decline in the availability of food [4,5].
Numerous studies conducted in Egypt have concentrated on monitoring the land cover in different areas along the Nile Valley and its Delta, which represents approximately 95% of the Egyptian population [6,7]. Between 1998 and 2014, the urban area in the region between Rashid and Damietta expanded by approximately 35,900 ha, with the highest urbanization rate observed between 2011 and 2013 [8,9]. Urban sprawl poses a significant threat to the productive agricultural lands of the Nile Delta, as observed in the Qalyubia Governorate, where the land area decreased from 683.2 km2 to 618.5 km2 during the period of 1992–2009 [10]. The expansion of urban areas has resulted in significant changes in land use and land cover, which in turn affect temperature patterns [11,12,13]. The transformation of natural landscapes into urbanized areas leads to the replacement of vegetation with impervious surfaces such as concrete and asphalt, which absorb and radiate more heat than natural surfaces [14,15]. This phenomenon, known as the urban heat island effect, causes urban areas to become significantly warmer than their rural counterparts. Therefore, understanding the relationship between human activities, urbanization, and temperature change is crucial for mitigating the effects of climate change [16].
Satellite remote sensing and GIS techniques have been used by researchers to analyze and predict land use and land cover [8,17,18,19,20,21]. Several methods such as Random Forest, Support Vector Machine (SVM), and Artificial Neural Networks (ANN), are becoming increasingly popular for land cover classification. These algorithms can learn and adapt to complex land cover patterns, thereby improving the accuracy of classification. However, traditional classification methods, such as maximum likelihood classification, are still widely used and simple and straightforward to implement [19,22,23]. Recently, several studies have utilized Google Earth Engine (GEE) to estimate LST. Mujabar [24] used Landsat 8 data and GEE to estimate LST in the Greater Cairo region of Egypt. This study found that LST was strongly influenced by land use, with built-up areas exhibiting higher temperatures than agricultural and water surfaces. Similar results were obtained in the Kingdom of Saudi Arabia [25]. Furthermore, the highest LST values were observed in significant heat islands with temperatures greater than 60 °C near the industrial iron and steel factories [26].
LST, derived from remote sensing data, is a valuable and commonly used resource for investigating surface urban heat islands (UHIs) [27]. The advent of thermal remote sensing has facilitated the accessibility of LST data, thanks to satellite sensors such as Landsat, MODIS, and ASTER. These sensors provide broad coverage, enabling the analysis of LST patterns across large areas of the Earth’s surface [28]. Many researchers have studied the effect of land cover change on land surface temperature in order to adapt new strategies and policies mitigating the effects of increasing temperatures on the surrounding environment [29,30].However, the correlation between land use/land cover (LULC) and the urban heat island (UHI) effect may not be linear because of various factors such as seasonal variability in land cover data and the complex landscape structure and urban morphology heterogeneity [31,32,33]. Furthermore, the nonlinear regression method could provide better results for predicting land surface temperature (LST) and gaining a deeper understanding of the LULC-UHI relationship [34].
GEE provides a range of tools for land cover classification, including supervised and unsupervised classification algorithms using satellite data from the Thermal Infrared Sensor (TIRS) aboard the Landsat 8 satellite. Several studies have demonstrated the potential of GEE for land cover classification and LST estimation. For example,. Tassi, & Vizzari [35] used GEE to classify land cover types in the Pearl River Delta region of China using Landsat data and a random forest algorithm. Also, the area of impervious surfaces in Greater Cairo, Egypt has increased from 564 to 869 km2 from 2000 to 2019 using GEE to estimate LST [24].
The Cellular Automata (CA)-Markov model has potential to describe heterogeneous LULC and urban areas. Consequently, this model is considered to be one of the most practical for predicting future urban sprawl [18]. The CA-Markov model is frequently utilized to monitor changes in LULC because it can quantitatively simulate trends of change using diverse data. The model is straightforward and user-friendly and has a preset calibration process that enables simulations [19].
The aims of the current study are as follows: (1) study the change in land cover and urban change in the rural areas and their impact on the change in surface temperature in the district of El-Reyad, Kafrelsheikh Governorate, during the selected time period. (2) Predicting urban sprawl and potential changes in land surface temperatures up to 2056.

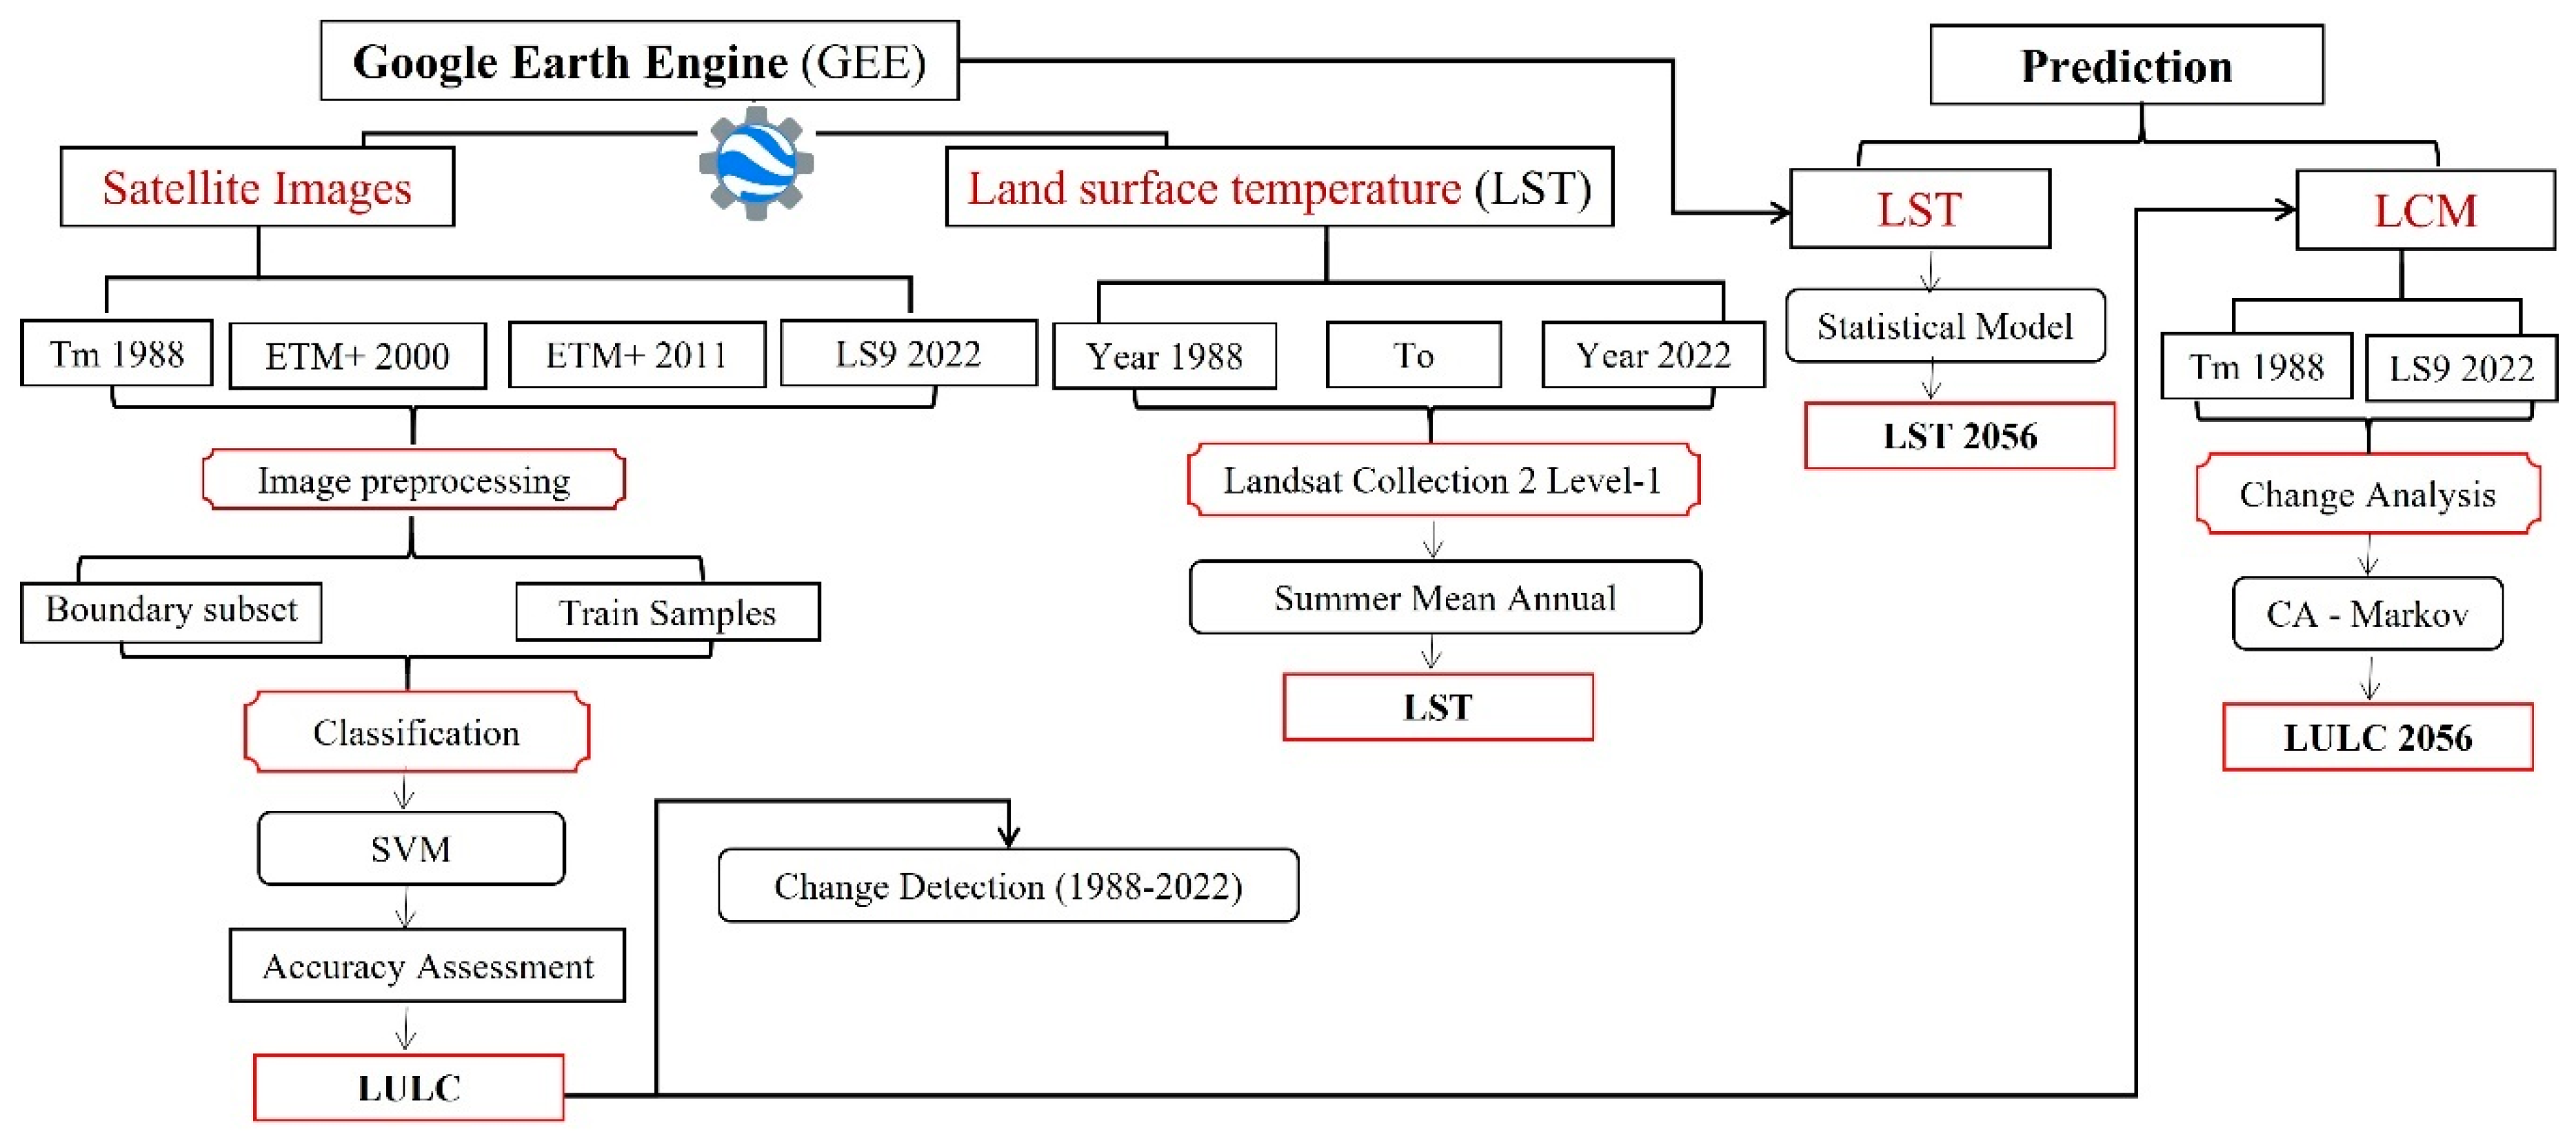
2. Materials and Methods
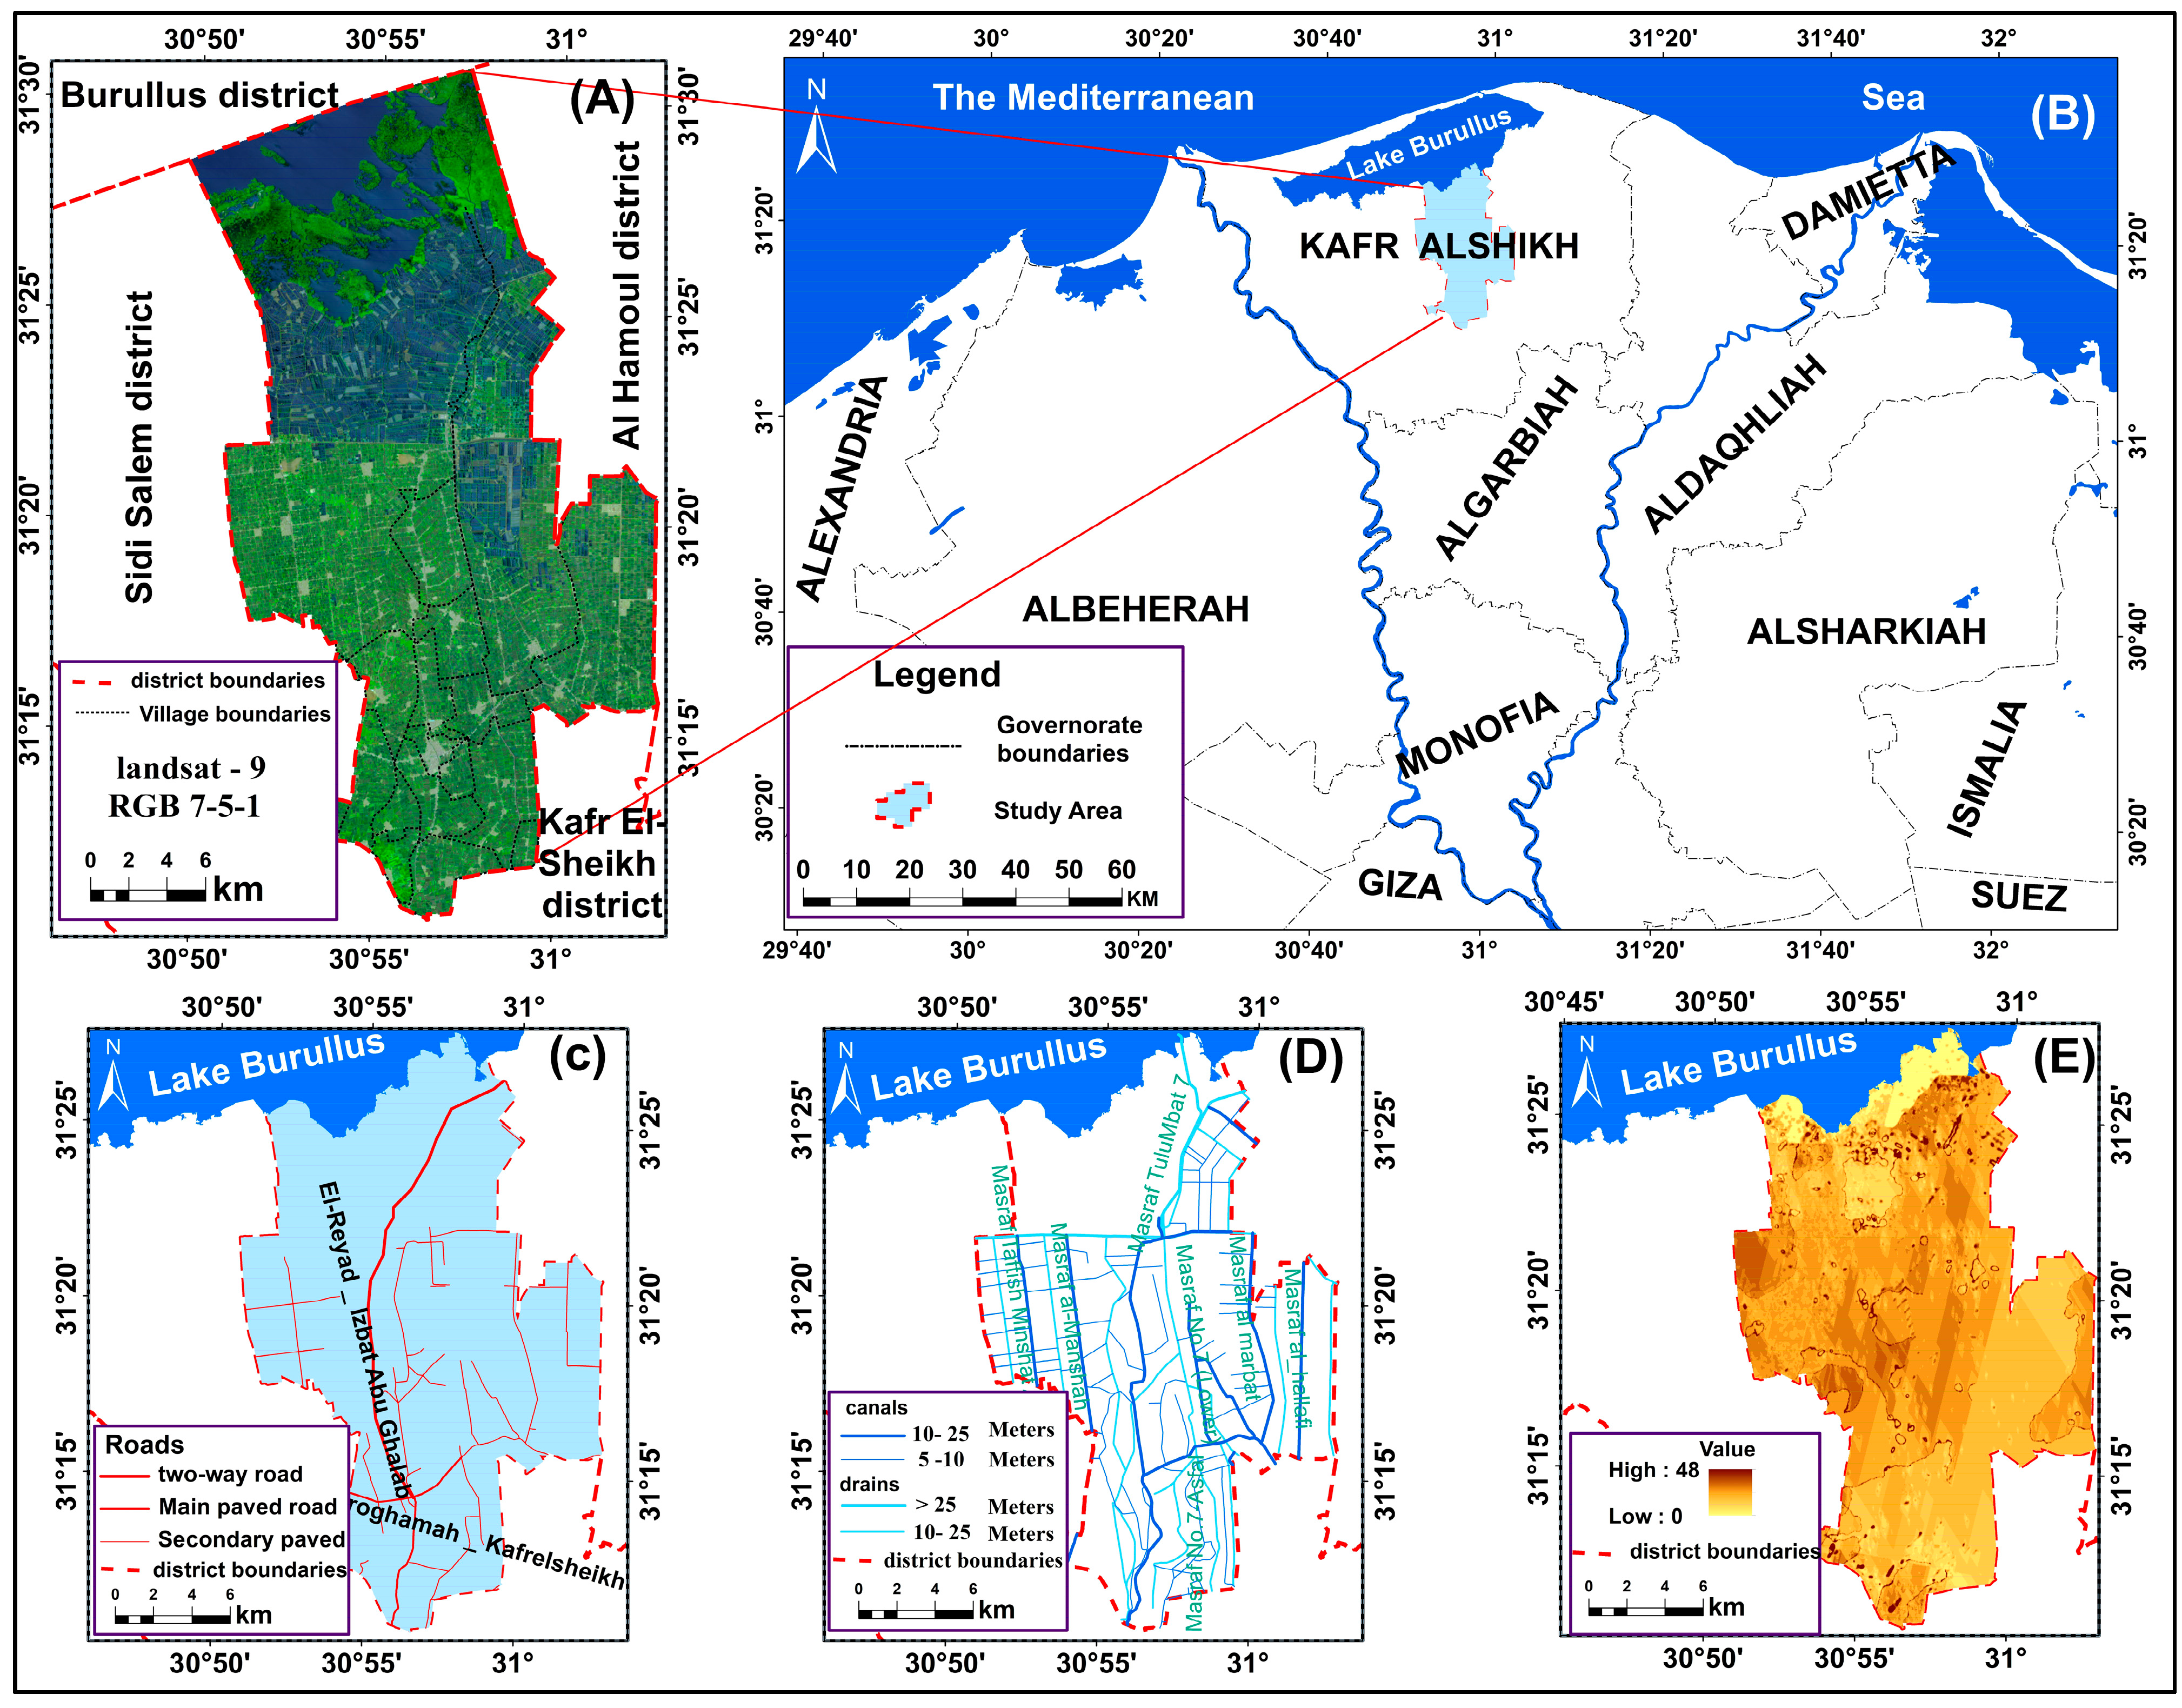
2.1. Study Area

El-Reyad district is located between longitudes 30°49′40″ and 31°2′50″ E, and between latitudes 31°30′48″ and 31°10′33″ N (Figure 1). This site indicates the extension of the district in the form of a rectangle, and it extends to the northern part of the Kafrelsheikh governorate in the northern Nile Delta (Figure 1A,B). On the other side, there was a clear rise in the levels of the areas located south of the study area, which had elevation greater than three meters, gradually decreasing towards the north towards Lake Burullus to reach the zero level (Figure 1E). The area is characterized by a high density of canals that reaches (578.8 m/km2), and the density of drains reaches (688.3 m/km2), and the reason for the increase in the density of drains is that the district is located north of the delta and this area represents the ends of the canals (Figure 1C,D). The population of El-Reyad increased from 89.9 thousand in 1986 to 120.5 thousand in 1996, and to 186.2 thousand people in 2017, which means that the population has almost doubled within 30 years with an annual increase of 3.2 thousand people per year. Forecasting the future population is crucial in assessing its potential impacts on land surface temperature (LST), since the population in 2056 will be 709.9 thousand people, as population growth and urbanization can lead to increased LST and associated negative environmental and health effects.

2.2. Land Use/Cover Classification

In this study, multitemporal remote sensing images were used to analyze and predict land cover changes in the El-Reyad district from 1988 to 2056, as shown in (Figure 2). The following satellite images were used to analyze the change in land cover: (i) Landsat-5 Thematic Mapper (TM) images acquired in Jun 1988 and 2000, respectively; (ii) Landsat-7 Enhanced Thematic Mapper plus (ETM+) images acquired in 2011; and Landsat-9 Operational Land Imager (OLI) acquired in 2022 with a spatial resolution of 30 m. Satellite images were radiometrically and atmospherically corrected.
GEE provides a convenient platform for utilizing SVM as a classification technique to classify land use/land cover (LULC) types based on spectral, textural, and other features extracted from remote sensing data. GEE provides a platform for importing, preprocessing, training, and applying SVM models to large remote sensing data. SVM using GEE is a powerful tool for tasks such as urban growth detection and provides valuable insights into the spatial distribution of different land cover types [36].

2.3. Estimating Land Surface Temperature Using GEE

Landsat surface temperature (LST) is an essential geophysical parameter in numerous studies, including global energy balance studies, hydrologic modeling, vegetation monitoring, and crop health assessment. The Landsat series of satellite images was used during the summer months from June–August during the study period, and the average temperature was retrieved from satellite images. GEE has pre-processed “USGS Landsat 4–9 Level 2, Collection 2” datasets containing atmospherically corrected surface reflectance and LST products generated from the Landsat Collection 2 Level-1 thermal infrared bands, Top of Atmosphere (TOA) reflectance, and TOA brightness temperature integrated with multiple datasets. These datasets include the Advanced Spaceborne Thermal Emission and Reflection Radiometer (ASTER) Global Emissivity Database (GED) data, ASTER Normalized Difference Vegetation Index (NDVI) data, and atmospheric profiles of geopotential height, specific humidity, and air temperature (AT). AT was extracted from Goddard Earth Observing System (GEOS) Model Version 5 Forward Processing Instrument Teams (FP-IT) (for acquisitions from 2000 to present) or Modern-Era Retrospective analysis for Research and Applications Version 2 (MERRA-2) (for acquisitions from 1982 to 1999).
In the present study, two pre-processing steps were applied to the LST product to convert it from Equation number (1) Digital Number (DN) to Kelvin and Equation (2) from Kelvin to Celsius as follows:
ST Kelvin = (ST band × Scale) + Offset
ST Celsius = ST Kelvin − 273
where ST Kelvin is the land surface temperature estimated in Kelvin unit, ST band is the ‘ST_B6’ in case of Landsat 4–7 and ‘ST_B10’ in case of Landsat 8–9, and the Scale and Offset values to transform the pixel value from DN to Kelvin are 0.00341802 and 149, respectively, for all USGS Landsat 4–9 Level 2, Collection 2. To convert to a Celsius unit, ST Kelvin was subtracted from 273.

2.3.1. CA–Markov Model

IDRISI Selva 17 software was used to predict the changes in land cover in the study area in 2056, based on the CA-Markov model, according to Anderson’s classification, in which they arranged the initial foundations for the categories of land use and land cover classification that depend on remote sensing data [37]. The study area includes a set of classifications, and the researcher will follow this method with some modifications in accordance with the conditions of the region and the objective of the study. The software could process large amounts of data and generate high-quality results that were critical for the success of the research project. In addition to using the CA-Markov model, the research team utilized a variety of data collection and processing techniques to ensure the accuracy of their predictions. Satellite imagery was collected using remote sensing technology to gather data about the study area, which was then processed using advanced image processing techniques [38]. Overall, the data collection and satellite image processing techniques used in this study were critical for predicting future land cover changes in the study area. By utilizing advanced software tools, classification systems, and data collection techniques, researchers have generated accurate results that will be useful for policymakers and other stakeholders in the region.

2.3.2. Accuracy Assessment

Accuracy assessment is a crucial step in land use/cover change detection to ensure the reliability and accuracy of classified images. To conduct the accuracy assessment, 500 ground-truth points covering all land use/cover classes in the El-Reyad district were collected and split into two groups. A number of 300 (60%) of these points were used as training points for image classification, while the remaining 200 points (40%) were used for accuracy assessment. The validation data is generally assumed to be accurate and to represent the “ground truth”. By cross tabulating the classification results and the corresponding validation samples, various metrics can be computed [39]. These metrics include overall accuracy (OA, Equation (3), accuracy at the class level, such as producer’s accuracy (PA) (1 minus omission error), and user’s accuracy (UA) (1 minus commission error) (referred to as Equations (4) and (5)). The Kappa statistic (Equation (6)), a statistical measure that evaluates the agreement between the classified image and the reference data, is also calculated. It takes into account the agreement that can occur by chance and provides a more robust assessment of the accuracy of the classification [40].
In this framework, Pontius and Millones [41] proposed two additional measures as alternatives to the use of Kappa. The two measures are quantity disagreement (QD) and allocation disagreement (AD) (Equations (7) and (8)). The QD quantifies the disparity between the classification and reference data due to differences in class proportions. Allocation disagreement (AD) evaluates differences in the spatial distribution of classes [42]
Overall   Accuracy   ( OA ) = N u m b e r   o f   C o r r e c t l y   C l a s s i f i e d   S a m p l e s N u m b e r   o   f   T o t a l   S a m p l e s
Class   Producer s   Accuracy   ( PA ) = N u m b e r   o   f   C o r r e c t l y   C l a s s i f i e d   S a m p l e s   i n   C a t e g o r y N u m b e r   o   f   S a m p l e s   f   r o m   R e f e r e n c e   D a t a   i n   C a t e g o r y
Class   User s   Accuracy   ( UA ) = N u m b e r   o   f   C o r r e c t l y   C l a s s i f i e d   S a m p l e s   i n   C a t e g o r y N u m b e r   o f   S a m p l e s   C l a s s i f i e d   t o   t h a t   C a t e g o r y
Kappa   Statistic   ( k ) = O v e r a l l   A c c u r a c y E s t i m a t e d   C h a n c e   A g r e e m e n t 1 E s t i m a t e d   C h a n c e   A g r e e m e n t
Q D = 1 2 j = 1 C P i + P + i
A D = j = 1 C m i n ( P i + , P + i ) C
In the context of error matrices for the ith class among C classes, where Pi+-, P+i denote the row and column totals, respectively, C is the overall agreement.
The QD and AD values range from 0 to 1 with the values close to 0 representing perfect agreement in the spatial allocations for each class between the validation and prediction data.

3. Results and Discussion

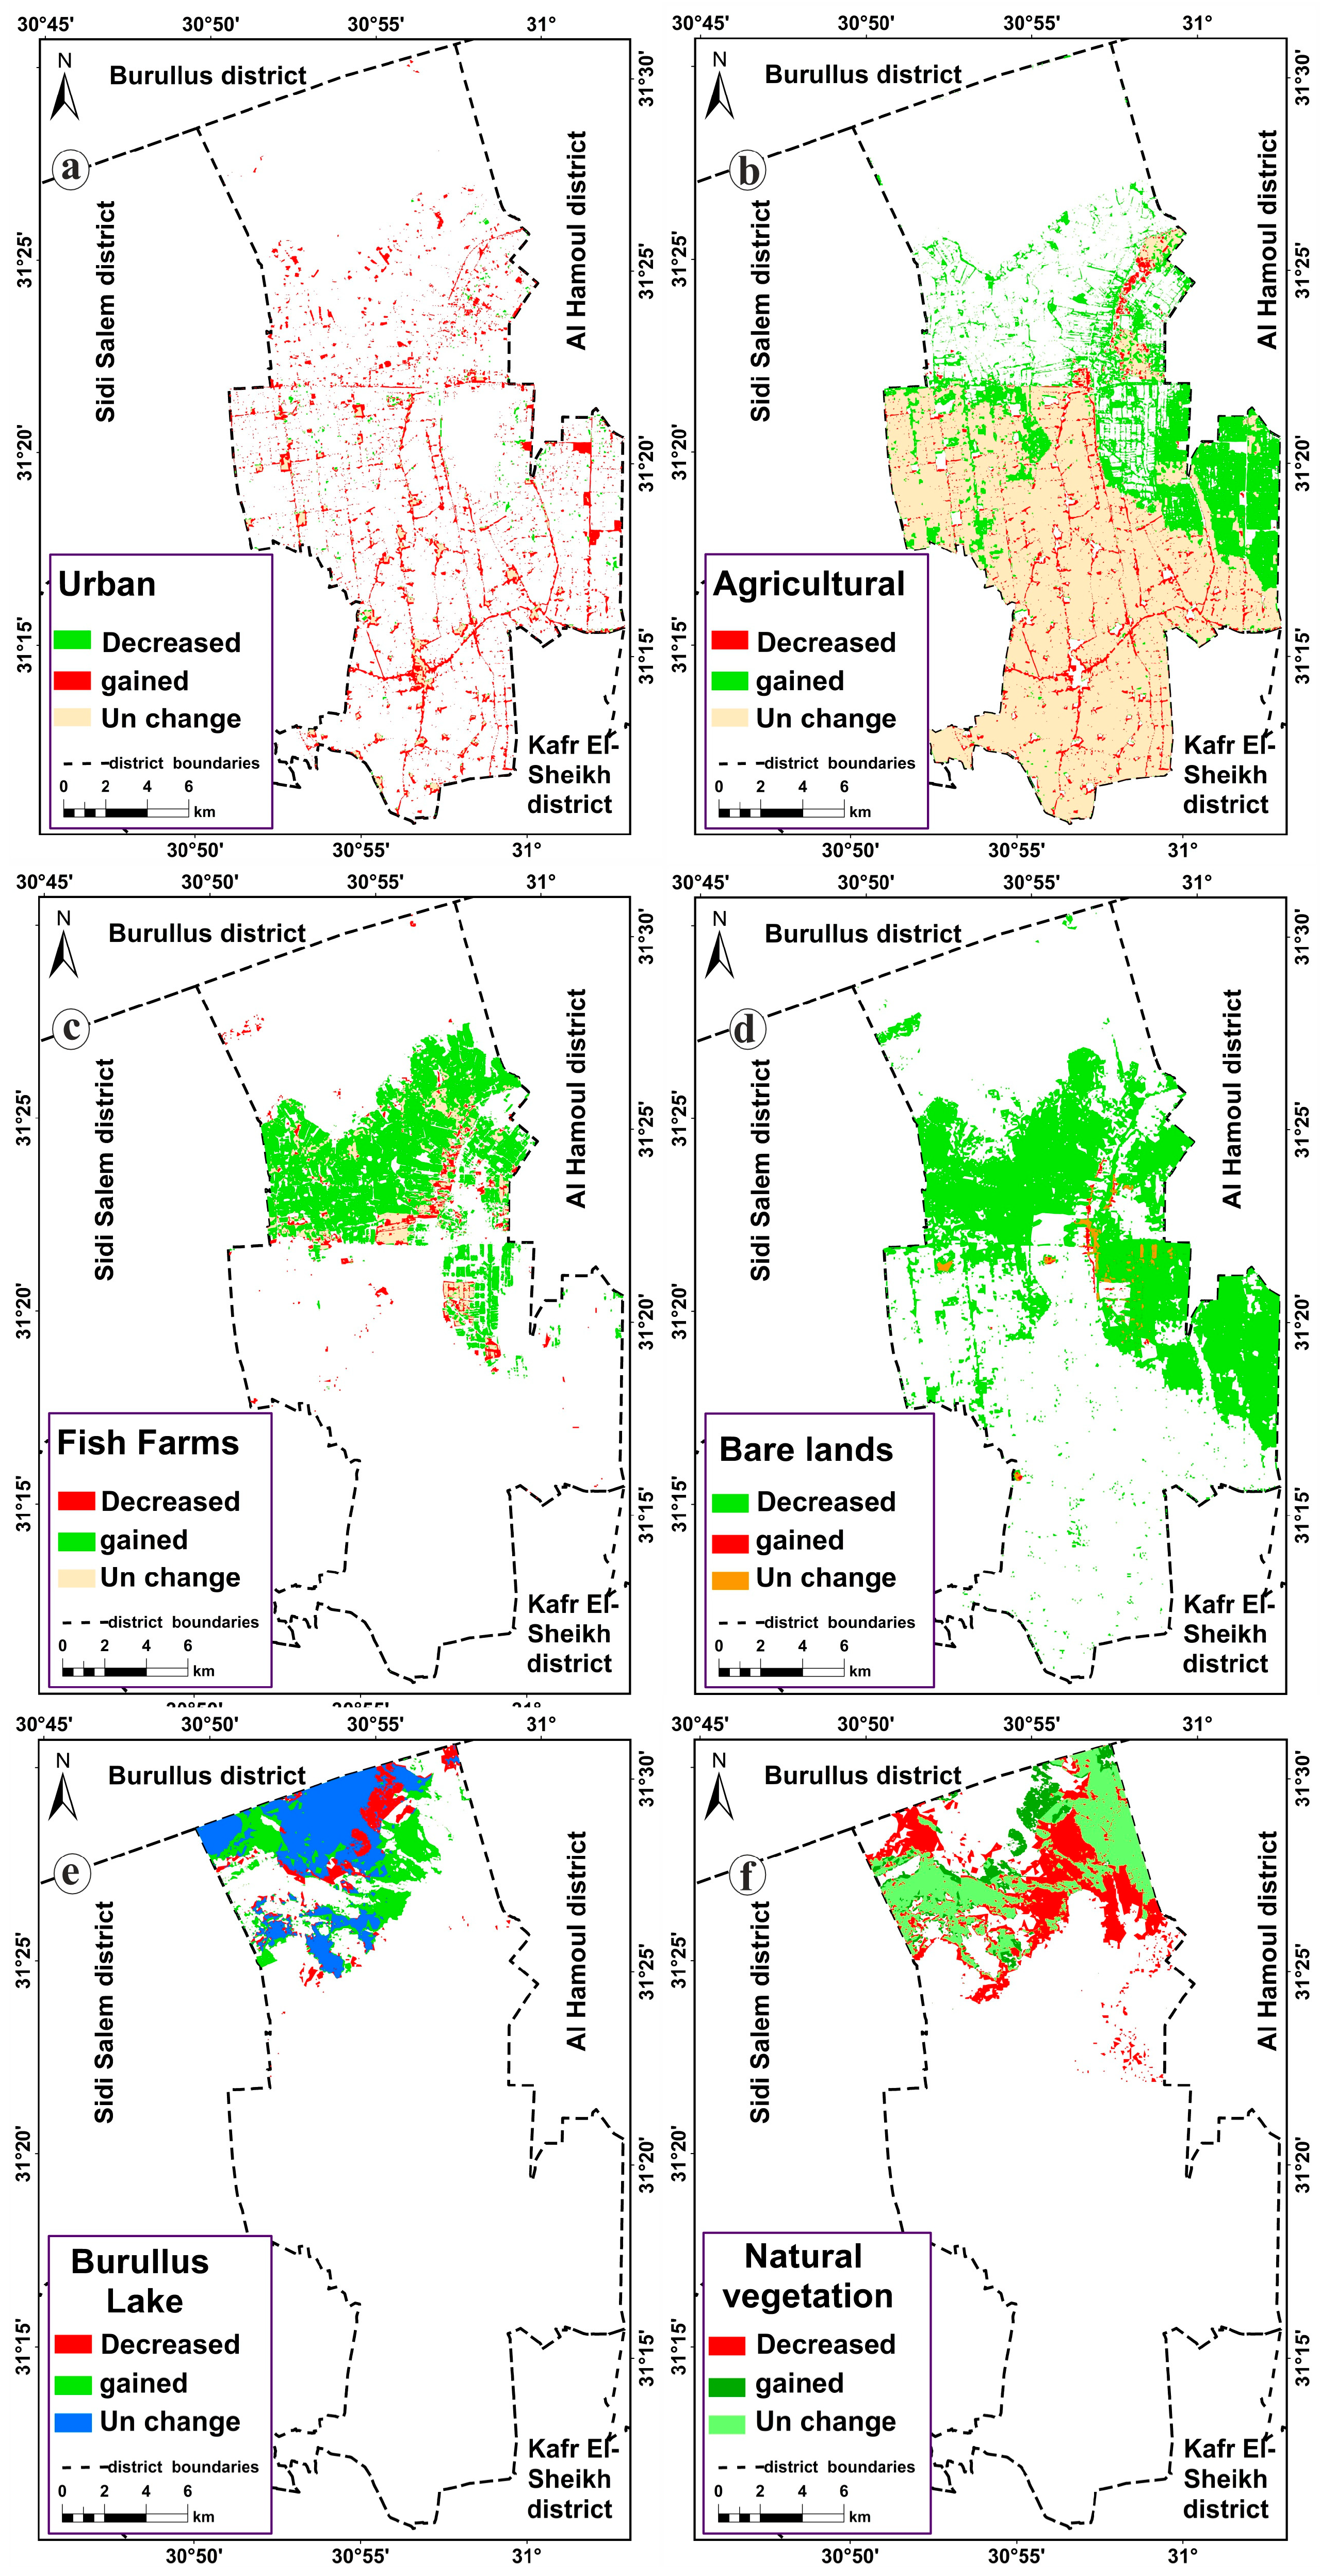
3.1. Monitoring Land Cover Changes

We performed an accuracy assessment for various land use/land cover classes, encompassing urban areas, agricultural land, fish farms, bare lands, Lake Burullus, and natural vegetation. Table 1 presents the overall accuracies and kappa coefficients of the classification results from the years 1988, 2000, 2011, and 2022. The overall accuracies were 88.2%, 91%, 93.6%, and 96.2%, and the kappa coefficients were 0.84, 0.881, 0.915, and 0.95, respectively. The results of allocation disagreement AD were 0.09, 0.065, 0.042, and 0.30, respectively, and the results of quantity disagreement QD were 0.03, 0.025, 0.018, and 0.01 for the LULC predictions during the four dates. Therefore, the results were highly satisfied with total disagreement between validation and prediction datasets [41,43].
The results indicated that the classification of 2022 was the most accurate, thus matching the ground-truth points collected in 2022.
The Google Earth Engine platform was used to complete the supervisory classification of land cover, as it relied upon the support vector machine (SVM) classification of Landsat satellite images from 1988, 2000, 2011, and 2022. Six classes of land cover were identified: agricultural lands, bare lands, urbanization, natural vegetation, Lake Burullus, and fish farms, as shown in Table 2. The classification showed changes in land cover in the El-Reyad district from 1988 to 2022, with the highest rates of change noted in urbanization and fish farms, respectively.
Urbanization was found to be a major factor in land cover change which increased from 1642 acres in 1988 to 7378 acres in 2022. In 2011, the urban area was recorded at about 5093 acres which was the highest change during the study period. The total change in urbanization was 2356 acres from 2000 to 2011. In addition, the period from 2011 to 2022 recorded a big change of 2285 acres. The increase in urban sprawl in the study area coincided with urban sprawl in the rest of the delta lands after 2011, and the increase continued thereafter, with increasing land cover changes in that period [44]. As shown in Figure 3 and Figure 4, the eastern parts of the region were affected by urban sprawl more than the rest of the regions, and this is consistent with the study of [19,45] presented, and this is due to the high population density in those regions [44]. On the other hand, the northern parts of the region were less urbanization extended, which may be due to the low population density.
Agricultural land increased from 45,791 acres in 1988 to 56,953 acres in 2000, and then increased to 59,285 acres in 2011, and then decreased to 57,715 acres in 2022. The net changes in agricultural areas were 11,162 acres and 2332 acres in 2000 and 2011, respectively, and a decrease of 1570.8 acres in 2022. The increase in agricultural area during 1988 until 2011 was due to increasing land reclamation activities in the region, especially in the north, and these results are confirmed by many studies [44,46]. Fish farming is the dominant activity in the north of the Kafrelsheikh governorate, and the results showed that from 1988 to 2022 fish farms increased dramatically from 3855.6 acres in 1988 to 17,612 acres in 2022, accounting for one-fifth of the study area, due to low agricultural productivity as a result of degradation factors such as soil salinity and waterlogging [47,48]. In addition, fisheries activity is more profitable than other traditional farming methods, and these reasons led to large areas changing into fish farms [49]. On the other hand, the results showed that the increase in fish farm areas during the period from 2011 to 2022 was not significant, as the change in fish farm areas recorded only about 24 acres. Table 2 shows that the total change in fish farm areas was 13,756 acres from 1988 to 2022, whereby the largest change was 12,542 acres from 1988 to 2000, and then 1190 acres from 2000 to 2011. Only 23.8 acres was the magnitude of the expansion area in fish farms from 2011 to 2022. The area of Lake Burullus has increased from 8853.6 acres in 1988 to 11,090.8 acres in 2022. The lake area increased to 11,114.6 acres in 2000, and then decreased to 10,186 acres in 2011. Natural vegetation covers the area located in the northern part of the study area, adjacent to Lake Burullus. Furthermore, bare lands also decreased from 29,440.6 acres to 785.4 acres during 1988 until 2022. This huge change was 22,086 acres from 1988 to 2000. This reduction in the bare area corresponded to an increase in agricultural, urban, and fish farm areas. The decrease in barren lands during the years of the study reflects the human activity that led to a change in the state of the lands for many other uses. The natural vegetation areas decreased from 14,589.4 acres to 9615.2 acres in 2022, with most of the reduction in natural vegetation due to conversion to fish farms. The reduction in natural vegetation and bare lands fits with the expansion of fish farms and their disinfection operations on one hand and the increasing agricultural reclamation and urban growth on the other hand. Hossen and Negm in 2020 [50] reported that the water surface area of Lake Burullus will be decreased by 58.95% in 2030, as a result of human practices in the area adjacent to Lake Burullus, and this issue leads to negative impacts on environmental balance, so the monitoring of environmental risks and the preservation of the lake are therefore required.

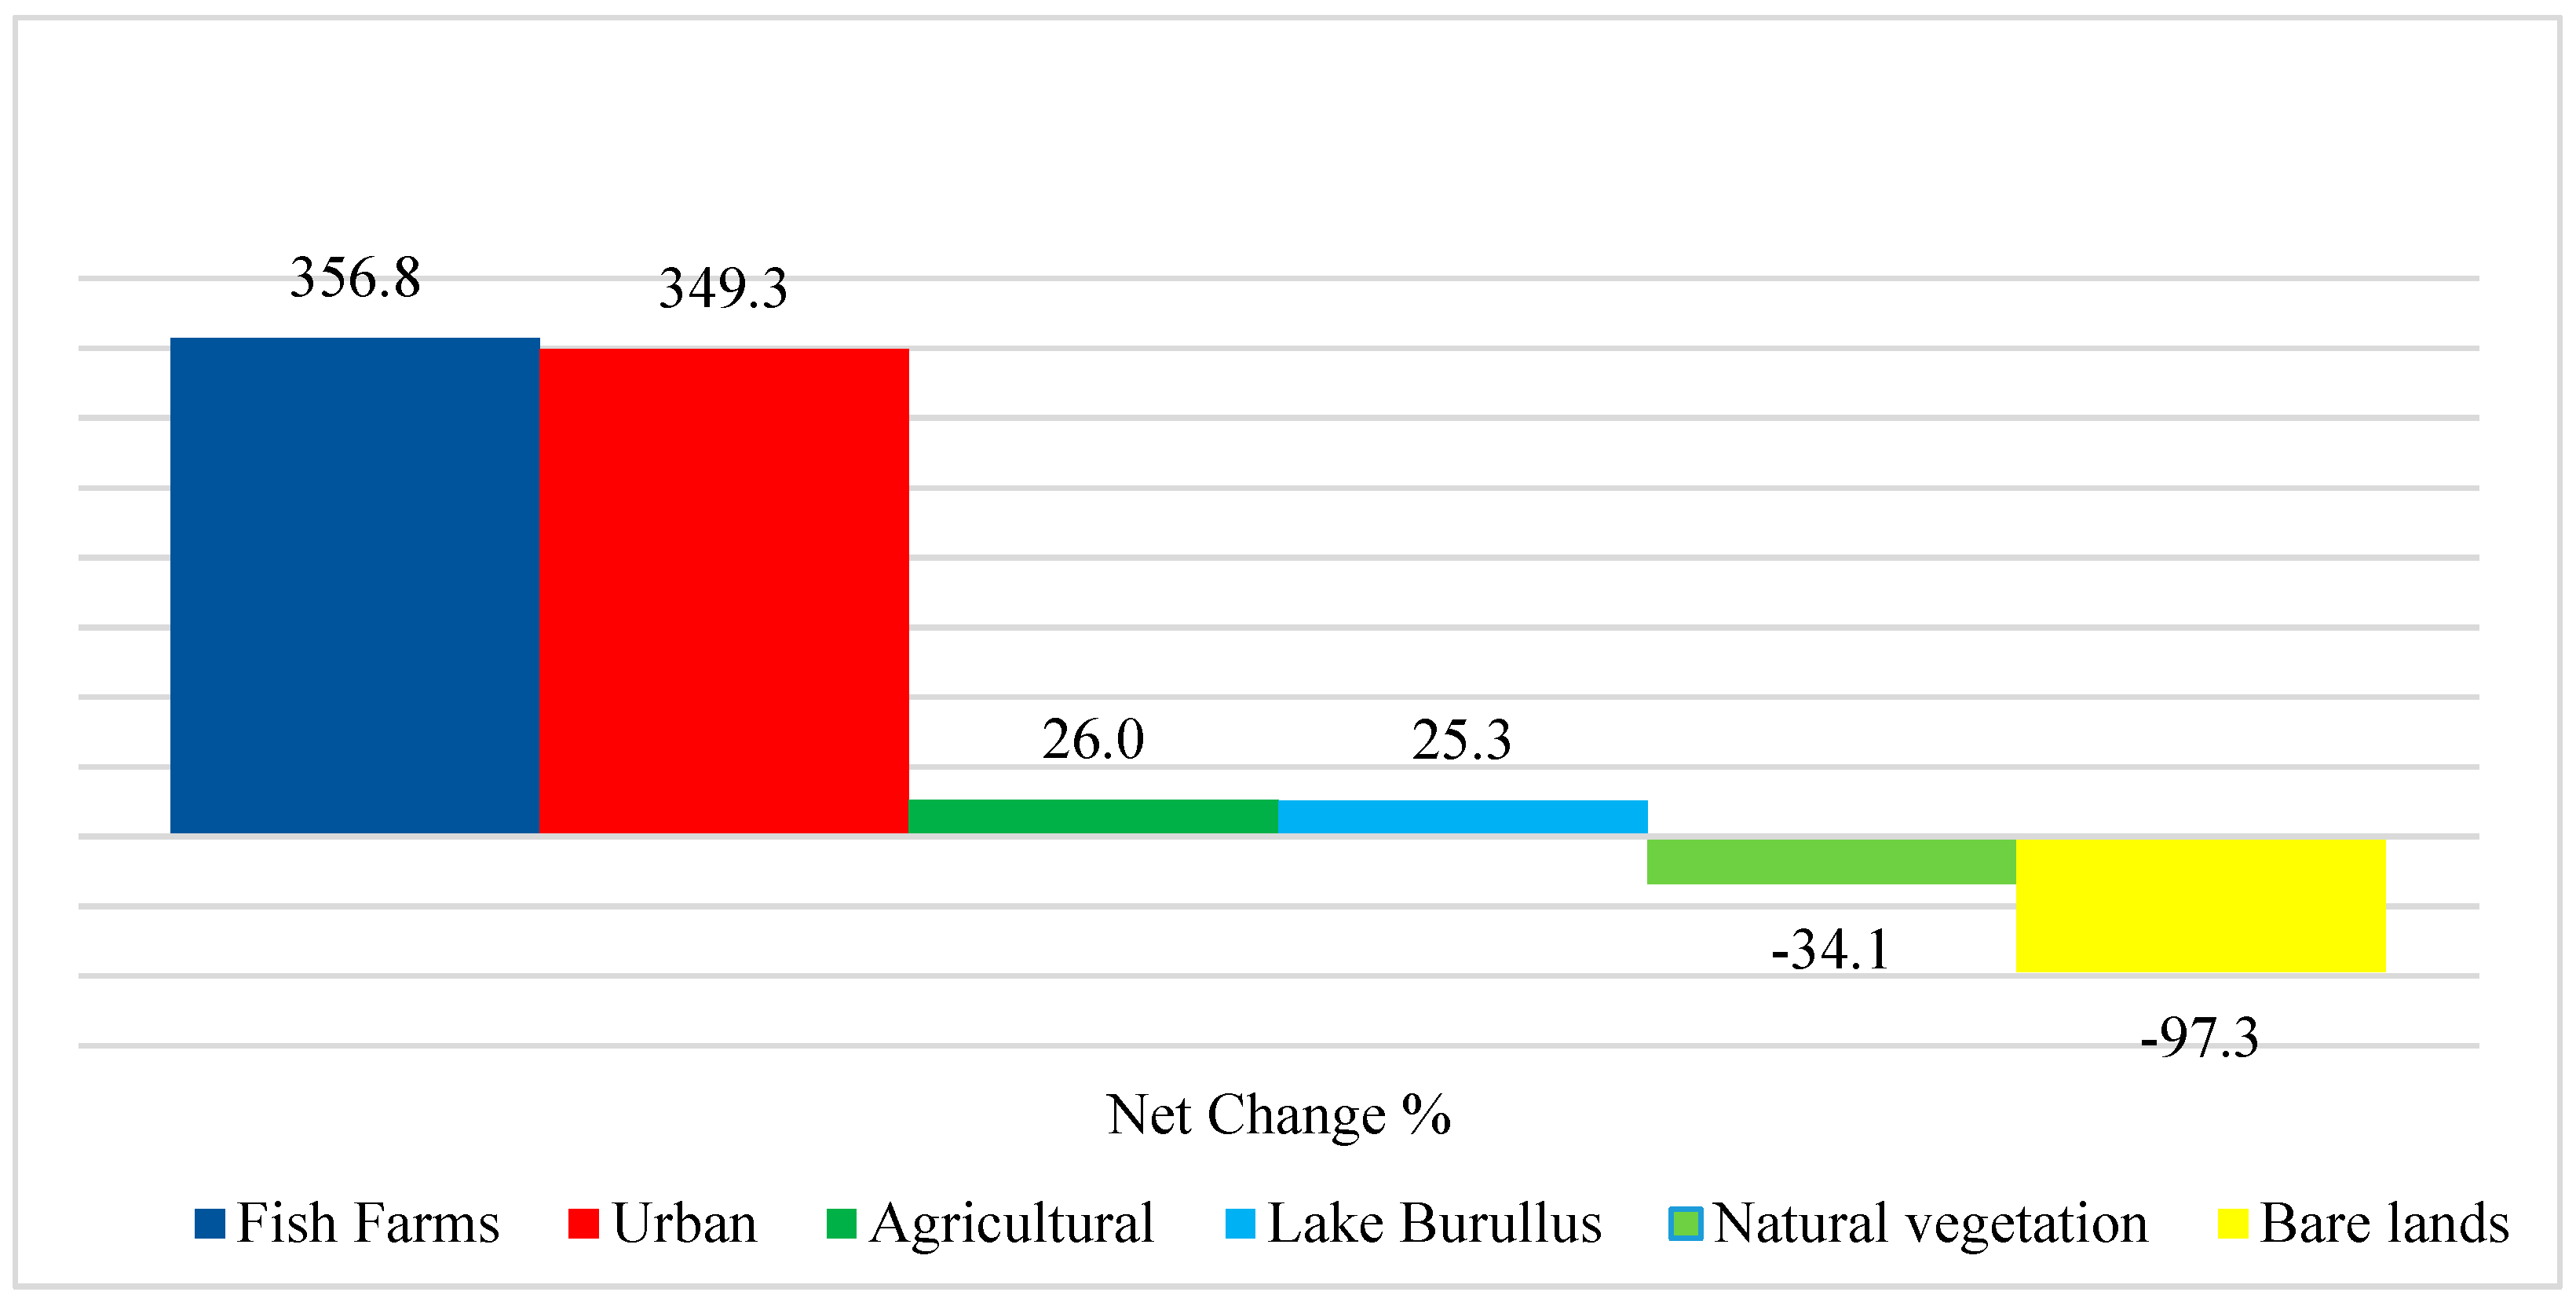
3.2. Spatiotemporal Changes in Land Cover/Use

To investigate the changes in land cover in the El-Reyad district, we used ArcGIS to calculate the physical change in land cover when subjected to one of the following: unchanged, increased, or decreased. Furthermore, the reasons for these changes were identified to better understand the dynamic changes in land cover in the study area. Figure 5 showed the dynamic changes in land cover in the study area from 1988 to 2022. Table 3 shows that most loss areas were from barren lands by 28,988.4 acres (66%), followed by natural vegetation at 16% of the total loss. Agricultural lands were found to be the largest class that has increased by 15,874.6 acres (36%) of the total changes in the study area. The results replicate how the expansion of fish farm areas represents about a quarter of the total increase by 15,184.4 acres (25.2%) during 1988 to 2022, which reflects the behavior of the local population in fishing to achieve high profitability [19]. Most of these increases in agricultural lands (36.3%) and fish farms were as a result of the conversion of bare lands to agricultural lands and fish farms (Table 3). The results showed that the number of urban classes did not decrease during the study period. However, the increase in urban areas was due to the transformation of other classes of land cover to urbanization, most of which was the result of the transformation of agricultural and bare land into urban areas.
The reduction in the area of Lake Burullus was 1999 acre per year. On the other hand, the lake increased by 4260 acres in other places. The reduction in natural vegetation accounted for 7187.6 acres (16.4% of the total reduction). The reduction of natural vegetation was due to its conversion to lakes and fish farms. In contrast, the total area of unchanged lands in the El-Reyad district was found to be 60,356.8 acres, with agricultural lands representing the highest percentage (69.3%), and bare lands representing the lowest (0.9%). These unchanged lands are spread across the southern and central sectors of the study area.
Furthermore, the total area of decreased land across all categories of land cover in the study area was 43,768.2 acres, with bare land representing the largest portion. Our results also reveal that the area of agricultural lands decreased by 3950.8 acres (9%), with most of this land being converted to urban areas at 3532.97 acres. The remaining area of converted agricultural lands was transformed into fish farms at 319.55 acres. The results showed that the expansion of fish farms was mainly on bare lands. By 2022, bare land was almost consumed (97.3%, Figure 6). Therefore, the future expansion of fish farms within the study area is projected to be limited. In contrast, the fish farm and urbanization rates were extremely high in the study area (356.8% and 349.3%, respectively, Figure 6), which was mainly at the expense of agricultural lands.

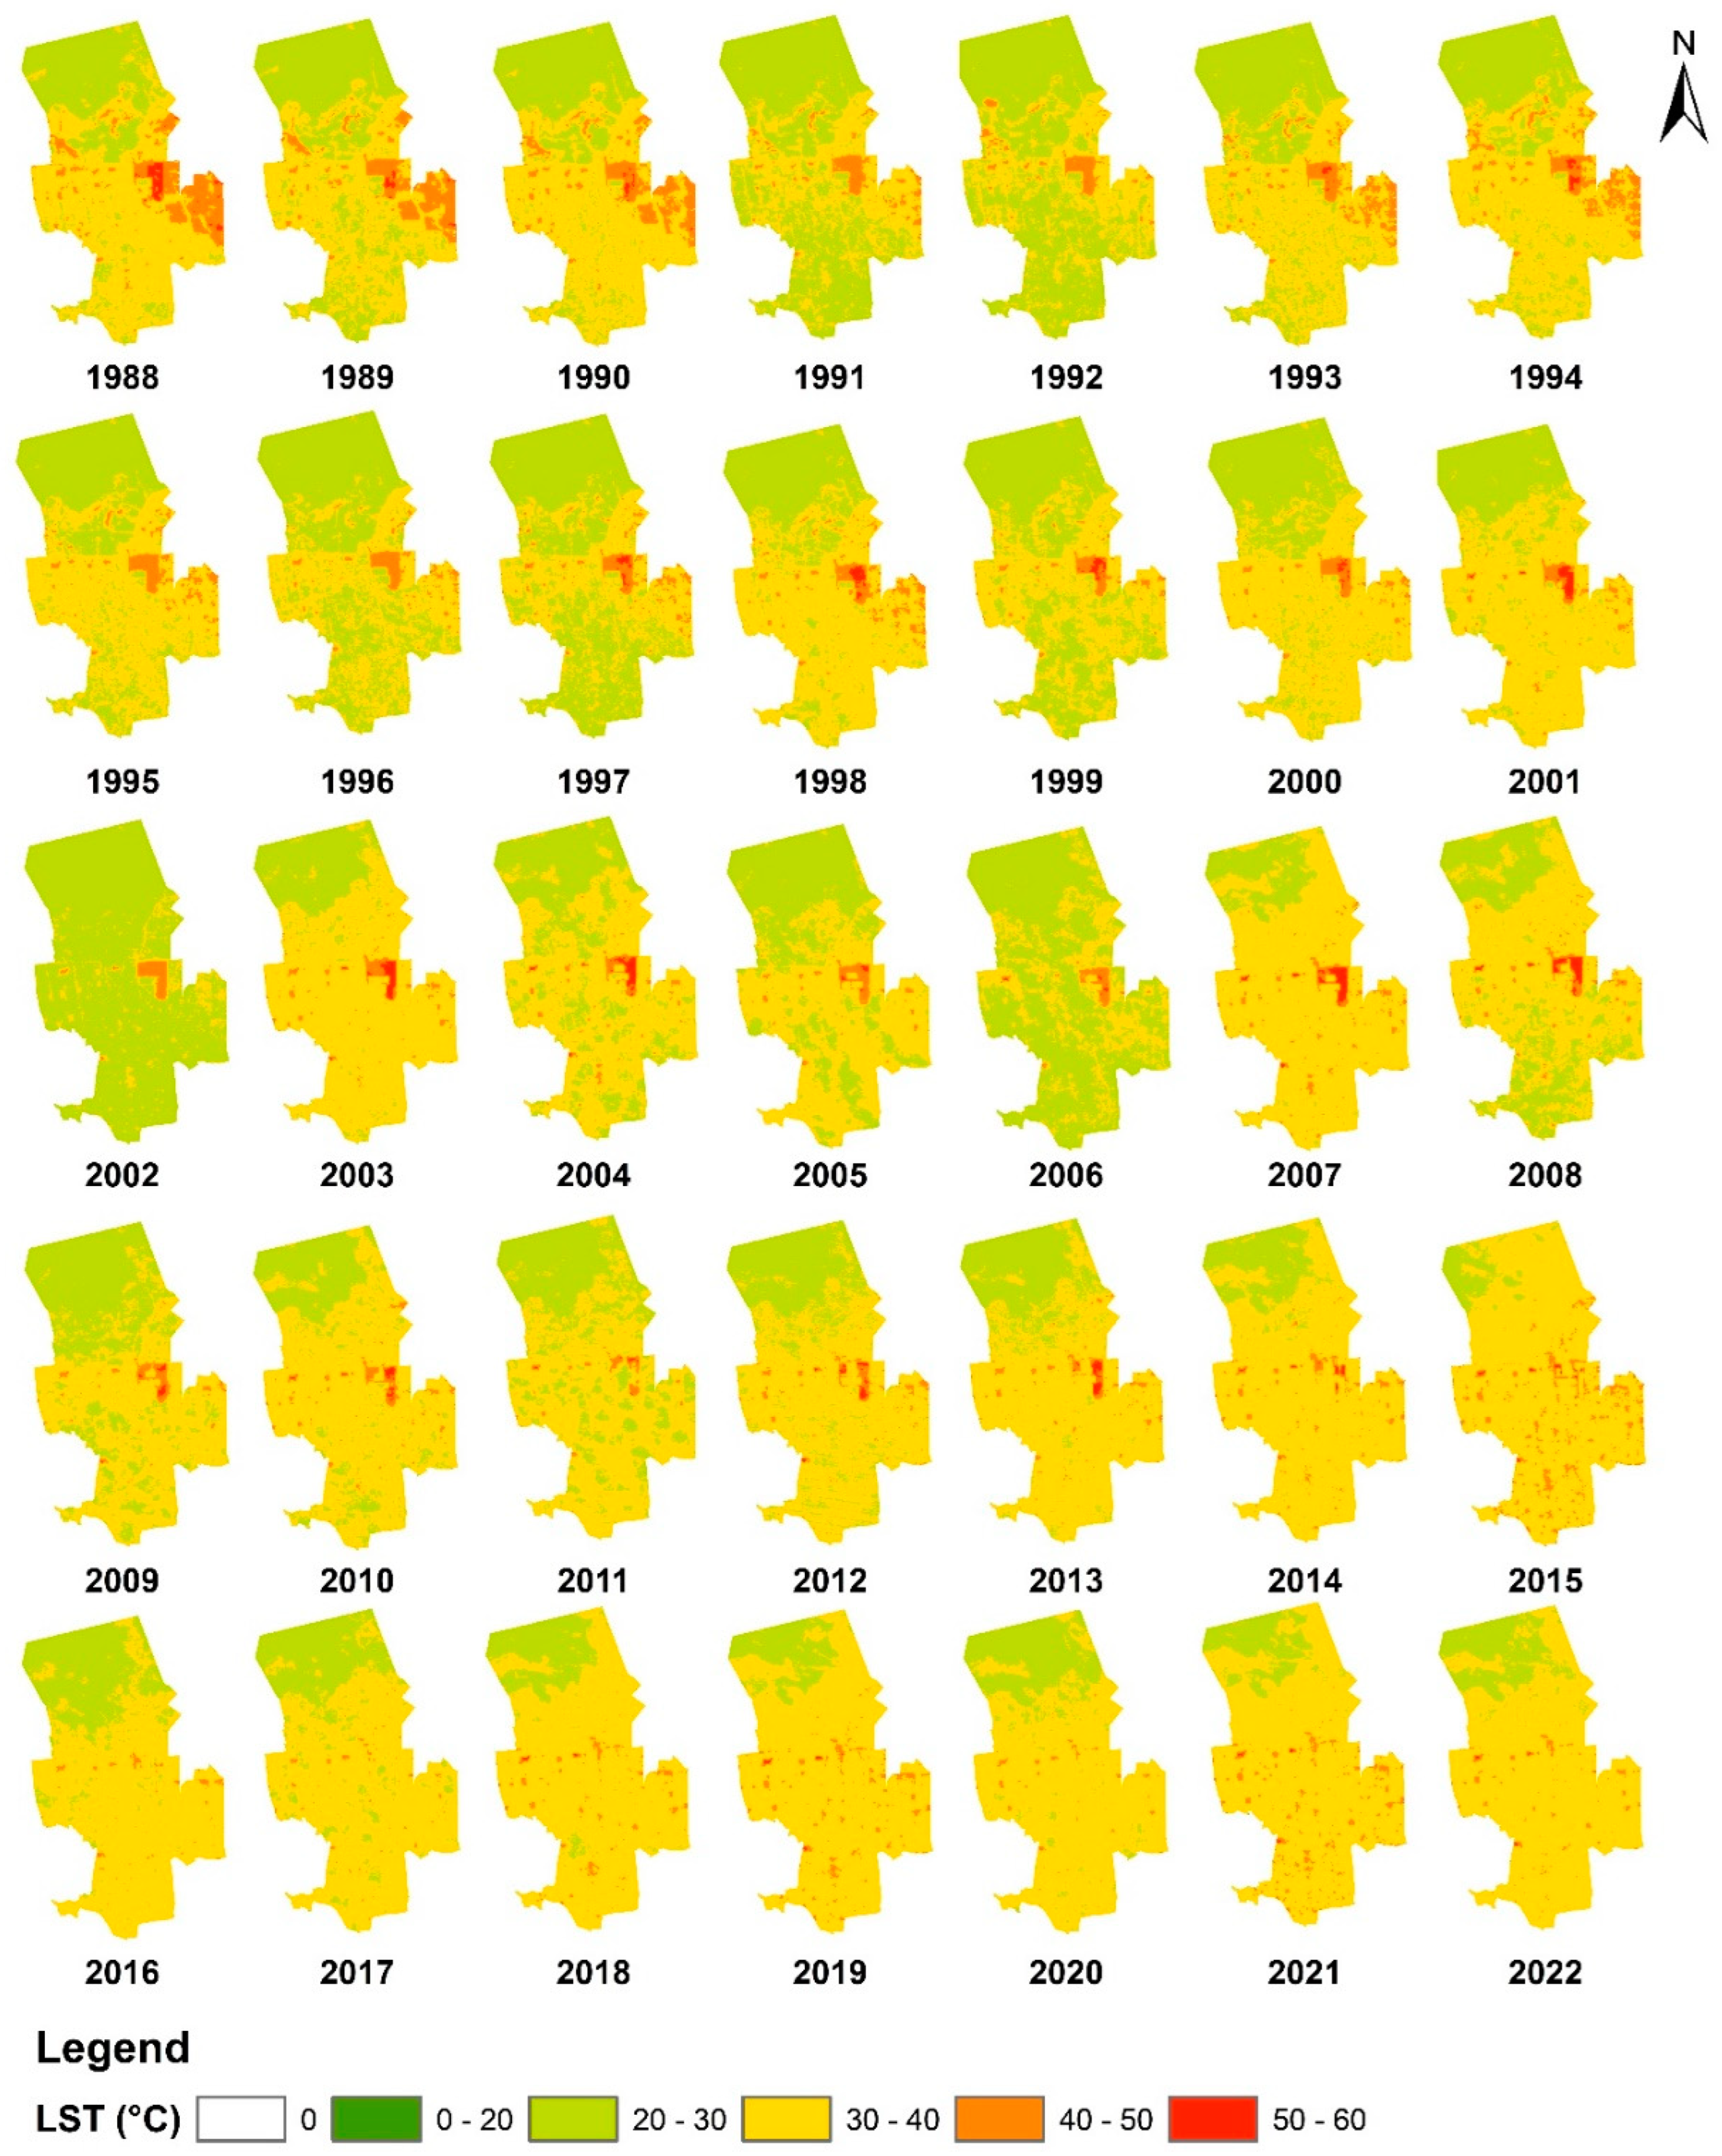
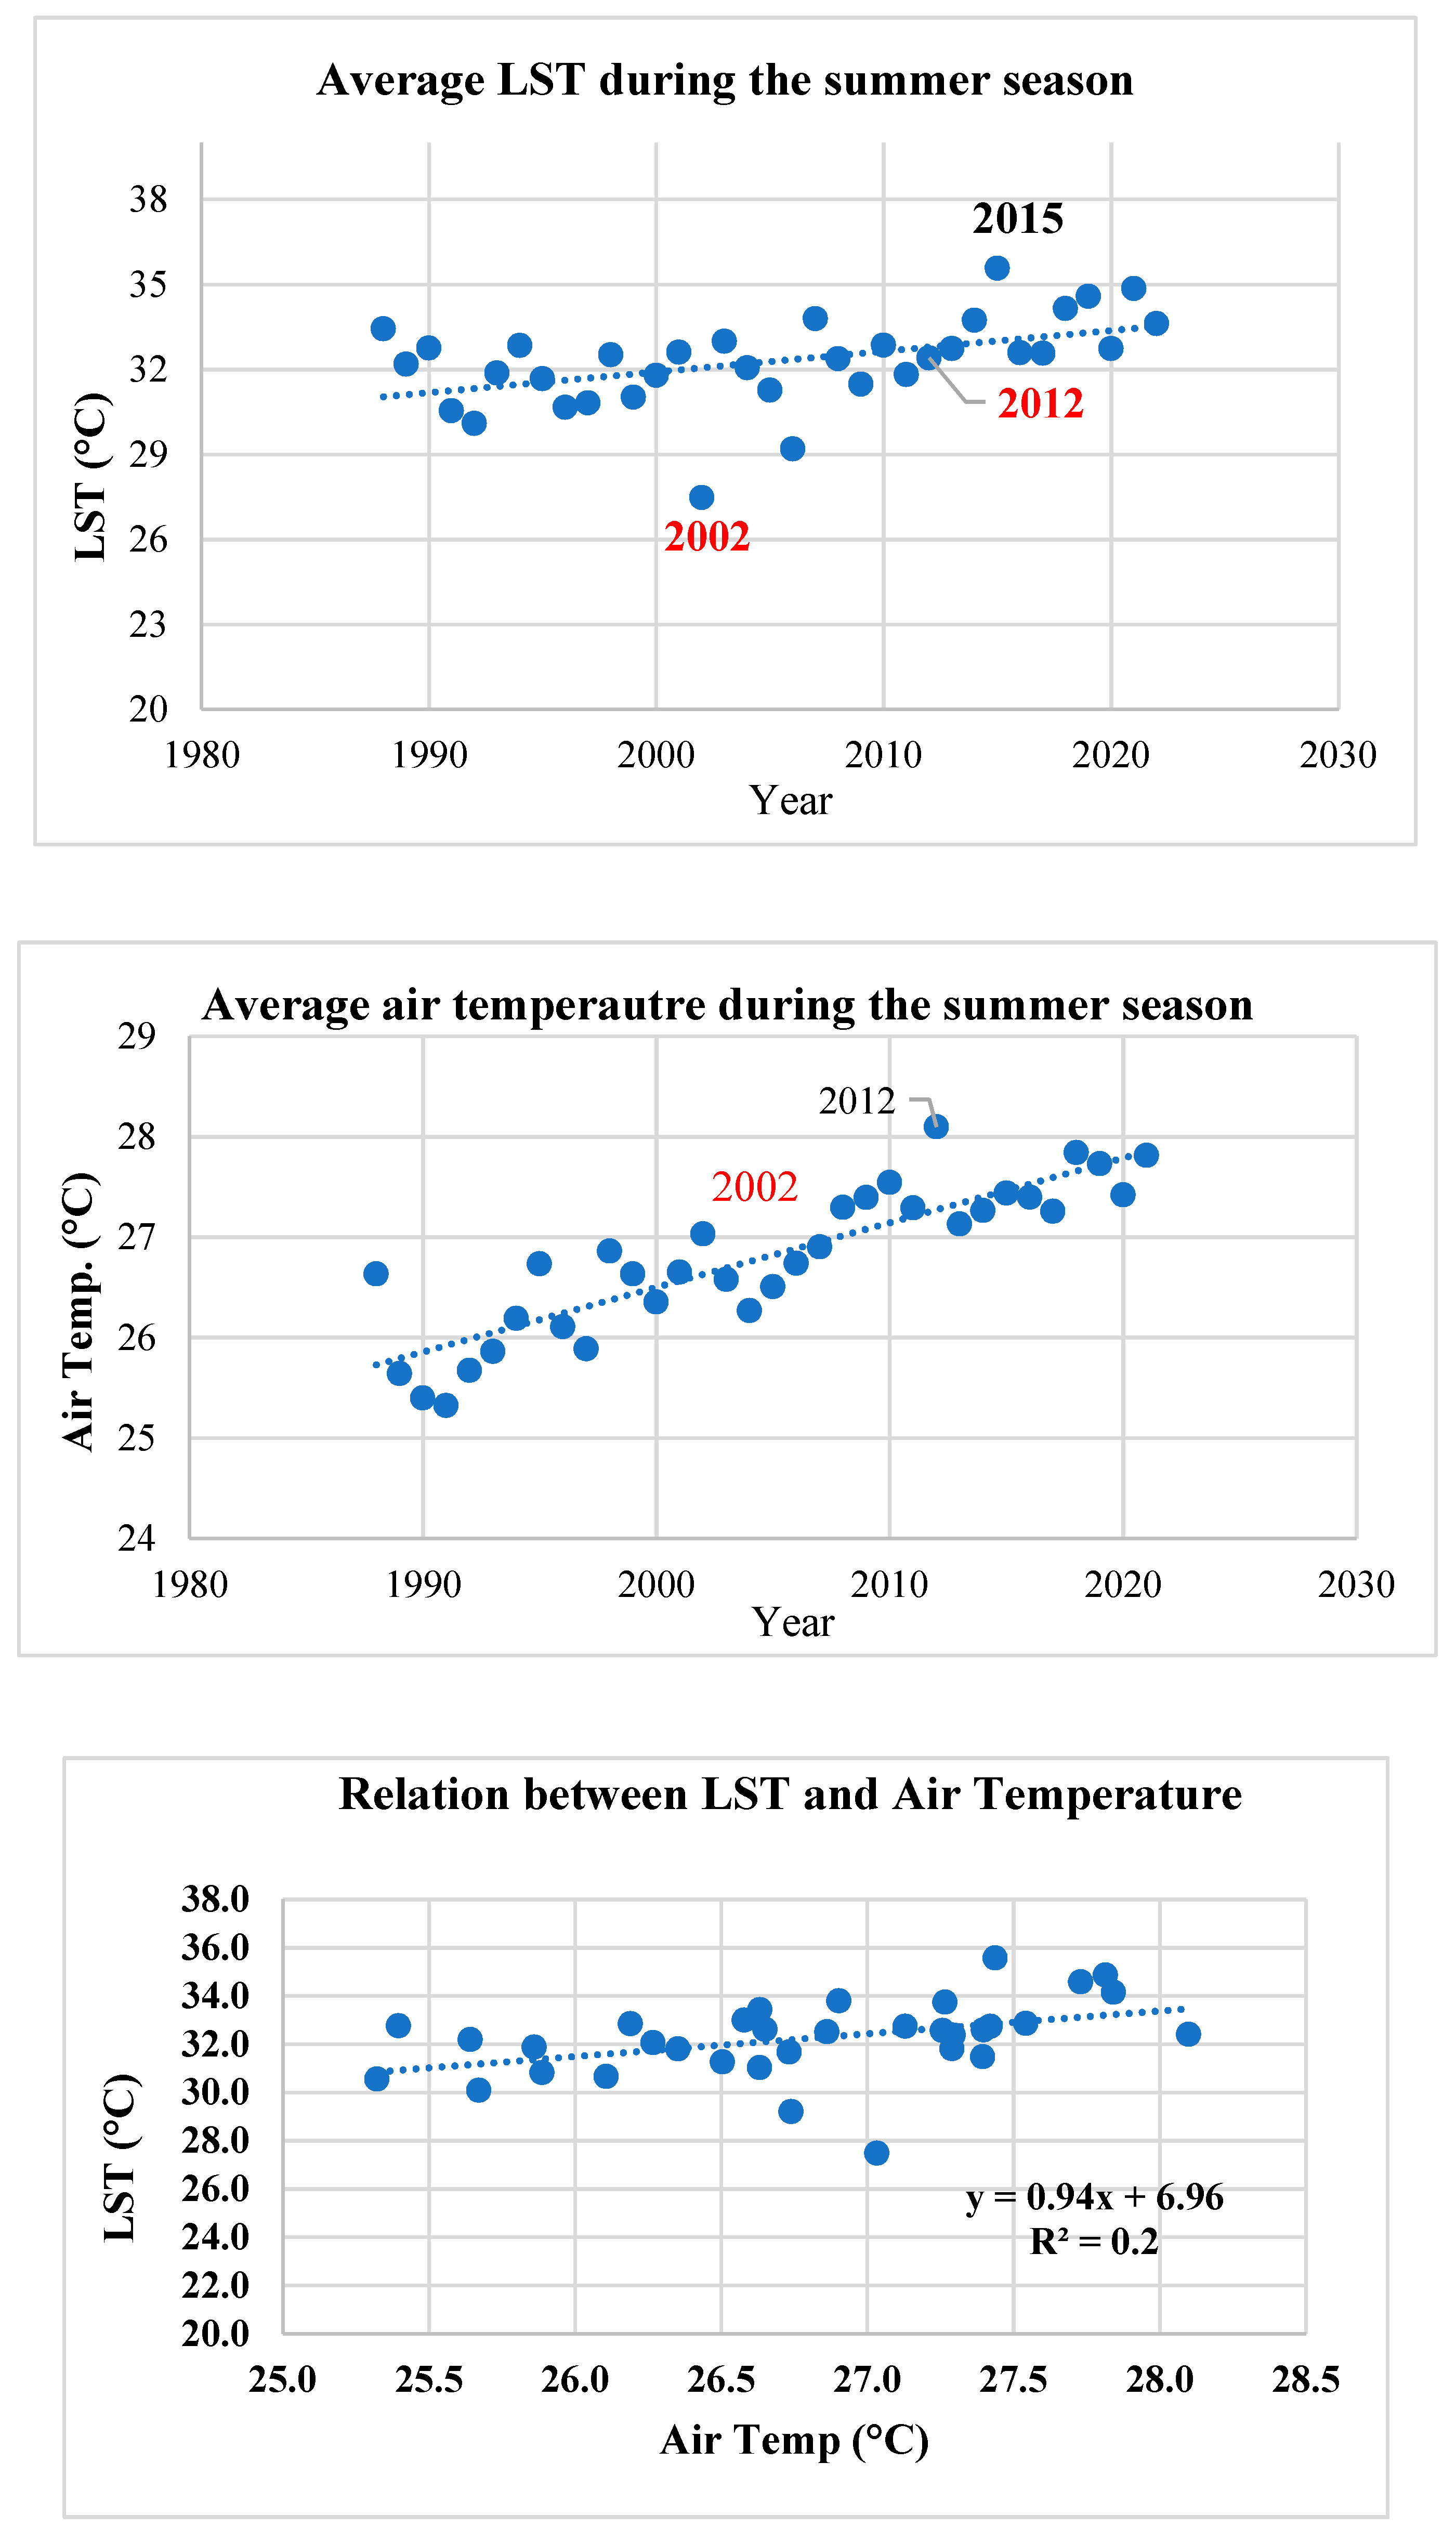
3.3. Spatiotemporal Changes in Land Surface Temperature

The annual LST maps in Figure 7 were estimated as the average LST during the summer months. These time series maps showed that the average summer LST decreased over the eastern part of the study area when gradually transformed from bare lands to fish farms and agricultural lands. Other regions showed an increasing LST trend over the years, indicating an increase in LST. Several factors can contribute to the increase in land surface temperature [26,51]. Those factors could be natural such as volcanic eruptions, solar radiation, and oceanic cycles, or human factors such as greenhouse gas emissions and urbanization in addition to other land use changes (e.g., deforestation and agricultural practices). However, human-induced factors typically have a greater impact on land surface temperature (LST) compared to natural factors. As human activities increase, the urban area increases instead of cooling surfaces (vegetation cover) [50].
In the El-Reyad district, air temperature and LST exhibited a general upward trend (Figure 8). The correlation between the two variables showed a weak positive relationship (R2 = 0.1902, Figure 8), reflecting the lower impact of global warming on the rising LST. For example, the average LST reached its maximum during the study period in 2015, whereas the air temperature for the same year was not the maximum. In contrast, significant changes in land use were observed over the study area, which was expected to have a higher impact on the area LST.

3.4. Prediction of Land Use/Land Cover

Predicting changes in land cover and land surface temperature (LST) is crucial for developing strategies to address upcoming challenges, as it determines the direction of change and its relationship to temperature change and thus enables decision makers to take precautionary measures to limit the increase in urban sprawl. The results of changes in land use and land cover over the past 34 years were used to predict future land cover patterns in the study area over the next 34 years. The CA-Markov model simulated the land use and land cover changes until 2056 (Figure 9A; Table 4). The findings indicated that the agricultural land in El-Reyad district will decrease by 11.38% between 2022 and 2056, due to conversion of agricultural activity to urbanization, wherein the total agricultural loss will be approximately 11,866.8 acres to different land uses, with an annual average of about 349.3 acres per year.
The expected results indicate that by 2056, there will be significant soil loss primarily in the highly fertile agricultural soils near urban areas. These soils have a clay texture, a high content of organic matter, and a high suitability for a wide range of crops. In contrast, the rest of Egypt’s soils are characterized by a sandy texture, lower organic matter content, and limited production capacity. The degradation of these fertile agricultural soils may have implications for food production in the affected area, potentially posing challenges to meeting the agricultural demands of the region [47,50,51,52,53]. Note how [50,51,52] these areas are in the southern parts of the study area (Figure 9). On the other hand, the urban area is expected to increase from 7378 acres in 2022 to 12,258.3 acres in 2056. The greatest expansion of urbanization will occur in the fertile soils and some fish farm areas. However, the area of fish farms is projected to grow by 6.1% by 2056 (from 17,612 acres in 2022 to 23,966.6 acres in 2056). Fish farms are the primary economic activity source for the inhabitants of the El-Reyad district; therefore, preserving their area is necessary [49]. Moreover, the area of Lake Burullus is expected to reduce by 1.1% of its size. Meanwhile, the natural vegetation is likely to increase by 2.2% of its size between 2022 and 2056. On the other hand, the area of bare lands is projected to decrease by 0.5% of its size until 2056. Parallel to the change in land cover, the land surface temperature will change, as it is associated with human activities. The results showed that with increasing vegetation cover, LST decreases, and vice versa, and this finding agrees with [26,51]. The results showed that urbanization growth is projected to be the main driver of the future increase in LST in the study area. During the past 34 years, the average LST increased from 32.4 °C in 1988 to 33.6 °C in 2022. In addition, the average LST is expected to increase to 36 °C by 2056. The maximum LST is expected to reach about 60 °C in 2056, as shown in Table 5. Figure 9B shows the dynamic correspondence between LST and land use/cover types, as the average LST decreased in the areas characterized by conversion of barren land to agricultural land. On the other hand, an increase in average LST was observed with the increase in urbanization. Despite increasing the average LST in general in the study area, there are some areas that have decreased their LST due to the change in the state of the land from barren to agricultural activities and fish farms.

4. Conclusions

This study depicted the anticipated changes in land use, land cover, and land surface temperature within rural areas located in arid regions. We analyzed the impact of human activities on land use modifications, particularly the conversion of cropland and vegetation areas into urban areas, which has resulted in alterations to the thermal landscape of the region. Despite this, the results of this study showed the negative impacts of urban sprawl on the rural environment by converting large areas into urbanization. The prediction results show that the total agricultural area will decrease by 11.7% by 2056. The barren lands and the natural vegetation areas were the most variable changes until 2022, wherein 97.3% of the bare area has changed to another use and natural vegetation lost about 34.1% of its area. On the other hand, the change in fish farms and urbanization accounted for 357.9% and 346.6%, respectively. This indicates an increase in urbanization and fish farming at the expense of the rest of the land uses in the study area. The results show an increase in average LST from 32.4 to 33.6 from 1988 to 2022. In addition, it expected that average LST will increase to 36 by 2056. Also, changes in LST have been linked to human activities and land uses where some areaa decreased their LST and others increased their LST. Overall, the results show the magnitude of the major land cover changes that have occurred in the El-Reyad region over the past three decades, providing important insights into the changing landscape of the region and potential impacts on its ecological and social systems. We recommend that further investigation can enhance our understanding of the relationship between land use/land cover (LULC) and land surface temperature (LST) in the context of the urban heat island (UHI) based on higher resolution imagery for LULC classification which can provide a more detailed and accurate representation of the land cover composition within urban areas. Therefore, local authorities must adopt policies to reduce urban encroachment on fertile lands on the one hand and to limit the rise in temperature on the other hand.

Author Contributions

Conceptualization, W.M., Z.M., S.M.A.K., E.H., B.A. and E.S.M.; methodology, W.M., S.M.A.K., E.S.M. and D.E.K.; software, E.H., A.E. and S.M.A.K.; validation, W.M., S.M.A.K., A.E. and B.A.; formal analysis; M.N. and E.H.; investigation, E.S.M., B.A. and S.M.A.K.; resources, W.M., E.H. and M.N.; writing original draft preparation, W.M., S.M.A.K., E.S.M. and M.N.; writing review and editing, W.M., S.M.A.K., E.S.M., D.E.K. and B.A.; visualization, S.C. and E.H.; supervision, E.S.M., D.E.K. and S.C. All authors have read and agreed to the published version of the manuscript.

Funding

Nanling Team Plan Project of Shaoguan (Double Carbon Spatial Big Data).

Institutional Review Board Statement

Not applicable.

Informed Consent Statement

Not applicable.

Data Availability Statement

Not applicable.

Acknowledgments

The authors would like to acknowledge the staff members of the Geography and GIS Department, Faculty of Arts and Geology Department, Faculty of Science, Kafrelsheikh University, Egypt for their comments and discussion, as well as the National Authority for Remote Sensing and Space Sciences and GDAS’ Project of Science and Technology Development (2021GDASYL-20210103003) for their support. This paper has been supported by the RUDN University Strategic Academic Leadership Program.

Conflicts of Interest

The authors declare no conflict of interest.

References

  1. Chen, M.; Liu, W.; Lu, D. Challenges and the way forward in China’s new-type urbanization. Land Use Policy 2016, 55, 334–339. [Google Scholar] [CrossRef]
  2. Desa, U.N. World Urbanization Prospects, the 2011 Revision; Population Division, Department of Economic and Social Affairs, United Nations Secretariat: New York, NY, USA, 2014. [Google Scholar]
  3. Araya, Y.H.; Cabral, P. Analysis and Modeling of Urban Land Cover Change in Setúbal and Sesimbra, Portugal. Remote Sens. 2010, 2, 1549–1563. [Google Scholar] [CrossRef]
  4. Hamdi, H.; Abdelhafez, S. Agriculture and soil survey in Egypt. In Soil Resources of Southern and Eastern Mediterranean Countries; CIHEAM: Paris, France, 2001; pp. 111–130. [Google Scholar]
  5. Muñoz-Rojas, M.; Jordán, A.; Zavala, L.M.; De la Rosa, D.; Abd-Elmabod, S.K.; Anaya-Romero, M. Impact of land use and land cover changes on organic carbon stocks in Mediterranean soils (1956–2007). Land Degrad. Dev. 2015, 26, 168–179. [Google Scholar] [CrossRef]
  6. El Nahry, A.H.; Mohamed, E.S. Potentiality of land and water resources in African Sahara: A case study of south Egypt. Environ. Earth Sci. 2011, 63, 1263–1275. [Google Scholar] [CrossRef]
  7. AbdelRahman, M.A.; Saleh, A.M.; Arafat, S.M. Assessment of land suitability using a soil-indicator-based approach in a geomatics environment. Sci. Rep. 2022, 12, 18113. [Google Scholar] [CrossRef] [PubMed]
  8. Elfadaly, A.; Lasaponara, R. On the use of satellite imagery and GIS tools to detect and characterize the urbanization around heritage sites: The case studies of the Catacombs of Mustafa Kamel in Alexandria, Egypt and the Aragonese Castle in Baia, Italy. Sustainability 2019, 11, 2110. [Google Scholar] [CrossRef]
  9. Abu-Hashim, M.; Lilienthal, H.; Schnug, E.; Lasaponara, R.; Mohamed, E.S. Can a Change in Agriculture Management Practice Improve Soil Physical Properties. Sustainability 2023, 15, 3573. [Google Scholar] [CrossRef]
  10. Shalaby, A.; Gad, A. Urban Sprawl Impact Assessment on The Fertile Agricultural Land of Egypt Using Remote Sensing and Digital Soil Database, Case Study: Qalubiya Governorate. In Proceedings of the US Egypt Workshop on Space Technology and Geoinformation for Sustainable Development, Cairo, Egypt, 14–17 June 2010; Volume 1417, p. 12. [Google Scholar]
  11. Kalnay, E.; Cai, M. Impact of Urbanization and Land-Use Change on Climate. Nature 2003, 423, 528–531. [Google Scholar] [CrossRef] [PubMed]
  12. Li, D.; Wu, S.; Liang, Z.; Li, S. The Impacts of Urbanization and Climate Change on Urban Vegetation Dynamics in China. Urban For. Urban Green. 2020, 54, 126764. [Google Scholar] [CrossRef]
  13. Li, X.; Stringer, L.C.; Dallimer, M. The Impacts of Urbanisation and Climate Change on The Urban Thermal Environment in Africa. Climate 2022, 10, 164. [Google Scholar] [CrossRef]
  14. Mohajerani, A.; Bakaric, J.; Jeffrey-Bailey, T. The Urban Heat Island Effect, Its Causes, and Mitigation, with Reference to the Thermal Properties of Asphalt Concrete. J. Environ. Manag. 2017, 197, 522–538. [Google Scholar] [CrossRef] [PubMed]
  15. Abulibdeh, A. Analysis of Urban Heat Island Characteristics and Mitigation Strategies For Eight Arid and Semi-Arid Gulf Region Cities. Environ. Earth Sci. 2021, 80, 1–26. [Google Scholar] [CrossRef]
  16. Leal Filho, W.; Wolf, F.; Castro-Díaz, R.; Li, C.; Ojeh, V.N.; Gutiérrez, N.; Bönecke, J. Addressing The Urban Heat Islands Effect: A Cross-Country Assessment of The Role of Green infrastructure. Sustainability 2021, 13, 753. [Google Scholar] [CrossRef]
  17. El-Zeiny, A.; Effat, H.; Mansour, K.; Shahin, A.; Elwan, K. Geo-environmental monitoring of coastal and land resources of Port Said Governorate, Egypt. Egypt. J. Remote Sens. Space Sci. 2022, 25, 157–172. [Google Scholar] [CrossRef]
  18. Boumaza, B.; Chekushina, T.V.; Kechiched, R.; Benabdeslam, N.; Brahmi, L.; Kucher, D.E.; Rebouh, N.Y. Environmental Geochemistry of Potentially Toxic Metals in Phosphate Rocks, Products, and Their Wastes in the Algerian Phosphate Mining Area (Tébessa, NE Algeria). Minerals 2023, 13, 853. [Google Scholar] [CrossRef]
  19. Hendawy, E.; Belal, A.A.; Mohamed, E.S.; Elfadaly, A.; Murgante, B.; Aldosari, A.A.; Lasaponara, R. The Prediction and Assessment of The Impacts of Soil Sealing on Agricultural Land in The North Nile Delta (Egypt) Using Satellite Data and GIS Modeling. Sustainability 2019, 11, 4662. [Google Scholar] [CrossRef]
  20. Tadese, S.; Soromessa, T.; Bekele, T. Analysis of The Current and Future Prediction of Land Use/Land Cover Change Using Remote Sensing and The CA-Markov Model in Majang Forest Biosphere Reserves of Gambella, Southwestern Ethiopia. Sci. World J. 2021, 2021, 6685045. [Google Scholar] [CrossRef]
  21. Vinayak, B.; Lee, H.S.; Gedem, S. Prediction of Land Use and Land Cover Changes in Mumbai City, India, Using Remote Sensing Data and A Multilayer Perceptron Neural Network-Based Markov Chain Model. Sustainability 2021, 13, 471. [Google Scholar] [CrossRef]
  22. Belal, A.A.; Mohamed, E.S.; Abu-Hashim, M.S.D. Land evaluation based on GIS-spatial multi-criteria evaluation (SMCE) for agricultural development in dry Wadi, Eastern Desert, Egypt. Int. J. Soil Sci. 2015, 10, 100–116. [Google Scholar] [CrossRef]
  23. Athukorala, D.; Murayama, Y. Urban Heat Island Formation in Greater Cairo: Spatio-Temporal Analysis of Daytime and Nighttime Land Surface Temperatures Along The Urban–Rural Gradient. Remote Sens. 2021, 13, 1396. [Google Scholar] [CrossRef]
  24. Mujabar, P.S. Spatial-Temporal Variation of Land Surface Temperature of Jubail industrial City, Saudi Arabia Due to Seasonal Effect by Using Thermal infrared Remote Sensor (TIRS) Satellite Data. J. Afr. Earth Sci. 2019, 155, 54–63. [Google Scholar] [CrossRef]
  25. Abd-Elmabod, S.K.; Fitch, A.C.; Zhang, Z.; Ali, R.R.; Jones, L. Rapid urbanisation threatens fertile agricultural land and soil carbon in the Nile delta. J. Environ. Manag. 2019, 252, 109668. [Google Scholar] [CrossRef] [PubMed]
  26. Imhoff, M.L.; Zhang, P.; Wolfe, R.E.; Bounoua, L. Remote sensing of the urban heat island effect across biomes in the continental USA. Remote Sens. Environ. 2010, 114, 504–513. [Google Scholar] [CrossRef]
  27. Myint, S.W.; Wentz, E.A.; Brazel, A.J.; Quattrochi, D.A. The impact of distinct anthropogenic and vegetation features on urban warming. Landsc. Ecol. 2013, 28, 959–978. [Google Scholar] [CrossRef]
  28. Yuan, F.; Bauer, M.E. Comparison of impervious surface area and normalized difference vegetation index as indicators of surface urban heat island effects in Landsat imagery. Remote Sens. Environ. 2007, 106, 375–386. [Google Scholar] [CrossRef]
  29. Adams, M.P.; Smith, P.L. A systematic approach to model the influence of the type and density of vegetation cover on urban heat using remote sensing. Landsc. Urban Plan. 2014, 132, 47–54. [Google Scholar] [CrossRef]
  30. Owen, T.W.; Carlson, T.N.; Gillies, R.R. An assessment of satellite remotely-sensed land cover parameters in quantitatively describing the climatic effect of urbanization. Int. J. Remote Sens. 1998, 19, 1663–1681. [Google Scholar] [CrossRef]
  31. Zhou, W.; Qian, Y.; Li, X.; Li, W.; Han, L. Relationships between land cover and the surface urban heat island: Seasonal variability and effects of spatial and thematic resolution of land cover data on predicting land surface temperatures. Landsc. Ecol. 2014, 29, 153–167. [Google Scholar] [CrossRef]
  32. Guo, G.; Wu, Z.; Xiao, R.; Chen, Y.; Liu, X.; Zhang, X. Impacts of urban biophysical composition on land surface temperature in urban heat island clusters. Landsc. Urban Plan. 2015, 135, 1–10. [Google Scholar] [CrossRef]
  33. Tran, D.X.; Pla, F.; Latorre-Carmona, P.; Myint, S.W.; Caetano, M.; Kieu, H.V. Characterizing the relationship between land use land cover change and land surface temperature. ISPRS J. Photogramm. Remote Sens. 2017, 124, 119–132. [Google Scholar] [CrossRef]
  34. Liu, X.; Hu, G.; Chen, Y.; Li, X.; Xu, X.; Li, S.; Wang, S. High-resolution multi-temporal mapping of global urban land using Landsat images based on the Google Earth Engine Platform. Remote Sens. Environ. 2018, 209, 227–239. [Google Scholar] [CrossRef]
  35. Tassi, A.; Vizzari, M. Object-Oriented LULC Classification in Google Earth Engine Combining Snic, Glcm, and Machine Learning Algoritms. Remote Sens. 2020, 12, 3776. [Google Scholar] [CrossRef]
  36. Anderson, J.R. A Land Use and Land Cover Classification System for Use with Remote Sensor Data; US Government Printing Office: Washington, DC, USA, 1976; Volume 964.
  37. Gemmechis, W.A. Land Use Land Cover Dynamics Using CA-Markov Chain a Case of Belete Gera Forest Priority Area South Western Ethiopia. 2022. Available online: https://www.researchgate.net/publication/364156701_Land_use_land_cover_Dynamics_using_CA-Markov_Chain_A_case_of_Belete_Gera_Forest_Priority_Area_South_Western_Ethiopia (accessed on 10 May 2023).
  38. Olofsson, P.; Foody, G.M.; Herold, M.; Stehman, S.V.; Woodcock, C.E.; Wulder, M.A. Good Practices for Estimating Area and Assessing Accuracy of Land Change. Remote Sens. Environ. 2014, 148, 42–57. [Google Scholar] [CrossRef]
  39. Carletta, J. Assessing agreement on classification tasks: The kappa statistic. arXiv 1996, arXiv:cmp-lg/9602004. [Google Scholar]
  40. Pontius, R.G., Jr.; Millones, M. Death to Kappa: Birth of quantity disagreement and allocation disagreement for accuracy assessment. Int. J. Remote Sens. 2011, 32, 4407–4429. [Google Scholar] [CrossRef]
  41. Warrens, M.J. Properties of the quantity disagreement and the allocation disagreement. Int. J. Remote Sens. 2015, 36, 1439–1446. [Google Scholar] [CrossRef]
  42. Maxwell, A.E.; Warner, T.A. Thematic classification accuracy assessment with inherently uncertain boundaries: An argument for center-weighted accuracy assessment metrics. Remote Sens. 2020, 12, 1905. [Google Scholar] [CrossRef]
  43. Said, M.E.; Ali, A.M.; Borin, M.; Abd-Elmabod, S.K.; Aldosari, A.A.; Khalil, M.M.; Abdel-Fattah, M.K. On the use of multivariate analysis and land evaluation for potential agricultural development of the northwestern coast of Egypt. Agronomy 2020, 10, 1318. [Google Scholar] [CrossRef]
  44. AbdelRahman, M.A.; Afifi, A.A.; Scopa, A. A time series investigation to assess climate change and anthropogenic impacts on quantitative land degradation in the North Delta, Egypt. ISPRS Int. J. Geo-Inf. 2021, 11, 30. [Google Scholar] [CrossRef]
  45. AbdelRahman, M.A.; Shalaby, A.; Aboelsoud, M.H.; Moghanm, F.S. GIS spatial model based for determining actual land degradation status in Kafrelsheikh Governorate, North Nile Delta. Model. Earth Syst. Environ. 2018, 4, 359–372. [Google Scholar] [CrossRef]
  46. Jiménez-González, M.A.; Álvarez, A.M.; Carral, P.; Abd-Elmabod, S.K.; Almendros, G. The pyrolytical fingerprint of nitrogen compounds reflects the content and quality of soil organic carbon. Geoderma 2022, 428, 116187. [Google Scholar] [CrossRef]
  47. Abd El-Hamid, H.T.; Nour-Eldin, H.; Rebouh, N.Y.; El-Zeiny, A.M. Past and Future Changes of Land Use/Land Cover and the Potential Impact on Ecosystem Services Value of Damietta Governorate, Egypt. Land 2022, 11, 2169. [Google Scholar] [CrossRef]
  48. Lasner, T.; Mytlewski, A.; Nourry, M.; Rakowski, M.; Oberle, M. Carp land: Economics of fish farms and the impact of region-marketing in the Aischgrund (DEU) and Barycz Valley (POL). Aquaculture 2020, 519, 734731. [Google Scholar] [CrossRef]
  49. Hossen, H.; Negm, A. Change Detection in The Water Bodies of Burullus Lake, Northern Nile Delta, Egypt, Using RS/GIS. Procedia Eng. 2016, 154, 951–958. [Google Scholar] [CrossRef]
  50. Abd-Elmabod, S.K.; Bakr, N.; Muñoz-Rojas, M.; Pereira, P.; Zhang, Z.; Cerdà, A.; Jordán, A.; Mansour, H.; De la Rosa, D.; Jones, L. Assessment of soil suitability for improvement of soil factors and agricultural management. Sustainability 2019, 11, 1588. [Google Scholar] [CrossRef]
  51. AbdelRahman, M.A.; Metwalli, M.R.; Gao, M.; Toscano, F.; Fiorentino, C.; Scopa, A.; D’Antonio, P. Determining the Extent of Soil Degradation Processes Using Trend Analyses at a Regional Multispectral Scale. Land 2023, 12, 855. [Google Scholar] [CrossRef]
  52. AbdelRahman, M.A.E.; Natarajan, A.; Srinivasamurty, C.A.; Hegde, R. Estimating soil fertility status in physically degraded land using GIS and remote sensing techniques in Chamarajanagar district, Karnataka, India. Egypt. J. Remote Sens. Space Sci. 2016, 19, 95–108. [Google Scholar] [CrossRef]
  53. AbdelRahman, M.A.E.; Engel, B.; Eid, M.S.M.; Aboelsoud, H.M. A new index to assess soil sustainability based on Temporal Changes of Soil Measurements Using Geomatics–An example from El-Sharkia, Egypt. All Earth 2022, 34, 147–166. [Google Scholar] [CrossRef]
Figure 1. Location of the study area and some of its geographical characteristics. (A) Location of the study area over Landsat-9 image. (B) Map of the study area. (C) The distribution of roads in the district. (D) Canals and drains. (E) Digital Elevation Model (DEM) of the study area.
Sustainability 15 13497 g001
Figure 2. Flowchart work steps of the study area.
Sustainability 15 13497 g002
Figure 3. Land cover change between 1988 and 2022. (a) Land cover change in 1988 based on TM image. (b) Land cover change in 2000 based on TM image. (c) Land cover change in 2011 based on ETM+ image. (d) Land cover change in 2022 based on Landsat-9 image.
Sustainability 15 13497 g003
Figure 4. Bar graph showing the distribution area by (acres) of land cover in the El-Reyad District.
Sustainability 15 13497 g004
Figure 5. Changes in land cover classes in the study area between 1988 and 2022 for six categories: urban (a), agriculture (b), fish farms (c), bare lands (d), Lake Burullus (e), and natural vegetation (f).
Sustainability 15 13497 g005
Figure 6. Net change % in land cover types between 1988 and 2022, A negative sign indicates a decrease in area by %.
Sustainability 15 13497 g006
Figure 7. The spatiotemporal variation of LST over the study area was estimated from Landsat images from 1988 to 2022.
Sustainability 15 13497 g007
Figure 8. LST and air temperature trends and relationships during the study period.
Sustainability 15 13497 g008
Figure 9. (A). Prediction of land cover changes in 2056 in the El-Reyad district. (B). Prediction of LST in 2056 in the El-Reyad district.
Sustainability 15 13497 g009
Table 1. Accuracy assessment of LULC from 1988 to 2022.
LULC1988200020112022
Producer (%)User (%)Producer (%)User (%)Producer (%)User (%)Producer (%)User (%)
Urban97.0790.7197.1492.8997.7696.1597.7697.76
Agricultural89.7091.7291.0491.7291.7295.3195.5897.74
Fish farms84.6191.6689.8895.2393.1895.3496.5997.70
Bare ands85.1076.9286.5386.5391.83788.2397.8288.23
Lake Burullus70.9673.3381.4873.3387.8780.5593.5487.87
Natural vegetation58.3377.7769.5688.8883.3388.238594.44
Overall accuracy88.2 91 93.6 96.2
Kappa statistic0.84 0.88 0.915 0. 95
Quantity Disagreement0.03 0.025 0.018 0.01
Allocation Disagreement0.090 0.065 0.042 0.030
Table 2. Land cover change from 1988 to 2022.
Land Cover1988200020112022
Acre%Acre%Acre%Acre%
Urban1642.21.627372.65093.24.973787.1
Agricultural45,791.24456,953.454.759,285.856.957,71555.4
Fish farms3855.63.716,398.215.717,588.216.917,61216.9
Bare lands29,440.628.37354.27.12070.62785.40.7
Lake Burullus8853.68.511,114.610.710,186.49.811,090.810.6
Natural vegetation14,589.4149662.89.39948.49.59615.29.2
Sum104,173100104,173100104,173100104,173100
Table 3. The change detection of lands in the El-Reyad district between 1988 to 2022.
Land CoverDecreased (Acre)%Unchanged (Acre)%Increased (Acre)%
Agricultural3950.89.041,816.669.315,874.636.3
Urban--1094.81.86283.210.4
Fish Farms1404.23.22427.64.015,184.425.2
Bare lands28,988.466.2547.40.9--
Lake Burullus2237.25.16830.611.34260.29.7
Natural Vegetation7187.616.47639.812.721895
Total43,768.2100.060,356.8100.043,792100.0
Table 4. Prediction of land cover in the El-Reyad District in 2056.
20222056Change
Acre%Acre%%
Agricultural57,71555.445,848.1744.01−11.38
Urban73787.112,258.311.74.66
Fish Farms17,61216.923,960.2523.06.10
Bare lands785.40.8329.64670.39−0.48
Lake Burullus11,090.810.69845.339.45−1.149
Natural vegetation9615.29.211,924.3211.442.24
Sum437.7100437.7100-
Table 5. Statistics of LST until 2056.
LST19882000201120222056
Min24.924.524.627.528
Max54.052.153.054.459.9
Average ± SD32.4 ± 0.531.8 ± 0.832.81 ± 0.333.6 ± 0.236 ± 0.5
SD is stander deviation.
Disclaimer/Publisher’s Note: The statements, opinions and data contained in all publications are solely those of the individual author(s) and contributor(s) and not of MDPI and/or the editor(s). MDPI and/or the editor(s) disclaim responsibility for any injury to people or property resulting from any ideas, methods, instructions or products referred to in the content.

