Abstract
Due to the importance of the allocation of energy microgrids in the power distribution networks, the effect of the uncertainties of their power generation sources and the inherent uncertainty of the network load on the problem of their optimization and the effect on the network performance should be evaluated. The optimal design and allocation of a hybrid microgrid system consisting of photovoltaic resources, battery storage, and a backup diesel generator are discussed in this paper. The objective of the problem is minimizing the costs of power losses, energy resources generation, diesel generation as backup resource, battery energy storage as well as load shedding with optimal determination of the components energy microgrid system include its installation location in the 33-bus distribution network and size of the PVs, batteries, and Diesel generators. Additionally, the effect of uncertainties in photovoltaic radiation and network demand are evaluated on the energy microgrid design and allocation. A Monte Carlo simulation is used to explore the full range of possibilities and determine the optimal decision based on the variability of the inputs. For an accurate assessment of the system’s reliability, a forced outage rate (FOR) analysis is performed to calculate potential photovoltaic losses that could affect the operational probability of the system. The cloud leopard optimization (CLO) algorithm is proposed to optimize this optimization problem. The effectiveness of the proposed algorithm in terms of accuracy and convergence speed is verified compared to other state-of-the-art optimization methods. To further improve the performance of the proposed algorithm, the reliability and uncertainties of photovoltaic resource production and load demand are investigated.
1. Introduction
1.1. Motivation and Background
Renewable energy sources (RESs) are rapidly expanding to reduce reliance on fossil fuels and damage to the environment [1,2]. The most common forms of RES include solar, wind, and hydroelectricity. As clean and efficient energy sources, they can contribute to a reduction in carbon emissions and a slowdown in climate change [3,4]. Moreover, due to the exchange of active/reactive energy between generation sources and the grid, the basic characteristics of the distribution network are changing. Power networks are affected by these production sources depending on their location and capacity [5,6]. It is therefore important to take into consideration the optimal location and size of these renewable energy resources during the design of a power system [7,8]. The ideal design of these kinds of systems is the objective of hybrid system optimization. In other words, the capacity of the RESs and energy storage systems (ESSs) should be chosen for the hybrid system’s optimization in a manner that reduces system costs and ensures a specific degree of reliability for the load [9,10]. Additionally, the ESS, which serves as a backup system, must be big enough to handle the load when the RESs alter their output [11]. Therefore, determining the capacity and site of RESs and EESs is crucial for the best design of hybrid microgrid energy systems. On the other hand, energy microgrids have the ability to connect to the grid and can inject power into the grid and also receive power from the grid [12,13]. If they are installed in the best place in the network and their optimal capacity is determined, in addition to improving the performance of the network, they can reduce energy production costs and there is a greater chance for RES to compete with other energy production methods [14,15].
1.2. Literature Review and Research Gap
The topic of distributed energy resources (DERs) allocation in distribution networks has been the subject of several research studies. These studies have mostly employed distributed wind and photovoltaic energy sources without storage devices. Finding the ideal installation site and the ideal resource capacity has received most of the focus in this kind of study. Numerous techniques have been used to address the problem of optimum DERs allocation. Generally, these solution techniques can be classified into three main techniques: classical, analytical, and metaheuristic [16]. Solving problems using classical methods involves the use of mathematical models. Traditional techniques that can quickly determine the best solution include linear programming and the Lagrange function. These approaches may not be able to identify the ideal solution, nevertheless, when the problem’s dimensions and the number of variables grow [17]. A mathematical equation or algorithm is used to solve a problem through analytical methods. However analytical approaches may not converge to the global optimum points [18]. Despite the fact that analytical methods may be stuck at the local optimal, there are studies such as [19,20] which provide the mechanism for finding global optimal for multiple DGs. In metaheuristic methods, heuristics are used to find approximate solutions to problems. The Jacobian or Hessian matrices must be calculated in addition. These methods are conceptually simple, and it is easy to use them in solving different kinds of optimization problems. Due to the complexity and nonlinear nature of the optimal DER allocation problem, evolutionary or metaheuristic approaches have proven to be the most effective in recent years. Using artificial intelligence optimization and machine learning, refs. [21,22] predicts the energy of wind resources at several sites in Jordan. Weibull, Gamma, and Rayleigh distribution models were used to characterize the provided wind data. Using statistical analysis to ascertain the wind characteristics determined by measured wind data, ref. [23] presents a technical evaluation of wind power potential for seven locations in Jordan. The findings of this study indicate that Jordan has a great potential for wind energy and that its environmental and energy policy goals can be met by exploiting wind energy.
In [24], a bacterial foraging optimization algorithm is employed to minimize the total power loss and enhance the voltage characteristics of radial distribution systems with distributed generation. The proposed method is intended to enhance the efficacy of the bacterial foraging optimization algorithm. Distributed generators and battery energy storage are utilized concurrently to enhance the reliability of distribution networks in [25]. In order to address the optimization problem, a multi-objective evolutionary algorithm is utilized to enhance the network’s dependability and reduce drop in voltage. A method for the best location of distributed green power and capacitor banks determined by technical and economic parameters is devised in [26]. In [27], the optimal DG scheduling problem is allocated in a distribution network. The analysis of the DG planned problem is specifically depicted as a financial cost-benefit analysis due to reduced power purchased and reduced penalty emission cost resulting from decreased emission in the network. In [28], an optimal structure for a hybrid photovoltaic–wind system design combined with battery storage appears, taking based on the cloud uncertainty modeling and battery degradation into account, and minimizing the total net present cost, load loss, and battery degradation cost. In [29], the economic modeling of a sustainable island system consisting of a wind turbine, battery, combined heat and power system, and thermal storage to simultaneously meet electrical and thermal demands is carried out. The method seeks to discover the lowest possible capital, repair and maintenance, and operating costs, as well as the least amount of pollution associated with these factors. In [30], teaching and learning algorithms are applied to allocate the distributed generation in distribution networks. The particle swarm optimization technique is used in [31] to place wind turbines and photovoltaic cells in the distribution network with the goal of lowering losses and enhancing voltage stability.
Aside from the distribution network, several research studies have been conducted in developing and planning the hybrid system. A photovoltaic–wind system with ESS is presented in [32] as a means of reducing yearly energy costs. The annual capital value and maintenance costs are included in the expenses. To achieve the most efficient design for the system, discrete cooling methods, a harmony search, and a chaotic search for discrete harmony have been employed. As a result of the results of this study, it has been demonstrated that the cooling method based on the chaotic search for discrete harmony is an effective method for improving the capacity of hybrid systems, despite its ease of implementation. Optimized load supply has been achieved with a hybrid system composed of wind turbines, photovoltaic panels, and fuel cells [33]. By taking reliability limitations into account, the problem aims to reduce energy production system costs. The system’s expenses include original capital expenditures, ongoing operation, and maintenance expenses, as well as the cost of unsupplied load energy. The enhanced particle community method has been used to address the issue. The likelihood index of failing to deliver a particular load has been considered in a model for finding the ideal capacity of a photovoltaic wind–fuel cell hybrid system that uses the Bee algorithm with the goal function of reducing initial investment and system maintenance expenses [34]. The ideal number of photovoltaic arrays, wind turbines, and hydrogen storage tanks has been chosen for this research while taking load demand into account. The findings indicated that more money is needed to provide a greater system load likelihood. In [35], a methodology for calculating a photovoltaic–wind-battery hybrid system’s equipment capacity has been presented with generation and demand power balance. Minimizing yearly energy production costs in terms of equipment performance and investment expenses is the aim function. The absence of load power has been used in this research as a gauge for how well the hybrid system can handle the load demand. In [36], a model has been presented for maximizing wind–photovoltaic systems’ efficiency to serve residential loads. The suggested model has been used in this research to calculate DRE’s optimum capacity while reducing maintenance and investment expenses. An index of dependability, which measures the likelihood of a shortage of load power, reflects the system’s inability to deliver the load. In this analysis, the DER’s capacity is determined such that the system’s overall yearly cost is kept to a minimum. In addition, the power deficit remains within a certain range. Photovoltaic–wind systems with battery storage and diesel generator backup sources have been investigated in [37] aiming to eliminate the load energy deficit and reduce the initial cost of the system as well as energy expenditures.
The research gaps of the literature are presented as follows:
- The literature review showed that not much comprehensive research has been conducted on the improvement of distribution network performance using hybrid microgrid energy systems with DG and storage technologies.
- Energy microgrid systems with the ability to connect to the grid and inject programmable power based on the energy storage system can be effective on the grid performance. Fewer studies have addressed the role of energy storage devices in addition to renewable energy sources in their effectiveness in injecting programmable power into the distribution network.
- On the other hand, the role of energy microgrids on load shedding in the distribution network has not been well addressed. Additionally, the review of the literature has shown that the effect of the uncertainty of the power of renewable sources in energy microgrids on the performance of the distribution network has not been well seen and evaluated.
- Therefore, based on the described cases, it is necessary to provide a comprehensive study for the allocation of energy microgrids, including renewable energy sources, backup sources, as well as energy storage elements, taking into account the uncertainty of production.
1.3. Contributions
This research examines the deterministic and stochastic design and allocation of a hybrid microgrid energy system in the distribution network that the microgrid consists of PV resources, diesel generators, and battery energy storage. The hybrid microgrid system’s load is self-sufficient, without requiring energy from the upstream network. The objective function is defined as minimizing the costs of power losses, energy resources generation, diesel generation as backup resource, battery energy storage as well as load shedding and the optimal site and size of the microgrid was found using the CLO. Main contributions of the paper are listed as follows:
- The simultaneous design and allocation of the hybrid energy microgrid system in the IEEE 33-bus distribution network with the aim of minimizing the costs of power losses, production of photovoltaic resources, backup power of diesel generator, battery energy storage, and the cost of load shedding, taking into account the uncertainty of production of renewable photovoltaic resources, has been presented.
- The cloud leopard optimization (CLO) algorithm [38] inspired by the hunting behavior of cloud leopards has been used to determine the optimal location of energy microgrid installation as well as the optimal installation capacity of production and storage resources in the distribution network.
- The stochastic problem has been implemented considering the uncertainty of production of photovoltaic resources and the obtained results have been compared with the problem without uncertainty.
- To verify the performance of the CLO algorithm in solving the problem, its performance has been compared with the methods of particle swarm optimization (PSO) [39], fish table foraging (MRFO) [40], and artificial electric field algorithm (AEFA) [41].
- The effect of changes in the capacity of photovoltaic sources as well as changes in its availability on solving the problem has been evaluated.
1.4. Structure of the Paper
The article structure is that in Section 2, the problem formulation is presented, and the objective function (OF) and limitations are modeled. Section 3 presents the proposed metaheuristic method for solving the design and allocation problem of hybrid systems. The simulation results are given and discussed in Section 4, and the research findings are concluded in Section 5.
2. Problem Formulation
This research challenges the construction of an optimized hybrid system for commercial buildings. This microgrid consists of a photovoltaic panel, an energy storage system, and a diesel generator. By solving this problem, the optimal number of batteries and diesel engine size, as well as the size of the photovoltaic panel, can be determined.
2.1. Objective Functions
The distribution network’s performance, however, may be affected by the source of additional power. Therefore, it may be of critical importance to place the hybrid system correctly. Therefore, hybrid system placement is considered. Installation, maintenance, and replacement costs associated with photovoltaic panels, batteries, and diesel generators, as well as system losses and load shedding, are included in the objective functions. Furthermore, profits derived from electricity sales to the grid are included in the objective function. The objective function is defined as the total costs of power loss, PVs, batteries, diesel generators, load shedding costs minus the obtained profit of the microgrid from the sale of excess power to the distribution network as Minimize F = Cost-Profit.
In the following, the various parts of the cost function and the profit resulting from the sale of electricity to the grid by the microgrid have been formulated.
2.1.1. Cost of Power Losses
The cost of power losses in the distribution network is included in the problem of optimal hybrid system placement. Here, the total cost of power losses, , is expressed as follows [1,42]:
where is price of electricity is at hour t and day d and is the value of power loss in the grid in day d at hour t. It should be highlighted that in the relevant research, the electricity price varies depending on the time of day—peak, midday, and off-peak.
2.1.2. Cost of PV Generation
A photovoltaic panel has expenses associated with it, such as installation cost (), maintenance cost (), and replacement cost (). The cost of purchasing various kinds of equipment is determined based on their quantity and is performed just once. When it comes to maintenance charges, the cost is expressed as a monetary amount every year. In other words, the expenditures that were computed are yearly. As a result, the total costs () associated with photovoltaic panels are considered as follows [1,5,28,42]:
where is number of PV panels, denotes purchase and installation cost of ith PV, is operation and maintenance cost of per kW PV power in a year, is maintenance cost of ith PV, and is replacement cost of ith PV. and refer to the inflation and interest rates, respectively. L is useful lifetime of the PV and n is number of each PV replacement.
2.1.3. Cost of ESS
The cost of the ESS () is stated in the same way as the cost of a photovoltaic panel as follows [1,5,28,42]:
where , , and are, respectively, the investment, operation and maintenance, and replacement costs of ESS. is number of batteries, denotes purchase and installation cost of ith battery, is operation and maintenance cost of per kWh battery power in a year, is maintenance cost of ith battery, and is replacement cost of ith battery. and refer to the inflation and interest rates, respectively. is useful lifetime of the battery and n is number of each battery replacement.
2.1.4. Cost of Diesel Generator
Investment cost (), maintenance cost (), and replacement cost () are included in the total cost () of diesel generator [1,5,28,42]:
where is number of diesel generators, denotes purchase and installation cost of ith diesel, is operation and maintenance cost of per kW diesel power in a year, is maintenance cost of ith diesel, and is replacement cost of ith diesel. and refer to the inflation and interest rates, respectively. is useful lifetime of the diesel and n is number of each diesel replacement.
2.1.5. Cost of Load Shedding
When shedding a customer’s load, there are costs involved that must be considered by the OF. This cost, which is determined as follows, is calculated by the multiplication of the price of load shedding multiplied by the amount of annual load shedding cost () in the installed hybrid system as follows:
where the cost and value of load shedding in day d at hour t are represented by and , respectively. Here, for the constructed microgrid, , where , , , and are the output power generation of PV system, diesel generator, battery system, as well as load demand in the hybrid system, respectively.
2.1.6. Profit from the Sale of Excess Power
If the electricity produced by the photovoltaic array is more than the network load and the battery’s energy capacity, it can be sale to the network, generating a profit. This advantage may be expressed as follows [42]:
where is the profit from the sale of excess power in the hybrid system during a year and is excess power in day d and hour t. Note that here .
2.2. Constraints
When putting the optimization program into practice, there are some technical restrictions that should be respected to solve the optimization issue. The following constraints might be expressed [1,5,28,42].
2.2.1. Power Balance in the Hybrid System
The primary goal of the problem is to ensure there is sufficient power generation in the hybrid system to supply the required load demand. This constraint is considered using the following equality constraint.
2.2.2. Maximum Permissible Load Shedding in the Hybrid System
This constraint restricts daily load shedding of hybrid system which is expressed as follows:
2.2.3. Compliance with Photovoltaic Panel and Diesel Generator Constraint
The production power of photovoltaic panels and diesel generators cannot exceed their maximum production power capacity, which is expressed by (9) and (10), respectively.
2.2.4. Constraints Related to the Battery Charging and Discharging Conditions
Limitations for battery charging and discharging are one of the key barriers to batteries being able to solve battery-related issues. In other words, you are not permitted to, for instance, deplete the batteries to 0% or charge them to 100%. Additionally, you are not permitted to use any current to add or subtract power from the load. Typically, SOC minimum and maximum values are provided as follows:
2.2.5. Power Balance in the Distribution Network
It is essential to establish a balance between the production and consumption of electricity in the distribution network under all circumstances. Accordingly, the total power derived from the main station, the excess power generated by the hybrid system, must be equal to the total network losses and load demands.
where , , , and , respectively, represent the excess power generated by the hybrid system, the power supplied from the main substation of the network, the losses in the network, and the network demand in day d and time t. Note that the and are determined when the distribution power flow program is performed at each hour t of day d.
2.2.6. Voltage Limits
The buses’ voltage magnitude, , should be limited between its lower, , and upper, , bounds at each load node during the year, using the following constraints:
2.2.7. Power Flow Limits
The power flow through branches, , must not exceed the maximum allowable power flow, , which can be expressed as follows:
3. Proposed Optimizer
3.1. The Clouded Leopard Optimization
There is a creature known as the clouded leopard, a shy and solitary animal. It has been demonstrated that two specific activities of this species of leopard have a greater significance than others. It spends the entire day snoozing in the trees. During the evening, this animal descends from the trees in order to forage [38]. The recommended clouded leopard optimization (CLO) technique was derived from modeling these two common patterns in clouded leopard [38].
3.1.1. Initialization
The clouded leopard can be regarded as one of the potential solutions and contributors to the CLO algorithm. Decision variables are determined by the leopard’s location within the search area. An element of each vector portraying a clouded leopard may be compared using choice factors. Initially, cloud leopards are placed randomly in accordance with (15) [38].
where represents the ith clouded leopard, is its jth dimension, N is clouded leopards’ number, m represents the decision variables number, and is a random number from [1, 0]. is the minimum, and refers to the maximum limit of the variable j and “·” refers to symbol of scalar multiplication. The relation matrix (31) [38] illustrates mathematically how cloud leopards together form the CLO algorithm population.
A matrix representing the CLO population is represented by X. A cloud leopard is a selected solution, and for N cloud leopards Xi, i = 1, 2, …, N is the computed fitness values, which can be defined using the vector below:
where Fi denotes the fitness value derived from the ith cloud leopard and F(.) denotes the array of the OF values. An optimal solution is proposed based on the population with the greatest health value. Every time a run is conducted, members of the population are moved around in the search space, and new fitness values are computed, updating the best member of the population. For updating the position of the clouded leopard population in the search region, two clouded leopard activities are mathematically modeled.
3.1.2. Phase 1: Activity in the Night for Hunting (Exploration)
Foraging habits at night enable the clouded leopard to move from one site to another in search of food. In this behavior, the clouded leopard indicates that members of its population are in the inquiry phase, during which they are combing the various regions of the global search area. Clouded leopards adopt a different stance depending on where their prey is (32). According to (33) [38], the previous cloud leopard [30] will be replaced if the newly generated position has a higher OF value.
where is ith cloud leopard proposed new position according to the phase 1 of CLO, indicates its jth dimension, and its fitness value is defined by . is a randomly chosen number in the range of [0, 1]. pi and refer to the identified prey location and fitness value for the ith clouded leopard, respectively. A random integer number can either be 1 or 2.
3.1.3. Phase 2: Rest Top of the Trees (Exploitation)
After searching for food and feeding on it, clouded leopards rest on trees. As a result of their behavior, clouded leopards tend to travel closer to the locations where they belong, which is indicative of the time of exploitation and local exploration. A spot is created at random near each leopard’s position in order to mimic this behavior. The previous position is changed in accordance with (35) [38] if a higher fitness value is found.
where is proposed new position for the ith cloud leopard according to the phase 2 of CLO, is its ith dimension, is its fitness value, and is selected numbers from the interval [1, 0], randomly.
To complete the first run of the CLO algorithm, all cloud leopard locations are modified according to phases one and two. In the following steps, the CLO is repeated, with the CLO population being modified in accordance with steps (33) to (36) until all iterations have been completed. Following the implementation of CLO’s entire algorithm cycle, the best possible solution is selected as the best solution. Algorithm 1 illustrates the CLO pseudocode.
| Algorithm 1 CLO algorithm | |||
| 1: | Input: The information of the problem. | ||
| 2: | Adjust the iterations number (T) and the algorithm population number (N). | ||
| 3: | Initiate the clouded leopards position using Equations (30) and (31) and generation of the objective vector using Equation (32). | ||
| 4: | for | ||
| 5: | for | ||
| 6: | // Phase# 1: Exploration | ||
| 7: | Consider the objective prey position randomly for ith leopard. | ||
| 8: | Compute the new position of the ith leopard using Equation (33). | ||
| 9: | The ith leopard update via Equation (34). | ||
| 10: | // Phase# 2: Exploitation | ||
| 11: | Compute the new position of the ith leopard considering Equation (35). | ||
| 12: | By using Equation (36) update the position of the clouded leopard i. | ||
| 13: | end | ||
| 14: | Print the global best solution. | ||
| 15: | end | ||
| 16: | end | ||
| 17: | Output: The global best variable set achieved via CLO | ||
3.2. CLO Implementation for Deterministic Problem
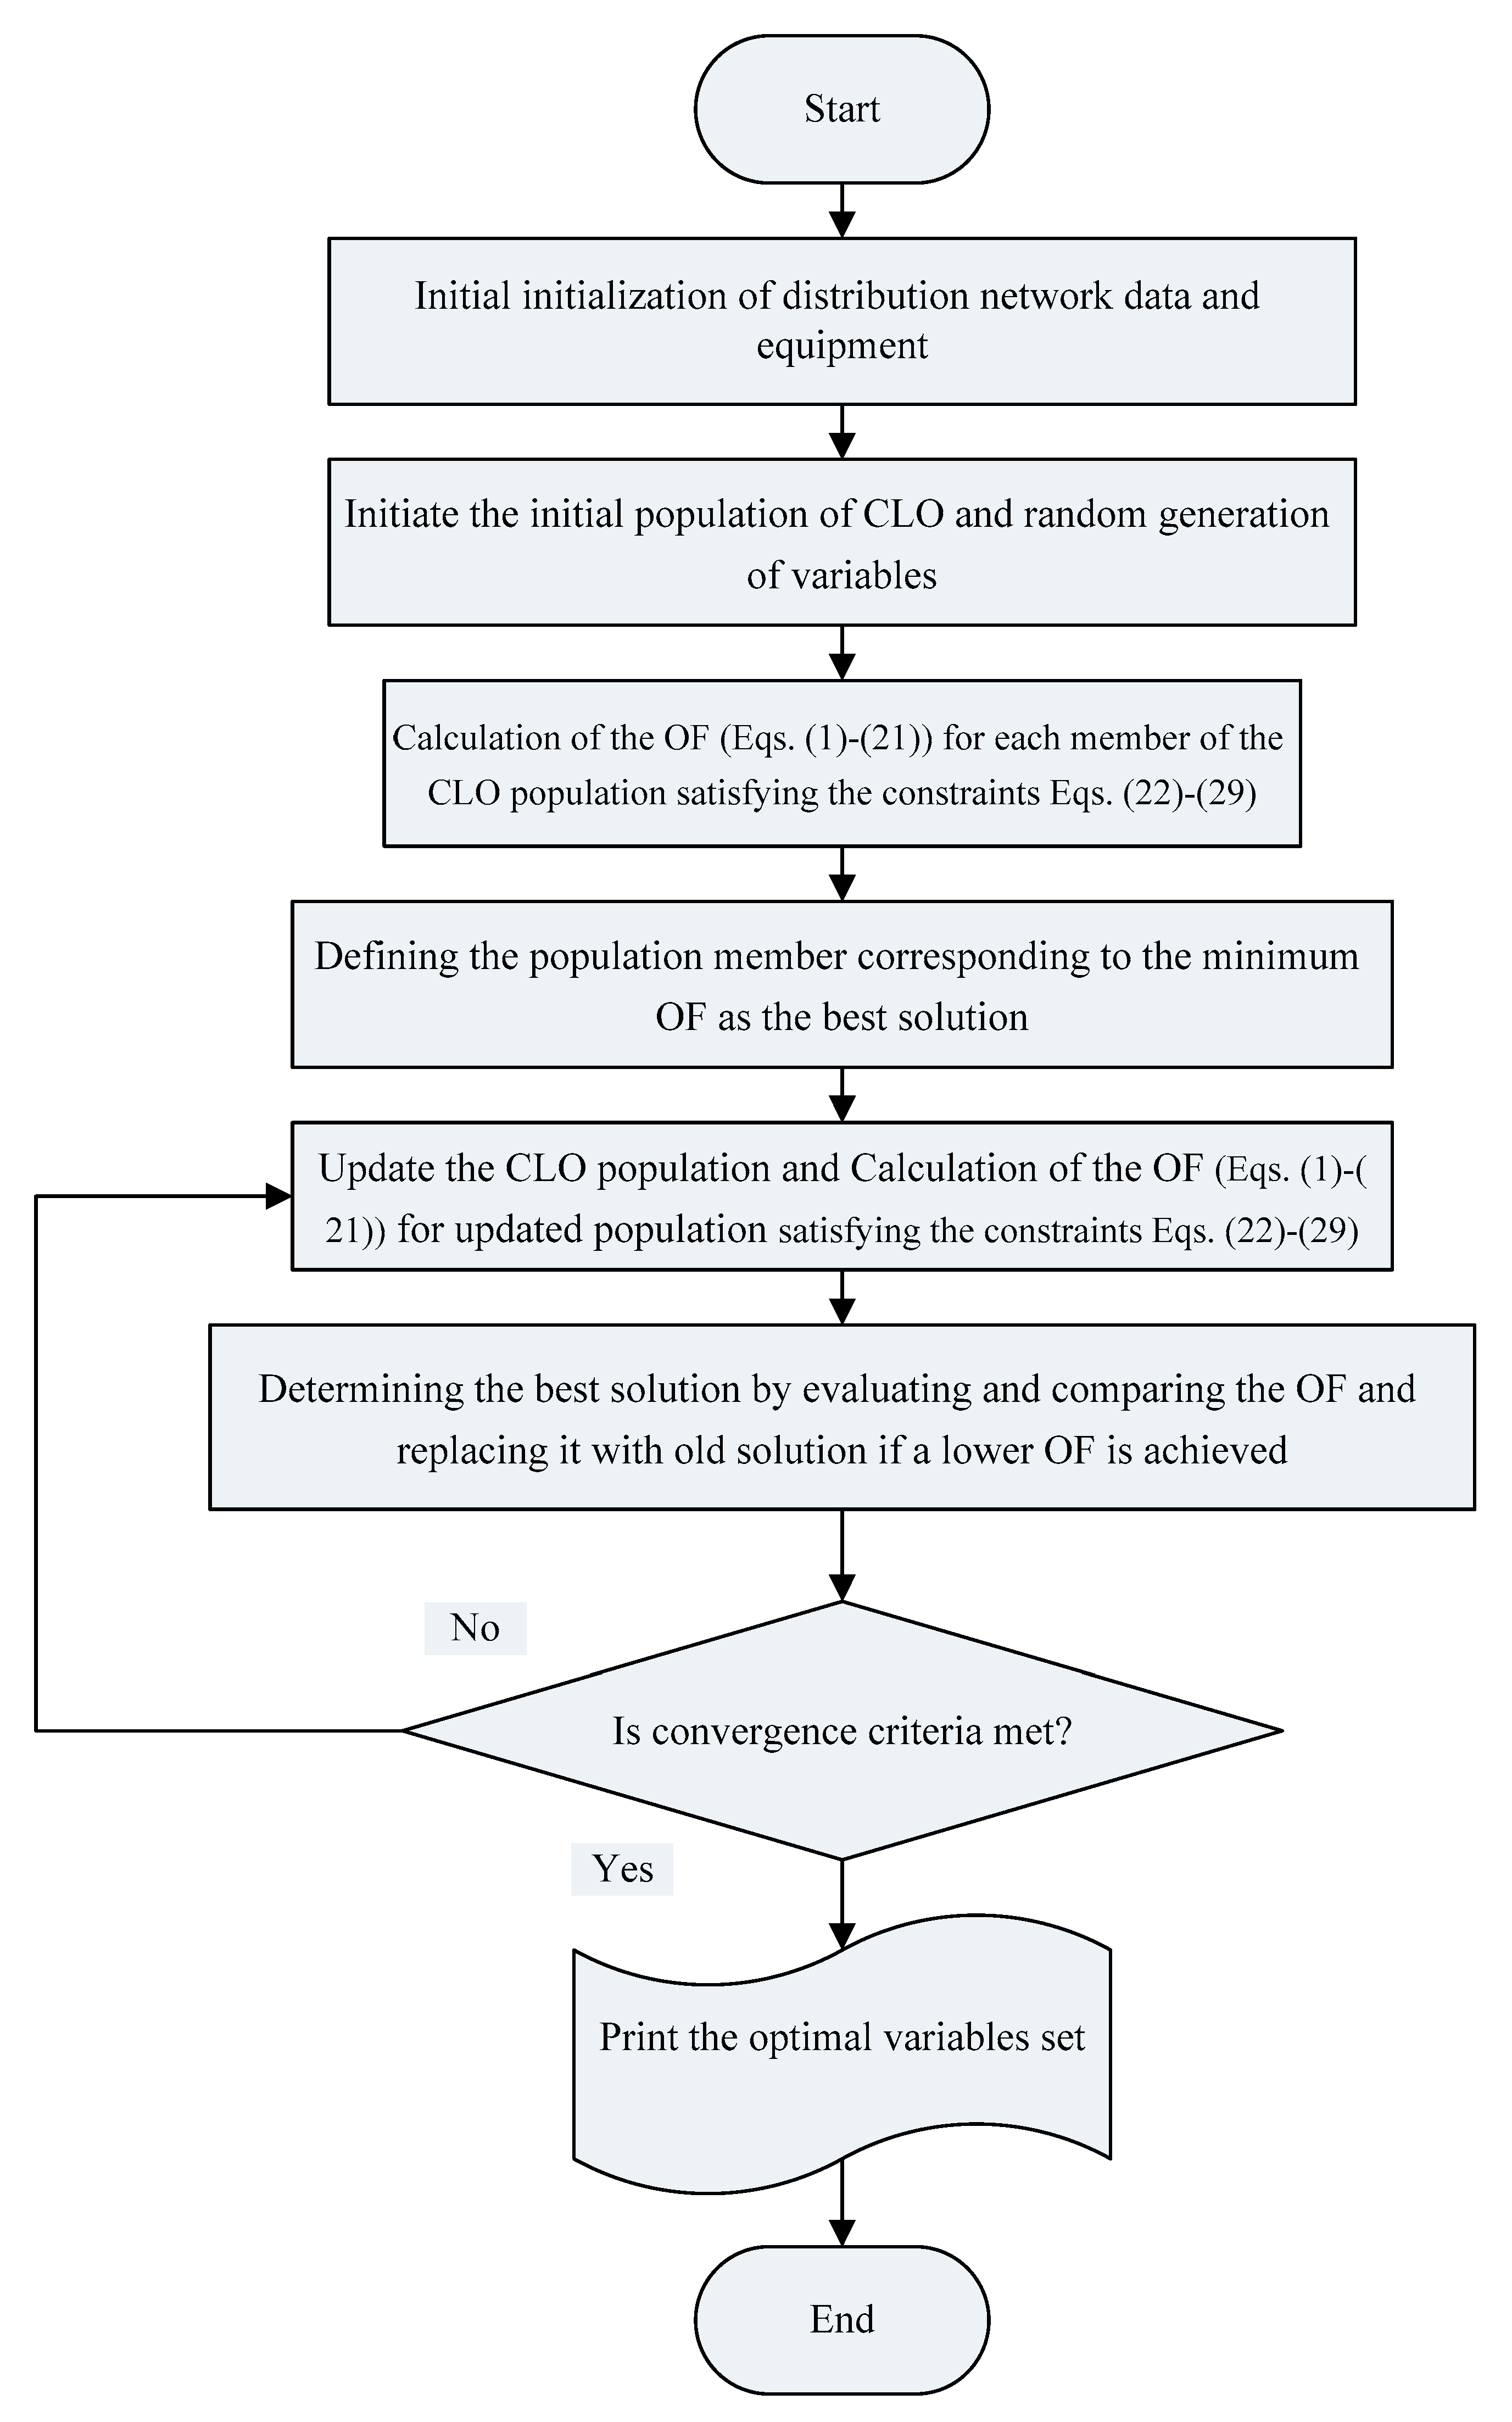
An illustration of the CLO flowchart for solving the HPVDS distribution network allocation problem is shown in Figure 1. To apply the CLO method to the problem, the following steps are provided:
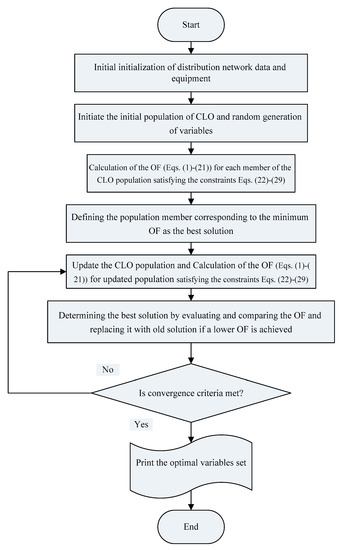
Figure 1.
Flowchart of the CLO implementation in problem solving.
- Step 1: The network (line and bus load) and device data are initialized in this step. Data on technical and economic aspects of devices are also initiated.
- Step 2: Creating random factors and establishing the CLO population is the second step. Trial and error and the authors’ experience determine the algorithm’s maximum repetition and population number. A random set of variables is also selected, depending on the population size of the algorithm.
- Step 3: Identify the goal function, OF, of each CLO community participant.
- Step 4: Choose as the best solution the population member with the lowest OF value.
- Step 5: Updating the algorithm population using CLO.
- Step 6: Determine the target function for the updated population of the CLO from Step 5.
- Step 7: Compare and evaluate the goal functions in Steps 4 and 6, and then select the optimal response.
- Step 8: Select the most appropriate solution. In that case, the value achieved in Step 6 is replaced by the value of the aim function in Step 4.
- Step 9: Has the convergence requirement for obtaining the OF’s lowest value and executing the method the most times been met? If yes, move to Step 5; otherwise go to the next step.
- Step 10: Determine which variables best fit the target function as the overall best solution, return the results, and conclude the program.
3.3. CLO Implementation for Probabilistic Problem
To deal with the load and solar irradiance uncertainties, the Monte Carlo simulation (MCS) method is used. For this purpose, 1000 random data are generated for each quantity. The step-by-step method of solving the stochastic problem is as follows:
- Step 1: Generate 1000 random data for each random variable.
- Step 2: Random generation of answer sets for optimization variables.
- Step 3: Choosing variables set.
- Step 4: Testing the network for 1000 random data using the MCS and investigating the limitations for all 1000 possible states.
- Step 5: Calculate the OF in the condition of satisfying the constraints (Equations (22)–(29)) and determining the best solution in this step.
- Step 6: Updating the decision variables according to the CLO.
- Step 7: Computing the OF in the condition of satisfying the constraints (Equations (22)–(29)) and determining the best solution in this step. Replace the new solution with the old solution (Step 5), if it is better than it.
- Step 8: Checking the convergence condition, if it converges, go to Step 9, otherwise go to Step 3.
- Step 9: Stop the program.
3.4. Power Management Scheme in the Hybrid System
Photovoltaic panels provide the electrical power for the hybrid system. The storage system and the diesel are used for supplying the network load when the photovoltaic panels are unable to provide power. In this regard, the operation strategy can be described as follows:
- After supplying the load, photovoltaic power is stored in the batteries if the photovoltaic power exceeds the network demand.
- If the photovoltaic panel production power is more than the power required by the hybrid system’s load and charging batteries, the excess production of photovoltaic arrays can be sold to the network.
- A portion of the grid load can be supplied by the panels if the photovoltaic is less than the grid load, and the remainder can be supplied by a storage system if there is sufficient storage capacity.
- In the event that the photovoltaic panel production power is less than the grid load and the battery cannot meet the remaining load demand, a diesel generator can supply as much load as possible.
- In cases where photovoltaic panels produce less power than the load and the battery cannot supply it, and the remaining load exceeds diesel generator capacity, the remaining load will be disconnected or bought from the grid.
The utilization strategy without the presence of the photovoltaic panel is as follows:
- When the batteries are sufficiently large, they will be able to meet the load in a hybrid system.
- If the batteries cannot supply the grid load, the remaining load is supplied by the diesel generator.
- Batteries and diesel generators will be turned off or purchased from the grid if the load exceeds their maximum capacities.
4. Simulation Results and Discussion
In this case, the hybrid system is being requested by a commercial building that contains residential units whose load changes throughout the day. Peak load is generally thought to occur in the early hours of the night since both residential and business loads will experience significant consumption during this time. An analysis of the load of the proposed hybrid system is conducted using 24 h demand with two load peaks, as illustrated below. Microgrid normalized load is represented in Figure 2. The peak load demand is assumed to be 250 kW. With such an approach, it is also necessary to consider the load demand of the distribution network [42]. Loads are assumed to follow a similar pattern throughout the year. Therefore, a daily load pattern has been established and made universal for the entire year. In this case, the daily load is calculated by taking the average of all previous days over the course of the year. Based on a peak load demand of 250 kW, Figure 2 illustrates the normalized load demand over a day. It should be noted that the total load that is not served by the hybrid system should not exceed 25% of its total load. Additionally, the diesel generator should not deliver less than 20% of its full capacity to the hybrid system load during certain hours [42].
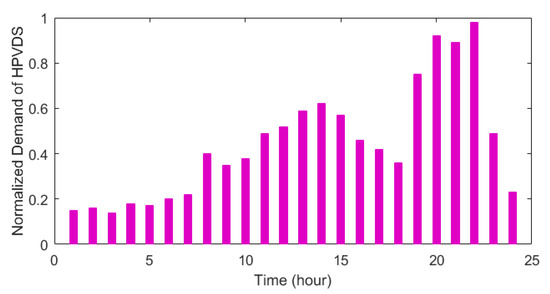
Figure 2.
Normalized load of the hybrid system for 24 h.
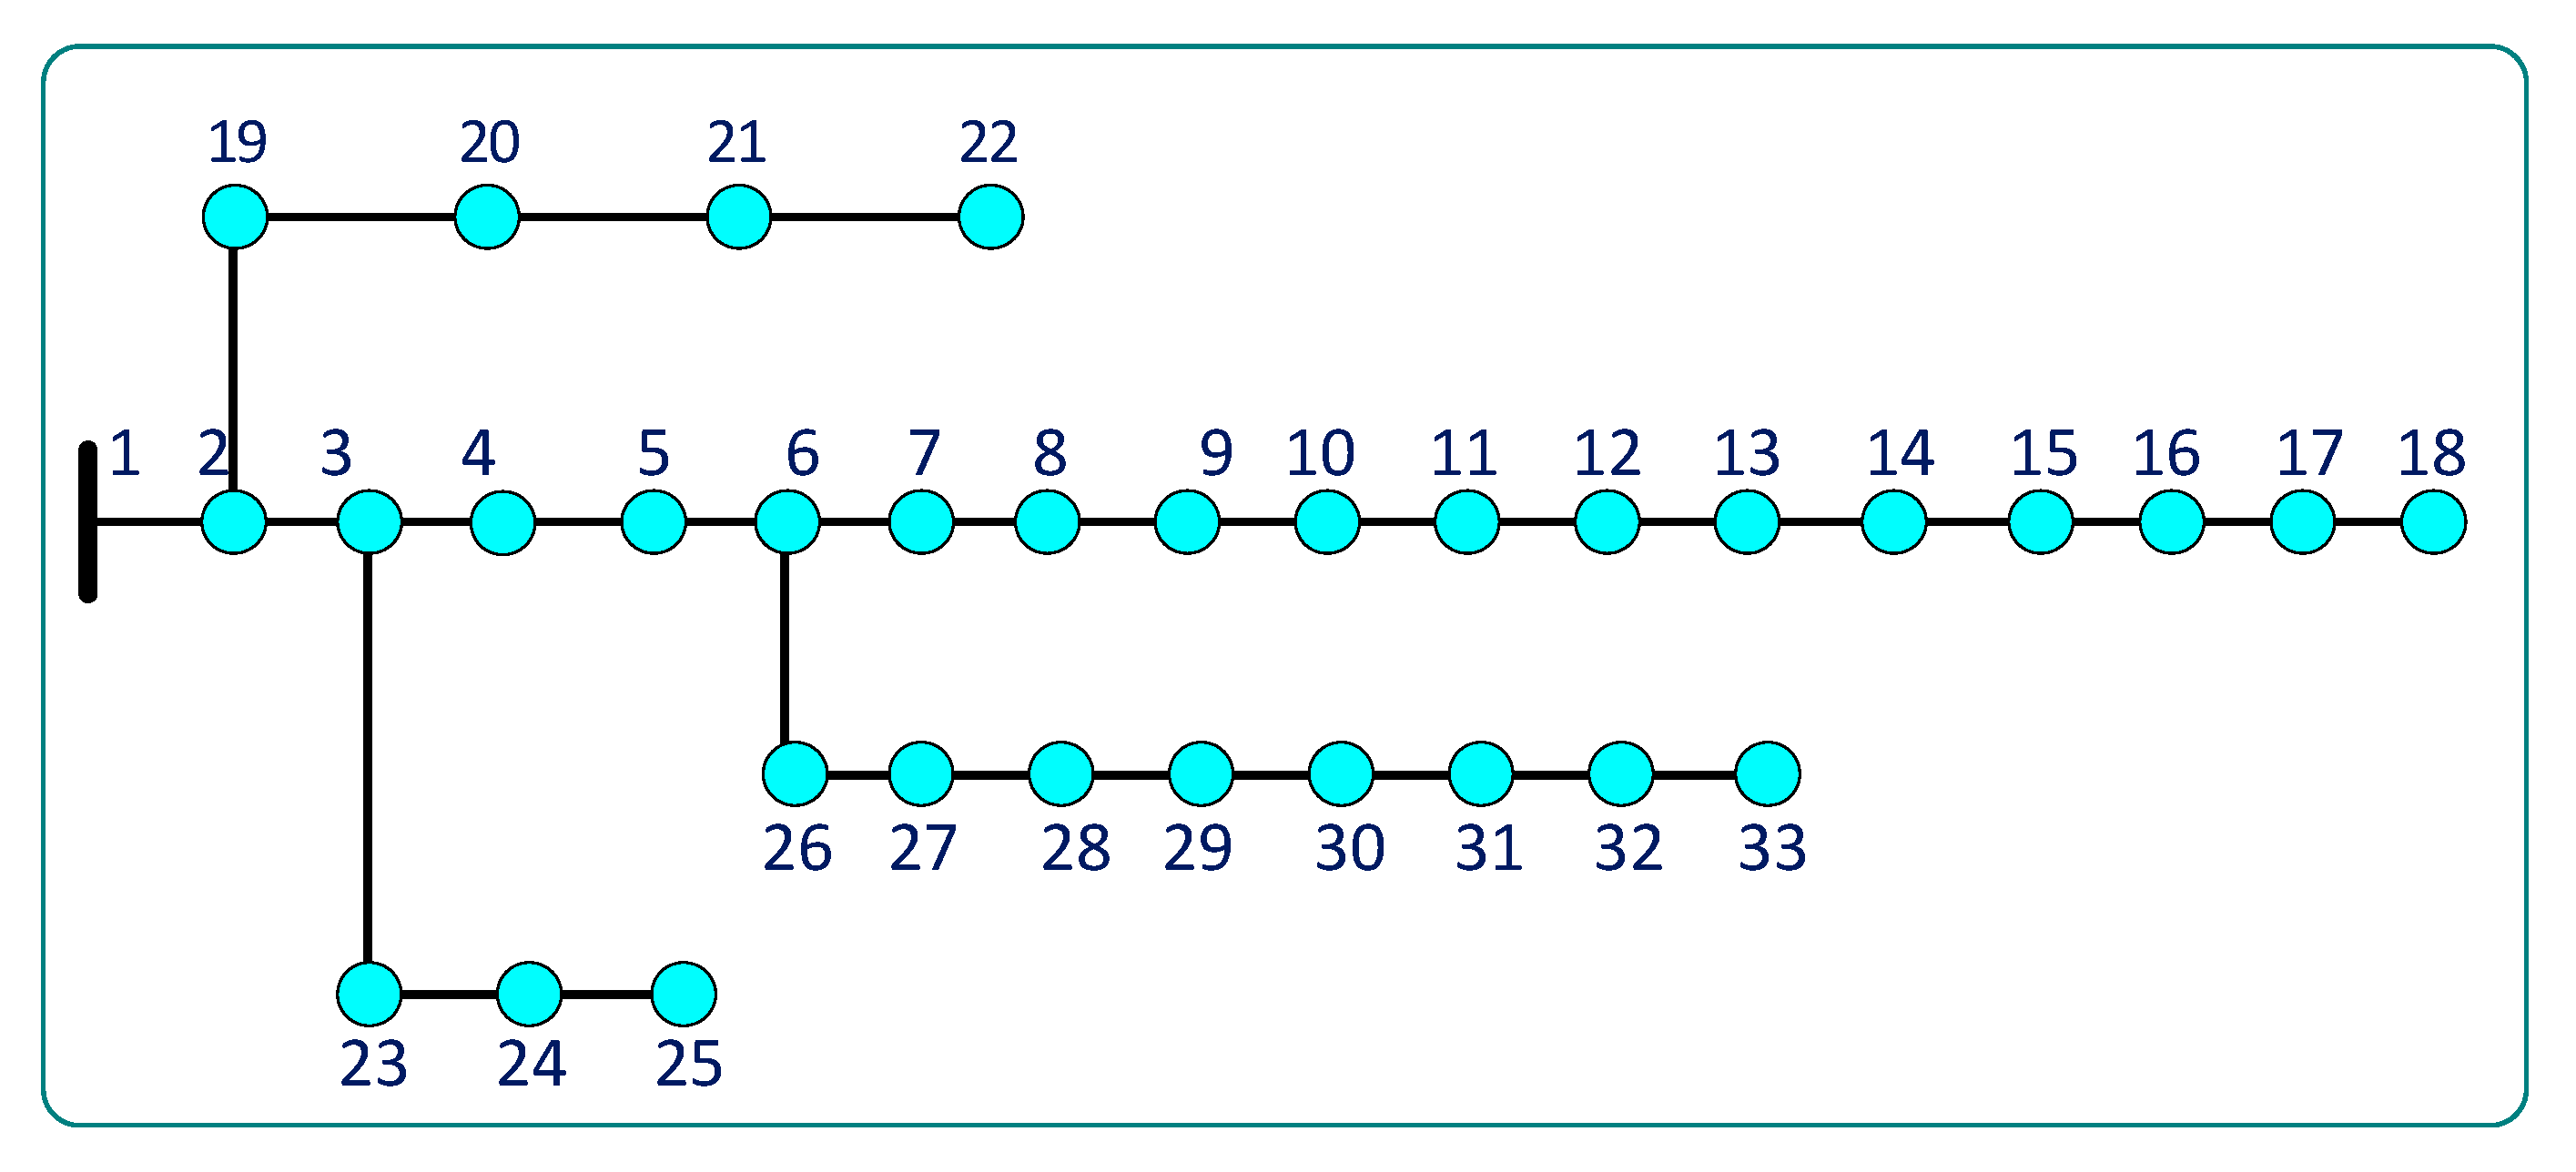
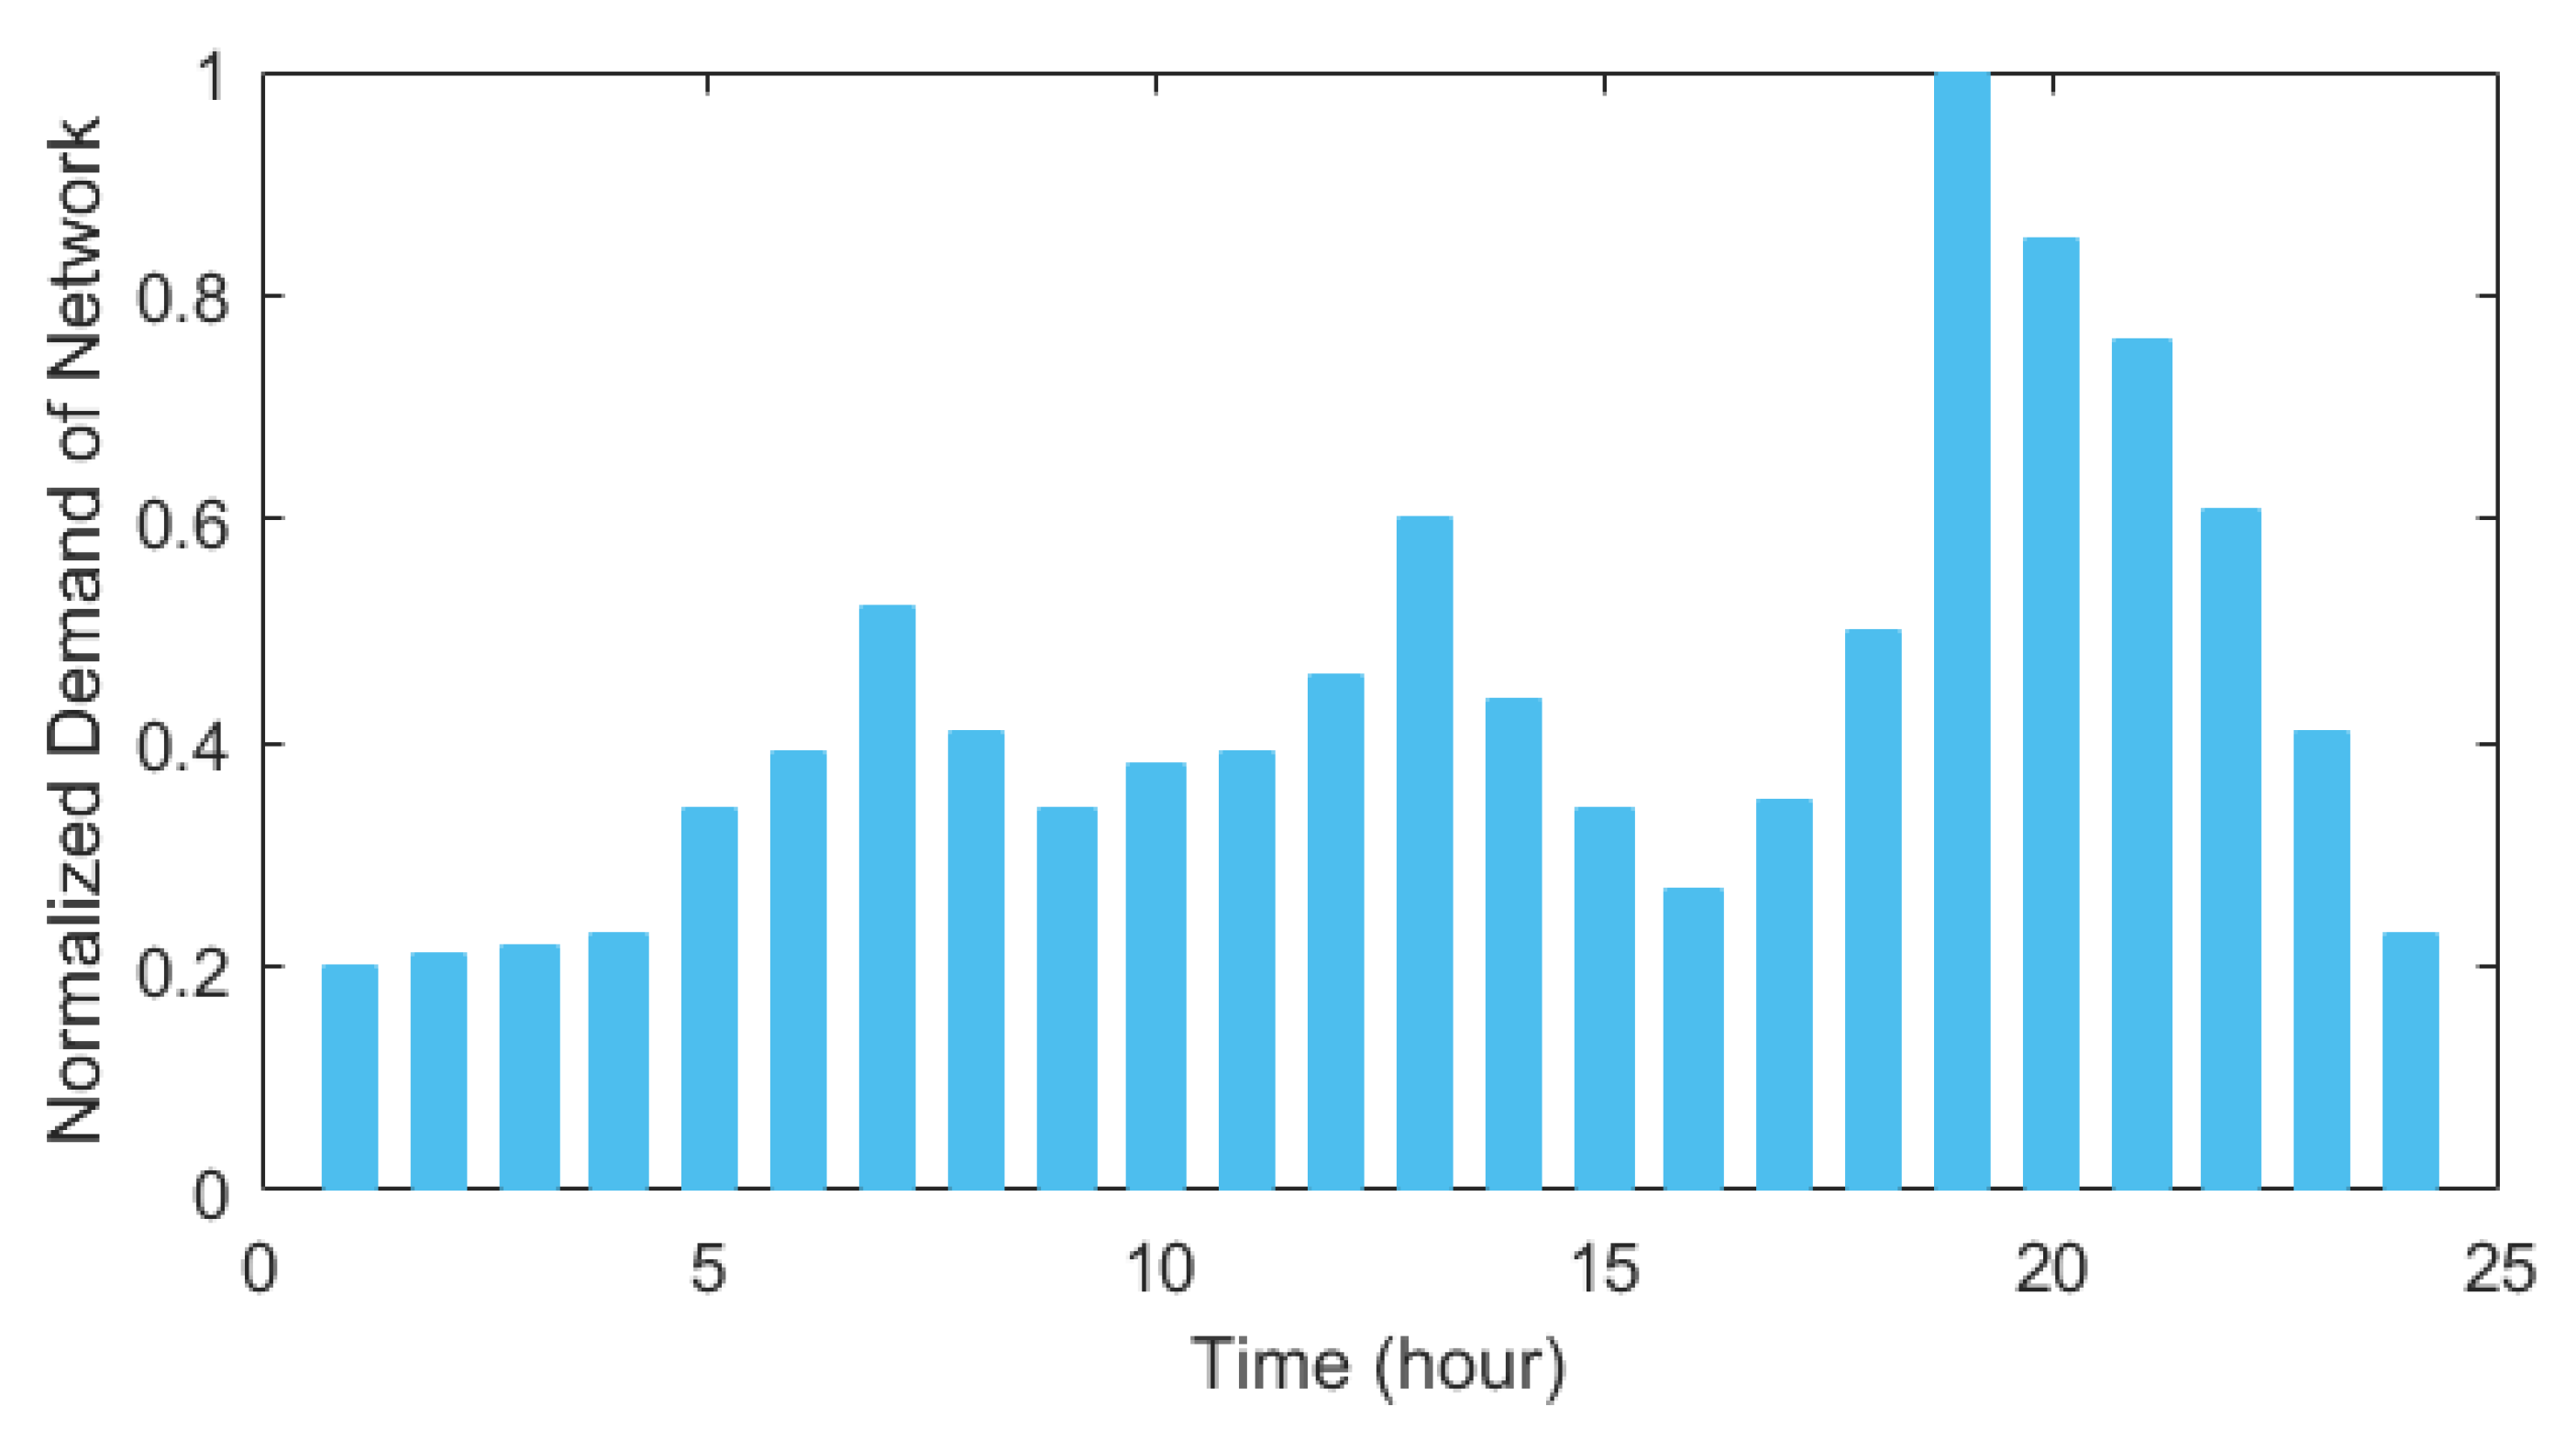
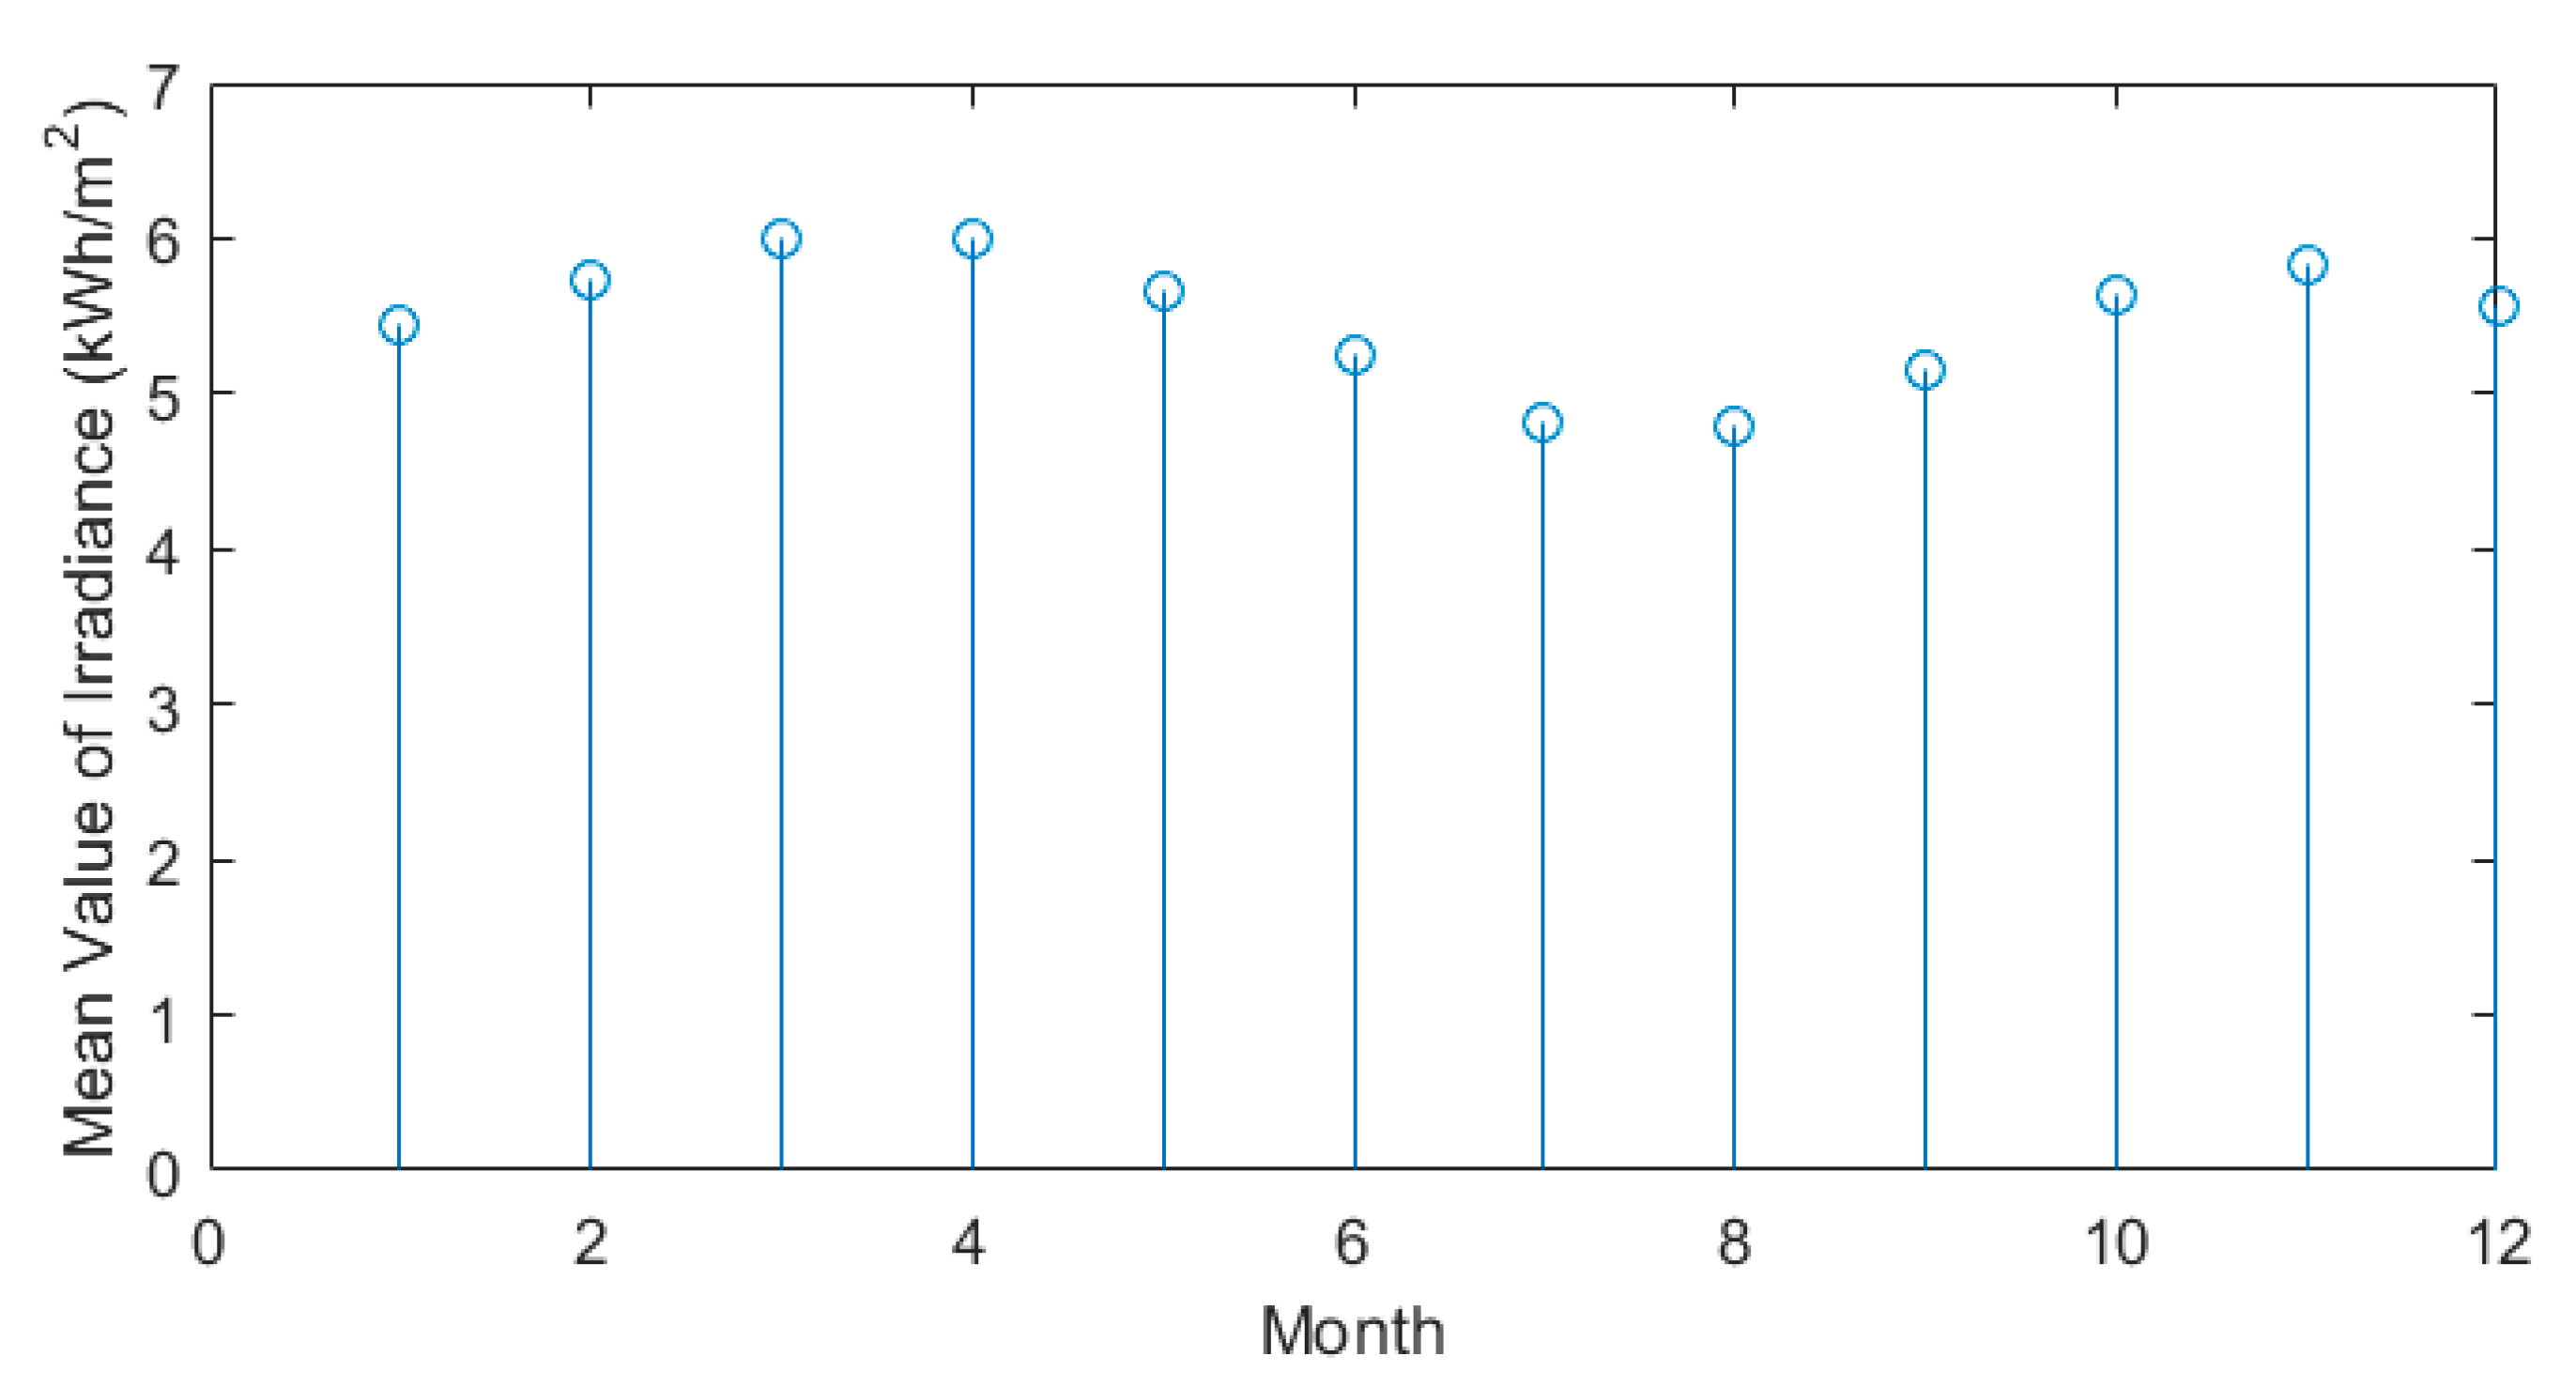
Figure 3 illustrates the single-line schematic of the IEEE 33-bus radial network. Detailed information about the lines and buses of this network can be found in [42]. In Figure 4, the network load profile for the distribution network is shown according to [42,43,44,45]. Furthermore, the network’s peak load is equal to the mean load derived from references [42,43,44,45]. Additionally, Figure 5 displays a normalized 24 h photovoltaic radiation profile. For each month, Figure 6 displays the curve of the highest power generated by the photovoltaic panel. As the hybrid system is placed under the worst possible circumstances, August is the month with the least exposure to radiation.

Figure 3.
Diagram of radial 33-bus network.
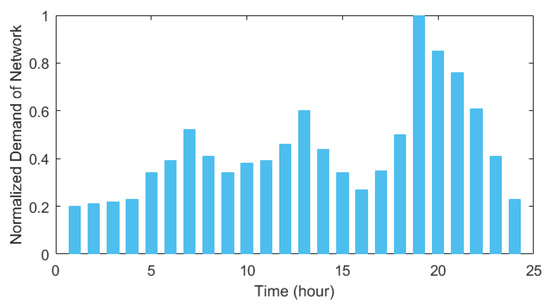
Figure 4.
Normalized load of the 33-bus distribution network.
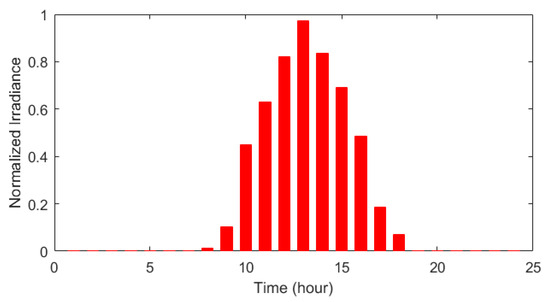
Figure 5.
Daily normalized irradiance.
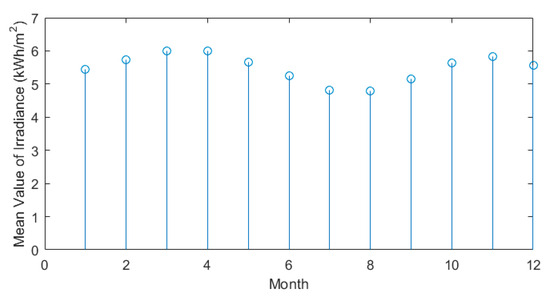
Figure 6.
Average daily irradiance curve by month.
The cost of installing a photovoltaic panel is 7.44 $/kW, and maintaining it is $40 per year. Each battery costs 0.283 $/Ah, and annual maintenance costs are $50. Diesel generators typically cost 0.55 cents per watt and 0.20 cents per hour to operate. A hybrid system with an ideal load would be a commercial structure. Additionally, the distribution network has a domestic load, where the cost of power is lower than with a hybrid system. As shown in Table 1, electricity pricing differs based on load type and load level [42,43,44,45].

Table 1.
Electricity price for different loads at different levels.
4.1. Results of Design and Sizing
The results of the CLO algorithm simulation for optimal hybrid system sizing in the IEEE 33-bus test system are presented in this section. In this study, the optimal results obtained by using the proposed algorithm are compared with several state-of-the-art methods in terms of the quality and convergence of the solutions.
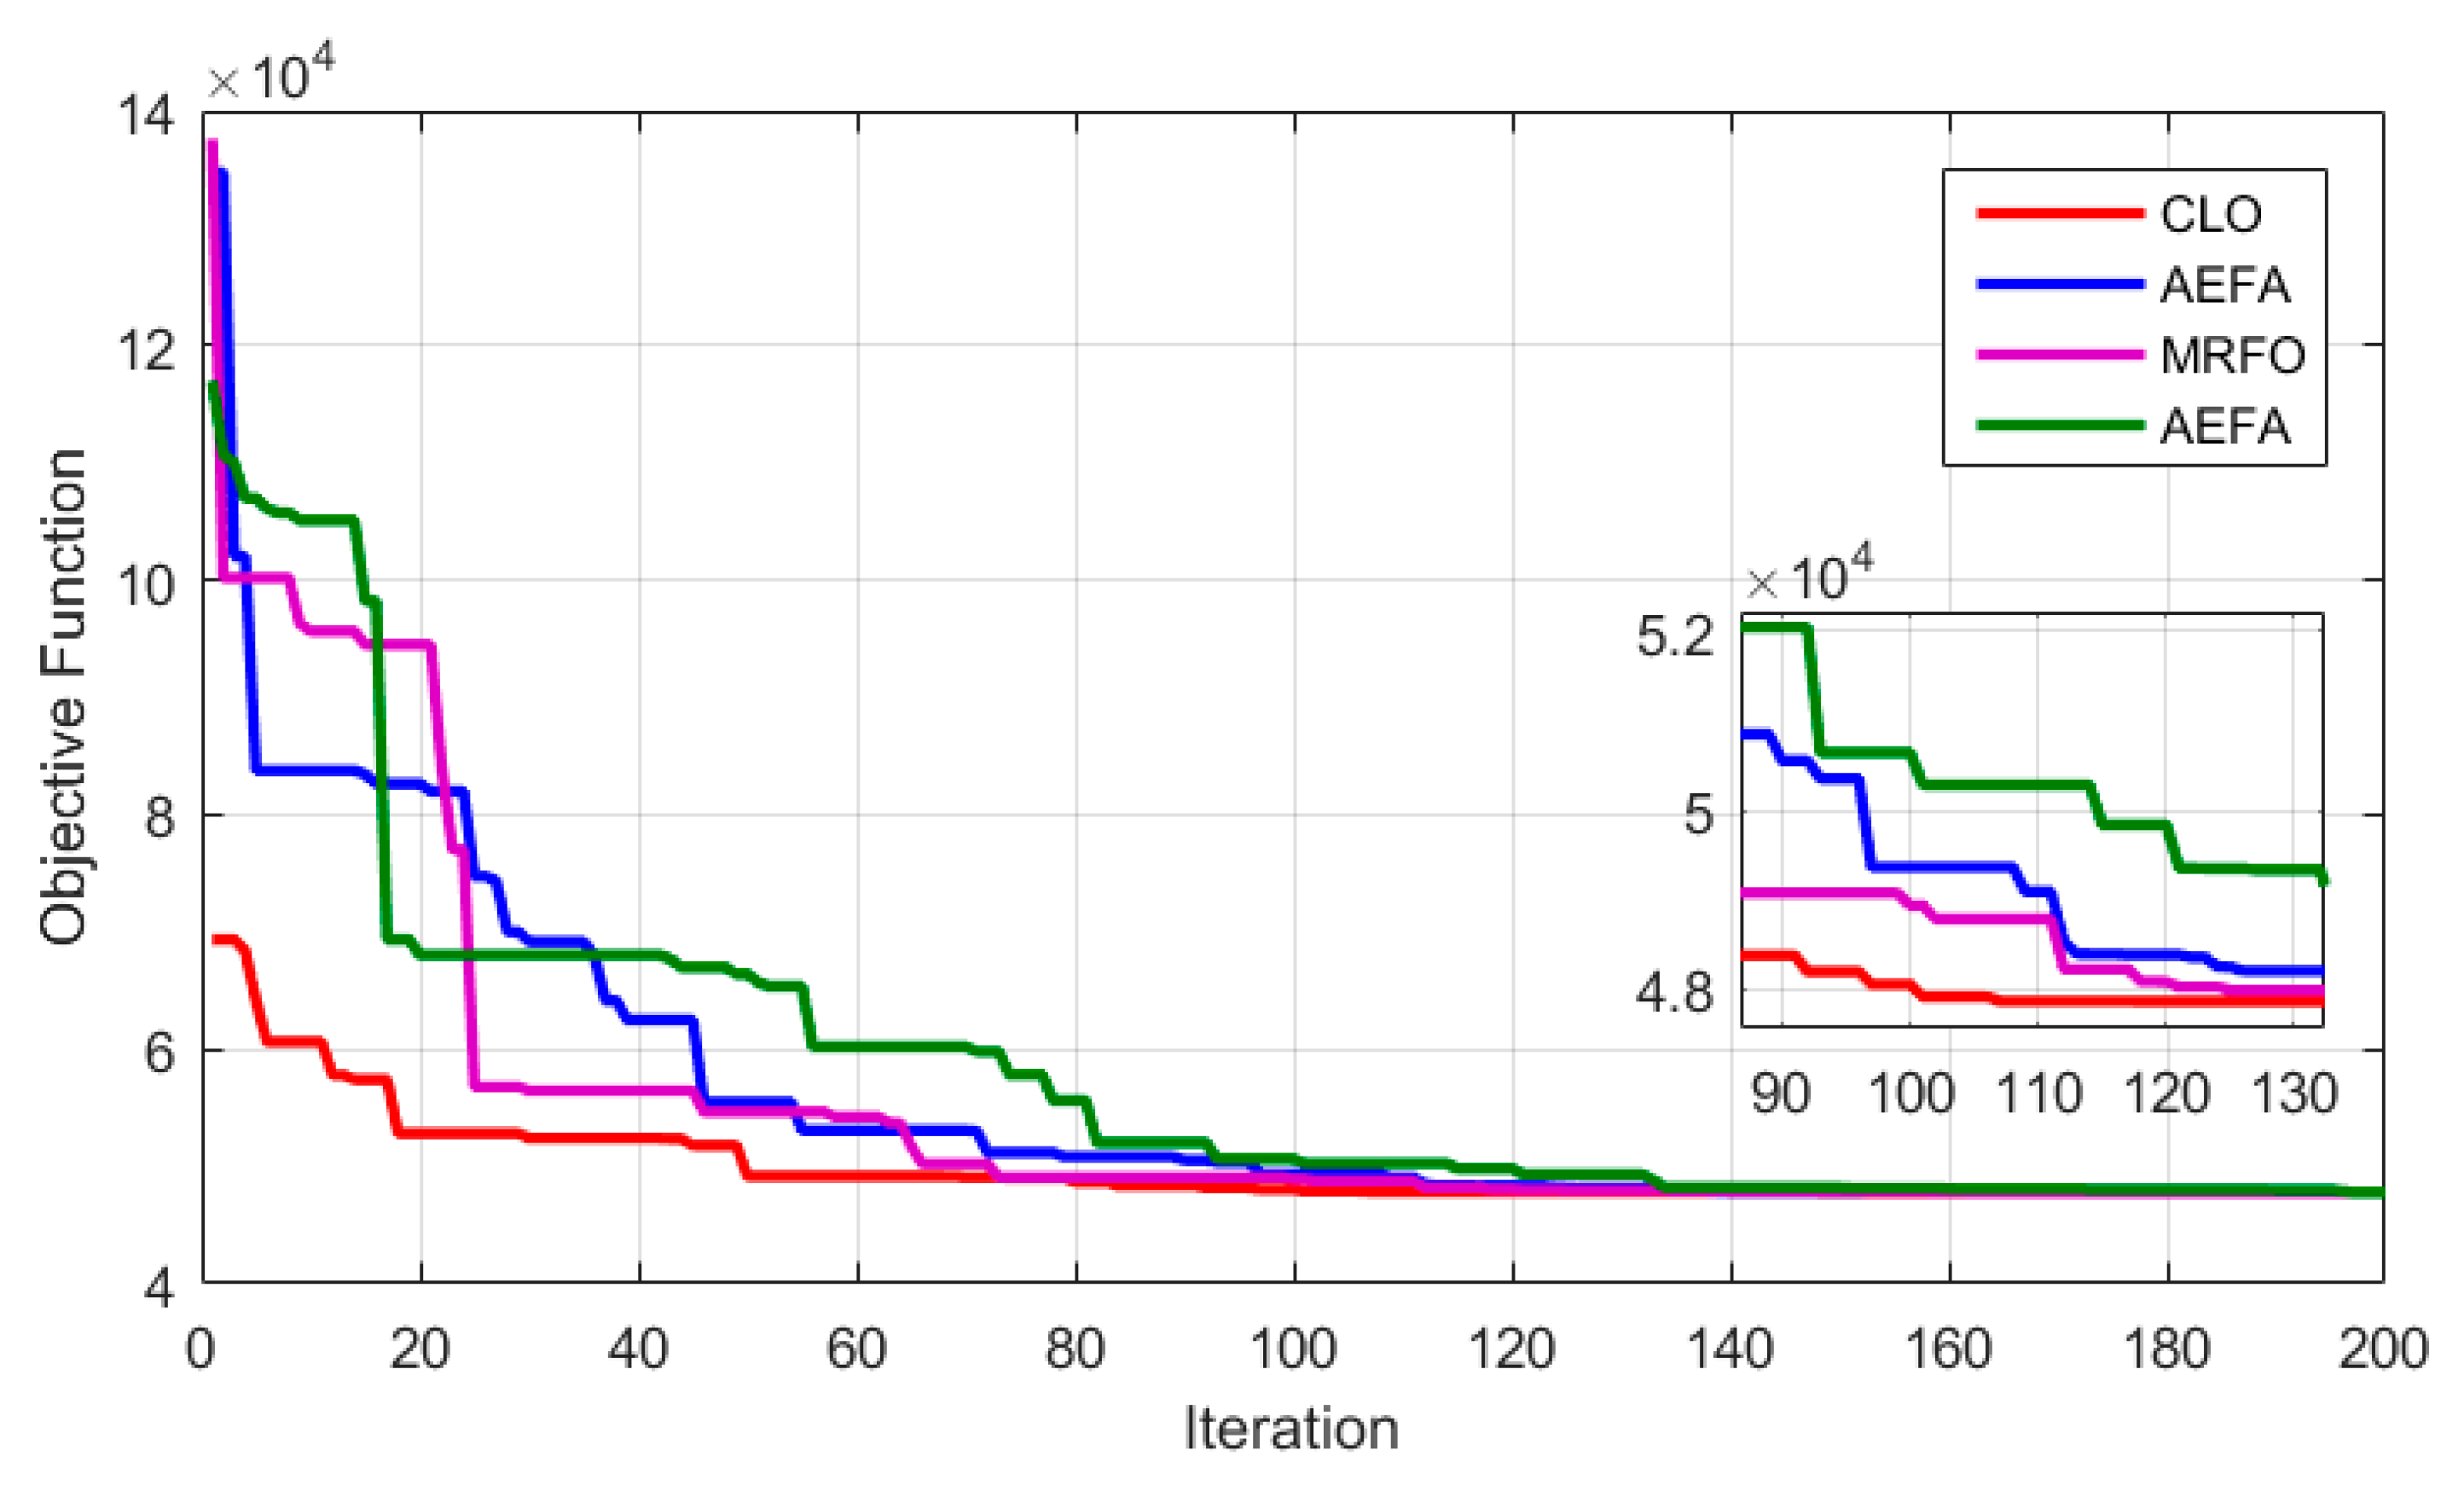
Using the economic data provided, the 33-bus network optimization program has been run, and the most promising results are shown in Table 2. Figure 7 illustrates the convergence behavior of the applied techniques in determining the optimal solutions. As can be seen from Table 2 and Figure 7, CLO produced superior results to PSO, AEFA, and MEFO methods and required less iteration than these methods.
Table 2.
The results of designing and determining the size of the hybrid system in the distribution network of 33 buses.
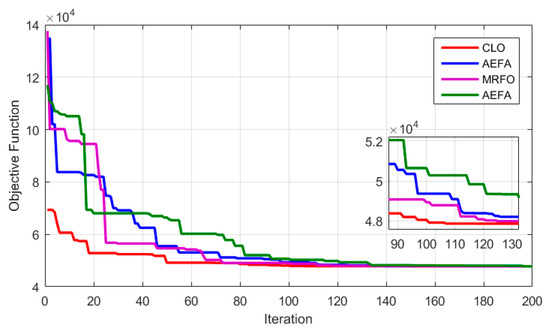
Figure 7.
Convergence process of different algorithms to solve the problem for the 33-bus network.
According to the statistical analysis results of 20 independent executions of each algorithm given in Table 3, it is clear the CLO is obtained better presentation of the criteria with lower mean and standard deviation values.
Table 3.
The statistical results of different methods to solve the problem for the 33-bus network.
Figure 8 depicts the optimal energy management of the hybrid system in August. During the early morning hours, when there is no sun, the battery powers the hybrid system’s load. During these hours, the battery energy is negative, which indicates that the battery is depleted. Battery charging begins at 8 o’clock and ends at 11 o’clock. As a result, no power is stored in it until it discharges again at 18:00. Consequently, the battery is charged again at 7:00 p.m. and fully discharged at 8:00 p.m. Likewise, the diesel generator is connected and disconnected at 8 and 9 a.m., respectively. The situation lasts until 8:00 p.m., following which the load is supplied until 24:00 p.m. Given the sizeable quantity of photovoltaic output, a significant portion can be sold to the network. The profit generated enhances the OF. Throughout the day, the network is designed to provide full load without interruption.
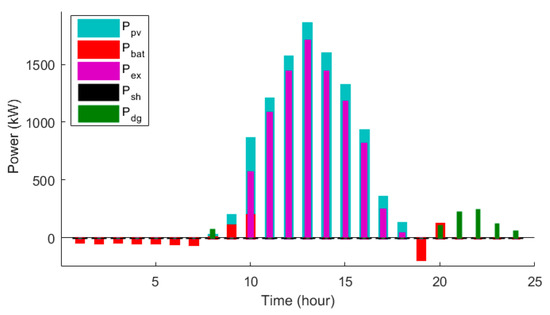
Figure 8.
The hybrid system’s behavior on a typical day in August.
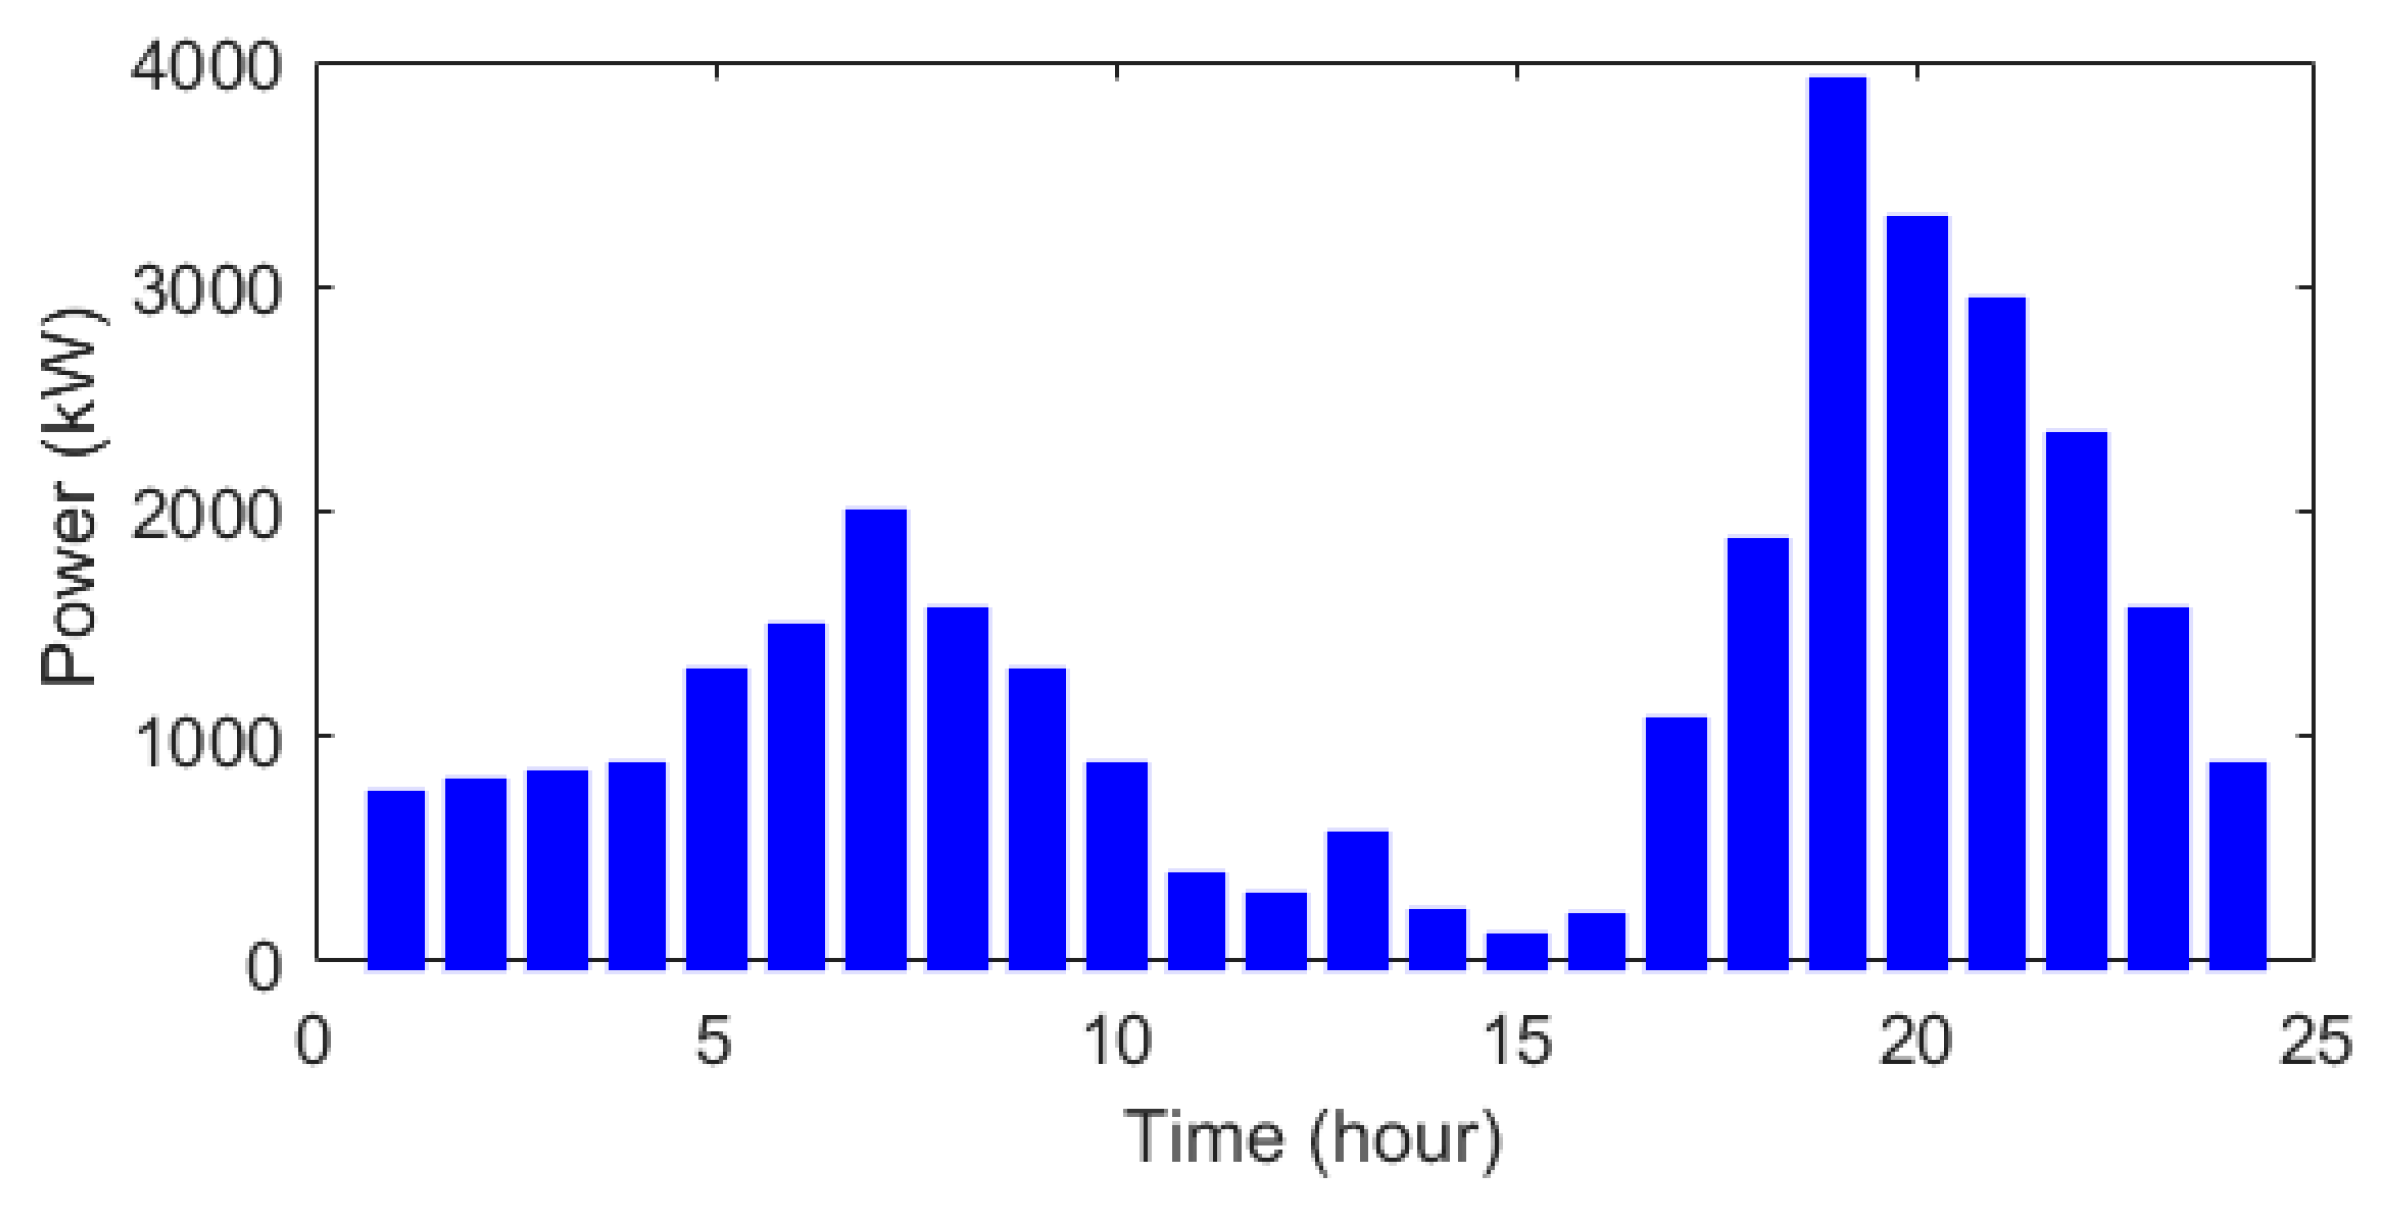
Figure 9 shows the amount of energy purchased by the installed hybrid system from the main network. During the photovoltaic energy period, the amount of electricity required from the upstream network has decreased significantly. The base system’s loss and associated cost are 1061 kW and 55.86 $ per day, respectively. When the hybrid system is installed in the network, these values decrease to 956.79 kW and 51.78 dollars per day.

Figure 9.
Purchased power from the upstream network.
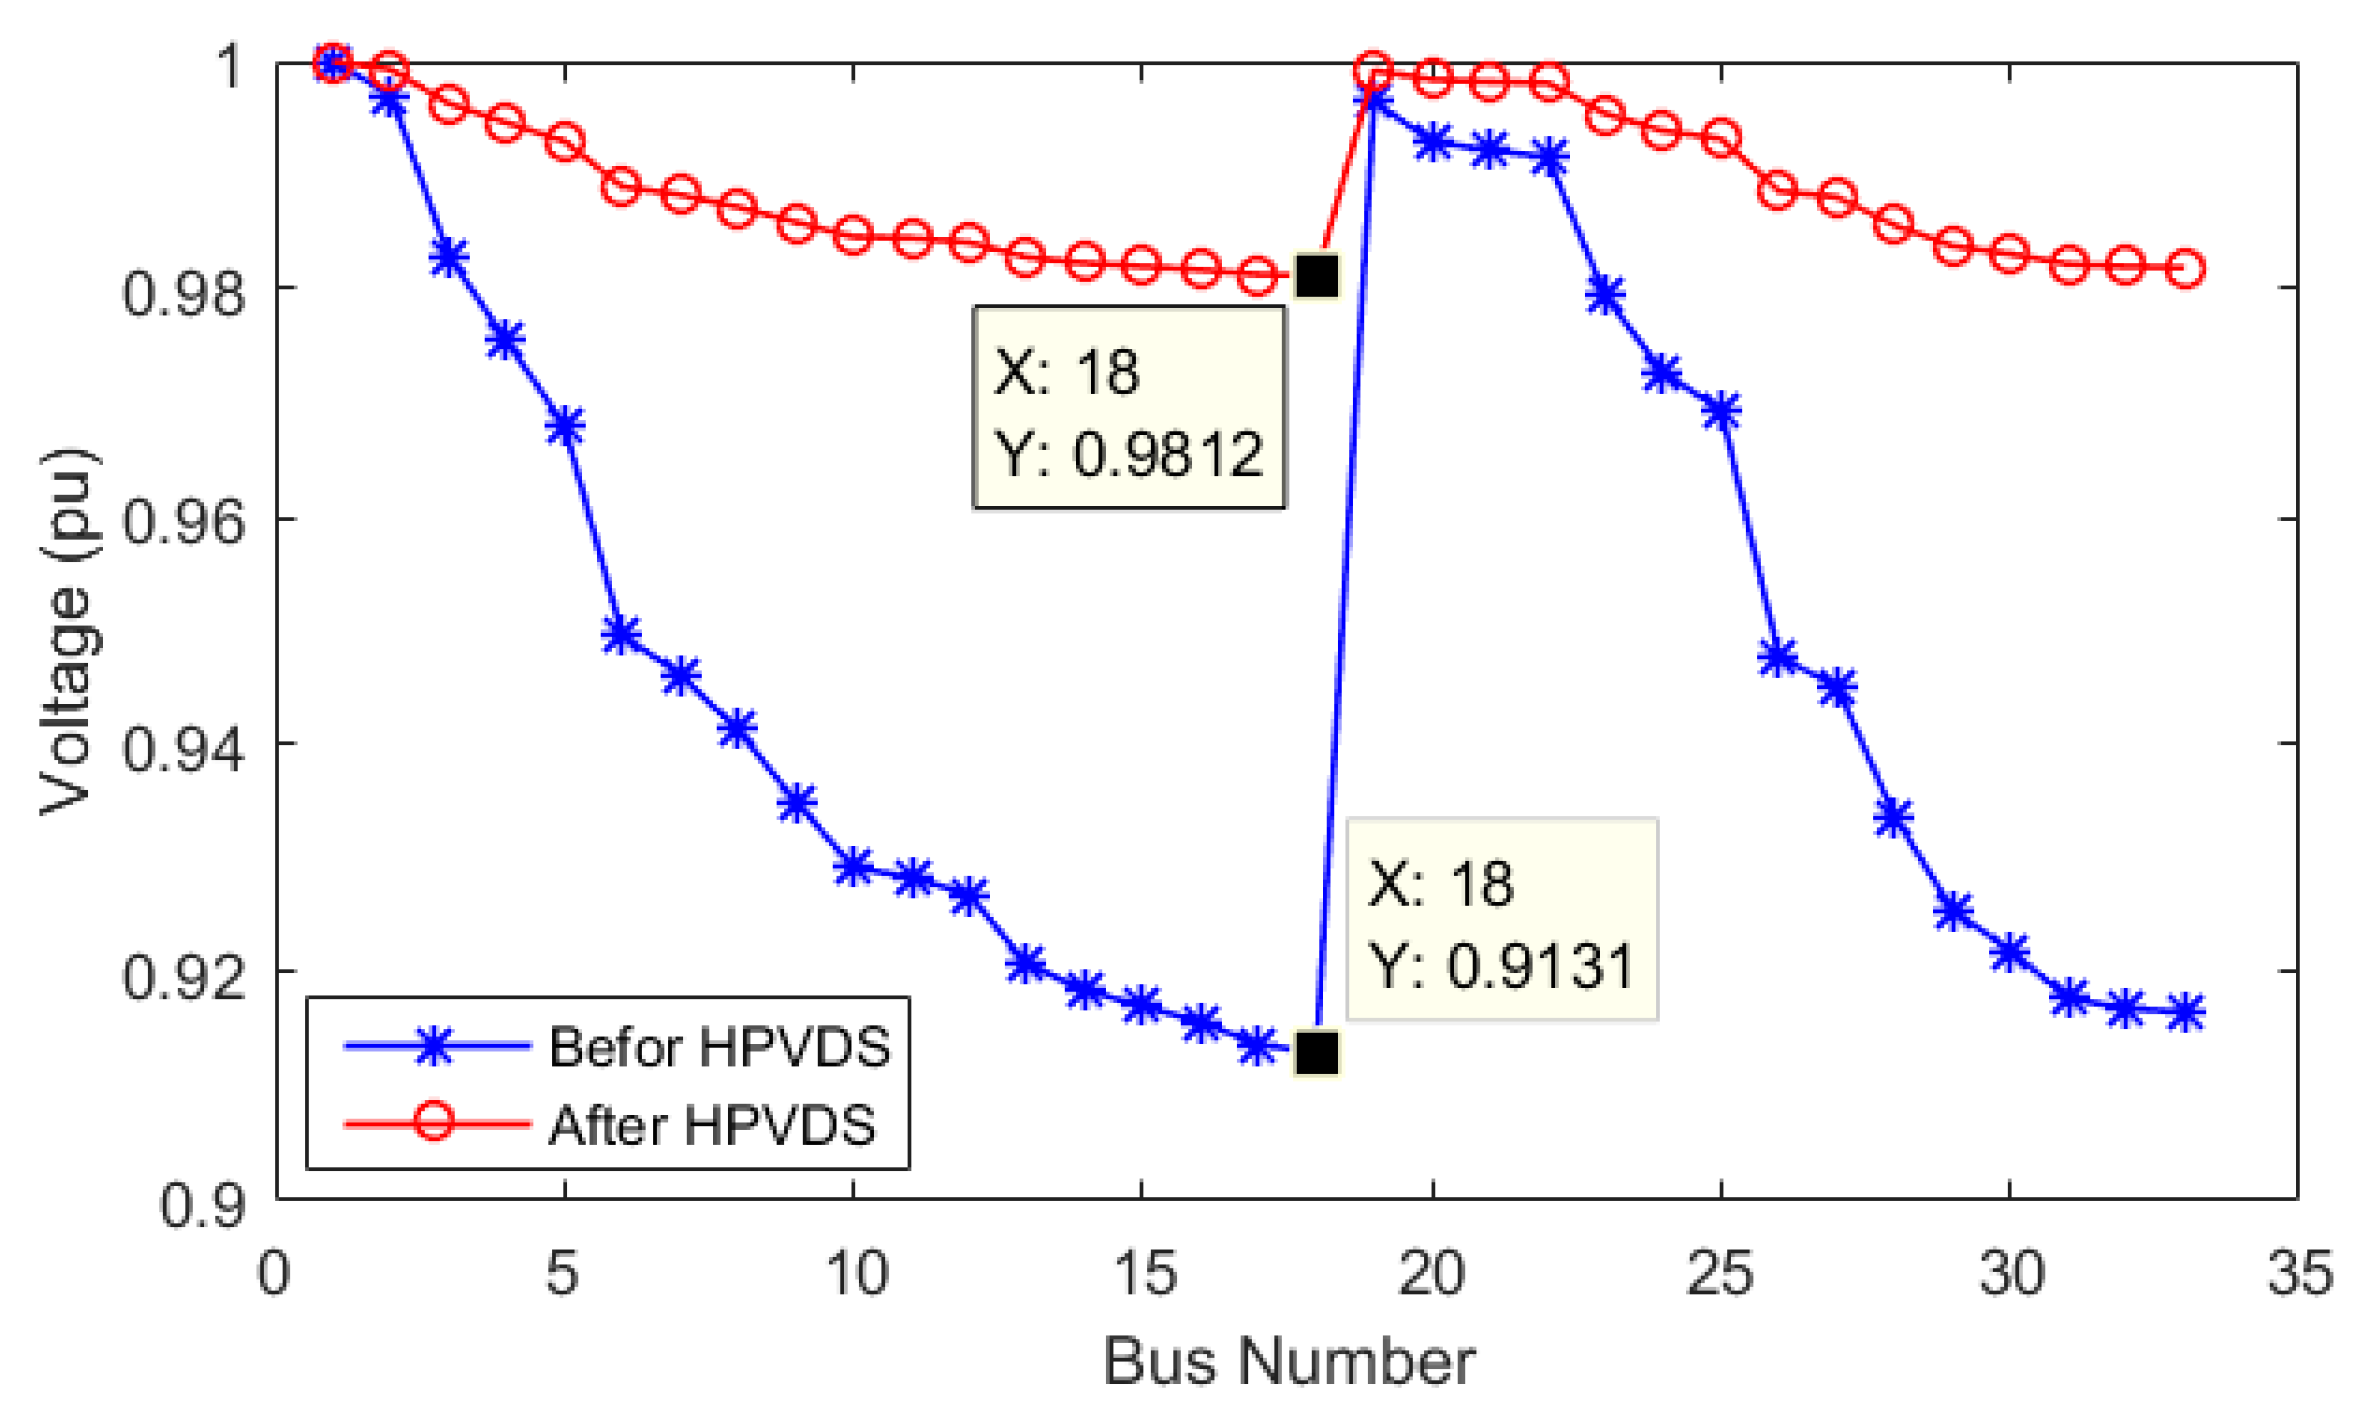
Furthermore, the optimal integration of hybrid system in the distribution system reasonably enhances the voltage profile as shown in Figure 10. As can be seen, the planned power injection to the distribution network has reduced the voltage deviations of all the network buses compared to the basic state of the network without microgrid. Therefore, optimal allocation of microgrid in the network has improved the voltage conditions of the network.

Figure 10.
Voltage fluctuations of the 33-bus network before and after using the hybrid system.
4.2. Effect of Changes in Photovoltaic Power Capacity
This section examines the impact of modifying photovoltaic panel capacity on resolving the optimization problem in the 33-bus network using the CLO approach. Table 4 presents the results of the investigation, which included increasing and decreasing the panel’s capacity by 10%. Accordingly, the amount of profit generated from the sale of electricity to the network has increased with the increase in the PV capacity of the hybrid system. Furthermore, reduced network losses have reduced total costs as well.
Table 4.
Hybrid system design results in 33-bus distribution network due to photovoltaic panel capacity changes.
4.3. The Effect of Considering the Availability of Photovoltaic Resources
When simulating a system’s performance for a more detailed analysis, it appears necessary to consider the failure and healthy state of the equipment. Therefore, these concepts are used to develop the system reliability model, which also serves as the basis for the operating principles of the system. Thus, the system’s reliability model should include the outage of the equipment [37,38]. The equipment failure repair rate is expressed as the number of repairs per year. Each equipment failure rate is expressed in terms of failures per year. A piece of equipment’s availability is also measured by its repair rate and overall failure and repair rates. A reliability model based on these concepts is required to obtain a more precise assessment of the system. As part of the reliability evaluation process, the forced outage rate (FOR) of the energy-producing units (e.g., panels) is assumed. It is determined that the operation probability of the system will be affected by photovoltaic loss due to outages of photovoltaic sources as described in [37,38]:
where defines the probability of occurring outages, and indicates the availability of photovoltaic panels.
To accurately evaluate system reliability calculations, planned or emergency outage of PV units should be applied. If the contingencies happen in the system, then the production power of the remaining PV units is stated as follows:
Therefore, the expected production power of the degraded PV system due to the contingencies is defined as follows [38]:
where indicates the availability of the photovoltaic system and is production power capacity of all panels. Note that the availability of an equipment can be defined as the following form [37]:
where and indicate the rate of equipment repair and failure, respectively.
The purpose of this case study is to examine the impact of the contingency of a part of the PV system on the optimal placement results. Specifically, the problem with three PV system availability values is solved using the CLO algorithm. Table 5 summarizes the results. Consequently, as PV system availability decreases, costs increase due to PV capacity reduction. For instance, the total cost for the scenario with an availability of 100% is $47,781, while the cost for the scenario with an availability of 80% is $75,260, which is $27,479 higher. This shows that availability has a significant impact on costs, and therefore companies should strive to achieve higher availability values when designing PV systems.
Table 5.
The amount of the cost and determined power of the load with the hybrid system in the distribution network of 33 buses due to the availability changes of the photovoltaic unit.
4.4. The Effect of Considering Uncertainty
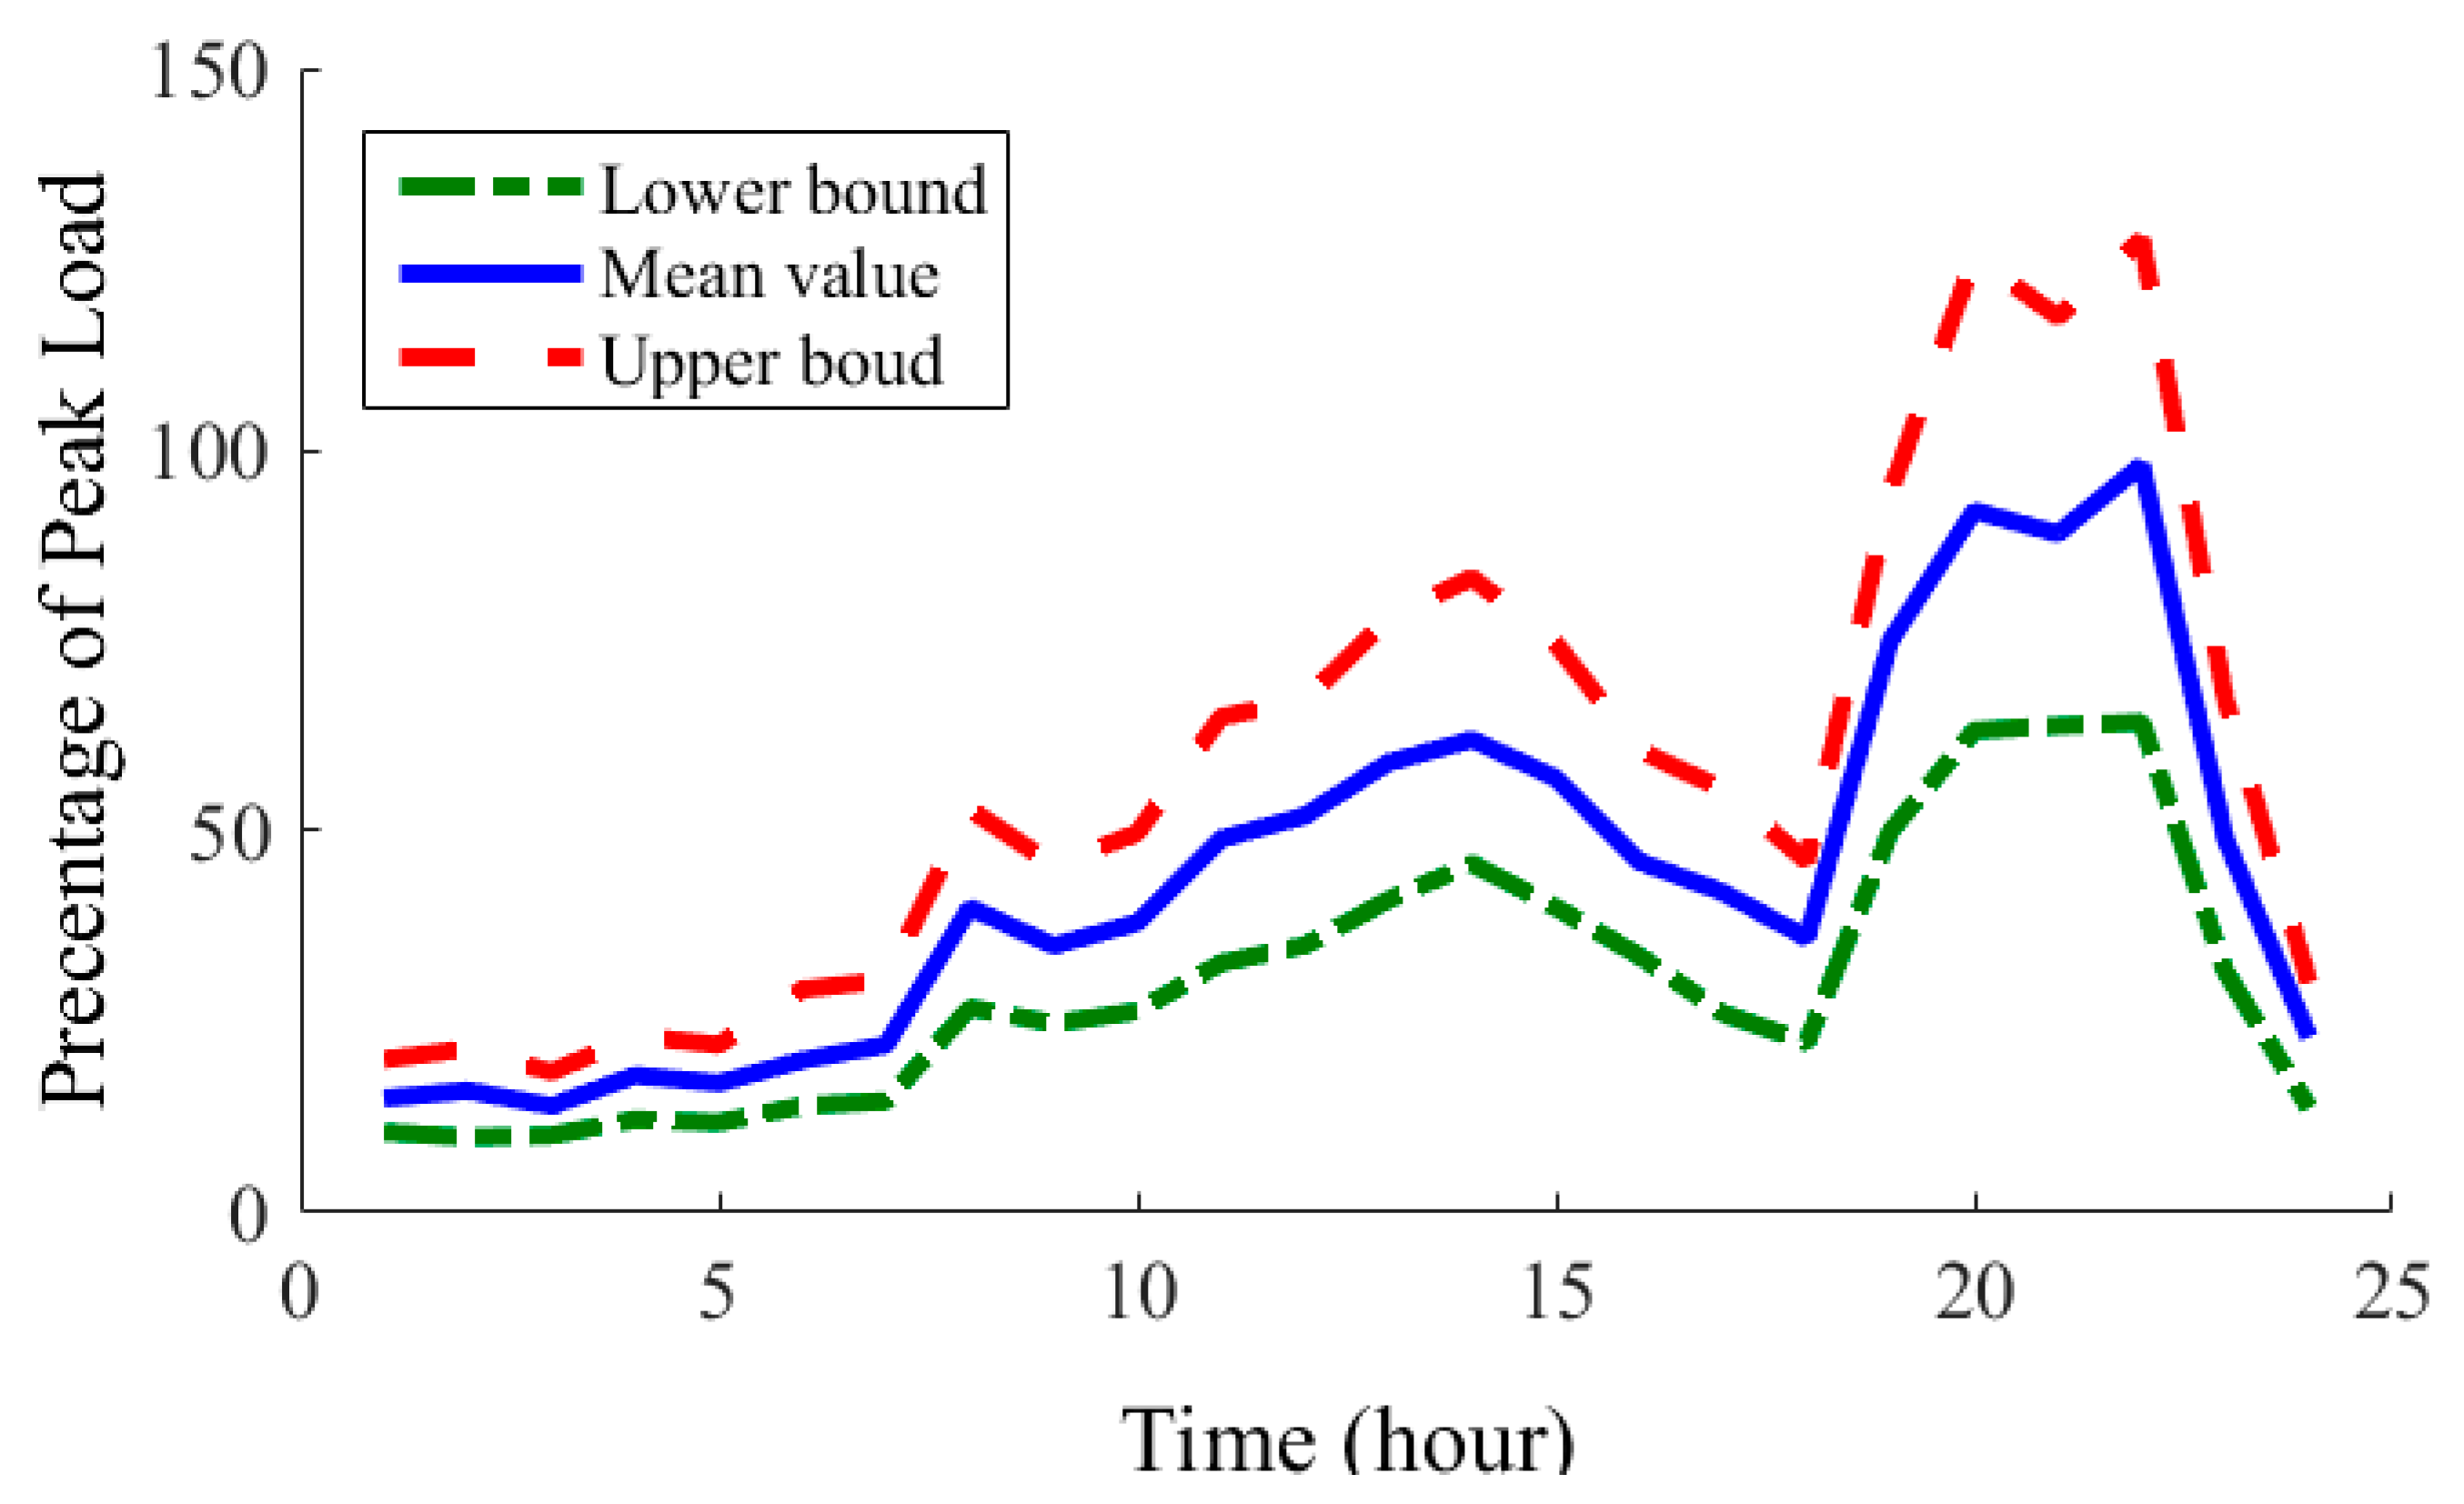
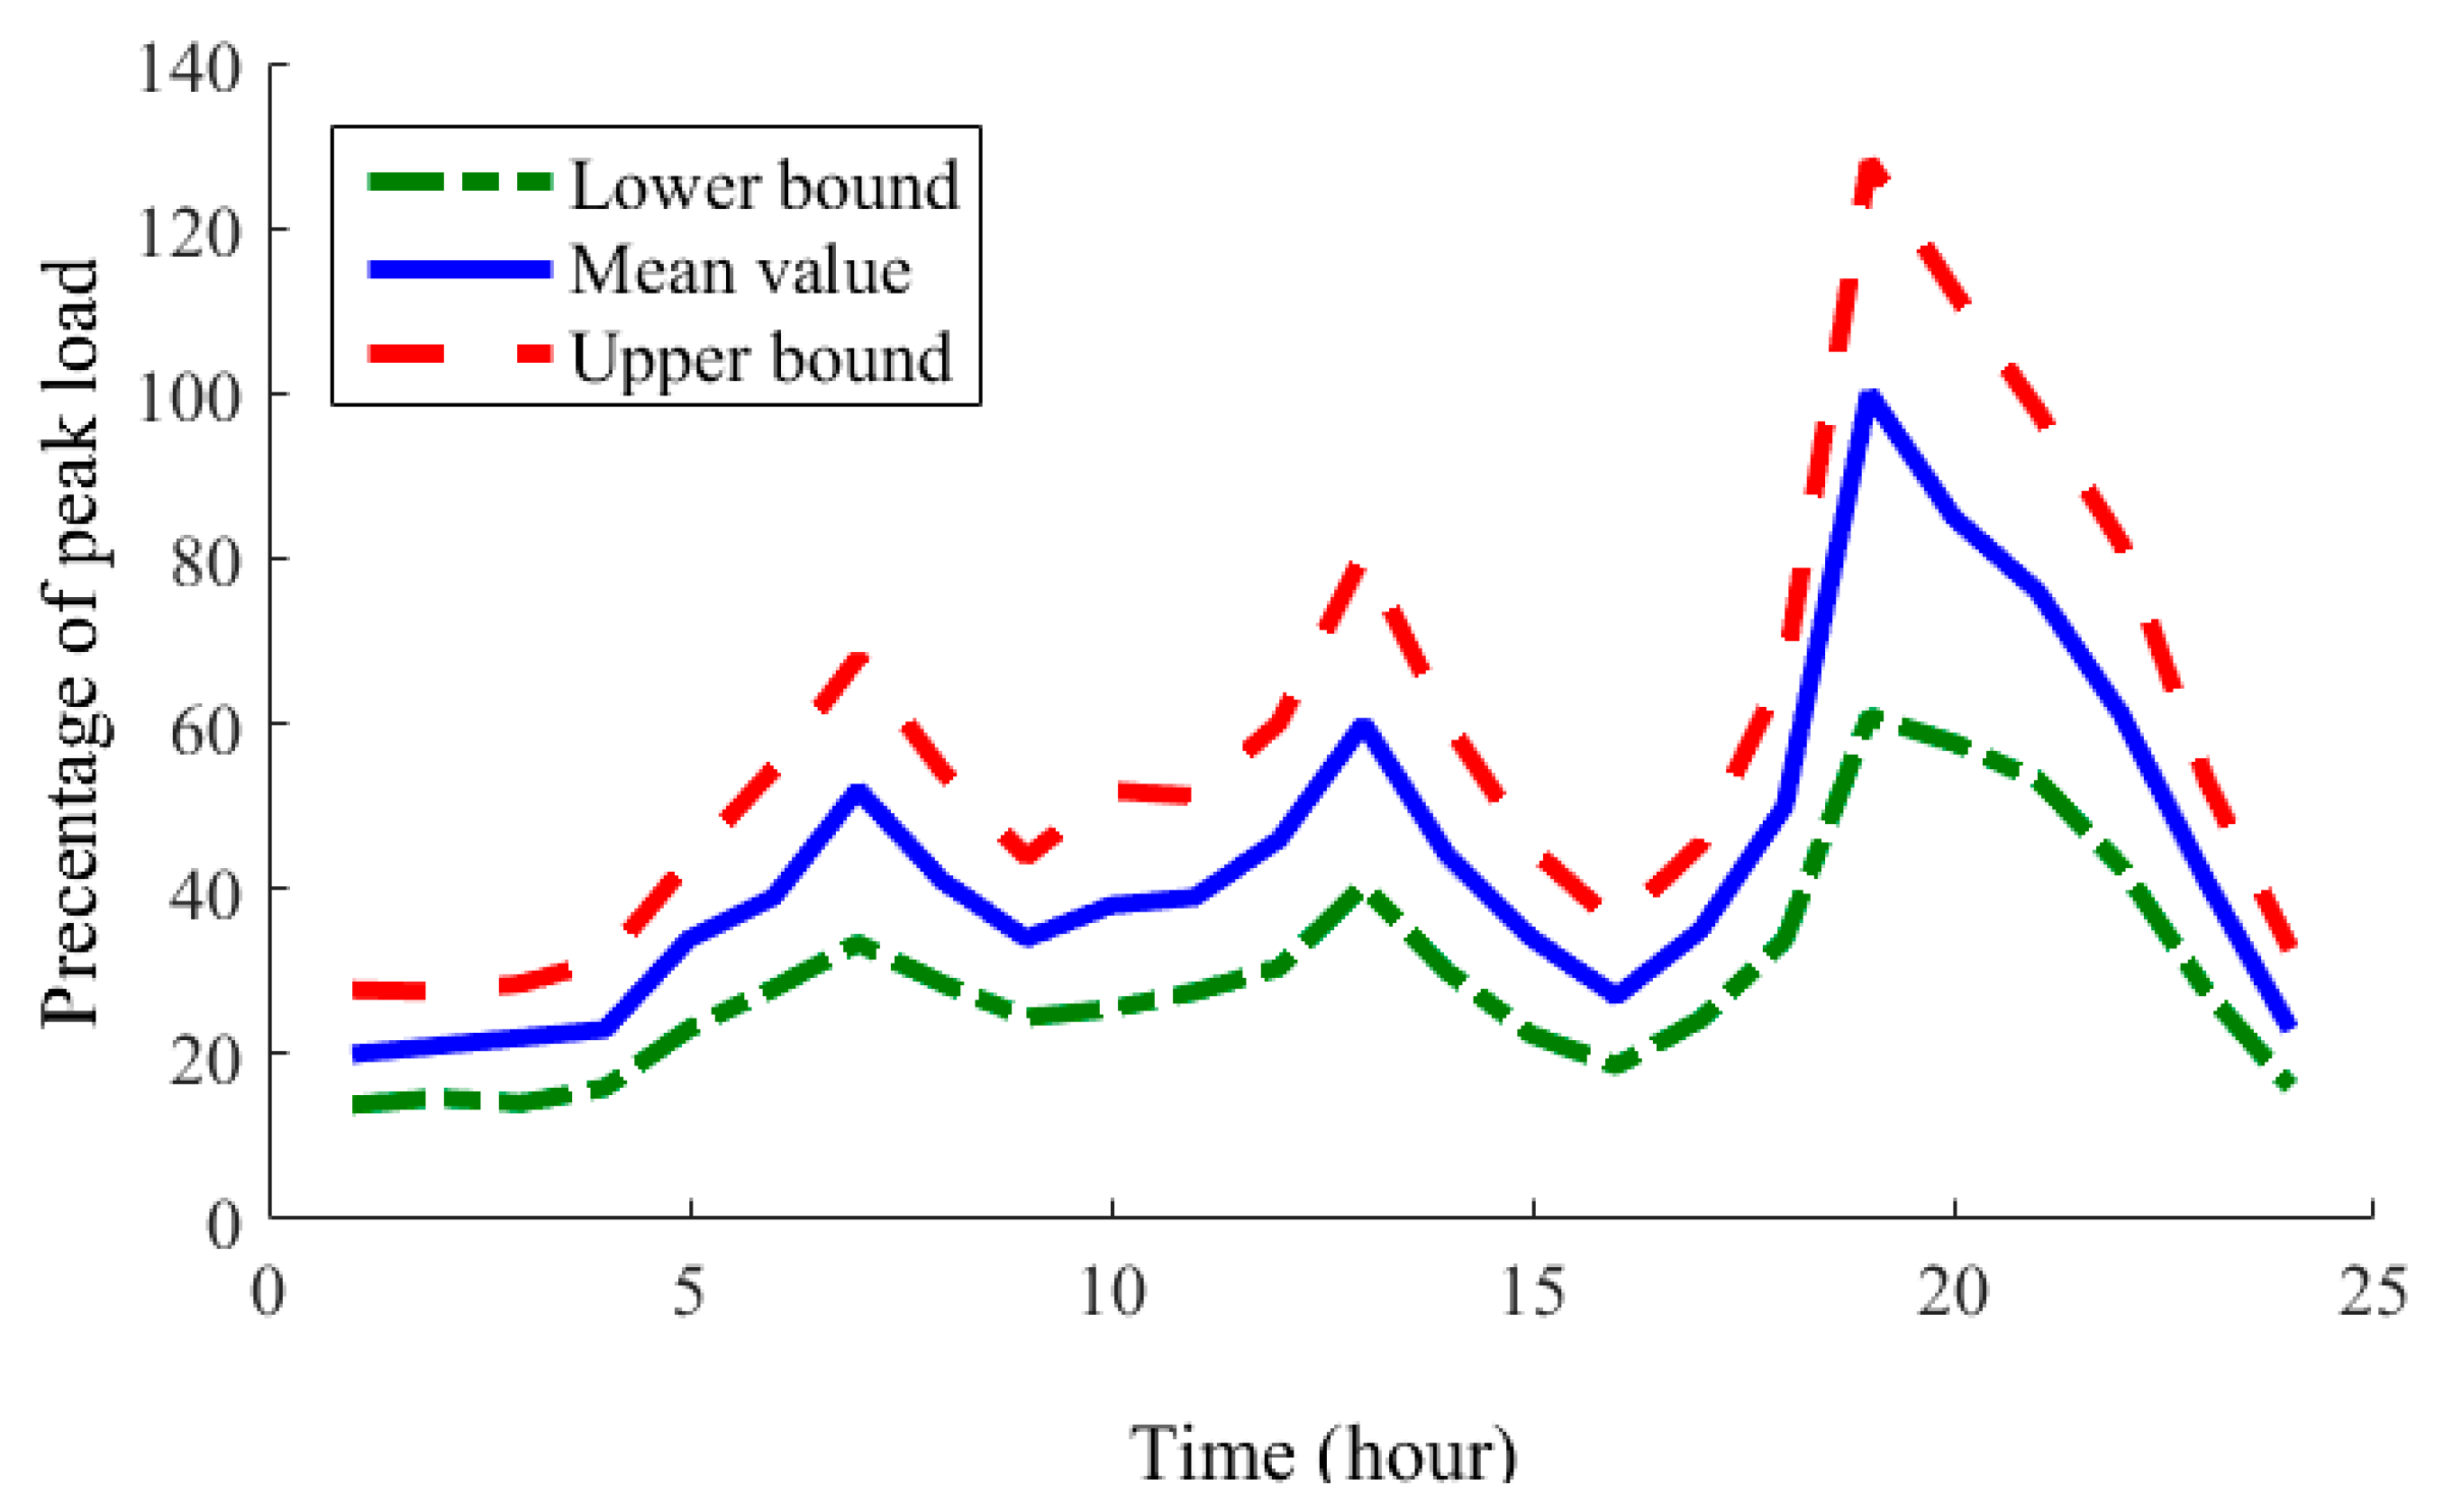
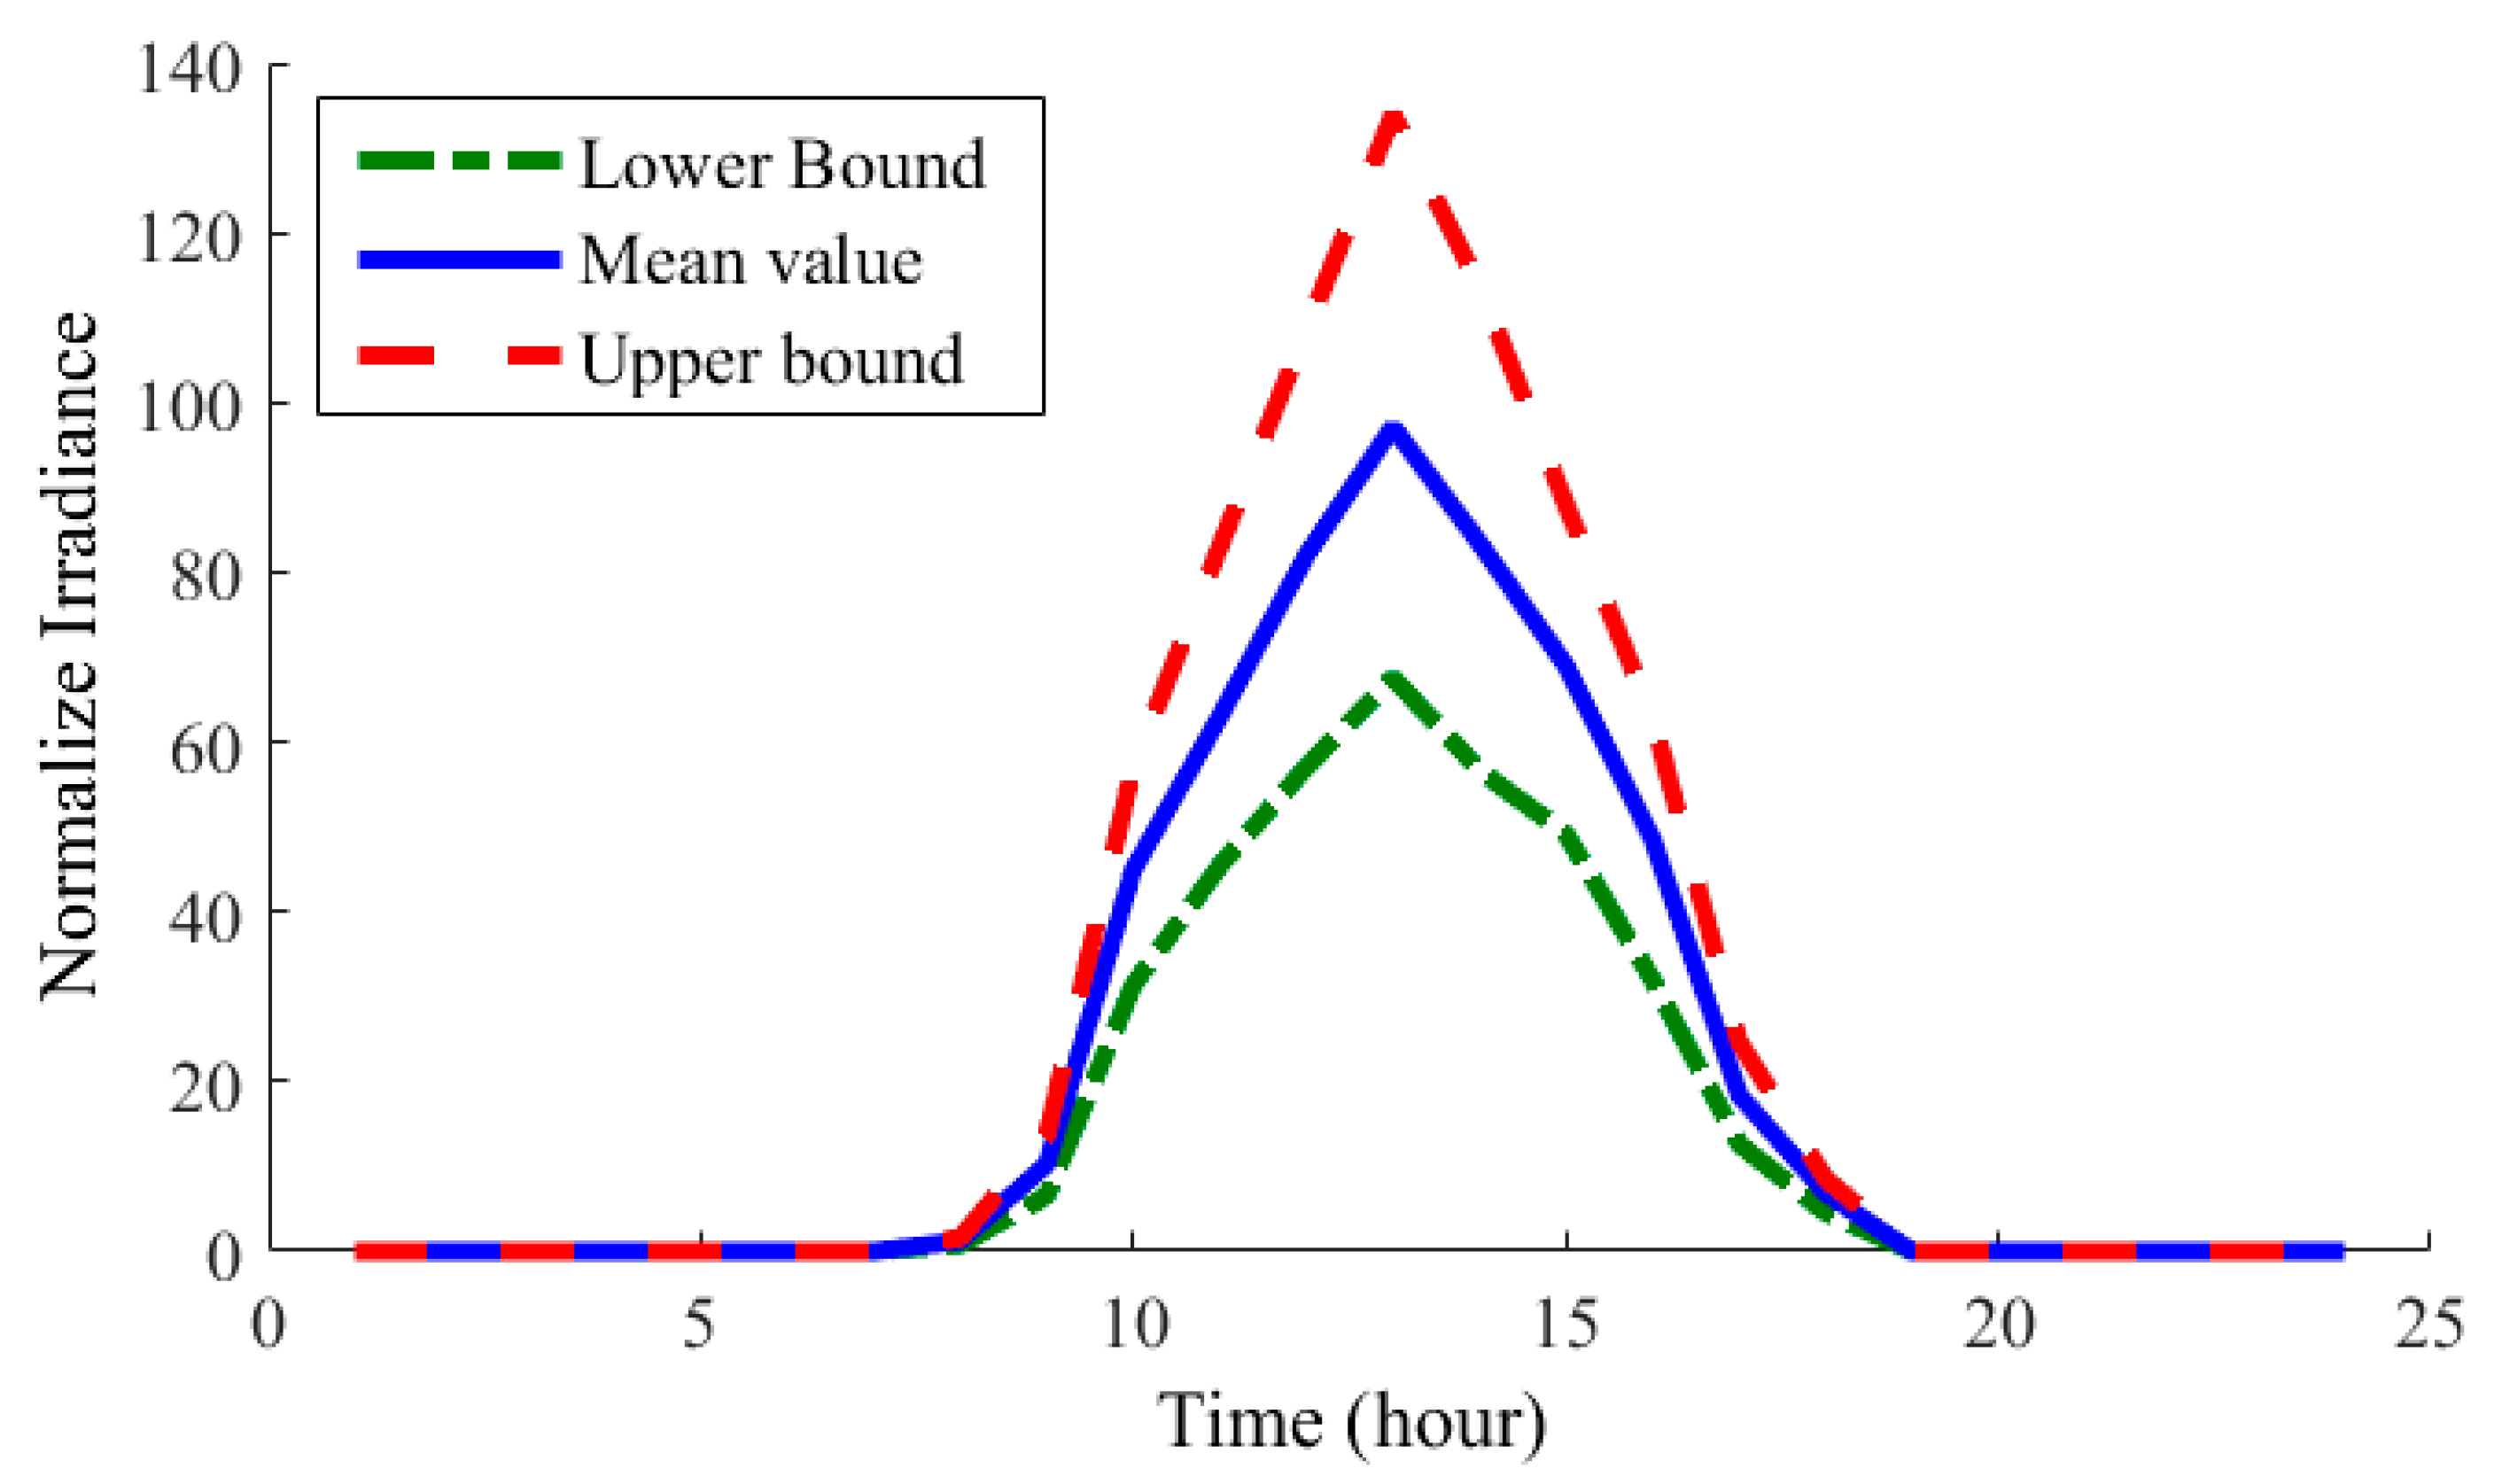
There is often uncertainty regarding both the amount of load demand and the amount of solar radiation in an area. It is common to forecast photovoltaic radiation and network load using beta and normal probability distribution functions (PDFs). In this paper, Monte Carlo is used to generate a set of sample scenarios of load demand and solar radiation based on these PDFs. For this purpose, 1000 random data points have been created for each amount. Throughout this analysis, it is assumed that the quantity of radiation or load each hour will fall within two limits. The upper and lower limits are determined by the distribution network load, the microgrid load, and the amount of sunshine during the day. The restrictions are shown in Figure 11, Figure 12 and Figure 13.
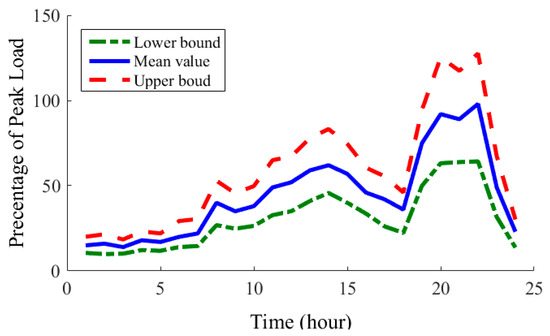
Figure 11.
Upper limit, lower limit, and mean load of the hybrid system.

Figure 12.
Upper limit, lower limit, and mean load of the distribution network.
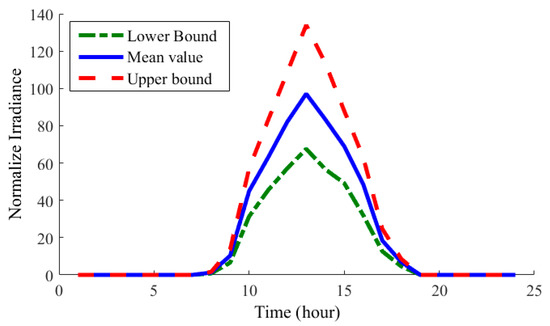
Figure 13.
Upper limit, lower limit, and mean daily photovoltaic radiation.
An optimization algorithm is then applied to the generated sample scenarios to optimize the operation of a photovoltaic–battery hybrid system. Following the optimization process, the results are used to assess the performance of the system and the impact of uncertainty concerning solar radiation and load demand. The results of the optimal design of the microgrid considering the uncertainty using the CLO algorithm are given in Table 6. As is known, the cost of power generation has increased greatly considering uncertainty, owing to conditions in which load demand is at its peak and power generation is at its minimum. It is evident, however, that the cost increases by approximately 50% compared with the case without uncertainty. Consequently, it is important to remember that in stochastic conditions, the network cost may increase greatly, which emphasizes the importance of solving problems stochastically. The question arises, is it reasonable to boost the system cost by 50% for the occurrence of a condition that may occur only 10% of the time? It is important to note that the optimization program considers all possible scenarios for the network when making a particular choice. The costs associated with the obtained solution are the highest. If the proposed solution cannot meet the constraints even in one scenario, that solution is rejected by the program. In this situation, the cost of the system increases drastically. To solve such a problem, here no solution is rejected, and the system cost is calculated for each solution in all scenarios. Finally, the average costs of all scenarios are considered for the desired solution. Therefore, if the proposed solution by the optimization method cannot satisfy the constraints in several scenarios, the answer is not rejected and will continue to be investigated. It is clear that for scenarios whose number is small if the constraints are not respected, they will not have a great impact on the solution process.
Table 6.
The results of considering the uncertainty with the mean and maximum cost of random cases as the OF using the CLO.
Accordingly, if the mean estimate of the cost of stochastic scenarios is considered, overall system costs would rise by 27%. This is nearly 20% less than in the case of using the maximum cost of the scenarios. As a result, uncertainty can be taken into account when determining the mean cost of the system under all possible scenarios.
5. Conclusions
In this study, the design of a microgrid consisting of a commercial load, a photovoltaic panel, battery storage, and diesel backup is studied. Installation and purchase costs as well as maintenance and replacement costs were considered for the photovoltaic panel, battery, and diesel generator. Using a meta-heuristic algorithm named CLO, the optimal size of the microgrid components, as well as the location of the microgrid within the network, was determined to achieve maximum efficiency at the lowest costs. According to the comparison of the results, the proposed method based on CLO performed better in terms of finding optimum solutions with higher convergence speeds. The results were compared to PSO, AEFA, and MRFO algorithms for deterministic problem-solving. The main findings of the paper are presented as follows:
- The results demonstrated the effectiveness of the proposed methodology based on the CLO for the optimal design and allocation of a microgrid energy system with lowest total cost compared with the PSO, MRFO, and AEFA methods. The total cost was obtained $47,781, $47,786, $47,788, and $47,790 using the CLO, PSO, MRFO, and AEFA methods, respectively.
- Due to planned injected energy to the distribution network using PVs resources, battery reserve energy, and diesel power backup, the power losses and load shedding were reduced, and the voltage profile of the network was improved.
- A Monte Carlo simulation was considered to solve the probabilistic problem and model the uncertainties. Based on the study results, generation costs in the network increase significantly when uncertainty is considered. As a result, it is essential to consider uncertainty to effectively manage generation costs in the network.
- The proposed method was found to be superior to the other algorithms in terms of accuracy, speed, and cost-effectiveness compared to the PSO, MRFO, and AEFA methods in view of convergence process.
- The results of the study can be applied to actual microgrid designs, to develop more efficient and cost-effective systems, and also robust scheduling of a microgrid energy system with multi-storage energy using the information gap decision theory is suggested for future work.
Author Contributions
Conceptualization, M.A.A. and Z.A.M.; theoretical analysis, M.A.A. and Z.A.M.; modeling, M.A.A. and Z.A.M.; simulation, M.A.A. and Z.A.M.; writing—original draft preparation, M.A.A. and Z.A.M.; writing—review and editing, M.A.A. and Z.A.M. All authors have read and agreed to the published version of the manuscript.
Funding
This work has been funded by Ajman University under the internal research grant (2022-IRG-ENIT-9).
Institutional Review Board Statement
Not applicable.
Informed Consent Statement
Not applicable.
Data Availability Statement
Not applicable.
Conflicts of Interest
The authors declare no conflict of interest.
References
- Jafar-Nowdeh, A.; Babanezhad, M.; Arabi-Nowdeh, S.; Naderipour, A.; Kamyab, H.; Abdul-Malek, Z.; Ramachandaramurthy, V.K. Meta-heuristic matrix moth–flame algorithm for optimal reconfiguration of distribution networks and placement of solar and wind renewable sources considering reliability. Environ. Technol. Innov. 2020, 20, 101118. [Google Scholar] [CrossRef]
- Li, P.; Hu, J.; Qiu, L.; Zhao, Y.; Ghosh, B.K. A distributed economic dispatch strategy for power–water networks. IEEE Trans. Control Netw. Syst. 2021, 9, 356–366. [Google Scholar] [CrossRef]
- Lv, S.; Zhang, B.; Ji, Y.; Ren, J.; Yang, J.; Lai, Y.; Chang, Z. Comprehensive research on a high performance solar and radiative cooling driving thermoelectric generator system with concentration for passive power generation. Energy 2023, 275, 127390. [Google Scholar] [CrossRef]
- Cai, T.; Dong, M.; Chen, K.; Gong, T. Methods of participating power spot market bidding and settlement for renewable energy systems. Energy Rep. 2022, 8, 7764–7772. [Google Scholar] [CrossRef]
- Arabi-Nowdeh, S.; Nasri, S.; Saftjani, P.B.; Naderipour, A.; Abdul-Malek, Z.; Kamyab, H.; Jafar-Nowdeh, A. Multi-criteria optimal design of hybrid clean energy system with battery storage considering off-and on-grid application. J. Clean. Prod. 2021, 290, 125808. [Google Scholar] [CrossRef]
- Akorede, M.F.; Hizam, H.; Aris, I.; Ab Kadir, M.Z.A. A review of strategies for optimal placement of distributed generation in power distribution systems. Res. J. Appl. Sci. 2010, 5, 137–145. [Google Scholar] [CrossRef]
- Zhang, X.; Wang, Y.; Yuan, X.; Shen, Y.; Lu, Z.; Wang, Z. Adaptive dynamic surface control with disturbance observers for battery/supercapacitor-based hybrid energy sources in electric vehicles. IEEE Trans. Transp. Electrif. 2022. [Google Scholar] [CrossRef]
- Wang, Z.; Zhao, D.; Guan, Y. Flexible-constrained time-variant hybrid reliability-based design optimization. Struct. Multidiscip. Optim. 2023, 66, 89. [Google Scholar] [CrossRef]
- Zhang, X.; Lu, Z.; Yuan, X.; Wang, Y.; Shen, X. L2-gain adaptive robust control for hybrid energy storage system in electric vehicles. IEEE Trans. Power Electron. 2020, 36, 7319–7332. [Google Scholar] [CrossRef]
- Jiang, J.; Zhang, L.; Wen, X.; Valipour, E.; Nojavan, S. Risk-based performance of power-to-gas storage technology integrated with energy hub system regarding downside risk constrained approach. Int. J. Hydrogen Energy 2022, 47, 39429–39442. [Google Scholar] [CrossRef]
- Min, C.; Pan, Y.; Dai, W.; Kawsar, I.; Li, Z.; Wang, G. Trajectory optimization of an electric vehicle with minimum energy consumption using inverse dynamics model and servo constraints. Mech. Mach. Theory 2023, 181, 105185. [Google Scholar] [CrossRef]
- Nowdeh, S.A.; Davoudkhani, I.F.; Moghaddam, M.H.; Najmi, E.S.; Abdelaziz, A.Y.; Razavi, S.; Gandoman, F.H. Fuzzy multi-objective placement of renewable energy sources in distribution system with objective of loss reduction and reliability improvement using a novel hybrid method. Appl. Soft Comput. 2019, 77, 761–779. [Google Scholar] [CrossRef]
- Naderipour, A.; Kamyab, H.; Klemeš, J.J.; Ebrahimi, R.; Chelliapan, S.; Nowdeh, S.A.; Abdullah, A.; Marzbali, M.H. Optimal design of hybrid grid-connected photovoltaic/wind/battery sustainable energy system improving reliability, cost and emission. Energy 2022, 257, 124679. [Google Scholar] [CrossRef]
- Lin, L.; Shi, J.; Ma, C.; Zuo, S.; Zhang, J.; Chen, C.; Huang, N. Non-intrusive residential electricity load decomposition via low-resource model transferring. J. Build. Eng. 2023, 73, 106799. [Google Scholar] [CrossRef]
- Deng, W.; Zhang, Y.; Tang, Y.; Li, Q.; Yi, Y. A neural network-based adaptive power-sharing strategy for hybrid frame inverters in a microgrid. Front. Energy Res. 2023, 10, 1082948. [Google Scholar] [CrossRef]
- Harrison, G.P.; Wallace, A.R. Optimal power flow evaluation of distribution network capacity for the connection of distributed generation. IEE Proc. Gener. Transm. Distrib. 2005, 152, 115–122. [Google Scholar] [CrossRef]
- Wang, C.; Nehrir, M.H. Analytical approaches for optimal placement of distributed generation sources in power systems. IEEE Trans. Power Syst. 2004, 19, 2068–2076. [Google Scholar] [CrossRef]
- Griffin, T.; Tomsovic, K.; Secrest, D.; Law, A. Placement of dispersed generation systems for reduced losses. In Proceedings of the 33rd Annual Hawaii International Conference on System Sciences, Maui, HI, USA, 7 January 2000. [Google Scholar]
- Ihsan, M.; Shahzad, M.; Ullah, N. Analytical method for optimal reactive power support in power network. In Proceedings of the 2019 2nd International Conference on Computing, Mathematics and Engineering Technologies (iCoMET), Sukkur, Pakistan, 30–31 January 2019; pp. 1–6. [Google Scholar]
- Shahzad, M.; Ahmad, I.; Gawlik, W.; Palensky, P. Active power loss minimization in radial distribution networks with analytical method of simultaneous optimal DG sizing. In Proceedings of the 2016 IEEE International Conference on Industrial Technology (ICIT), Taipei, Taiwan, 14–17 March 2016; pp. 470–475. [Google Scholar]
- Al-Quraan, A.; Al-Mhairat, B.; Malkawi, A.M.; Radaideh, A.; Al-Masri, H.M. Optimal Prediction of Wind Energy Resources Based on WOA—A Case Study in Jordan. Sustainability 2023, 15, 3927. [Google Scholar] [CrossRef]
- Darwish, H.H.; Al-Quraan, A. Machine Learning Classification and Prediction of Wind Estimation Using Artificial Intelligence Techniques and Normal PDF. Sustainability 2023, 15, 3270. [Google Scholar] [CrossRef]
- Bataineh, K.M.; Dalalah, D. Assessment of wind energy potential for selected areas in Jordan. Renew. Energy 2013, 59, 75–81. [Google Scholar] [CrossRef]
- Devi, S.; Geethanjali, M. Application of modified bacterial foraging optimization algorithm for optimal placement and sizing of distributed generation. Expert Syst. Appl. 2014, 41, 2772–2781. [Google Scholar] [CrossRef]
- Hamidan, M.A.; Borousan, F. Optimal planning of distributed generation and battery energy storage systems simultaneously in distribution networks for loss reduction and reliability improvement. J. Energy Storage 2022, 46, 103844. [Google Scholar] [CrossRef]
- Pereira, L.D.; Yahyaoui, I.; Fiorotti, R.; de Menezes, L.S.; Fardin, J.F.; Rocha, H.R.; Tadeo, F. Optimal allocation of distributed generation and capacitor banks using probabilistic generation models with correlations. Appl. Energy 2022, 307, 118097. [Google Scholar] [CrossRef]
- Salimon, S.A.; Adepoju, G.A.; Adebayo, I.G.; Adewuyi, O.B. Comparative assessment of techno-economic and environmental benefits in optimal allocation of distributed generators in distribution networks. Sci. Afr. 2023, 19, e01546. [Google Scholar] [CrossRef]
- Davoudkhani, I.F.; Dejamkhooy, A.; Nowdeh, S.A. A novel cloud-based framework for optimal design of stand-alone hybrid renewable energy system considering uncertainty and battery aging. Appl. Energy 2023, 344, 121257. [Google Scholar] [CrossRef]
- Nowdeh, S.A.; Naderipour, A.; Davoudkhani, I.F.; Guerrero, J.M. Stochastic optimization–based economic design for a hybrid sustainable system of wind turbine, combined heat, and power generation, and electric and thermal storages considering uncertainty: A case study of Espoo, Finland. Renew. Sustain. Energy Rev. 2023, 183, 113440. [Google Scholar] [CrossRef]
- García, J.A.M.; Mena, A.J.G. Optimal distributed generation location and size using a modified teaching–learning based optimization algorithm. Int. J. Electr. Power Energy Syst. 2013, 50, 65–75. [Google Scholar] [CrossRef]
- Kayal, P.; Chanda, C.K. Placement of wind and photovoltaic based DGs in distribution system for power loss minimization and voltage stability improvement. Int. J. Electr. Power Energy Syst. 2013, 53, 795–809. [Google Scholar] [CrossRef]
- Askarzadeh, A. A discrete chaotic harmony search-based simulated annealing algorithm for optimum design of PV/wind hybrid system. Photovolt. Energy 2013, 97, 93–101. [Google Scholar] [CrossRef]
- Kaviani, A.K.; Riahy, G.H.; Kouhsari, S.M. Optimal design of a reliable hydrogen-based stand-alone wind/PV generating system, considering component outages. Renew. Energy 2009, 34, 2380–2390. [Google Scholar] [CrossRef]
- Maleki, A.; Askarzadeh, A. Artificial bee swarm optimization for optimum sizing of a stand-alone PV/WT/FC hybrid system considering LPSP concept. Photovolt. Energy 2014, 107, 227–235. [Google Scholar] [CrossRef]
- Engin, M.; Engin, D. Sizing PV-wind hybrid energy system for Lighting. Int. J. Dev. Sustain. 2012, 1, 85–98. [Google Scholar]
- Kaabeche, A.; Belhamel, M.; Ibtiouen, R. Techno-economic valuation and optimization of integrated photovoltaic/wind energy conversion system. Photovolt. Energy 2011, 85, 2407–2420. [Google Scholar] [CrossRef]
- Kaabeche, A.; Ibtiouen, R. Techno-economic optimization of hybrid photovoltaic/wind/diesel/battery generation in a stand-alone power system. Photovolt. Energy 2014, 103, 171–182. [Google Scholar] [CrossRef]
- Trojovská, E.; Dehghani, M. Clouded Leopard Optimization: A New Nature-Inspired Optimization Algorithm. IEEE Access 2022, 10, 102876–102906. [Google Scholar] [CrossRef]
- Kennedy, J.; Eberhart, R. Particle swarm optimization. In Proceedings of the ICNN’95-International Conference on Neural Networks, Perth, WA, Australia, 27 November–1 December 1995; Volume 4, pp. 1942–1948. [Google Scholar]
- Zhao, W.; Zhang, Z.; Wang, L. Manta ray foraging optimization: An effective bio-inspired optimizer for engineering applications. Eng. Appl. Artif. Intell. 2020, 87, 103300. [Google Scholar] [CrossRef]
- Yadav, A. AEFA: Artificial electric field algorithm for global optimization. Swarm Evol. Comput. 2019, 48, 93–108. [Google Scholar]
- El-Zonkoly, A. Optimal placement and schedule of multiple grid connected hybrid energy systems. Int. J. Electr. Power Energy Syst. 2014, 61, 239–247. [Google Scholar] [CrossRef]
- Khalesi, N.; Rezaei, N.; Haghifam, M.R. DG allocation with application of dynamic programming for loss reduction and reliability improvement. Int. J. Electr. Power Energy Syst. 2011, 33, 288–295. [Google Scholar] [CrossRef]
- Alanazi, A.; Alanazi, M.; Nowdeh, S.A.; Abdelaziz, A.Y.; El-Shahat, A. An optimal sizing framework for autonomous photovoltaic/hydrokinetic/hydrogen energy system considering cost, reliability and forced outage rate using horse herd optimization. Energy Rep. 2022, 8, 7154–7175. [Google Scholar] [CrossRef]
- Arasteh, A.; Alemi, P.; Beiraghi, M. Optimal allocation of photovoltaic/wind energy system in distribution network using meta-heuristic algorithm. Appl. Soft Comput. 2021, 109, 107594. [Google Scholar] [CrossRef]


Disclaimer/Publisher’s Note: The statements, opinions and data contained in all publications are solely those of the individual author(s) and contributor(s) and not of MDPI and/or the editor(s). MDPI and/or the editor(s) disclaim responsibility for any injury to people or property resulting from any ideas, methods, instructions or products referred to in the content. |
© 2023 by the authors. Licensee MDPI, Basel, Switzerland. This article is an open access article distributed under the terms and conditions of the Creative Commons Attribution (CC BY) license (https://creativecommons.org/licenses/by/4.0/).