Article

The Development of Green Ports in Emerging Nations: A Case Study of Vietnam

1
Faculty of Economics, Vietnam Maritime University, Haiphong 180000, Vietnam
2
Hai Phong External Affairs Department, Haiphong 180000, Vietnam
*
Author to whom correspondence should be addressed.
Sustainability 2023, 15(18), 13502; https://doi.org/10.3390/su151813502
Submission received: 27 May 2023 / Revised: 24 August 2023 / Accepted: 27 August 2023 / Published: 8 September 2023
(This article belongs to the Section Sustainable Transportation)

Abstract

:
The development of green ports is still limited, especially in developing nations, despite the fact that they are viewed as a significant answer to the problems of environmental pollution and climate change. The purpose of this study is to investigate the factors that promote and hinder the development of green ports in developing countries. Using 248 managers from 12 Vietnamese container ports as a sample, this study is one of the pioneers in using a quantitative methodology to investigate the factors affecting the development of green ports. We used SPSS 22.0 and AMOS 22.0 to perform principal component analysis (PCA), confirmatory factor analysis (CFA), and structural equation modeling (SEM). Our results indicated that cooperation of involved parties and foreign capital has the most important role in green port development in developing countries, followed by environmental regulation. Our findings also showed that lack of initial capital and lack of technological advancement negatively affects the development of green ports in these countries. The results and implications of the study will be discussed in more detail.

1. Introduction

Ports play an increasingly significant role in fostering regional economic growth and international trade as a key hub of the transportation network [1,2]. Ports now provide cities, regions, and nations with a vital strategic resource for taking part in global economic cooperation and competitiveness, in addition to providing space for transportation, logistics, and a way to connect with the outside world [3,4]. For instance, ports play a significant role in the Vietnamese economy, contributing to the nation’s positioning as the “new Asian tiger” in Business Times (Singapore). Vietnamese exports will total around 371.5 billion USD in 2022, up 10.5% from 2021, according to information provided by the Ministry of Industry and Trade of Vietnam at the 2022 overview conference on December 26. The import-export turnover is occurring for the first time. Vietnam has exported goods worth more than 700 billion USD. Ports are also locations for the generation of renewable energy, such as solar, tidal, and wind energy, both onshore and offshore. This renewable energy industry might provide jobs and add value to ports by building future power-supply infrastructure and clustering associated firms in port regions, revitalizing the economy of port towns [5].
However, ports’ effects on climate change via greenhouse gas emissions, as well as on human health via air pollutants discharged in residential areas, cannot be overlooked [6]. Vessel emissions at ports are becoming increasingly problematic, particularly for SOx, NOx, and PM, which have a negative impact on local people’s health [7]. In terms of GHG emissions, the release of CO2, SO2, NOx, PM10, PM2.5, HC, CO, and VOC may be extremely harmful to one’s health and has been associated with asthma, other respiratory disorders, cardiovascular disease, lung cancer, and premature death [8]. The World Health Organization (WHO) considers air pollution to be a serious environmental danger to health, estimating that it causes three million deaths per year [9].
Green ports are presented as an achievable solution to the energy issue and environmental degradation. A green port is a port that not only satisfies environmental criteria but also provides economic benefits. Green ports are an excellent strategy to reduce environmental pollution and ecological harm, as well as to maintain the ports’ water resources and natural environment [10].
According to the study findings of the criteria of a green port by [11,12], nations in Europe, the United States, and certain developed countries in Asia such as Singapore and South Korea have created and applied sets of sustainability standards to port operations [12,13,14,15,16,17,18,19,20,21,22,23]. The findings revealed that ports in these nations enhance economic demand while having no harmful environmental impact. It appears that technology and monetary advantages have allowed these countries to significantly change their seaports toward sustainability. In contrast, developing countries confront unique challenges in addressing the issue of green port development. Many Chinese port authority bodies, for example, are disappointed by the lack of a fundamental set of rules or criteria for green port evaluation to use in order to finally become ‘green’. Furthermore, due to a lack of information openness, implementing a holistic approach to Chinese ports’ sustainability standards is particularly challenging [12]. Although previous studies have shown factors influencing the development of green ports in developed countries [8,24], there are still relatively few studies for developing countries that face contradictions in terms of economic development and environmental protection.
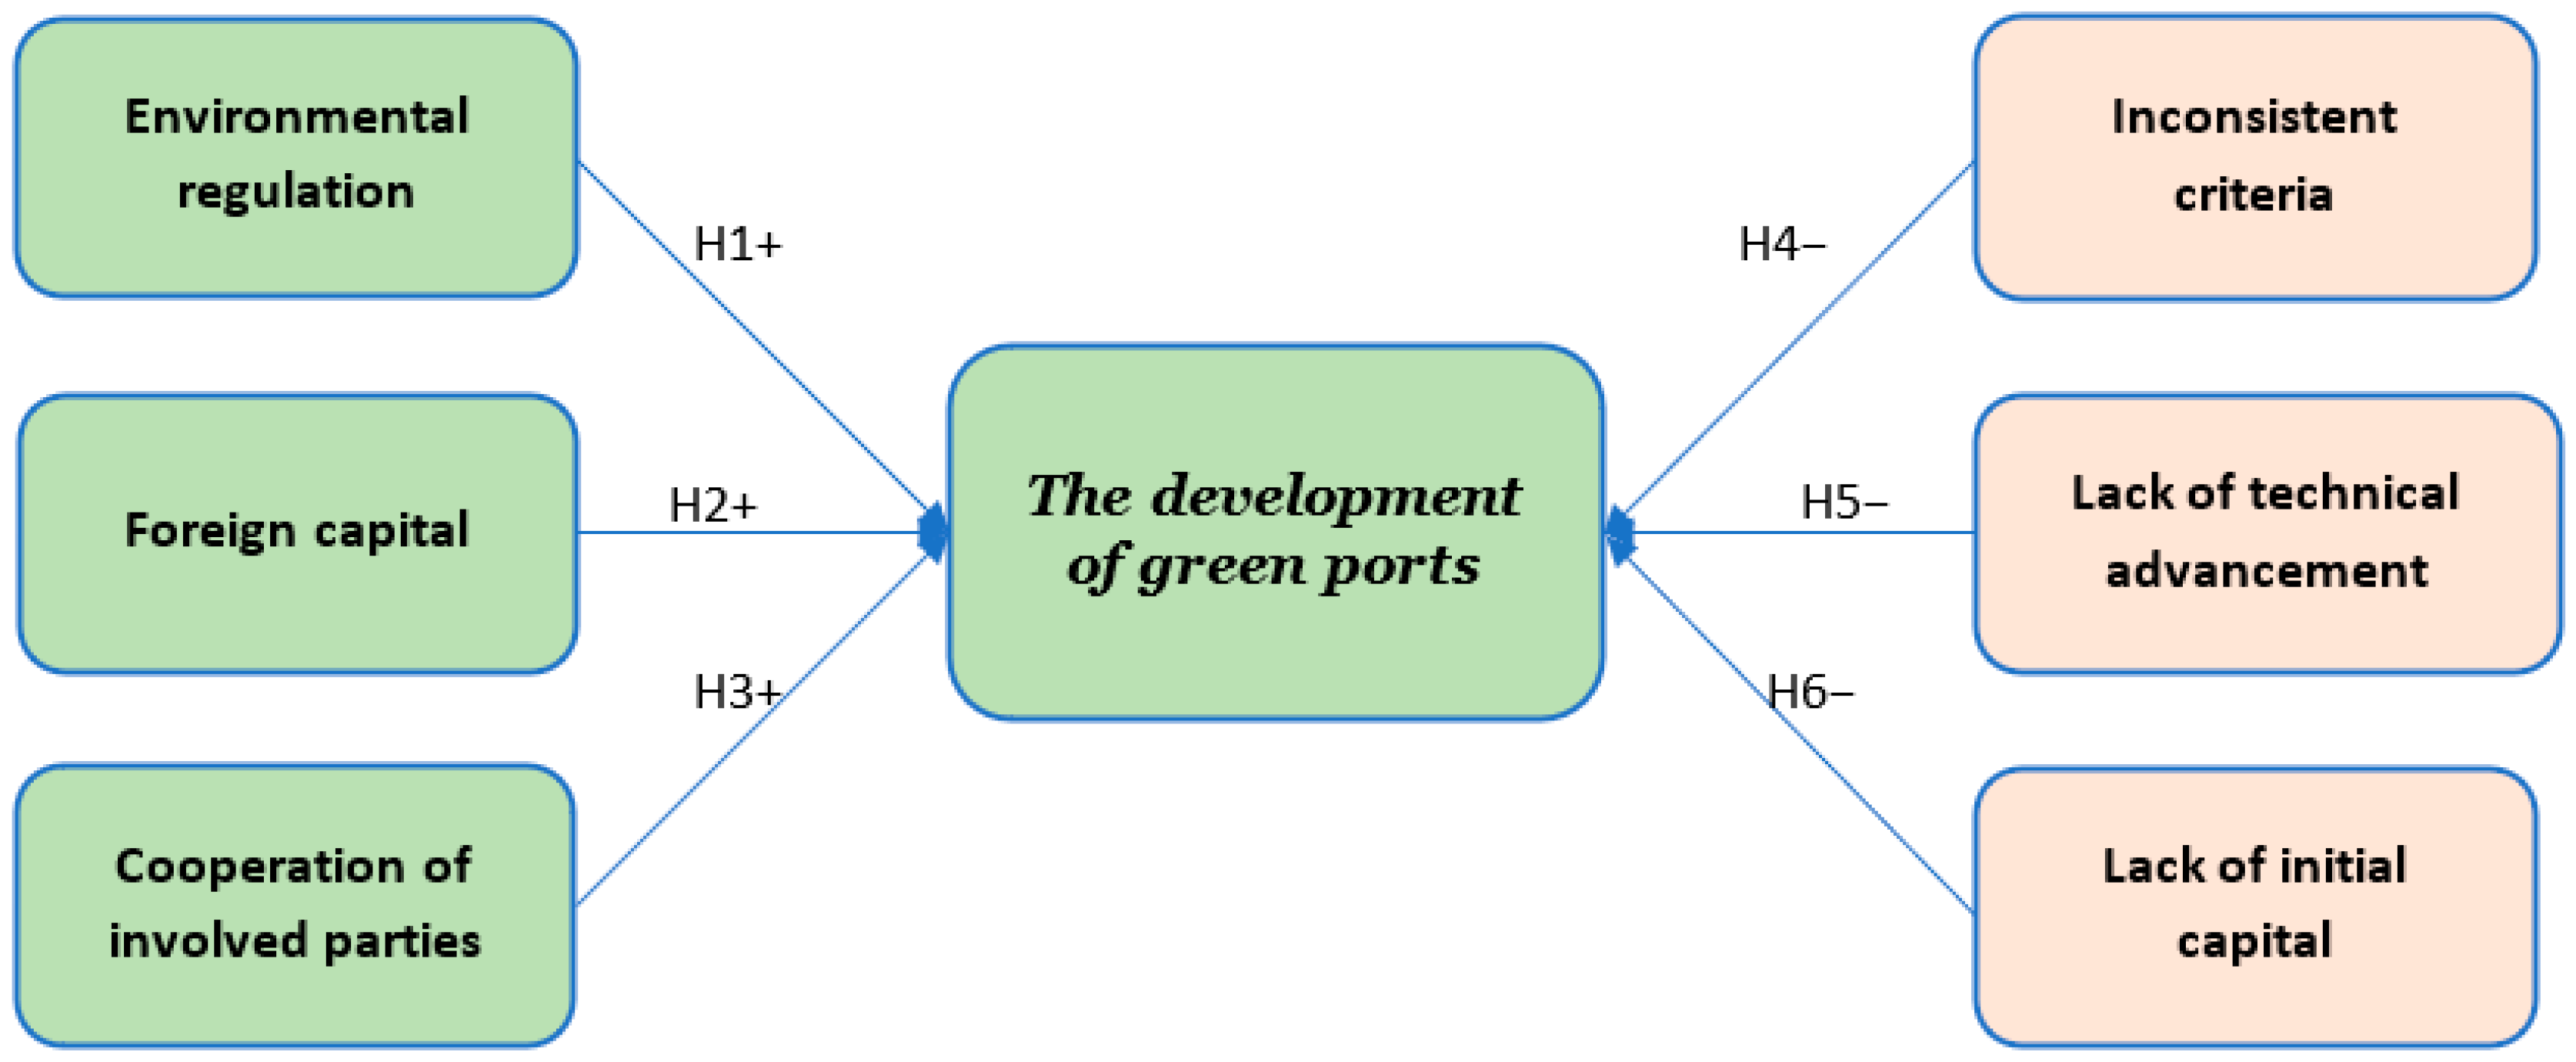
The study’s goal is to investigate the factors influencing the development of green ports in developing countries, particularly in Vietnam. This is one of the first studies that employs survey and quantitative methods to explore the factors influencing green port development. A better understanding of these variables has important implications for the underlying theoretical framework of green ports, allowing academics to distinguish between the factors influencing the development of green ports in developed and developing countries. According to the research findings, there are three drivers and two obstacles, which adds to the theoretical foundation of green ports. While prior research employed qualitative approaches to identify important factors, this study added substantial value by quantitatively assessing these elements. Particularly, our research affirms the importance of international regulations in the development of green ports [8] and reinforces the impact of national policy on environmental protection through mandatory requirements and guidelines. National laws and regulations have a substantial influence on port compliance with environmental criteria, even though the International Marine Organization (IMO) is the primary maritime transport authority. Furthermore, although prior studies had demonstrated the role of technological leverage in reducing environmental impact and supporting the development of green ports in developed nations, our study confirms that the lack of modern technology will adversely affect the development of green ports in developing countries.

2. Literature Review

2.1. Green Port

The production of air, oil, and noise pollution, as well as health and ecological dangers, by ports, has a substantial and often fatal influence on port stakeholders and a long-term and green port growth plan [25]. The key issue in ecological ports is striking a balance between the impact on the environment and business interests. As a result, various studies propose that a sustainable port or green port may be used to address this problem [6,26,27,28]. According to [28], a sustainable port (also known as a green port) is one that the port authority, in collaboration with port users, proactively designs and conducts, relying on an economically sustainable strategic plan, collaborating with natural philosophy, and engaging stakeholders. Starting from a long-term goal on the location in which it is positioned and from its position of privilege within the supply chain, it ensures development that anticipates the needs of the community. Ref. [27] favored the idea of a green port that produced all of its renewable energy sources (RES), such as wind turbines or a small solar park, to balance off any energy consumed in operating the port’s operations. Ref. [6] proposed that a green port is one that has either made an investment in new machinery with improved environmental performance or has developed a strategy to reduce emissions, energy consumption in operations, and water pollution. The three bottom lines of economic growth, social well-being, and environmental preservation should be controlled and balanced through the active integration of climate change mitigation and adaptation measures into the green port’s policies and objectives [26]. A green port is one that aims for environmental preservation, energy savings, safety, and human health in port operations. A green port is one that has a specific plan or action to prevent negative environmental consequences and guide people in environmental protection. For example, the port replaces fossil fuel-powered equipment with electrical equipment to decrease air pollution, and it uses shore power as an alternative to generators inside ships to reduce air pollution and noise, using a green prize to motivate people to adhere to the rules. Previous research has indicated that a green port must meet needs such as air pollution management, noise pollution management, solid waste pollution management, water pollution management, human resource training, information technology application, and hazard response [11,12]. Based on the findings of these studies, the Vietnamese government released the “Green Port Development Program” in 2020, requiring seaports to comply with the requirements voluntarily by 2025, and mandatorily by 2030.

2.2. The Drivers and Barriers of Green Ports

2.2.1. Environmental Regulations

To safeguard the port environment and lower the danger of pollution, environmental regulations comprise both international conventions and national policies [8,29,30,31,32,33,34]. The International Maritime Organization (IMO) was founded by the United Nations in 1948 to develop and enforce a comprehensive regulatory framework for shipping. It is now in charge of issues with security at sea, the environment, legislation, technological collaboration, shipping efficiency, and more. The majority of states, including Vietnam, have ratified the IMO conventions. At the same time, the European Union has established a number of environmental rules that primarily focus on air pollution, wildlife and biodiversity, water and marine ecosystems, soil, waste, and other aspects that would reduce environmental threats. The European directives must be followed by all EU members. Each country must ratify the European regulation and implement it into its legal system within a reasonable time limit. According to its needs and obligations, each nation builds its environmental policy. The nation’s environmental policy combines its obligations and goals [35]. For instance, by the year 2030, the Vietnamese government wants all ports to operate in accordance with green port standards. We predict that environmental restrictions will have a significant influence on the development of green port policies based on the justification given above [8,31,33,34,36].
Hypothesis 1.
Environmental regulations are positively related to the development of a green port.

2.2.2. Foreign Capital

Foreign direct investment, loans from multilateral organizations like the World Bank, or loans from foreign governments are all examples of ways that money from abroad enters the home nation and is referred to as “foreign capital”. Direct and indirect foreign investments fall into two different groups [37]. Foreign direct investment (FDI) has driven remarkable economic progress in a number of emerging countries [37]. In general, FDI increases the availability of money and, with the proper host-country rules, may also hasten the transfer of technology. The development of human capital is aided by technology transfer, which can increase the likelihood of economic growth. In other words, FDI might both directly and indirectly assist economic growth.
For more than 30 years and even today, capital from foreign direct investment (FDI) has significantly aided Vietnam’s socioeconomic development. FDI into Vietnam increased by 9.2% from 2020 to 31.15 billion USD in 2021, notwithstanding the COVID-19 pandemic’s challenging course of development. This indicates how confident international investors are about the business climate in Vietnam. The construction of seaport infrastructure has benefited significantly in recent years from FDI funding. The presence of international firms in the transport and port sectors, such as Hutchison, PSA, DP World, SSA, Maersk A/S, and CMA-CGM, has greatly increased FDI in Vietnam [38].
Additionally, indirect investment resources, namely, official development assistance, are used to upgrade the seaport infrastructure in Vietnam (ODA). Three significant ports—including Cai Lan, Tien Sa, and Cai Mep–Thi Vai—have had investments completed by the maritime industry using ODA assistance. Basically, the seaport system has made it possible for goods to be imported and exported and for linkages to be formed between different areas of the country by water, favorably impacting economic growth and initially meeting the demands of the socio-economic development of the country [38].
Vietnam is working to develop a circular economy in which seaports are headed on the right path for sustainability. Many people are interested in the green port’s building. The creation of a green port, however, will be quite expensive. In order to implement the port greening strategy, foreign capital will be a crucial resource.
Hypothesis 2.
Foreign capital is positively related to the development of a green port.

2.2.3. Cooperation of Involved Parties (Shipping Firms, Transportation Companies)

The challenge of changing ports toward sustainability and the necessity to include a wide variety of stakeholders are acknowledged in several publications, both inside and beyond the scope of this study (e.g., [39,40,41]). Three kinds of green port environmental issues may be distinguished, according to the OECD (2011): (1) ship emissions, (2) port operations, and (3) traffic in the hinterland. Key causes of air pollution brought on by shipping include sulfur oxides (SOx), nitrogen oxides (NOx), and particulate matter, all of which have an impact on local and regional air pollution. Additionally, the physical and emotional health of dockworkers as well as residents in coastal regions might be negatively impacted by noise from ship auxiliary engines during laytime. Due to the enormous number of cars that go to and from ports, pollution and traffic are the key challenges from an inland perspective [7]. The Association of Southeast Asian Nations highlighted one of the major barriers to the sustainable growth of ports in Asia as poor coordination with shipping companies and other supply chain partners [42,43].
Numerous earlier studies have demonstrated that the concerted effort by multiple stakeholders to alleviate the burden on the port authority will make the development of the green port plan more successful [44,45,46,47,48,49,50]. First, by deploying more environmentally friendly ships, such as propulsion improvements and auxiliary engine retrofits [46,48,51], or slowing down their speed in the port area [44], shipping firms may promote a more environmentally friendly port strategy. Second, some significant solutions for the inland transportation system are provided to reduce air pollution, noise, traffic accidents, and congestion by developing an intermodal rail and road infrastructure and encouraging shippers to transfer their goods by rail to and from ports [45]. With the assistance of all parties concerned, the development of green ports will be more successful.
Hypothesis 3.
Cooperation of involved parties is positively related to the development of a green port.

2.2.4. Inconsistent Criteria

The absence of uniformity in green port criteria presents another challenge to development. Research on the green port criterion is expanding [12,13,14,15,16,17,18,52,53,54]. However, ports will find it challenging to determine their development direction due to the abundance of green port requirements. For instance, ref. [55] suggested that adopting an onshore power supply system (cold ironing) and lowering the ship’s speed while enhancing its landfall are two of the best ways to a port’s greenness performance.
Ref. [12] proposed sustainable criteria for green ports—such as liquid pollution management, air pollution management, noise control, marine ecological protection, biological system preservation, low-carbon and energy-saving management, and establishment of green port organizational management. On the other hand, six green port performance indicators have been developed by the majority of port authorities (Shanghai, Hong Kong, Singapore, Port of L.A. and L.B., and Kaohsiung, 2012) and international organizations (PPCAC, IAPH): speed reduction after landfall, cold ironing, using electrically powered equipment, encouraging the use of low-sulfur fuel, a willingness to reuse recyclable resources, and encouraging the development of public transport modes [11].
It appears that there are several varied criteria in the research. This makes it difficult for ports to decide which factors are crucial for the growth of their green ports. The development of green ports at ports in underdeveloped countries with limited resources may be hampered by the requirement to invest significant time and money in determining which criteria are appropriate for them.
Hypothesis 4.
Inconsistent criteria are negatively related to the development of a green port.

2.2.5. Lack of Technical Advancement

The application of cutting-edge technology in the environmentally friendly ship and port infrastructure is referred to as technical development. A number of cutting-edge technologies—including cold ironing technology, seawater filters, alternative energy sources, and monitoring systems—have been suggested for use at green ports in [29]. First, cold ironing is the practice of providing a ship with electricity from the land while it is berthed rather than using its auxiliary engines. This corresponds to being able to shut off every engine. The use of cold iron can lower greenhouse gas emissions but only if the onshore electricity is generated from renewable energy sources [56]. It has been shown that cold ironing reduces overall greenhouse gas emissions from transportation by less than 0.5% [57]. Ref. [34] explores the effectiveness of cold ironing as an emissions reduction alternative and develops a mathematical methodology for assessing the technology’s economic viability. Cold ironing, according to ref. [34], can result in local emissions reductions ranging from 48% to 70% for CO2, 3% to 60% for SOx, 40% to 60% for NOx, and 57% to 70% for BC of a container terminal’s ship emissions inventory. Additionally, seawater is pumped, for instance, in the cramped scrubber of a ship. The scrubber receives ship exhaust gas, which interacts with saltwater there. A rapid and efficient reaction takes place when SO2 comes into contact with seawater, turning the SO2 and calcium carbonate (CaCO3) in the saltwater into CO2 and calcium sulphate (gypsum), an essential component of regular seawater [58]. Furthermore, the development of advanced monitoring systems has made it feasible to locate potential pollution sources and provide timely pollution control actions [8]. In yard operations, the biggest environmental advantages will come from the deployment of more efficient ship-to-shore cranes, which will improve the number of transfers per hour and hence shorten the entire turnaround time of large polluting vessels. On the hinterland side, ITS may be utilized to decrease line formation at the gates. Furthermore, the ongoing replacement of truck fleets, together with efforts to cut driver idling periods, will result in significant reductions in emissions at the gate. Last but not least, employing complementary or alternative energy sources—including wind, solar, and biofuels—can reduce emissions into the environment and assist in achieving environmental goals [29]. Refs. [29,55,59,60,61,62] have demonstrated the importance of advanced technology in achieving the port’s sustainable goals.
However, the technology employed in green ports poses a big problem for ports today. Most ports in underdeveloped countries have outdated equipment, which is bad for the environment. Access to new technologies will be challenging in the near future. Equipment that requires electricity, onshore power sources, and systems for creating alternative energy all need considerable capital investments over protracted periods of time. Due to the absence of current technology, adopting a green port plan in poor countries will be quite difficult.
Hypothesis 5.
Lack of technical advancement is negatively related to the development of a green port.

2.2.6. Lack of Initial Capital

All costs related to the facility before, during, and after the green port’s development are included in the list of financial barriers. In order to satisfy the criteria of decreasing emissions at the port, modern technology, such as cold ironing systems, must be installed. Diesel-powered equipment must also be replaced with equipment that runs on electricity. Numerous studies have shown that the cost of implementing a cold ironing system might be high [63,64]. For instance, it was anticipated that investment expenses at the ports of Aberdeen and Copenhagen would total £6.6 million and €37 million, respectively. According to the World Ports Climate Initiative (WPCI), annual operating and maintenance expenditures represent 5% of the project’s total investment costs [65]. The cost of powering the berthed ships varies greatly depending on the electricity policies of the various nations. The shortage of electricity in some cities or areas may also be a barrier. Local grids frequently cannot handle high-voltage cold ironing systems. This is especially true in smaller cities. In order to support cold ironing system investments in such areas, further multimillion-dollar expenditures in new electrical networks and transformation substations are required [66]. Additionally, employing electric equipment comes with a high initial cost. The majority of the machinery at the port is driven by diesel, which produces a lot of emissions and noise pollution. Furthermore, resources are needed for the training of human resources for the management and upkeep of green ports. Port authorities will thus be under pressure to raise a significant initial capital source for building a green port (Figure 1).
Hypothesis 6.
Lack of initial capital is negatively related to the development of a green port.

3. Methodology

3.1. Participants and Procedure

We met with the Vietnamese seaport administration organization, Vietnam National Shipping Lines Corporation. Vietnam has 34 seaports, of which 2 are special-type seaports, 11 are class I seaports, 7 are class II seaports, and 14 are class III seaports. Among the aforementioned ports, the ones chosen are those with high throughput, significant investment capital, and pioneers in the application of sustainability criteria in Vietnam. Furthermore, the ports were chosen because they were in the Northern, Central, and Southern Vietnam, ensuring the sample was representative. This results in 12 container ports that satisfy the aforementioned requirements. In the north, there are four ports: CaiLan, HaiPhong, NghiSon, and CuaLo. There are four ports in the center: DungQuat, QuyNhon, ChanMay, and VanPhong. The south has four ports: CatLai, TanCang PhuHuu, VICT, and VungTau.
Survey respondents must be knowledgeable about seaport operations and have at least 5 years of experience in order to be considered for research purposes. Participants must also be involved in management or activities connected to seaport development. The seaport directors introduce people that fit the following requirements. We explained the goal of the study to voluntary participants before beginning the survey. By submitting their email addresses, survey participants indicated their consent to participate. We performed the survey from April 2022 to October 2022 after receiving a list of survey subjects’ email addresses. Because port managers are frequently busy at the beginning and end of the year, this was a good time to collect data (Appendix A).
We sent emails with links to the online questionnaires and an attached consent letter ensuring that information was provided voluntarily and that respondents’ confidence was respected. After consenting to the survey, participants could proceed to complete the survey questions by clicking on the link. The participants were asked whether the port they worked in met the sustainable indicators of a green port or whether they were focused on its growth when they first accessed the questionnaire’s welcome page. If they answer “Yes”, they continued to receive questions about the factors that promote and inhibit the adoption of green ports. We sent 380 questionnaires to 12 ports, with an average of 31 questionnaires per port. There were 132 questionnaires that were invalid for various reasons, such as answer omission. As a result, 248 valid questionnaires were received, with an average of 21 replies per port, representing a 65.3% effective response rate. Prominent ports like Hai Phong and CatLai had 23 responses. The ChanMay port had the fewest responses (18).
Detailed information about the participants is presented in Table 1.

3.2. Measure

3.2.1. Dependent Variable

In this study, we measure the development of a green port using four criteria: “The port implements environmental protection strategies over the four years from 2016 to 2020”. “The port makes improvements to port operations that protect the environment over the four years from 2016 to 2020”. “The port employees are trained on the green port over the four years from 2016 to 2020”. “The port offers a green award to encourage individuals to comply with the rules from 2016 to 2020”.

3.2.2. Independent Variables

Based on literature and expert opinions, the independent variables included drivers and barriers to adopting green ports [8,24,31,64,67,68]. The degree to which the mentioned driver and barrier variables to green port development in the target ports were present was assessed using a five-point Likert scale (1 for strongly disagree, 2 for disagree, 3 for neutral, 4 for agree, and 5 for strongly agree).
We conducted a pilot test in order to assess and enhance the survey questions. In response to feedback from the 15 replies from management at the 5 ports, a few minor changes were made to the questionnaire. The last questionnaire was then distributed to participants. Table 2 presents an overview of the survey.
Environmental regulation. Five criteria were utilized to measure this regulation. The following are two examples: “The port has an inventory of relevant environmental legislation”. “The port has a specific budget for environmental management”.
Foreign capital. We employed five criteria to measure foreign capital. Examples of the statements are as follows: “Foreign capital invests in the infrastructure”. “Foreign companies expand their operations”.
Cooperation of involved parties. This variable was evaluated using five criteria. Examples of the statements include the following: “Ships apply strategies to reduce their environmental impact such as alternative fuels, slow steaming, improved hull design, cold ironing”. “The shipping lines are interested in the discount policy when complying with the regulations of the green port”.
Inconsistent criteria. To evaluate inconsistent criteria, we used five different criteria. Some examples are as follows: “There are different criteria for green ports”. “Insufficient resources to comply with all criteria”.
Lack of technical advancement. Four criteria were used to measure this variable. Examples include the following: “The port lacks the software to monitor pollution and warn sources of pollution in real time”. “The port lacks an onshore power supply to provide power for hoteling”.
Lack of initial capital. We measured this using five criteria. Examples are as follows: “Need a large amount of money to invest in cold ironing”. “Need a large amount of money to build an onshore distribution”.

3.3. Analyses

We used SPSS 22.0 and AMOS 22.0 to conduct the statistical analysis for this study. We conducted the data analysis using a two-stage methodology [69]. Data analysis was used to first assess the convergent and discriminant validity of the multiple-item scale in the proposed model. According to [70], construct validation is the presence of certain kinds of validity, or “the extent to which an operationalization assesses the notion it is supposed to examine” (p. 142). We employed principal component analysis (PCA) and confirmatory factor analysis (CFA) using SPSS 22.0 and AMOS 22.0, respectively, to investigate the measurement model. Second, we tested structural models based on the clean measurement model using structural equation modeling (SEM).

4. Result

4.1. Principal Components Analysis

To begin, we analyze the data utilizing PCA and Varimax rotation. The eigenvalues of the six factors are all greater than 1.0. Putting all structures together, 66.2% of the total variance is explained. However, a seven-factor structure with an eigenvalue of 0.70 can be seen in the screen plot. Then, with the number of discovered components set to seven, we carried out the PCA once more. The results show that Cooperation5 loads on one aspect of Foreign, whereas Environmental5 loads on two constructions. We carefully considered the phrasing of these two items and decided to remove them for further data analysis. Next, all of the items were put into the specified structures (Table 3). The total variance is explained by all constructs at 70.8%. Next, the confirmatory factor analysis was performed.

4.2. Confirmatory Factor Analysis

Confirmatory factor analysis (CFA) is performed using AMOS 22.0. We initially use the following criteria and indices to check the model’s fit: Tucker-Lewis index (TLI) larger than 0.90; comparative fit index (CFI) greater than 0.90; standardized root mean square residual (SRMR) less than 0.08; chi-square statistic divided by the degree of freedom (χ2/df ratio) higher than 3; and root mean square errors of approximation (RMSEA) less than 0.05 (excellent) or less than 0.08 (good) [71]. The objective of this stage is to remove the object that stands out visibly from the other objects [69].
All elements are loaded appropriately on their intended constructions. As a result, the CFA showed a good model fit with χ2/df = 1.516, GFI = 0.90, TLI = 0.96, CFI = 0.97, IFI = 0.97, and RMSEA = 0.039 values.
Two metrics are used to assess the consistency and dependability of the factors: Cronbach’s alpha (α) and composite reliability (CR). According to [72], two values have been utilized in place of one another. The values of the CR and Cronbach’s alpha should be more than 0.7, according to [73].
As shown in Table 4, all of the CR values for environmental regulation (0.84), foreign capital (0.86), cooperation of involved parties (0.92), inconsistent criteria (0.85), lack of technical advancement (0.83), lack of initial capital (0.89), and the development of a green port (0.89), respectively, were greater than the threshold value of 0.7. Additionally, all of the items’ Cronbach’s alpha values—0.83, 0.87, 0.91, 0.86, 0.83, 0.89, 0.89—exceeded the threshold value of 0.7 for each of the following: environmental regulation, foreign capital, cooperation of involved parties, inconsistent criteria, lack of technical advancement, lack of initial capital, and the development of a green port (Table 4).
Ref. [74] asserts that the average variance extracted (AVE) value should be greater than 0.5. According to the findings, the AVE values of environmental regulation, foreign capital, cooperation of involved parties, inconsistent criteria, lack of technical advancement, lack of initial capital, and the development of a green port are 0.52, 0.53, 0.60, 0.55, 0.51, 0.58, and 0.57, respectively.
These items’ standard factor loadings exceed 0.50 (ranging from 0.61 to 0.98) and are significant at p > 0.001 [75]. As a consequence, the convergent validity of all constructions may be trusted. According to the approach of [74], the variables of the model exhibit discriminant validity if the square root of AVE is higher than the inter-construct correlation coefficients of the variables. Additionally, the study’s model suited the data well. According to the research results, the proposed model possesses discriminant validity.

4.3. Common Method Variance

Common method variance (CMV), as described by [76], is the systematic error variation that occurs when variables are assessed using the same source or technique [77]. Therefore, a bias might result from the systematic error variance. Because respondents consistently answered all survey items, the anticipated relationship between variables may be exaggerated or understated [76,77].
In this study, we employed and looked at CMV preventive techniques. We first used a set of mixed questions to prevent respondents from determining which qualities were related to which variables [78]. Additionally, to evaluate the CMV in our study, we used the most well-liked statistical methods, including Harman’s single-factor test and partial elimination of the general construct. The calculated principal component analysis (PCA) findings showed that seven separate factors explained 70.8% of the total variance (Table 5). The first unrotated component explained just 22% (less than 50%) of the variation in the data. No single factor appears, and the variance is not primarily explained by the first component. Because of this, data analysis showed that CMV was not present in this research.

4.4. Hypotheses Testing

First, we give an analysis of the structural models. The normed χ22 to degrees of freedom) is 1.516, below the necessary cutoff value of 3 [79]. An adequate fit is shown by the following values: GFI = 0.90, TLI = 0.96, CFI = 0.97, IFI = 0.97, and RMSEA = 0.039. Every fit index is considered to be excellent or very near the suggested level. The results show that the structural model accurately represents the data.
The outcomes of our hypotheses testing are shown in Table 6. Our findings support Hypothesis 1 by demonstrating that environmental regulations have a positive effect on the development of green ports (β = 0.182, p < 0.05). Furthermore, according to our findings, the adoption of green ports is positively influenced by foreign capital (β = 0.241, p < 0.01), supporting Hypothesis 2. Hypothesis 3 is supported by the data from our study, which show that the parties’ collaboration has a significant and positive impact on the growth of a green port (β = 0.272, p < 0.01).
However, a variety of reasons can impede the development of green ports. Lack of technical advancement negatively affects its development (β = −0.268, p < 0.05), supporting Hypothesis 5. Hypothesis 6 is accepted, which shows that lack of initial capital has a significant and negative impact on the growth of green ports (β = −0.179, p < 0.01). Contrary to our predictions, Hypothesis 4 is rejected. Inconsistent criteria have no impact on the adoption of green ports (β = −0.081, p > 0.05) (Figure 2).

5. Discussion

A green port’s major objective is to continually minimize negative environmental consequences without affecting economic growth [33]. In order to effectively utilize resources and alternative sources of energy, green ports rely heavily on technological innovation. However, there are not many studies in the academic literature that especially deal with emerging countries, where rising tensions between economic development and environmental conservation exist. Our findings provide some new perspectives on the variables influencing the growth of green ports. The goal of this research was to investigate all the factors influencing the expansion of green ports in developing countries, specifically Vietnam. The study’s findings are particularly noteworthy since they come from a diverse group of managers who represent 12 container ports, with a focus on Vietnam.
Our findings showed that the effective and targeted approach to pollution management and prevention today is environmental regulation, which is supported by prior research [31]. The government can put the demands of environmental regulation into practice by developing market-oriented incentive programs, such as the collection of pollution fines and environmental taxes, or command-and-control policies, such as the passage of local laws and regulations. According to our study’s findings, which are in line with those of previous studies, environmental legislation positively affects the implementation of green ports [31,80,81]. This is because, while not favorable, laws often carry fines for breaking the rules, which have shown to be a potent inducer to adopt sustainable standards. As a result, this legislation attempts to comply with environmental standards by imposing financial and even criminal penalties for behaviors that harm the maritime environment. Regulation plays an important role in promoting ports in developing nations to meet green port sustainability criteria, which complement the findings of the previous study [8]. Before considering anything else, every organization must comply with the law.
A key finding of our research is the role of foreign capital in developing-country green port development. The expected arrival of a significant foreign source of finance will be a major motivator for investment and upgrading of port equipment and facilities in an ecologically friendly direction. The majority of port equipment in developing nations is outdated, runs on fossil fuels, and produces significant pollution [82]. Replacing obsolete devices with electric ones will help to create more environmentally friendly surroundings [83]. Furthermore, several port authorities are modernizing their cargo-handling equipment with quicker and more efficient machinery. This improves the terminal’s energy efficiency while also reducing vessel turnaround time at berth and, as a result, vessel emissions generated near the port. Investments in energy generation within the port have been studied in smaller ports where there is room for the deployment of renewable energy sources [6]. Recognizing the importance of foreign capital for green port development, developing countries seek to attract foreign capital. According to [84,85], the governments of China and African countries seek methods to entice foreign investment to improve their ports. Our analysis has aided the government and port authorities in their attempts to pinpoint the crucial resources for the long-term development of seaports and to address the tricky problem of initial investment money. In the transition to green ports, there is a significant difference between developed and emerging nations. It appears that developing-country seaports have more difficulty acquiring funding to modernize machinery and equipment to decrease emissions.
Our research also found the collaborative role of port stakeholders in the development of green ports, which is consistent with other research [9,86]. Individual efforts by the port in the development of green ports appear to encounter multiple challenges in the absence of stakeholder collaboration. The importance of stakeholders’ cooperation is demonstrated through compliance with environmental protection regulations and changes in polluting behaviors, which actively contribute to the development of green ports [44,46,47]. For instance, a variety of methods are already being used by shipping firms to diminish their environmental impact, mostly in order to abide by international standards that demand that they reduce emissions. These firms can use an onshore power supply system and alternative fuels (MGO, LNG), slow down to 12 nm while approaching the port, stop dumping ballast water at ports, or engage in other cooperative activities that are thought to help the green port strategy succeed [9].
Our findings revealed that the lack of technical advancements is a major obstacle to the development of green ports in developing countries. Previous studies have confirmed the importance of technology in controlling greenhouse gas emissions [9,87]. For example, on the marine side, this refers to the usage of shore power or cold ironing, which links vessels at berth to an energy supply and allows the auxiliary engines to be turned off. Ref. [34] explores the effectiveness of cold ironing as an emissions reduction alternative and develops a mathematical methodology for assessing the technology’s economic viability. On the hinterland side, ITS may be utilized to decrease line formation at the gates. Furthermore, the ongoing replacement of truck fleets, together with efforts to cut driver idling periods, will result in significant reductions in emissions at the gate. Technology is considered as a driving force in changing polluting equipment and increasing environmental protection at developed-country seaports [60,61,62]. Ports in underdeveloped nations, on the other hand, have limited access to these technologies due to expensive prices or lack of technology transfer. According to our findings, advances in technology are a driver of green port development in wealthy nations [29,60,62] but a barrier in developing countries.
Our findings showed that initial capital barriers have a negative influence on the adoption of green ports, which is in line with other studies [66,88,89]. Although solutions for reducing emissions have been found, the high initial financial investment required to implement these strategies creates a challenge for port authorities. The purchase of equipment that complies with green port requirements, such as a cold ironing system, demands significant initial capital. Ref. [89] found that because expensive expenditures are probably necessary for many different kinds of equipment, they represent a considerable obstacle to the adoption of cold ironing. For instance, it was expected that investment costs would come to £6.6 million and €37 million, respectively, for the ports of Aberdeen and Copenhagen [63,64]. There seem to be very few ports capable of raising this amount of capital without government help.
Contrary to what we anticipated, the development of a green port was unaffected by inconsistent criteria. This may be due to the fact that ports are currently developing green ports and have just recently implemented the primary requirement [11,12]. It will take additional time to fully apply the green port requirements. The thorough and universal implementation of the standards, nevertheless, might pose a problem for ports in the future.
Green ports are seen as an efficient way to ensure economic development while also protecting environmental quality in port operations. This study identifies the factors that promote and impede green port development. Among these factors, technology is a great solution for ensuring the port’s long-term growth and balancing the interaction between environmental impact and economic interests. Ports should make investments in technology to remove pollution sources, save money, and increase worker productivity.

6. Theoretical and Practical Implementation

Our study has many theoretical implications. First, the research results reinforce the importance of green ports for sustainable development, in the context of increasing climate change. Green ports not only meet the need to become an important connection point in the logistics system but also have the ability to control emissions to the environment, ensuring environmentally friendly development [6]. Our study emphasized the role of a green port, such as reducing noise, water, and solid waste pollution, using alternative energy sources, preserving natural habitats, and training employees in green port knowledge. In addition to the environmental benefits, green ports also offer economic opportunities through environment-oriented options such as industrial ecology and renewable energy. Ports have much potential for ecological industrial plans, which can range from pollution avoidance, process optimization, and waste management to internalization of environmental costs, local economic growth, and competitiveness [90]. Several Japanese ports have been transformed into recycling centers [91], and the Port of Rotterdam has promoted the use of waste heat capacity [92]. Ports are also locations for the generation of renewable energy, such as solar, tidal, and wind energy, both onshore and offshore. This renewable energy industry might provide jobs and add value to ports by building future power-supply infrastructure and clustering associated firms in port regions, revitalizing the economy of port towns [5].
Second, this is one of the first quantitative studies on the factors influencing the adoption of green ports in developing-country ports. According to the research findings, there are three drivers and two obstacles, which add to the theoretical foundation of green ports. While prior research employed qualitative approaches to identify important factors [24], this study added substantial value by quantitatively assessing these elements. Particularly, our research affirms the importance of international regulations in the development of green ports [8] and reinforces the impact of national policy on environmental protection through mandatory requirements and guidelines. National laws and regulations have a substantial influence on port compliance with environmental criteria, even though the International Marine Organization (IMO) is the primary maritime transport authority. Furthermore, although prior studies had demonstrated the role of technological leverage in reducing environmental impact and supporting the development of green ports in developed nations, our study confirms that the lack of modern technology will adversely affect the development of green ports in developing countries. The results of our study have improved the theoretical foundation for green ports in developing countries where the availability of current technology for development and the requirement for sustainable development are still in conflict. One of the major achievements of this study is the realization of the significance of stakeholder cooperation in the development of green ports. According to our research, stakeholders like shipping firms (who use light fuels, do not discharge ballast water at ports, and reduce speed in RSZ), transport companies (who use cars that adhere to Euro 4 requirements), and others must work together for the green port plan to be successful.
This study has a number of practical implications. The first practical implementation is that port authorities may identify crucial factors in the transformation of their ports to green ports. Attracting foreign investment capital will assist them in addressing the financial investment for expensive machinery and access to new technologies. It seems that technological innovation is the only path to sustainable port development both economically and environmentally. This study’s findings help port management understand the critical role of technology in the port greening process. The research also provides port managers with an approach to developing collaborative relationships with stakeholders in order to coordinate and implement green port standards. Port administrations may also implement a variety of other possible measures to encourage stakeholder participation in the growth of green ports. Using an annual environmental excellence awards program, port authorities may select the most environmentally friendly businesses across a variety of operational areas, and they may then reward them with a bonus or a reduction in port fees. Peak and off-peak hours may be less frequent as a result of effective demand-based pricing regulations, which would reduce fuel waste and air pollution.
Our findings indicate that legislation significantly affects the adoption of green port strategies for emerging nations. It indicates that financial penalties, license suspensions, or criminal prosecutions have altered port authorities’ attitudes and actions. The findings have significant implementation for the policymaker’s legal decision to impose requirements on ports in order to protect the environment. Results have been shown in a variety of nations, including both developed and developing nations. Like the Chinese government, for instance, others are interested in reducing emissions from port-related activity. The previous Law on the Prevention and Treatment of Air Pollution was changed by the state council in 2016, and the newly added No. 63 provision mandates that moored vessels use onshore electricity as a first resort. Additionally, it was mandated by the Special Action Plan for the Prevention and Control of Pollution from Ports and Ships that 50% of container ship berths at significant port terminals should be equipped to supply shoreside electricity to ships. Legislation addressing environmental concerns specific to the port business is present across Europe. The European Union (EU, Brussels, Belgium) has put regulations in place that may encourage environmentally aware and green ports and supports bold international programs addressing methods to prevent global warming (for example, by easing the transition to a low-carbon economy). Environmental sustainability in the seaport industry is one of the goals of the EU’s operations in this area (Directives 2012/33/EU, 2012/27/EU, 2014/94/EC; EU Regulation No. 2015/575). Our research offers recommendations for policymakers on how to encourage ports to voluntarily become green ports. They should help port enterprises acquire foreign capital for green port development by building a favorable investment environment. The government may also offer financial incentives to urge port administrations to comply with green port standards, such as decreased taxes and electric consumption. Ports may decide to take actions that affect their emissions and environmental consequences even when their main objective is to save operational costs. Options include paying ports for their environmentally friendly practices or spending a considerable amount of money on equipment replacement with a focus on cargo terminals.

7. Limitations and Future Research

Because the study used self-reported questionnaires to acquire data from participants, the study’s cross-sectional methodology does not enable inferences about longitudinal, green port-related changes and causality. Common method variance (CMV) was defined by [76] as the systematic error variation that occurs when variables are assessed using the same source or technique [77]. As a result, there may be a bias produced by systematic error variation. The estimated association between variables, in particular, can be inflated or deflated as a result of respondents providing consistent replies to all survey questions [76,77]. To eliminate CMV and show causation factors, future studies might recruit individuals in more than two waves and from various sources. However, in this study, we used methods to minimize and investigate CMV. The principal component analysis (PCA) result revealed seven different variables that accounted for 70.8% of the overall variation. Only 22% of the variation in data was captured by the first unrotated component (less than 50%). There is no one factor that emerges, and the first factor does not account for the vast majority of the variance. From the data analysis, it was determined that CMV did not exist in this study.
Another limitation of our research is that it only includes the 12 main container ports in Vietnam. These ports have high cargo throughput and high investment capital. As a result, the factors influencing the successful implementation of the green port strategy for major ports may differ from those impacting smaller ports with fewer resources. As a result, future research might look at the differences in factors influencing large and small container ports throughout the greening process.

8. Conclusions

The green port concept aims to include environmentally friendly adherence in port activities, operations, and management. Green ports make an effort to use their resources efficiently, minimize the negative influence on the regional environment, enhance the level of environmental management, and improve the quality of the natural surroundings of the port area. Green ports have been demonstrated to reduce emissions and safeguard the environment, and they have been applied in European countries, the United States, and several industrialized Asian countries. However, green port development in developing countries is still quite limited. According to this study, there are three drivers and two barriers to green port development in emerging nations, especially Vietnam. As a result, the two primary factors encouraging port authorities to apply green port sustainability criteria are cooperation among parties involved and environmental regulations, followed by foreign capital. In contrast, two factors hinder the development of green ports in underdeveloped countries: lack of technical advancement and lack of initial capital. Our findings have significant implications in both theory and practice. This research not only adds to the theoretical foundation of green ports in developing nations, but it also gives practical recommendations for port authorities and policymakers in their transition to green ports.

Author Contributions

Methodology, S.-T.L.; Software, S.-T.L.; Formal analysis, T.-H.N.; Investigation, T.-H.N.; Writing—original draft, S.-T.L.; Writing—review & editing, S.-T.L.; Supervision, S.-T.L. All authors have read and agreed to the published version of the manuscript.

Funding

This research was funded by [Vietnam Maritime University] grant number [QD/DHHH] and the APC was funded by [Vietnam Maritime University].

Institutional Review Board Statement

Not applicable.

Informed Consent Statement

Informed consent was obtained from all subjects involved in the study.

Data Availability Statement

On behalf of all the authors, the corresponding author states that our data is unavailable due to privacy.

Conflicts of Interest

The authors declare no conflict of interest.

Appendix A. Survey Questions on the Development of Green Ports

The research team conducts research on the factors affecting the development of green ports. The research team wishes to receive objective answers and correct reflections on the actual situation of the ports according to the questions in the survey form below. We appreciate your cooperation, which will shed light on scientific investigation.
  • PART 1: DEMOGRAPHIC QUESTIONS
  • What is your gender?
  • a. Male
  • b. Female
  • What is your position?
  • a. President/Vice President
  • b. Division Manager
  • c. Senior Leader
  • How many years of work experience do you have?
  • a. 5–10 years
  • b. 11–15 years
  • c. 16–20 years
  • d. Over 20 years
  • What is your degree?
  • a. Bachelor’s
  • b. Master’s
  • PART 2: QUESTIONS RELATED TO THE DEVELOPMENT OF GREEN PORTS
No.QuestionsStrongly DisagreeDisagreeNeutralAgreeStrongly Agree
12345
1Foreign capital invests in cold ironing.
2When entering the port area, ships reduce speed to 12 knots.
3The inland transportation complies with the environmental policies of port.
4There are different criteria for green ports.
5Foreign capital invests in the port.
6The port complies with national policies to protect the environment.
7Need a large amount of money to train the employees.
8Foreign capital invests in the infrastructure.
9Need a large amount of money to invest in cold ironing.
10The shipping lines are interested in the discount policy when complying with the regulations of the green port.
11Foreign companies expand their operations.
12The port has an environmental policy.
13Foreign companies are interested in the port system.
14The port complies with international conventions to protect the environment such as IMO, and MARPOL.
15Need a large sum of money to build an onshore distribution.
16The port has an inventory of relevant environmental legislation.
17Spending a lot of money on research and the selection of criteria.
18The port develops environmental protection strategies from 2016 to 2020.
19Need a large amount of money to invest in the port equipment.
20The port develops the port activities that protect the environment from 2016 to 2020.
21The port teaches the employees about the green port from 2016 to 2020.
22The port lacks of onshore power supply to provide power for hoteling.
23The port has a specific budget for environmental management.
24Having difficulty choosing key criteria.
25The port develops a green award to encourage individuals to comply with the rules from 2016 to 2020.
26The port lacks the software to monitor pollution and warn of sources of pollution in real time.
27Ships apply strategies to reduce their environmental impact such as alternative fuels, slow steaming, improved hull design, and cold ironing.
28The inland transportation meets Euro4 emission standards.
29The port lacks alternative energy sources such as wind and solar power.
30The port lacks equipment that uses electricity.
31Insufficient resources to comply with all criteria.

References

  1. Tsai, H.L.; Lu, C.S.; Chang, C.C. The influence of organisational green climate on employees’ green behaviours: Evidence from the Eco Port of Kaohsiung. Int. J. Shipp. Transp. Logist. 2017, 9, 696–723. [Google Scholar] [CrossRef]
  2. Yang, Y.C. Determinants of container terminal operation from a green port perspective. Int. J. Shipp. Transp. Logist. 2015, 7, 319–346. [Google Scholar] [CrossRef]
  3. Bjerkan, K.Y.; Hansen, L.; Steen, M. Towards sustainability in the port sector: The role of intermediation in transition work. Environ. Innov. Soc. Transit. 2021, 40, 296–314. [Google Scholar] [CrossRef]
  4. Wang, L.; Zhou, Z.; Yang, Y.; Wu, J. Green efficiency evaluation and improvement of Chinese ports: A cross-efficiency model. Transp. Res. Part D Transp. Environ. 2020, 88, 102590. [Google Scholar] [CrossRef]
  5. McNeil, C.; Straw, W.; Rowney, M. Pump Up the Volume: Bringing Down Costs and Increasing Jobs in the Offshore Wind Sector; Institute for Public Policy Research: London, UK, 2013. [Google Scholar]
  6. Zis, T.P. Green Ports; Springer: Berlin/Heidelberg, Germany, 2019; pp. 407–432. [Google Scholar]
  7. Aregall, M.G.; Bergqvist, R.; Monios, J. A global review of the hinterland dimension of green port strategies. Transp. Res. Part D 2018, 59, 23–34. [Google Scholar] [CrossRef]
  8. Tseng, P.H.; Pilcher, N. Evaluating the key factors of green port policies in Taiwan through quantitative and qualitative approaches. Transp. Policy 2019, 82, 127–137. [Google Scholar] [CrossRef]
  9. Bergqvist, R.; Monios, J. Green Ports in Theory and Practice. In Green Ports; Elsevier: Amsterdam, The Netherlands, 2019; pp. 1–17. [Google Scholar]
  10. Anastasopoulou, D.; Kolios, S.; Stylios, C. How will Greek ports become green ports? Geo-Eco-Marina 2011, 17, 73–80. [Google Scholar]
  11. Lirn, T.C.; Wu, Y.J.; Chen, Y.J. Green performance criteria for sustainable ports in Asia. Int. J. Phys. Distrib. Logist. Manag. 2013, 43, 427–451. [Google Scholar] [CrossRef]
  12. Chen, Z.; Pak, M. A Delphi analysis on green performance evaluation indices for ports in China. Marit. Policy Manag. 2017, 44, 537–550. [Google Scholar] [CrossRef]
  13. Berechman, J.; Tseng, P.H. Estimating the Environmental Costs of Port Related Emissions: The Case of Kaohsiung. Transp. Environ. 2012, 17, 35–38. [Google Scholar] [CrossRef]
  14. Chin, A.T.; Low, J.M. Port performance in Asia: Does production efficiency imply environmental efficiency. Transp. Res. Part D Transp. Environ. 2010, 15, 483–488. [Google Scholar] [CrossRef]
  15. Gupta, A.K.; Gupta, S.K.; Patil, R.S. Environmental Management Plan for Port and Harbour Projects. Clean Technol. Environ. Policy 2005, 7, 133–141. [Google Scholar] [CrossRef]
  16. Park, J.Y.; Yeo, G.T. An evaluation of greenness of major Korean ports: A fuzzy set approach. Asian J. Shipp. Logist. 2012, 28, 67–82. [Google Scholar] [CrossRef]
  17. Papaefthimiou, S.; Sitzimis, I.; Andriosopou, K. A Methodological Approach for Environmental Characterization of Ports. Marit. Policy Manag. 2017, 44, 81–93. [Google Scholar] [CrossRef]
  18. Peng, Y.; Liu, H.; Li, X.; Huang, J.; Wang, W. Machine learning method for energy consumption prediction of ships in port considering green ports. J. Clean. Prod. 2020, 264, 121564. [Google Scholar] [CrossRef]
  19. Portugal, L.D.; Morgado, A.V.; Lima, O.J. Location of cargo terminals in metropolitan areas of developing countries: The Brazilian case. J. Transp. Geogr. 2011, 19, 900–910. [Google Scholar] [CrossRef]
  20. Tzannatos, E. Ship Emissions and Their Externalities for the Port of Piraeus-Greece. Atmos. Environ. 2010, 44, 400–407. [Google Scholar] [CrossRef]
  21. Wiegmans, B.W.; Louw, E. Changing port-city relations at Amsterdam: A new phase at the interface? J. Transp. Geogr. 2011, 19, 575–583. [Google Scholar] [CrossRef]
  22. Vaio, A.D.; Varriale, L.; Alvino, F. Key performance indicators for developing environmentally sustainable and energy efficient ports: Evidence from Italy. Energy Policy 2018, 122, 229–240. [Google Scholar] [CrossRef]
  23. Zhen, L.; Lin, S.; Zhou, C. Green port oriented resilience improvement for traffic-power coupled networks. Reliab. Eng. Syst. Saf. 2022, 108569, 225. [Google Scholar] [CrossRef]
  24. Lalla-Ruiz, E.; Heilig, L.; Voß, S. Chapter 3—Environmental Sustainability in Ports. In Sustainable Transportation and Smart Logistics; Elsevier: Amsterdam, The Netherlands, 2019; pp. 65–89. [Google Scholar]
  25. Xie, B.; Zhang, X.; Lu, J.; Liu, F.; Fan, Y. Research on ecological evaluation of Shanghai port logistics based on emergy ecological footprint models. Ecol. Indic. 2022, 139, 108916. [Google Scholar] [CrossRef]
  26. Lam, J.S.; Yap, W.Y. A stakeholder perspective of port city sustainable development. Sustainability 2019, 11, 447. [Google Scholar] [CrossRef]
  27. Nikitakos, N. Green logistics: The concept of zero emissions port. FME Trans. 2012, 40, 201–206. [Google Scholar]
  28. Vellinga, T. Green Ports, Fiction, condition or foregone conclusion? Delft University of Technology: Delft, The Netherlands, 2011. [Google Scholar]
  29. Cullinane, K.; Cullinane, S. Atmospheric Emissions from Shipping: The Need for Regulation and Approaches to Compliance. Transp. Rev. 2013, 33, 377–401. [Google Scholar] [CrossRef]
  30. Knudsen, O.F.; Hassler, B. IMO Legislation and Its Implementation: Accident Risk, Vessel Deficiencies and National Administrative Practices. Mar. Policy 2011, 35, 201–207. [Google Scholar] [CrossRef]
  31. Lam, J.; Notteboom, T. The greening of ports: A comparison of port management tools used by leading ports in Asia and Europe. Transp. Rev. 2014, 34, 169–189. [Google Scholar] [CrossRef]
  32. Lindstad, H.; Eskeland, G. Environmental regulations in shipping: Policies leaning towards globalization of scrubbers deserve scrutiny. Transp. Res. Part D Transp. Environ. 2016, 47, 67–76. [Google Scholar] [CrossRef]
  33. Pavlic, B.; Cepak, F.; Sucic, B.; Peckaj, M.; Kandus, B. Sustainable port infrastructure, practical implementation of the green port concept. Therm. Sci. 2014, 18, 935–948. [Google Scholar] [CrossRef]
  34. Zis, T.; North, R.J.; Angeloudis, P.; Ochieng, W.Y.; Bell, M.H. Evaluation of cold ironing and speed reduction policies to reduce ship emissions near and at ports. Marit. Econ. Logist. 2014, 16, 371–398. [Google Scholar] [CrossRef]
  35. Puig, M.; Azarkamand, S.; Wooldridge, C.; Selén, V.; Darbra, R.M. Insights on the environmental management system of the European port sector. Sci. Total Environ. 2022, 806, 150550. [Google Scholar] [CrossRef]
  36. Sys, C.; Vanelslander, T.; Adriaenssens, M.; Rillaer, I.V. International emission regulation in sea transport: Economic feasibility and impact. Transp. Res. Part D Transp. Environ. 2016, 45, 139–151. [Google Scholar] [CrossRef]
  37. Anwar, S.; Nguyen, L.P. Foreign direct investment and economic growth in Vietnam. Asia Pac. Bus. Rev. 2010, 16, 183–202. [Google Scholar] [CrossRef]
  38. News. The investment in construction and development of ports system. 2021. Available online: https://investvietnam.gov.vn/vi/-80.nd/tinh-hinh-dau-tu-xay-dung-va-phat-trien-he-thong-cang-bien.html (accessed on 26 August 2023).
  39. Cheon, S. The Economic-Social Performance Relationships of Ports: Roles of Stakeholders and Organizational Tension. Sustain. Dev. 2016, 25, 50–62. [Google Scholar] [CrossRef]
  40. Denktas-Sakar, G.; Karatas-Cetin, C. Port Sustainability and Stakeholder Management in Supply Chains: A Framework on Resource Dependence Theory. Asian J. Shipp. Logist. 2012, 28, 301–319. [Google Scholar] [CrossRef]
  41. Lam, J.S.; Ng, A.K.; Fu, X. Stakeholder management for establishing sustainable regional port governance. Res. Transp. Bus. Manag. 2013, 8, 30–38. [Google Scholar] [CrossRef]
  42. Roh, S.; Thai, V.V.; Wong, Y.D. Towards Sustainable ASEAN Port Development: Challenges and Opportunities for Vietnamese Ports. Asian J. Shipp. Logist. 2016, 32, 107–118. [Google Scholar] [CrossRef]
  43. Zheng, S.; Luo, M. Competition or cooperation? Ports’ strategies and welfare analysis facing shipping alliances. Transp. Res. Part E Logist. Transp. Rev. 2021, 153, 102429. [Google Scholar] [CrossRef]
  44. Ahl, C.; Frey, E.; Steimetz, S. The effects of financial incentives on vessel speed reduction: Evidence from the Port of Long Beach Green Flag Incentive Program. Marit. Econ. Logist. 2017, 181, 416–434. [Google Scholar] [CrossRef]
  45. Bergqvist, R.; Egels-Zande’n, N. Green port dues—The case of hinterland transport. Res. Transp. Bus. Manag. 2012, 5, 85–91. [Google Scholar] [CrossRef]
  46. Geng, P.; Tan, Q.; Zhang, C.; Wei, L.; He, X.; Cao, E.; Jiang, K. Experimental investigation on NOx and green house gas emissions from a marine auxiliary diesel engine using ultralow sulfur light fuel. Sci. Total Environ. 2016, 572, 467–475. [Google Scholar] [CrossRef]
  47. Kong, Y.; Liu, J. Sustainable port cities with coupling coordination and environmental efficiency. Ocean. Coast. Manag. 2021, 205, 105534. [Google Scholar] [CrossRef]
  48. Ling-Chin, J.; Roskilly, A. Investigating the implications of a new-build hybrid power system for Roll-on/Roll-off cargo ships from a sustainability perspective e a life cycle assessment case study. Appl. Energy 2016, 181, 416–434. [Google Scholar] [CrossRef]
  49. Luo, M.; Chen, F.; Zhang, J. Relationships among port competition, cooperation and competitiveness: A literature review. Transp. Policy 2022, 118, 1–9. [Google Scholar] [CrossRef]
  50. Winnes, H.; Styhre, L.; Fridell, E. Reducing GHG emissions from ships in port areas. Res. Transp. Bus. Manag. 2015, 17, 73–82. [Google Scholar] [CrossRef]
  51. Eide, M.S.; Endresen, Ø.; Skjong, R.; Longva, T. Cost-effectiveness assessment of CO2 reducing measures in shipping. Marit. Policy Manag. 2009, 36, 367–384. [Google Scholar] [CrossRef]
  52. Chiu, R.-H.; Lin, L.-H.; Ting, S.-C. Evaluation of Green Port Factors and Performance: A Fuzzy AHP Analysis. Math. Probl. Eng. 2014, 2014, 802976. [Google Scholar] [CrossRef]
  53. Fitzgerald, W.B.; Howitt, O.J.; Smit, I.J. Greenhouse Gas Emissions from the International Maritime Transport of New Zealand’s Imports and Exports. Energy Policy 2011, 39, 1521–1531. [Google Scholar] [CrossRef]
  54. Yap, W.Y.; Lam, J.S. 80 Million-Twenty-Foot-Equivalent-Unit Container Port? Sustainability Issues in Port and Coastal Development. J. Ocean. Coast. Manag. 2013, 71, 13–25. [Google Scholar] [CrossRef]
  55. Chang, C.-C.; Wang, C.-M. Evaluating the effects of green port policy: Case study of Kaohsiung harbor in Taiwan. Transp. Res. Part D Transp. Environ. 2012, 17, 185–189. [Google Scholar] [CrossRef]
  56. Green, E.H.; Winebrake, J.J.; Corbett, J.J. Opportunities for Reducing Greenhouse Gas Emissions from Ships; Report Prepared for the Clean Air Task Force; Clean Air Task Force: Boston, MA, USA, 2008. [Google Scholar]
  57. Frey, H.C. Identification and Evaluation of Potential Best Practices for Greenhouse Gas Emissions Reductions in Freight Transportation. 2008. Available online: http://www.northeastdiesel.org/research/seminars/frey/frey.pdf (accessed on 26 August 2023).
  58. Andreasen, A.; Mayer, S. Use of seawater scrubbing for SO2 removal from marine engine exhaust gas. Energy Fuels 2007, 21, 3274–3279. [Google Scholar] [CrossRef]
  59. Chou, C.-C. AHP model for the container port choice in the multiple-ports region. J. Mar. Sci. Technol. 2010, 18, 8. [Google Scholar] [CrossRef]
  60. Hollen, R.M.; Bosch, F.A.; Volberda, H.W. Strategic levers of port authorities for industrial ecosystem development. Marit. Econ. Logist. 2015, 17, 79–96. [Google Scholar] [CrossRef]
  61. Liu, Q.; Lim, S.H. Toxic air pollution and container port efficiency in the USA. Marit. Econ. Logist. 2017, 19, 94–105. [Google Scholar] [CrossRef]
  62. Ugboma, C.; Ugboma, O.; Ogwude, I.C. An analytic hierarchy process (AHP) approach to port selection decisions—Empirical evidence from Nigerian ports. Int. J. Marit. Econ. 2006, 8, 251–266. [Google Scholar] [CrossRef]
  63. Ballini, F.; Bozzo, R. Air pollution from ships in ports: The socio-economic benefit of cold-ironing technology. Res. Transp. Bus. Manag. 2015, 17, 92–98. [Google Scholar] [CrossRef]
  64. Innes, A.; Monios, J. Identifying the unique challenges of installing cold ironing at small and medium ports—The case of aberdeen. Transp. Res. Part D Transp. Environ. 2018, 62, 298–313. [Google Scholar] [CrossRef]
  65. World Ports Climate Initiative. Cost Benefit Calculation Tool Onshore Power Supply; CE Delft: Delft, The Netherlands, 2016. [Google Scholar]
  66. Krämer, I.; Czermański, E. Onshore power one option to reduce air emissions in ports. Sustain. Manag. Forum 2020, 28, 13–20. [Google Scholar] [CrossRef]
  67. Giuliano, G.; O’Brien, T. Reducing port-related truck emissions: The terminal gate appointment system at the ports of Los Angeles and Long Beach. Transp. Res. Part D Transp. Environ. 2007, 12, 460–473. [Google Scholar] [CrossRef]
  68. Trellevik, V. Onshore Power Supply for Cruise Vessels. In Assessment of Opportunities and Limitations for Connecting Cruise Vessels to Shore Power; Semantic Scholar: Seattle, WA, USA, 2018. [Google Scholar]
  69. Anderson, J.C.; Gerbing, D.W. Structural equation modeling in practice: A review and recommended two-step approach. Psychol. Bull. 1988, 103, 411–423. [Google Scholar] [CrossRef]
  70. Bagozzi, R.P.; Yi, Y.; Phillips, L.W. Assessing construct validity in organizational research. Adm. Sci. Q. 1990, 36, 421–458. [Google Scholar] [CrossRef]
  71. Kline, R.B. Principles and Practice of Structural Equation Modeling; Guilford Press: New York, NY, USA, 2011. [Google Scholar]
  72. Hair, J.F.; Anderson, R.E.; Babin, B.J.; Black, W.C. Multivariate Data Analysis: A Global Perspective; Upper Saddle River; Pearson: Hong Kong, China, 2010; Volume 7. [Google Scholar]
  73. Hair, J.J.; Hult, G.T.; Ringle, C.; Sarstedt, M. A Primer on Partial Least Squares Structural Equation Modeling (PLS-SEM); Sage: Newcastle, UK, 2016. [Google Scholar]
  74. Fornell, C.; Larcker, D.F. Evaluating structural equation models with unobservable variables and measurement error. J. Mark. Res. 1981, 18, 39–50. [Google Scholar] [CrossRef]
  75. Cheung, G.W.; Wang, C. Current Approaches for Assessing Convergent and Discriminant Validity with SEM: Issues and Solutions. Acad. Manag. Proc. 2017, 2017, 12706. [Google Scholar] [CrossRef]
  76. Tehseen, S.; Ramayah, T.; Sajilan, S. Testing and controlling for Common Method Variance: A review of available methods. J. Manag. Sci. 2017, 4, 142–168. [Google Scholar] [CrossRef]
  77. Richardson, H.A.; Simmering, M.J.; Sturman, M.C. A tale of three perspectives: Examining post hoc statistical techniques for detection and correction of common method variance. Organ. Res. Methods 2009, 12, 762–800. [Google Scholar] [CrossRef]
  78. Podsakoff, P.M.; MacKenzie, S.B.; Lee, J.Y.; Podsakoff, N.P. Common method biases in behavioral research: A critical review of the literature and recommended remedies. J. Appl. Psychol. 2003, 88, 879–903. [Google Scholar] [CrossRef]
  79. Gefen, D.; Straub, D.W.; Boudreau, M. Structural equation modeling and regression: Guidelines for research practice. Commun. AIS 2000, 4, 2–76. [Google Scholar] [CrossRef]
  80. Deng, G.; Chen, J.; Liu, Q. Influence Mechanism and Evolutionary Game of Environmental Regulation on Green Port Construction. Sustainability 2022, 14, 2930. [Google Scholar] [CrossRef]
  81. Vaio, D.; Varriale, L. Management Innovation for Environmental Sustainability in Seaports: Managerial Accounting Instruments and Training for Competitive Green Ports beyond the Regulations. Sustainability 2018, 10, 783. [Google Scholar] [CrossRef]
  82. Hendricks. Equipment investment and growth in developing countries. J. Dev. Econ. 2000, 61, 335–364. [Google Scholar] [CrossRef]
  83. de la Peña Zarzuelo, I.; Soeane, M.J.F.; Bermúdez, B.L. Industry 4.0 in the port and maritime industry: A literature review. J. Ind. Inf. Integr. 2020, 20, 100173. [Google Scholar] [CrossRef]
  84. Beresford, K.; Pettit, S.J.; Xu, Q.; Williams, S. A study of dry port development in China. Marit. Econ. Logist. 2012, 14, 73–98. [Google Scholar] [CrossRef]
  85. Van Niekerk, H.C. Port Reform and Concessioning in Developing Countries. Int. J. Marit. Econ. 2005, 7, 141–155. [Google Scholar] [CrossRef]
  86. Marčeta, M.; Bojnec, Š. Innovation and competitiveness in the European Union countries. Int. J. Sustain. Econ. 2020, 13, 1–17. [Google Scholar] [CrossRef]
  87. Wiegmans, B.W.; Geerlings, H. Sustainable port innovations: Barriers and enablers for successful implementation. World Rev. Intermodal Transp. Res. 2010, 3, 230–250. [Google Scholar] [CrossRef]
  88. Radwan, E.; Chen, J.; Wan, Z.; Zheng, T.; Hua, C.; Huang, X. Critical barriers to the introduction of shore power supply for green port development: Case of Djibouti container terminals. Clean Technol. Environ. Policy 2019, 21, 1293–1306. [Google Scholar] [CrossRef]
  89. Williamsson, J.; Costa, N.; Santén, V.; Rogerson, S. Barriers and Drivers to the Implementation of Onshore Power Supply—A Literature Review. Sustainability 2022, 14, 6072. [Google Scholar] [CrossRef]
  90. OECD. The Competitiveness of Global Port-Cities; OECD Publishing: Paris, France, 2014. [Google Scholar]
  91. OECD. Green Growth in Kitakyushu, Japan; OECD Publishing: Paris, France, 2013. [Google Scholar]
  92. Baas, L.W.; Huisingh, D. The synergistic role of embeddedness and capabilities in industrial symbiosis: Illustration based upon 12 years of experiences in the Rotterdam Harbour and Industry Complex. Prog. Ind. Ecol. Int. J. 2008, 5, 399–421. [Google Scholar] [CrossRef]
Figure 1. The research model.
Sustainability 15 13502 g001
Figure 2. Proposed model’s standardized path coefficient.
Sustainability 15 13502 g002
Table 1. Characteristics of the participants.
VariableCategoryFrequencyPercentage (%)
1Degree of educationBachelor13956.05
Master10943.95
2GenderMale19679.03
Female5220.97
3PositionPresident/Vice President3514.11
Division Manager6124.60
Senior Leader15261.29
4Working experience5–10 years5923.79
11–15 years10241.13
16–20 years3915.73
Over 20 years4819.35
Table 2. Construct measures.
No.ConstructItemDescription
1Environmental regulationsEnvironmental1The port complies with international conventions to protect the environment such as IMO and MARPOL.
Environmental2The port complies with national policies to protect the environment.
Environmental3The port has an environmental policy.
Environmental4The port has an inventory of relevant environmental legislation.
Environmental5The port has a specific budget for environmental management.
2Foreign capitalForeign1Foreign capital invests in the port.
Foreign2Foreign capital invests in cold ironing.
Foreign3Foreign capital invests in the infrastructure.
Foreign4Foreign companies expand their operations.
Foreign5Foreign companies are interested in the port system.
3Cooperation of involved partiesCooperation1The inland transportation meets Euro4 emission standards.
Cooperation2Ships apply strategies to reduce their environmental impact such as alternative fuels, slow steaming, improved hull design, and cold ironing.
Cooperation3The shipping lines are interested in the discount policy when complying with the regulations of the green port.
Cooperation4When entering the port area, ships reduce their speed to 12 knots.
Cooperation5The inland transportation complies with the environmental policies of the port.
4Inconsistent criteriaCriteria1There are different criteria for green ports.
Criteria2Insufficient resources to comply with all criteria.
Criteria3Having difficulty choosing key criteria.
Criteria4Spending a lot of money on research and the selection of criteria.
5Lack of technical advancementTechnical1The port lacks alternative energy sources such as wind and solar power.
Technical2The port lacks equipment that uses electricity.
Technical3The port lacks the software to monitor pollution and warn of sources of pollution in real time.
Technical4The port lacks an onshore power supply to provide power for hoteling.
6Lack of initial capitalInitial1Need a large amount of money to invest in cold ironing.
Initial2Need a large amount of money to build an onshore distribution.
Initial3Need a large amount of money to invest in the port equipment.
Initial4Need a large amount of money to train the employees.
7The development of the green portGreen1The port implemented environmental protection strategies from 2016 to 2020.
Green2The port improves the port activities that protect the environment from 2016 to 2020.
Green3The port train the employees in the knowledge of the green port from 2016 to 2020.
Green4The port offers a green award to encourage individuals to comply with the rules from 2016 to 2020.
Table 3. Results of factor analysis.
Component
1234567
Environmental20.816
Environmental40.809
Environmental30.681
Environmental10.678
Foreign3 0.834
Foreign4 0.765
Foreign5 0.754
Foreign2 0.717
Foreign1 0.690
Cooperation3 0.903
Cooperation4 0.776
Cooperation2 0.751
Cooperation1 0.744
Criteria1 0.853
Criteria4 0.792
Criteria2 0.761
Criteria3 0.606
Technical1 0.860
Technical2 0.840
Technical4 0.677
Technical3 0.643
Initial2 0.934
Initial1 0.915
Initial4 0.761
Initial3 0.735
Green1 0.990
Green3 0.927
Green2 0.745
Green4 0.688
Note. N = 248, Environmental = environmental regulation, Foreign = foreign capital, Cooperation = cooperation of involved parties, Criteria = inconsistent criteria, Technical = lack of technical advancement, Initial = lack of initial capital, Green = development of the green port.
Table 4. Results of convergent reliability testing.
No.ConstructItemStandard Loadingp-ValueMeanStd.dαAVECR
1Environmental regulationsEnvironmental20.982***4.030.860.830.520.84
Environmental40.966***
Environmental30.785***
Environmental10.728***
2Foreign capitalForeign10.868***3.350.750.870.530.86
Foreign20.846***
Foreign40.677***
Foreign30.618***
3Cooperation of involved partiesCooperation30.912***3.960.890.910.600.92
Cooperation40.905***
Cooperation20.811***
Cooperation10.703***
4Inconsistent criteriaCriteria10.829***3.820.450.860.550.85
Criteria40.792***
Criteria20.779***
Criteria30.620***
5Lack of technical advancementTechnical10.876***3.450.630.830.510.83
Technical20.859***
Technical40.838***
Technical30.723***
6Lack of initial capitalInitial20.855***4.010.750.890.580.89
Initial10.843***
Initial40.669***
Initial30.638***
7The development of a green portGreen10.922***3.680.410.890.570.89
Green30.901***
Green20.848***
Green40.720***
Note. N = 248, Environmental = environmental regulation, Foreign = foreign capital, Cooperation = cooperation of involved parties, Criteria = inconsistent criteria, Technical = lack of technical advancement, Initial = lack of initial capital, and Green = the development of a green port. Std.d = standard deviation, α = Cronbach’s alpha, AVE = average variance extracted, and CR = composite reliability. *** p < 0.001.
Table 5. Results of total variance explained.
Total Variance Explained
FactorInitial EigenvaluesExtraction Sums of Squared LoadingsRotation Sums of Squared Loadings
Total% of VarianceCumulative %Total% of VarianceCumulative %Total
16.51522.46522.4656.21321.42421.4243.579
23.04010.48432.9492.6349.08430.5084.903
32.8929.97142.9212.5398.75639.2644.529
42.4408.41551.3362.0437.04446.3082.721
52.3998.27159.6072.0146.94653.2543.500
61.9796.82366.4301.6185.57958.8332.342
71.2764.40170.8311.0043.46362.2962.166
80.7762.67773.508
90.7132.45975.967
100.6432.21878.185
110.6002.06880.253
120.5461.88482.137
130.5311.83083.967
140.4921.69685.663
150.4361.50587.168
160.4091.40988.577
170.3961.36489.941
180.3761.29691.237
190.3491.20392.440
200.3201.10493.545
210.3021.04294.587
220.2780.96095.547
230.2520.86796.414
240.2370.81897.232
250.2140.73797.969
260.2030.70098.669
270.1940.66999.338
280.1140.39399.731
290.0780.269100.000
Table 6. Hypothesis testing results.
Hypothesis No.Independent VariableDependent VariableBetap-ValueSupport Hypothesis
1EnvironmentalGreen0.1820.029Yes
2ForeignGreen0.2410.004Yes
3CooperationGreen0.2720.002Yes
4CriteriaGreen−0.0810.159No
5TechnicalGreen−0.2680.011Yes
6InitialGreen−0.1790.006Yes
Note. N = 248, Environmental = environmental regulation, Foreign = foreign capital, Cooperation = cooperation of involved parties, Criteria = inconsistent criteria, Technical = lack of technical advancement, Initial = lack of initial capital, Green = the development of a green port.
Disclaimer/Publisher’s Note: The statements, opinions and data contained in all publications are solely those of the individual author(s) and contributor(s) and not of MDPI and/or the editor(s). MDPI and/or the editor(s) disclaim responsibility for any injury to people or property resulting from any ideas, methods, instructions or products referred to in the content.

