Article

Modeling to Achieve Area Business Continuity Management Implementation via a Fuzzy Cognitive Map

Department of Architecture, Civil Engineering and Industrial Management Engineering, Nagoya Institute of Technology, Gokiso-cho, Showa-ku, Nagoya 466-8555, Aichi, Japan
*
Author to whom correspondence should be addressed.
Sustainability 2023, 15(18), 13531; https://doi.org/10.3390/su151813531
Submission received: 12 July 2023 / Revised: 11 August 2023 / Accepted: 21 August 2023 / Published: 10 September 2023
(This article belongs to the Section Sustainable Management)

Abstract

:
Area business continuity management (Area-BCM) is introduced to enhance sustainable economic growth by building public–private partnerships. It is implemented in pilot industrial zones in disaster-prone regions to tackle problems beyond a single organization’s capacity. The framework emphasizes multiple stakeholders in the decision-making process, but participation and implementation remain major challenges for many practitioners in the search for potential pathways. Therefore, this study presents a model of causal relationships between concepts to achieve the implementation of Area-BCM. To capture expert perceptions and visualize relationships, a fuzzy cognitive map (FCM) is deployed. The use of fuzzy logic facilitates the integration of diverse viewpoints and the representation of ambiguous and complex scenarios. Initially, 28 appropriate concepts were identified by reviewing the literature on practical Area-BCM cases, which were then scrutinized by experts, including eight driving causes, eleven required actions, and nine outcome variables. Subsequently, FCMs were constructed through individual interviews. Since the FCMs had been aggregated, a scenario analysis was performed under five different conditions to evaluate potential strategies. The simulation results present promising concepts that could improve Area-BCM implementation. The findings emphasize that these strategies will have a positive influence when top management is committed, government support is achieved, and workshops exist.

1. Introduction

Disasters hinder the progress of sustainable development, as they are unpredictable events with real impacts on society and the economy. A disaster that occurs in one region can cause a decrease in productivity, which will also reduce the economic growth in that country. A study of a disaster in Japan revealed the impacts of an earthquake on people’s livelihoods in terms of significant damage to agricultural production, fisheries, tourism, and industrial production [1,2]. In an era of globalized industries, a disaster that strikes one region can have ripple effects across the supply chain worldwide. The 2011 flood in Thailand demonstrated the vulnerability of the networked world, as Thailand is a hub of manufacturing for automotive and electronic parts [3]. The impact of the flood not only caused damage to local households and factories, but also disrupted the global supply chain [4]. Failing to deliver automotive and electronic parts from Thailand forced many manufacturers to suspend their operations globally, which impacted the automobile and electronic industries most severely because they are especially dependent on suppliers in flood-affected areas [4]. Moreover, halting business operations caused people to lose their jobs and incomes [2,4]. Consequently, the growth rate of Thailand’s GDP decreased from 4.1% and is expected to drop to 2.9% [3]. These events are obstacles to economic sustainability. Dispersion forces must be built by having sufficient stocks, alternative production sites, and diversified suppliers to reduce the risk of supply chain disruption due to high concentrations [2,4]. This strategy, known as a business continuity plan (BCP), aims to increase resilience, and encourage early recovery. However, the magnitude of the disaster’s impact sends a clear message: no individual, group, organization, or society can face a disaster alone. The BCP survey found that although companies have developed BCPs, they still face challenges in dealing with information sharing, recovery resources, and utility supply in the event of a disaster [5]. To address this issue, the Japan International Cooperation Agency (JICA) introduced area business continuity management (Area-BCM), which broadens the scope of a BCP [6]. It involves stakeholders who manage local risks by forming alliances, making risk-informed decisions, and developing area plans [6,7]. The ultimate goal is to boost long-term economic growth and community resilience while reducing the risk of a global supply disruption.
Eastern Asia is a global factory and the center of supply chain networks and industrial agglomerations. Thus, an Area-BCM was implemented in pilot areas vulnerable to disasters, such as Indonesia, the Philippines, and Vietnam [6,7]. The process of implementing the Area-BCM requires ongoing activities among stakeholders [7]. When Area-BCM was initially introduced to the target company, the executors found that they did not take it seriously [8]. In particular, achieving stakeholder involvement without incentives was difficult [6]. Another challenge was that conducting a risk assessment of the area would have been difficult without government leadership because a company cannot simulate large-scale disasters [6]. The Area-BCM strategy implemented in Thailand presented a unique challenge: the plan was not followed after a new leader was appointed. [9]. The need to spend time and effort has caused increasing disillusionment among practitioners who cannot achieve tangible results and the claimed benefits [10]. This complication in the implementation of Area-BCM reveals its slow progress. These issues call for a better understanding of the components of implementing Area-BCM. Improvement or neglect of some issues may positively or negatively impact performance. As a result, an entire region cannot improve its disaster capabilities, and its sustainability is impeded.
To achieve sustainability in business and supply chain management, previous studies presented models and key attributes to consider. For instance, Shokouhyar et al. [11] constructed a relation map for a sustainable supply chain. Kumar et al. [12] analyzed critical success factors for sustainable manufacturing in the automobile industry, and the findings emphasized the involvement of upper management. Meanwhile, Rajak et al. [13] examined the supply chain barriers to sustainable transportation and found that economic benefits were the most significant barrier. However, the factors and models in those studies may not accurately represent the characteristics of Area-BCM, which focuses on managing regional risks by integrating stakeholders. Some previous studies investigated significant factors in the BCP field but lacked system-level analyses. For example, Sapapthai et al. [14] applied an analytic hierarchy process to categorize and prioritize business continuity management (BCM) factors but did not analyze how the factors influenced each other. Montshiwa [15] presented a modified BCP for a complex automobile supply chain and implemented structural equation modeling to analyze interactions among factors but lacked some important factors, such as government support and information sharing. Meechang and Watanabe [16] built an interpretive model of factors for Area-BCM but could not explain to what extent a factor influenced the results. The current literature reveals the knowledge gap, including Area-BCM processes, important barriers, causal relationships between factors, and model dynamics. Therefore, a study that considers causal relationships is needed to understand the implementation system of Area-BCM.
Therefore, this study builds a model of causal relationships to achieve the implementation of Area-BCM. The novel aspect of this study is its suggestion of developing a strategy for Area-BCM with the aid of a fuzzy cognitive map (FCM) that is used to aggregate factors within the system from the perceptions of experts. Since the concepts in Area-BCM are ambiguous and uncertain, FCM can capture nonquantifiable knowledge [17] and provide information about how a change of one factor can affect others [18]. Analyzing causal relationships among them can help identify hidden connections between drivers, actions, and outcomes that are difficult to predict, even by practitioners. It is a semiquantitative method that could be a step forward and easy for decision making in management. In light of this, the recent study answers the research question:
  • To what extent do defined factors influence the Area-BCM implementation in different scenarios?
The finding is to support practitioners in implementing Area-BCM, or it could be a guide for other collaborative–sustainable frameworks.
The rest of this study is structured as follows. Section 2 discusses the FCM method and the development process. Section 3 explains the application of FCM to Area-BCM and identifies concepts for modeling. Section 4 presents the aggregated FCM and scenario analysis results. Section 5 discusses the results and suggests an FCM-based strategy for practitioners. Finally, Section 6 concludes this study and suggests future studies.

2. Materials and Methods

The application of FCM has been implemented in many areas, such as business management [19], sustainable economic development [20], disaster management [21], and supply chain management [11]. A method is also proven in industrial management decisions, such as the containment of supply chain disruptions in the fashion industry [22] and the implementation of strategies in the retail industry [23]. However, the literature review shows that up to now, no previous work exists to address the concepts of Area-BCM implementation in focusing on multistakeholder involvement. To the best of our knowledge, FCM has not been applied to any study for analysis of factors in Area-BCM. Therefore, we chose to model a system of implementation of Area-BCM to understand the relationships between causes, actions, and impacts, ultimately influencing the feasibility of achieving implementation. In such a context, the analysis is based on the knowledge gained from experts based on their experience and perception [24,25]. Furthermore, the factors and modeling of an Area-BCM system occur in a fuzzy environment due to the ambiguity and lack of numerical evidence in implementation. A chosen method can deal with fuzzy data and nonlinear systems [17].

2.1. Fuzzy Cognitive Map

FCM is a modeling technique that combines fuzzy logic and artificial neural networks [26]. The method is to visualize the causal relationships between variables, factors, and concepts (referred to as concepts in this study) throughout the system [27]. Its structure comprises nodes that represent concepts that describe system behavior and weighted edges that represent relation degrees [24]. In general, this is a mechanism for gathering human thoughts and displaying them as neural networks. Although FCM cannot make quantitative predictions, it can forecast the effects of policy in a “what-if” scenario, assuming a complex real world [24,28]. The main advantages of FCM over other quantitative research methodologies, such as structural equation modeling [29] and Bayesian model [30], include (i) its participatory approach, which allows stakeholders to express their perceptions in evidence-based decision-making; (ii) its ability to model a complex system; and (iii) its ability to discover hidden feedback in a system [25]. The method can develop models considering positive and negative effects and integrating the opinions of stakeholders. Moreover, it can describe the whole system’s behavior by representing an entity, state, and variable. The following subsections explain the mathematical methods used in this study.

2.1.1. State Vector

To construct the FCM, we must identify the concepts representing the study’s system. The value of concept i denoted as C i is ranged within [0, 1] [31]. The weight of edges from C i to C j represented as w i j takes values within [−1, 1], depending on the following conditions [31]:
  • w i j > 0 is a positive causality when an increase or decrease of C i increases or decreases the value of C j , respectively;
  • w i j < 0 is a negative causality when an increase or decrease of C i increases or decreases the value of C j , respectively;
  • w i j = 0 is no influence between C i and C j .
At each simulation interaction, the value of a concept C i is represented by state vector A i and is determined by the impact of other concepts on itself [32], in which the calculation rule is the following:
A i ( k + 1 ) = f ( A i ( k ) + j i j = 1 N A j ( k ) w j i ( k ) )
where A i ( k + 1 ) is the value of concept C i at time k + 1 , A j ( k ) is the value of concept C j at time k , w j i is the relation degree between concepts C j and C i , and f is the sigmoid threshold function.
The simulation of status values stops when the system reaches equilibrium; that is A k = A k 1 or A k A k 1 e , where e is a residual, representing the minimum error difference between concepts. It is typically set as 0.001 [20].

2.1.2. Threshold Functions

Threshold functions are used to transform a status value into an interval [0, 1] at each step to keep the dynamic analysis bounded. Bivalent, saturation, trivalent, hyperbolic, linear threshold, and sigmoid functions are some of the most commonly used functions [33,34]. The sigmoid function is the best choice for this study because we aim to predict the probability as an output in a nonlinear system. The sigmoid function is computed as follows:
f x = 1 1 + e λ x
where λ > 0 is the adjustment parameter that determines how quickly the output approaches the limiting value of 0 and 1; x is the vector value A i k of a concept at a given iteration; and e is a residual that describes a minimum error difference between concepts [25].

2.1.3. Map Aggregation

Map aggregation is vital in decision problems where we have many variables to consider and the outcomes to be judged are not equally important to decision makers [35]. Some studies qualitatively aggregated the weight matrix to obtain a condensed weight matrix with fewer concepts [36,37]. This study applied quantitative aggregation of an arithmetic mean to comprehend the cumulative perceptions of all experts [25,28].
Based on Kosko’s averaged weights [24], n th experts assign the important value of nodes C i and the relation degree w i j between nodes C i and C j . Then, the averaged node C i a v e and averaged weight w i j a v e are calculated as in Equations (3) and (4), respectively:
C i j ( a v e ) = f ( n = 1 N C i j n N )
w i j ( a v e ) = f ( n = 1 N w i j n N )
Once we obtain the initial aggregated weight values, the proposed model is computed until steady states to obtain the final values.

2.1.4. Structural Analysis

Social cognitive theory is applied to examine the structure of maps through several indices, namely density, in-degree (cumulative weights of inbound links), out-degree (cumulative weights of outbound links), and centrality degree (sum of in-degree and out-degree) [28,38]. To explain, in-degree indicates the concept influenced by other concepts [39]. A concept with a high in-degrees and no out-degree is a receiver, whereas that with a high out-degree is a potential factor that influences concepts in a system [39]. The importance of concepts can be judged by the degree of centrality, in which the higher the value of the degree of centrality, the greater the importance of concepts [28,40].

2.2. Development Process

The construction of FCM requires a participatory approach that involves stakeholders who are familiar with specific problems [21,41]. In such a context, we asked experts in Area-BCM to give their opinions on Area-BCM implementation. Before an interview, initial concepts were prepared as reference inputs. Then, experts were asked to review those concepts which they were allowed to adjust or eliminate, and then rate the concepts. At this stage, a questionnaire was developed so that experts could conveniently express opinions. The five-scale linguistic variables are deployed as rating values of very weak, weak, medium, strong, and very strong importance, which is equivalent to a numerical scale of 0.2, 0.4, 0.6, 0.8, and 1, respectively [41]. Subsequently, each expert was interviewed in order to construct an individual FCM, proving causal relationships and rating relation degrees on the same scale as concept values, but which can be represented in either positive or negative values. Following the completion of all interviews, each map was coded into adjacent matrices. Averaging the multiple maps yielded FCMs [42]. After experts identify activated concepts for scenario development and complete FCM aggregation, simulations can be performed in the final step. The result does not provide completed quantitative predictions but rather shows what will happen to the system in simulations under given conditions. The entire development process is illustrated in Figure 1.

2.3. Data Collection

Ozesmi and Ozesmi [28] mentioned that it was not necessary to have an experienced expert in all aspects of the problem, but rather to opt for many experts from different disciplines to capture the system. Therefore, we selected five experts from those who succeeded in implementing BCM at a higher level than an internal organization. The first expert has prior experience promoting Area-BCM in industrial parks in Southeast Asia. The other three experts have prior experience developing Area-BCM in Japanese industrial parks. Another expert has extensive experience with a mature BCM in financial institutions and private companies. Initially, a paper and electronic questionnaire was prepared and distributed to each expert to rate the importance of concepts for Area-BCM implementation. Subsequently, each expert was interviewed individually, with the exception of one interview with a pair of experts. The interview’s goal is to observe an Area-BCM implementation system. Every expert is asked to build a mind map that indicates cause-and-effect relationships between concepts and score the degree of the relation. The linguistic variables for relation degree can have a range of 1–5 and be positive, negative, or no relationship. Figure 2 is an example of a mind map built by the n -th expert. Since interviews have been conducted with five experts, individual FCMs were coded into Excel sheets as an adjacent matrix, where relation values were normalized between −1 and 1.

3. Application of FCM to Area-BCM Implementation

3.1. Area Business Continuity Management

Area-BCM is a framework introduced by JICA [6]. It is an approach to address limitations that individual organizations cannot address in major disasters. The main problems include dealing with critical infrastructure, transportation, and supply chain disruptions [6]. To overcome these problems, various stakeholders from the public, private, and community sectors must collaborate to improve the capacity for disasters. Establishing Area-BCM requires stakeholders to share information and perform cyclic processes involving multiple components and mutual decision-making, as shown in Figure 3 [7]. To explain, implementing Area-BCM starts with understanding an area by assessing risk hazards and knowing key business resources [7]. Then, stakeholders facing the same risks collaborate to define common goals and decide strategies to prevent business disruptions [7]. Next, Area-BCP must be developed, in which a document detailing the first and second phases, as well as clearly defined responsibilities, should be included [7]. The defined strategies should then be implemented and tested [7]. Last, Area-BCM is a management process that requires improvement through cycle repetition [7]. The current issue is that Area-BCM has not been prolongedly implemented due to a lack of maintenance when conditions, such as leaders and hazards, have changed [9]. In contrast, a similar framework known as the Kyoto BCP has been in continuous operation in the public sector of Kyoto prefecture [43].
The most difficult issues at the start of implementation are introducing new concepts to users and requesting their participation [8]. Area-BCM will be difficult to achieve if stakeholders are not included because the plan requires information from multiple stakeholders to define hazards and strategies. Baba et al. [8] suggested a different approach to promoting Area-BCM and attracting participants by visualizing the evidence-based risk and potential impacts of external resource disruption. Furthermore, workshops in pilot areas revealed roadblocks during plan formulation, such as participants failing to define the working committee for Area-BCM activities due to increased workload [7]. The practical cases show that many factors can either negatively or positively influence the implementation of a system. Therefore, we would like to investigate the factors and actions that could lead to Area-BCM implementation success in the public–private sector collaboration.

3.2. Concepts of Causes-Actions-Impacts

Based on the system of a cooperative framework, there must be causes for stakeholders to take action under some conditions and derive outcomes. This study compiled relevant factors from several Area-BCM case studies [7,8,9,14,16] to clarify the implementation. According to the literature, we summarize the 28 concepts in Table 1 with their descriptions and relevant sources.
These concepts served as a guideline for experts during the data collection phase. To ensure the significance of bundled concepts, experts may add or remove them based on their experiences. The concepts cover three major decision-making components: causes, actions, and impacts [21]. First, in Area-BCM, the cause is a driver of attention. Therefore, causes represent the reasons why stakeholders decide whether or not to develop Area-BCM. The survey reported the key reasons companies were selected to develop disaster plans, including disaster experiences, top management commitment, and customer requirements [5]. On the other hand, the barriers that cause companies not to develop plans are resources and knowledge [5]. Therefore, those factors are categorized into cause concepts.
Action represents activities that must be undertaken by multi-stakeholders who aim to participate in Area-BCM to manage regional risks [7]. In the current study context, the concepts of actions are the key procedures in implementing Area-BCM, from promotion and risk analysis to improvement to the continuation of its practices [7]. These factors were selected because they were emphasized more than other actions. For example, Area-BCM must be promoted and raise stakeholders’ concerns about disaster risks [8]. Next, a workshop can help people understand external resources and safety issues [44]. Moreover, a case of Area-BCM in Bangkadi industrial park indicated that the implementation had failed due to a lack of continuous improvement [9]. As a result, these concerns are addressed in the concepts of actions.
The term “impact” refers to the tangible and intangible benefits resulting from participating in Area-BCM and influencing the path to a sustainable economy. They include working committees, collaboration efforts, information sharing, and individual thoughts, such as perception and awareness [7], in addition to hard documents (Area-BCP) or strategies. All predefined concepts represent the system of the current study. Following the review of concepts, each expert was asked to construct an individual FCM and find the strength of causal relationships between 28 concepts. We asked experts to explain the map after they completed individual FCMs to gain insight into their perceptions. Maps were then converted into adjacent matrices for data analysis. The analysis of a system was performed at both static and dynamic levels. First, the static analysis is conducted to analyze the entire map using a social cognitive approach that can present (i) several concepts and connections, providing a characteristic of the map; (ii) density, indicating the complications of a map; and (iii) degrees of centrality, describing the status of concepts [45]. Next, the dynamic analysis is to compute a fuzzy inference that interprets concepts’ importance in a system. Additionally, scenario analysis can be used to observe the differences between concepts in the steady state, which is necessary for strategy development.
Table 1. Predefined concepts of Area-BCM.
ConceptsDescriptionSources
Causes
C1. Government supportSupporting actions and activities to introduce Area-BCM by the government.[6,7,16,43]
C2. External requirementExpectations to establish Area-BCM from external stakeholders.[46]
C3. Top management commitmentA commitment of an organizational leader to building, allocating, and spending resources for Area-BCM.[14,16]
C4. Natural hazardsImpacts of natural hazards on industry and community.[8]
C5. Availability of common resourcesNon-disruptive infrastructure (i.e., electricity, gas, water supply, and transportation roads) during disasters).[6,7,8]
C6. WorkloadThe excessive tasks in Area-BCM implementation.[7]
C7. Lack of human resourcesInsufficient human resources to implement Area-BCM and continue activities.[5]
C8. Change of conditionsChanging of components to develop Area-BCM (i.e., new risks, key business, stakeholders, and responsibility).[7]
Actions
C9. Promotion of Area-BCMIntroducing an Area-BCM framework and presenting incentives to new users/ industrial complexes/ companies.[8]
C10. Risk assessmentAnalysis of potential hazards and risks that can harm people, facilities, and services.[47,48]
C11. WorkshopAn activity that gathers stakeholders to do an exercise and prepare for disasters.[7,46]
C12. Identifying stakeholdersKnowing the stakeholders who are related to your business and should participate in the implementation of Area-BCM.[7,48]
C13. Area-BIAAnalysis of the impacts of the disaster on society and business in the entire area.[44,48]
C14. Defining a common goalThe goal of implementing the Area-BCM defined by stakeholders.[7,14]
C15. Determining recovery timeA desirable time to get business operations back from suspension due to disasters.[7]
C16. Defining strategyObtaining a strategy to improve the capacity for business continuity and recovery of an area.[7,9]
C17. Defining responsibilityResponsibility of all stakeholders to participate in Area-BCM.[7,9]
C18. Training in organizationA process to train and communicate the Area-BCM with staff in one’s organization.[7,16]
C19. Continuous improvementAn improvement activity of Area-BCM by repeating the cycle to update information.[7,8,14]
Impacts
C20. Working teamForming a working team to work on implementation of Area-BCM.[6,7,14]
C21. CollaborationActions among stakeholders to solve the problems of the area.[6,46]
C22. Risk perceptionIndividual judgments and beliefs about the potential risk and the possibility of losses.[29]
C23. Information sharingSharing of disaster information to prioritize activities for sustainable development.[6,46]
C24. Communication channelA channel to communicate Area-BCM with internal and external stakeholders.[29]
C25. Decision-makingUnderstanding the weaknesses of the business and formulating strategies for the area together with the stakeholders.[7]
C26. Area-BCPA document of procedures in Area-BCM implementation.[7,8]
C27. Awareness raisingFostering information and knowledge to improve understanding of hazards’ consequences.[7,16]
C28. Effective Area-BCMAchieving business continuity and recovery quickly.[7]

3.3. Development of Input Concepts for Scenarios

The Area-BCM implementation procedure requires different elements in each phase [7]. Therefore, six scenarios (baseline + five) scenarios were developed for FCM-based simulations. The study participants assigned input concepts corresponding to four scenarios. The scenarios and identified concepts are explained as follows.
  • The baseline scenario comprises all concept values set to zero, but a concept of natural hazards (C4) is activated [20,25]. The situation of existing hazards is represented without taking any action. This scenario is a base for exploring the different concept values between a steady state of the baseline scenario and the other developed scenarios.
  • Scenario 1 is defined as an Area-BCM promoting phase. In other words, this is the state before the Area-BCM cycle begins. After two major disasters, namely, the 2011 Great East Japan Earthquake and the 2011 Thailand flood [6], the Area-BCM was established in 2013 and implemented in three pilot areas: the Philippines, Vietnam, and Indonesia [6]. Educating practitioners about the Area-BCM remains a significant challenge. Therefore, to initiate Area-BCM in any region, we need to promote the features and illustrate the concerns of stakeholders about the risks of disaster [8]. Furthermore, the Akemi industrial park indicated the key role of governments and leaders in initiating the park-wide BCP [43]. Since experts have experienced introducing Area-BCM to new users, we asked them about the important concepts in this situation. The concepts mentioned include government support (C1), top management commitment (C3), impacts of natural hazards (C4), promotion (C9), workshop (C11), risk perception (C22), and awareness raising (C27). Those concepts represent the potential incentives to trigger participation in the next step.
  • Scenario 2 is a situation in which stakeholders must participate to understand the area and follow the process as an Area-BCM cycle [7]. The primary activity is risk analysis to comprehend potential risks and develop Area-BCP [6,47]. Experts suggested that a workshop would aid practitioners in developing Area-BCM; as a result, the majority of the significant factors were chosen to represent operating actions [7,46]. Government support (C1), external requirement (C2), top management commitment (C3), natural hazards (C4), risk assessment (C10), workshop (C11), Area-BIA (C13), defining common goal (C14), and working team (C20) are the nine input vectors associated with this scenario.
  • Scenario 3 is to foster collaboration for Area-BCM since the scale of Area-BCM depends on participants; the more parties, the greater the capacity of the disaster to encounter disasters [7]. Therefore, the activated concepts of this scenario emphasize interactions among stakeholders, including government support (C1), external requirements (C2), top management commitment (C3), natural hazards (C4), workshop (C11), collaboration (C21), information sharing (C23), and communication channel (C24).
  • Scenario 4 is the maintenance state. Once the Area-BCM system has been placed, stakeholders must repeat the cycle to update any changes in conditions. In this context, practitioners obtain Area-BCP and implement measures and project improvement for Area-BCM [7,16]. Therefore, experts identified the activated concepts to keep Area-BCM alive, namely top management commitment (C3), natural hazards (C4), change of conditions (C8), workshop (C11), training in organization (C18), continuous improvement (C19), and Area-BCP (C26).
  • Scenario 5 is defined as a full execution scenario in which all 28 input vectors are set to one. A rationale for simulating this scenario is to observe the impacts on the Area-BCM system when the required processes have been executed.
To recap, the concept of natural hazards is activated every time for each scenario. Furthermore, the informants identified top management commitment (C3) and the workshop (C11) as input vectors for all the scenarios developed. The simulation results of the developed scenarios are then compared with the baseline scenario. Exploring the change in concept values between scenarios offers a quantitative interpretation of the influence of activated concepts on the system. Hence, the results enable the development of the strategy. The results of the scenario analysis are presented in the next section.

4. Results

This section presents the results of FCM following the above development process. The main results include the characteristics of a map, the degrees of centrality, the aggregated maps, and the scenario analysis. R-4.3.0 with the fcm package is applied to perform inference and scenario simulations [49]. In this case, R programming is chosen because it provides transparency and eliminates calculation limitations when compared to other tools. Mental Modeler [50], for example, is user-friendly for non-IT users but lacks learning algorithms and has a limited set of options. FCM expert [34] has several learning algorithms for adjusting the weight matrix, but modifying activation values takes time when a model contains many concepts. In contrast, the open source package in R programming offers researchers the opportunity to examine fuzzy inference with various functions and is easy to use [49]. The results of the study are described below.

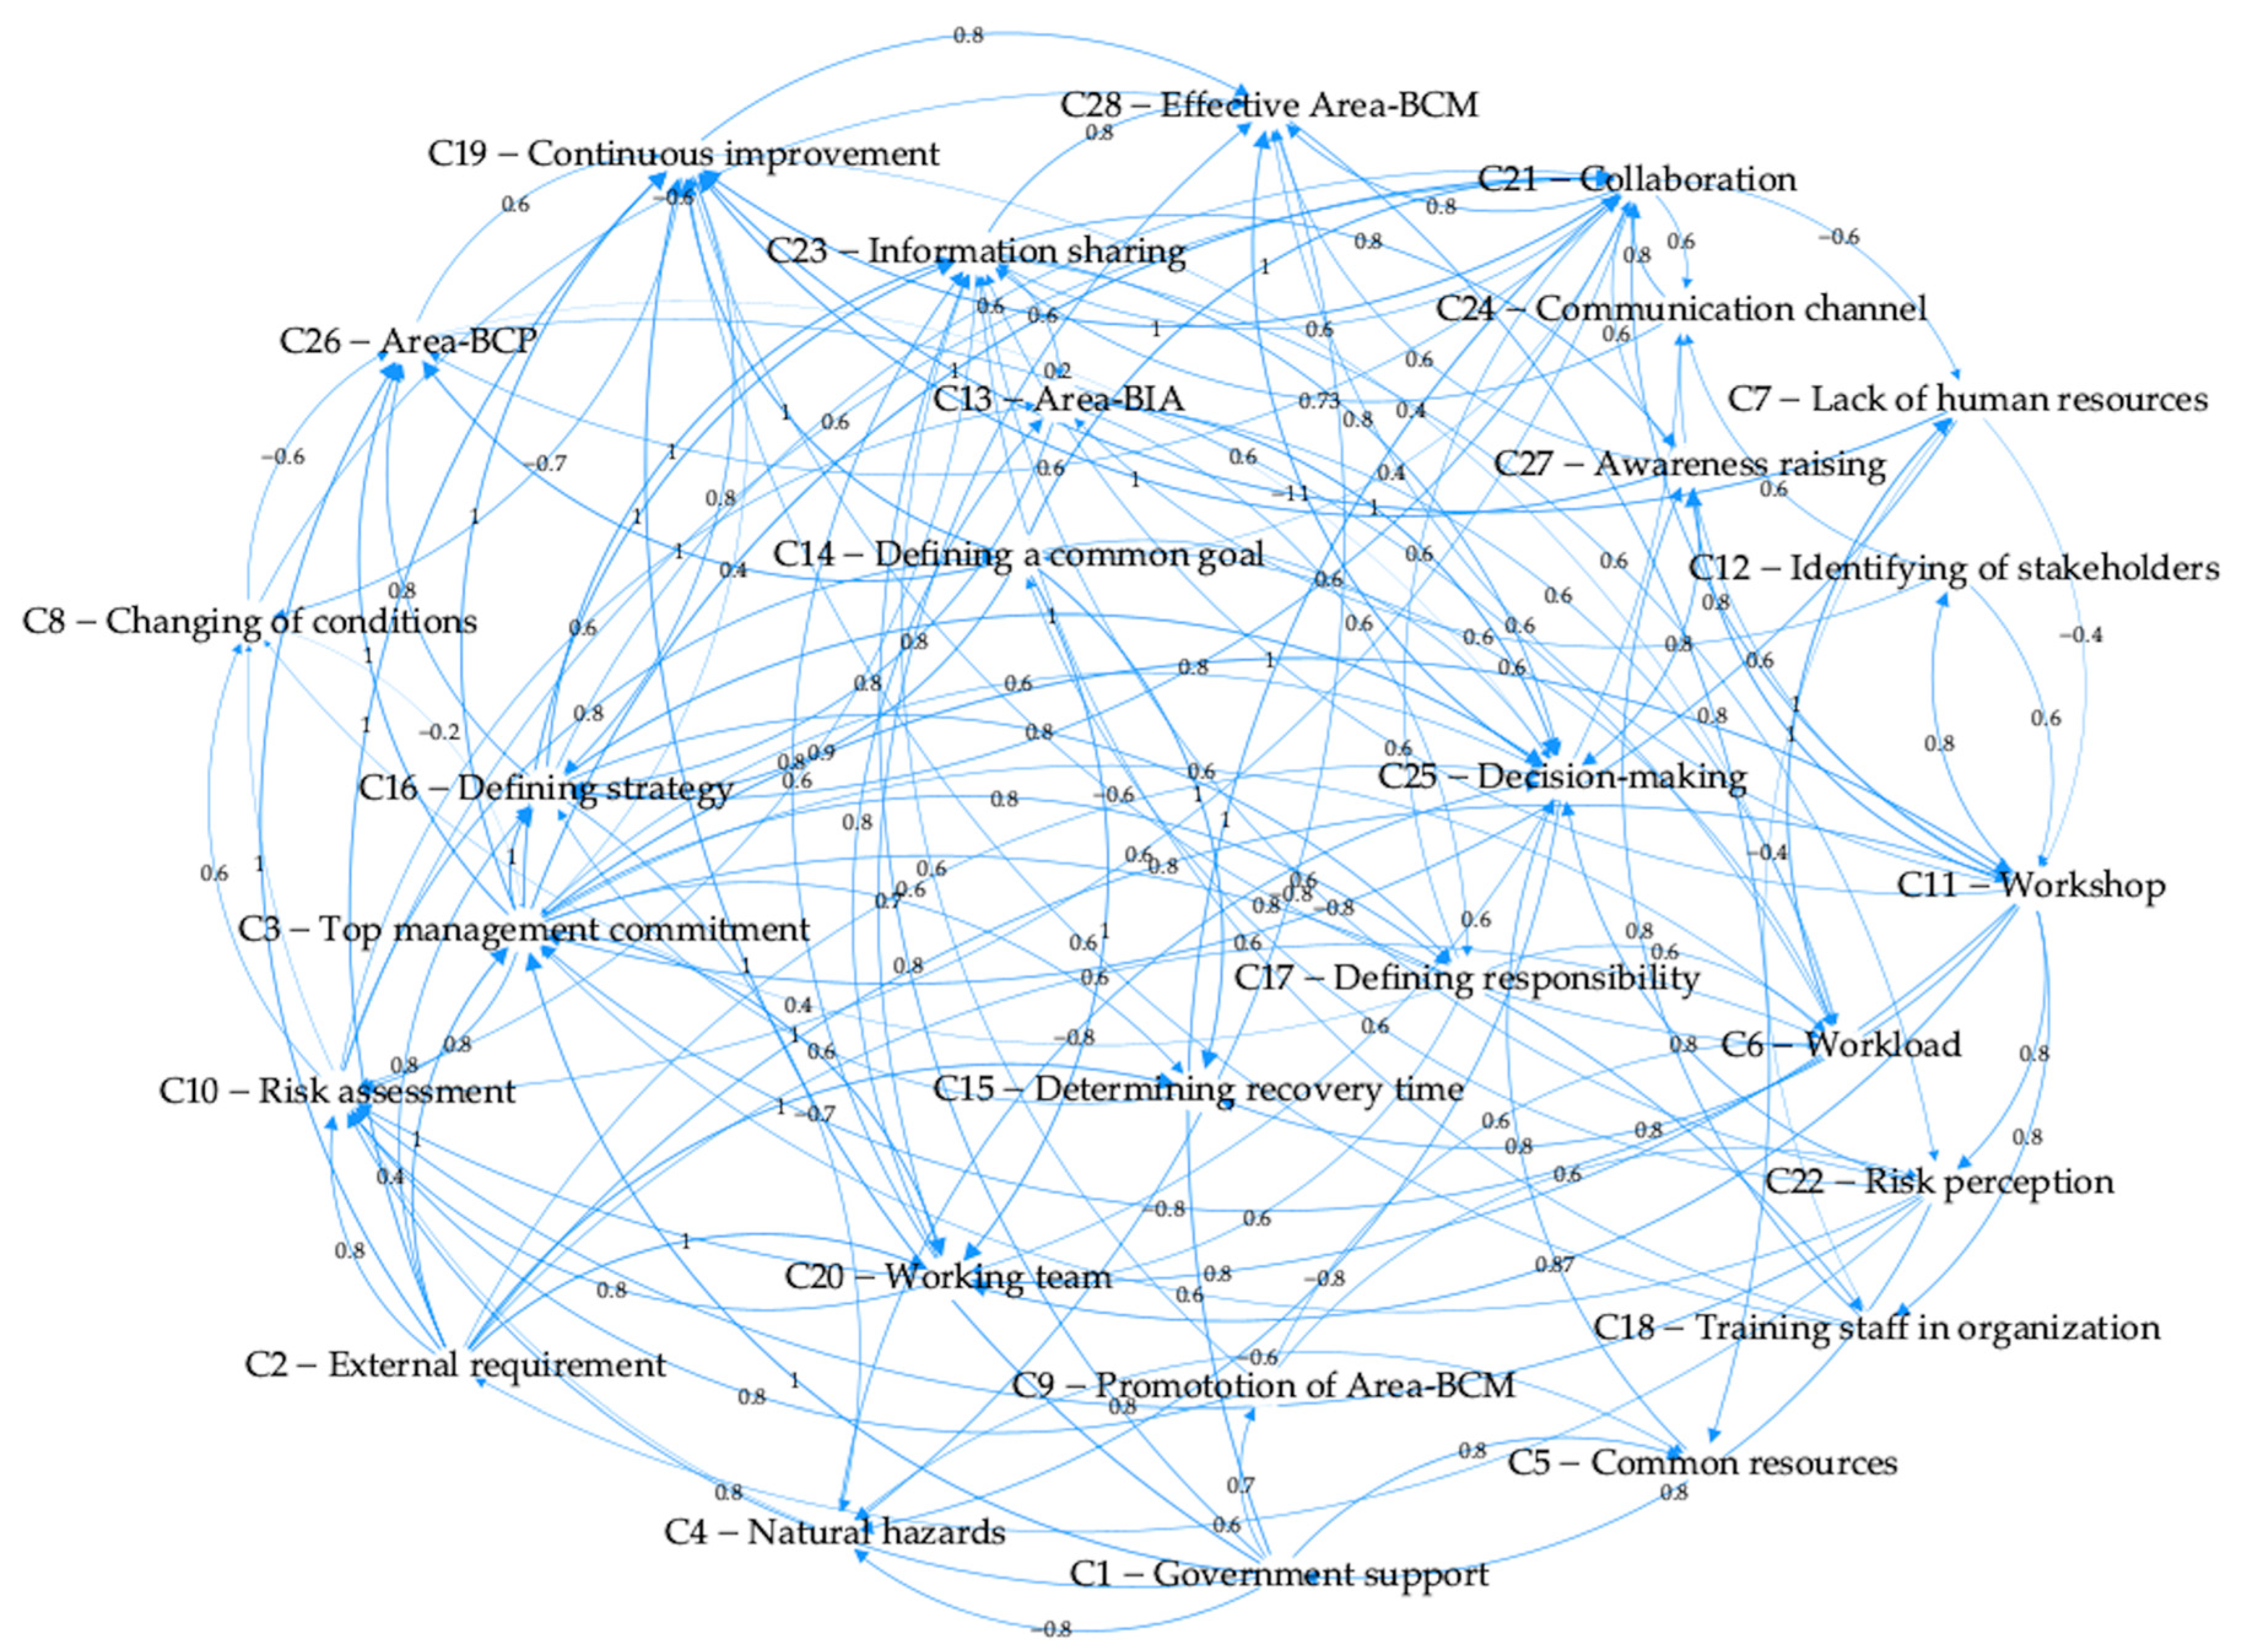
4.1. Aggregated Fuzzy Cognitive Map

4.1.1. Map Characteristics

We identified 28 concepts in the Area-BCM implementation system and asked experts to scrutinize them. Afterward, each expert creates an individual map based on the defined concepts and provides the strength of the relationships. As a result, we merged four FCMs into a single map. Appendix A presents the averaged-weight matrix (Table A1). The matrix contains 138 relations, of which 121 are positive and 17 are negative. A map has a density of 0.18, which means that 18% of the links are displayed in comparison to the maximum number of links between 28 concepts. Gephi [51], an open-source software, is used to visualize the aggregated FCM, as shown in Figure 4. Because the nature of concepts was identified, and experts provided various opinions on the Area-BCM system, the complexity of the aggregated FCM stems from a large number of connections.
The centrality measures in network analysis are a theory to illustrate a map structure [52]. This step revealed key features of the map and concepts. The concept with the highest out-degree is top management commitment (C3), weighing 11.3 and 13 outbound links. To explain, the commitment of top management directly influences 13 concepts in which the strong influence as a five-score rating includes workshop (C11), defining strategy (C16), continuous improvement (C19), working team (C20), collaboration (C21), information sharing (C23), and Area-BCP (C26). Hence, top management commitment is the potential factor that influences others in implementing the Area BCM. The concept with the highest in-degree is a continuous improvement (C19), weighing 8.8 and holding 11 inbound links. It is strongly affected by government support (C1), external requirements (C2), top management commitment (C3), defining common goals (C14), collaboration (C21), and awareness raising (C27). However, it is negatively affected by workload (C6) and lack of human resources (C7). It implies that maintaining improvement of Area-BCM needs the most support, and it would fail to improve if there is too much workload and insufficient staff. Furthermore, a map depicts the critical role of top management commitment (C3) from the highest degrees of centrality, holding both high out-degree and in-degree. Unexpectedly, identifying stakeholders (C12) has the lowest degree of centrality, which means low interactions with the other concepts. The total degree of centrality is presented in Table 2.

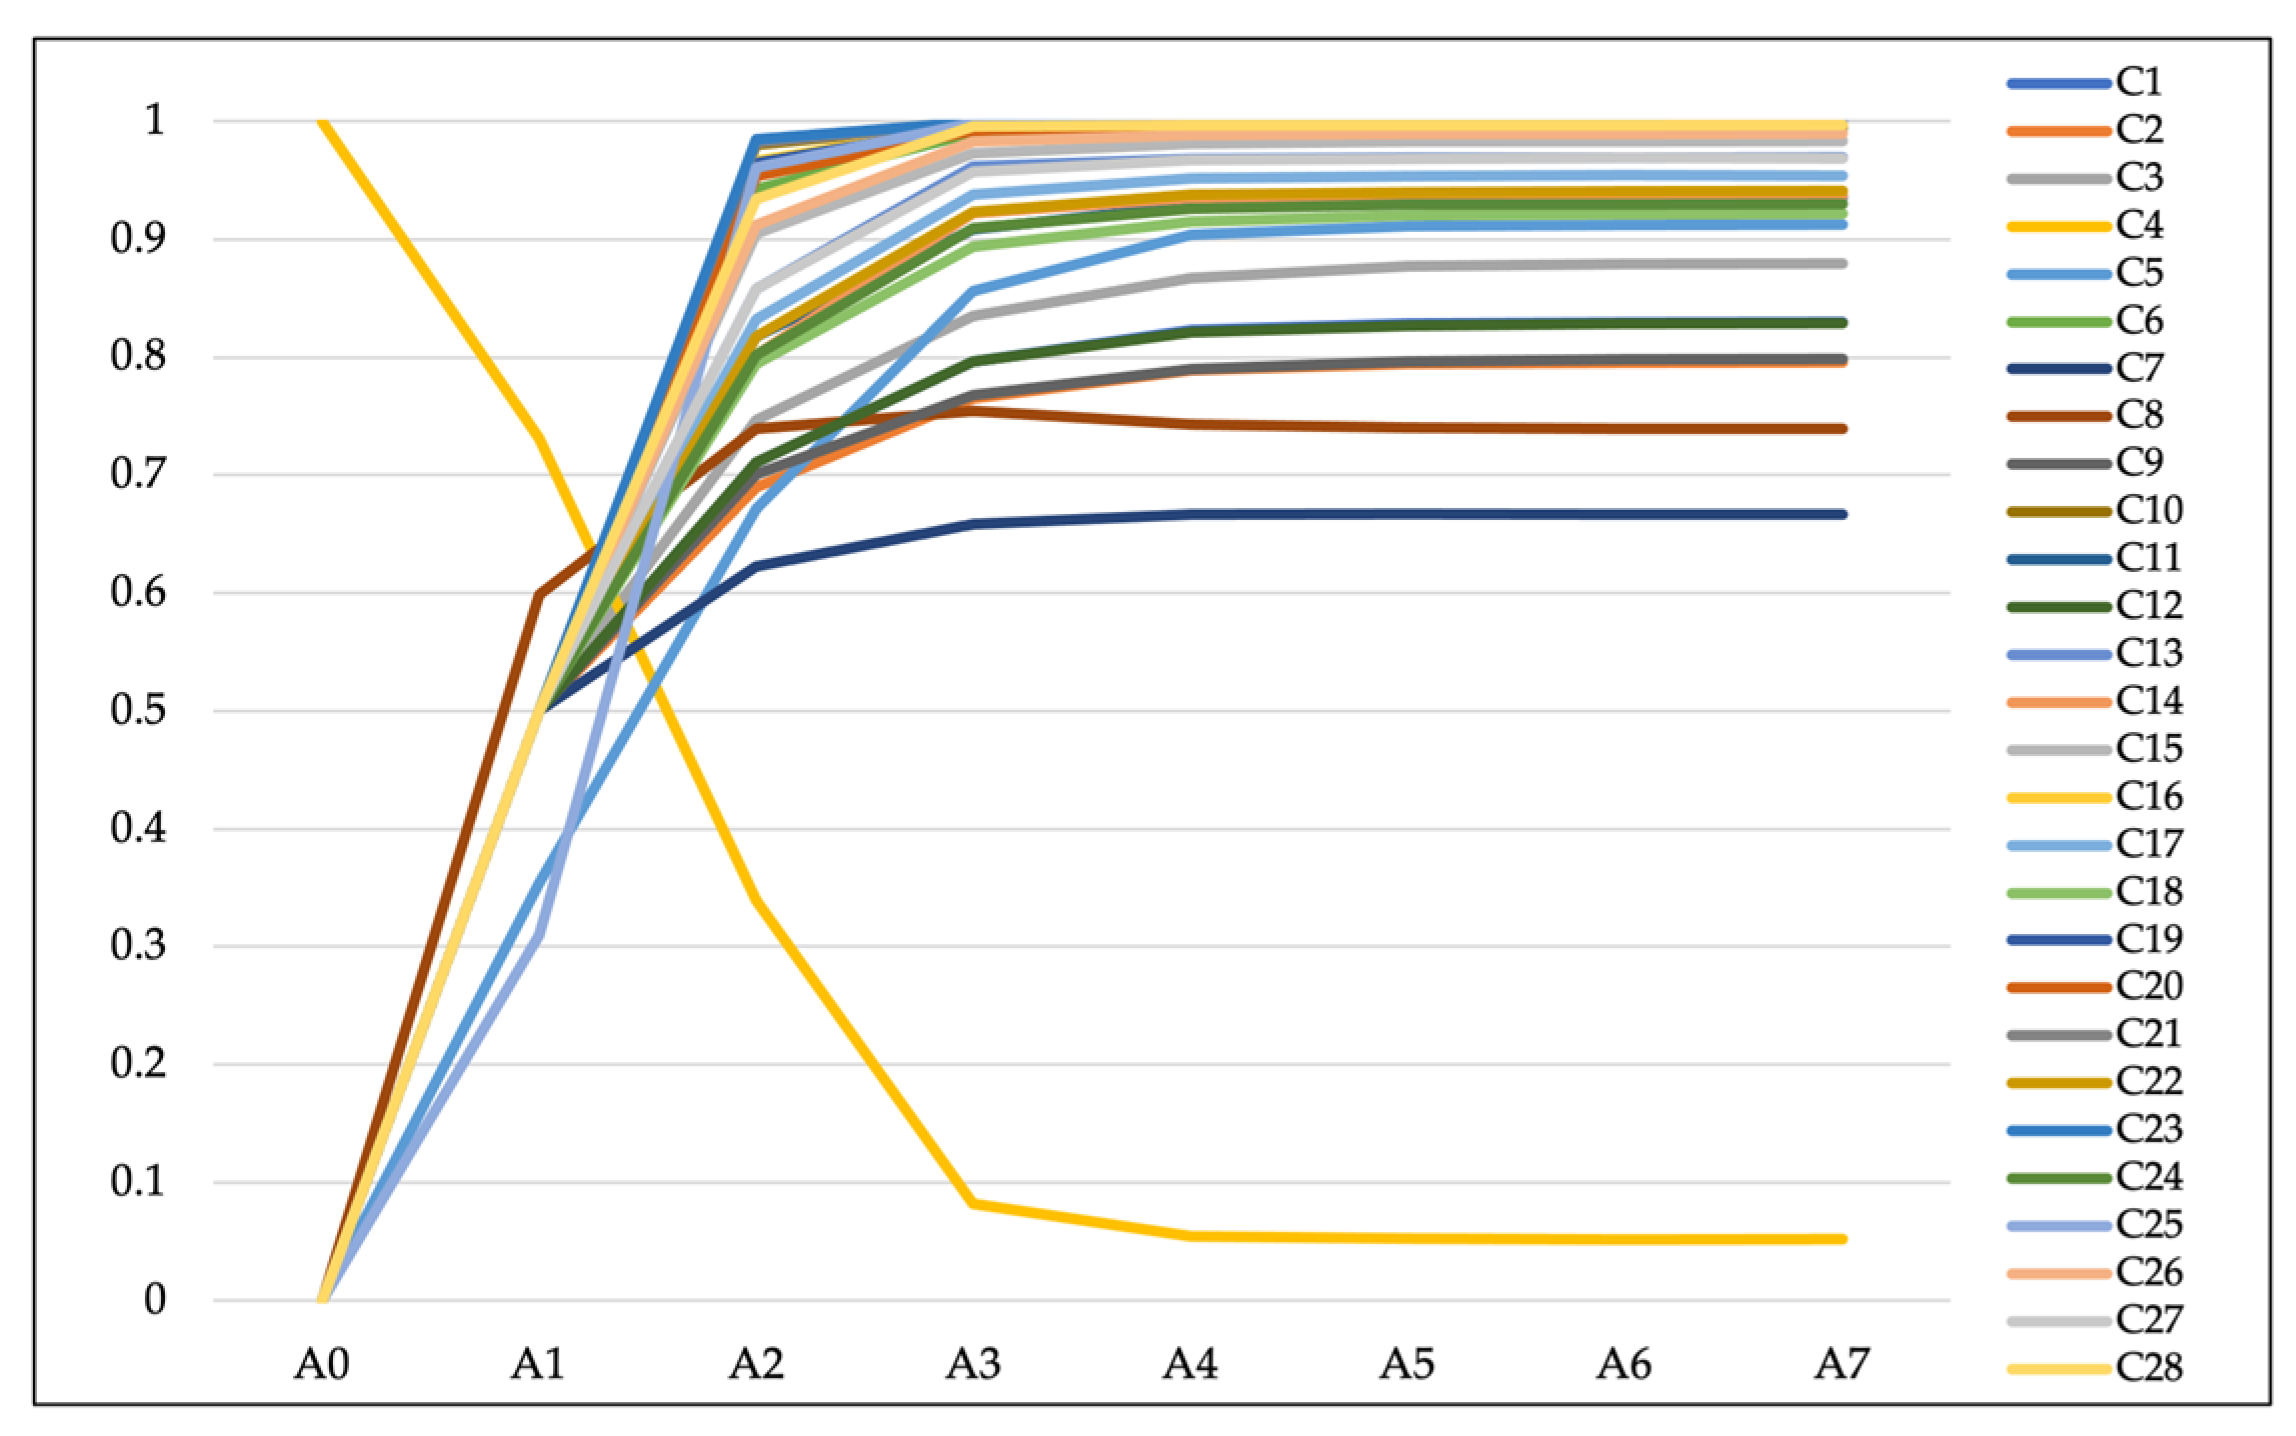
4.1.2. FCM Steady State Analysis

Based on the initial status values of the factors A 0 and the initial weight matrix E 0 from experts, the FCM calculation is simulated to determine the steady state of a system. We refer to the modified Kosko’s inference rule and the sigmoid function with lambda = 1 (Equations (1) and (2)) [20]. To explain, a state value is calculated by multiplying the set of initial concepts by the initial weight matrix. The final values of each concept can be derived after a certain number of iterations and concepts are converged at A k A k 1 < 0.001 . In the first step, FCM inference is performed using a baseline scenario in which all concept values are set to zero, except for natural hazards (C4), which are set to one. As a result, Table 2 displays the concepts’ initial and final values. Mehryar and Surminski [21] suggested that, in addition to an aggregated map, researchers provide information on the number of times each relation was repeated to better understand the consensus level. After seven iterations, the concepts in this study reach an equilibrium point. Figure 5 depicts the result of an iterative calculation. Most concepts are limited to one, except for natural hazards (C4), lack of human resources (C7), and change of conditions (C8). It implies that when the Area-BCM system is generated, those three concepts can be decreased while information sharing (C23) is activated to the greatest extent possible. As a result, this is a positive outcome of implementing Area-BCM to reduce disaster impacts and improve information sharing.

4.2. Scenario Analysis

Scenario analysis or what-if analysis presents how different values of an under a given set of assumptions and independent variables affect other dependent variables. We can assess how changes in one variable affect the system by selecting a given set of variables. In other words, it is simulated to determine what the state of the system will be under various conditions or strategies. Therefore, it is carried out to observe how the activated concepts affect others. After the simulation results are obtained, the baseline scenario is established to compare the outcomes of each scenario.
We conducted five scenarios utilizing concepts and weight matrix by activating defined concepts. The activated concepts called input vectors influence other concepts by weighing the causal relationships [25]. The input vectors in each scenario were derived from experts. They are initially set to the most significant, which is equal to one. Finally, Table 2 displays the FCM scenario results. The outcomes of the simulations were then compared to the baseline result.
The FCM scenario analysis reveals slightly different perspectives on the emphasized concepts established by the experts. It emphasizes the benefit of FCM in revealing hidden relationships [25]. Since the concept values are obtained at a steady state, the differences between the baseline scenario and the five scenarios are explored. Based on different activating concepts in five scenarios, the results show a slight change in concepts between −0.031 and 0.023%, which is comparable to the other studies [20,45,53]. Figure 6 depicts the percentage changes in concepts (causes-actions-impacts) for five scenarios when compared to a baseline scenario.
Figure 6a focuses on the concepts of causes. As shown, five scenarios for Area-BCM implementation appear to be capable of increasing drivers such as government support (C1), external requirement (C2), top management commitment (C3), decreasing barriers such as a lack of human resources (C7) and change of conditions (C8), and mitigating the impact of natural hazards. Scenario 5—full execution of all concepts presented in the green bar—is activated, with the most decreased impacts of natural hazards (C4). It is only marginally higher than scenario 1 (promotion of Area-BCM) presented in the blue bar. However, the full implementation and promotion of Area-BCM illustrate the same changes in increasing government support (C1), external requirement (C2), availability of common resources (C5), and decreasing in unstable situations as the change of condition (C8) is lower. We expected that the full execution scenario would present the largest change in every concept. Nevertheless, top management commitment (C3) and the lack of human resources (C7) are the most influenced by scenario 3 (collaboration) shown in the gray bar. From the scenario simulations, we cannot decrease the workload (C6) as there is not much clearly changed in each scenario.
Figure 6b reports the effects on actions. Five scenarios can make changes in the promotion of Area-BCM (C9), workshops (C11), identifying stakeholders (C12), Area-BIA (C13), defining a common goal (C14), determining recovery time (C15), defining responsibility (C17) and training in organization (C18). To demonstrate, a full execution scenario emerges to activate the best promotion of Area-BCM (C9). In contrast, workshop (C11), identifying of stakeholders (C12), and organization training (C18) have the biggest changes in the collaboration scenario. Despite the high degree of centrality in risk assessment (C10), defining strategy (C16), and continuous improvement (C19), we barely notice any changes influenced by scenario simulations.
Figure 6c indicates the relative change in impact concepts. To illustrate, the FCM-based simulation of promotion is the best for building risk perception (C22). In addition, it reveals that communication channels (24) and awareness raising (C27) can be enhanced by all scenarios but are presented with the highest values in the collaboration scenario. Although we expect to observe what scenarios will influence all impacts, unfortunately, we cannot see a clear change in collaboration (C21), information sharing (C23), decision making (C25), and effective Area-BCM (C28).
The FCM-based simulation of concepts demonstrated the importance of existing concepts in successfully implementing Area-BCM. We assumed that when all concepts were combined, the changes in all concepts would be positive. The full implementation of the concept scenario can achieve the greatest decrease in natural hazards. Promoting, on the other hand, improves risk perception. For several concepts, the result of the collaboration scenario is suggested to be the best. Although the scenarios for the formulation of Area-BCM and maintenance influence the concepts in the Area-BCM study, they could not make a change as high as the other three scenarios. The results of an analysis can provide practitioners with a set of factors that are significant to each outcome. Compiling an analysis of different scenarios helps decision makers perceive the expected outcomes. The results support the implications of concepts and strategy development in the next section.

5. Discussion

The findings of this study provide several insights into the implementation of Area-BCM in industrial parks. This section discusses the concepts that are important for implementation. The results of static analysis as centrality measures are described for implications, and the results of dynamic analysis as FCM simulations are discussed for strategy development as follows.

5.1. FCM Implications

In network analysis, the degree of centrality and the out-degree present that top management commitment (C3) is the most important and potential concept to empower Area-BCM implementation. It has the highest interaction degrees for supporting 13 concepts and receiving impacts from seven concepts. To demonstrate supporting powers, the role of management in Area-BCM is to provide perspective and strategy and allocate resources, rewards, and time [54]. The management is also the person who connects with external stakeholders. Therefore, management commitment is critical in two aspects: (i) establishing individual BCM and (ii) aligning own BCM with Area-BCM to eliminate external resource and interdependency problems (i.e., logistic services and the availability of information). A strong leader with a disaster resilience attitude is required for an organization to succeed in Area-BCM [7]. The result emphasizes the interpretative model that top management commitment is the foundation of the Area-BCM [16]. Taking into account the impacts of the other concepts on top management commitment (C3), the result indicates that the management commitment would not appear if it lacked the influencing concepts, namely government support (C1), external requirement (C2), and risk perception (C22). In other words, management may not commit to Area-BCM unless they receive support from the government, requirements from external stakeholders, and perceive risks. The Kyoto BCP case study revealed the key role of the government, which is concurrent with this study [43]. To illustrate, the government is responsible for holding BCM seminars and building relationships between local stakeholders [43]. Moreover, the BCP survey in Thailand revealed that many companies developed BCP due to requests from customers, the government, and the community [5]. Therefore, this study suggests that government support be obtained prior to introducing Area BCM into a designated area. Then, a strong influence of government support on the management commitment and promotion of Area-BCM can facilitate its activities. Within this pathway, initiating the Area-BCM framework seems possible.
Continuous improvement (C19) derived the most inbound links in the degree, indicating its high dependence on ten concepts. First, the improvement will be reduced if there is a workload (C6) and a lack of human resources (C7). The current study presents an unusual reason for the study of Area-BCM in Bangkadi Industrial Park in Thailand, as in the previous case, Area-BCM was not continuously improved due to the change in local government [9]. Taking into account positive influences, continuous improvement (C19) is affected by the other eight concepts, in which very strong drivers are government support (C1), external requirement (C2), top management commitment (C3), defining common goal (C14), collaboration (C21), and awareness raising (C27). Therefore, Area-BCM executors who want to keep an Area-BCM alive should keep those concepts under control to achieve continuous improvement. Currently, static result-based strategies that can be proposed include maintaining long-term relationships among the government, business parties, and firms and establishing a common goal for building a sustainable economic region against disasters.

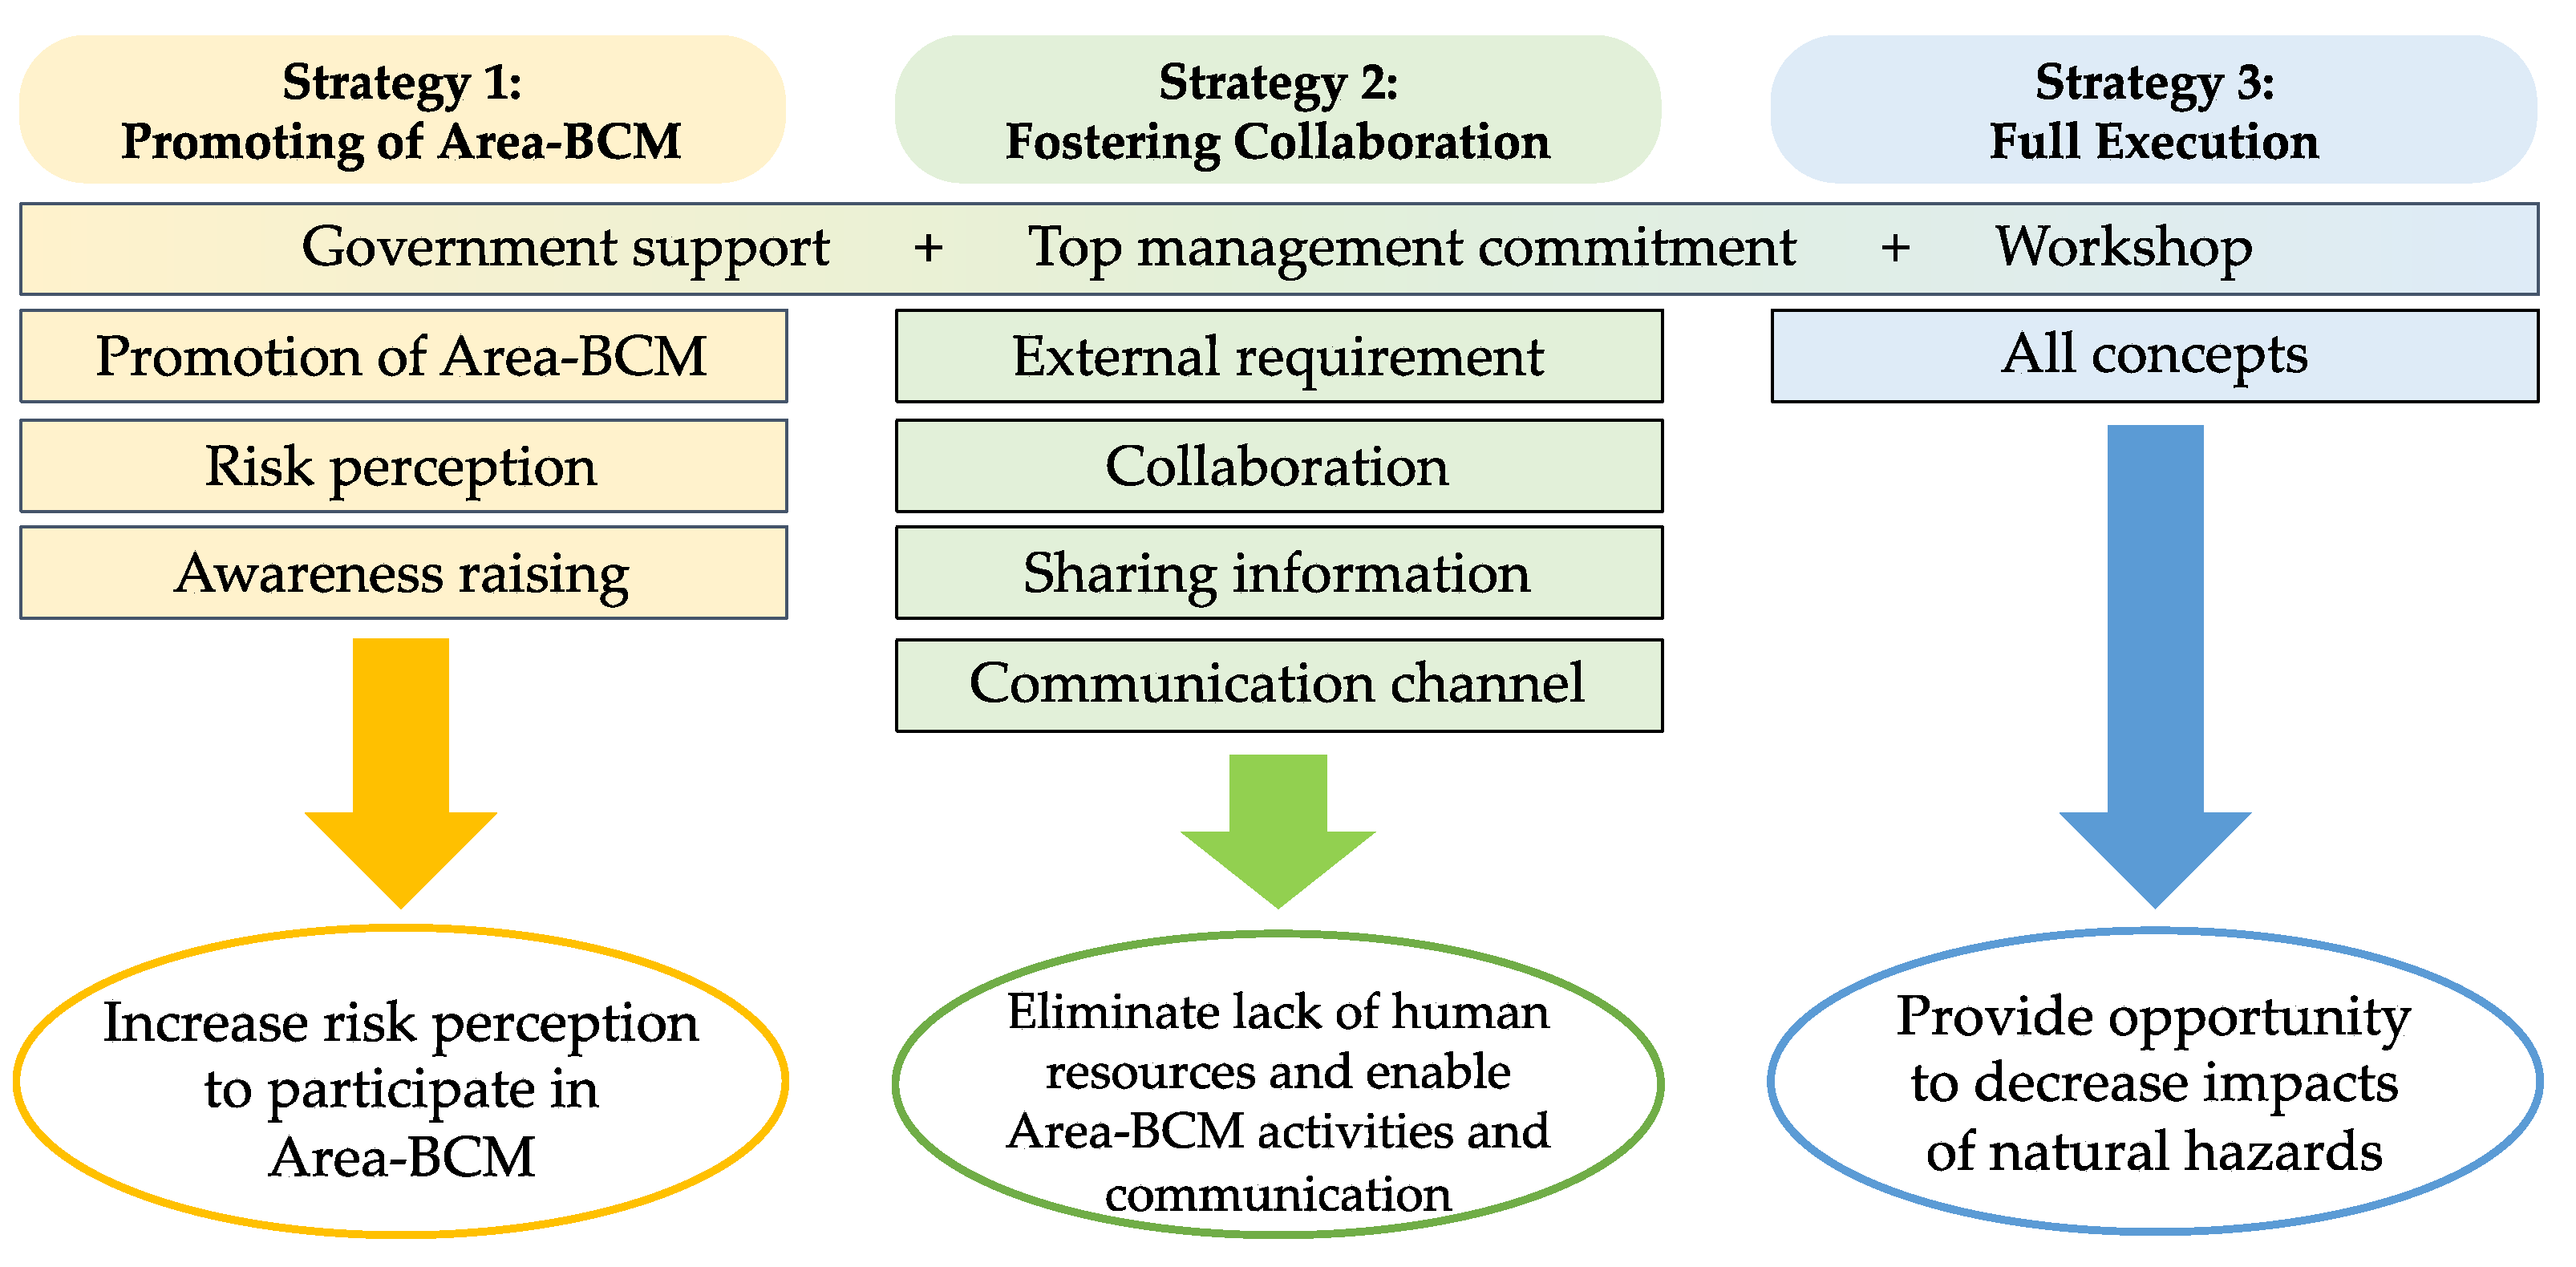
5.2. FCM-Based Strategy Development

The Area-BCM framework was introduced to strengthen disaster capability by building relationships among stakeholders in industrial agglomerations. Its implementation requires multi-stakeholders to be involved in multi-step activities and layout strategies to protect a disruption from disaster. Although guideline and implementation case examples were identified [7], practitioners are still a long way from being successful due to the challenges of showing incentives, gaining participation, and gaining perceptions of risk [6,8]. Furthermore, the need for leadership mechanisms for effective accountability, such as training, maintenance, and review, cannot be ignored [7]. In this context, the FCM is applied to illustrate causal relationships in a complex system. First, the simulation of the baseline scenario of the implementation of Area-BCM depicts the values of concepts in a steady state, in which the effective Area-BCM (C28) reaches one and the natural hazards (C4) decrease to the lowest. In addition, FCM scenario analysis could help identify the critical role of concepts and provide valuable information for strategy development. This study provides beneficial implications for developing three strategies, as depicted in Figure 7.
To promote Area-BCM, our findings are consistent with the previous study’s suggestion that visualizing the disaster’s impacts and promoting a framework will increase stakeholders’ perception when considering Area-BCM [6]. When activating concepts in this scenario, we can see the most significant change in risk perception (C22) compared to other scenarios. Therefore, executors who aim to introduce the Area-BCM to new users should take the identified concepts in promoting scenarios; then, risk perception would be increased and be able to initiate Area-BCM. Based on the results, the first strategy to promote Area-BCM can be implemented using seven factors, including government support (C1), top management commitment (C3), impacts of natural hazards (C4), promotion (C9), workshop (C11), risk perception (C22) and awareness raising (C27).
Regarding the previous study on the design of the Area-BCM [48], we expected that scenario 2 (i.e., formulating the Area-BCM) would strongly influence the action concepts by activating risk assessment (C10), workshop (C11) and working team (C20). However, we do not find an outstanding increase compared to other scenarios. Similarly, we expected that scenario 4 (i.e., maintenance) would significantly decrease condition change (C8) and increase continuous improvement (C19), but no impact was observed. To explain the causal effect relationship, we discovered that identified concepts in these two scenarios increase workload, which negatively impacts the Area-BCM system. In addition, experts in this study did not identify government support for the maintenance scenario. In comparison, since 2015, the Kyoto BCP has prioritized the prefectural government [43]. As a result, additional factors must be investigated to eliminate the workload burden and achieve implementation. Consequently, formulation and maintenance scenarios are not proposed for strategy development. In other words, risk perception and collaboration are more important than processes for implementing Area-BCM.
Next, a collaboration scenario reveals the best influences on various concepts, including top management commitment (C3), lack of human resources (C7), workshop (C11), identifying stakeholders (C12), training in organization (C18) and communication channel (C24). When considering the lack of human resources, the previous study presented it as a problem that hinders BCP development [5]. However, this study finds that a collaboration strategy will solve the human resource problem and enhance Area-BCM activities such as workshops. To elaborate on collaboration, an expert who implemented the concept of Area-BCM in the previous pilot countries mentioned that implementation was possible because the local government supported firms to participate in Area-BCM activities [7]. The results show key drivers and characteristics similar to those of a study of the BCP in the entire Akemi industrial park wherein the government and the industrial operator increased coordination and allowed two-way communication between companies and local governments in disaster information sharing [43]. Therefore, this scenario is paramount for the collaboration of stakeholders in Area-BCM. It can be applied as a strategy to develop communication channels between sectors, which is beneficial to support stakeholder participation.
Finally, we activated all the concepts in scenario 5 (full execution) with the expectation that it would make the best changes for every concept. On the contrary, it only presents the best influence to reduce the impacts of natural hazards (C4) and further promote Area-BCM (C9). Additionally, an effective Area-BCM (C28) could not be provoked. Therefore, we left a research gap to find further strategies that improve the influences on tiny-changed concepts in this study, such as collaboration (C21), information sharing (C23) and decision making (C25). However, this scenario provides an important finding that if all related concepts of Area-BCM are taken, the impacts of natural hazards can be reduced. Therefore, full execution strategies could be a promising route for the Area-BCM system that can minimize the impacts of disasters and lead to sustainable economic growth.
Finally, three scenarios provide the most motivation for concepts in Area-BCM. The simulations revealed that (i) strategies are more effective when there is government support (C1), top management commitment (C3), and a workshop (C11), (ii) workload is a barrier that impedes actions in Area-BCM, and (iii) concepts with high in-degree are less changed in simulations because they are sensitive. In this study, no single strategy will perfectly fulfill Area-BCM implementation in all aspects. Each strategy has advantages, disadvantages, and side effects in relation to the system. However, activating all concepts results in a significant decrease in natural hazards. Today, the question is whether the industrial sector, regional governments, and communities will work together to establish Area-BCM and survive mega-disasters or whether each stakeholder will work independently. One may ask: What could we benefit from participating in Area-BCM implementation? The results of this study indicate that the implementation of Area-BCM offers a communication channel among stakeholders to minimize the impacts of natural hazards. The remarkable attribute of Area-BCM over other disaster plans is prioritizing and managing common resources in the face of disaster [6].

6. Conclusions

We anticipate long-term economic growth despite natural disasters. The Area-BCM framework combines public and private sectors to promote disaster resilience and a sustainable economy. As a result, this study investigates the concepts and attempts to provide evidence to aid in Area-BCM implementation. The concepts to be studied are related to Area-BCM causes (drivers and barriers), actions, and impacts. Because Area-BCM concepts are associated with ambiguity, FCM is used to understand causal relationships between concepts and how the system would change if developed scenarios were activated. Because of the number of concepts and expert perceptions, the static analysis results show a complicated map of Area-BCM. However, in network analysis, centrality measures can describe the position of concepts. We found that top management commitment (C3) is a potential concept with the highest centrality degree and out-degree. The role of top management is to drive Area-BCM activities. Meanwhile, the highest in-degree on the map is for continuous improvement (C19). It indicates the importance of supporting it in order to keep Area-BCM alive. The dynamic analysis simulates the performing inference with R Studio using the modified Kosko equation. The baseline scenario indicates the potential of Area-BCM implementation to decrease the impacts of natural hazards. Scenario analysis depicts that scenario 1 (i.e., promoting Area-BCM) increases risk perception (C22) over other scenarios. Hence, the first strategy is to apply concepts in scenario 1 to create the perception of risk for stakeholders. Since there is a risk perception, stakeholders may tend to participate in the Area-BCM process. Next, scenario 3 influences the highest increase in mainly action concepts, i.e., workshops (C11) and identifying stakeholders (C12). The previous study mentioned a lack of human resources as a barrier to developing BCP, but we found that the collaboration scenario can alleviate this problem and enhance Area-BCM activities. Meanwhile, it also drives the communication channel (C24) to the most significant change. Thus, a second collaboration strategy is proposed. The impact of natural hazards (C4) is lowest reduced in scenario 5; then, we provide the third strategy. To imply this, simulations indicated the impacts of Area-BCM in mitigating natural hazards, where this framework could be a positive sign for sustainable economic growth. The study’s key findings are that the three proposed strategies will be effective when top management commitment, government support, and workshops are combined. Moreover, the hidden relationships that workload impedes Area-BCM implementation are revealed. According to the results, the paths to success in Area-BCM implementation are (i) to focus on the notable concepts in a map (top management commitment and continuous improvement) and (ii) to develop strategies based on the identified concepts from three significant scenarios.
The current study has the limitation that only some concepts can be enhanced by the defined scenarios. Therefore, future studies should investigate more strategies to improve concepts that present tiny changes in this study. For example, what strategy could influence risk assessment and information sharing and eliminate a workload barrier? Furthermore, it should be noted that the model in this study is developed based on experts’ perceptions. The model’s nature is to compare concepts under different scenarios for strategy development, but concepts cannot be evaluated quantitatively. We suggest adding quantitative concepts to run simulations based on numeric data and integrating with a new method to expand a pure perception model to a quantitative one.

Author Contributions

Conceptualization, K.M. and K.W.; methodology, K.M.; software, K.M.; validation, K.M.; formal analysis, K.M.; investigation, K.M. and K.W.; resources, K.M. and K.W.; data curation, K.M.; writing—original draft preparation, K.M.; writing—review and editing, K.W.; visualization, K.M.; supervision, K.W. All authors have read and agreed to the published version of the manuscript.

Funding

This research received no external funding.

Institutional Review Board Statement

Not applicable.

Informed Consent Statement

Informed consent was obtained from all subjects involved in the study.

Data Availability Statement

The data presented in this study are available upon request from the corresponding author. The data are not publicly available due to data privacy restriction.

Acknowledgments

This research was supported by the Science and Technology Research Partnership for Sustainable Development (SATREPS) in collaboration between Japan Science and Technology Agency (JST, JPMJSA1708) and Japan International Cooperation Agency (JICA). Authors would like to thank all experts in this study.

Conflicts of Interest

The authors declare no conflict of interest.

Appendix A

Table A1. Initial weight matrix.
C1C2C3C4C5C6C7C8C9C10C11C12C13C14C15C16C17C18C19C20C21C22C23C24C25C26C27C28
C1001−0.80.80000.70.80000000010100.800000
C2001000.60000.80.800010.8001100000.6100
C3000000.60000.810000.710.80.81110100.6100
C40000−0.6000.40000000000000000−0.8000
C50000000000000000000000000.8000
C600−0.8000100000000000−0.6000000000
C700−0.80000000−0.40000000−1000000000
C800−0.20000000000000000000000−0.60−0.6
C9000000.60000.8000000000000.60.600000
C1000000000.600000.60.80000000.60000000
C110000000000.800.8000.8000.900.870.80.80.60.60010.6
C1200000000000.600.600000000000.60000
C13000000.60000000000.80.600000001000
C14000000.60000000010.9001110000.6100
C150000000000000000.6000000000000
C16000−0.70000000000000.80000.601010.800
C17000000.600.4000000000000.60.60000000
C18000000−0.4000000000000.60000.60000.80
C19000.4000.40−0.700000000.8000000000000.8
C200000000000.8000.80000000000.800000.8
C21000000−0.6000.60000.400.80010000.60.600.600.8
C220.80.60.60000000.80000.6000000000.600.8000
C230000000000.6000.6000000000.6000.800.80.8
C2400000000000000000000.60.800.7300000
C25000−0.8000000000000000000000001
C26000000.60000000000000.6000000.2000
C27000000000000000000100.60000.8000.6
C28000−0.80.800000000000000000000000

References

  1. Tokunaga, S.; Resosudarmo, B.P. Spatial economic modelling of Megathrust Earthquake in Japan. In New Frontiers in Regional Science: Asian Perspectives; Springer: Singapore, 2017. [Google Scholar]
  2. World Bank. Infrastructure Rehabilitation. In Learning from Megadisasters: Lessons from the Great East Japan Earthquake; Ranghieri, M., Ishiwatari, F., Eds.; The World Bank: Washington, DC, USA, 2014. [Google Scholar]
  3. World Bank. Thai Floods 2011: Rapid Assessment for Resilient Recovery and Reconstruction Planning; The World Bank: Bangkok, Thailand, 2012. [Google Scholar]
  4. Haraguchi, M.; Lall, U. Flood risks and impacts: A case study of Thailand’s floods in 2011 and research questions for supply chain decision making. Int. J. Disaster Risk Reduct. 2015, 14, 256–272. [Google Scholar] [CrossRef]
  5. Meechang, K.; Watanabe, K.; Ino, E. The Successes and Challenges of Disaster Response: Practices in Thailand Industrial Areas. In Proceedings of the 18th Annual Meeting of the Asia Oceania Geosciences Society (AOGS 2021), Singapore, 1–6 August 2022. [Google Scholar]
  6. Baba, H.; Watanabe, T.; Nagaishi, M.; Matsumoto, H. Area Business Continuity Management, a New Opportunity for Building Economic Resilience. Procedia Econ. Financ. 2014, 18, 296–303. [Google Scholar] [CrossRef]
  7. Japan International Cooperation Agency. Planning Guide for Area Business Continuity: Area BCM Toolkits: Main Volume; Japan International Cooperation Agency: OYO International Corp.: Mitsubishi Research Institute, Inc.: CTI Engineering In-ternational Co., Ltd.: Tokyo, Japan, 2015.
  8. Baba, H.; Adachi, I.; Takabayashi, H.; Nagatomo, N.; Nakasone, S.; Matsumoto, H.; Shimano, T. Introductory study on Disaster Risk Assessment and Area Business Continuity Planning in industry agglomerated areas in the ASEAN. J. Disaster Risk Manag. 2013, 3, 184–195. [Google Scholar] [CrossRef]
  9. ADPC. Nutural Disaster Risk Assessment and Area Business Continuity Plan Formulation; Asian Disaster Preparedness Center: Bangkok, Thailand, 2017. [Google Scholar]
  10. Reed, M.S. Stakeholder participation for environmental management: A literature review. Biol. Conserv. 2008, 141, 2417–2431. [Google Scholar] [CrossRef]
  11. Shokouhyar, S.; Pahlevani, N.; Mir Mohammad Sadeghi, F. Scenario analysis of smart, sustainable supply chain on the basis of a fuzzy cognitive map. Manag. Res. Rev. 2019, 43, 463–496. [Google Scholar] [CrossRef]
  12. Kumar, N.; Mathiyazhagan, K.; Mathivathanan, D. Modelling the interrelationship between factors for adoption of sustainable lean manufacturing: A business case from the Indian automobile industry. Int. J. Sustain. Eng. 2020, 13, 93–107. [Google Scholar] [CrossRef]
  13. Rajak, S.; Parthiban, P.; Dhanalakshmi, R. Analysing barriers of sustainable transportation systems in India using Grey-DEMATEL approach: A supply chain perspective. Int. J. Sustain. Eng. 2021, 14, 419–432. [Google Scholar] [CrossRef]
  14. Sapapthai, S.; Leelawat, N.; Tang, J.; Kodaka, A.; Ino, E. Success Factors of Business Continuity Management Implementation Using Analytic Hierarchy Process—A case study of an automotive part company in Ayutthaya Province, Thailand. In Proceedings of the 2021 3rd International Conference on Management Science and Industrial Engineering, Osaka, Japan, 2–4 April 2021. [Google Scholar]
  15. Montshiwa, A.L.; Nagahira, A.; Ishida, S. Modifying business continuity plan (BCP) towards an effective auto-mobile business continuity management (BCM): A quantitative approach. J. Disaster Res. 2016, 11, 691–698. [Google Scholar] [CrossRef]
  16. Meechang, K.; Watanabe, K. Implementing Area Business Continuity Management for Large-Scale Disaster: A Total Interpretive Structural Modeling Approach. J. Disaster Res. 2023, 18, 513–523. [Google Scholar] [CrossRef]
  17. Barbrook-Johnson, P.; Penn, A.S. Fuzzy Cognitive Mapping. In Systems Mapping: How to Build and Use Causal Models of Systems; Springer: Berlin/Heidelberg, Germany, 2022. [Google Scholar]
  18. Felix, G.; Nápoles, G.; Falcon, R.; Froelich, W.; Vanhoof, K.; Bello, R. A review on methods and software for fuzzy cognitive maps. Artif. Intell. Rev. 2019, 52, 1707–1737. [Google Scholar] [CrossRef]
  19. Groumpos, P.P. Modelling business and management systems using fuzzy cognitive maps: A critical overview. IFAC-PapersOnLine 2015, 48, 207–212. [Google Scholar] [CrossRef]
  20. Papageorgiou, K.; Singh, P.K.; Papageorgiou, E.; Chudasama, H.; Bochtis, D.; Stamoulis, G. Fuzzy cognitive map-based sustainable socio-economic development planning for rural communities. Sustainability 2019, 12, 305. [Google Scholar] [CrossRef]
  21. Mehryar, S.; Surminski, S. Investigating flood resilience perceptions and supporting collective decision-making through fuzzy cognitive mapping. Sci. Total Environ. 2022, 837, 155854. [Google Scholar] [CrossRef]
  22. Bevilacqua, M.; Ciarapica, F.E.; Marcucci, G.; Mazzuto, G. Fuzzy cognitive maps approach for analysing the domino effect of factors affecting supply chain resilience: A fashion industry case study. Int. J. Prod. Res. 2020, 58, 6370–6398. [Google Scholar] [CrossRef]
  23. Büyüközkan, G.; Vardaloğlu, Z. Analyzing of CPFR success factors using fuzzy cognitive maps in retail industry. Expert Syst. Appl. 2012, 39, 10438–10455. [Google Scholar] [CrossRef]
  24. Kosko, B. Adaptive inference in fuzzy knowledge networks. In Readings in Fuzzy Sets for Intelligent Systems; Morgan Kaufmann: San Francisco, CA, USA, 1993; pp. 888–891. [Google Scholar]
  25. Singh, P.K.; Chudasama, H. Pathways for climate resilient development: Human well-being within a safe and just space in the 21st century. Glob. Environ. Change 2021, 68, 102277. [Google Scholar] [CrossRef]
  26. Azadeh, A.; Salehi, V.; Arvan, M.; Dolatkhah, M. Assessment of resilience engineering factors in high-risk environments by fuzzy cognitive maps: A petrochemical plant. Saf. Sci. 2014, 68, 99–107. [Google Scholar] [CrossRef]
  27. Nápoles, G.; Papageorgiou, E.; Bello, R.; Vanhoof, K. On the convergence of sigmoid fuzzy cognitive maps. Inf. Sci. 2016, 349, 154–171. [Google Scholar] [CrossRef]
  28. Özesmi, U.; Özesmi, S.L. Ecological models based on people’s knowledge: A multi-step fuzzy cognitive mapping approach. Ecol. Modell. 2004, 176, 43–64. [Google Scholar] [CrossRef]
  29. Meechang, K.; Leelawat, N.; Tang, J.; Ino, E.; Kodaka, A.; Chintanapakdee, C.; Watanabe, K. Affecting factors on perceived usefulness of area-business continuity management: A perspective from employees in industrial areas in Thailand. In Proceedings of the IOP Conference Series: Earth and Environmental Science, Sendai, Japan, 7–8 November 2019. [Google Scholar]
  30. Kodaka, A.; Leelawat, N.; Ino, E.; Tang, J.; Park, J.; Kohtake, N. The Impact of Employee Behavior on Business Continuity at an Industrial Complex. In Proceedings of the 2021 IEEE International Symposium on Systems Engineering (ISSE), Veinna, Austria, 13 September–13 October 2021. [Google Scholar]
  31. Dickerson, J.A.; Kosko, B. Virtual worlds as fuzzy cognitive maps. Presence Teleoperators Virtual Environ. 1994, 3, 173–189. [Google Scholar] [CrossRef]
  32. Papageorgiou, E.; Stylios, C.; Groumpos, P. Fuzzy cognitive map learning based on nonlinear Hebbian rule. In Proceedings of the AI 2003: Advances in Artificial Intelligence: 16th Australian Conference on AI, Perth, Australia, 3–5 December 2003. [Google Scholar]
  33. Chen, C.T.; Chiu, Y.T. A study of dynamic fuzzy cognitive map model with group consensus based on linguistic variables. Technol. Forecast. Soc. Change 2021, 171, 120948. [Google Scholar] [CrossRef]
  34. Nápoles, G.; Espinosa, M.L.; Grau, I.; Vanhoof, K. FCM expert: Software tool for scenario analysis and pattern classification based on fuzzy cognitive maps. Int. J. Artif. Intell. Tools 2018, 27, 1860010. [Google Scholar] [CrossRef]
  35. Yager, R.R.; Kacprzyk, J. The Ordered Weighted Averaging Operators: Theory and Applications; Springer Science & Business Media: New York, NY, USA, 2012. [Google Scholar]
  36. Mourhir, A.; Papageorgiou, E.I.; Kokkinos, K.; Rachidi, T. Exploring precision farming scenarios using fuzzy cognitive maps. Sustainability 2017, 9, 1241. [Google Scholar] [CrossRef]
  37. Carvalho, J.P.; Tomé, J.A.B. Rule Based Fuzzy Cognitive Maps in Socio-Economic Systems. In Proceedings of the IFSA/EUSFLAT Conference, Lisbon, Portugal, 20–24 July 2009; pp. 1821–1826. [Google Scholar]
  38. Gray, S.R.J.; O’Mahony, C.; O’Dwyer, B.; Gray, S.A.; Gault, J. Caught by the fuzz: Using FCM to prevent coastal adaptation stakeholders from fleeing the scene. Mar. Policy 2019, 109, 103688. [Google Scholar] [CrossRef]
  39. Wasserman, S.; Faust, K. Social Network Analysis: Methods and Applications; Cambridge University Press: Cambridge, UK, 1994. [Google Scholar]
  40. Papageorgiou, E.; Kontogianni, A. Using fuzzy cognitive mapping in environmental decision making and management: A methodological primer and an application. In International Perspectives on Global Environmental Change; Stephen, S.Y., Steven, E.S., Eds.; InTech: Rijeka, Croatia, 2021; pp. 427–450. [Google Scholar]
  41. Stach, W.; Kurgan, L.; Pedrycz, W. A Survey of Fuzzy Cognitive Map Learning Methods. Available online: http://128.172.132.65/papers/chapterSurveyFCM2003.pdf (accessed on 2 April 2023).
  42. Nápoles, G.; Grau, I.; León, M.; Grau, R. Modelling, aggregation and simulation of a dynamic biological system through Fuzzy Cognitive Maps. In Proceedings of the Advances in Computational Intelligence: 11th Mexican International Conference on Artificial Intelligence, MICAI 2012, San Luis Potosí, Mexico, 27 October–4 November 2012. [Google Scholar]
  43. World Bank. Resilient Industries in Japan: Lessons Learned in Japan on Enhancing Competitive Industries in the Face of Disasters Caused by Natural Hazards; The World Bank: Washington, DC, USA, 2020. [Google Scholar]
  44. Kodaka, A.; Leelawat, N.; Watanabe, K.; Park, J.; Tang, J.; Ino, E.; Kohtake, N. Industrial Area Business Continuity Management Exercise: An Experimental Validation for Flood in Thailand. J. Disaster Res. 2022, 17, 853–860. [Google Scholar] [CrossRef]
  45. Falcone, P.M.; Lopolito, A.; Sica, E. The networking dynamics of the Italian biofuel industry in time of crisis: Finding an effective instrument mix for fostering a sustainable energy transition. Energy Policy 2018, 112, 334–348. [Google Scholar] [CrossRef]
  46. Japan Cabinet Office, 2019 Survey of BCP Development and Disaster Reduction Measures within Companies. 2021. Available online: https://www.pref.kyoto.jp/kikikanri/documents/bcpjissekityousagaiyou.pdf (accessed on 10 March 2023).
  47. Kakinuma, D.; Miyamoto, M.; Nakamura, Y.; Sriariyawat, A.; Visessri, S. Development of an Inundation Model for Creating Industrial Park-Scale Risk Information for Area-BCM. J. Disaster Res. 2022, 17, 877–888. [Google Scholar] [CrossRef]
  48. Kodaka, A.; Ono, T.; Watanabe, K.; Leelawat, N.; Chintanapakdee, C.; Tang, J.; Kohtake, N. A dependent activities elicitation method for designing area business continuity management. In Proceedings of the 2020 IEEE International Symposium on Systems Engineering (ISSE), Vienna, Austria, 12 October–12 November 2020. [Google Scholar]
  49. Dikopoulou, Z.; Papageorgiou, E.; Jetter, A.; Bochtis, D. Open source tool in R language to estimate the inference of the Fuzzy Cognitive Map in environmental decision making. In Proceedings of the 9th International Congress on Environmental Modelling and Software, Ft. Collins, CO, USA, 24–28 June 2018. [Google Scholar]
  50. Gray, S.A.; Gray, S.; Cox, L.J.; Henly-Shepard, S. Mental modeler: A fuzzy-logic cognitive mapping modeling tool for adaptive environmental management. In Proceedings of the 2013 46th Hawaii International Conference on System Sciences, Maui, HI, USA, 7–10 January 2013. [Google Scholar]
  51. Bastian, M.; Heymann, S.; Jacomy, M. Gephi: An open source software for exploring and manipulating networks. In Proceedings of the International AAAI Conference on Web and Social Media, San Jose, CA, USA, 17–20 May 2009. [Google Scholar]
  52. Landherr, A.; Friedl, B.; Heidemann, J. A critical review of centrality measures in social networks. Bus. Inf. Syst. Eng. 2010, 2, 371–385. [Google Scholar] [CrossRef]
  53. Falcone, P.M.; De Rosa, S.P. Use of fuzzy cognitive maps to develop policy strategies for the optimization of municipal waste management: A case study of the land of fires (Italy). Land Use Policy 2020, 96, 104680. [Google Scholar] [CrossRef]
  54. Barbara, M. Determining the Critical Success Factors of an Effective Business Continuity: Disaster Recovery Program in a Post 9/11 World: A Multi-Method Approach. Master’s Thesis, Concordia University, Montreal, QC, Canada, 2006. [Google Scholar]
Figure 1. The development process of fuzzy cognitive map (FCM).
Sustainability 15 13531 g001
Figure 2. A mind map of the n -th expert. Area-BCM, area business continuity management; Area-BIA, area business impact analysis.
Sustainability 15 13531 g002
Figure 3. The area business continuity management (Area-BCM) cycle, adapted from [6,7].
Sustainability 15 13531 g003
Figure 4. Aggregated fuzzy cognitive map (FCM).
Sustainability 15 13531 g004
Figure 5. Iterative calculation of fuzzy cognitive map (FCM).
Sustainability 15 13531 g005
Figure 6. Percentage of change for concept values of (a) causes, (b) actions 2, and (c) impacts in five scenarios.
Sustainability 15 13531 g006
Figure 7. Fuzzy cognitive map-based strategies for area business continuity management (Area-BCM) implementation.
Sustainability 15 13531 g007
Table 2. Centrality degrees and state values of each concept.
ConceptsOut-DegreeIn-DegreeCentralityBase ScenarioScenario 1Scenario 2Scenario 3Scenario 4Scenario 5
IVFVIVFVIVFVIVFVIVFVIVFV
C16.900.807.7000.829510.829510.829510.829500.829510.8295
C28.600.609.2000.795800.795810.795810.795800.795810.7958
C311.304.8016.1000.879810.880010.880010.880110.880010.8800
C41.803.104.9010.051810.051810.051810.051810.051810.0518
C50.802.203.0000.912300.912400.912300.912300.912310.9124
C62.404.607.0000.994400.994500.994500.994500.994510.9945
C72.202.004.2000.666600.666500.666500.666500.666510.6665
C81.402.103.5000.739400.739400.739400.739410.739410.7394
C92.600.703.3000.798810.798900.798900.798900.798910.7989
C102.606.809.4000.999200.999210.999200.999200.999210.9992
C118.572.8011.3700.935910.936110.936010.936110.936010.9360
C121.800.802.6000.828800.828900.828900.828900.828810.8289
C133.002.605.6000.969600.969610.969600.969600.969610.9696
C147.101.808.9000.937100.937110.937100.937100.937110.9371
C150.603.504.1000.983400.983400.983400.983400.983410.9834
C164.905.7010.6000.998200.998200.998200.998200.998210.9982
C172.202.204.4000.954300.954300.954300.954300.954310.9543
C182.401.704.1000.921800.921900.921900.921910.921910.9219
C193.108.8011.9000.998200.998200.998200.998210.998210.9982
C203.205.078.2700.996100.996110.996100.996100.996110.9961
C216.007.0013.0000.999400.999400.999410.999400.999410.9994
C224.802.006.8000.940910.941000.941000.941000.941010.9410
C234.207.3311.5300.999600.999600.999610.999600.999610.9996
C242.131.803.9300.930100.930100.930110.930100.930110.9301
C251.808.009.8000.999600.999600.999600.999600.999610.9996
C261.405.006.4000.989600.989600.989600.989610.989610.9896
C273.002.605.6000.969010.969000.969000.969000.969010.9690
C281.606.007.6000.997200.997200.997200.997200.997210.9972
IV stands for initial value; FV stands for final value.
Disclaimer/Publisher’s Note: The statements, opinions and data contained in all publications are solely those of the individual author(s) and contributor(s) and not of MDPI and/or the editor(s). MDPI and/or the editor(s) disclaim responsibility for any injury to people or property resulting from any ideas, methods, instructions or products referred to in the content.

