Abstract
The random distribution of a complex joint network within a coal–rock mass has a significant weakening effect on its bearing capacity, making the surrounding rock of the roadway highly susceptible to instability and failure under the influence of in situ stress and mining-induced stress. This poses challenges in controlling the surrounding rock and seriously affects the normal production of mines. Consequently, it is imperative to conduct stability analysis on complex jointed roadway surrounding rock. Therefore, taking the transport roadway of Panel 11030 in the Zhaogu No. 2 Coal Mine as a case study, the microscopic contact parameters of particles and joint surfaces in each rock layer were calibrated through uniaxial compression and shear simulation tests using the particle flow simulation software PFC2D 5.0. Based on the calibrated microscopic contact parameters, a multilayered roadway surrounding rock model containing complex joints was established, and the joint density was quantified to analyze its effects on the displacement field, stress field, force chain field, and energy field of the roadway surrounding rock. The research findings indicate that as the distance to the sidewall decreases, the impact of joint density on the deformation of the surrounding rock of the roadway increases. The displacement of the roadway roof, floor, and sidewalls is affected differently by the joint density, predominantly contingent upon the properties of the rock mass. During the process of stress redistribution in the surrounding rock, the vertical stress of the roof and floor is released more intensively compared to the horizontal stress, while the horizontal stress of the sidewalls is released more intensively compared to the vertical stress. The increase in joint density leads to an increasing release rate of the surrounding rock stress, causing the load-bearing rock mass to transfer towards the deeper part. As the joint density increases, the force chain network gradually transitions from dense to sparse, resulting in a decrease in strong force chains and a decline in the bearing capacity of the surrounding rock, accompanied by an expansion in the range of force chain failure and deformation. With the continuous increase in joint density, the values of maximum released kinetic energy and residual released kinetic energy become larger. Once the joint density reaches a certain threshold, the kinetic energy stability zone consistently maintains a high energy level, indicating extreme instability in the roadway and sustained deformation. The results provide a valuable insight for analyzing the failure mechanism of complex jointed roadway surrounding rock and implementing corresponding support measures.
1. Introduction
A coal–rock mass is influenced by long-term tectonic activities, resulting in the random distribution of various defects such as structural planes and fractures with different characteristics. The presence of these defects gives rise to a complex joint network, which significantly impairs the bearing capacity of the coal–rock mass [1,2,3]. As a result, the roadway surrounding rock is prone to instability and failure under the influence of in situ stress and mining-induced stress; this poses difficulties in the stability analysis, support design, and control of the surrounding rock, seriously affecting the normal production of mines [4,5,6]. Hence, undertaking stability analysis of complex jointed roadway surrounding rock holds tremendous theoretical significance and engineering value.
Investigations into the mechanical properties of jointed rock masses, serving as the basis for the stability analysis of complex jointed roadways, have been extensively pursued by scholars. Their research has demonstrated the profound influence of joints on the stability of roadway surrounding rock. Cao et al. [7] analyzed the mechanical characteristics and failure behavior of rock masses with different intersecting joint angles through combined physical experiments and numerical simulations, summarizing four different failure modes. Yang et al. [8] investigated the influence of joint angles, joint spacing, and joint overlap on the strength and failure modes of rock specimens, revealing that the joint angle had the most significant effect on the failure mode. Liu et al. [9] analyzed the fatigue fracturing characteristics of discontinuous jointed rock masses under cyclic loading conditions and compared them with static loading tests, revealing a more abrupt failure of specimens under the former conditions. Dou et al. [10] analyzed the influence of joint dip angle on the mechanical and energy characteristics of sandstone specimens and analyzed the failure shapes at different fracture interfaces using scanning electron microscopy. In summary, scholars have achieved numerous results in the study of the mechanical characteristics of jointed rock masses, laying a foundation for the stability analysis of complex jointed roadway surrounding rock.
Based on the aforementioned observations, scholars have conducted experimental and simulation analysis on complex jointed roadway surrounding rock [11,12,13]. Regarding physical experiments, Yang et al. [14] analyzed the mechanical characteristics and crack propagation behavior of specimens with cavities under different joint dip angle conditions to investigate the influence of joints on roadway stability, and they found that a dip angle of 90° had the least impact. Wang et al. [15] comprehensively examined the effects of roadway shape and fault dip angle on roadway damage, studying the initiation position and propagation path of cracks under the respective influences. Guo et al. [16] analyzed the deformation evolution process of layered jointed roadway surrounding rock models and found that the distribution of stress concentration zones in the surrounding rock is highly uneven due to the unique characteristics of layered joint structures.
However, indoor experiments possess inherent limitations, as they can only examine small-scale models of jointed roadway surrounding rock., Additionally, the restrictions imposed by the fabrication methods of joints, where the models have regular joint arrangements and a small number of joints, there are significant differences compared to actual engineering sites. Therefore, scholars have conducted numerical simulation analysis. Huang et al. [17] explored the influence of the position, dip angle, and thickness of weak interlayers on roadway stability and analyzed the relationship between the damaged zone and the aforementioned parameters based on simulation results, providing references for roadway support design. Li et al. [18] compared and analyzed the deformation of jointed roadway surrounding rock under different stress conditions. Xiong and Tao [19,20] both studied the stability of inclined coal–rock layer roadway surrounding rock and proposed corresponding support schemes by analyzing the deformation and failure of the roof, floor, and sidewalls. Lin et al. [21] examined the influence of the orientation, dip angle, and spacing of joints in a three-dimensional state on the stability of surrounding rock, providing references for the stability assessment and support optimization of roadway surrounding rock. He et al. [22] improved the discontinuous deformation analysis method to better simulate the deformation and failure process of jointed roadway surrounding rock, and the simulation results showed good agreement with actual engineering. In summary, scholars have employed a combination of laboratory experiments and numerical simulations to elucidate the unstable deformation process of jointed roadway surrounding rock from perspectives such as stress field, displacement field, and crack field. They have proposed corresponding support schemes based on the working conditions. However, most of the objects are roadway surrounding rock models with dominant joint surfaces, regular joint arrangements, and different joint angles, without considering the influence of complex joint networks on the strength and deformation of the surrounding rock. Therefore, it is imperative to figure out the influence of complex joints on the stability of roadway surrounding rock.
Based on this, this study takes the transport roadway of Panel 11030 in the Zhaogu No. 2 Coal Mine as a case study. With the assistance of the particle flow software PFC2D, a multilayered roadway surrounding rock model with complex joints is established, and the quantity of complex joints is quantified based on joint density. The influence of joint density on the displacement field, stress field, force chain field, and other aspects of the roadway surrounding rock under corresponding stress conditions is analyzed, elucidating the effect of joint density on the stability of complex jointed roadway surrounding rock.
2. Summary of Engineering Background
Zhaogu No. 2 Coal Mine is located in the southern foothills of the Taihang Mountains, in the eastern part of the Jiaozuo Coalfield, under the jurisdiction of Huixian City, Xinxiang. This study focuses on the transportation roadway of Panel 11030 in Zhaogu No. 2 Coal Mine for research purposes. The specific layout of the roadway is shown in Figure 1. The transportation roadway of Panel 11030 is excavated along the coal seam roof, with a designed cross-section dimension of 4.8 m × 3.3 m (width × height). The average thickness of the coal seam is 6.12 m, and the average compressive strength ranges from 15.7 to 25.4 MPa. The immediate roof is mainly composed of mudstone, with an average thickness of approximately 1.86 m and an average compressive strength ranging from 32.5 to 47.7 MPa. The basic roof is mainly composed of sandy mudstone, with an average thickness of approximately 21.92 m and an average compressive strength ranging from 43.7 to 48.1 MPa. The floor is mainly composed of sandy mudstone, with an average thickness of approximately 13.88 m and an average compressive strength ranging from 22.0 to 61.2 MPa [23].
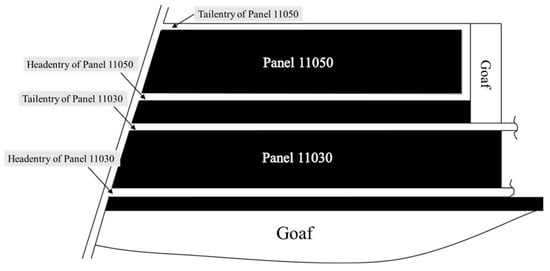
Figure 1.
Roadway layout plan.
Figure 2 shows the deformation of the transportation roadway in Panel 11030. Based on the previous investigations conducted by the research group, it was found that under the influence of in situ stress and mining-induced stress, the complex joint network inside the roadway surrounding rock leads to significant spatial non-uniformity in rock failure and frequent development of surface cracks. From the figure, it can be observed that the red circle indicates severe rock fragmentation, with numerous cracks in the roof, making it prone to roof collapse accidents. The green circle represents relatively intact rock masses. In certain sections of the roadway, the roof surrounding rock is severely fractured, and the sidewall surrounding rock is subject to significant inward squeezing, which can no longer meet the normal production requirements. Therefore, based on the problem of uncontrollable jointed roadway surrounding rock, this study investigates the influence of joint density on the stability of complex jointed roadway surrounding rock.

Figure 2.
Field monitoring of transportation roadway 11030.
3. Calibration and Construction of Parameters for the Complex Jointed Roadway Surrounding Rock Model
3.1. Calibration of Particle Micromechanical Parameters for the Surrounding Rock of the Roadway
In PFC (Particle Flow Code), the physical and mechanical behavior of materials is simulated through the contact constitutive relationship between particles. The micromechanical parameters between particles directly affect the macroscopic mechanical response of the material. Therefore, it is necessary to adjust the micromechanical contact parameters between particles repeatedly to make the mechanical characteristics of the material simulated by the model close to the actual material.
Before establishing the numerical model of the roadway surrounding rock using the PFC2D, this study first calibrated the micromechanical parameters and contact parameters of the particles based on the mechanical properties of each coal and rock strata of the roadway surrounding rock. Uniaxial compression simulation tests were conducted on standard rock specimens from each coal and rock strata. The micromechanical contact parameters between particles were adjusted through a trial-and-error method to obtain results that were consistent with indoor physical mechanical tests. Figure 3 and Figure 4 show the comparison between some stress–strain curves obtained from indoor tests and numerical simulation results. Table 1 and Table 2 present the adjusted micromechanical parameters of the particle flow model for the roadway surrounding rock.
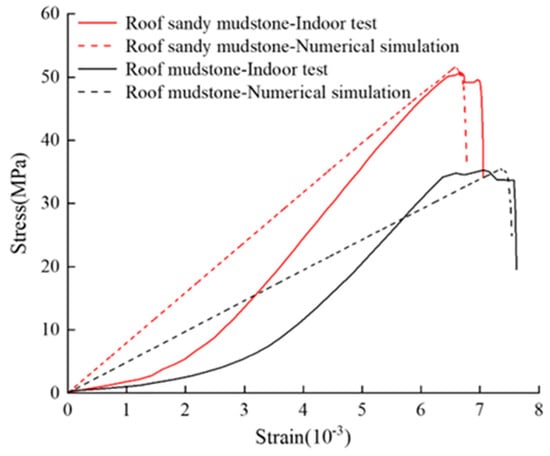
Figure 3.
Roof rock and numerical simulation stress−strain curve checking.
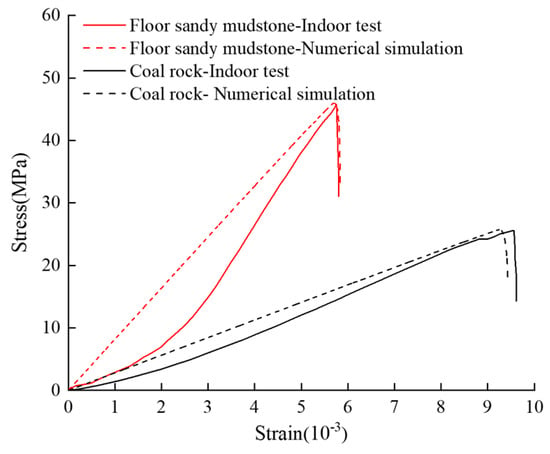
Figure 4.
Floor rock and numerical simulation stress−strain curve checking.

Table 1.
Microscopic parameters of roadway surrounding rock model.

Table 2.
Microscopic boundary parameters of roadway surrounding rock model.
3.2. Calibration of Micromechanical Parameters for Joint Surfaces
Using the Discrete Fracture Network (DFN) to characterize rock joint surfaces, the DFN is embedded in the bonded particle model, and corresponding contact models and contact parameters between the DFN and model particles are assigned to represent the mechanical properties of rock joint surfaces. The contact model at the joint surface adopts a smooth joint model, and a shear model with a planar joint surface is established based on the particle micro-contact parameters calibrated in Section 3.1. Shear simulation tests are conducted with normal stresses of 1 MPa, 2 MPa, 3 MPa, 4 MPa, and 5 MPa to calibrate the micro-parameters of the joint surface [24]. The experimental model is shown in Figure 5. The friction angles of the joint surfaces in the basic roof sandy mudstone, immediate roof mudstone, coal seam, and floor sandy mudstone are 40°, 35°, 31°, and 37°, respectively [23]. Figure 6, Figure 7, Figure 8 and Figure 9 represent the simulation results of direct shear tests on different coal–rock layers. It can be observed that as the normal stress increases, the peak shear force increases, and the difference between the simulated and actual friction angles of the structural plane is small. The micro-contact parameters of the simulated structural plane can be used for subsequent research. The calibrated micro-contact parameters of the joint surface are shown in Table 3.
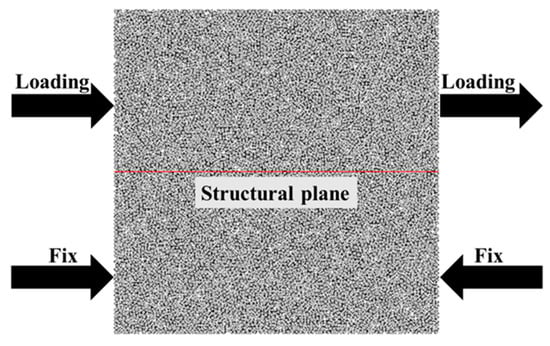
Figure 5.
Shear test model.
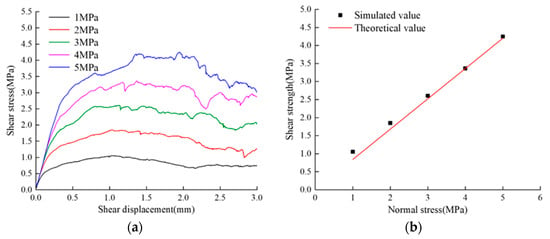
Figure 6.
Direct shear results of different normal stresses on the joint surface of basic roof sandy mudstone: (a) shear stress−displacement curve; (b) shear stress−normal stress linear fitting.
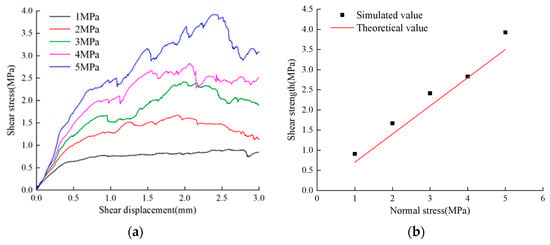
Figure 7.
Direct shear results of different normal stresses on the joint surface of immediate roof mudstone: (a) shear stress−displacement curve; (b) shear stress−normal stress linear fitting.
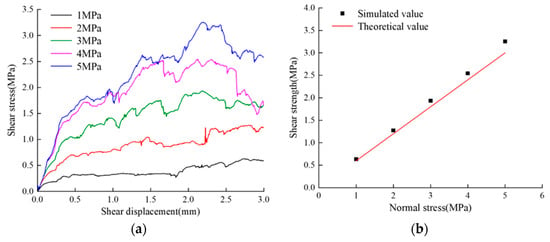
Figure 8.
Direct shear results of different normal stresses on the joint surface of coal seam: (a) shear stress−displacement curve; (b) shear stress−normal stress linear fitting.
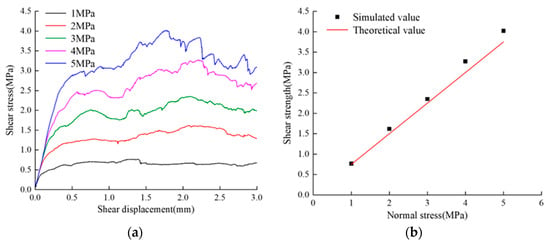
Figure 9.
Direct shear results of different normal stresses on the joint surface of immediate floor sandy mudstone: (a) shear stress−displacement curve; (b) shear stress−normal stress linear fitting.

Table 3.
Microscopic boundary parameters of joint.
3.3. Construction of Complex Jointed Roadway Surrounding Rock Model
As mentioned above, based on the calibrated particle micro-parameters and contact parameters described earlier, a numerical model of the roadway was established. The overall dimensions of the model were designed as 30 m × 35.95 m (width × height), and the dimensions of the rectangular roadway were prefabricated according to the actual size of 4.8 m × 3.3 m (width × height). The model was subjected to the original rock stress field (vertical stress of 15 MPa and horizontal stress of 12 MPa) using a servo mechanism, and the roadway was simulated for excavation.
The specific steps for establishing the excavation model of the roadway are as follows: Based on the particle and joint contact micro-parameters calibrated from the previous uniaxial compression tests and direct shear tests on joint surfaces, an intact rock model before excavation was constructed. Before excavation, the bottom wall was fixed, and then the upper wall and boundary walls were subjected to corresponding vertical and horizontal stresses through the servo program, allowing the model to achieve equilibrium under the influence of gravity and external forces, establishing the initial stress field of the original rock. Once the model reached initial equilibrium, the roadway was excavated using the DEL command. The complete roadway surrounding rock model after excavation and the roadway surrounding rock model with complex joints are shown in Figure 10 and Figure 11, respectively.
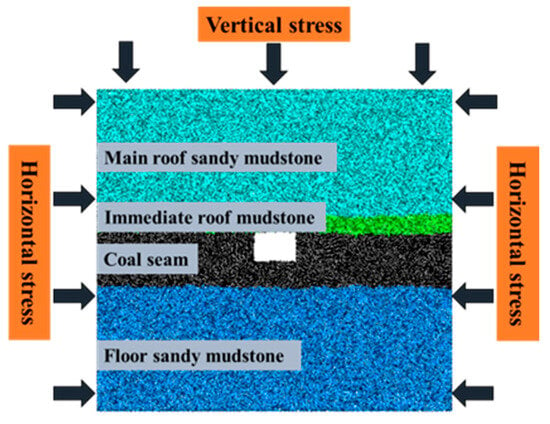
Figure 10.
Particle flow model of complete roadway surrounding rock.
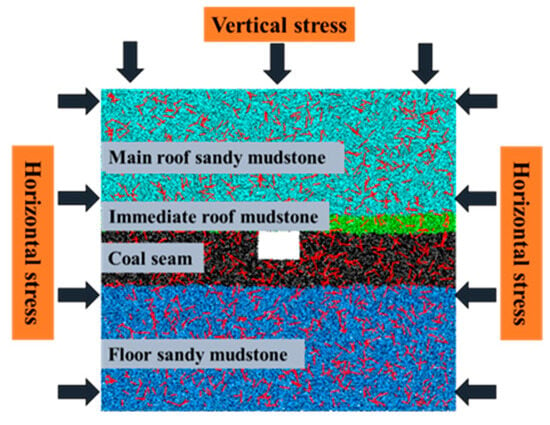
Figure 11.
Particle flow model of surrounding rock of jointed roadway.
4. Analysis of the Influence of Joint Density on the Stability of Roadway Surrounding Rock
To investigate the influence of joint density on the stability of roadway surrounding rock, joint density εf (the length of joint traces per unit area) was set to 0 m/m−2 (intact), 0.2 m/m−2, 0.4 m/m−2, 0.6 m/m−2, 0.8 m/m−2, and 1.0 m/m−2. For each level of complex joint roadway surrounding rock model, 15 samples were taken, and the average values of displacement and stress changes in the roadway surrounding rock were calculated as representative values for each joint density. The joint dip angles and positions were uniformly distributed, with a dip angle range of 0° to 180° and a joint trace length range of 0 m to 1.5 m. The roadway surrounding rock models with different joint densities are shown in Figure 12.
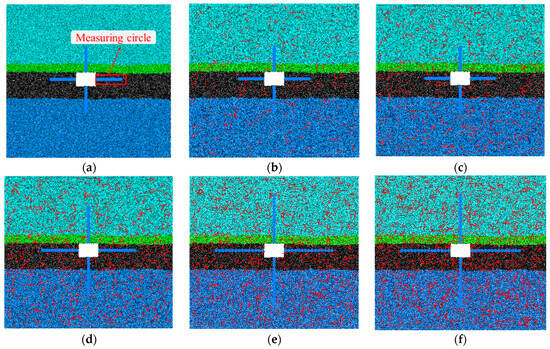
Figure 12.
Schematic diagram of roadway surrounding rock model with different joint densities: (a) joint density εf = 0 m/m−2; (b) joint density εf = 0.2 m/m−2; (c) joint density εf = 0.4 m/m−2; (d) joint density εf = 0.6 m/m−2; (e) joint density εf = 0.8 m/m−2; (f) joint density εf = 1.0 m/m−2.
By setting measuring lines on the roof, floor, and sidewalls, different numbers of measuring circles were placed on each measuring line to monitor the stress changes in the roadway surrounding rock in real time. This allowed for the analysis of the variation patterns of roadway surrounding rock stress with respect to joint density. For the models with joint densities εf = 0 to 0.4 m/m−2, 0.6 m/m−2, and 0.8 to 1.0 m/m−2, the measuring circles were located at distances of 0.4 to 6.0 m, 0.4 to 8.4 m, and 0.4 to 11.6 m from the roadway edge, respectively. The adjacent measuring circles had center-to-center intervals of 0.4 m, 0.6 m, and 0.8 m. The arrangement of measuring circles is shown in Figure 12. Since the measured stress of the measuring circles represents the average contact stress of the particles within the circle, a measuring circle radius of 0.4 m was chosen to ensure the accuracy of the measured stress and to avoid a measurement range that was too large to reflect the specific stress conditions of the surrounding rock at that location.
4.1. Analysis of Displacement Field Variation
By writing FISH language, particle displacements within a specified range were exported and their average displacement was calculated. This average displacement value represents the deformation of the surrounding rock at the central position within the specified range. Figure 13 illustrates the influence trend of joint density on the displacement field of roadway surrounding rock at the same depth from the sidewall. Through analysis, the following conclusions can be drawn:
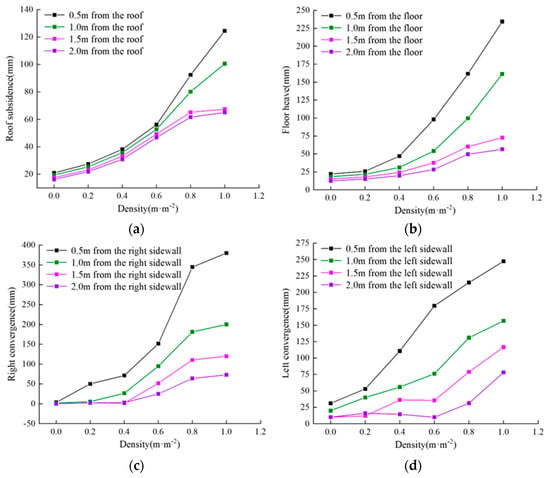
Figure 13.
Influence curve of joint density on displacement field of roadway surrounding rock: (a) the influence curve of joint density on roof subsidence at the same distance; (b) the influence curve of joint density on floor at the same distance; (c) the influence curve of joint density on the right sidewall convergence at the same distance; (d) the influence curve of joint density on the left sidewall convergence at the same distance.
- (1)
- With the location closer to the roadway sidewall, the impact of joint density on the deformation of the roadway surrounding rock becomes greater. The displacement values of the roadway roof, floor, and sidewalls are affected differently by joint density. From Figure 13c, it can be observed that as the joint density εf increases from 0 m/m−2 to 0.2 m/m−2, significant deformation first occurs in the sidewall of the roadway. The maximum displacement value of the right sidewall increases from 3 mm to 50 mm, an increase of 47 mm. From Figure 13b, it can be seen that when the joint density εf increases to 0.4 m/m−2, significant deformation subsequently occurs in the floor, with the maximum floor heave increasing to 46 mm. When the joint density εf increases to 1.0 m/m−2, the maximum displacements of the left and right sidewalls, roof, and floor reach 247 mm, 380 mm, 124 mm, and 234 mm, respectively. The convergence of the left and right sidewalls is 627 mm, and the convergence of the roof and floor is 358 mm. The analysis reveals the following reasons: as the roadway is excavated along the roof, both sidewalls and the floor consist of relatively weak coal layers, while the roof consists of mudstone and sandy mudstone. Therefore, the sidewalls and floor are the first to undergo significant deformation due to the influence of joint density, followed by the roof.
- (2)
- As the joint density increases, the main areas of deformation in the roadway surrounding rock extend from the shallow rock mass to the deep rock mass. Taking the deformation of the roadway sidewall as an example, from Figure 13c,d, it can be observed that when the joint density εf increases from 0 m/m−2 to 0.4 m/m−2, the main deformation of the right sidewall occurs at the 0–1.0 m range, while the main deformation of the left sidewall occurs at the 0–1.5 m range. When the joint density εf increases to 0.6 m/m−2, deformation of the surrounding rock starts at a distance of 2.0 m from the right sidewall, and the convergence of the right sidewall increases to 51 mm. When the joint density εf increases to 0.8 m/m−2, deformation of the surrounding rock begins at a distance of 2.0 m from the left sidewall, and the convergence increases to 31 mm. When the joint density εf increases to 1.0 m/m−2, the convergence of the surrounding rock from both sidewalls reaches 78 mm and 72 mm at a distance of 2.0 m from the sidewalls. It can be observed that the increase in joint density leads to a decrease in the overall bearing capacity of the roadway surrounding rock. Shallow rock mass deformation and damage are severe, and the load-bearing rock mass gradually transfers towards the surrounding rock.
Figure 14 illustrates the comprehensive displacement nephogram of the surrounding rock models with different joint densities after excavation of the roadway. By adjusting the range of particle displacements to analyze the influence of joint density on the displacement field, it can be observed from the figure that as the joint density continues to increase, the deformation range of the surrounding rock becomes larger, and the influence of joint density on the displacement field of the roadway surrounding rock becomes more significant. When the joint density εf increases from 0 m/m−2 to 1.0 m/m−2, under the combined effects of overlying strata pressure and joint-induced rock degradation, the deformation range of the roof surrounding rock significantly increases. At the same time, the surrounding rock gradually experiences rock loosening and detachment, leading to a sudden increase in local displacement and deformation.
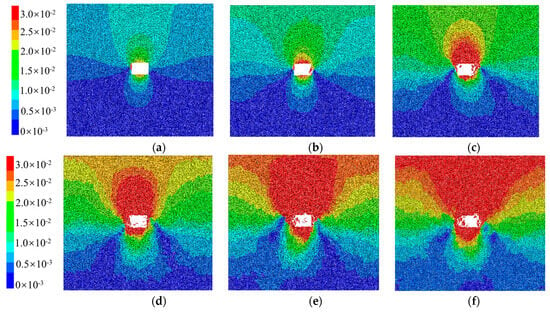
Figure 14.
Comprehensive displacement nephogram of roadway surrounding rock model with different joint densities: (a) 0 m/m−2; (b) 0.2 m/m−2; (c) 0.4 m/m−2; (d) 0.6 m/m−2; (e) 0.8 m/m−2; (f) 1.0 m/m−2.
4.2. Analysis of Stress Field Variation
In order to analyze the stress variation at different depths of the roadway surrounding rock more clearly, the stress release ratio λ [25] is introduced:
where σm is the stress before excavation in MPa, and σn is the stress after excavation stabilization in MPa.
By detecting the stress state of each measuring circle, the stress release ratio at various positions near the surrounding rock after roadway excavation is calculated. Figure 15 shows the relationship between the stress release ratio of the roadway surrounding rock and the distance from the sidewall when the joint density εf is 0.6 m/m−2. In the figure, λ is positive when the stress decreases, and λ is negative when the stress increases.
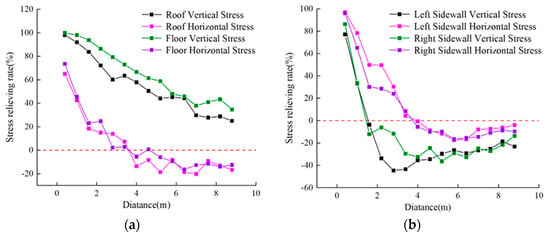
Figure 15.
Figure of stress release rate of surrounding rock at different depths after roadway excavation stability: (a) variation curve of stress release rate of roof and floor; (b) variation curve of stress release rate of two sides.
From Figure 15, the following can be observed:
- (1)
- During the process of stress redistribution in the roadway surrounding rock, the vertical stress of the roof and floor is released more significantly compared to the horizontal stress, while the horizontal stress of the sidewalls is released more significantly compared to the vertical stress. With the distance closer to the sidewall, the stress release ratio of the surrounding rock becomes greater. Taking the stress of the roof and floor surrounding rock as an example, when the distance from the sidewall is 1.0 m, the vertical stress release rate of the roof and floor are 92% and 98%, respectively, and the horizontal stress release rate are 42% and 46%; when the distance from the sidewall is 5.2 m, the vertical stress release rate of the roof and floor are 44% and 59%, respectively, and the horizontal stress release rate are −18% and −6%. It can be seen that with the increasing depth from the sidewall, the vertical stress of the roof remains in a release state, while the roof and floor show a zone of increased horizontal stress.
- (2)
- The horizontal stress of the roof and floor, as well as the vertical stress and horizontal stress of the sidewalls, gradually change from positive values to negative values, indicating a continuous zone of stress increase for the horizontal stress of the roof, the vertical stress of the sidewalls, and the horizontal stress of the sidewalls with increasing depth from the sidewall. When the distance from the sidewall is approximately 1.6 m, both sidewalls show a zone of increased vertical stress, with stress release ratios reaching −3.7% and −12.1%, respectively. When the distance from the sidewall is approximately 4 m, the surrounding rock shows a zone of increased horizontal stress, with the horizontal stress release rate of the sidewalls being −0.6% and −5.6%, respectively, and the horizontal stress release rate of the roof and floor being −13.6% and −5.5%, respectively.
In order to explore the variation in stress release rate with increasing joint density, the vertical stress of the roof and floor and the horizontal stress of the sidewalls at the same location were monitored. Figure 16a represents the variation in stress release rate of the surrounding rock with joint density at a distance of 2.8 m from the sidewall. From the figure, it can be observed that the increase in joint density results in a decrease in the overall bearing capacity of the surrounding rock. The vertical stress release rate of the roof and floor and the horizontal stress release rate of the sidewalls show a continuous increasing trend. When the joint density increases from 0 m/m−2 to 1.0 m/m−2, the vertical stress release rate of the roof and floor increases from 63% and 65% to 78% and 92%, respectively, while the sidewalls change from the zone of stress increase to the zone of stress release, with an increase from −8% and −15% to 35% and 60%, respectively. It can be seen that with the continuous increase in joint density, the stress release rate of the surrounding rock keeps increasing, and the bearing rock mass of the roadway surrounding rock is transferred to deeper regions.
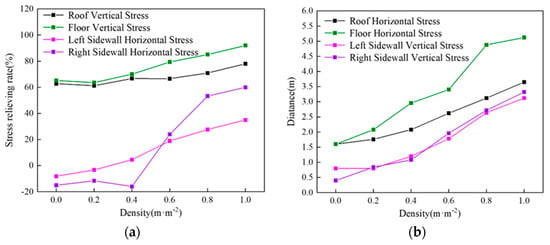
Figure 16.
The influence of joint density on the stress release rate of surrounding rock and initial position of stress raising zone (a) variation curve of stress release rate; (b) variation curve of initial position.
By monitoring the horizontal stress of the roof and floor and the vertical stress of the sidewalls through measuring circles, the influence of joint density on the initial position of the stress increase zone is analyzed. As shown in Figure 16b, joint density significantly affects the initial position of the stress increase zone of the horizontal stress of the roof and floor and the vertical stress of the sidewalls. With the increase in joint density, the stress increase zone gradually shifts towards the deeper rock mass. When the joint density εf increases from 0 m/m−2 to 1.0 m/m−2, the stress increase zone of the horizontal stress of the roof and floor extends from a distance of 1.6 m from the roadway wall to 3.65 m and 5.12 m from the roadway wall, respectively, and the vertical stress increase zone of the sidewalls extends from distances of 0.8 m and 0.4 m from the roadway wall to 3.12 m and 3.32 m from the roadway wall, respectively. In conclusion, with the increase in joint density, the decrease in the bearing capacity of the surrounding rock requires deeper rock mass to support its stability.
4.3. Analysis of Force Chain Field Variation
In PFC (Particle Flow Code), force chains serve as pathways for stress transmission and possess certain bearing characteristics [26]. During the process of roadway excavation, it is inevitable that the force chain of the surrounding rock will undergo adjustments and changes. By analyzing the distribution morphology of the force chain in the surrounding rock with joint density εf = 0.6 m/m−2, the evolutionary characteristics of the force chain in the surrounding rock are studied. The evolutionary characteristics of the surrounding rock force chain at different time steps after roadway excavation are shown in Figure 17. With thicker force chains and darker colors, the contact force between particles increases; with thinner force chains and lighter colors, the contact force between particles decreases.

Figure 17.
Evolution characteristics of force chain after roadway excavation: (a) time step = 0 s; (b) time step = 0.061 s; (c) time step = 0.123 s.
From Figure 17a, it can be observed that in the original state of rock stress (time step = 0 s), the overall surrounding rock is influenced by both vertical and horizontal stresses, and the distribution of contact forces is crisscrossed, with a relatively uniform distribution of force chain. After the excavation of the roadway (time step > 0), the equilibrium state of the surrounding rock stress is disrupted, and the rock particles undergo movement and deformation, causing changes in the network of force chains. The force chain around the sidewall fractures, and the roof, floor, and sidewalls deform. At time step 0.061 s, the force chain network gradually evolves into an arch-shaped force chain, as shown in Figure 17b. The strong force chain zone in the upper horizontal direction of the roof has transformed into a distinctively directional arch-shaped strong force chain, supporting the load of the upper rock layers. At time step 0.123 s, as shown in Figure 17c, the stress state of the surrounding rock has reached a new equilibrium. Due to the weaker rock strata in the coal seam, the range of force chain fractures in the sidewalls and floor is significantly different from that of the roof. At this time, the entire surrounding rock of the roadway is enveloped within a strong force chain arch.
To investigate the influence of joint density on the force chain field of the surrounding rock after roadway excavation, the distribution morphology of force chain in the surrounding rock of the roadway under different joint densities was obtained, as shown in Figure 18. From the figure, it can be observed that the presence of joints weakens the overall bearing capacity of the surrounding rock. With the increase in joint density, the distribution of force chain networks gradually transitions from dense to sparse, and the strong force chain networks decrease. As a result, the overall bearing capacity of the surrounding rock decreases, and the range of force chain damage and deformation in the sidewalls increases. The influence of joint density on the failure depth of force chain is analyzed by calculating the distance between roadway wall and strong force chain arch. When the joint density εf = 0 m/m−2, the roof and floor of the surrounding rock experience damage, with force chain damage depths of 2.1 m and 2.8 m, respectively, which is equal to the thickness of the immediate roof mudstone and immediate floor coal seam. The sidewalls, as the main load-bearing zone of the surrounding rock, experience stress concentration. When the joint density εf = 0.8 m/m−2, the strong force chain network, which plays a major load-bearing role in the roadway surrounding rock, significantly decreases. The damage to the force chain network in the roof and floor intensifies, and the force chain deformation in the sidewalls becomes evident, with the damage depths of the left and right sidewalls being 2.25 m and 1.92 m, respectively. When the joint density increases to 1.0 m/m−2, the degree of damage to the force chain network in the surrounding rock further intensifies. The uneven distribution of joints in the sidewalls leads to severe deformation in the right sidewall, with the force chain damage depth increasing from 2.25 m to 3.3 m, while the damage depth in the left sidewall decreases from 1.92 m to 1.77 m. Overall, as the joint density increases, the range of force chain damage in the sidewalls of the roadway enlarges. Since the basic roof and main floor belong to stronger sandstone mudstone, the damage depth of the roof and floor force chain does not increase significantly, but the degree of force chain damage worsens.
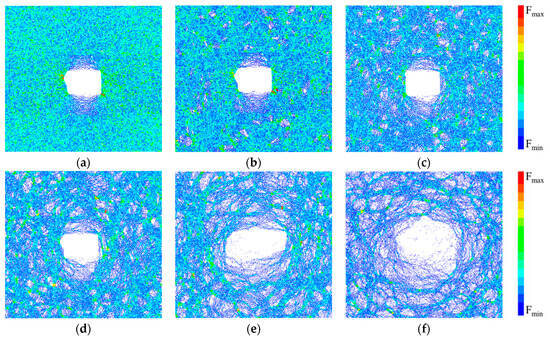
Figure 18.
Distribution characteristics of force chain of roadway surrounding rock under different joint densities: (a) joint density εf = 0 m/m−2; (b) joint density εf = 0.2 m/m−2; (c) joint density εf = 0.4 m/m−2; (d) joint density εf = 0.6 m/m−2; (e) joint density εf = 0.8 m/m−2; (f) joint density εf = 1.0 m/m−2.
4.4. Analysis of Energy Field Variation
After the initial model is subjected to pressure, energy is stored in the original rock stress field in the form of strain energy. After excavation, the surrounding rock tends to move to fill the newly formed space, converting the strain energy into kinetic energy release. Therefore, the kinetic energy variation in the roadway surrounding rock model is monitored to analyze the energy evolution pattern under different joint densities. Figure 19 shows the temporal curve of kinetic energy evolution in the roadway surrounding rock under different joint densities.
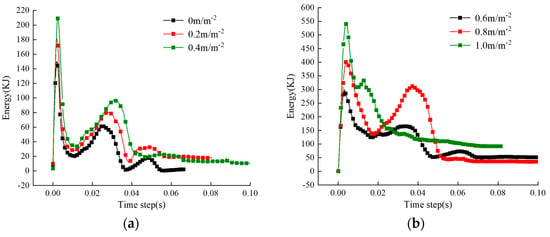
Figure 19.
Kinetic energy evolution curve of roadway surrounding rock under different joint densities; (a) εf = 0~0.4 m/m−2; (b) εf = 0.6~1.0 m/m−2.
Taking the example of the kinetic energy evolution curve of the roadway surrounding rock with a joint density of εf = 0.2 m/m−2, Figure 20 reveals that the kinetic energy curve can be divided into four stages [27,28,29]: (i) Kinetic Energy Release Stage (Stage I): After roadway excavation, the strain energy of the surrounding rock is rapidly released and converted into kinetic energy. Particles exhibit a tendency to move towards the excavation area, and particle damage begins to occur around the sidewalls. The overall kinetic energy of the surrounding rock gradually increases, reaching its maximum value when the kinetic energy reaches point D. This stage is followed by the next stage. (ii) Kinetic Energy Attenuation Stage (Stage II): In this stage, particles that experienced deformation and damage in the previous stage come into contact again. The deformation rate of the surrounding rock decreases, and the system’s kinetic energy begins to convert back into strain energy. The overall kinetic energy of the surrounding rock decreases continuously during this stage. (iii) Kinetic Energy Equilibrium Stage (Stage III): Under the influence of the gravity of the overlying strata, the roadway surrounding rock undergoes continuous deformation, and the previously accumulated strain energy is converted back into kinetic energy release. (iv) Kinetic Energy Stability Stage (Stage IV): In this stage, the overall kinetic energy of the surrounding rock remains at a relatively low level, indicating that the model has reached an equilibrium state.
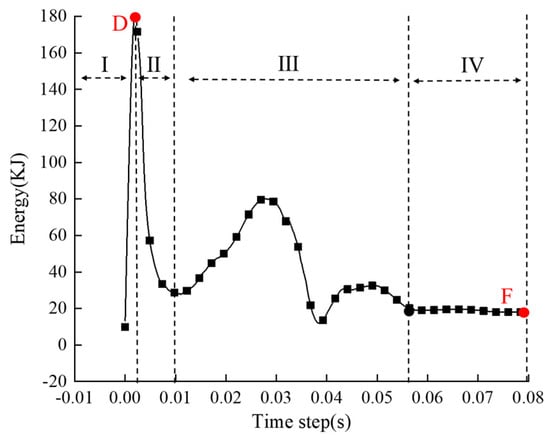
Figure 20.
Kinetic energy evolution curve of roadway surrounding rock of 0.2 m/m−2.
The vertex value D of the curve is defined as the maximum released kinetic energy EB, which represents the intensity of disturbance effects on the roadway surrounding rock after excavation. Point F is defined as the kinetic energy value of residual energy EF, which represents the severity of rock damage after system equilibrium and whether sustainable deformation exists [29]. Based on this, an analysis of the influence of joint density on the energy of the roadway surrounding rock was conducted.
Figure 21a,b, respectively, depict the variation curves of the maximum released kinetic energy and residual kinetic energy with respect to joint density. As the joint density increases, the maximum released kinetic energy shows linear growth, as shown in Figure 21a. When the joint density εf increases from 0 to 1.0 m/m−2, the maximum released kinetic energy increases from 149.85 kJ to 429.09 kJ, an increase of 186%. This indicates that the disturbance effects on the roadway surrounding rock intensify, making the rock highly susceptible to deformation. It suggests that the increase in joint density leads to a decrease in the overall bearing capacity of the roadway surrounding rock and an increase in rock deformation rate. Figure 21b reveals that the residual released kinetic energy shows a trend of increasing, decreasing, and then increasing again with increasing joint density. When the joint density εf increases from 0 m/m−2 to 0.6 m/m−2, the residual released kinetic energy increases from 2.02 kJ to 29.84 kJ. When the joint density εf increases from 0.6 m/m−2 to 1.0 m/m−2, the residual released kinetic energy remains between 29.87 kJ and 27.26 kJ, showing a smaller influence from joint density. It can be observed that as the joint density continues to increase, the values of maximum released kinetic energy and residual released kinetic energy become larger. Excavation disturbance leads to more severe damage to the roadway surrounding rock. When the joint density reaches a certain value, the roadway surrounding rock maintains a high level of energy in the kinetic energy stability zone, indicating extreme instability of the roadway and the presence of sustainable deformation.
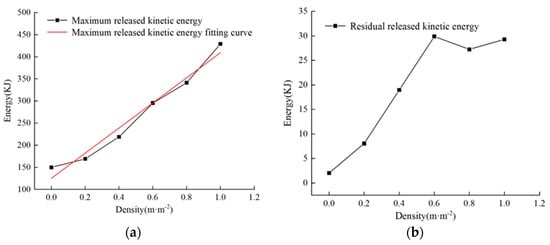
Figure 21.
Influence curve of joint density on maximum released kinetic energy and residual released kinetic energy; (a) maximum released kinetic energy; (b) residual released kinetic energy.
5. Conclusions
In the geometric information of a joint, joint density is one of the key parameters that affect the strength and stability of engineering rock masses. Therefore, it is necessary to investigate the impact of joint density on the stability of complex jointed roadway surrounding rock. In this study, taking Zhaogu No. 2 Coal Mine as the engineering background, the micro-contact parameters of particles and joint surfaces in each rock layer were calibrated through uniaxial compression tests and shear tests. Based on the calibrated micro-contact parameters, a multilayer roadway surrounding rock model with complex joints was established to investigate the influence of joint density on the stability of the roadway surrounding rock. The research results provide reference for explaining the failure rule of roadway surrounding rock with complex joints, studying the failure mechanism of roadway surrounding rock and proposing the corresponding support scheme. The main conclusions are as follows:
- (1)
- As the distance from the sidewall decreases, the influence of joint density on the deformation of the surrounding rock mass increases. However, the displacement of the roadway roof, floor, and sidewalls is affected by joint density to varying degrees, mainly related to the rock’s lithology.
- (2)
- During the process of rock stress redistribution, the vertical stress of the roof and floor undergoes more significant release compared to the horizontal stress, while the horizontal stress of the sidewalls undergoes more significant release compared to the vertical stress. The increase in joint density leads to an increasing rate of stress release in the surrounding rock, causing the load-bearing rock mass to transfer to deeper layers.
- (3)
- The presence of joints weakens the overall bearing capacity of the surrounding rock. With the increase in joint density, the distribution of force chain networks gradually transitions from dense to sparse, and the strong force chain networks decrease. As a result, the overall bearing capacity of the surrounding rock decreases, and the range of deformation and failure of the sidewalls increases.
- (4)
- As the joint density continuously increases, the values of maximum released kinetic energy and residual released kinetic energy become larger. Excavation disturbance leads to increasingly severe damage to the roadway surrounding rock. When the joint density reaches a certain value, the roadway surrounding rock maintains a high energy level in the kinetic energy stability zone, indicating extreme instability in the roadway and the presence of sustainable deformation.
Author Contributions
Conceptualization, methodology, data curation, software, and writing—original draft preparation, W.W. Data curation and funding acquisition, L.J. writing—review and editing, C.W., Y.Y. and X.P. Data curation and investigation, Y.H. All authors have read and agreed to the published version of the manuscript.
Funding
This research was financially supported by the National Natural Science Foundation of China (52074166) and Shandong Province (ZR2021YQ38).
Institutional Review Board Statement
Not applicable.
Informed Consent Statement
Not applicable.
Data Availability Statement
Data can be obtained from the corresponding author if necessary.
Conflicts of Interest
The authors declare no conflict of interest.
References
- Cai, M.; Kaiser, P.; Tasaka, Y.; Minami, M. Determination of residual strength parameters of jointed rock masses using the GSI system. Int. J. Rock Mech. Min. Sci. 2007, 44, 247–265. [Google Scholar] [CrossRef]
- Wu, Q.; Kulatilake, P. REV and its properties on fracture system and mechanical properties, and an orthotropic constitutive model for a jointed rock mass in A dam site in China. Comput. Geotech. 2012, 43, 124–142. [Google Scholar] [CrossRef]
- Xu, C.; Dowd, P. A new computer code for discrete fracture network modelling. Comput. Geosci. 2010, 36, 292–301. [Google Scholar] [CrossRef]
- Zhao, Y.; Jiang, L.; Li, C.; Niu, Q.; Sainoki, A.; Mitri, H.; Ning, J. Experimental investigation into the mechanical behavior of jointed soft rock using sand powder 3d printing. Rock Mech. Rock Eng. 2023, 5, 5383–5404. [Google Scholar] [CrossRef]
- Souley, M.; Homang, H. Stability of jointed rock masses evaluated by UDEC with an extended Saeb-Amadei constitutive law. Int. J. Rock Mech. Min. Sci. Geomech. Abstr. 1996, 33, 233–244. [Google Scholar] [CrossRef]
- Souley, M.; Homand, F.; Thoraval, A. The effect of joint constitutive laws on the modelling of an underground excavation and comparison with measurements. Int. J. Rock Mech. Min. Sci. 1997, 34, 97–115. [Google Scholar] [CrossRef]
- Cao, R.; Cao, P.; Fan, X.; Xiong, X.; Lin, H. An Experimental and Numerical Study on Mechanical Behavior of Ubiquitous-Joint Brittle Rock-Like Specimens Under Uniaxial Compression. Rock Mech. Rock Eng. 2016, 49, 4319–4338. [Google Scholar] [CrossRef]
- Yang, X.; Jing, H.; Tang, C.; Yang, S. Effect of parallel joint interaction on mechanical behavior of jointed rock mass models. Int. J. Rock Mech. Min. Sci. 2017, 92, 40–53. [Google Scholar] [CrossRef]
- Liu, Y.; Dai, F.; Dong, L.; Xu, N.; Feng, P. Experimental Investigation on the Fatigue Mechanical Properties of Intermittently Jointed Rock Models Under Cyclic Uniaxial Compression with Different Loading Parameters. Rock Mech. Rock Eng. 2018, 51, 47–68. [Google Scholar] [CrossRef]
- Dou, L.; Yang, K.; Chi, X. Fracture behavior and acoustic emission characteristics of sandstone samples with inclined precracks. Int. J. Coal Sci. Technol. 2021, 8, 77–87. [Google Scholar] [CrossRef]
- Wu, H.; Chen, J.; Gao, X.; Ling, T.; Zhang, X.; Jia, Q. Study on Failure Mechanism and Control Technology of Roadway Surrounding Rock under Complex Occurrence Coal Seam. Geofluids 2022. [CrossRef]
- Ma, K.; Sun, X.; Tang, C.; Wang, S.; Yuan, F.; Peng, Y.; Liu, K. An early warning method for water inrush in Dongjiahe coal mine based on microseismic moment tensor. J. Cent. South Univ. Technol. 2020, 27, 3133–3148. [Google Scholar] [CrossRef]
- Ren, F.; Zhu, C.; He, M.; Shang, J.; Feng, G.; Bai, J. Characteristics and Precursor of Static and Dynamic Triggered Rockburst: Insight from Multifractal. Rock Mech. Rock Eng. 2022, 56, 1945–1967. [Google Scholar] [CrossRef]
- Yang, S.; Yin, P.; Zhang, Y.; Chen, M.; Zhou, X.; Jing, H.; Zhang, Q. Failure behavior and crack evolution mechanism of a non-persistent jointed rock mass containing a circular hole. Int. J. Rock Mech. Min. Sci. 2019, 114, 101–121. [Google Scholar] [CrossRef]
- Wang, F.; Xie, H.; Zhou, C.; Wang, C.; Li, C. Combined effects of fault geometry and roadway cross-section shape on the collapse behaviors of twin roadways: An experimental investigation. Tunn. Undergr. Space Technol. 2023, 137, 105106. [Google Scholar] [CrossRef]
- Guo, Z.; Fan, J.; Wang, F.; Zhou, H.; Li, W. Geomechanical Model Experiment Study on Deformation and Failure Mechanism of the Mountain Roadway in Layered Jointed Rock Mass. Adv. Civ. Eng. 2021. [Google Scholar] [CrossRef]
- Huang, F.; Zhu, H.; Xu, Q.; Cai, Y.; Zhuang, X. The effect of weak interlayer on the failure pattern of rock mass around tunnel—Scaled model tests and numerical analysis. Tunn. Undergr. Space Technol. 2013, 35, 207–218. [Google Scholar] [CrossRef]
- Li, G.; Ma, F.; Guo, J.; Zhao, H. Experimental research on deformation failure process of roadway tunnel in fractured rock mass induced by mining excavation. Environ. Earth Sci. 2022, 81, 243. [Google Scholar] [CrossRef]
- Xiong, X.; Dai, J.; Ouyang, Y.; Shen, P. Experimental analysis of control technology and deformation failure mechanism of inclined coal seam roadway using non-contact DIC technique. Sci. Rep. 2021, 11, 20930. [Google Scholar] [CrossRef]
- Tao, Z.; Zhu, C.; Zheng, X.; Wang, D.; Liu, Y.; He, M.; Wang, Y. Failure mechanisms of soft rock roadways in steeply inclined layered rock formations. Geomatics. Nat. Hazards Risk 2018, 9, 1186–1206. [Google Scholar] [CrossRef]
- Lin, C.; Yu, J.; Chang, F.; Fu, X.; Yao, W.; Cai, Y. Influence of three-dimensional persistent joints on surrounding rock stability of large-span tunnel. J. Cent. South Univ. (Sci. Technol.) 2023, 54, 1141–1152. [Google Scholar]
- He, P.; Li, S.; Li, L.; Zhang, Q.; Xu, F.; Chen, Y. Discontinuous deformation analysis of super section tunnel surrounding rock stability based on joint distribution simulation. Comput. Geotech. 2017, 91, 218–229. [Google Scholar] [CrossRef]
- Jiang, L.; Sainoki, A.; Mitri, H.; Ma, N.; Liu, H.; Hao, Z. Influence of fracture-induced weakening on coal mine gateroad stability. Int. J. Rock Mech. Min. Sci. 2016, 88, 307–317. [Google Scholar] [CrossRef]
- Yang, Z. Characterization of rock joint roughness and study of shear mechanical behavior under confinement. Taiyuan Univ. Technol. 2021. [Google Scholar] [CrossRef]
- Fang, G.; Yang, S.; Sun, J.; Cheng, J. Study on instability fracture evolution of deep thick coal seams based on discrete element simulation. J. Min. Saf. Eng. 2016, 33, 676–683. [Google Scholar]
- Chi, X.; Zhang, Z.; Li, L.; Wang, Q.; Wang, Z.; Dong, H.; Xie, Y. Numerical and Experimental Study on a Novel Filling Support Method for Mining of Closely Spaced Multilayer Orebody. Minerals 2022, 12, 1523. [Google Scholar] [CrossRef]
- Liu, X.; Wang, G.; Wen, Z.; Wang, D.; Song, L.; Lin, M.; Chen, H. The Transient Unloading Response of a Deep-Buried Single Fracture Tunnel Based on the Particle Flow Method. Sustainability 2023, 15, 6840. [Google Scholar] [CrossRef]
- Zhang, D.; Guo, W.; Zhao, T.; Zhao, Y.; Chen, Y.; Zhang, X. Energy Evolution Law during Failure Process of Coal–Rock Combination and Roadway Surrounding Rock. Minerals 2022, 12, 1535. [Google Scholar] [CrossRef]
- Zou, Y.; Li, X.; Zhou, Z.; Yin, T.; Yin, Z. Energy evolution and stress redistribution of high-stress rock mass under excavation distribution. Chin. J. Geotech. Eng. 2012, 34, 1677–1684. [Google Scholar]
Disclaimer/Publisher’s Note: The statements, opinions and data contained in all publications are solely those of the individual author(s) and contributor(s) and not of MDPI and/or the editor(s). MDPI and/or the editor(s) disclaim responsibility for any injury to people or property resulting from any ideas, methods, instructions or products referred to in the content. |
© 2023 by the authors. Licensee MDPI, Basel, Switzerland. This article is an open access article distributed under the terms and conditions of the Creative Commons Attribution (CC BY) license (https://creativecommons.org/licenses/by/4.0/).