1. Introduction
In the realm of finance and economics, the intricate interplay between sustainability, uncertainty, and risk has gained considerable attention among researchers and policymakers alike. The growing awareness of the environmental challenges posed by climate change, coupled with the recognition of the need for sustainable practices and investments, has spurred investigations into the dynamic relationships between these key factors [
1,
2]. In particular, understanding how sustainability considerations interact with uncertainties and risks across different time frames has emerged as a critical study area.
The concept of sustainability encompasses a broad spectrum of economic, social, and environmental aspects, seeking to strike a balance between meeting present needs and ensuring the well-being of future generations. Sustainability-oriented initiatives, such as green bonds and environmentally responsible investments, have increased in popularity, as investors increasingly seek to align their portfolios with environmentally conscious practices [
3]. The Dow Jones Sustainability World Index holds substantial importance as a comprehensive measure of sustainability performance across global markets. It assesses companies based on environmental, social, and governance criteria, offering investors a clear view of businesses’ commitment to long-term sustainability and responsible practices. This index not only guides investment decisions towards environmentally conscious and socially responsible companies but also encourages corporations to enhance their sustainability efforts. In a world increasingly focused on sustainable practices, the Dow Jones Sustainability World Index plays a pivotal role in promoting economic growth that aligns with societal and environmental well-being.
However, sustainability efforts are not immune to uncertainties and risks, which can arise from various sources, including economic, geopolitical, and environmental factors [
4]. The dynamic nature of these uncertainties poses challenges for investors and decision makers, necessitating a deeper understanding of their time-varying relationships with sustainability-oriented assets and strategies.
Time-frequency relationships have emerged as a powerful tool for exploring the evolving dynamics between sustainability, uncertainty, and risk. Researchers can unravel the intricate co-movement patterns and correlations across different time horizons by employing methods such as the wavelet analysis. This approach allows for identifying short-term and long-term interactions, enabling a comprehensive assessment of the implications for investment strategies and risk management [
5].
The analysis of time-frequency relationships holds significant value as it enables us to unveil how the interactions between variables evolve over different time frames. This approach provides a dynamic perspective, allowing us to identify patterns and correlations that might be missed in traditional static analyses [
6]. By examining how relationships change across various frequencies and time intervals, we gain a deeper understanding of complex phenomena, such as the interplay between sustainability, uncertainty, and risk. This nuanced insight is crucial for devising informed strategies, making accurate predictions, and adapting to the ever-changing dynamics of financial markets and economic landscapes.
This research aims to delve into the multifaceted connections between sustainability, uncertainty, and risk through a time-frequency lens. By employing advanced analytical techniques, including wavelet power spectrum and wavelet coherence models, we seek to shed light on the nuanced and time-varying relationships between these critical elements.
The insights garnered from this investigation hold significant implications for policy-makers, investors, and financial institutions seeking to navigate an increasingly complex and uncertain landscape. Understanding the temporal dynamics of sustainability-related assets and their interactions with uncertainties and risks can facilitate the development of more robust investment strategies, enhance risk management practices, and foster the pursuit of sustainable and resilient economic growth.
The manuscript is organized as follows. In
Section 2, a methodical literature review is presented, exploring the interconnections between sustainability, uncertainty, and risk indexes through the application of scientometric analysis.
Section 3 introduces the data, along with descriptive statistics and methodologies utilized for the study. Moving to
Section 4, a comprehensive examination of findings is conducted, incorporating an in-depth analysis of outcomes from both wavelet power spectrum (WPS) and wavelet coherence analyses (WCA). This analysis extends to extreme market scenarios, including the COVID-19 pandemic, the Russian invasion of Ukraine, and recent global uncertainties.
Section 5 proceeds to delineate a discussion on the principal findings and their relevance to the BASEL accords. Finally, in
Section 6, the paper concludes by offering concluding remarks, highlighting contributions made, and suggesting avenues for future research.
2. Literature Review
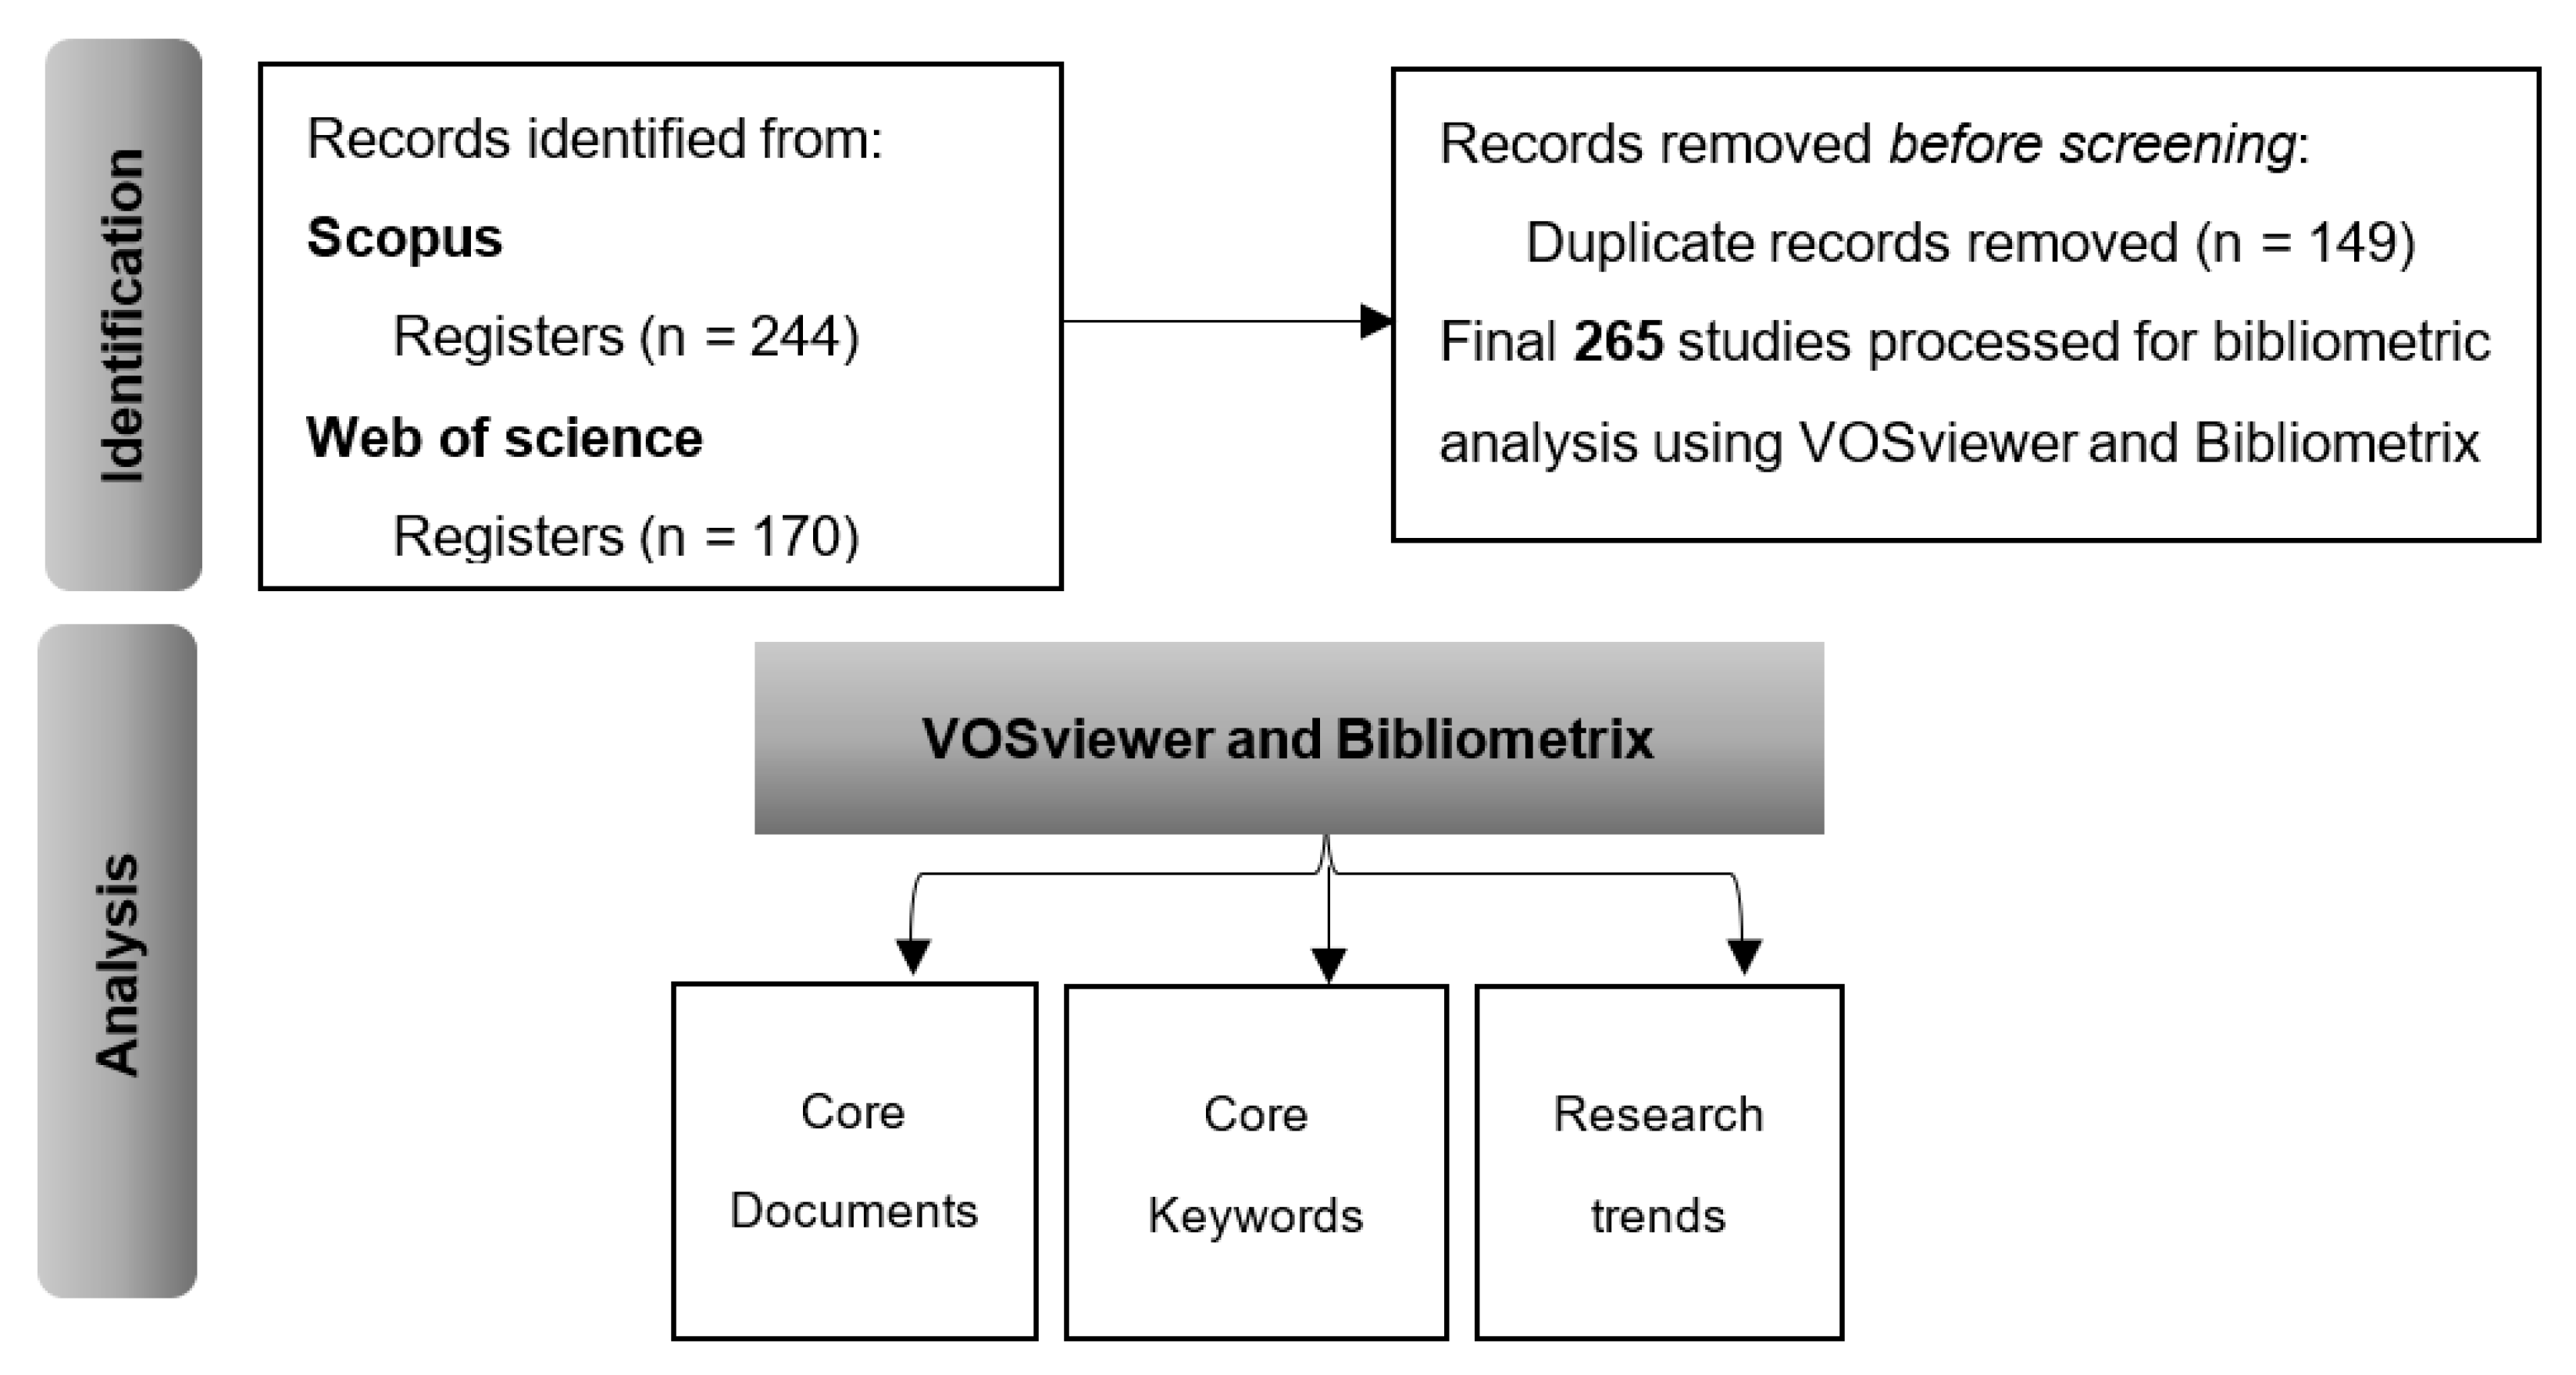
In this study, we conducted an analysis of the existing literature on the topic of the existent time–frequency relationships among sustainability, uncertainty, and risk (
Figure 1). To achieve this, three scientometric techniques were employed: (1) document analysis, (2) keyword analysis, and (3) research trends.
The research findings were visualized with VOSviewer software version 1.6.19, developed by [
7], and the Bibliometrix R-package, developed by [
8]. These selected scientometric techniques were utilized to achieve the following objectives: (i) identify the key studies in the field, (ii) identify the prominent researchers, institutions, countries, and sources contributing to the research on green bonds and uncertainty, and (iii) conduct a bibliography coupling analysis to gain insights into the emerging research topics within this area of study.
The scholarly databases employed for identifying and retrieving relevant publications in this study were Scopus and Web of Science (WoS). The search equation in Scopus was: (TITLE (sustainability) AND TITLE (uncertainty OR risk*) AND TITLE-ABS-KEY (co-movements OR link* OR dependence OR connectedness OR interdependence OR relationship* OR correlation* OR connection*)). In addition, the search equation in WoS was: sustainability (Title) and uncertainty or risk* (Title) and co-movements OR link* OR dependence OR connectedness OR interdependence OR relationship* OR correlation OR connection (Topic). The identified articles were downloaded and indexed in the Mendeley reference manager for reading and content analysis.
Figure 1 presents the framework used in this review. Duplicate records were removed during the screening process, resulting in a final analysis of 265 studies.
The scientific exploration of publications in Scopus and WoS Databases concerning sustainability, uncertainty, and risk led to identifying three distinct research trends (in line with [
9,
10]).
Figure 2 illustrates the prominent study relationships at the top and showcases the three research trends at the bottom.
The first research trend centers on sustainable practices’ impact on supply chain risk and performance [
11,
12,
13,
14,
15,
16,
17,
18,
19]. For example, [
11] highlights the growing recognition of sustainability-related risks companies face in their supply chains. It emphasizes the existing research gap where supply chain sustainability models often neglect to incorporate risk considerations. The findings suggest that implementing environmental and social sustainability strategies results in sustainable supply chain performance, with targeted practices in these domains playing a crucial role. However, their influence on operational and cost performance is not statistically significant. Conversely, social supply chain strategies positively impact both environmental and cost performance, mainly when mediated by risk assessment practices.
Furthermore, reference [
12] emphasizes the unique opportunity presented by the COVID-19 pandemic to reevaluate sustainability and green practices in supply chains. The study’s approach, rooted in stakeholder theory and social cognitive theory, aims to investigate how uncertainties related to COVID-19 positively influence green supply chain management and overall sustainability performance. The inclusion of corporate social responsibility (CSR) as a moderating factor adds depth to understanding how companies can navigate uncertainties effectively and enhance their sustainability efforts.
Overall, this research [
11,
12,
13,
14,
15,
16,
17] collectively contributes to the body of knowledge on sustainability, uncertainty, and risk in supply chain management. It highlights the challenges and opportunities faced by companies in managing supply chain risks and integrating sustainability practices. The empirical approaches and theoretical frameworks employed in the studies offer valuable insights for both academic research and practical decision making in supply chain management, promoting more sustainable and resilient supply chains. The research findings [
11,
12,
13,
14,
15,
16,
17] provide valuable insights for supply chain managers, investors, and policy-makers to make informed decisions regarding sustainable practices, risk mitigation, and performance outcomes. The inclusion of risk management in the context of sustainability is crucial to enhance supply chain resilience and reduce vulnerabilities. It further emphasizes the importance of considering specific risk profiles and incorporating sustainable practices tailored to the characteristics of different markets, including emerging economies.
The second research trend examines the topic concerning corporate sustainability and risk management [
20,
21,
22,
23]. For example, reference [
21] is essential for understanding the drivers of corporate sustainability within South African organizations and how they intersect with risk management. It highlights the link between sustainability and long-term organizational performance, indicating that sustainability and risk management should not be treated as separate entities. Finally, reference [
23] reiterates the aim of exploring the impact of controversial firms’ corporate sustainability assessments on risk exposure, specifically focusing on the environmental, social, and governance (ESG) paradigm. By considering controversy as an independent factor from the industry sector, the study provides insights into the implications of corporate social performance on firm-specific risk.
Additionally, reference [
22] highlights the critical role of corporate sustainability practices in achieving organizational performance excellence. This sets the stage for understanding how sustainability, uncertainty, and risk are interrelated in modern organizations. The mention of internal and environmental factors reinforces the complexity of the relationships, indicating that implementing sustainability initiatives involves considering various influences. Furthermore, reference [
20] emphasizes the need to explore the impact of corporate sustainability assessments on risk exposure, specifically focusing on the ESG paradigm. By investigating the relationships between sustainability performance and firm risk, the study contributes to risk management research and helps understand the role of sustainability disclosures in decision making.
In summary, the importance of the research in the second trend lies in their contributions to understanding the relationships between sustainability, uncertainty, and risk in organizational contexts. They highlight the significance of corporate sustainability practices, sustainability assessments, and their implications for risk management and decision making. These studies provide valuable insights for organizations seeking to integrate sustainability into their risk management strategies and achieve long-term performance excellence.
The third trend delves into different relations among sustainability, uncertainty, and risk [
24,
25,
26,
27,
28,
29,
30]. Then, references [
24,
25,
26,
27,
28,
29,
30] explore different aspects of how sustainability practices, risk management, and innovation intersect, providing a comprehensive understanding of the complex dynamics in the context of sustainable development and organizational performance. These studies contribute to the growing body of knowledge on the interplay between sustainability, uncertainty, and risk, helping organizations make informed decisions for achieving long-term sustainability and success.
In this way, reference [
24] examines how building reputation capital through ESG investing can mitigate the negative effect of economic policy uncertainty on firm valuation. The research suggests that sustainable reporting can act as an insurance-like mechanism during periods of high uncertainty, demonstrating the importance of ESG performance for financial firms during uncertain times. Similarly, reference [
27] explores the relationship between risk governance and sustainability, focusing on environmental issues. The study uncovers research themes related to resilience, adaptation, governance, and corporate sustainability, providing insights into how risk governance can contribute to sustainable outcomes. It clarifies the connection between risk governance and sustainable development, indicating how risk management can be optimized for sustainability.
The literature review reveals a gap in research, as studies have yet to conduct a simultaneous analysis of the three variables (sustainability, uncertainty, and risk) in the context of interdependence analysis. Considering this gap, conducting comprehensive research on these three variables allows for a deeper understanding of their evolving connections over time and how external factors influence their co-movement. Therefore, the current study aims to bridge this knowledge gap by investigating the relationships between sustainability, uncertainty, and risk.
4. Application and Results
4.1. Unconditional Correlation Analysis
Pairwise correlations across the variables’ returns are presented in
Figure 4. The negative correlations between the Sustainability World Index (RW1SGI) and both the ICE BofA MOVE Index (RMOVE) and the Cboe Volatility Index (RVIX), at −33% and −63%, respectively, suggest that as RW1SGI (a sustainability index) decreases, market volatility, as represented by RMOVE and RVIX, tends to increase. These findings could imply that shifts in sustainability perceptions or events might coincide with heightened market volatility. Additionally, the positive correlation of 0.32% between the ICE BofA MOVE Index (RMOVE) and the Cboe Volatility Index (RVIX) suggests that there is a tendency for these two volatility indices to move in the same direction. When RMOVE increases, RVIX also tends to increase, and vice versa. This implies a potential alignment between fixed-income market volatility (RMOVE) and stock market volatility (RVIX). This finding could be useful for investors and analysts in understanding how volatility in different market segments might be interconnected or influenced by similar factors.
According to the existing literature, the correlation between the Sustainability World Index and the VIX index is expected to be negative or weakly negative [
49]. Sustainability-focused companies tend to prioritize long-term strategies, which can offer stability even during increased market uncertainty, leading to lower volatility in their stock prices. As a result, investors seeking stable and sustainable investments may be drawn to such companies, leading to a negative correlation between the Sustainability World Index and the VIX index.
Furthermore, according to [
49], the heightened market volatility results in an elevated VIX Index, leading investors to exercise greater caution in their decision making. As fear and uncertainty increase in the financial markets, such heightened risk aversion is anticipated to impact the Sustainability Index negatively. Similarly, the co-movement of the Sustainability World Index against the ICE BofA MOVE Index is expected to be negative, too, because an increase in market uncertainty significantly influences the connectedness between green bonds and investor attention [
50,
51]. Additionally, following [
51], VIX and MOVE indexes, as proxy variables of economic policy uncertainty, are expected to have a positive correlation.
4.2. Wavelet Power Spectrum
Figure 5 displays the wavelet power spectrum of the DJ Sustainability World Index (RW1SGI), Cboe Volatility Index (RVIX), and ICE BofA MOVE Index (RMOVE) variables. The DJ Sustainability World Index (RW1SGI) in
Figure 5a exhibits significant volatility at low and medium frequencies, with notable spikes observed in 2016, the end of 2019–2020, and 2022–2023. The heightened volatility in 2016 can be attributed to several geopolitical events, including the Brexit referendum and the U.S. presidential election, which introduced uncertainty into global financial markets, subsequently influencing investor sentiment and amplifying market volatility. Moreover, the end of 2019–2020 witnessed the outbreak of the COVID-19 pandemic, while the Russian invasion of Ukraine in February 2022 and the prevailing global uncertainties in 2023 further impacted the Sustainability Index. These external events have played a crucial role in shaping the DJ Sustainability World Index dynamics during the mentioned periods.
The Cboe Volatility Index (RVIX) behavior, as depicted in
Figure 5b, demonstrates notable volatility during 2020 and the beginning of 2023 across low, medium, and high frequencies, aligning with the previously identified events. Notably, the COVID-19 pandemic, the Russian invasion of Ukraine, and the ensuing European energy crisis triggered post-COVID-19 inflation and impacted the global markets, leading to increased interest rates. Consequently, heightened volatility in the financial markets contributed to an upsurge in both the Volatility and Uncertainty Indexes. Then, both periods experienced heightened volatility. However, it is important to note that the COVID-19 pandemic period (2019–2021) was marked not only by volatility (VIX index) but also by increased inflation, reflecting a broader economic impact compared to the more localized impact of the Ukraine–Russia conflict on volatility.
Likewise, the ICE BofA MOVE Index (RMOVE) in
Figure 5c reveals elevated volatility at low and medium frequencies, particularly in 2020 and 2021. These periods were marked by various global events that influenced financial markets, contributing to increased volatility and fluctuations in the ICE BofA MOVE Index.
4.3. Wavelet Coherence Approach
The wavelet coherence approach was employed to examine the causal association between the DJ Sustainability World Index (RW1SGI), the Cboe Volatility Index (RVIX), and the ICE BofA MOVE Index (RMOVE). The findings are presented in
Figure 6, showcasing the co-movement of these variables in the time-frequency domain. The figure also includes a table summarizing the main results for each pair of time series. The x-axis depicts the research period in days, while the y-axis illustrates the frequency domain, partitioned into five bands: 1–4, 4–16, 16–64, 64–256, and 256–512 daily cycles. The labels ST, MT, and LT denote short-term, medium-term, and long-term signals, respectively. A color gradient legend on the plot’s right side signifies the power, ranging from dark blue (low power) to dark red (high power).
The wavelet coherence analysis in
Figure 6a reveals a consistent pattern of left-up arrows across all scales, indicating that the DJ Sustainability World Index (RW1SGI) has a significant negative impact on the Cboe Volatility Index (RVIX) across short, medium, and long-term periods. This suggests that as the sustainability index (RW1SGI) decreases, the volatility index (RVIX) tends to increase, highlighting a potentially inverse relationship between sustainability and market volatility.
In practical terms, this outcome implies that shifts in sustainability factors are associated with changes in market volatility. A decrease in sustainability, which might be related to negative environmental, social, or economic developments, appears to coincide with increased market volatility. This could mean that events or factors affecting sustainability negatively might introduce higher uncertainty or perceived risk to the financial market, leading to heightened volatility.
Such insights from the analysis can aid investors and financial analysts in understanding the interconnected dynamics between sustainability considerations and market uncertainty. It suggests that maintaining or enhancing sustainability practices might contribute to stabilizing market conditions and potentially reducing volatility by mitigating sources of uncertainty related to environmental and social factors.
Only in 2017–2019, the Sustainability Index significantly caused the VIX index in the short-term and medium-term. The direction of causality does not change throughout the period analyzed (left-up arrows), indicating that the Sustainability Index significantly caused the VIX Index in this period.
Moreover,
Figure 6b displays the wavelet coherence analysis between the DJ Sustainability World Index (RW1SGI) and ICE BofA MOVE Index (RMOVE). The co-movement between these two variables exhibits temporal variations in causality at different frequencies. Specifically, during the period 2015–2016, the DJ Sustainability World Index (RW1SGI) had a significant negative influence on the ICE BofA MOVE Index (RMOVE) in the short-term. However, this relationship underwent a change since 2019, with the DJ Sustainability World Index (RW1SGI) continuing to have a significant negative impact on the ICE BofA MOVE Index (RMOVE), but now predominantly in the medium-term and long-term.
Notably, the direction of causality changed during different periods and frequencies. Between 2014 and 2023, during intervals such as 2014, 2019–2020, 2021, and 2022–2023, a consistent pattern of left-down arrows emerged for the scale range of 4–64. This pattern indicates that, in the short-term, the ICE BofA MOVE Index (RMOVE) exhibited a significant negative influence on the DJ Sustainability World Index (RW1SGI). Additionally, this negative influence was also apparent in both the short-term and medium-term during 2014.
The periods with the pronounced causal relationship between RMOVE and RW1SGI suggest instances of heightened market turbulence and uncertainty. These periods are tied to significant macroeconomic events that involve geopolitical tensions, financial crises, and environmental concerns. The consistent negative impact on sustainability sentiments during these identified intervals implies that the increased market volatility, as represented by RMOVE, coincided with a reduced focus on sustainability, potentially due to shifts in investor behavior, market sentiment, or broader economic concerns. These nuanced temporal shifts underscore the intricate relationship between financial market dynamics and sustainability considerations, revealing the impact of external forces on market sentiments and long-term sustainability priorities.
Finally,
Figure 6c illustrates the wavelet coherence analysis between the ICE BofA MOVE Index (RMOVE) and Cboe Volatility Index (RVIX). The relationship between these two indexes is primarily observed in the short- and medium-term, and it displays changes in causality over time.
In specific time periods, namely 2014, 2017–2019, and 2022–2023, the ICE BofA MOVE Index (RMOVE) significantly influenced the Cboe Volatility Index (RVIX) in both the short-term and medium-term, exhibiting a positive relationship. Conversely, during the periods of 2015–2016, 2019–2020, and 2021, the Cboe Volatility Index (RVIX) significantly influenced the ICE BofA MOVE Index (RMOVE) in the short-term and medium-term, also demonstrating a positive relationship.
These findings indicate varying causal interactions between the ICE BofA MOVE Index (RMOVE) and Cboe Volatility Index (RVIX) across different time periods and frequencies, suggesting a complex and dynamic relationship between volatility indexes in the short and medium term.
5. Discussion
Within the context of the study on sustainability, uncertainty, and risk, the BASEL accords, particularly those concerning market risk, assume significance. Then, the introduction of Basel accords amplified the significance of volatility forecasting within the realm of risk management [
52]. These accords outline regulatory standards that financial institutions must adhere to in order to ensure the adequacy of capital reserves against market risks. Ultimately, financial analysts and policy-makers commonly utilize volatility as a surrogate indicator for financial and economic turmoil [
52].
The intricate interplay between environmental sustainability, uncertainty, and risk is evident through numerous studies showcasing the profound connections between environmental challenges and economic and financial risks. Given that banks are principal credit providers in many economies, their collective management of these risks assumes paramount importance as a policy and regulatory concern [
53].
In relation to the study’s focus on time-frequency relationships, the implications are notable. By analyzing how sustainability, uncertainty, and risk interact over varying time horizons, financial institutions can gain insights into the dynamic nature of these factors. This understanding can guide the calibration of risk management procedures in line with the BASEL accords [
52].
The findings from the study might highlight periods of elevated volatility or increased risk exposure linked to specific time-frequency patterns. Financial institutions can utilize these insights to fine-tune their risk assessment, mitigation strategies, and capital allocation, aligning with the overarching goals of the BASEL accords. Effectively, the study’s exploration of time-frequency relationships offers institutions a means to elevate the precision and efficiency of their risk management strategies within the regulatory confines delineated by the BASEL accords. This underscores how inventive methodologies possess the potential to enrich risk evaluation within credit portfolios, potentially reshaping the landscape of risk management practices [
54]. In essence, this convergence highlights the interplay between the analysis of financial dynamics and the regulatory landscape, emphasizing the potential for these insights to shape prudent and informed financial policies and practices [
55].
6. Conclusions and Recommendations
This study contributes valuable knowledge to the evolving sustainability, uncertainty, and risk co-movements. The time-frequency analysis provided insights into the multifaceted connections between these critical elements, offering a deeper understanding of their dynamic relationships and potential implications for decision making and sustainable practices.
The interplay between sustainability, uncertainty, and risk in finance and economics has garnered significant attention among researchers and policy-makers. The awareness of environmental challenges posed by climate change and the need for sustainable practices and investments have led to investigations into the dynamic relationships between these key factors. Sustainability-oriented initiatives, such as green bonds and environmentally responsible investments, have gained popularity as investors seek to align their portfolios with environmentally conscious practices. However, sustainability efforts are not immune to uncertainties and risks arising from economic, geopolitical, and environmental factors, necessitating a deeper understanding of their time-varying relationships.
Time-frequency relationships, analyzed using wavelet analysis, have emerged as a powerful tool for exploring the evolving dynamics between sustainability, uncertainty, and risk. Researchers can unravel intricate patterns of co-movements and correlations across different time horizons, allowing the identification of short-term and long-term interactions. This approach enables a comprehensive assessment of the implications for investment strategies and risk management.
The wavelet power spectrum analysis revealed the volatility patterns in the DJ Sustainability World Index (RW1SGI), Cboe Volatility Index (RVIX), and ICE BofA MOVE Index (RMOVE) variables. The significant volatility observed in these indexes during specific periods coincided with various global events, including geopolitical events, the COVID-19 pandemic, the Russian invasion of Ukraine, and prevailing global uncertainties. These external events played a crucial role in shaping the dynamics of the DJ Sustainability World Index, Cboe Volatility Index, and ICE BofA MOVE Index during the mentioned periods.
The wavelet coherence analysis was employed to examine the causal relationships between the DJ Sustainability World Index (RW1SGI), Cboe Volatility Index (RVIX), and ICE BofA MOVE Index (RMOVE). The findings showed varying causal interactions between these indexes across different periods and frequencies. The DJ Sustainability World Index significantly influenced both the Cboe Volatility Index and ICE BofA MOVE Index in the short-, medium-, and long-term, with some exceptions in certain periods. The ICE BofA MOVE Index and Cboe Volatility Index also exhibited bidirectional causal relationships in specific periods and frequencies.
Further research could delve into the behavior of investors in response to changes in sustainability, uncertainty, and risk. Analyzing the impact of these variables on financial markets and investment decisions could help develop risk management strategies and sustainable investment practices. Additionally, examining how policy frameworks, regulations, and risk management practices influence the interplay between sustainability, uncertainty, and risk can offer guidance for designing more resilient and sustainable business models. Furthermore, investigating the unique dynamics of sustainability, uncertainty, and risk in specific sectors such as energy, healthcare, technology, and agriculture can provide sector-specific insights and inform targeted interventions. Finally, leveraging advanced analytical techniques such as machine learning and big data analytics can help identify complex patterns and associations between sustainability, uncertainty, and risk in vast datasets.
Understanding the temporal dynamics of sustainability-related assets and their interactions with uncertainties and risks can facilitate the development of more robust investment strategies, enhance risk management practices, and foster the pursuit of sustainable and resilient economic growth. The findings from this research have significant implications for policy-makers, investors, and financial institutions seeking to navigate an increasingly complex and uncertain landscape. Our study contributes valuable knowledge to the evolving field of sustainability, uncertainty, and risk, fostering informed decision making and sustainable practices for a more resilient and environmentally responsible future.
While this study contributes to the broader discourse on the dynamic interplay among sustainability, uncertainty, and risk across various frequency bands, it is important to acknowledge a potential limitation associated with the temporal and frequency aspects of the data. For instance, decision makers in financial markets may lean towards making decisions over extended time horizons, aligning with the findings of [
5,
56]. To mitigate this limitation, future research could address the issue by incorporating lower frequency data (such as weekly or monthly data) and accounting for the diversity of risk taking across distinct timeframes. This approach would provide a more comprehensive understanding of the relationships under consideration.


