

Machine Learning Models for the Prediction of the Compressive Strength of Self-Compacting Concrete Incorporating Incinerated Bio-Medical Waste Ash


 and
and
Abstract
:1. Introduction
2. Materials
2.1. Cement
2.2. Aggregates
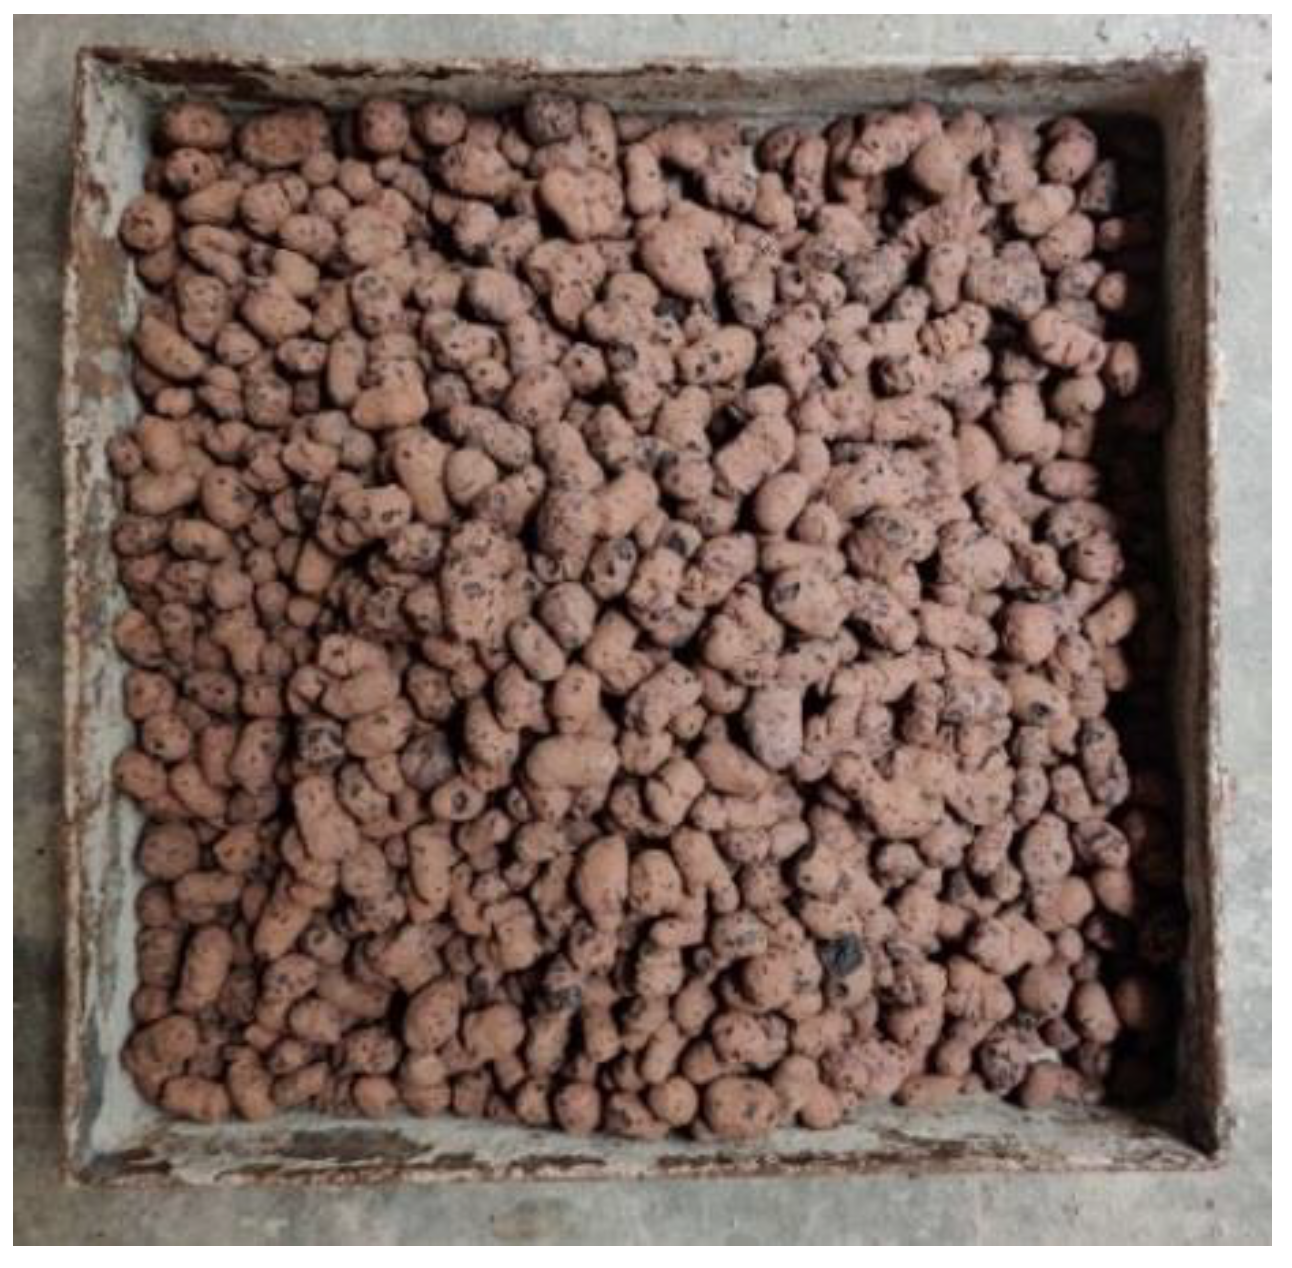
2.3. Lightweight Expandable Clay Aggregate (LECA)
2.4. Ground Granulated Blast Furnace Slag (GGBS)
2.5. Incinerated Bio-Medical Waste Ash (IBMWA)
2.6. Admixture
3. Methodology
3.1. Mix Design
3.2. Experimental Testing
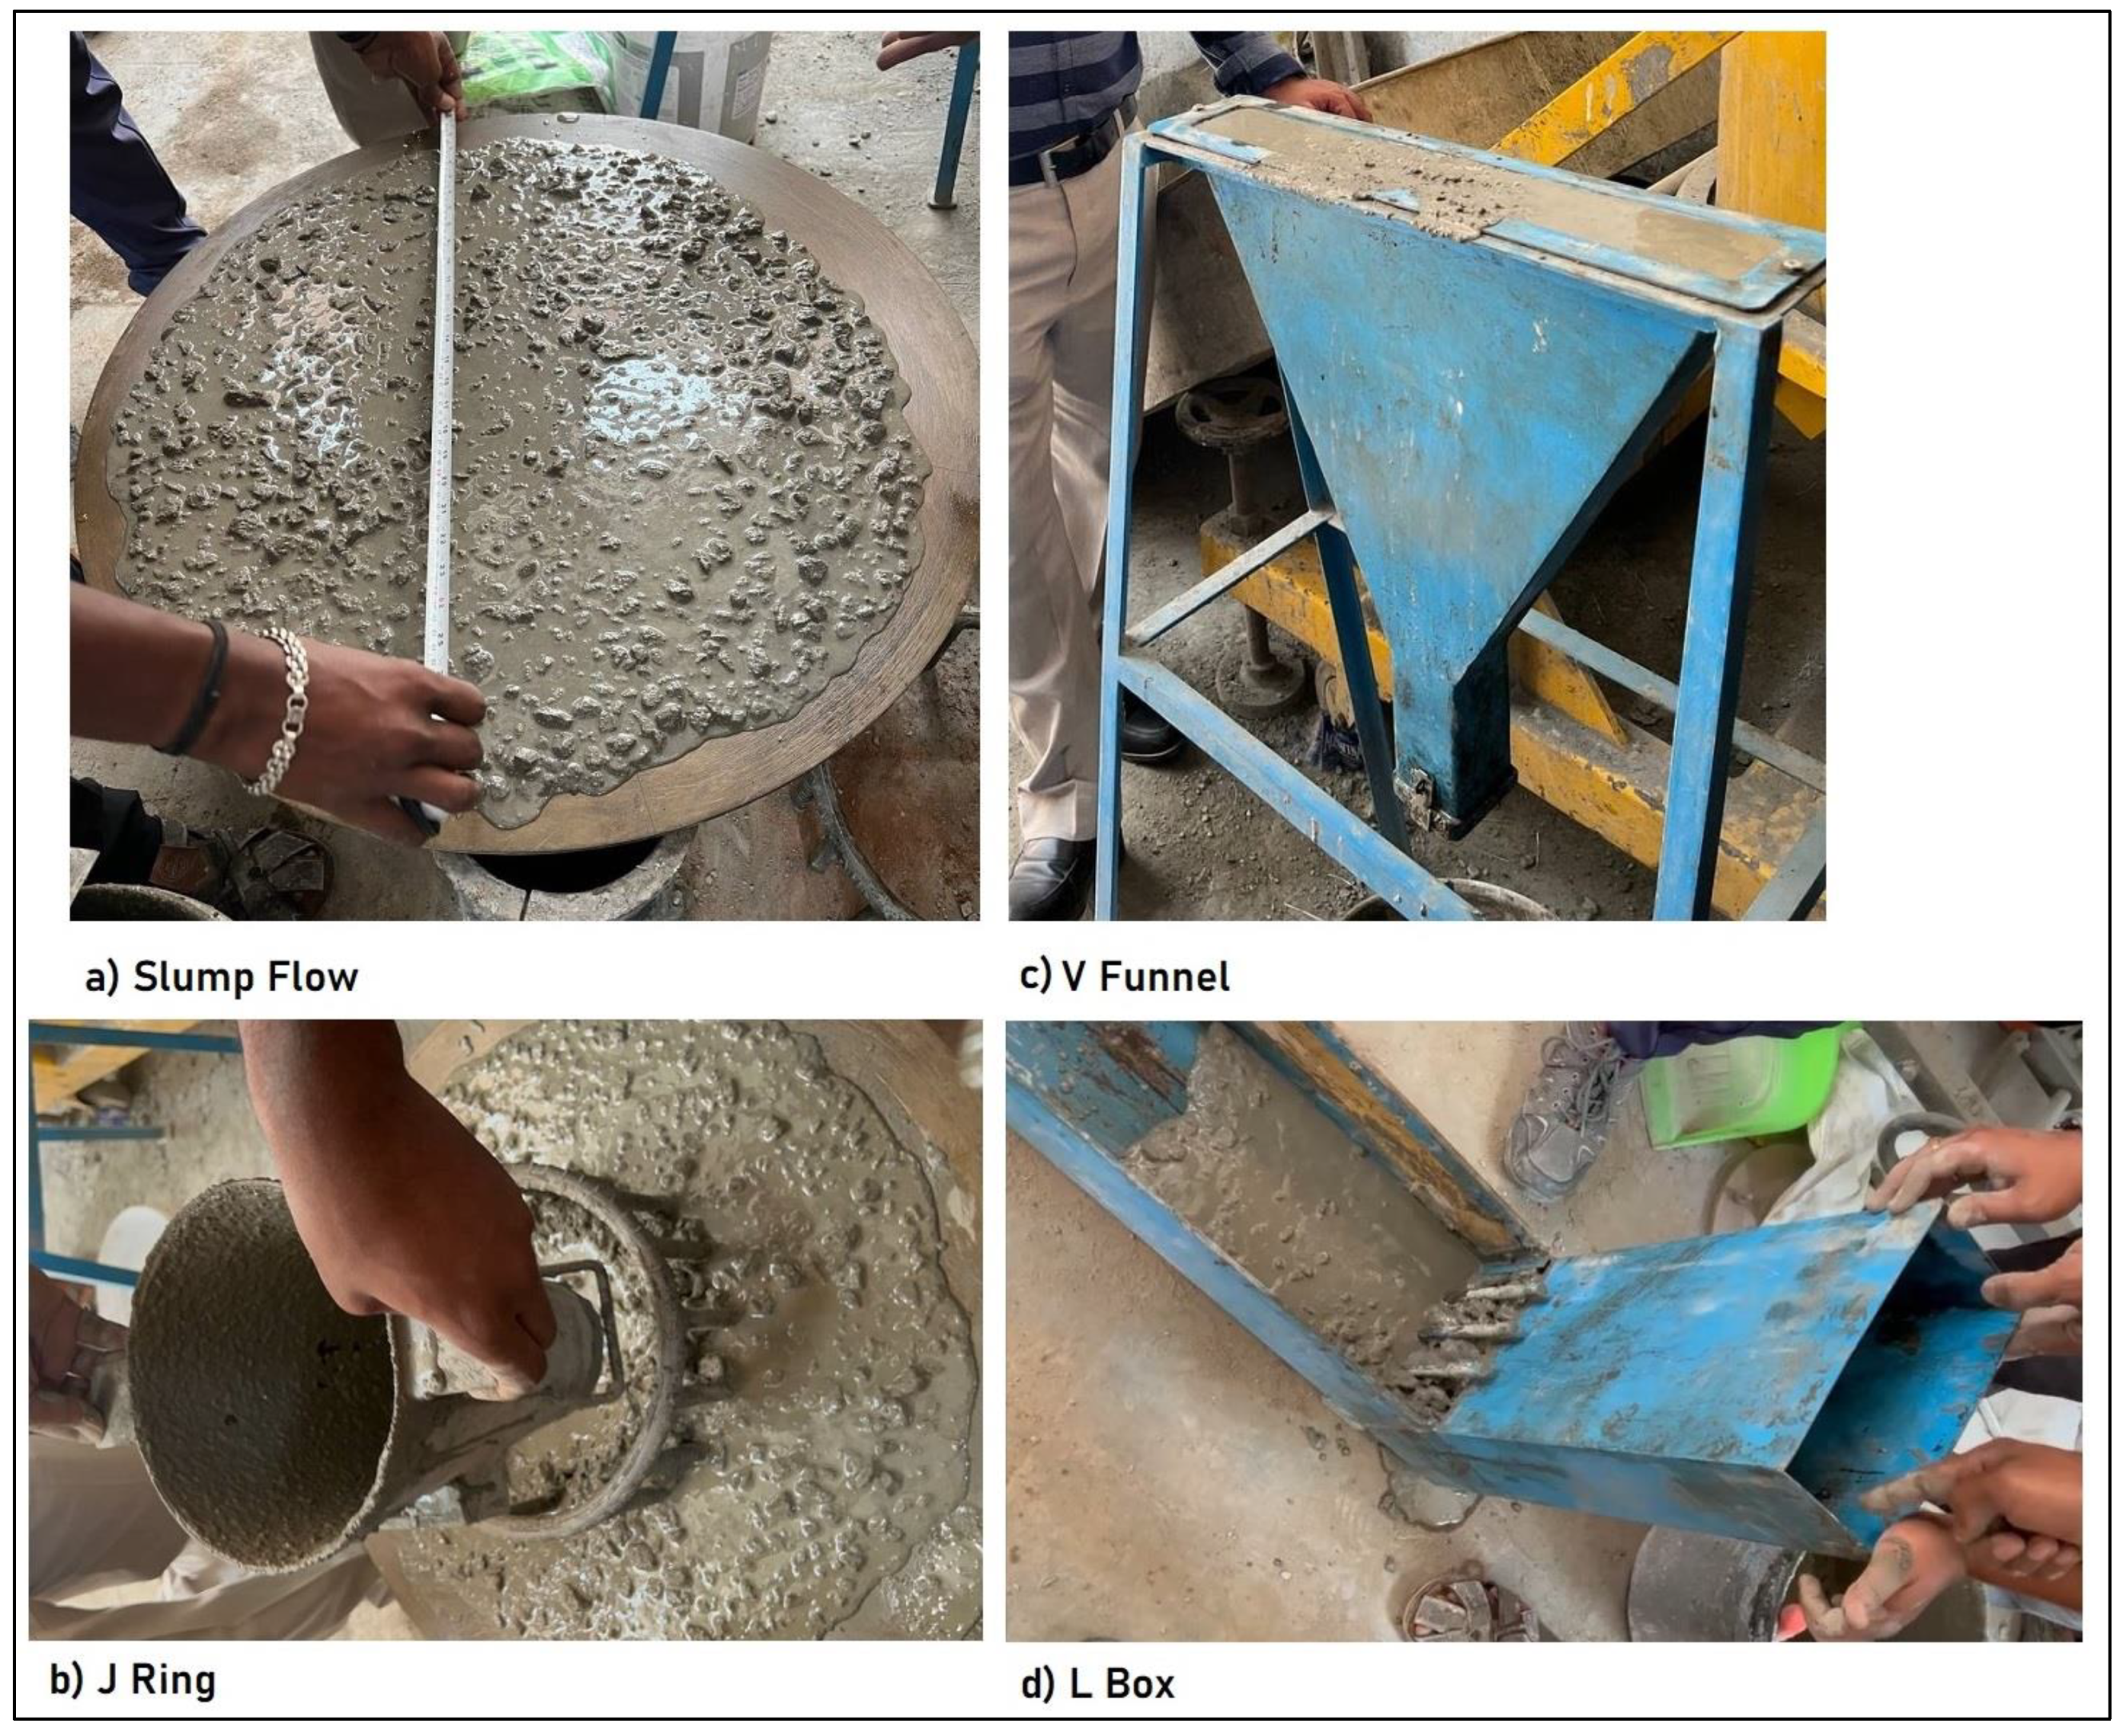
3.2.1. Fresh Properties of Concrete
- Slump flow
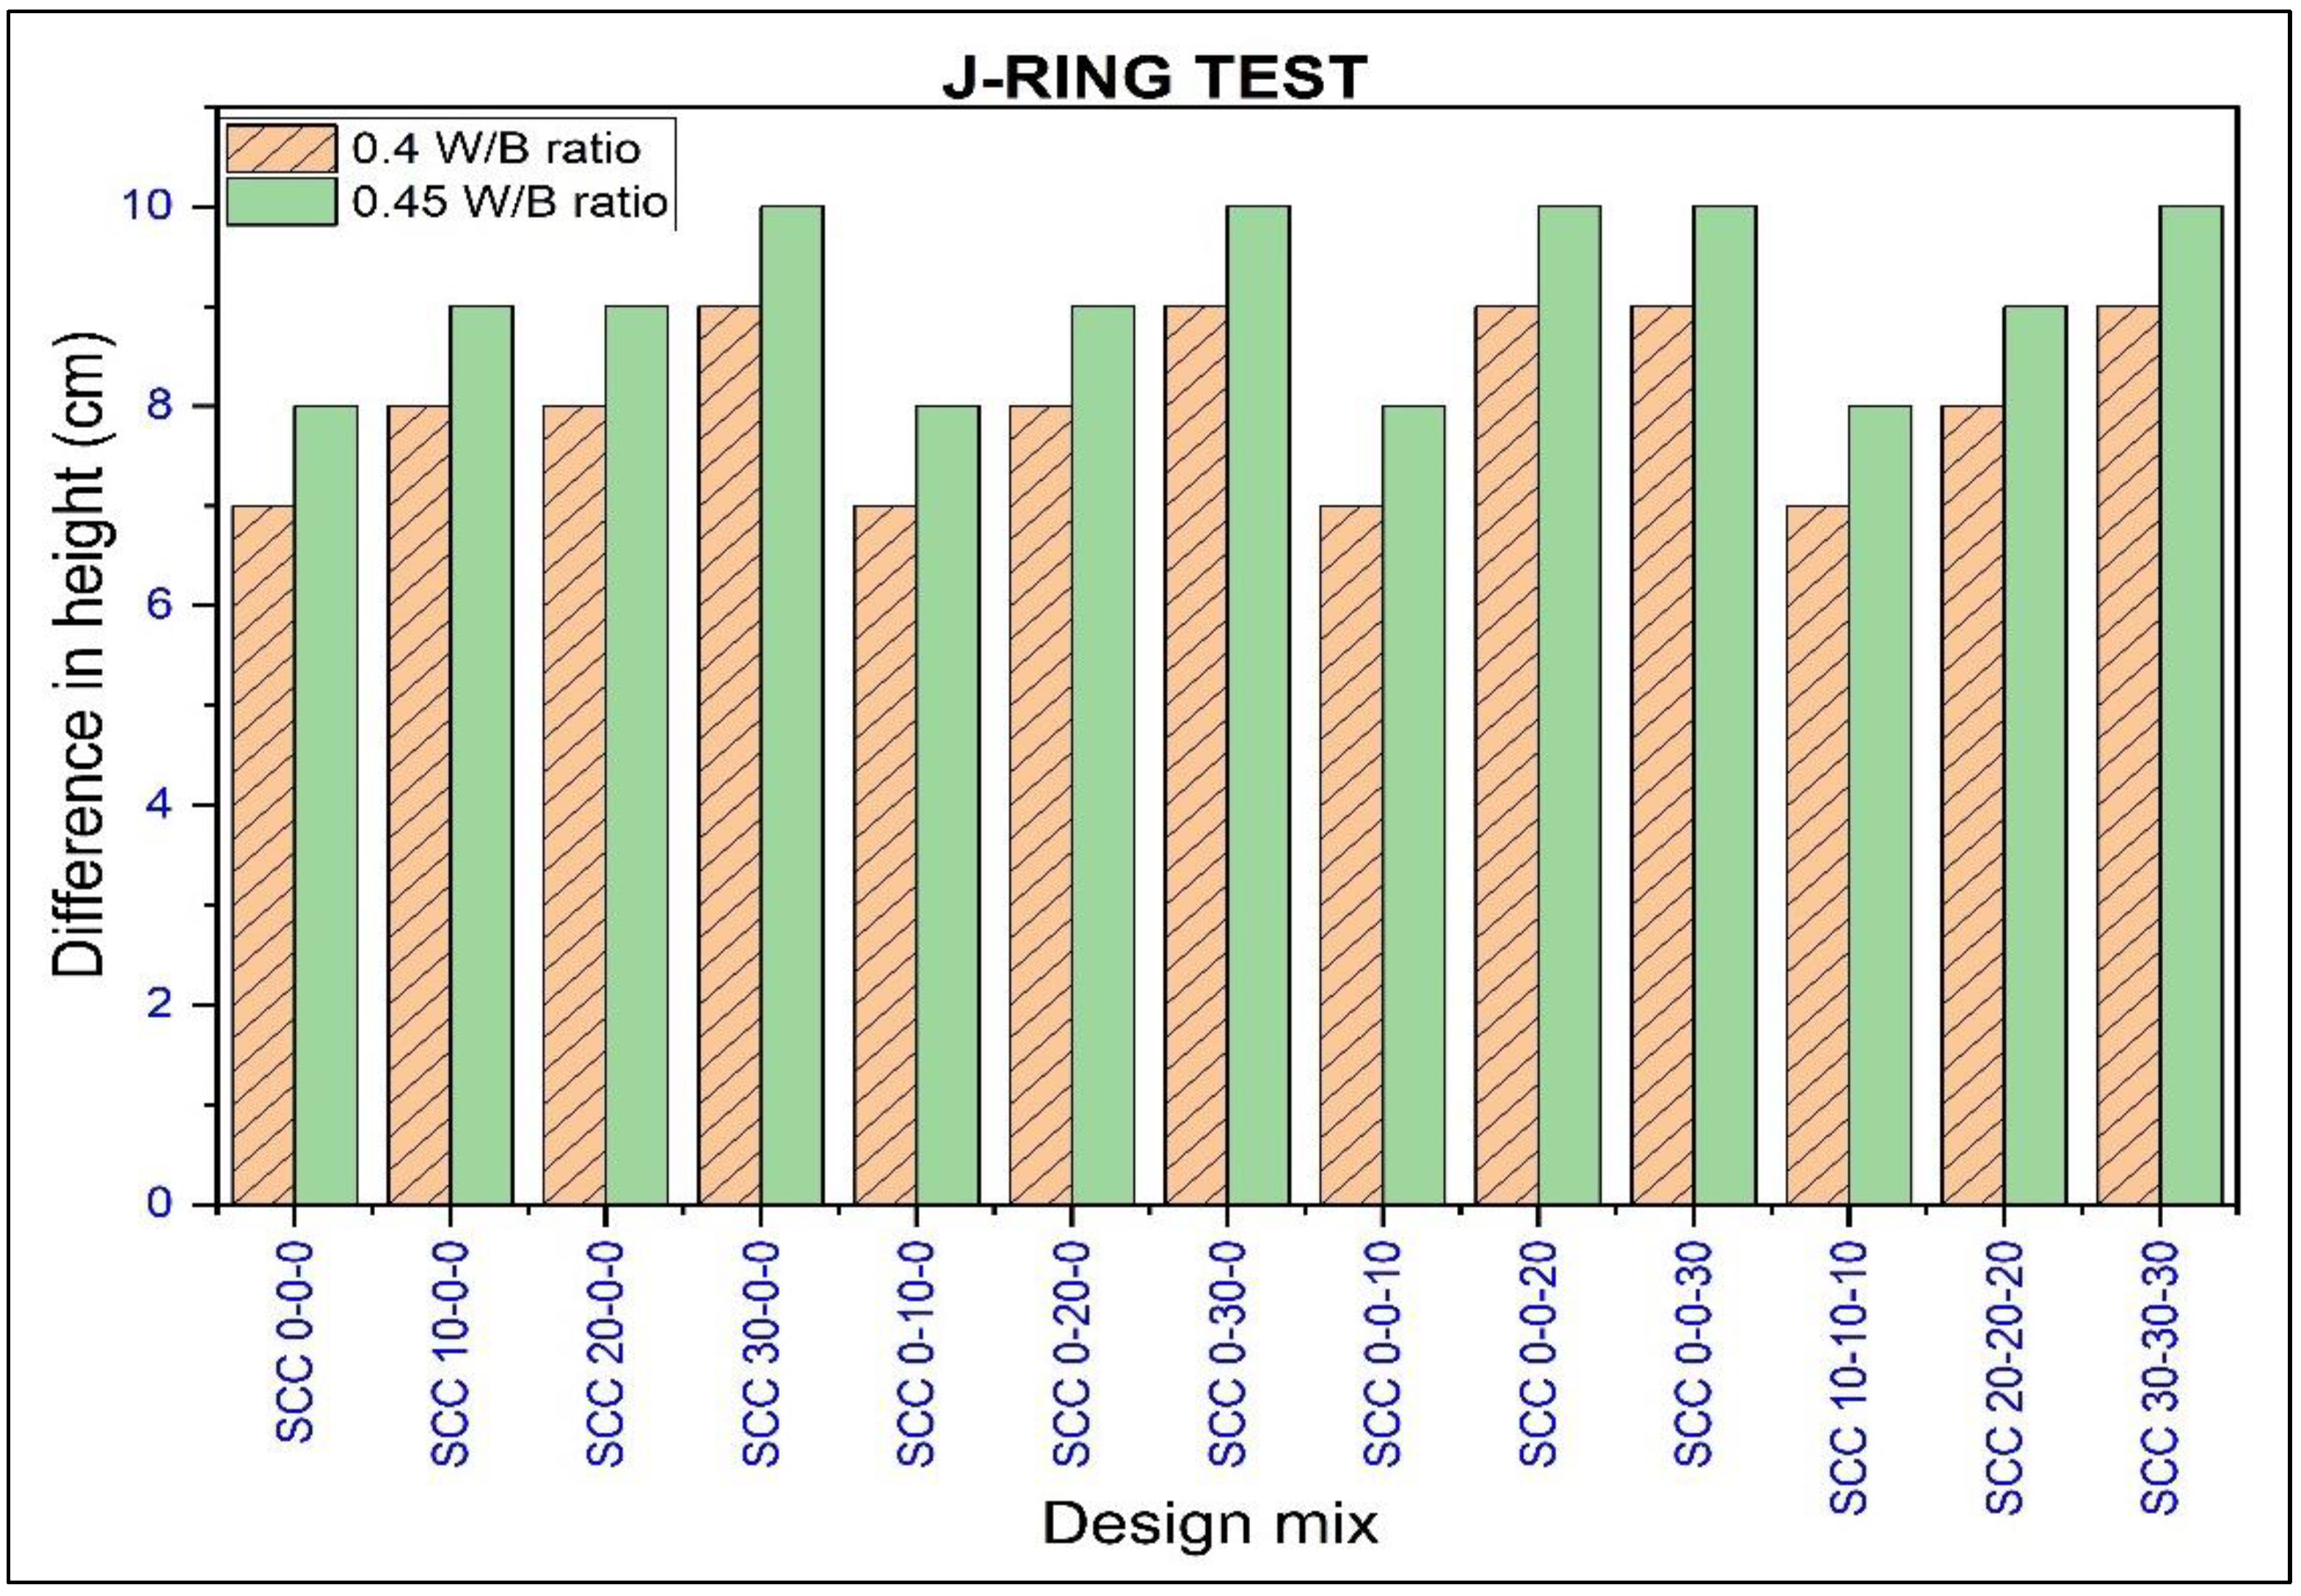
- J-Ring
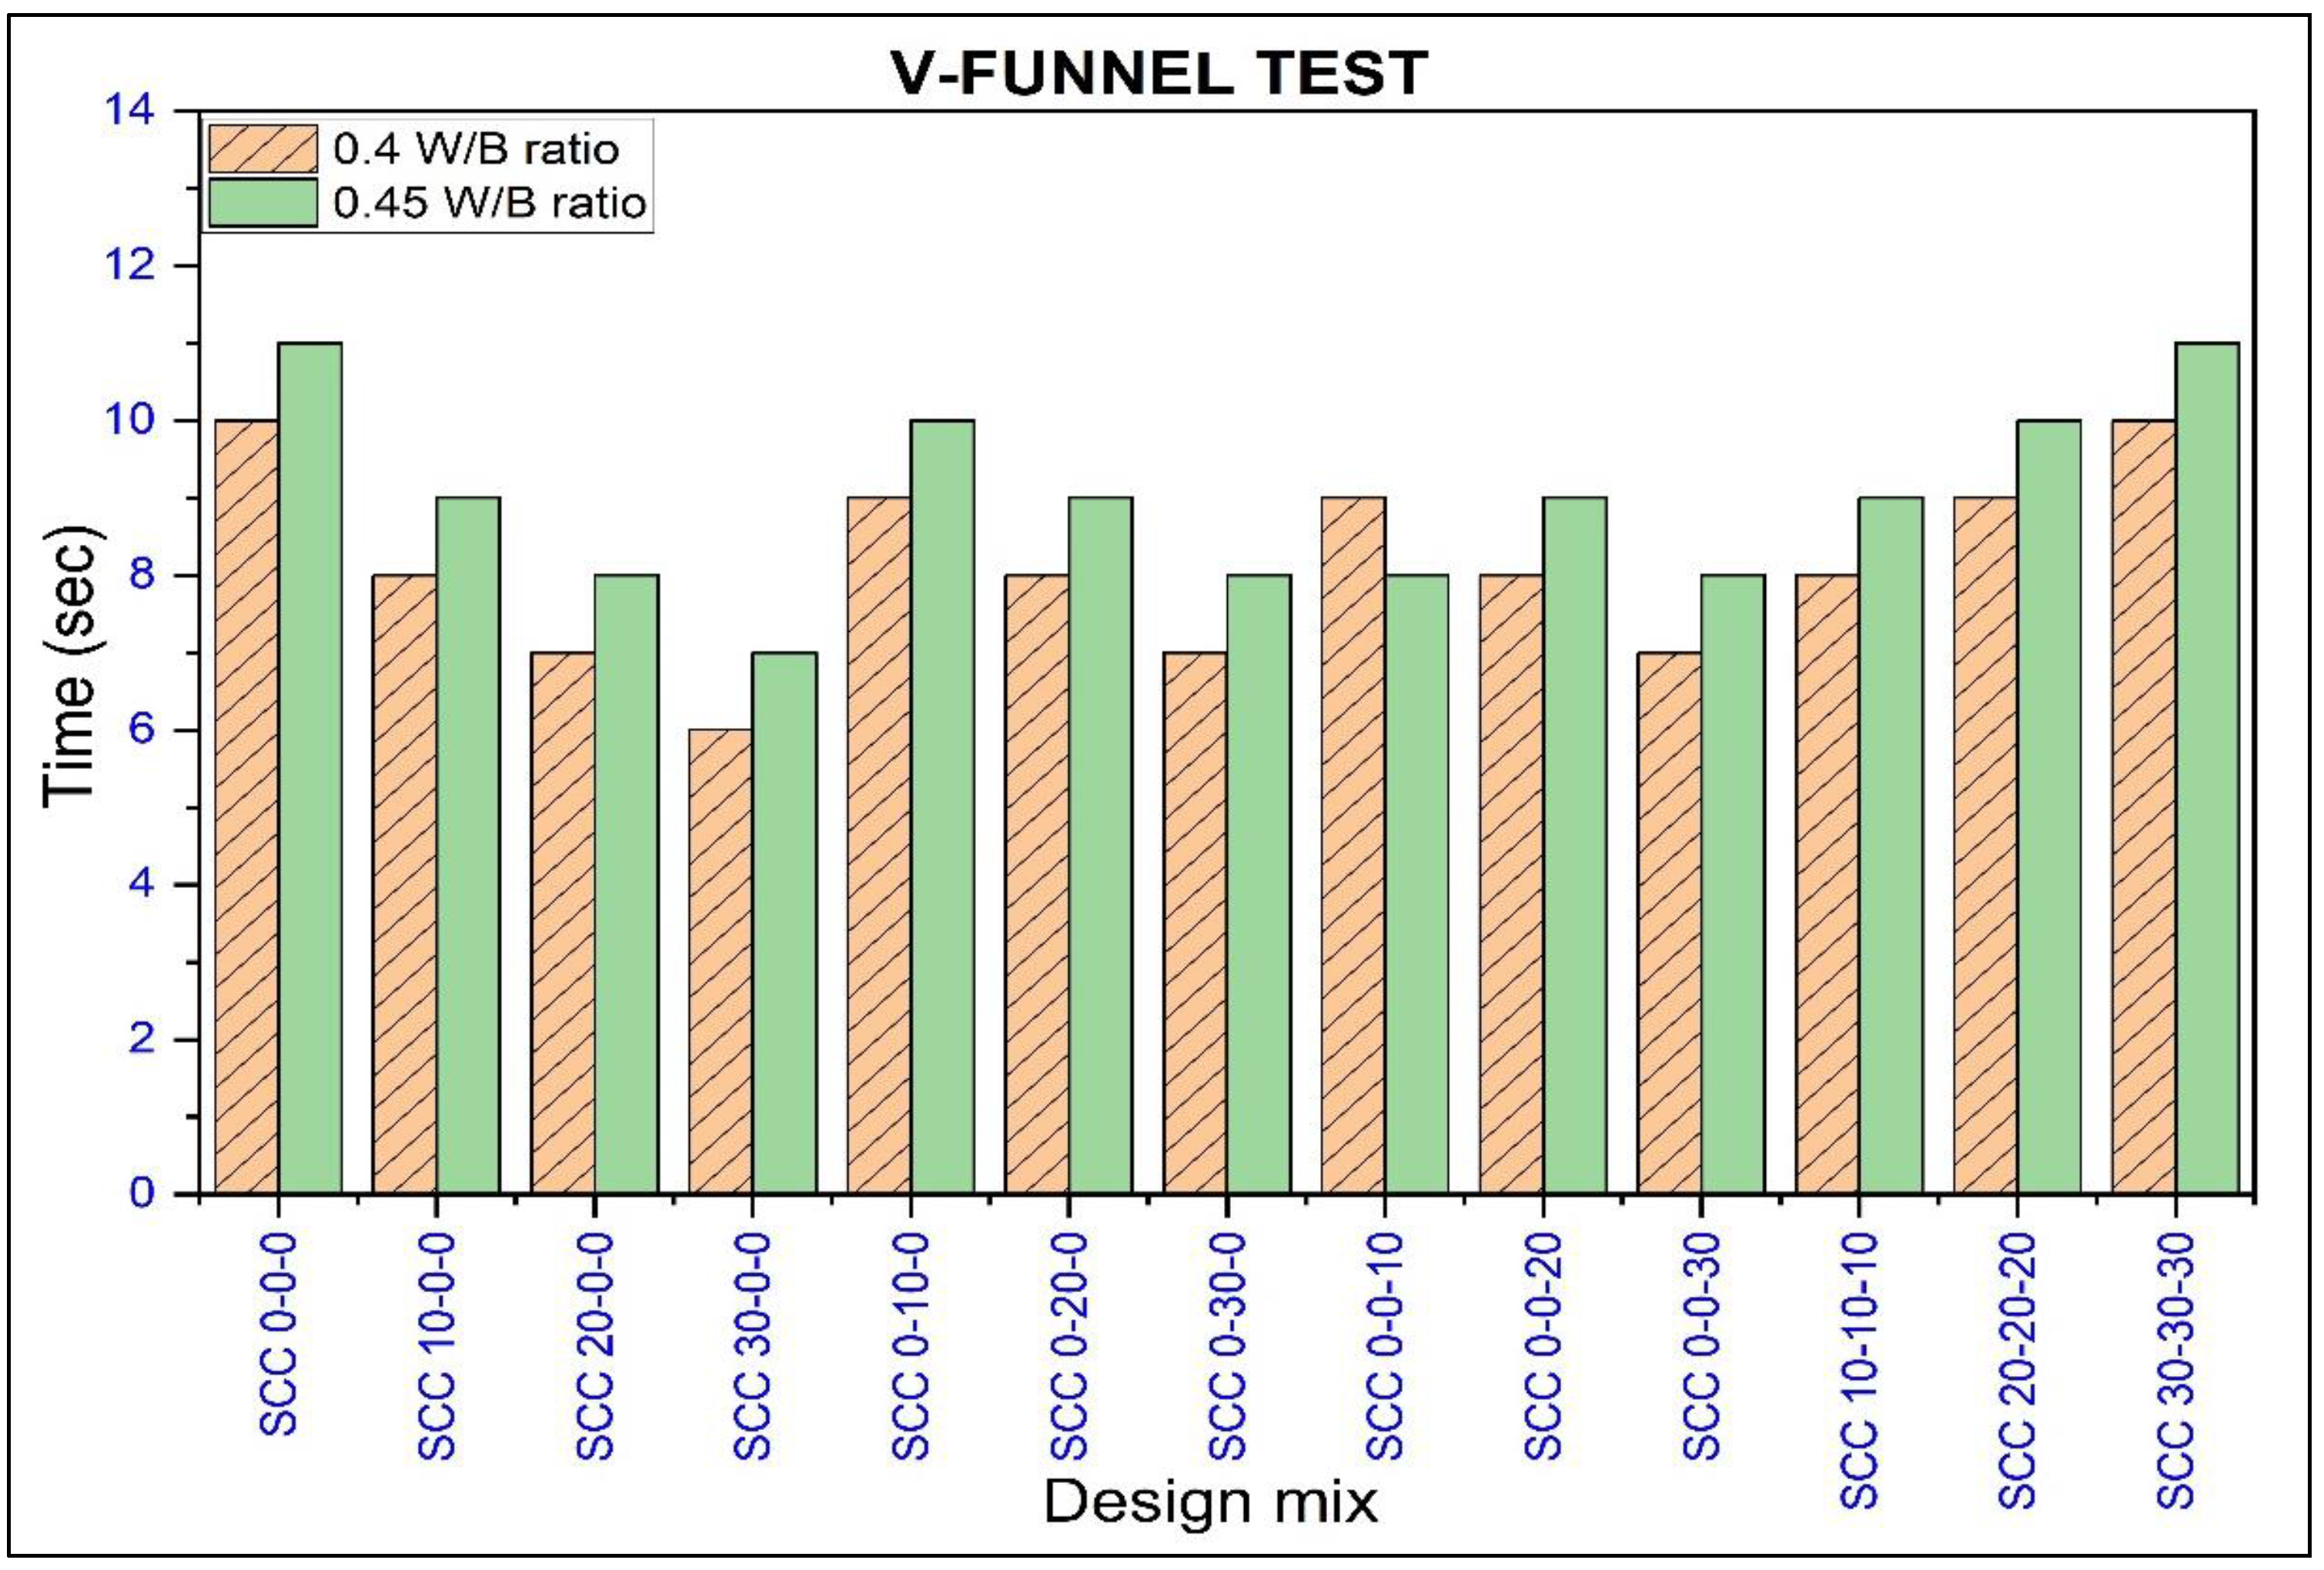
- V-funnel
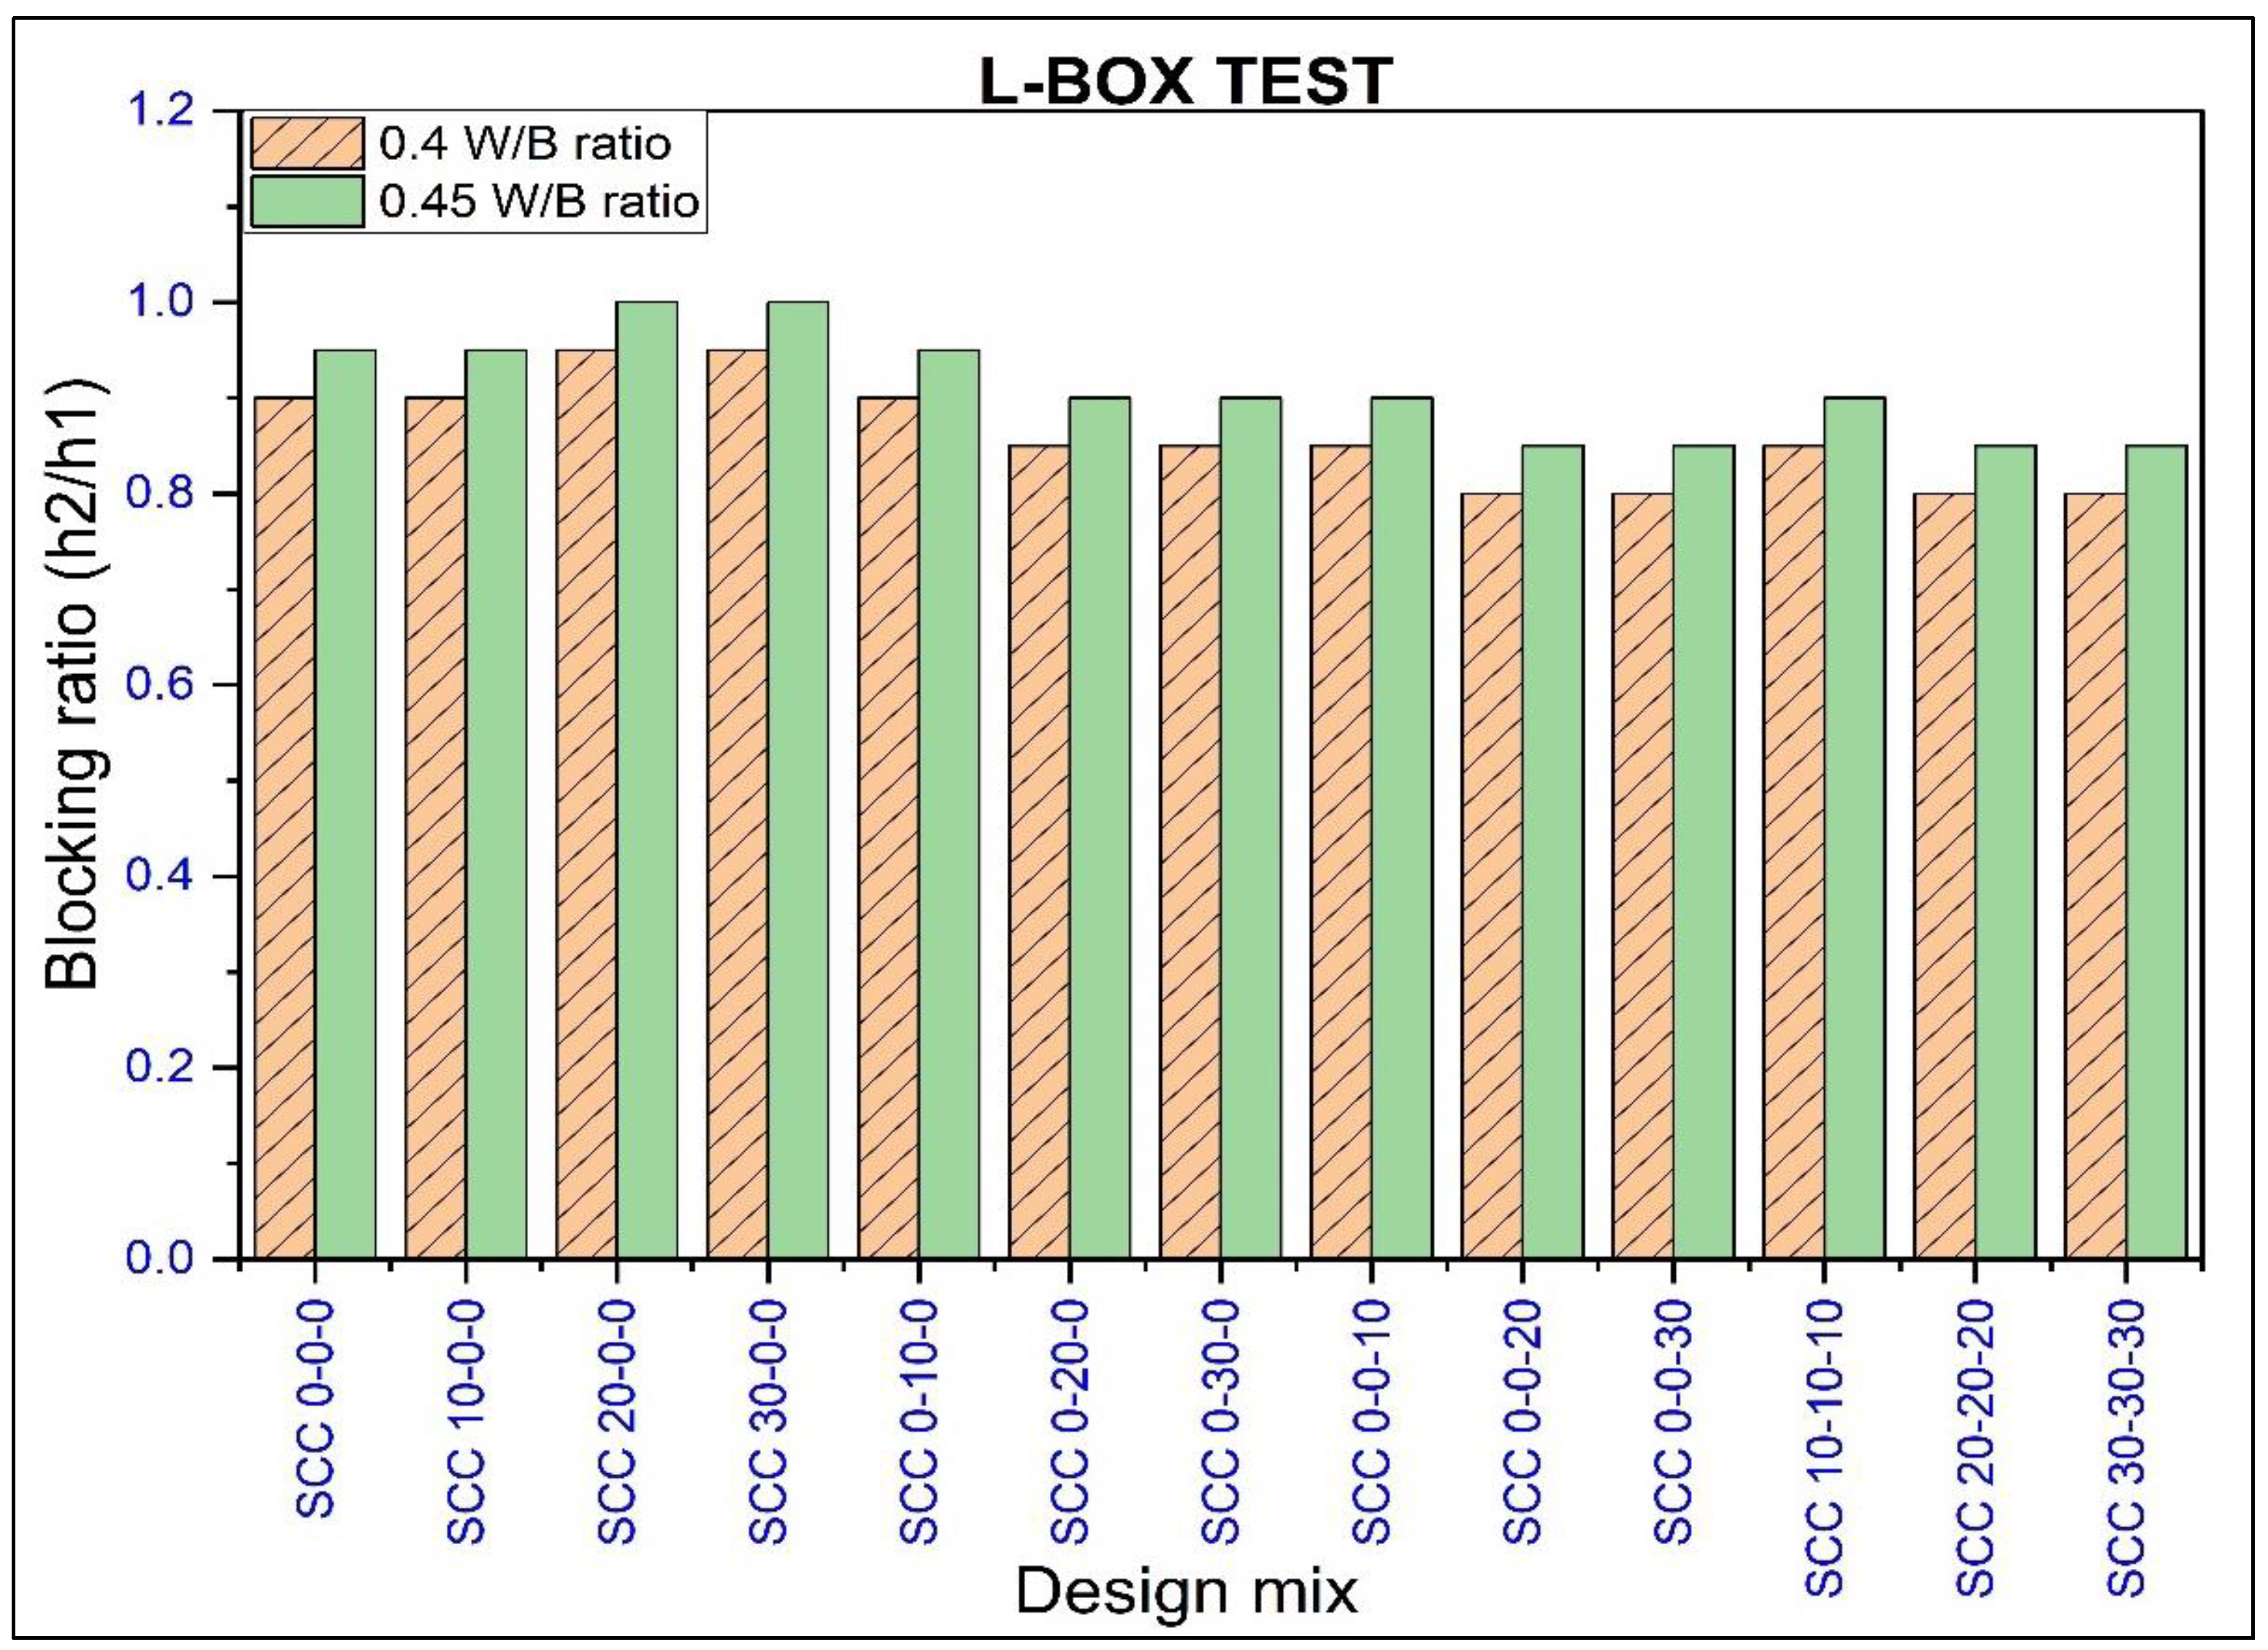
- L-Box
3.2.2. Hardened Properties of Concrete
3.3. Theoretical Overview
3.3.1. Artificial Neural Networks (ANN)
3.3.2. Gradient Tree Boosting (GTB)
3.3.3. CatBoost Regressor (CBR)
3.4. Model Development
3.5. Performance Evaluation
- Mean absolute error (MAE):
- Root-mean-square error (RMSE):
- Correlation coefficient:
- Willmott index:
- Nash–Sutcliffe efficiency (NSE)
- Kling–Gupta efficiency (KGE)
- Symmetric mean absolute percentage error (SMAPE):where xi is the observed values, yi is the model-computed values, is the mean of the observed values, is the mean of the model-computed values, and n is the number of values.
4. Results and Discussion
4.1. Experimental Results
4.1.1. Fresh Properties
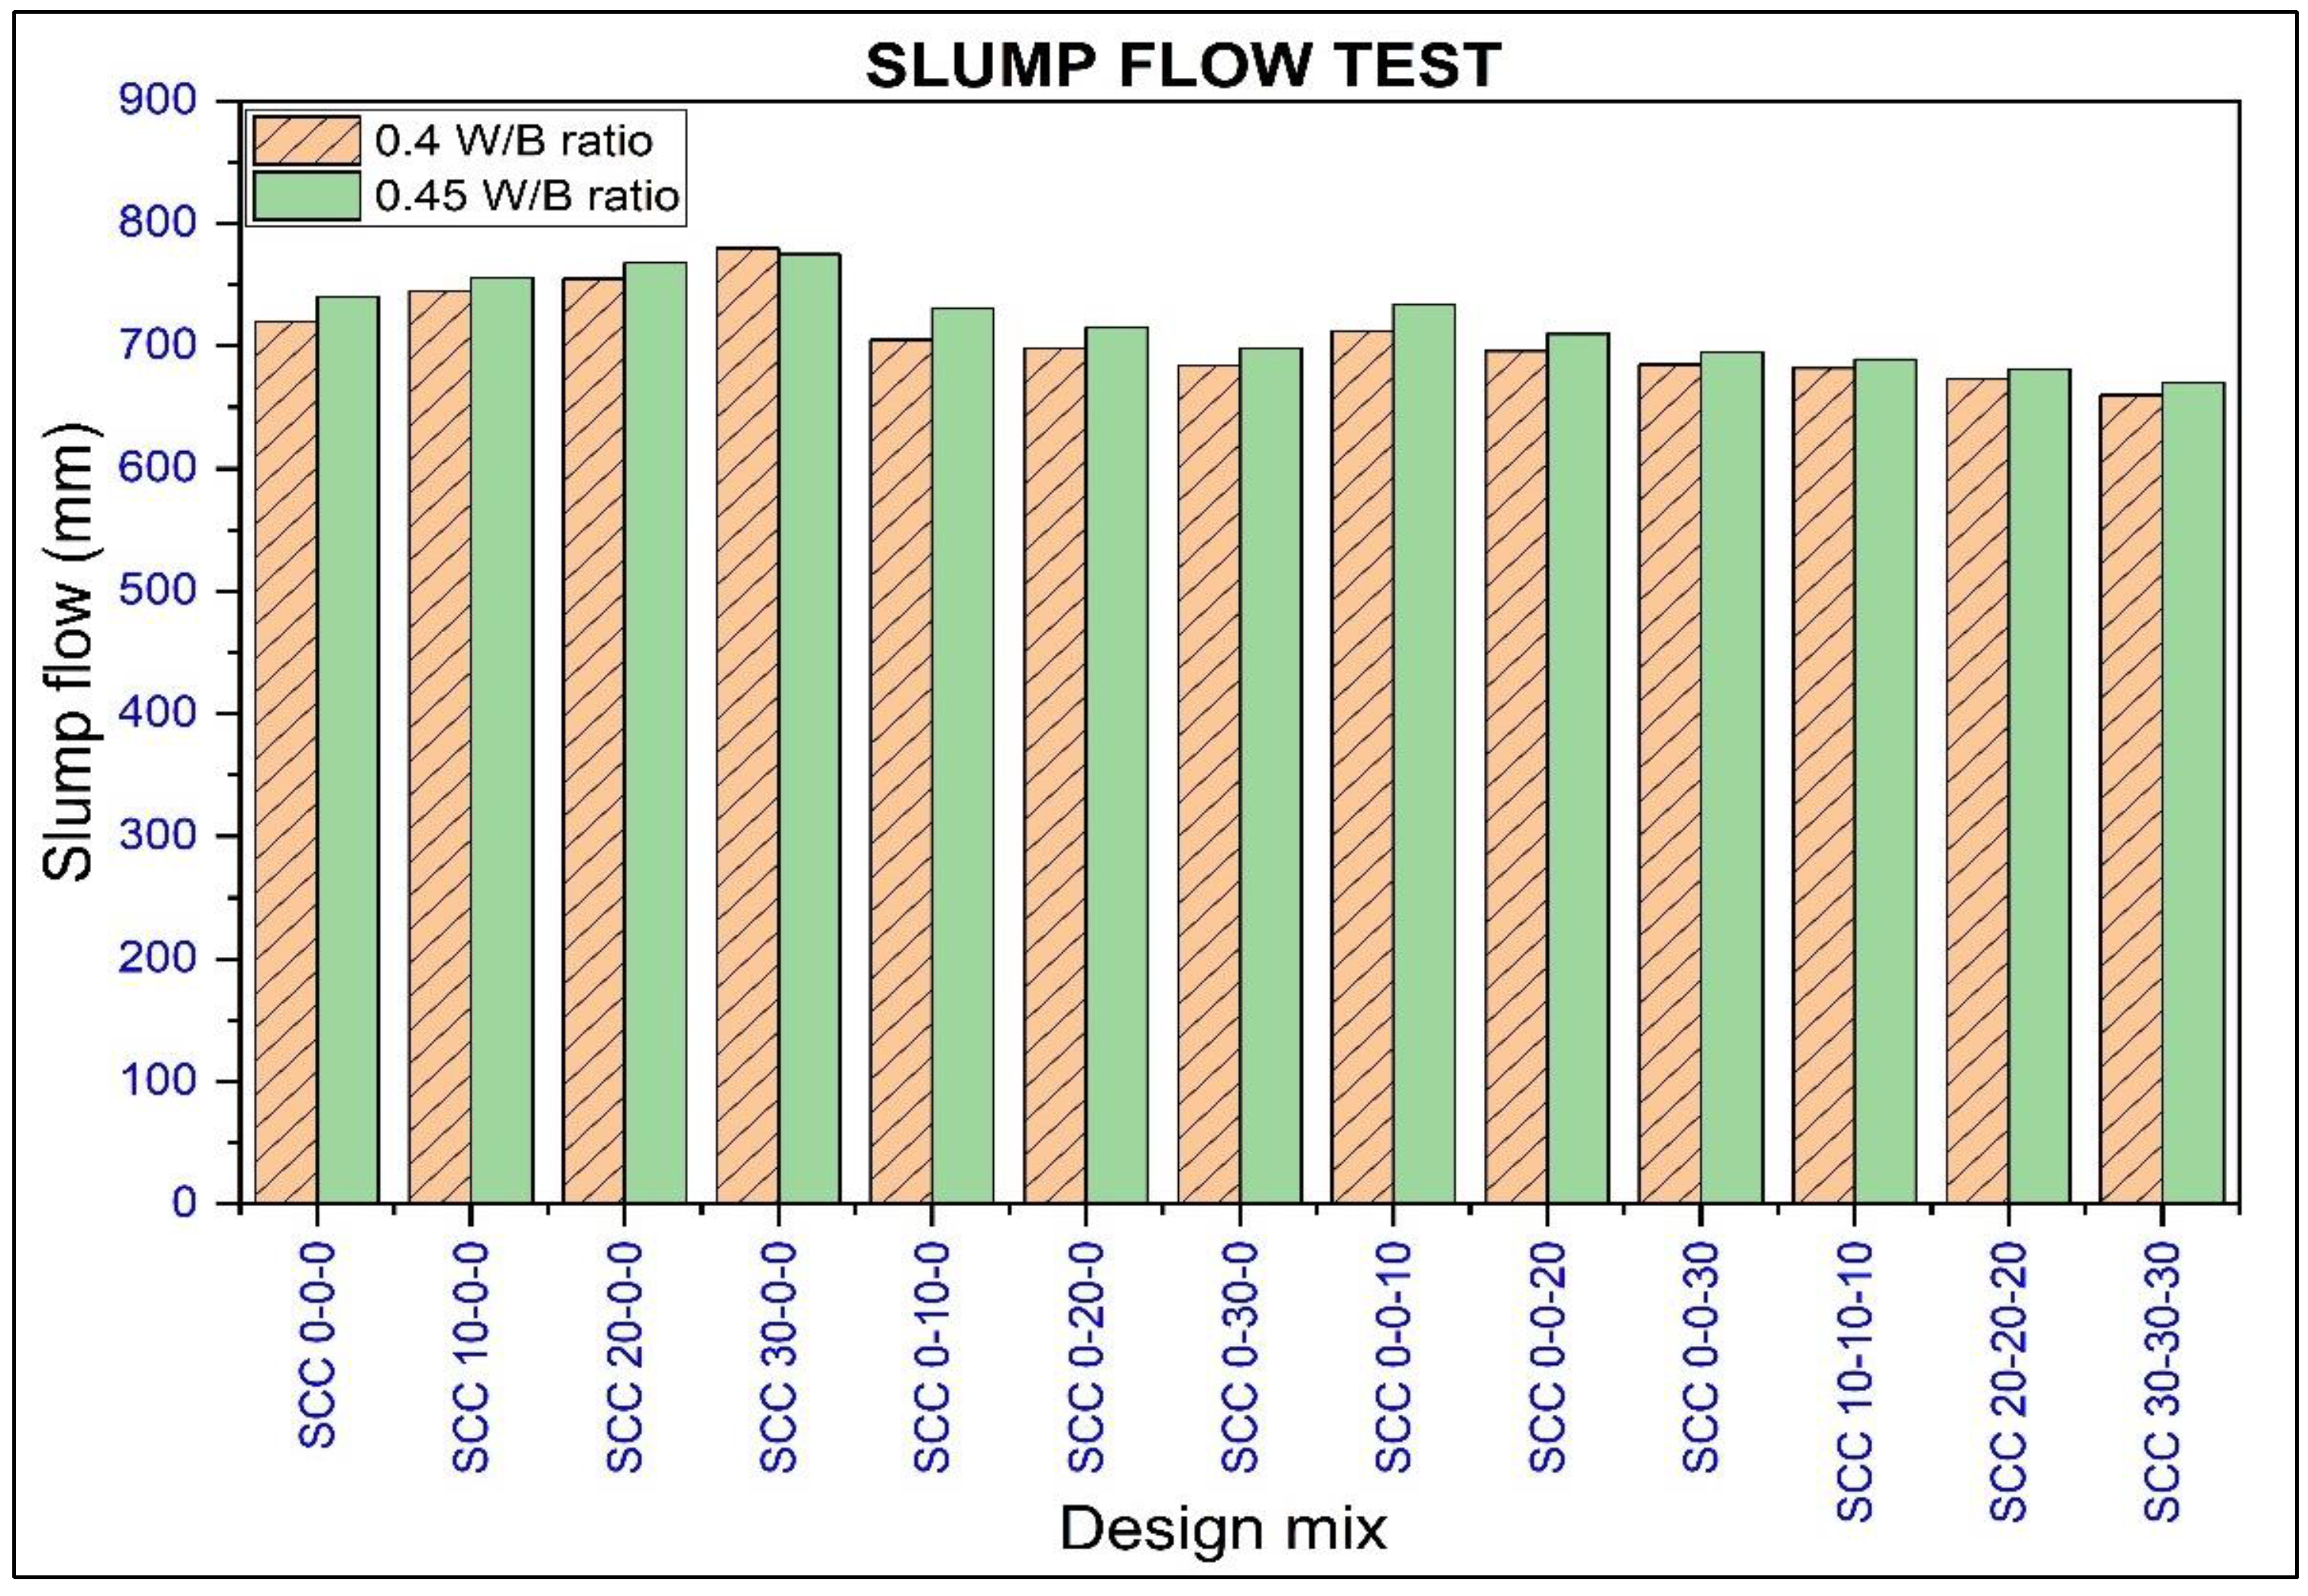
- Slump flow
- V-funnel
- L-box
- J-ring
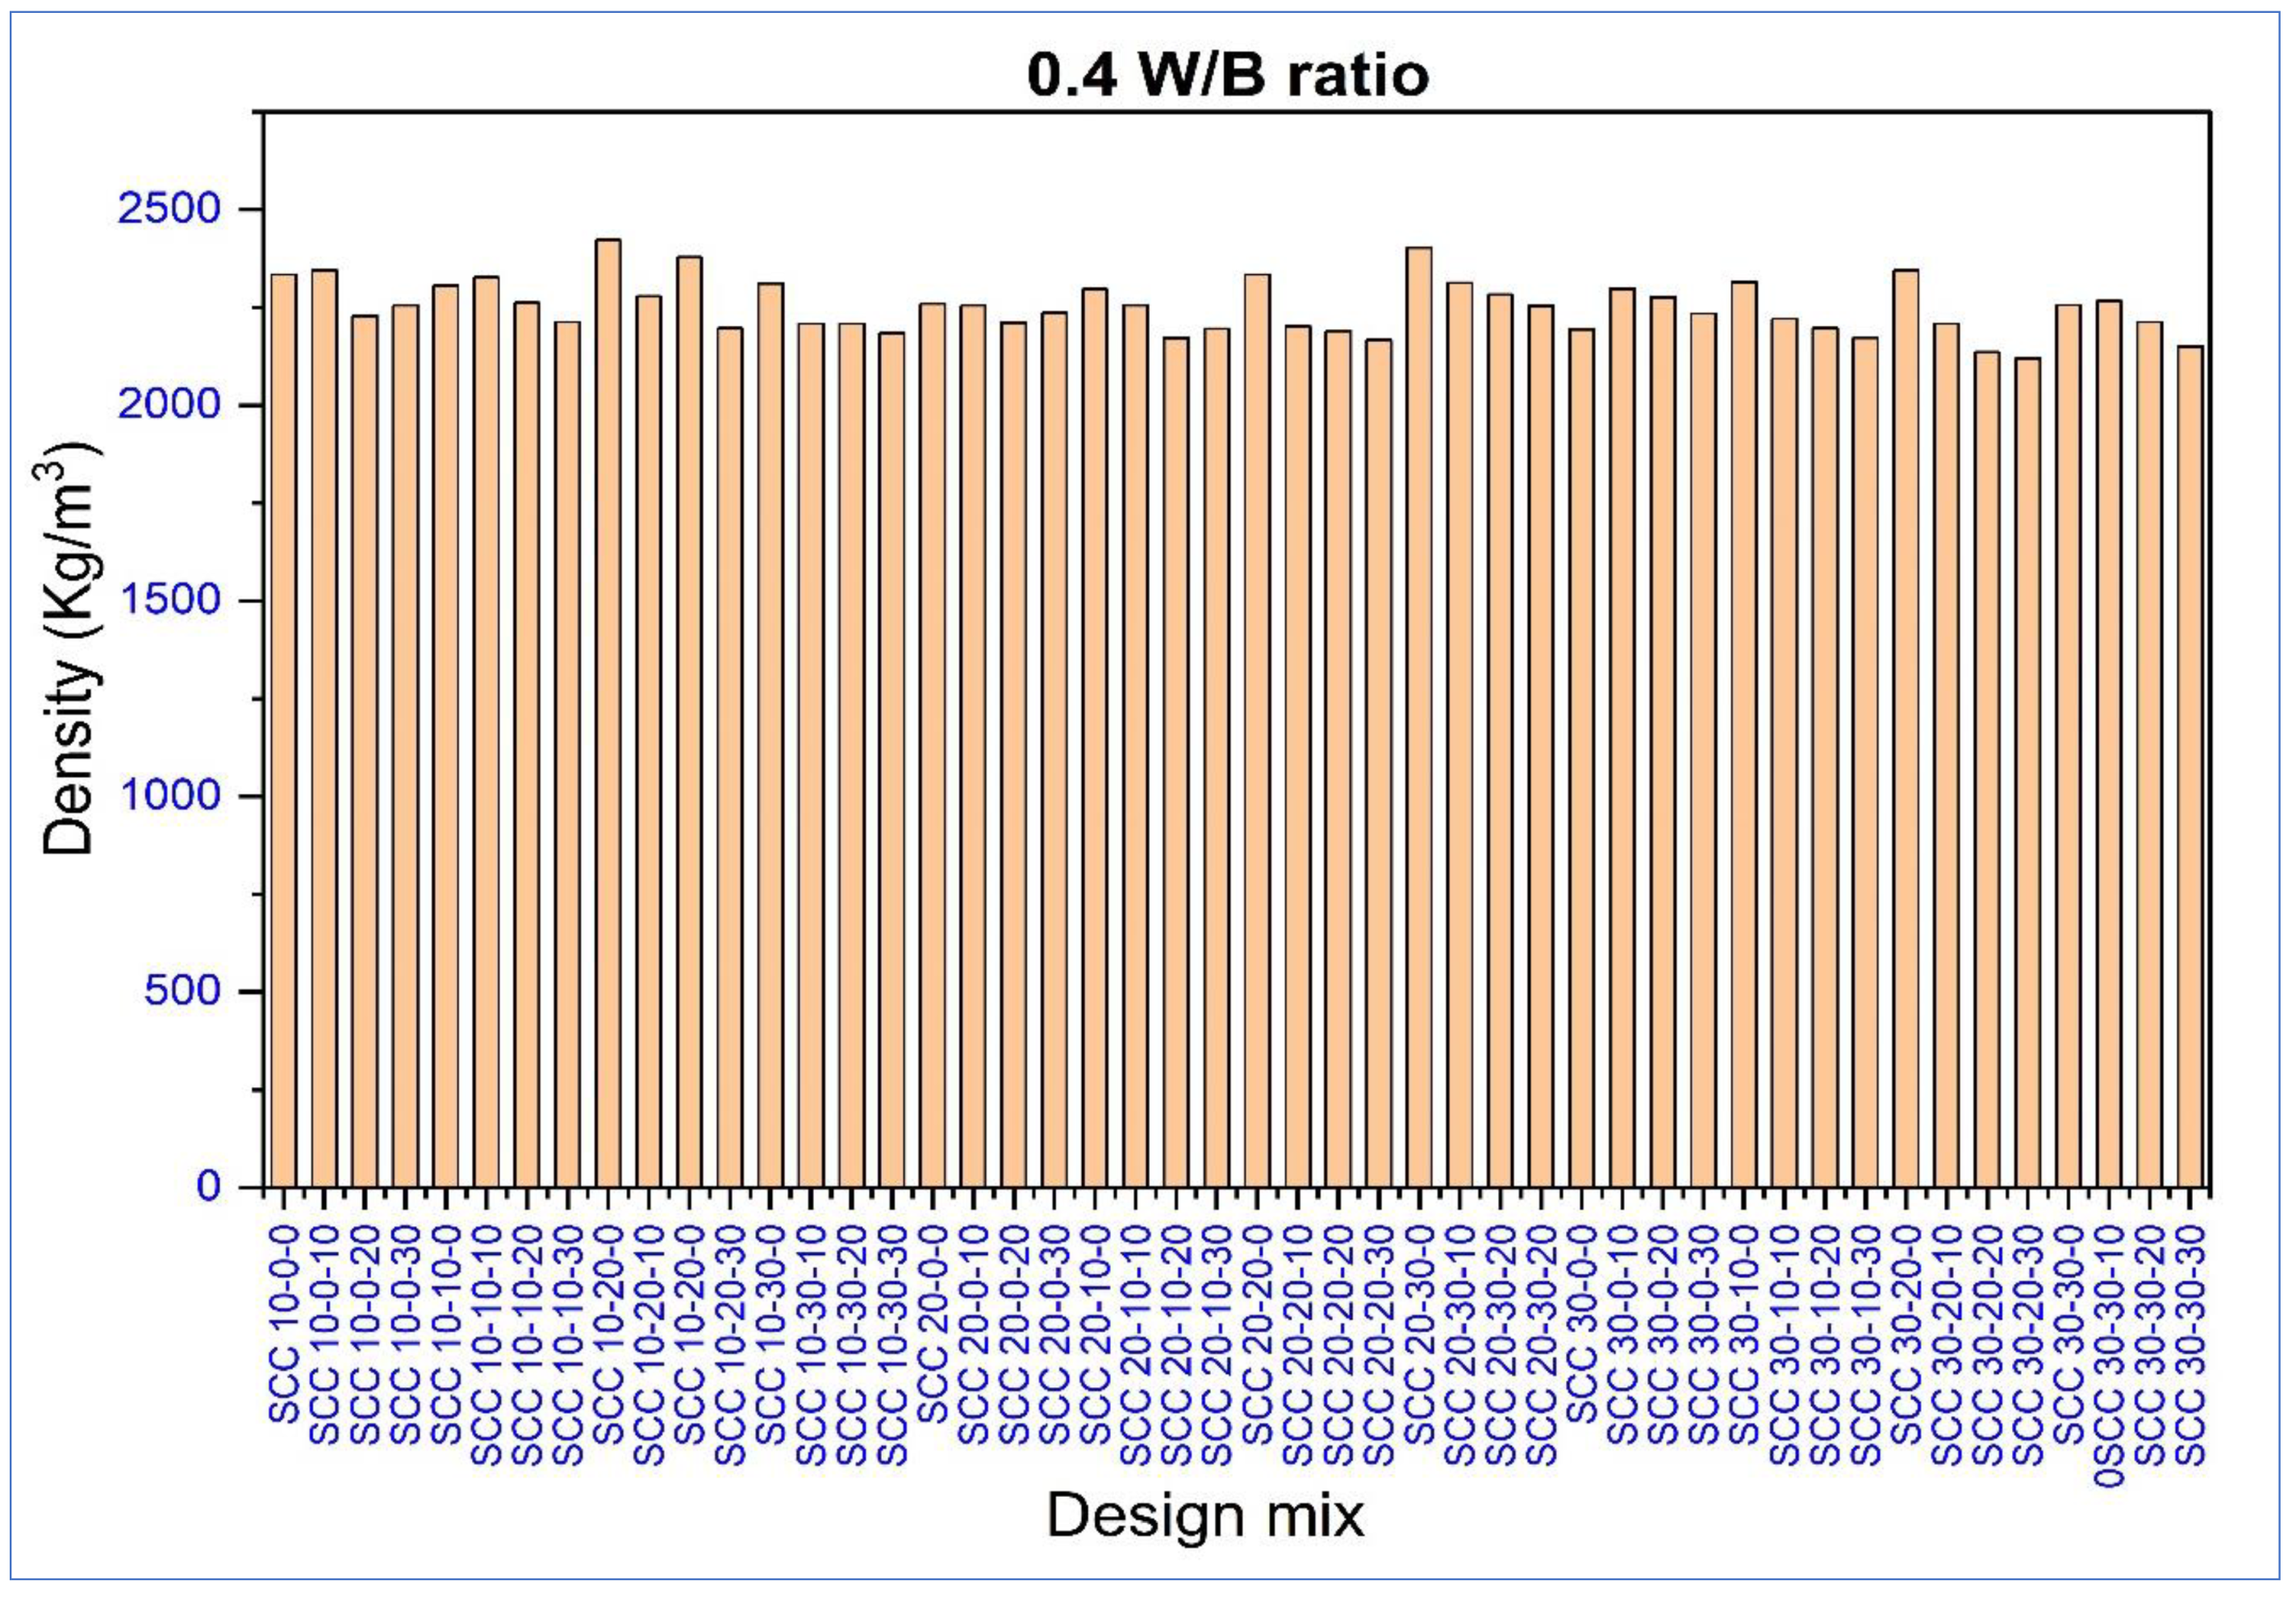
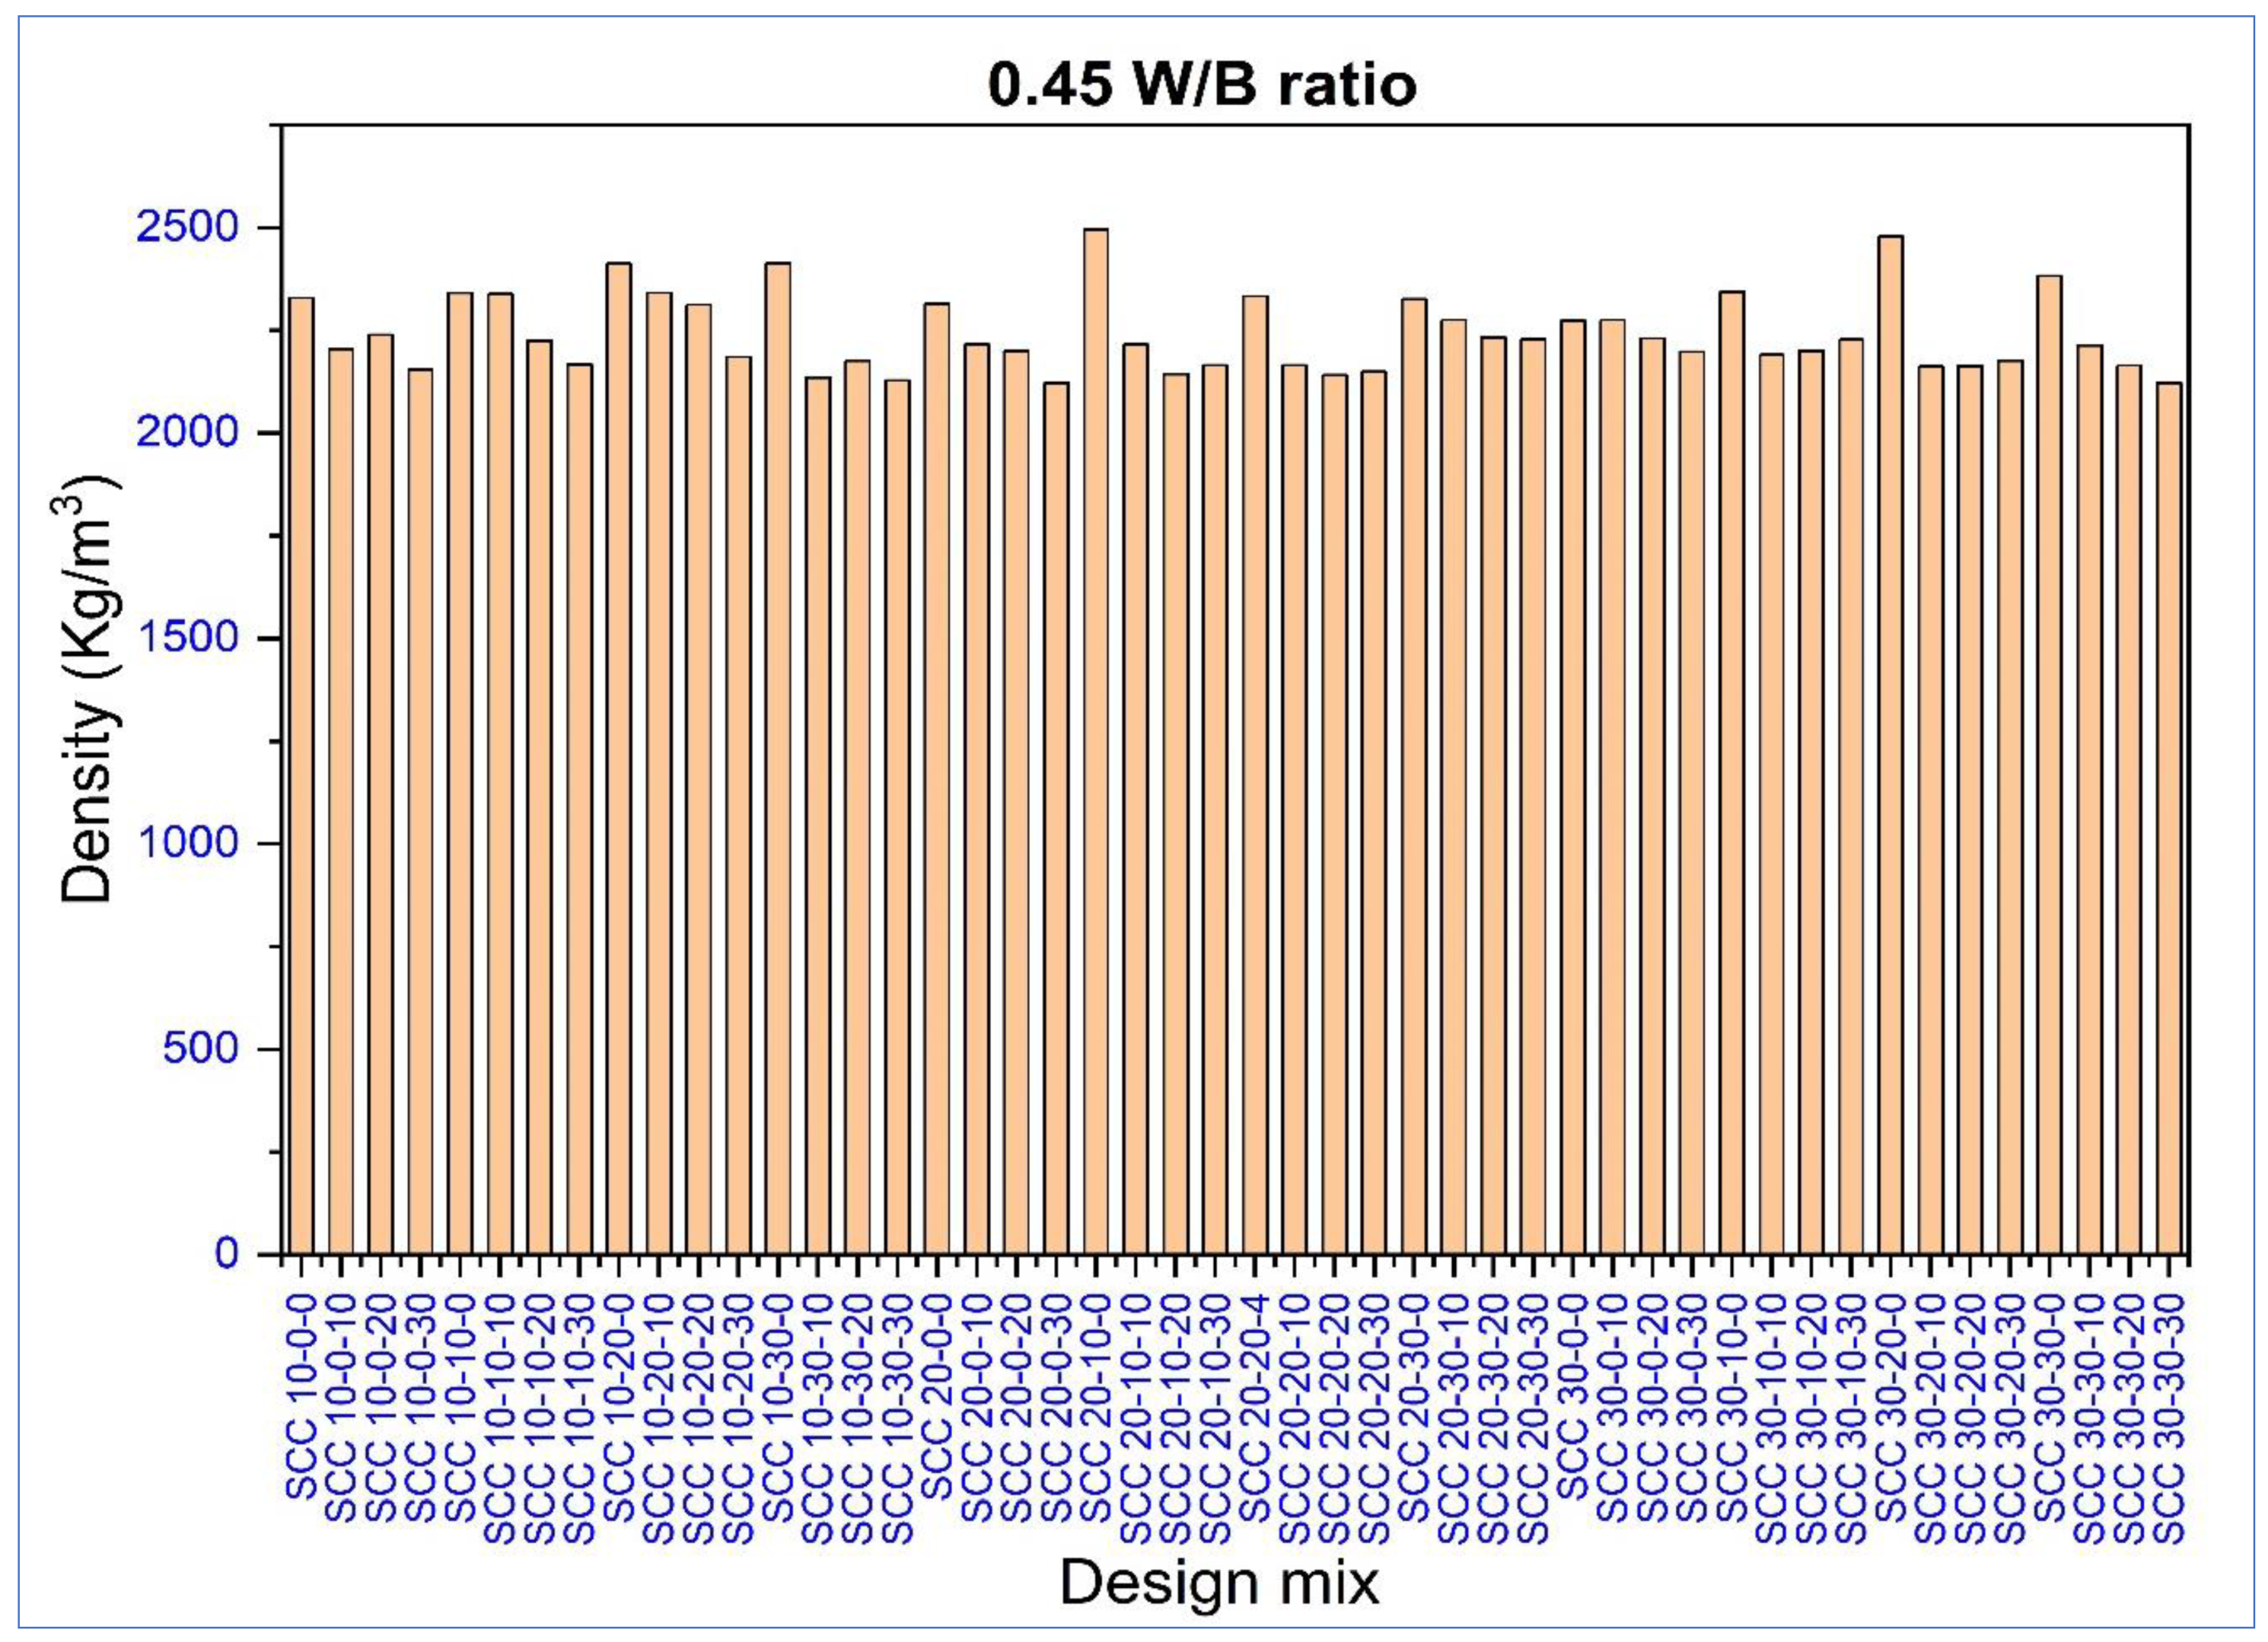
4.1.2. Hardened Properties of SCC Mixes
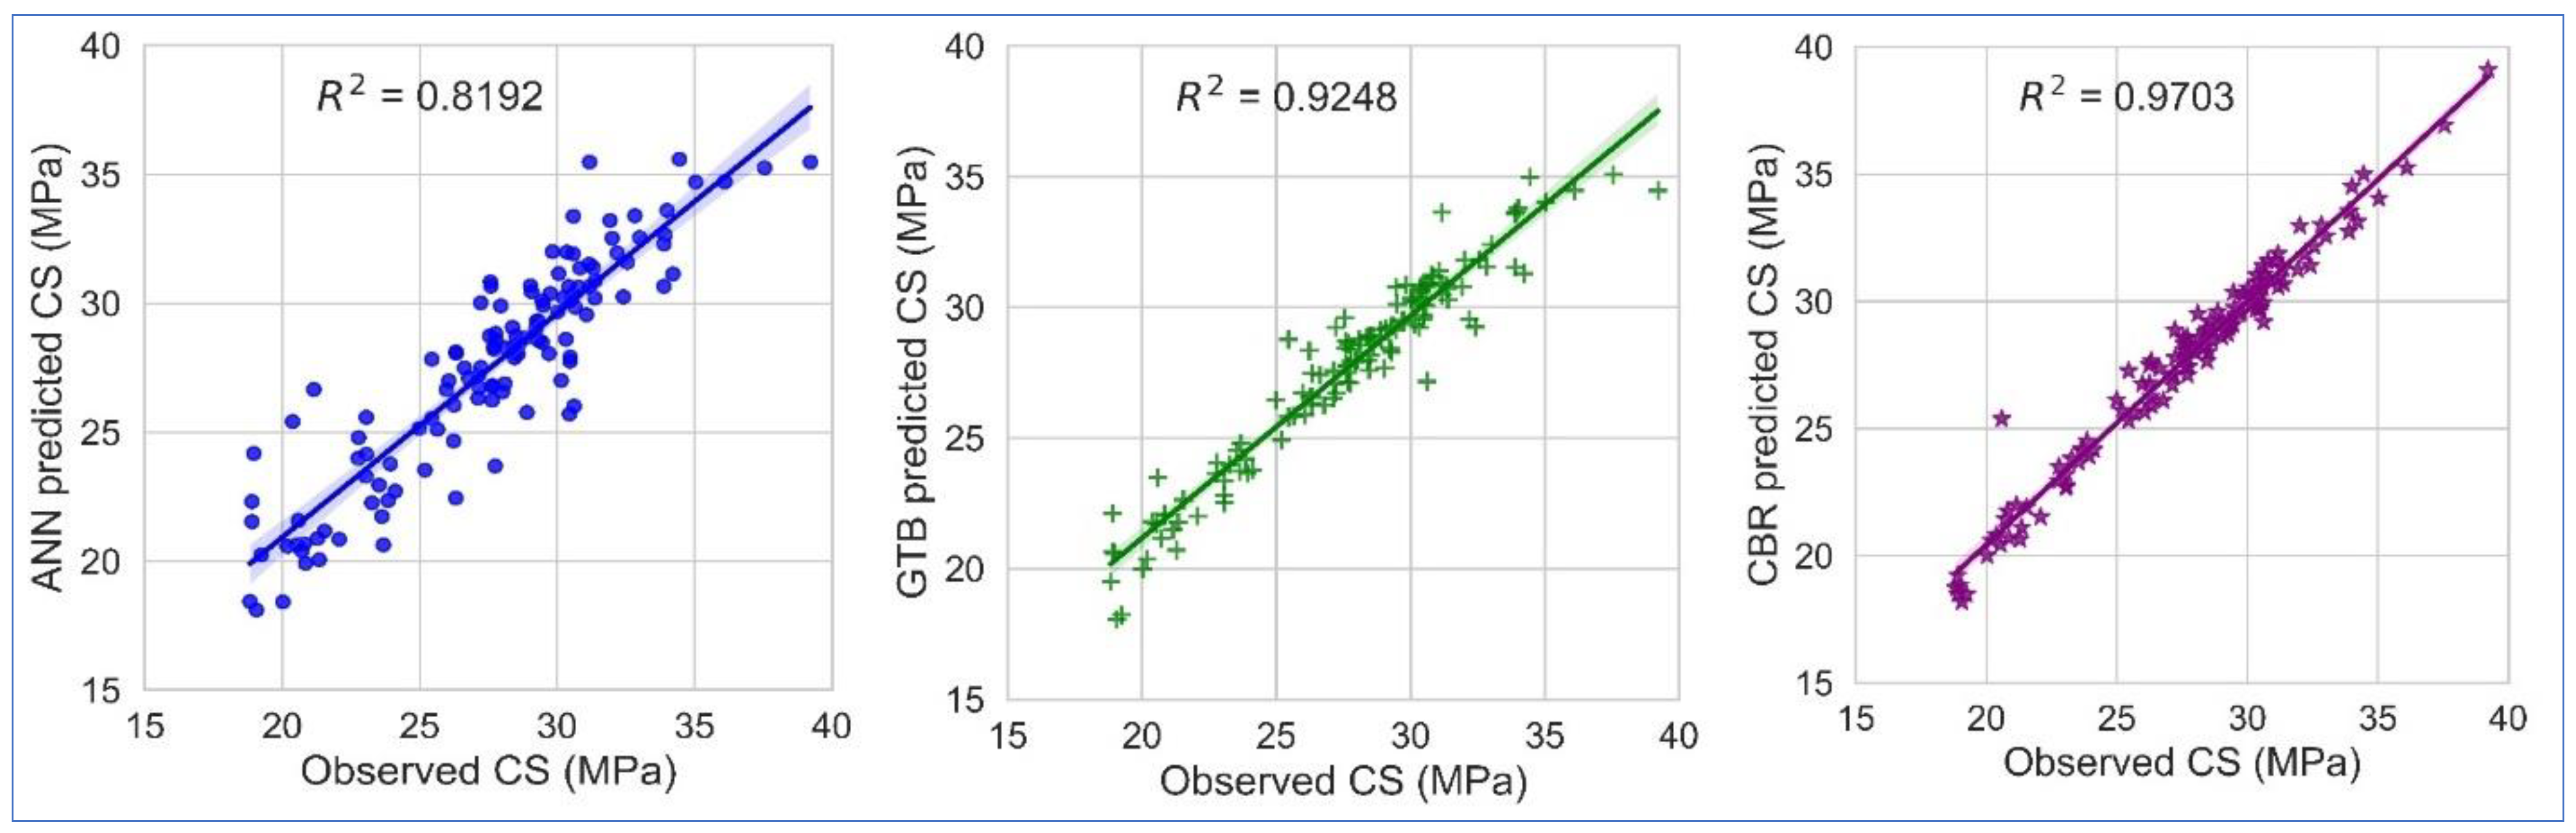
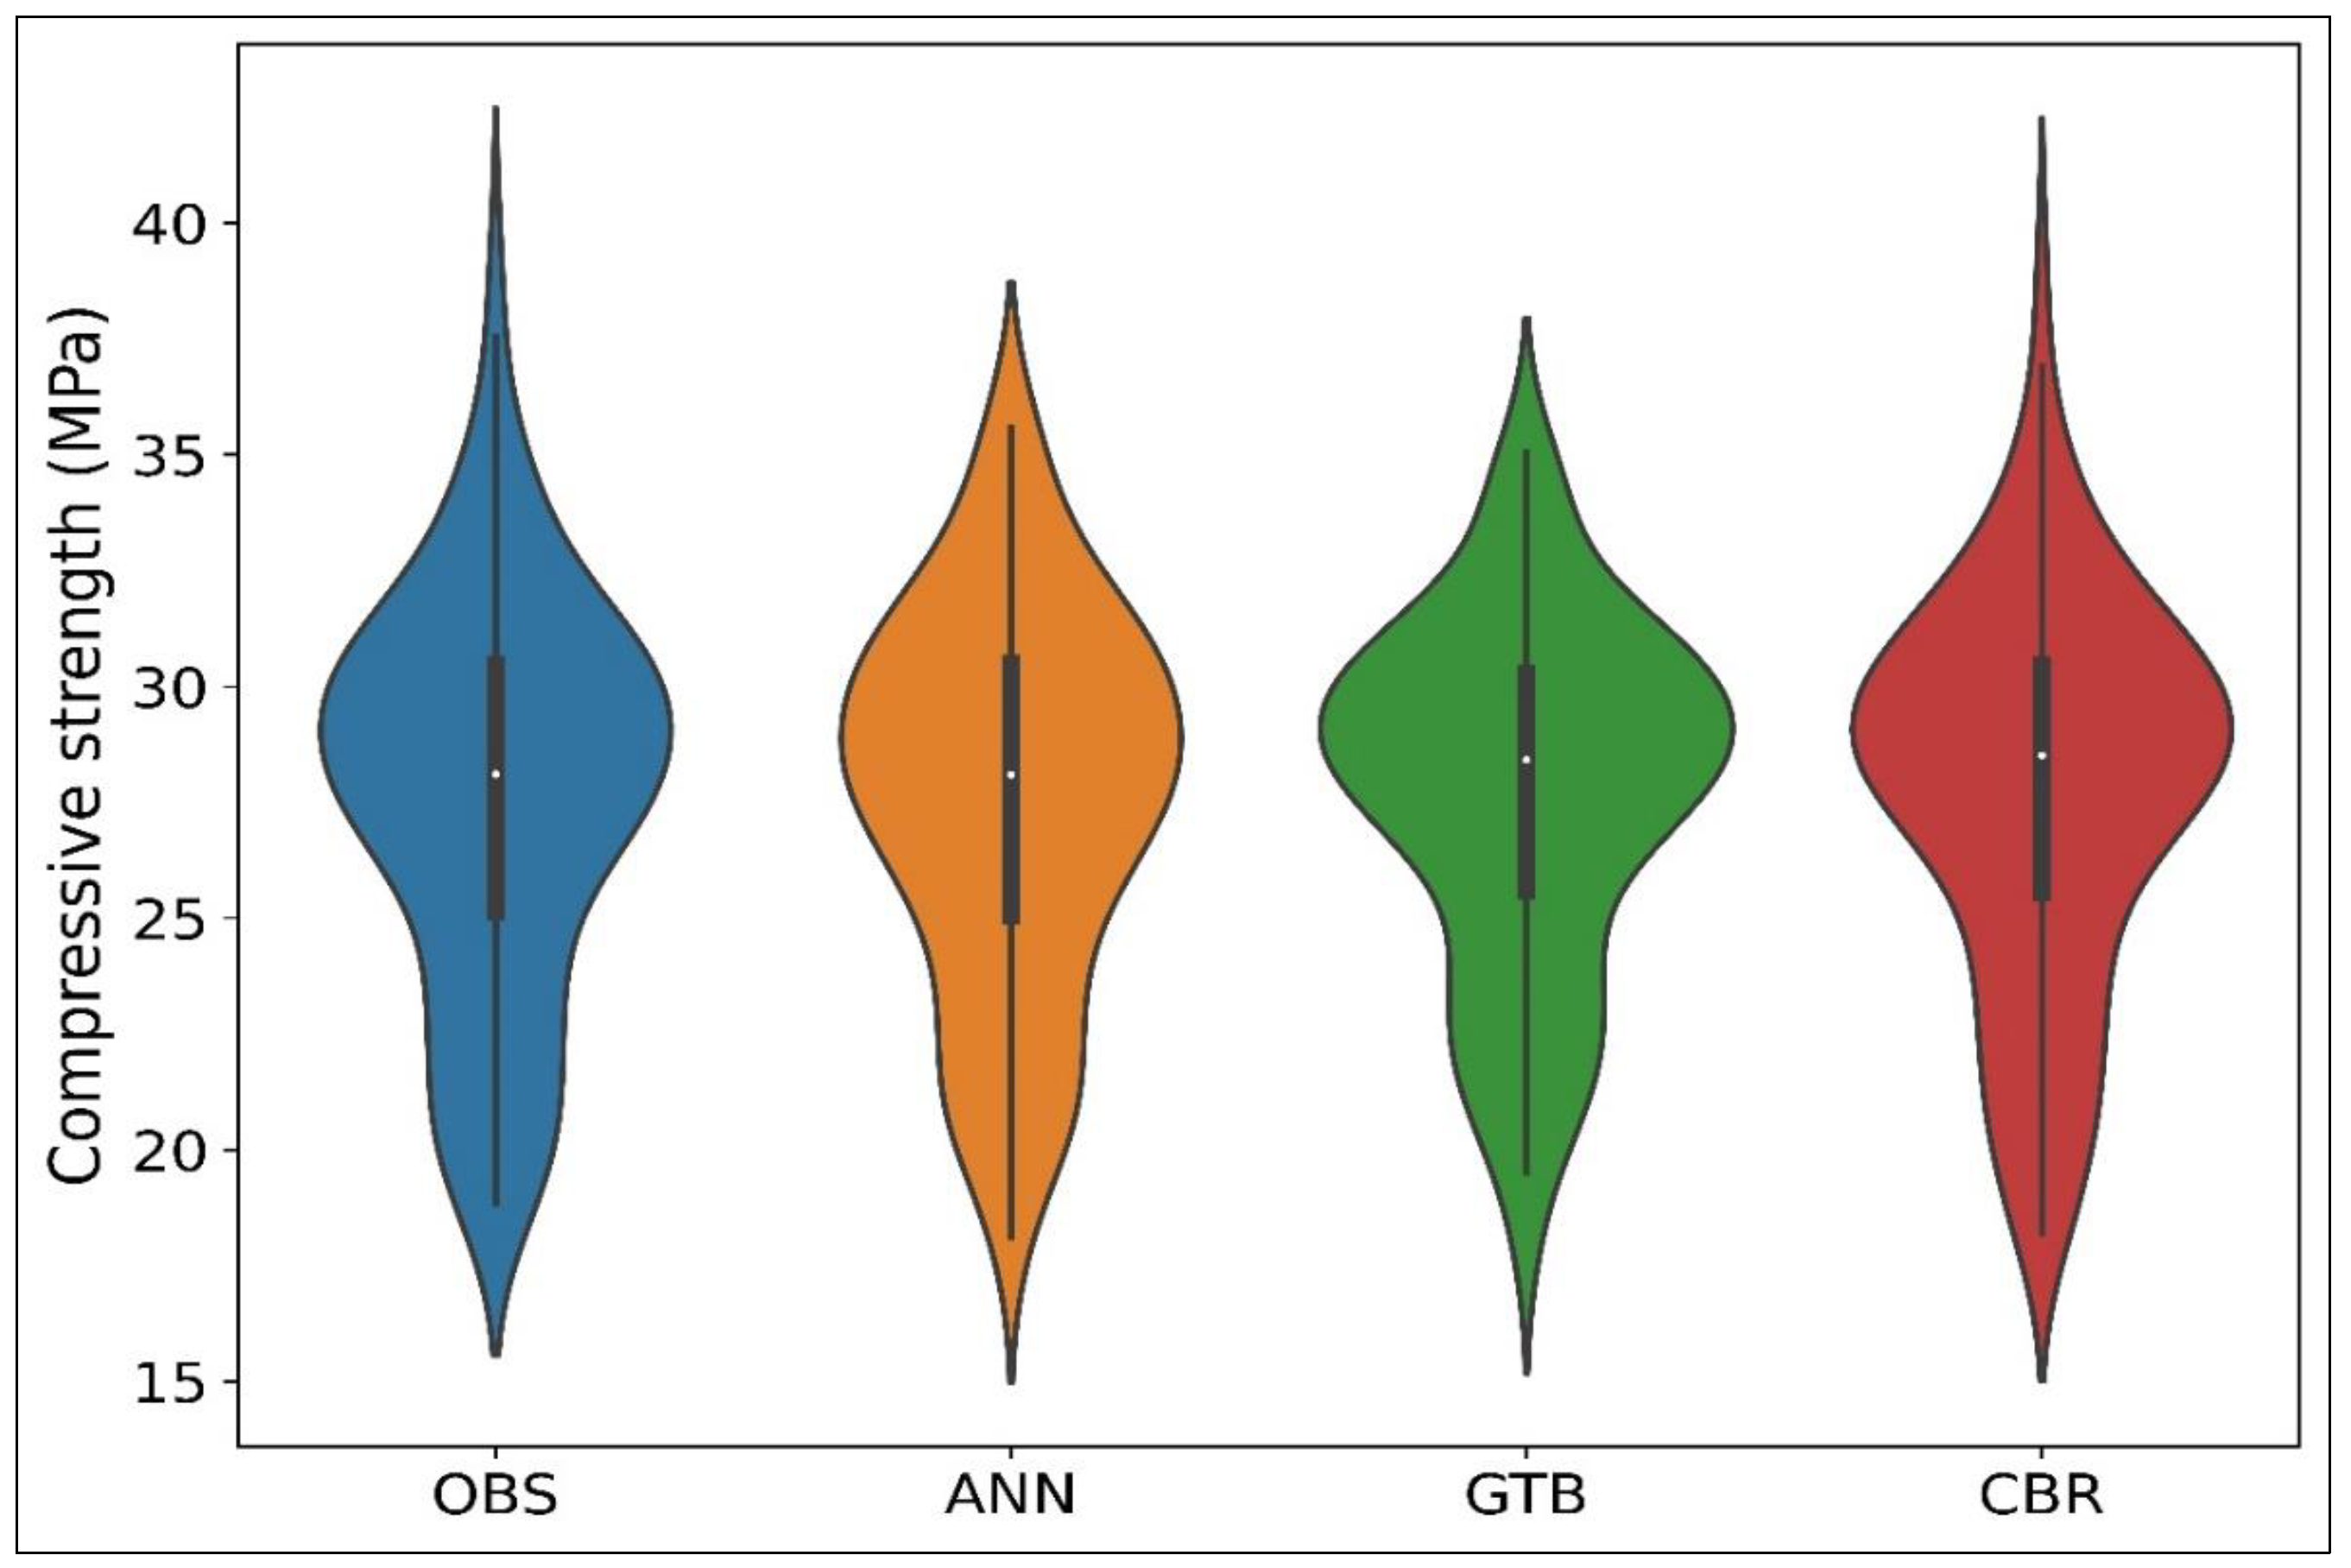
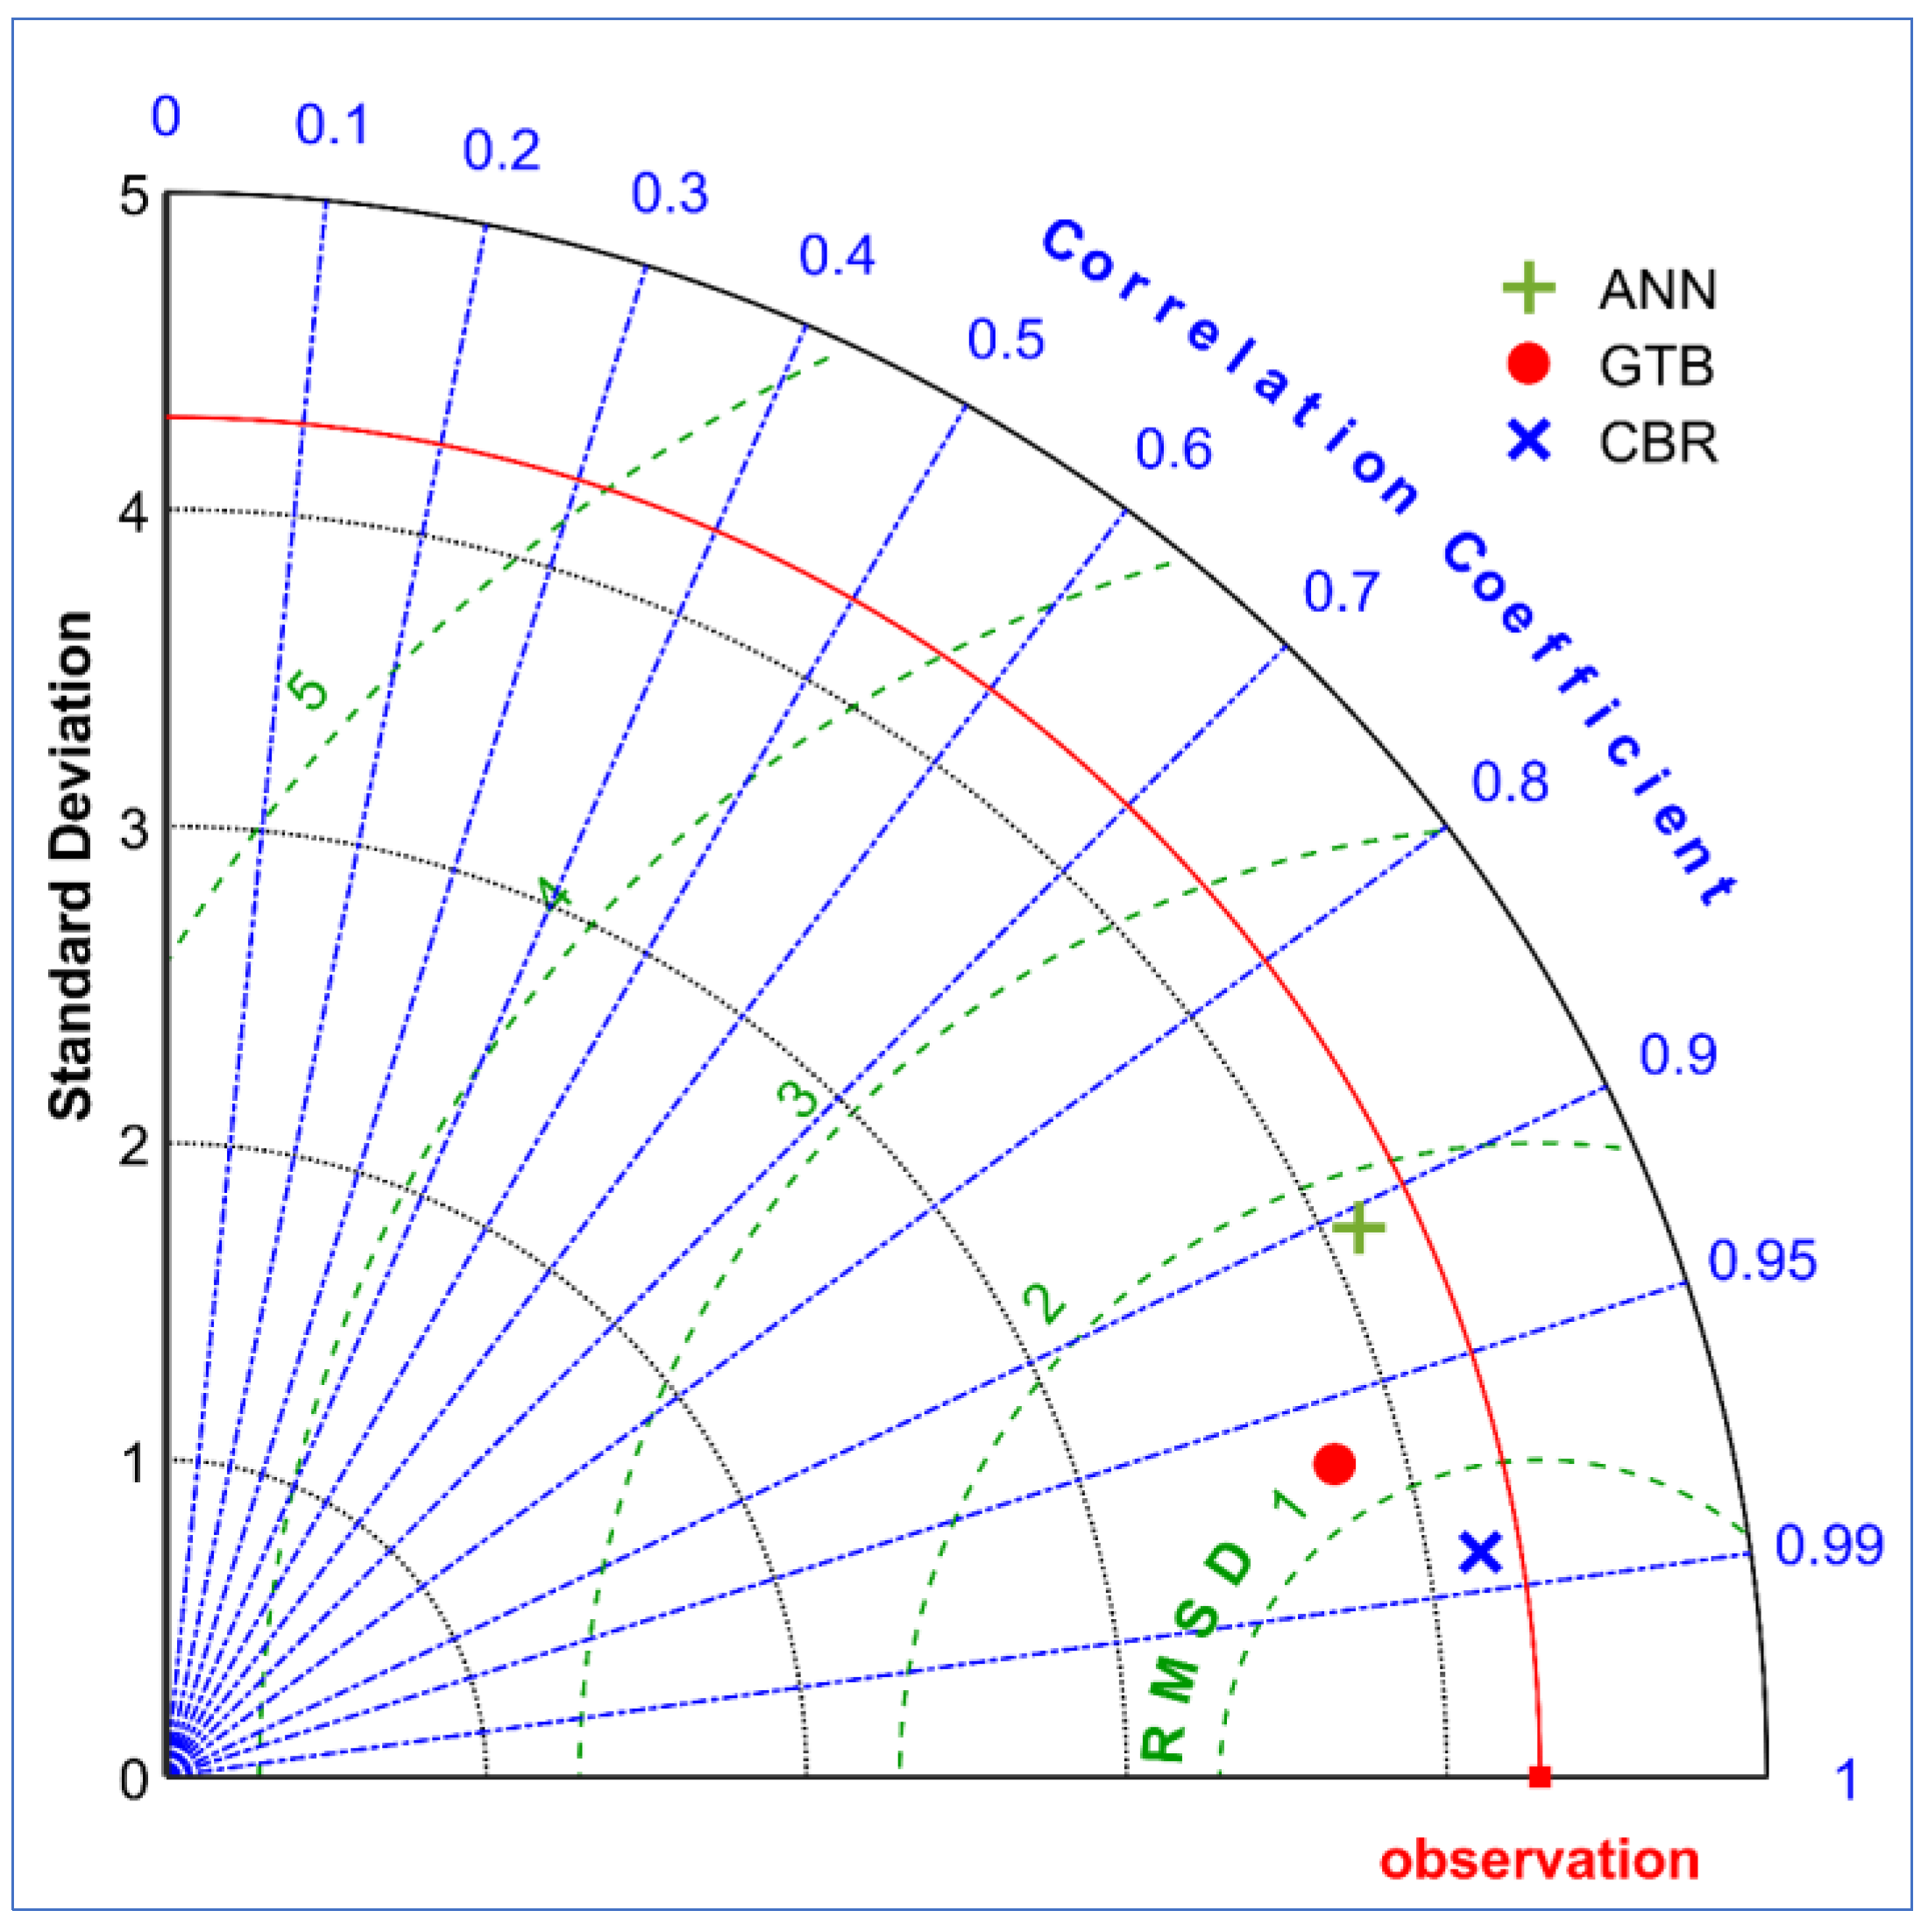
4.2. Performance of Machine-Learning Models
5. Conclusions
Supplementary Materials
Author Contributions
Funding
Institutional Review Board Statement
Informed Consent Statement
Data Availability Statement
Conflicts of Interest
References
- Okamura, H.; Ozawa, K.; Ouchi, M. Self-compacting concrete. Struct. Concr. 2000, 1, 3–17. [Google Scholar] [CrossRef]
- Domone, P.L. Self-compacting concrete: An analysis of 11 years of case studies. Cem. Concr. Compos. 2006, 28, 197–208. [Google Scholar] [CrossRef]
- Heniegal, A.M. Behavior of underwater self-compacting concrete. JES. J. Eng. Sci. 2012, 40, 1005–1023. [Google Scholar] [CrossRef]
- Moravvej, M.; Rashidi, M. Structural performance of self-compacting concrete. In Self-Compacting Concrete: Materials, Properties and Applications; Elsevier: Amsterdam, The Netherlands, 2020; pp. 371–387. [Google Scholar] [CrossRef]
- Goodier, C.I. Development of self-compacting concrete. Proc. Inst. Civ. Eng.-Struct. Build. 2003, 156, 405–414. [Google Scholar] [CrossRef]
- Bogas, J.A.; Gomes, A.; Pereira, M.F.C. Self-compacting lightweight concrete produced with expanded clay aggregate. Constr. Build. Mater. 2012, 35, 1013–1022. [Google Scholar] [CrossRef]
- Rashad, A.M. Lightweight expanded clay aggregate as a building material—An overview. Constr. Build. Mater. 2018, 170, 757–775. [Google Scholar] [CrossRef]
- Alqahtani, F.K.; Ghataora, G.; Khan, M.I.; Dirar, S. Novel lightweight concrete containing manufactured plastic aggregate. Constr. Build. Mater. 2017, 148, 386–397. [Google Scholar] [CrossRef]
- Youssf, O.; Hassanli, R.; Mills, J.E.; Elrahman, M.A. An experimental investigation of the mechanical performance and structural application of LECA-Rubcrete. Constr. Build. Mater. 2018, 175, 239–253. [Google Scholar] [CrossRef]
- Adesina, A.; Awoyera, P. Overview of trends in the application of waste materials in self-compacting concrete production. SN Appl. Sci. 2019, 1, 962. [Google Scholar] [CrossRef]
- Sun, C.; Chen, Q.; Xiao, J.; Liu, W. Utilization of waste concrete recycling materials in self-compacting concrete. Resour. Conserv. Recycl. 2020, 161, 104930. [Google Scholar] [CrossRef]
- Al-Oran, A.A.A.; Safiee, N.A.; Nasir, N.A.M. Fresh and hardened properties of self-compacting concrete using metakaolin and GGBS as cement replacement. Eur. J. Environ. Civ. Eng. 2022, 26, 379–392. [Google Scholar] [CrossRef]
- Kavitha, S.; Kala, T.F. Evaluation of Strength Behavior of Self-Compacting Concrete using Alccofine and GGBS as Partial Replacement of Cement. Indian J. Sci. Technol. 2016, 9, 1–5. [Google Scholar] [CrossRef]
- Liu, H.; Chen, W.; Pan, R.; Shan, Z.; Qiao, A.; Drewitt, J.W.; Hennet, L.; Jahn, S.; Langstaff, D.P.; Chass, G.A.; et al. From molten calcium aluminates through phase transitions to cement phases. Adv. Sci. 2020, 7, 1902209. [Google Scholar] [CrossRef] [PubMed]
- Dadsetan, S.; Bai, J. Mechanical and microstructural properties of self-compacting concrete blended with metakaolin, ground granulated blast-furnace slag and fly ash. Constr. Build. Mater. 2017, 146, 658–667. [Google Scholar] [CrossRef]
- Altoubat, S.; Badran, D.; Junaid, M.T.; Leblouba, M. Restrained shrinkage behavior of Self-Compacting Concrete containing ground-granulated blast-furnace slag. Constr. Build. Mater. 2016, 129, 98–105. [Google Scholar] [CrossRef]
- Oner, A.; Akyuz, S. An experimental study on optimum usage of GGBS for the compressive strength of concrete. Cement Concrete Comp. 2007, 29, 505–514. [Google Scholar] [CrossRef]
- Leelavathi, A.; Sudalaimani, K. Study on Self-Compacting Concrete with Sustainable Materials. Pol. J. Environ. Stud. 2021, 30, 5079–5088. [Google Scholar] [CrossRef]
- Hussien, R.M.; Abd El-Hafez, L.M.; Mohamed, R.A.; Faried, A.S. Influence of nano waste materials on the mechanical properties, microstructure, and corrosion resistance of self-compacted concrete. Case Stud. Constr. Mater. 2022, 16, e00859. [Google Scholar] [CrossRef]
- Borhan, T.M.; Abo Dhaheer, M.S.; Mahdi, Z.A. Characteristics of Sustainable Self-compacting Concrete Reinforced by Fibres from Waste Materials. Arab. J. Sci. Eng. 2020, 45, 4359–4367. [Google Scholar] [CrossRef]
- Kaur, H.; Siddique, R.; Rajor, A. Influence of incinerated biomedical waste ash on the properties of concrete. Constr. Build. Mater. 2019, 226, 428–441. [Google Scholar] [CrossRef]
- Altin, S.; Altin, A.; Elevli, B.; Cerit, O. Determination of hospital waste composition and disposal methods: A case study. Polish J. Environ. Stud. 2003, 12, 251–255. [Google Scholar]
- Aubert, J.E.; Husson, B.; Vaquier, A. Use of municipal solid waste incineration fly ash in concrete. Cement Concrete Res. 2004, 34, 957–963. [Google Scholar] [CrossRef]
- Ramesh, B.M.; Vongole, R.M.; Nagraj, Y.; Naganna, S.R.; Sreedhara, B.M.; Mailar, G.; Ramesh, P.S.; Yaseen, Z.M. Valorization of incinerator bottom ash for the production of resource-efficient eco-friendly concrete: Performance and toxicological characterization. Archit. Struct. Constr. 2021, 1, 65–78. [Google Scholar] [CrossRef]
- Hassan, H.F. Recycling of municipal solid waste incinerator ash in hot-mix asphalt concrete. Constr. Build. Mater. 2005, 19, 91–98. [Google Scholar] [CrossRef]
- Manjunath, B.; Di Mare, M.; Ouellet-Plamondon, C.M.; Bhojaraju, C. Exploring the potential use of incinerated biomedical waste ash as an eco-friendly solution in concrete composites: A review. Constr. Build. Mater. 2023, 387, 131595. [Google Scholar] [CrossRef]
- Feng, D.C.; Liu, Z.T.; Wang, X.D.; Chen, Y.; Chang, J.Q.; Wei, D.F.; Jiang, Z.M. Machine learning-based compressive strength prediction for concrete: An adaptive boosting approach. Constr. Build. Mater. 2020, 230, 117000. [Google Scholar] [CrossRef]
- de-Prado-Gil, J.; Palencia, C.; Silva-Monteiro, N.; Martínez-García, R. To predict the compressive strength of self compacting concrete with recycled aggregates utilizing ensemble machine learning models. Case Stud. Constr. Mater. 2022, 16, e01046. [Google Scholar] [CrossRef]
- Yeh, I.-C. Modeling of strength of high-performance concrete using artificial neural networks. Cement Concrete Res. 1998, 28, 1797–1808. [Google Scholar] [CrossRef]
- Lai, S.; Serra, M. Concrete strength prediction by means of neural network. Constr. Build. Mater. 1997, 11, 93–98. [Google Scholar] [CrossRef]
- Asteris, P.G.; Kolovos, K.G.; Douvika, M.G.; Roinos, K. Prediction of self-compacting concrete strength using artificial neural networks. Eur. J. Environ. Civ. Eng. 2016, 20, s102–s122. [Google Scholar] [CrossRef]
- Yaman, M.A.; Elaty, M.A.; Taman, M. Predicting the ingredients of self compacting concrete using artificial neural network. Alexandria Eng. J. 2017, 56, 523–532. [Google Scholar] [CrossRef]
- Zhang, J.; Ma, G.; Huang, Y.; Sun, J.; Aslani, F.; Nener, B. Modelling uniaxial compressive strength of lightweight self-compacting concrete using random forest regression. Constr. Build. Mater. 2019, 210, 713–719. [Google Scholar] [CrossRef]
- Awoyera, P.O.; Kirgiz, M.S.; Viloria, A.; Ovallos-Gazabon, D. Estimating strength properties of geopolymer self-compacting concrete using machine learning techniques. J. Mater. Res. Technol. 2020, 9, 9016–9028. [Google Scholar] [CrossRef]
- Farooq, F.; Czarnecki, S.; Niewiadomski, P.; Aslam, F.; Alabduljabbar, H.; Ostrowski, K.A.; Śliwa-Wieczorek, K.; Nowobilski, T.; Malazdrewicz, S. A Comparative Study for the Prediction of the Compressive Strength of Self-Compacting Concrete Modified with Fly Ash. Materials 2021, 14, 4934. [Google Scholar] [CrossRef] [PubMed]
- Hoang, N.-D. Machine Learning-Based Estimation of the Compressive Strength of Self-Compacting Concrete: A Multi-Dataset Study. Mathematics 2022, 10, 3771. [Google Scholar] [CrossRef]
- Tran, V.Q.; Mai, H.V.T.; Nguyen, T.A.; Ly, H.B. Assessment of different machine learning techniques in predicting the compressive strength of self-compacting concrete. Front. Struct. Civ. Eng. 2022, 16, 928–945. [Google Scholar] [CrossRef]
- Ghorbani, B.; Yaghoubi, E.; Wasantha, P.L.; van Staden, R.; Guerrieri, M.; Fragomeni, S. Machine learning-based prediction of resilient modulus for blends of tire-derived aggregates and demolition wastes. Road Mater. Pavement Des. 2023, 22, 1–22. [Google Scholar] [CrossRef]
- Tang, Y.; Wang, Y.; Wu, D.; Liu, Z.; Zhang, H.; Zhu, M.; Chen, Z.; Sun, J.; Wang, X. An experimental investigation and machine learning-based prediction for seismic performance of steel tubular column filled with recycled aggregate concrete. Rev. Adv. Mater. Sci. 2022, 61, 849–872. [Google Scholar] [CrossRef]
- IS 8112-1989; Specification for 43 Grade Ordinary Portland Cement. Bureau of Indian Standards: New Delhi, India, 2013.
- IS:383-1970; Specification for Coarse and Fine Aggregates from Natural Sources for Concrete. Bureau of Indian Standards: New Delhi, India, 2002.
- IS:12803-1989; Methods of Analysis of Hydraulic Cement by X-ray Fluorescence Spectrometer. Bureau of Indian Standards: New Delhi, Indian, 2004.
- IS:10262-2019; Concrete Mix Proportioning—Guidelines. Bureau of Indian Standards: New Delhi, India, 2019.
- Wang, S.-C. Artificial Neural Network. In Interdisciplinary Computing in Java Programming; Springer: Boston, MA, USA, 2003; pp. 81–100. [Google Scholar] [CrossRef]
- Wu, Y.; Feng, J. Development and Application of Artificial Neural Network. Wirel. Pers. Commun. 2018, 102, 1645–1656. [Google Scholar] [CrossRef]
- Benardos, P.G.; Vosniakos, G.C. Optimizing feedforward artificial neural network architecture. Eng. Appl. Artif. Intell. 2007, 20, 365–382. [Google Scholar] [CrossRef]
- Gurney, K. An Introduction to Neural Networks; CRC Press: London, UK, 2008. [Google Scholar]
- Friedman, J.H. Greedy function approximation: A gradient boosting machine. Ann. Statist. 2001, 29, 1189–1232. [Google Scholar] [CrossRef]
- Friedman, J.H. Stochastic gradient boosting. Comput. Stat. Data. Anal. 2002, 38, 367–378. [Google Scholar] [CrossRef]
- Natekin, A.; Knoll, A. Gradient boosting machines, A tutorial. Front. Neurorobot. 2013, 7, 21. [Google Scholar] [CrossRef] [PubMed]
- Prokhorenkova, L.O.; Gusev, G.; Vorobev, A.; Dorogush, A.V.; Gulin, A. CatBoost: Unbiased Boosting with Categorical Features; Bengio, S., Wallach, H.M., Larochelle, H., Grauman, K., Cesa-Bianchi, N., Garnett, R., Eds.; NeurIPS: Montréal, QC, Canada, 2018; pp. 6639–6649. Available online: https://proceedings.neurips.cc/paper/2018/file/14491b756b3a51daac41c24863285549-Paper.pdf (accessed on 30 December 2022).
- Hancock, J.T.; Khoshgoftaar, T.M. CatBoost for big data: An interdisciplinary review. J. Big Data 2020, 7, 94. [Google Scholar] [CrossRef]
- Mohamed, O.A.; Najm, O.F. Compressive strength and stability of sustainable self-consolidating concrete containing fly ash, silica fume, and GGBS. Front. Struct. Civ. Eng. 2017, 11, 406–411. [Google Scholar] [CrossRef]
- Dolatabad, Y.A.; Abolpour, B.; Tazangi, M.A.J. Investigating effects of Nano particles of silica on the properties of self-compacting concrete containing Perlite, Leca, and Scoria light weight aggregates. Arab. J. Geosci. 2021, 14, 862. [Google Scholar] [CrossRef]


| Tests Conducted | Results Obtained |
|---|---|
| Normal consistency (%) | 30% |
| Specific gravity | 3.13 |
| Initial setting time (minutes) | 65 |
| Final setting time (minutes) | 380 |
| Fineness | |
| Dry sieving (%) | 2.39 |
| Blains air permeability value (m2/kg) | 287 |
| Soundness | |
| Le Chatelier value (mm) | 1.2 |
| Autoclave (%) | 0.076 |
| Compressive Strength, (MPa) | |
| At 3 days | 27.84 |
| At 7 days | 37.33 |
| At 28 days | 48.28 |
| Tests | Results |
|---|---|
| Specific gravity | 2.64 |
| Water absorption (%) | 0.8 |
| Particle size | 20 mm and down |
| Fineness modulus | 6.02 |
| Bulk density (kg/m3) | 1511 |
| Tests | Results |
|---|---|
| Specific gravity | 2.60 |
| Gradation | Zone II |
| Particle size | 4.75 mm and down |
| Water absorption (%) | 1.8 |
| Bulk density (kg/m3) | 1699.65 |
| Tests | Results |
|---|---|
| Specific gravity | 1.38 |
| Water absorption (%) | 30% |
| Particle size | 20 mm and down |
| Bulk density (kg/m3) | 495 |
| Tests | Results |
|---|---|
| Specific gravity | 2.92 |
| Colour | Off-White |
| Bulk density (kg/m3) | 1050 |
| Fineness (m2/kg) | 372 |
| Tests | Results |
|---|---|
| Gradation | Zone III |
| Water absorption (%) | 3.9 |
| Specific gravity | 2.54 |
| Bulk density (kg/m3) | 1415 |
| Constituents | (%) |
|---|---|
| SiO2 | 12.11 |
| Al2O3 | 7.82 |
| Fe2O3 | 1.98 |
| CaO | 17.8 |
| MgO | 2.18 |
| Na2O | 3.55 |
| K2O | 1.25 |
| SO3 | 9.17 |
| MnO2 | 6.85 |
| PbO | 4.25 |
| ZnO | 12.9 |
| Others | 20.14 |
| TRAINING | |||||||
| LECA % | GGBS % | IBMWA % | DENSITY kg/m3 | W/B Ratio | SP % | CS (MPa) | |
| MIN | 0 | 0 | 0 | 2109.333 | 0 | 0.6 | 18.07 |
| MAX | 30 | 30 | 30 | 2530.667 | 0.45 | 1.4 | 39.61778 |
| MEAN | 14.92188 | 15 | 15 | 2260.444 | 0.425 | 1 | 27.73663 |
| SDV | 11.27177 | 11.20224 | 11.20224 | 92.31112 | 0.025049 | 0.400784 | 4.292255 |
| CV | 0.755385 | 0.746816 | 0.746816 | 0.040838 | 0.058939 | 0.400784 | 0.15475 |
| TESTING | |||||||
| LECA % | GGBS % | IBMWA % | DENSITY kg/m3 | W/B Ratio | SP % | CS (MPa) | |
| MIN | 0 | 0 | 0 | 2114.963 | 0.4 | 0.6 | 18.83 |
| MAX | 30 | 30 | 30 | 2486.519 | 0.45 | 1.4 | 39.21 |
| MEAN | 14.92188 | 15 | 15 | 2259.845 | 0.425 | 1 | 27.64 |
| SDV | 11.29393 | 11.22427 | 11.22427 | 90.72124 | 0.025098 | 0.401572 | 4.3 |
| CV | 0.75687 | 0.748285 | 0.748285 | 0.040145 | 0.059054 | 0.401572 | 0.155572 |
| Model Parameters | Settings |
|---|---|
| ANN | |
| Number of hidden layer neurons | 9 |
| Input layer activation function | logsig |
| Output layer activation function | purelin |
| Epochs | 200 |
| GTB | |
| n_estimators | 100 |
| max_depth | 9 |
| min_sample_split | 9 |
| learning_rate | 0.09 |
| loss | Lad * |
| CBR | |
| iterations | 100 |
| learning_rate | 0.2 |
| depth | 8 |
| MODELS | RMSE (MPa) | MAE (MPa) | SMAPE | NNSE | KGE | WI | |
|---|---|---|---|---|---|---|---|
| ANN | TRAIN | 1.8679 | 1.3715 | 2.5495 | 0.8403 | 0.8970 | 0.9488 |
| TEST | 1.8249 | 1.3345 | 2.4892 | 0.8469 | 0.8975 | 0.9509 | |
| GTB | TRAIN | 0.9786 | 0.4003 | 0.7224 | 0.9504 | 0.9011 | 0.9855 |
| TEST | 1.1770 | 0.8179 | 1.5047 | 0.9300 | 0.8761 | 0.9784 | |
| CBR | TRAIN | 0.1561 | 0.1189 | 0.2181 | 0.9987 | 0.9918 | 0.9997 |
| TEST | 0.73956 | 0.5211 | 0.9649 | 0.9712 | 0.9671 | 0.9923 |
Disclaimer/Publisher’s Note: The statements, opinions and data contained in all publications are solely those of the individual author(s) and contributor(s) and not of MDPI and/or the editor(s). MDPI and/or the editor(s) disclaim responsibility for any injury to people or property resulting from any ideas, methods, instructions or products referred to in the content. |
© 2023 by the authors. Licensee MDPI, Basel, Switzerland. This article is an open access article distributed under the terms and conditions of the Creative Commons Attribution (CC BY) license (https://creativecommons.org/licenses/by/4.0/).
Share and Cite
Chakravarthy H G, N.; Seenappa, K.M.; Naganna, S.R.; Pruthviraja, D. Machine Learning Models for the Prediction of the Compressive Strength of Self-Compacting Concrete Incorporating Incinerated Bio-Medical Waste Ash. Sustainability 2023, 15, 13621. https://doi.org/10.3390/su151813621
Chakravarthy H G N, Seenappa KM, Naganna SR, Pruthviraja D. Machine Learning Models for the Prediction of the Compressive Strength of Self-Compacting Concrete Incorporating Incinerated Bio-Medical Waste Ash. Sustainability. 2023; 15(18):13621. https://doi.org/10.3390/su151813621
Chicago/Turabian StyleChakravarthy H G, Nahushananda, Karthik M Seenappa, Sujay Raghavendra Naganna, and Dayananda Pruthviraja. 2023. "Machine Learning Models for the Prediction of the Compressive Strength of Self-Compacting Concrete Incorporating Incinerated Bio-Medical Waste Ash" Sustainability 15, no. 18: 13621. https://doi.org/10.3390/su151813621
APA StyleChakravarthy H G, N., Seenappa, K. M., Naganna, S. R., & Pruthviraja, D. (2023). Machine Learning Models for the Prediction of the Compressive Strength of Self-Compacting Concrete Incorporating Incinerated Bio-Medical Waste Ash. Sustainability, 15(18), 13621. https://doi.org/10.3390/su151813621