Abstract
The optimization design of buildings is very important to the energy consumption, carbon emissions, and sustainable development of buildings. The low-temperature granary has a low grain storage temperature and high energy consumption indexes. The design scheme of the roof insulation for a low-temperature granary should be determined in actual building design processes by considering the costs, carbon emissions, and outdoor climate, comprehensively. In this paper, a new low-carbon optimization design method is proposed for the roof insulation in the low-temperature granary. The low-carbon optimization design method can respond to the cost issue, emission reduction issue, and outdoor climate issue, simultaneously. Moreover, the low-temperature granary roof insulation of different ecological grain storage zones in China is optimized in terms of carbon reduction by using the proposed low-carbon optimization design method. The application results of the optimization design method in different ecological grain storage zones in China indicate that the outdoor climate has significant impacts on the economic performance and carbon reduction effect of roof insulation. The cost considerations related to carbon emissions can apparently increase the economic efficiency of roof insulation. The optimal economic thicknesses of expanded polystyrene (EPS) in the cities of Urumqi, Harbin, Zhengzhou, Changsha, Guiyang, and Haikou are 0.025 m, 0.037 m, 0.085 m, 0.097 m, 0.072 m, and 0.148 m, respectively. The different outdoor climates of the seven ecological grain storage areas in China have important influences on the comprehensive economic performances of low-temperature granary roof insulation. The design of the low-temperature granary roof insulation in Haikou city has the best economic performance among the seven ecological grain storage zones in China.
1. Introduction
The building industry has become one of the most energy-intensive industries in modern society. The production of building materials belongs to a highly energy-intensive production process. The reason for the high energy consumption of buildings is the lack of scientific design and construction of buildings [1]. On the other hand, the lack of energy-waste solutions also leads to high building energy consumption of buildings [2]. The design and application of insulation in building envelope structures, including the roof, floor, and exterior walls, is a commonly used energy-saving method for buildings [3]. The low-temperature granary has a low grain storage temperature and high energy consumption indexes. The low-temperature granary uses low-temperature storage environments to prevent and control the occurrence of grain loss phenomena due to pests and mold and to ensure the quality of stored grains. The grain storage temperature is below 15 °C in the low-temperature granary, and the large temperature difference between indoor and outdoor air can lead to high energy consumption for low-temperature grain storage [4]. The study of energy-saving and emission-reducing techniques with low-temperature granaries has important practical significance and high engineering application value.
The energy-saving and emission-reducing methods related to buildings are critical to the sustainability of buildings [5,6], the environment [7], and human society [8,9]. Zhang et al. [1] analyzed the evolution rules of the three parties’ behavior strategies and evolution stabilization strategies and found the key factors influencing the equilibrium using Mitchell’s score-based approach and the system dynamics model. Zhao et al. [3] presented a BIM-based, low-carbon building design optimization framework. An improved genetic algorithm was utilized to trade off the low-carbon energy savings of buildings and the daylighting performance. Andrade et al. [10] carried out studies on the carbon reduction potential of ultra-low-energy buildings in severely cold regions of China using an optimization method combining meta-models. Yang et al. [11] investigated seven driving factors of carbon emission evolution, encompassing energy, population, and income, and assessed the historical reduction in CO2 emissions from residential buildings in Henan Province in China using the Kaya–LMDI decomposition method. Yang et al. [12] systematically examined the value, potential, challenges, and improvement path of China’s green hydrogen industry. Liu et al. [13] investigated the retrofitting of existing residential buildings in China’s hot summer–cold winter climate region to improve energy performance and move toward low-energy building goals. Wei et al. [14] measured the life cycle carbon emissions of buildings and decomposed the drivers of carbon emissions in the materialization stage and operation stage of buildings. The optimized design is very helpful in improving energy efficiency and reducing the carbon emissions of buildings. Building design optimization is a multi-objective optimization process involving cost issues, low-carbon issues, and environmental protection issues [15].
A literature review shows that few previous studies consider both economic performance and the carbon reduction effect of building insulation simultaneously in solving the problem of building design [16,17]. This is not conducive to achieving the comprehensive optimization of economic performance and carbon reduction effects in building insulation design. So, the comprehensive optimization of economic performance and the carbon reduction effect of building insulation are taken into account in this study. In this paper, the low-temperature granary roof insulation of different ecological grain storage zones in China is optimized in terms of carbon reduction using a new low-carbon optimization design method. The structure of this paper is as follows: Section 2 proposes a novel low-carbon optimization design approach for building roof insulation; Section 3 depicts the application results in the low-temperature granary roof insulation of different ecological grain storage zones in China; Section 4 proposes the results and discussions of this study; and Section 5 presents the research conclusions, shortcomings, and future research prospects.
2. Materials and Methods
2.1. Accounting for Building Roof Insulation Optimization Design Method
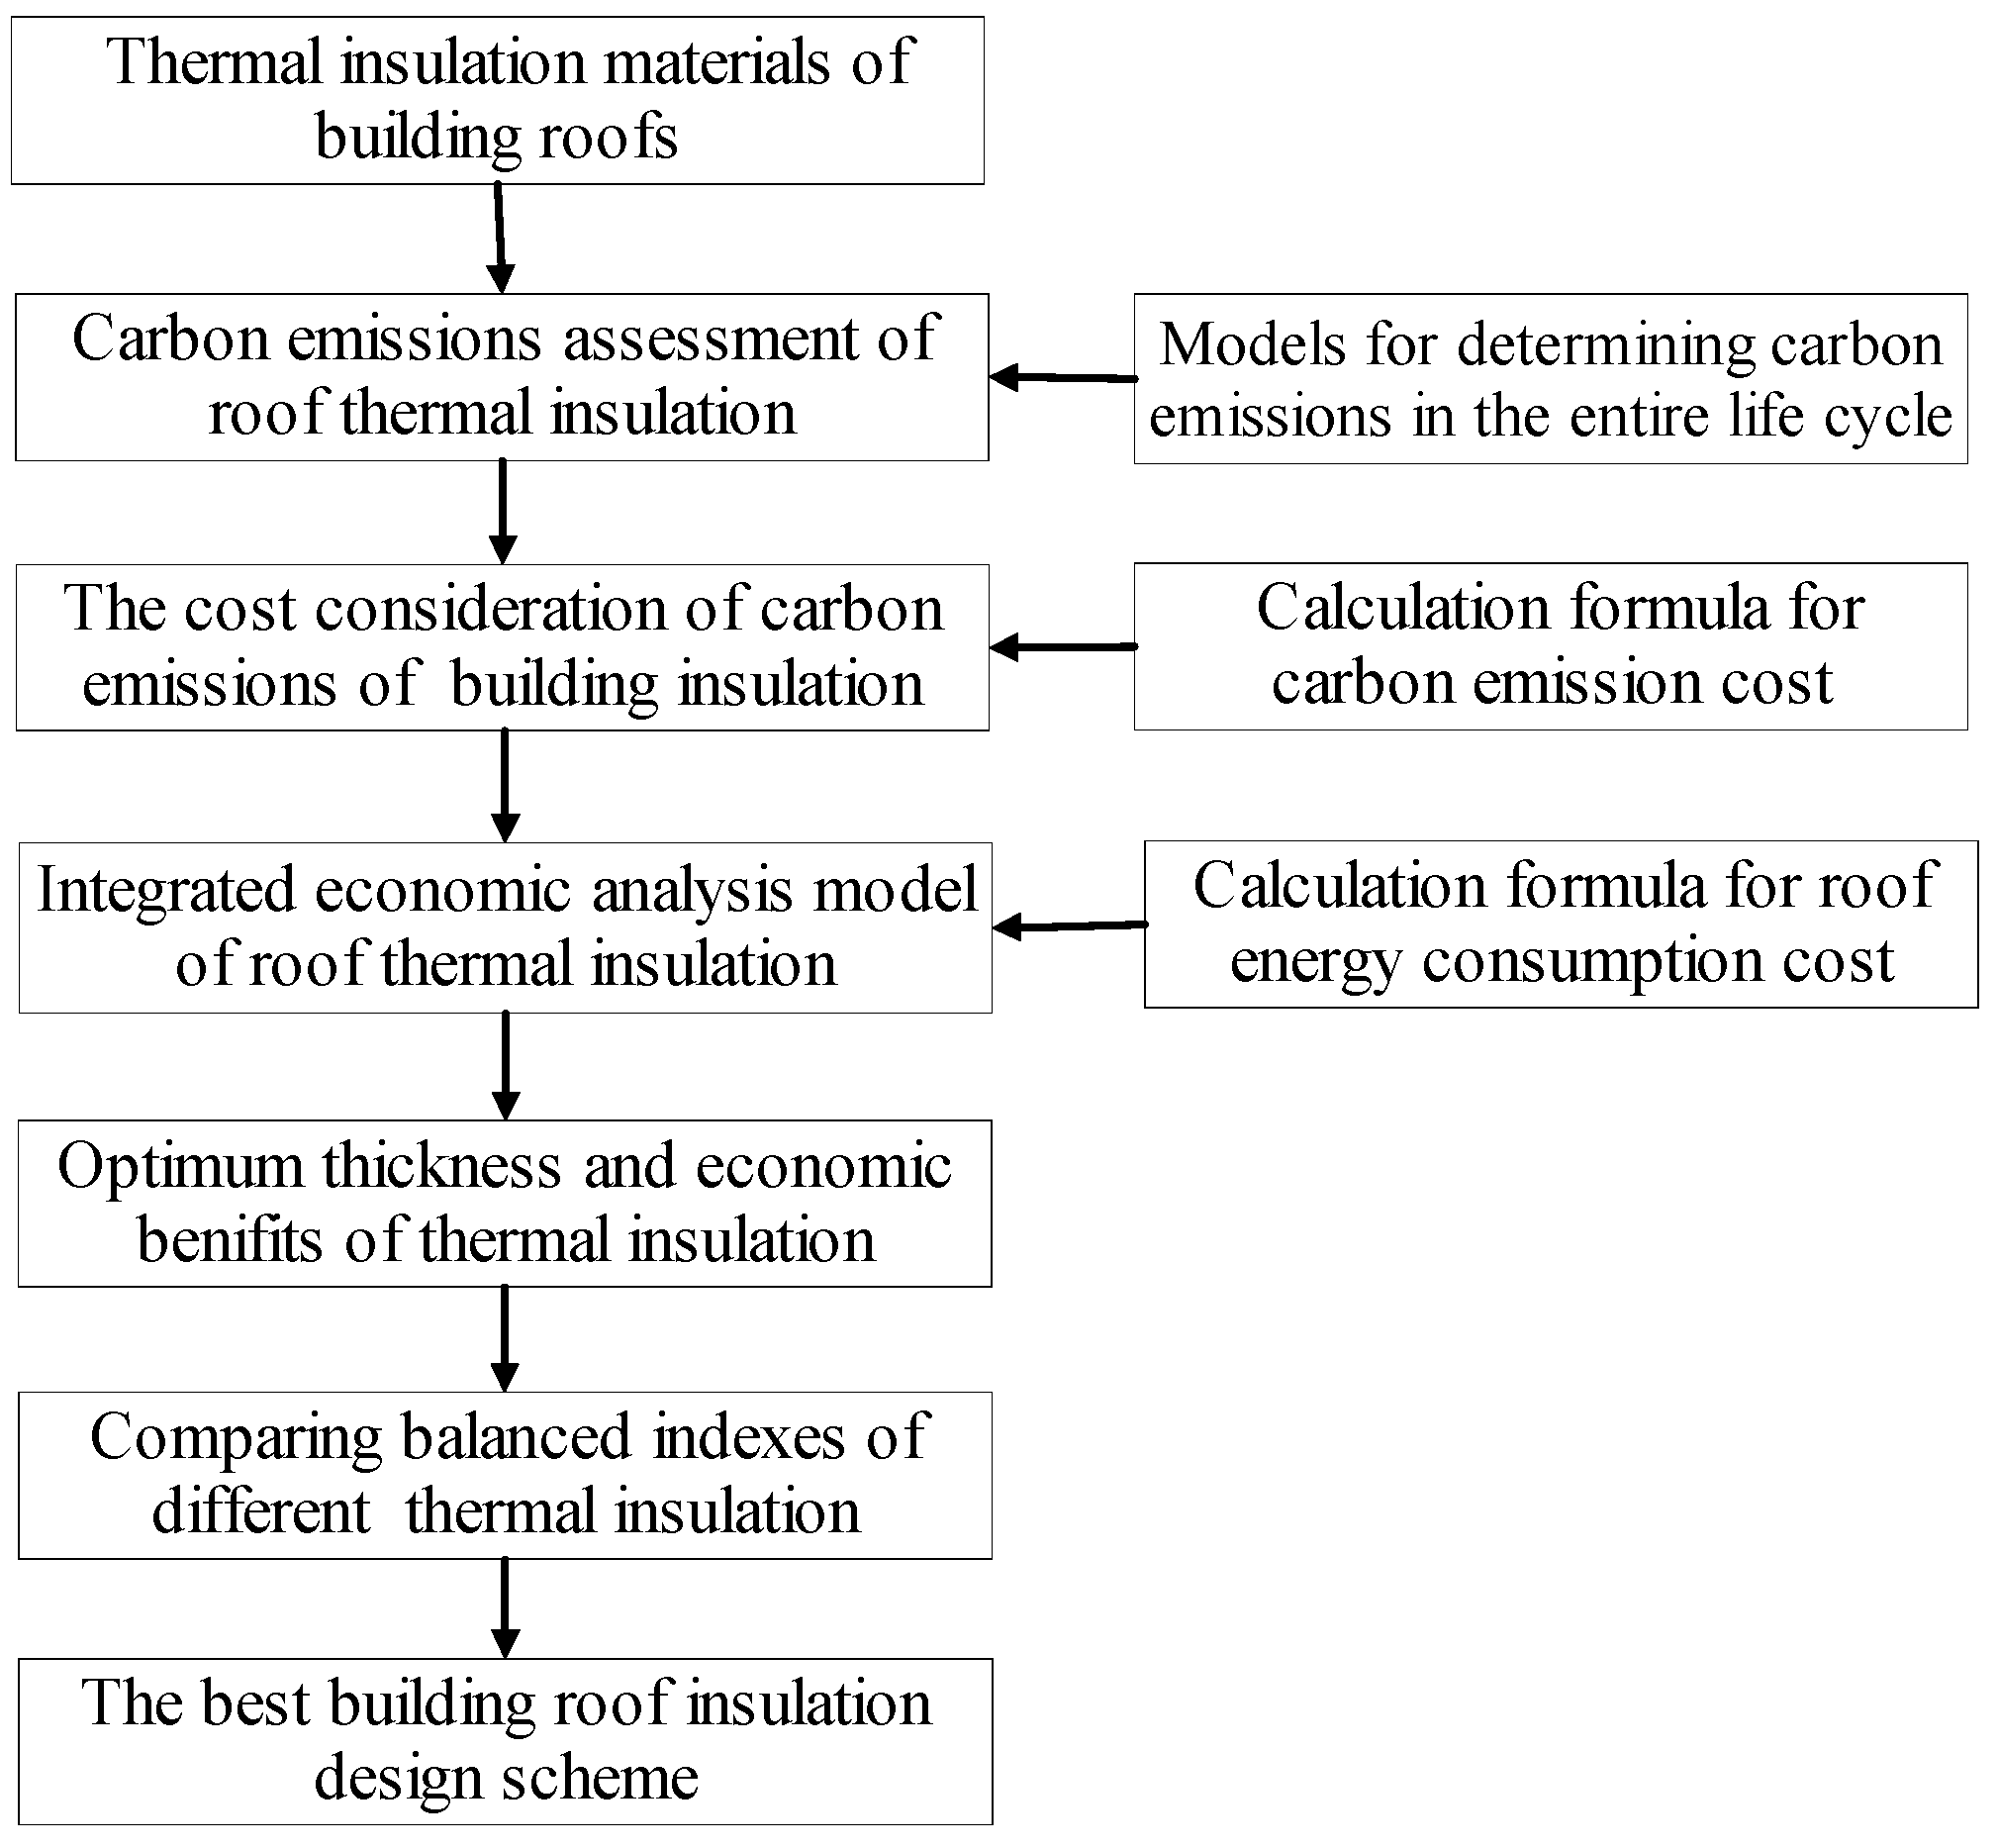
The optimization design of building roof insulation refers to minimizing the sum of the roof energy consumption cost, roof construction cost, and carbon emission cost in the entire life cycle of the roof insulation. The carbon emissions of building insulation are determined in this paper using the popular carbon emission factor method and process analysis method in the whole life cycle period [7]. The emission trading scheme (ETS) and carbon tax (CT) are used to establish the relationship between carbon emissions and the economic performance of roof insulation [18]. The carbon emission costs of roof insulation can be calculated based on the life cycle carbon emissions and the carbon tax rate (or carbon trading price). The traditional P1–P2 economic analysis model for building insulation is modified to consider the carbon emission costs of roof insulation. The balanced index of the carbon reduction effect is used to search for the best roof insulation design scheme candidate. The best roof insulation low-carbon design scheme is obtained when the balanced index of the carbon reduction effect is the lowest. Figure 1 provides a flowchart for determining the best roof insulation design scheme.
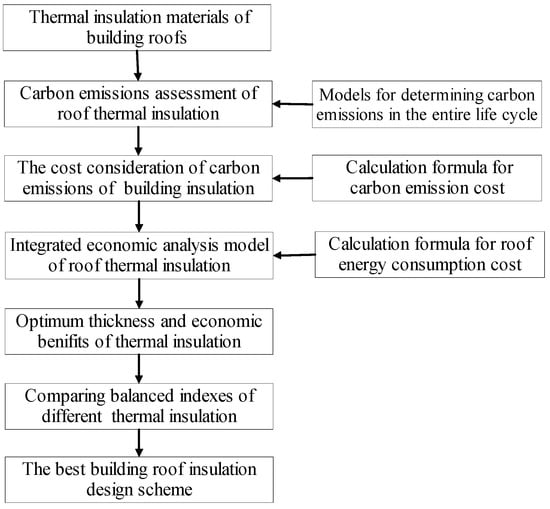
Figure 1.
Flowchart for determining the best roof insulation design scheme.
2.2. Carbon Emissions of Low-Temperature Granary Roof Insulation
2.2.1. Basic Concepts and Carbon Exchange Ways
Carbon emission is the general term or abbreviation for all greenhouse gas (GHG) emissions. According to the United Nations Framework Convention on Climate Change (UNFCCC), GHGs include the following six main categories [19]: (1) CO2; (2) CH4; (3) N2O; (4) HFCs, e.g., CHF3; (5) SF6, halogenated ethers, NF3, etc.; and (6) PFCs, e.g., CF4 and CnF2n + 2. According to the definition of global warming potential (GWP), the overall effect of GHGs is assessed using equivalent values for each type of GHG according to its greenhouse effect and its correspondence with the mass of CO2 of the same effect, using equivalent conversions. Among them, the equivalent CO2 emissions (CO2e) are often used as a measure of GHG emissions. In addition, other GHGs are usually ignored in general studies due to various considerations such as the specificity of the emission sources, the cumulative effect, and the feasibility and validity of the data statistics [20].
In the construction processes and the use processes of buildings, there are many forms of carbon exchange, which in general can be summarized as follows: (1) carbon emissions generated during the use of fossil energy; (2) carbon emissions or bio-carbon sequestration from industrial production, such as fossil energy extraction [21]; (3) carbon emissions from agricultural production, such as grain cultivation and nitrogen fertilizer application; (4) carbon emissions from composting, landfilling, or incineration of waste; (5) indirect carbon reduction through the use of clean energy instead of traditional energy sources; and (6) carbon storage through CO2 capture and storage technology [22].
2.2.2. Method to Determine Carbon Emissions of Roof Insulation
The calculation of the carbon emissions of the whole building process is the research focus of the low-carbon building evaluation system. At present, the process analysis method [23] is a common method for carbon emission chemical analysis in the international community. This method splits the production process according to the process flow; it uses the product of the measured carbon emission coefficient and the corresponding carbon emission source activity data to express the carbon emissions generated by each process and then calculates the total carbon emissions of the whole process according to the carbon emissions of each process.
where and are the activity data and emission factors of each process, respectively.
If there is an interaction of energy or raw materials in the process flow, it is calculated in a cycle according to Equation (1). The technology matrix is defined as , where is the quantity of the ith product consumed or produced by process j. The relationship between the net production and the duration of each process is as follows:
The net output column vector of the product is further defined as , and the carbon emission factor row vector is defined as , where is the carbon emission generated by process j per unit time; assuming that is a non-singular matrix, the total carbon emissions can be expressed as follows:
2.2.3. Building Life Cycle Assessment
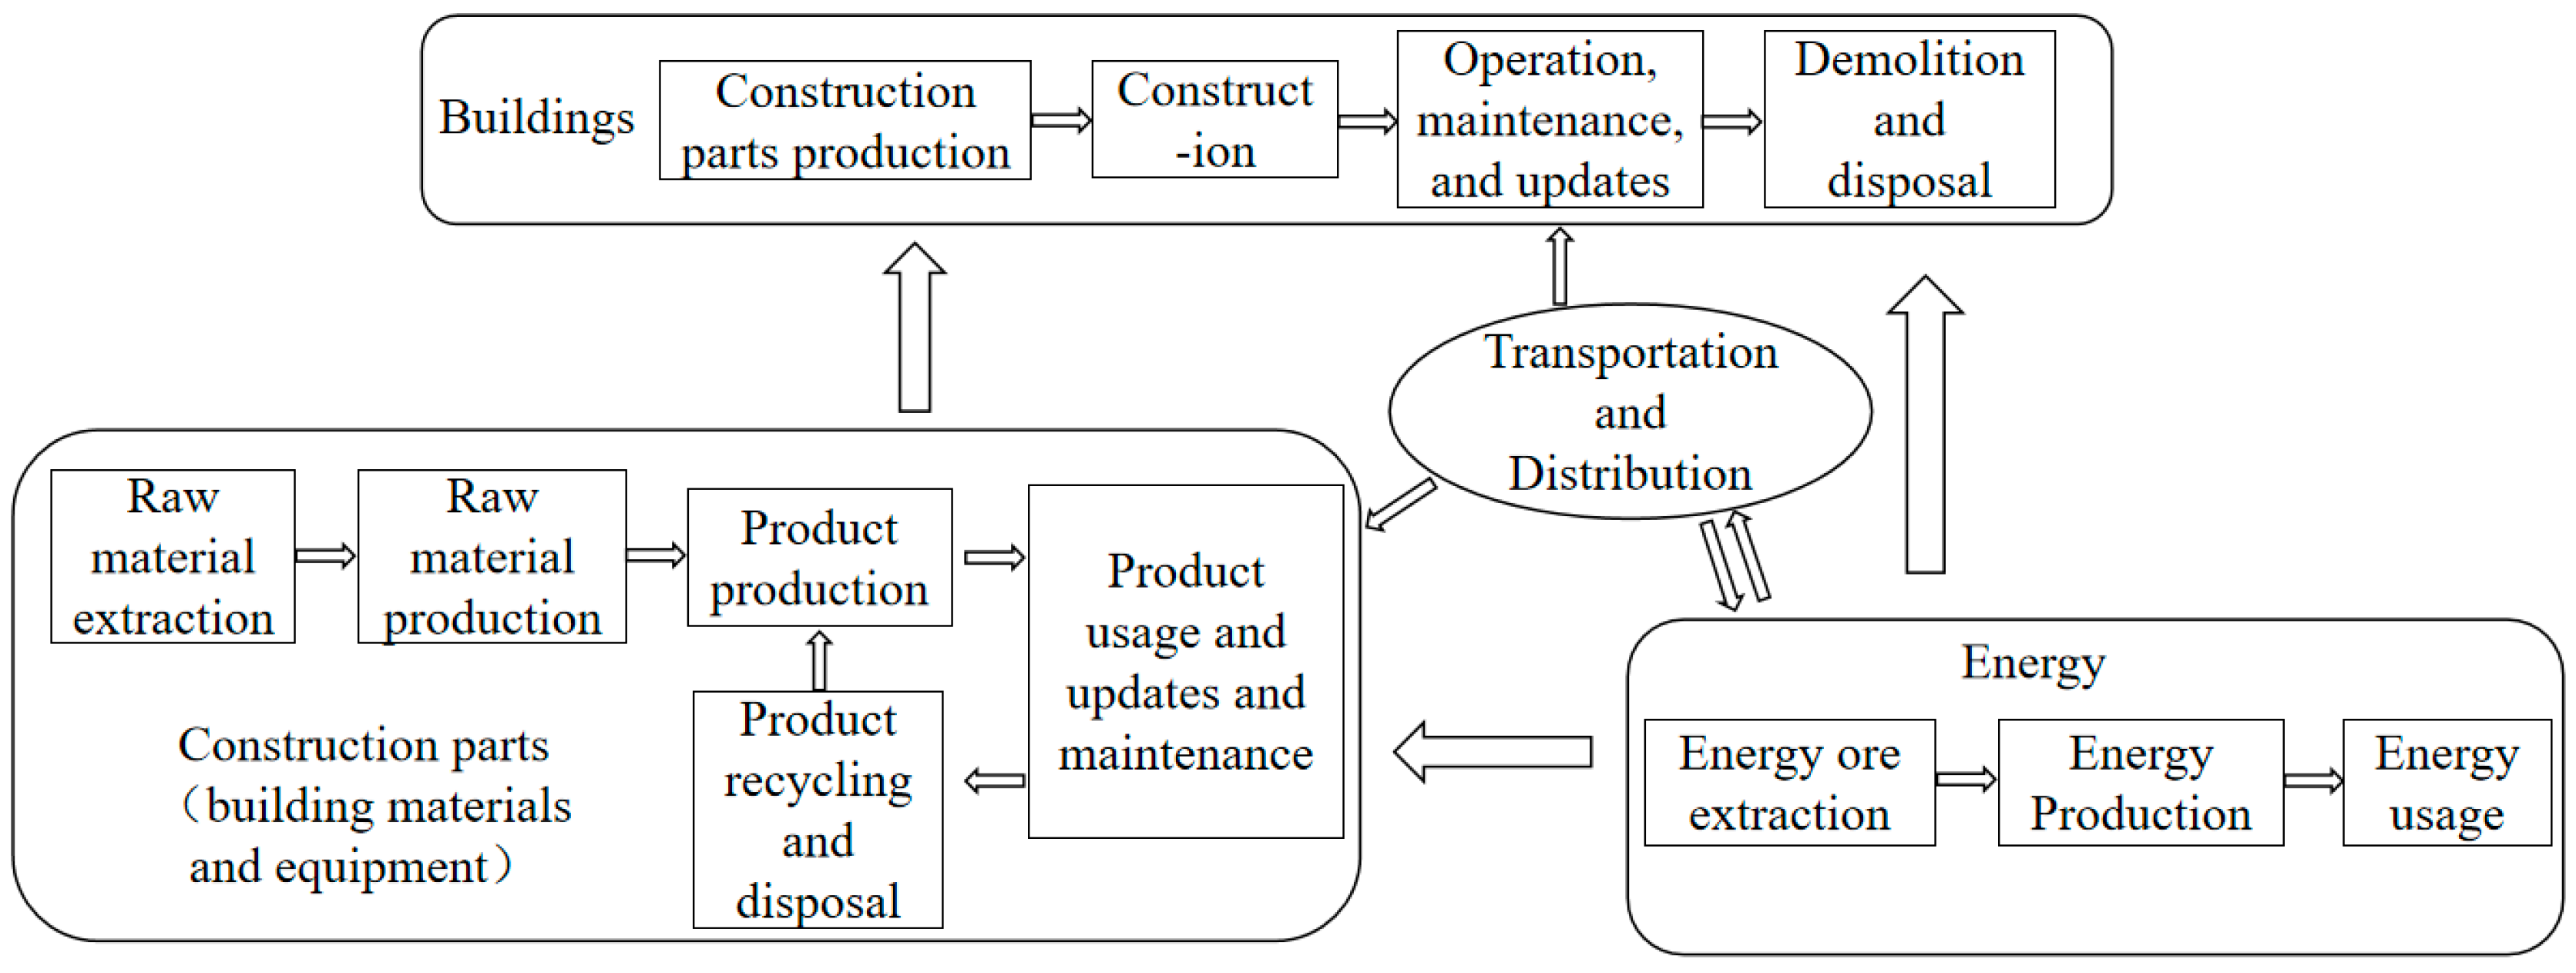
Life cycle assessment (LCA) is the only reasonable means of selecting materials, equipment, and components [24]. This paper divides the system’s boundaries and establishes a quantitative model for the life cycle of a roof insulation system based on the LCA theory and describes the greenhouse gas emission reduction policy. A building’s life cycle can be divided into four stages: part production, construction, building operation and maintenance renewal, and building demolition and disposal [25]. Among them, the production of building parts can be divided into the production process of building materials and equipment. All four stages must use energy; that is, the production process involves the use of energy, while the transportation of building parts and energy transmission and distribution connect these parts to form a whole [26], as shown in Figure 2.
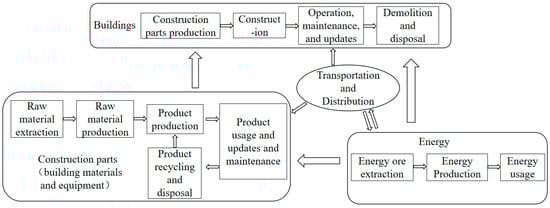
Figure 2.
Building life cycle.
The scope of this paper’s study of the life cycle of roof insulation systems considers the six phases of building production, transportation, construction, operation, demolition, and disposal, which can reduce the energy consumption and carbon emissions of building equipment (for example, heating equipment, ventilation equipment, and air conditioners) can be reduced with the roof insulation [27]. Because there are almost no greenhouse gas emissions in the operation stage of the insulation materials, the carbon emissions from insulation materials in the operation stage can be ignored. The cost consideration of carbon emissions of insulation during the operational phase does not impact the capital investment in roof insulation.
2.2.4. Life Cycle Carbon Emission Evaluation Model
The life cycle carbon emissions of roof insulation ( can be determined through the sum of the carbon emissions in the six stages of the entire life cycle of the roof insulation.
where represents the carbon emissions from insulation in the production stage, kgCO2e. represents the carbon emissions from insulation in the transportation stage, kgCO2e. represents the carbon emissions from insulation in the construction stage, kgCO2e. represents the carbon emissions from insulation in the operation stage, kgCO2e. represents the carbon emissions from insulation in the demolition stage of insulation, and kgCO2e. represents the carbon emissions from insulation in the disposal stage, kgCO2e.
Because there are almost no greenhouse gas emissions in the operation stage of insulation materials, the carbon emissions from insulation materials in the operation stage can be ignored. If building retrofitting occurs, the carbon emissions from the building retrofitting can be calculated using Equation (5). The following is the calculation formula for the carbon emissions in the other five stages of the entire life cycle of roof insulation:
where represents the carbon emissions from the raw materials in the production process, kgCO2e. is a loss ratio of the ith material in the production process. The loss ratio () refers to the proportion of loss and waste of the ith raw material in the production process. is the consumption for the ith material, m3. is the total number of various building insulation materials. is the carbon emission factor of the ith material, kgCO2e/m3. is the running time of the ith production equipment, h. is the carbon emission factor for the ith production equipment, kgCO2e/h. is the total amount of relevant equipment in the production process. represents the consumption of the ith insulation material, m3. represents the transportation distance of the ith insulation material, km. represents the carbon emission factor of the ith insulation material in the transportation processes, kgCO2e/km represents the empty return rate of transportation vehicle. represents the carbon emission of temporary measures at the construction site during the construction phase, kgCO2e. These temporary measures include the temporary work shed, equipment shed, material room, etc. represents the running time of the ith construction equipment, h. represents the carbon emission factor of the ith construction equipment, kgCO2e/h. represents the amount of construction machinery. represents the carbon emissions from the insulation in the demolition process, kgCO2e. represents engineering quantity, m2. represents the carbon emission factor of the ith procedure, kgCO2e/m2. represents the total number of demolition procedures. represents the carbon emissions of the waste transportation, kgCO2e. represents the carbon emissions of the insulation recycling, kgCO2e.
2.3. Comprehensive Economic Analysis Model for Roof Insulation
2.3.1. Carbon Reduction Policies and Life Cycle Carbon Costs
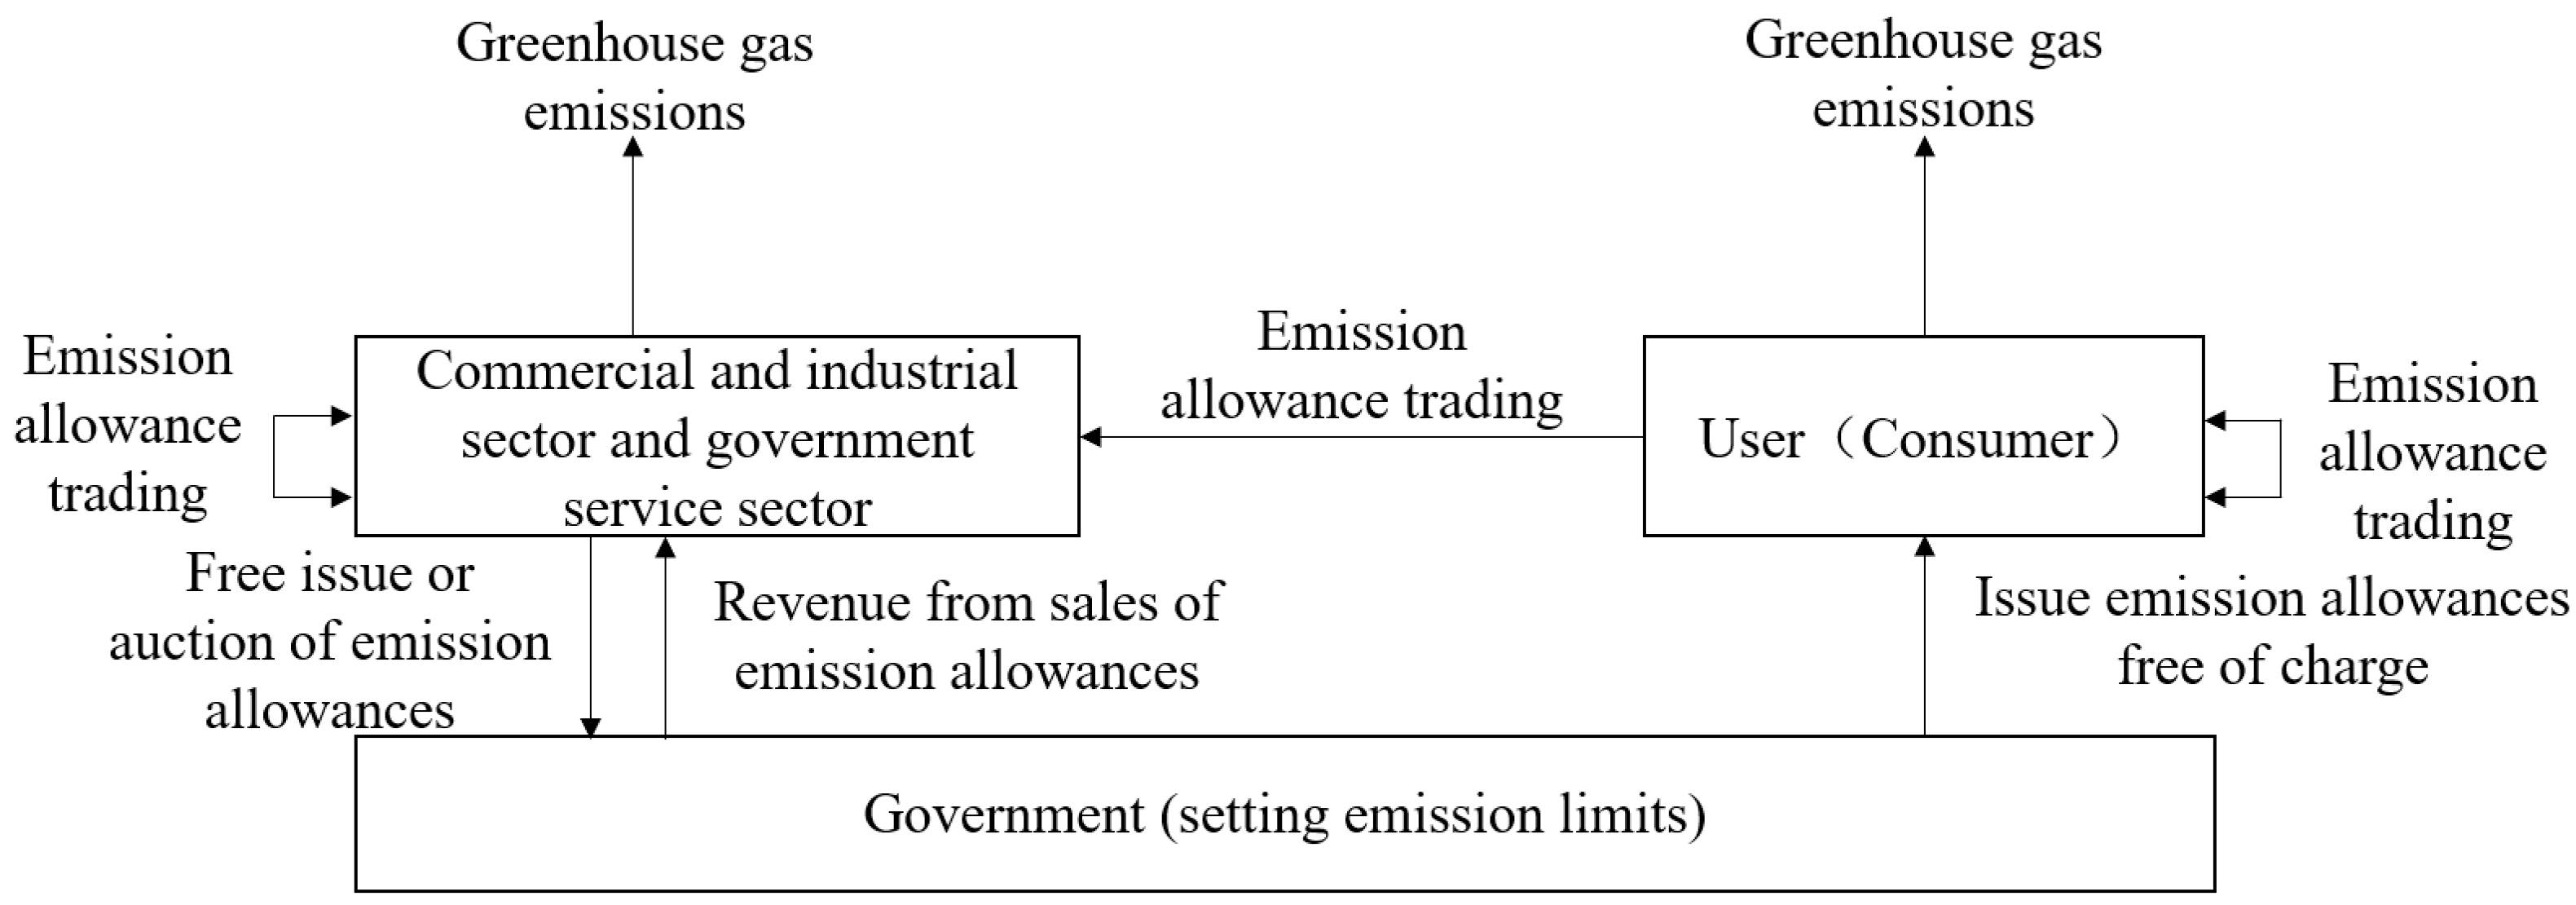
To combat global warming, many countries have adopted diverse policy measures [28]. There are many classifications of GHG emission reduction policies related to the building sector; these can be broadly classified into mandatory systems, incentive policies, and GHG-pricing-based emission reduction policies. Among them, GHG-pricing-based abatement policies are those that aim to reduce GHG emissions by pricing and charging for them. There are two basic forms of GHG pricing-based abatement policies: the carbon trading scheme (CTS) and the carbon tax (CT). The emission trading scheme is a scheme in which the government sets the total amount of GHG emissions, and the sum of emission permits issued for companies or individuals cannot exceed the upper limit of GHG emissions. The government can issue GHG emission permits in the form of free permits or auctioned permits [29]. There are various carbon emission trading mechanisms, such as the cap-and-trade, voluntary, and baseline credit models; the basic principles of their operation [30] are shown in Figure 3.
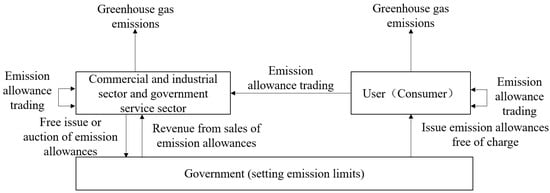
Figure 3.
The basic operation principles of emission trading mechanism.
When there is great uncertainty in the marginal cost of GHG emission reduction, the effect of the carbon emission trading mechanism on controlling GHG emissions is better than carbon tax, and the government can accurately control the total amount of GHG emissions within the predicted range using this mechanism. However, it is more difficult for the government to design a carbon emission trading mechanism than a carbon tax, and it also requires higher management and transaction costs. If the allocation of GHG emission allowances lacks public transparency or leaves more room for manipulation by powerful capital groups, it may lead to rent-seeking behaviors by interested parties [31].
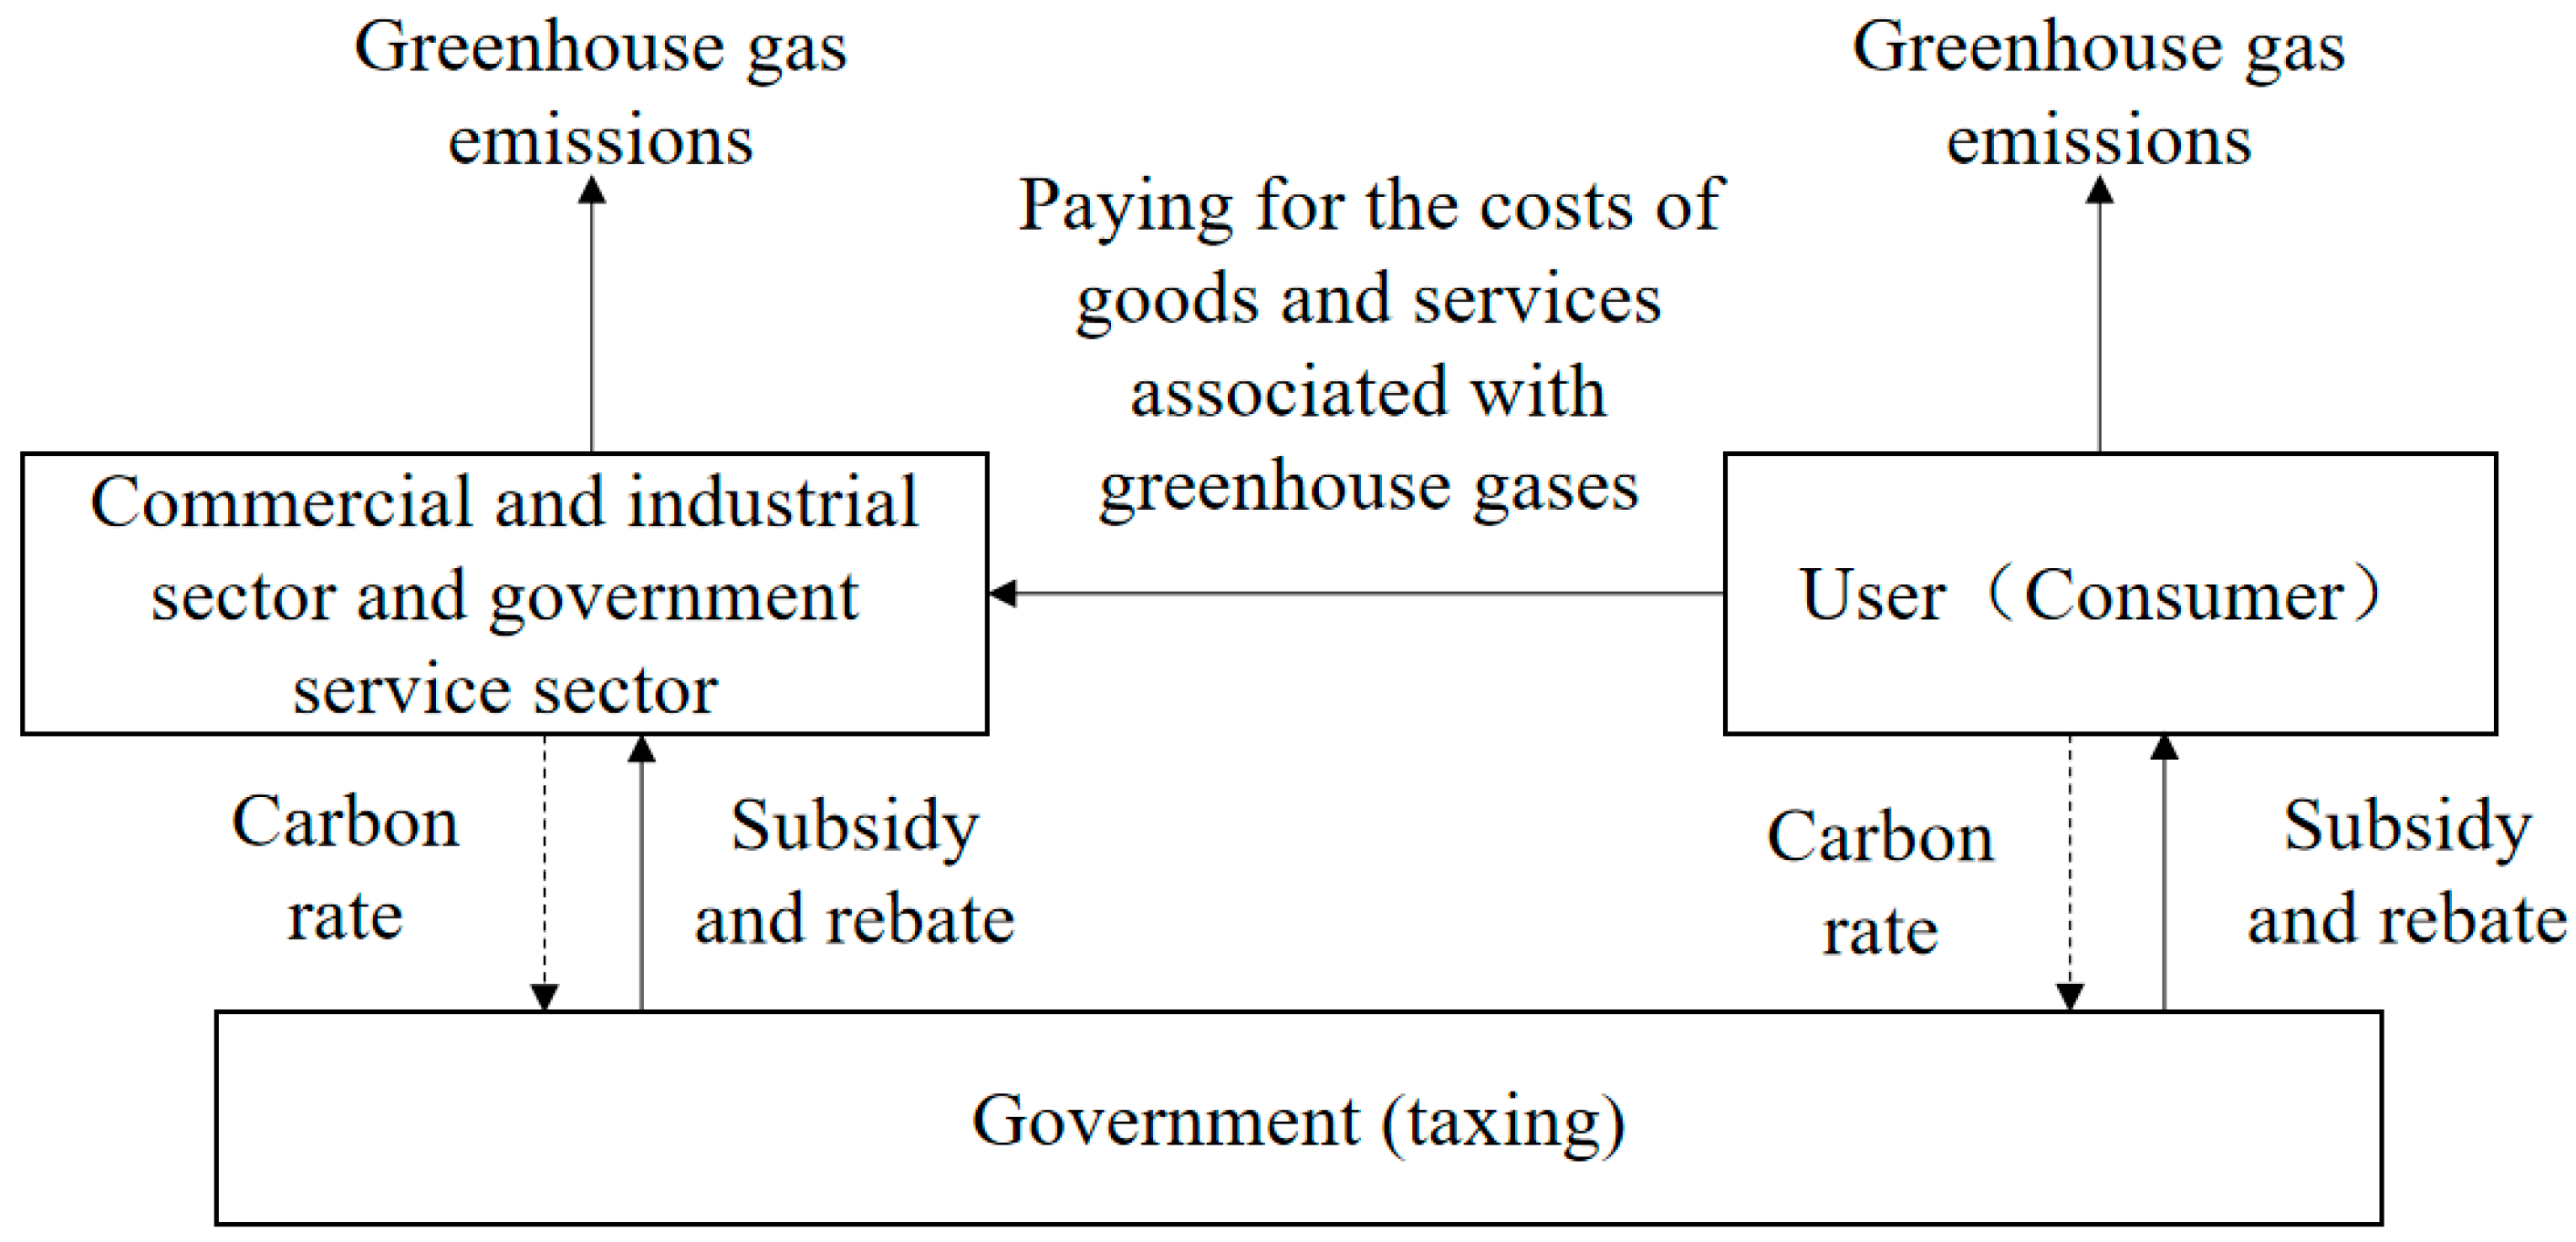
The carbon tax refers to the setting of a tax rate by the government on GHG emissions and using the price of GHG emissions to further drive producers or consumers to determine the total GHG emissions of firms or individuals [29]. The basic principle of carbon tax operation is shown in Figure 4. Garbaccio et al. [32] analyzed the potential impact of carbon tax on China’s economic development based on a general equilibrium model, and the results showed that the government’s carbon tax is beneficial to the reduction in carbon emissions while it can promote the long-term growth of China’s economy. Compared to other policy instruments, carbon taxes have lower administrative and transaction costs and can reconfigure the types of taxes while improving the rationality of the taxation mechanism [33]. The fiscal revenue obtained by the government through the carbon tax can be used to implement supporting incentive policies to further influence people’s perceptions and behaviors regarding carbon emission reduction [34], thus forming a virtuous cycle.
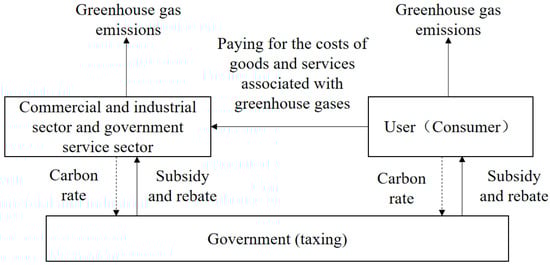
Figure 4.
The basic principle of carbon tax operation.
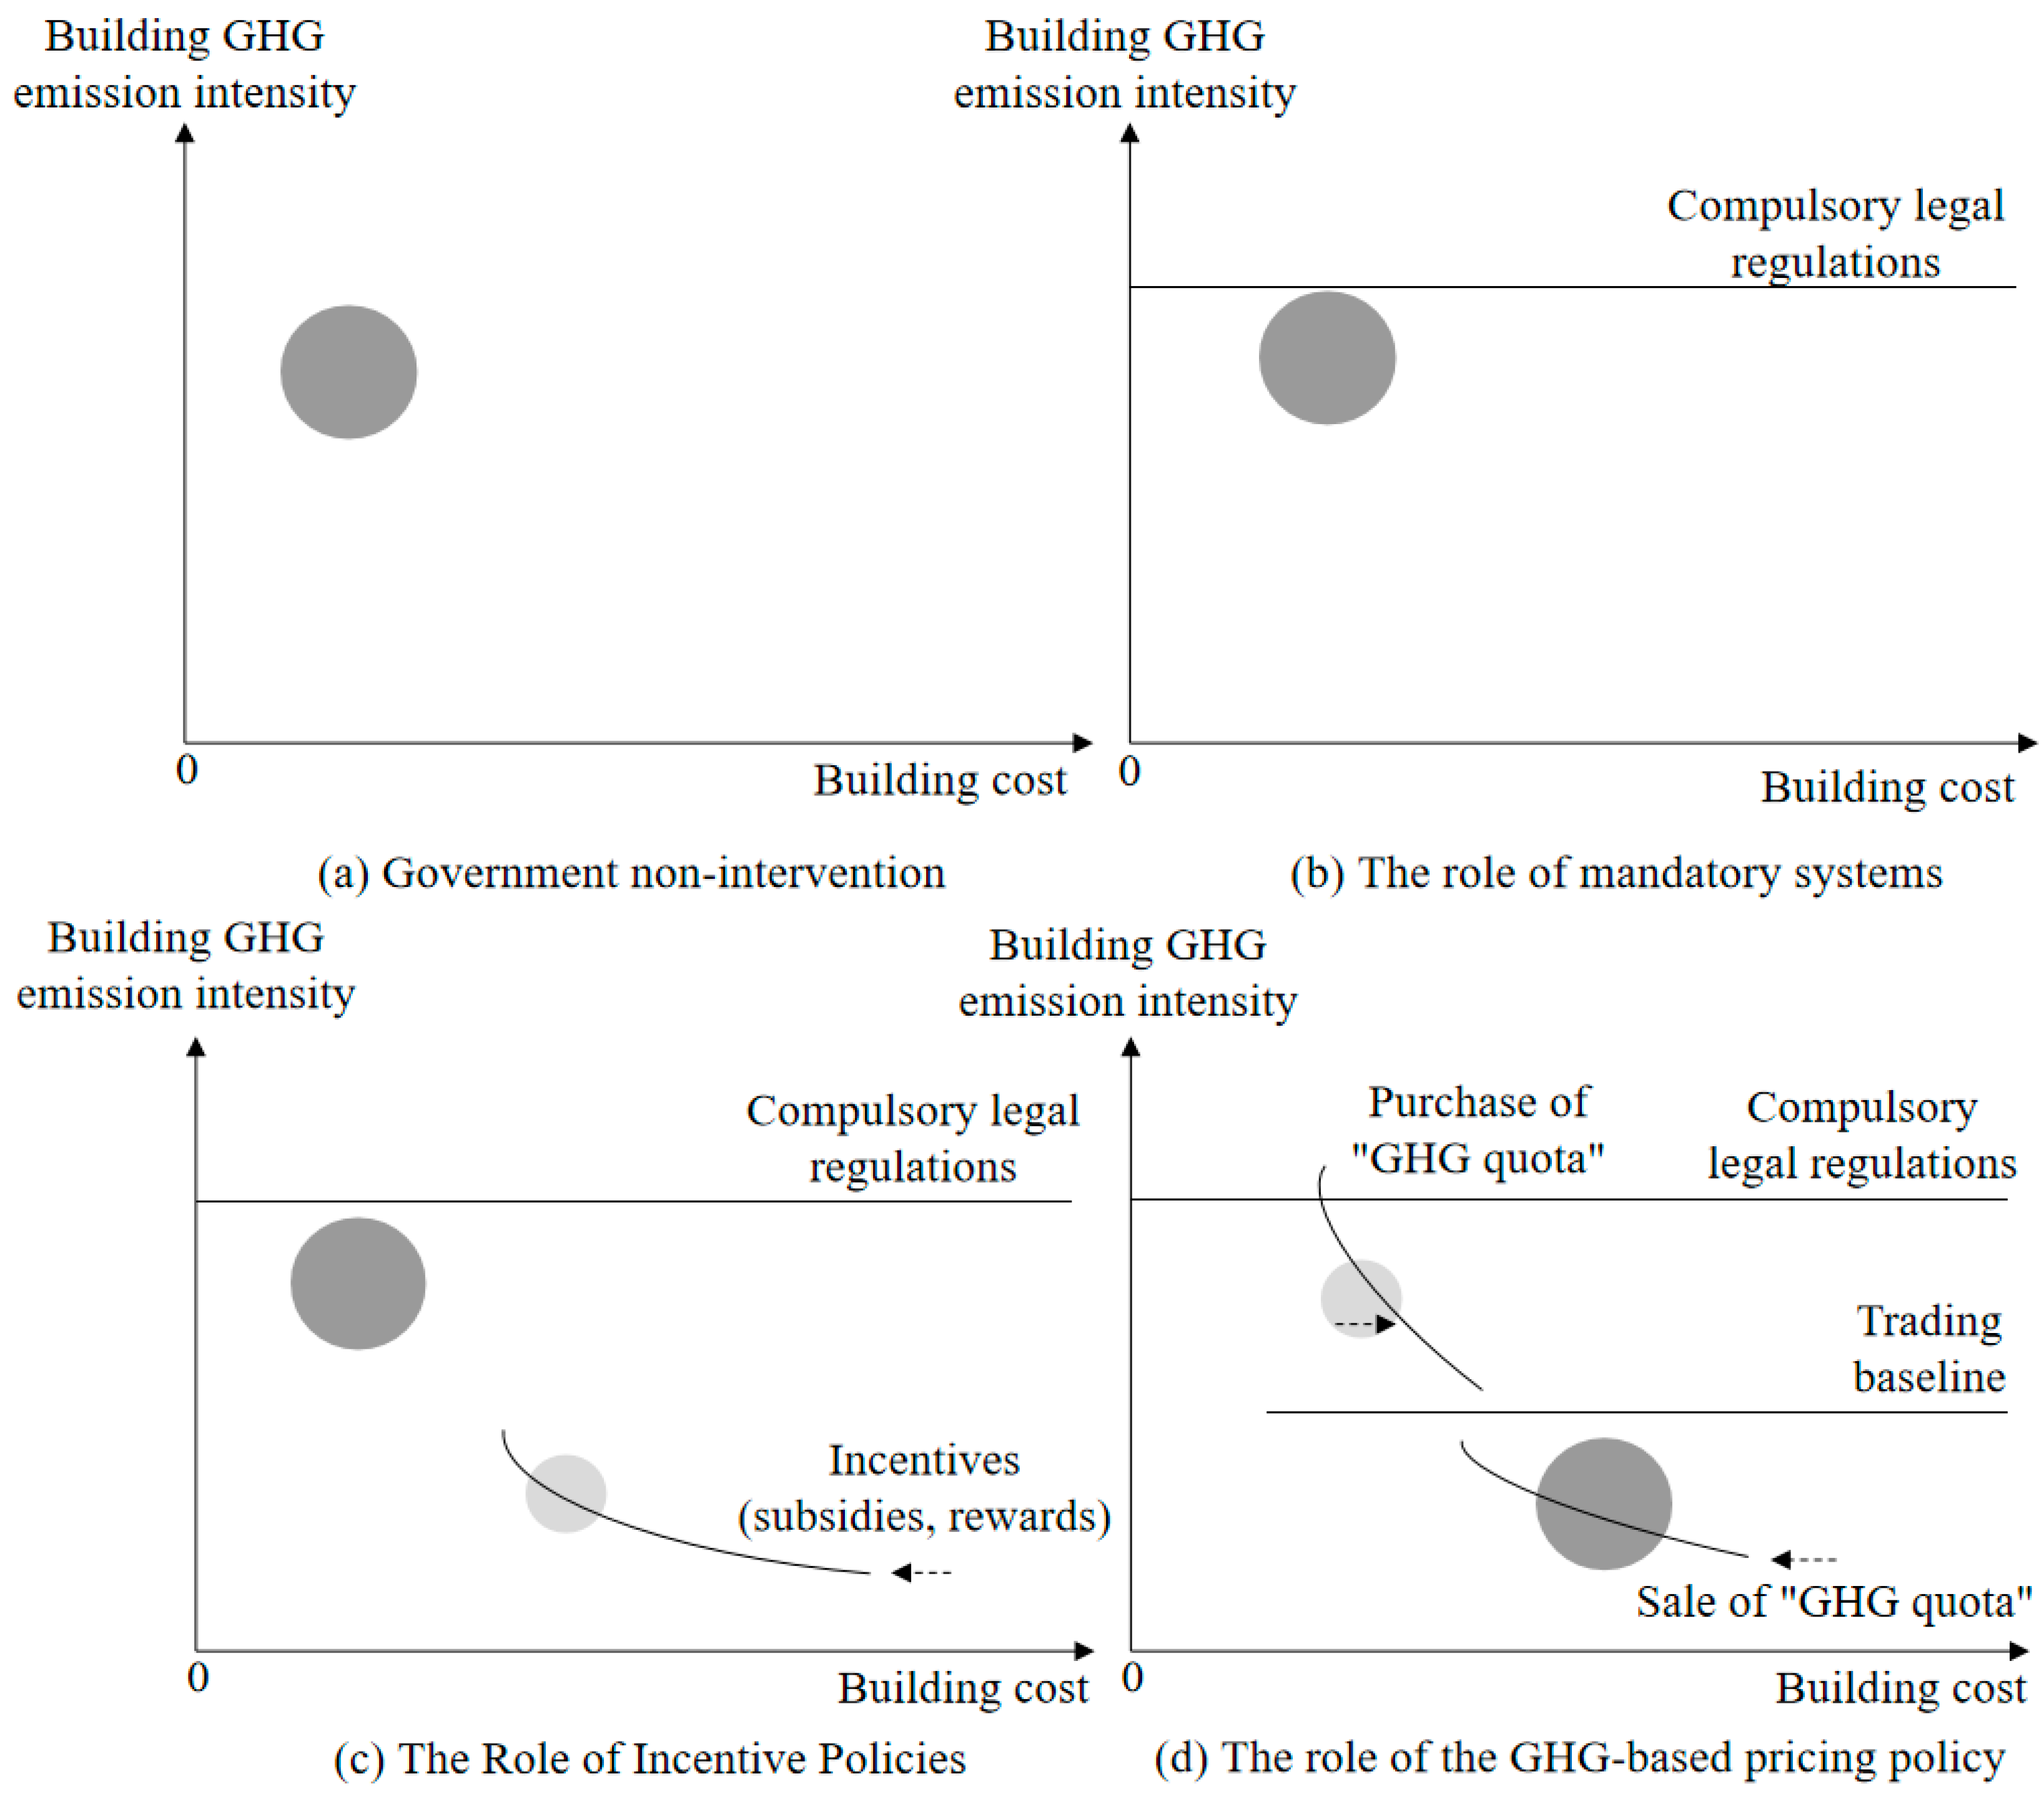
At present, with the existing level of carbon emission reduction technology in China, it is important to use the carbon emission reduction policy for the promotion of low-carbon technologies in buildings. In order to further elaborate the implementation effect of GHG emission reduction tools, the following four coordinate systems are established. Among them, the vertical and horizontal coordinates are the GHG emission intensity and the construction cost per unit area, respectively; the curve indicates the inverse relationship between the horizontal and vertical coordinates, and the circle indicates the overall construction site. As shown in Figure 5a, when the government has no intervention, the GHG emission intensity of construction has no upper limit, which is not conducive to the low-carbon development of China’s construction industry.
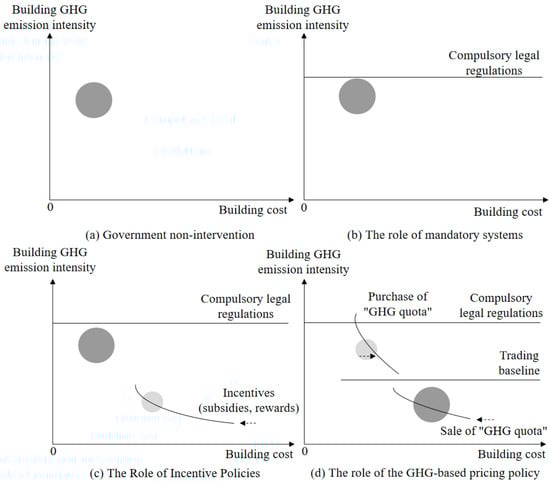
Figure 5.
Feasibility and implementation effectiveness of GHG abatement tools.
As shown in Figure 5b, when the government introduces mandatory laws and regulations on carbon emission reduction, the GHG emission intensity of construction enterprises is required to not exceed the specified standard. As shown in Figure 5c, when the government adopts incentive policies to guide construction enterprises to adopt green and low-GHG-emitting materials, the enterprises can put the government subsidies into the construction, which correspondingly reduces the construction cost of the enterprises, and the construction cost curve is thus shifted. However, the incentive policy requires high-cost investment and cannot be widely promoted. So, most enterprises still keep their low-cost and high-emission production methods unchanged. As shown in Figure 5d, when the government adopts the GHG-pricing-based abatement policy tool, the cost of GHG emissions generated by buildings is internalized as a part of the cost of the enterprises. During the implementation of the policy, the government will give a certain amount of GHG quotas to enterprises free of charge, and if the enterprises generate more GHGs than the total amount of their quotas, they will need to buy GHG quotas on the market. Meanwhile, enterprises that produce less than their GHG quotas can sell their excess quotas on the market, thus stimulating their carbon emission reduction behavior and changing the production cost curve at the same time.
The previous two policy tools are easy to implement but have limitations in terms of carbon emission reduction effects. The GHG-pricing-based policy tools are more efficient, do not require higher cost investments by the government, and can be promoted vigorously throughout the society, which is beneficial for the promotion of GHG emission reduction in the construction industry and for the optimization and upgrading of the industrial structure.
2.3.2. Carbon Emission Costs of Roof Thermal Insulation
Energy conservation, economic performance, carbon reduction, and the other influential factors should be considered in the optimization design of roof insulation. These three main influencing factors will interact with each other. Energy conservation due to roof insulation will reduce the electricity consumption cost caused by building roofs. Energy conservation due to roof insulation will also reduce carbon emissions because of the electricity consumption reduction. Currently, there are still no quantitative methods with which to determine the impact of carbon reduction on the economic performance of roof insulation.
The cost consideration of the carbon emissions of building insulation can be determined by carbon trading price [18], carbon tax price [35], and the other potential economic quantitative determination methods. The relationship between carbon emissions and economic performance of roof insulation can be established using the carbon trading scheme and carbon tax. The cost consideration of the carbon emissions can be included in the economic analysis models of roof insulation. The following is the calculation formula for the carbon emission costs:
where is the carbon emission cost of the roof insulation, USD/m3. is the total carbon emission of the roof insulation, tCO2e. is the carbon emission price, USD/tCO2e. is the amount of the consumed insulation material, m3.
2.3.3. Comprehensive Economic Analysis Model for Roof Insulation
The carbon emission costs will influence the economic indexes for insulation in the low-temperature granary roof. The traditional P1–P2 economic analysis model has been applied in the evaluation of economic performances of building insulation [36]. In this paper, the carbon emission costs will be included in the P1–P2 economic analysis model, which can comprehensively evaluate the economic performance of insulation. When the life-cycle investment cost of insulation () is the minimum or the life-cycle saving of insulation () is the maximum, the insulation layer thickness is optimal. The improved P1–P2 economic analysis model for insulation is given as follows:
where is the ratio of the first year’s energy consumption cost to the total energy consumption cost. is the life cycle investment cost to the initial investment cost in the building insulation. is the energy consumption capital investment, USD/m2. is the decrease in energy consumption capital investment due to the roof insulation, USD/m2. is the decrease in carbon emission capital investment due to the roof insulation, USD/m2. is the price of the insulation material, USD/m3. is the comprehensive capital investment in insulation, USD/m2. is the insulation layer thickness, m. is the present worth factor. is the market rate, = 1% [37]. is the inflation rate, = 5% [38]. is the time period of the entire lifecycle, year. is the ratio of the deposit cost to the capital investment cost, [39]. is the proportion of installment payments relative to the total investment in roof insulation. is the loan period, . is the loan interest rate. is the proportion of the resale price relative to the total investment cost, . is the discounted payback period, year.
2.4. Balanced Index of Carbon Emission Reduction Effect
Assessment indexes of carbon emissions can be used to assess different control measures for the carbon emissions of buildings. The conventional index [40], load index [34], and balanced index [41] are three common types of assessment indexes of carbon emissions. In this paper, the balanced index of the carbon emission reduction effect can be used to comprehensively investigate the carbon emission factor and the additional capital consumption factor [42]. The balanced index of the carbon emission reduction effect () can be calculated using Equation (16). The value of the balanced index of the carbon emission reduction effect decreases with the increase in the investment return rate for carbon emission reduction measures. The best low-carbon design scheme for roof insulation can be determined when the balanced index of the carbon emission reduction effect is the lowest.
where is the capital investment without control measures for carbon emissions, USD/m2. is the carbon emission without one control measure, kgCO2e/m2. is the capital investment due to the roof insulation, USD/m2. represents the carbon emission reduction in the control measures for carbon emissions, kgCO2e/m2.
3. Application of Optimization Design Method in Low-Temperature Granary Roof
3.1. Typical Cities in China and Buildings Considered
The low-temperature granary is used as an object in this study because its indoor air temperature (below 15 °C) is lower than that of other building types. China has a wide area and large differences in climate from one place to another [43]. Climate conditions are one of the most important external influencing factors that must be considered for the low-carbon design of the low-temperature granary. The roof insulation optimization design method was applied to the low-temperature granary roofs in seven ecological grain storage areas in China. Seven typical cities were selected from the seven ecological grain storage zones in China. These seven typical cities are Xining city (with typical Qinghai–Tibet Plateau grain storage climate characteristics); Urumqi city (with typical Mengxin grain storage climate characteristics); Harbin city (with typical northeast grain storage climate characteristics); Zhengzhou city (with typical North China grain storage climate characteristics); Changsha city (with typical Central China grain storage climate characteristics); Guiyang city (with typical southwest grain storage climate characteristics); and Haikou city (with typical South China grain storage climate characteristics).
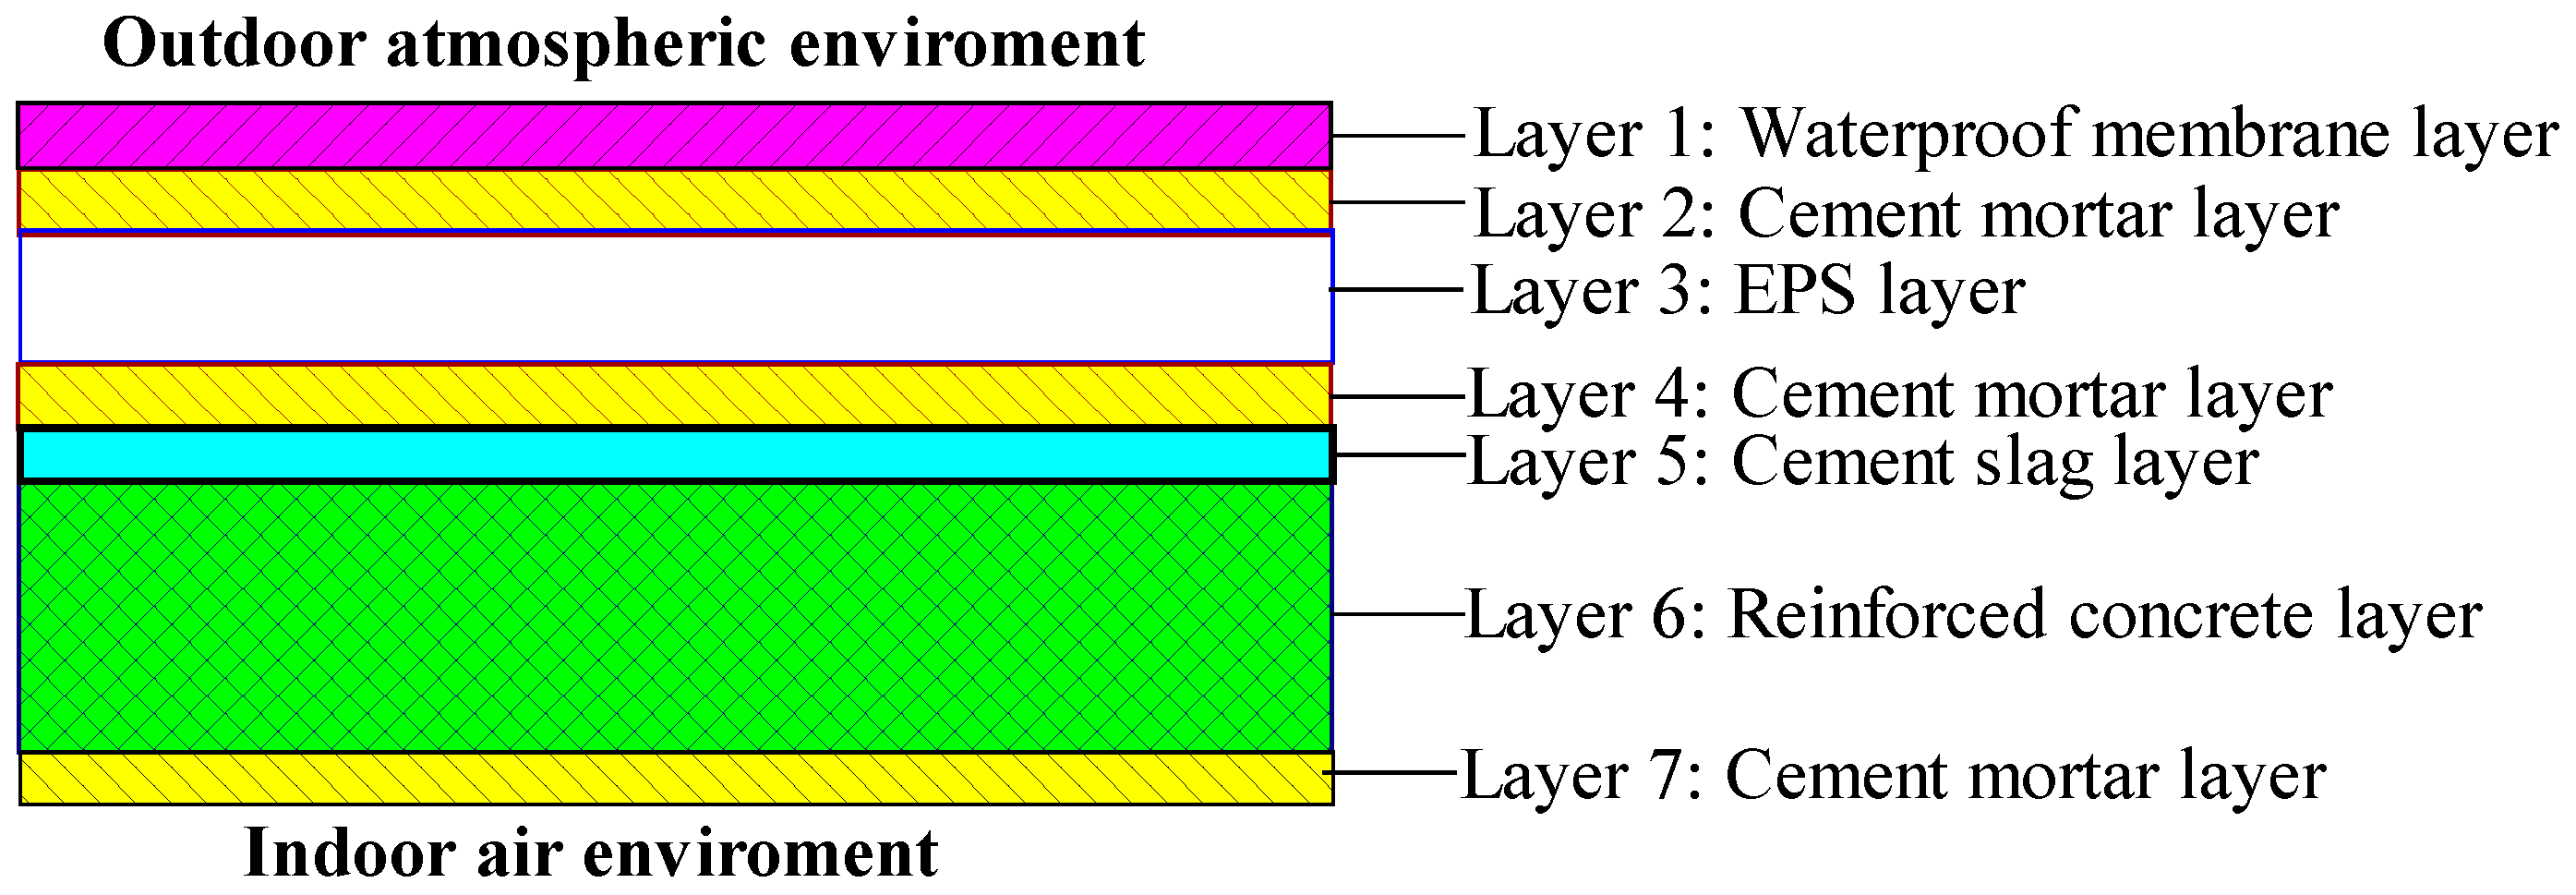
The typical roof structure of the low-temperature granary was used to analyze the economic performances of roof insulation in seven ecological grain storage zones in China, as shown in Figure 6. Table 1 shows the performance parameters of the roof elements for the typical roof structure of a low-temperature granary. The indoor air temperature in the low-temperature granary was set at 15 °C. The grain storage temperature in the low-temperature granary was maintained at 15 °C using air-conditioners with a 2.3 energy efficiency ratio. The life cycle of the insulation materials was set at 20 years.

Figure 6.
Considered roof structure of low-temperature granary.

Table 1.
Performance parameters of roof elements.
3.2. Life Cycle Carbon Emissions of Roof Insulation
COMSOL software and the EnergyPlus software were utilized to forecast the energy consumption of low-temperature granary roofs, respectively. To ensure the accuracy of the prediction results, the simulation results were mutually verified with each other. The total annual cooling load of the low-temperature granary roof was obtained through summing the hour-by-hour heat transfer per unit area of the roof. The low-temperature storage environment is beneficial to maintaining grain quality and inhibiting the growth of grain pests. The lower the temperature of grain storage, the safer the storage of grain in the granary. Therefore, the heating periods were not considered in the simulation studies. Table 2 shows the roof cooling loads for the low-temperature granary roofs with an EPS insulation layer thickness of 30 mm in the seven typical cities. For example, Figure 7 shows the annual roof cooling loads for different insulation layer thicknesses in the low-temperature granary roofs in Zhengzhou city. The annual roof cooling load decreases with the increase in the roof insulation layer thickness. However, the reduction rate of the annual roof cooling load decreases with the increase in the roof insulation layer thickness. Xining city is a typical representative city of the Qinghai–Tibet Plateau grain storage climate characteristics. It should be noted that the number of months with an outdoor air average temperature > 15 °C is 0. Therefore, the low-temperature granary in Xining city does not require mechanical cooling to maintain the lower grain storage temperatures. Xining city will not be involved in the economic performance analysis of granary roof insulation.
Table 2.
Roof cooling load.
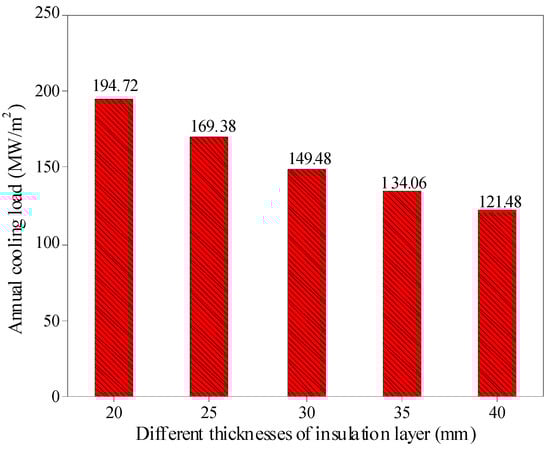
Figure 7.
Annual roof cooling loads of low-temperature granary in Zhengzhou city.
Four types of common insulation materials in granary roofs were discussed in this study. These four types of common insulation materials were rock wool (RW), extruded polystyrene (XPS), polyurethane (PU), and expanded polystyrene (EPS). The carbon emissions and the corresponding carbon emission costs for the above four types of insulation materials were calculated using the methods presented in Section 2.3, as shown in Table 3. The carbon emission of EPS is 0.451 tCO2e/m3, which is the lowest carbon emission among the four types of insulation materials. Therefore, EPS was used in this paper as the insulation material in the low-temperature granary roofs in seven ecological grain zones in China. In this paper, the electricity price was set as 0.1027 USD/kWh. The carbon trading price was set at 8.29 USD/tCO2e according to statistical data [30], and the electricity price was set at 0.0083 USD/kWh [38].
Table 3.
Carbon emission costs of roof insulation.
The vast majority of the carbon emissions of insulation material mainly come from the production stage of the insulation material. The carbon emissions of the four types of insulation materials considered are different. The order of carbon emissions of the four insulation materials is EPS < XPS < RW < PU. The main reason for the different carbon emissions of the four types of insulation materials is the different raw materials and production processes used for insulation materials. The carbon emissions of EPS mainly come from the preparation process of the polymer materials and the production process of the EPS insulation board. The preparation process of styrene raw materials and the production process of insulation boards are the two main sources of carbon emissions for XPS. The preparation process of the raw materials and the foaming curing process are the two main sources of the carbon emissions for PU. The preparation and production processes of raw materials are the two main sources of carbon emissions for RW. The carbon emissions of EPS are the lowest carbon emissions among the four types of insulation materials considered.
4. Results and Discussions
4.1. Economic Performance Analysis of Granary Roof Insulation
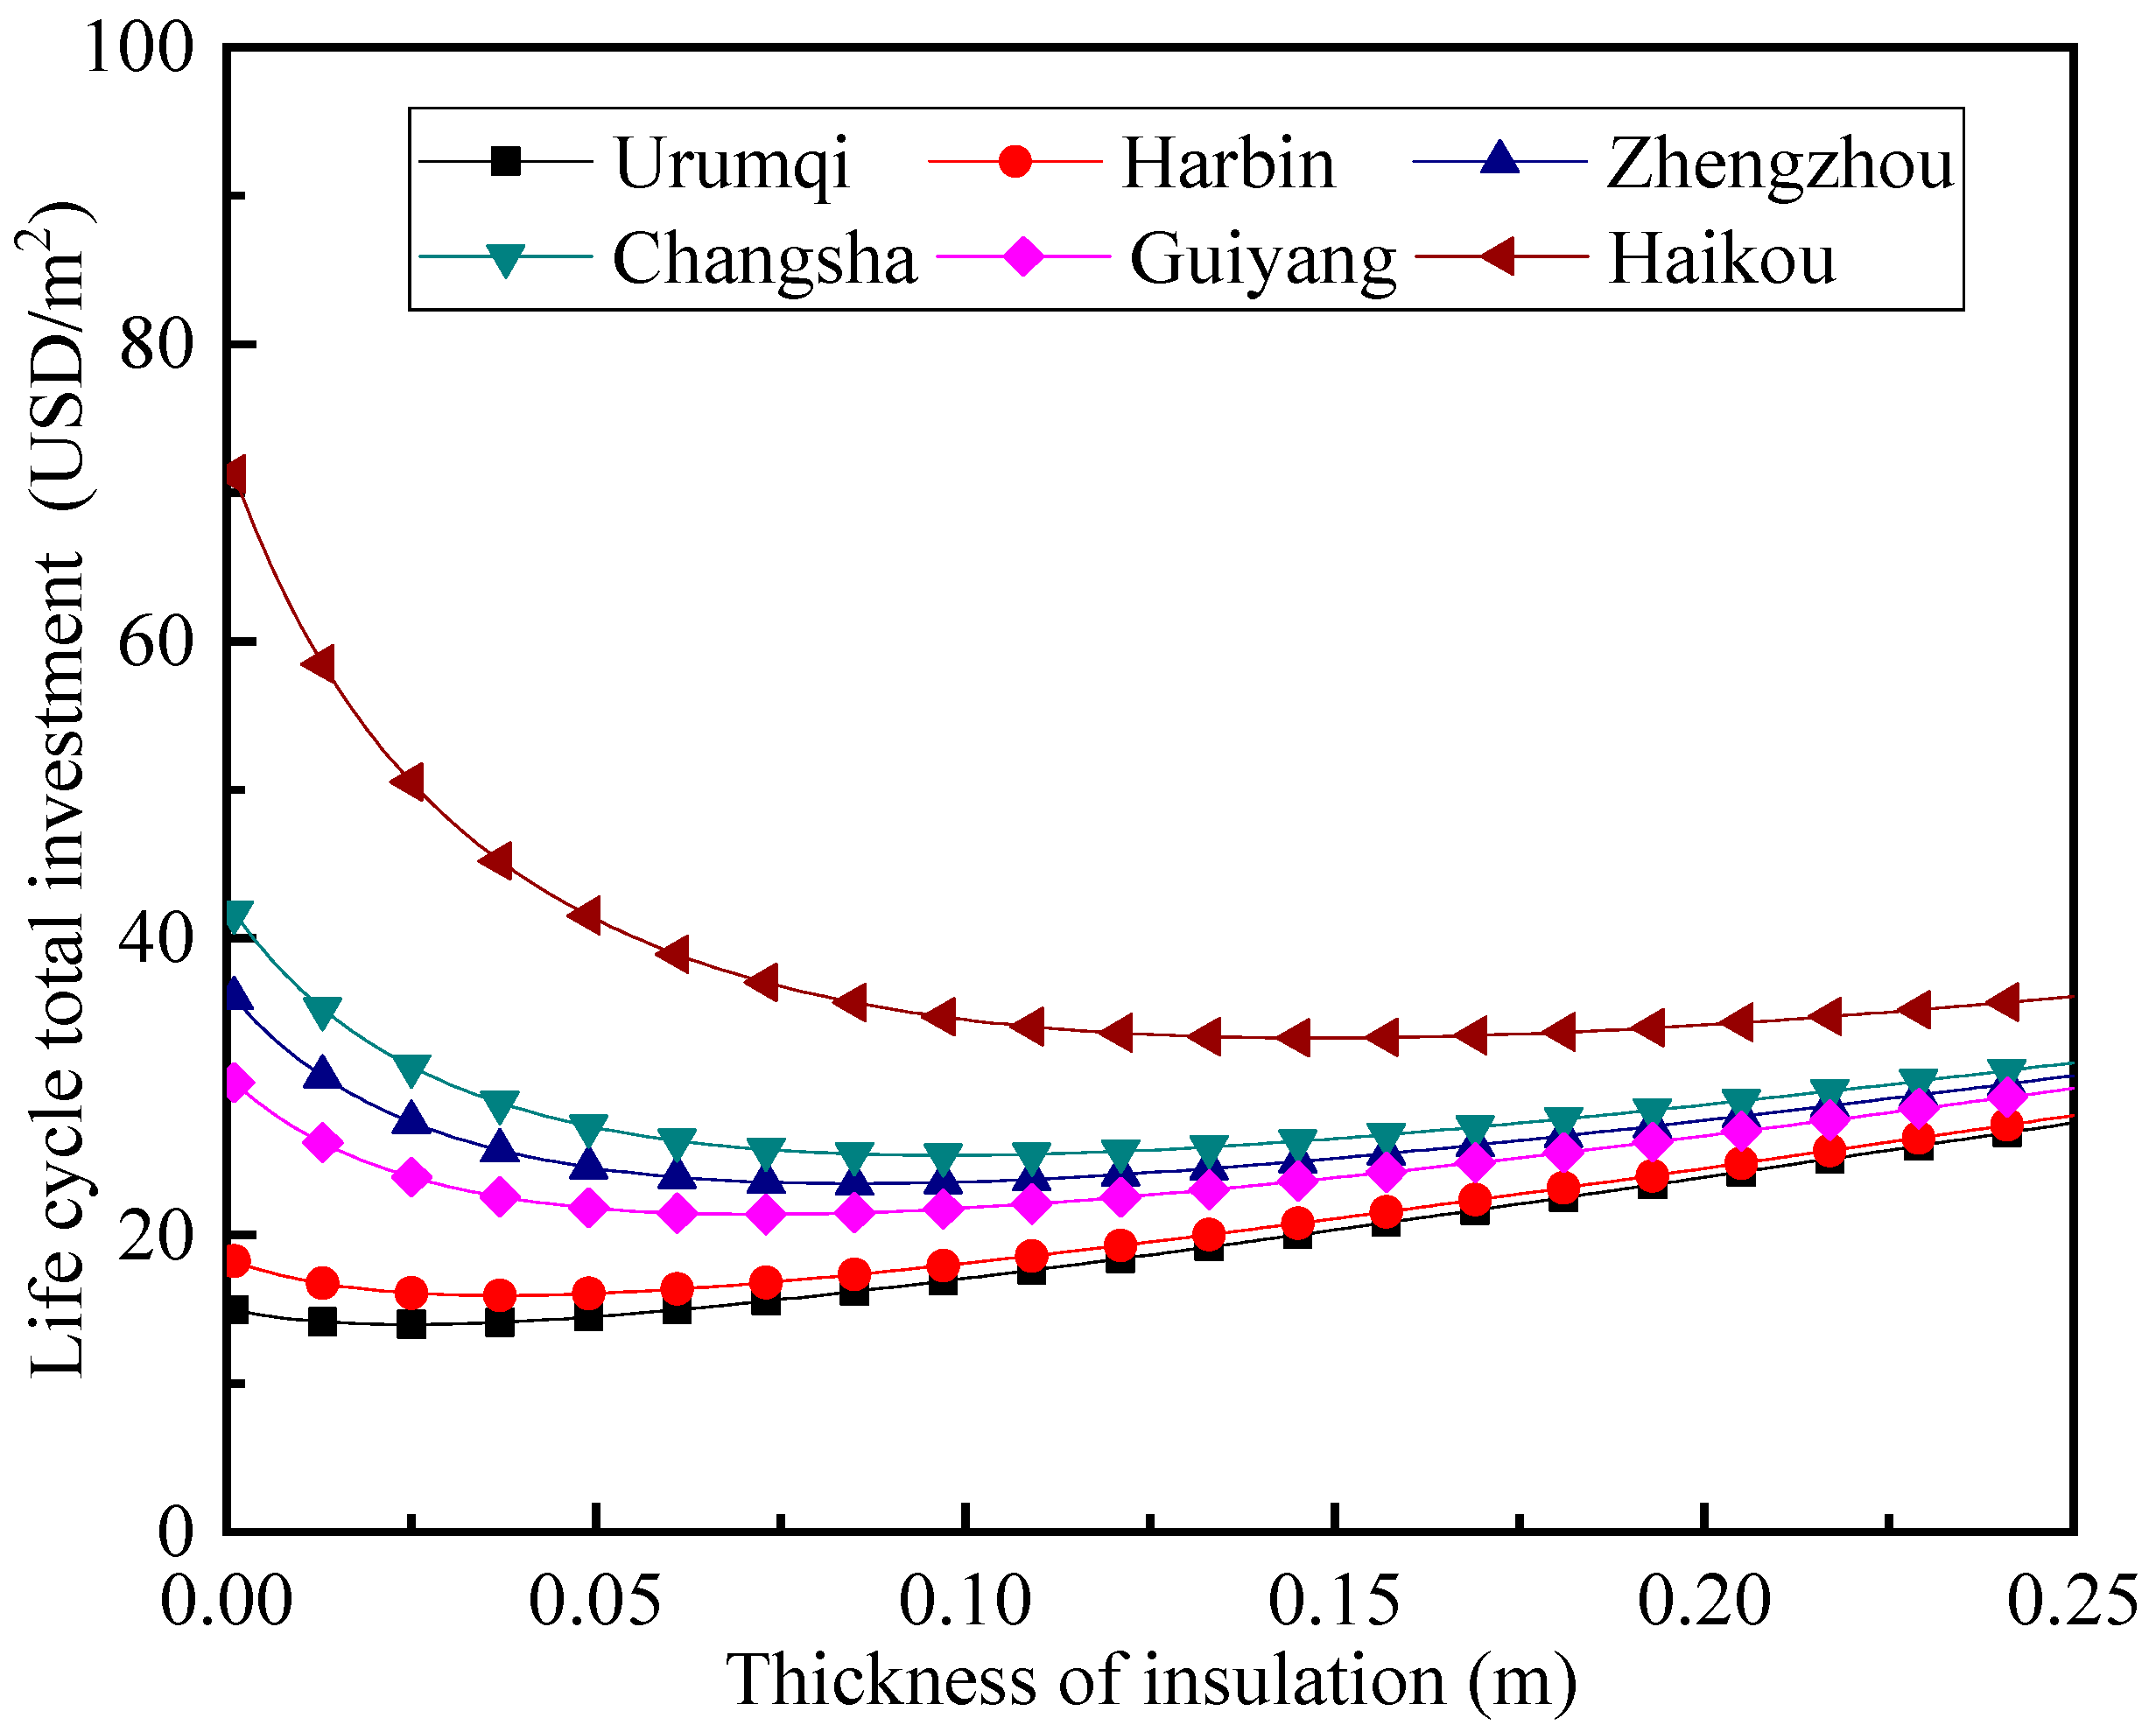
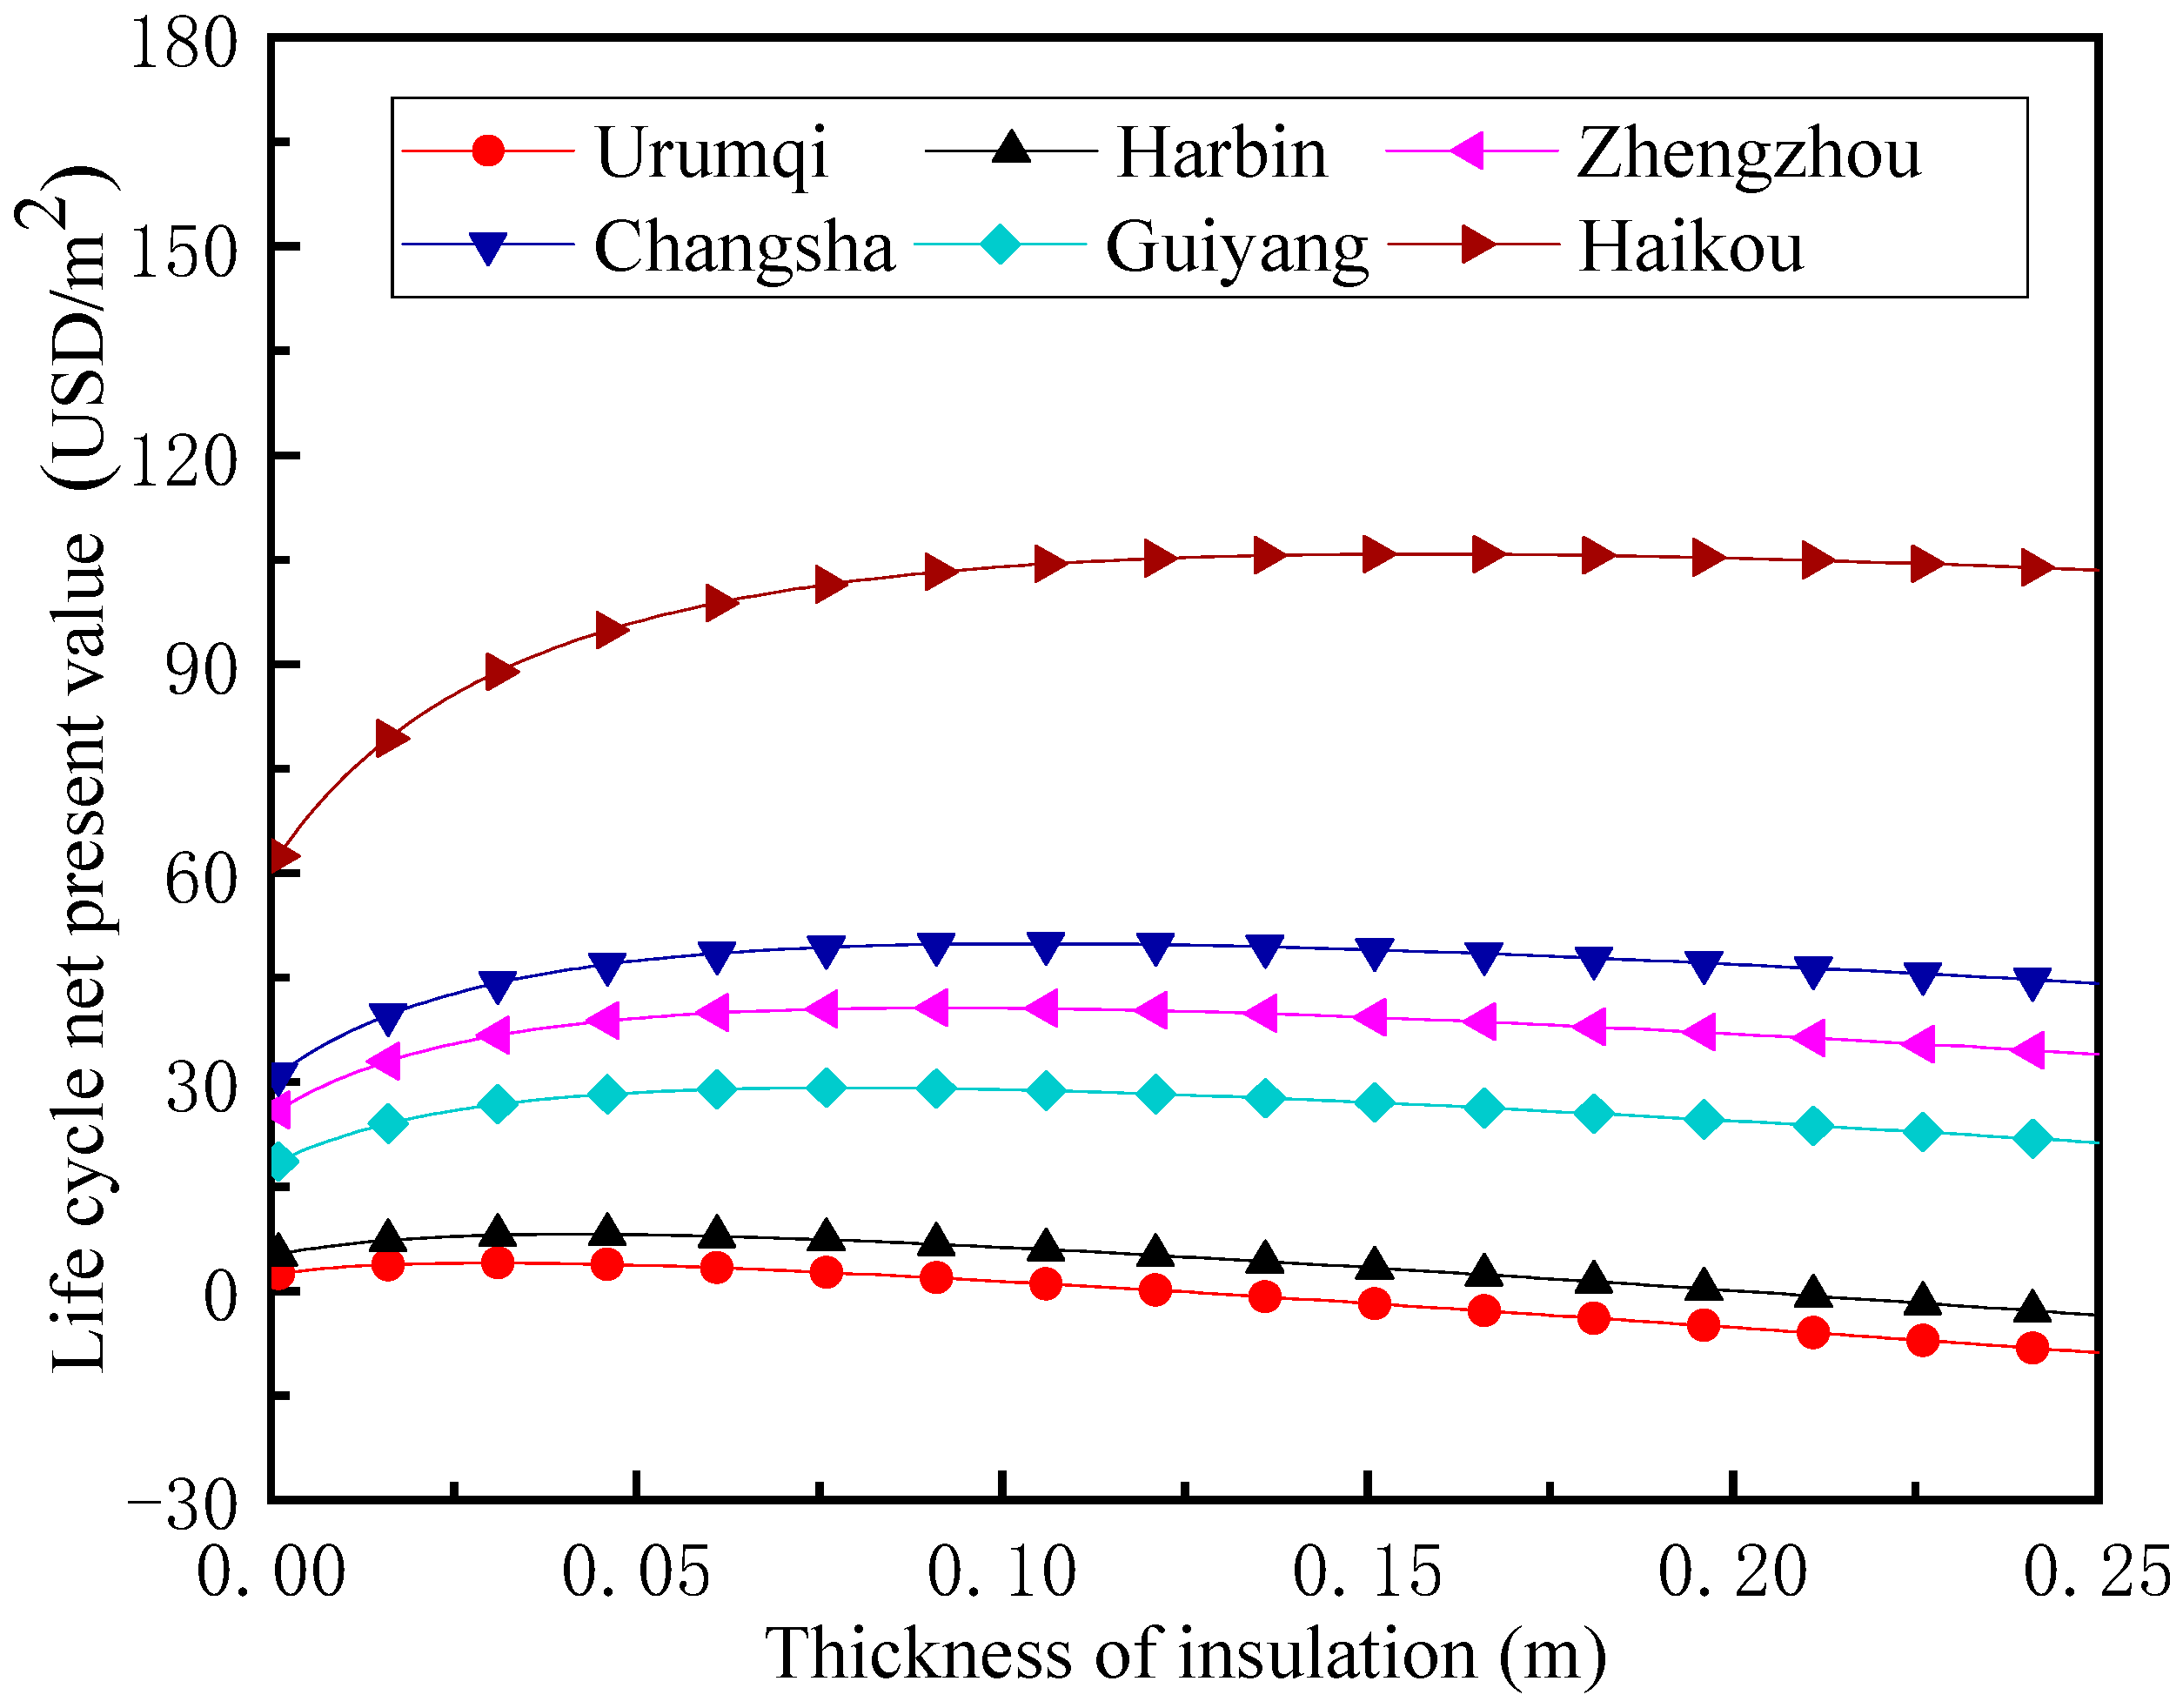
Figure 8 shows the calculated results of for EPS in the granary roofs with different insulation thicknesses in the six selected typical cities in China. Figure 9 shows the calculated results of for EPS in the granary roofs with different insulation thicknesses in the six selected typical cities in China. There is a minimum point of , and this point corresponds to the thickness of the insulation material that is the optimal thickness. When the material thickness is less than or thicker than this economic thickness, all the values increase accordingly. There is a maximum minimum point of , and this point also corresponds to the thickness of the insulation material that is the optimal thickness. When the material thickness is less than or thicker than this economic thickness, all values decrease accordingly. The calculated minimum values of in Urumqi city, Harbin city, Zhengzhou city, Changsha city, Guiyang city, and Haikou city were 13.98 USD/m2, 15.94 USD/m2, 23.59 USD/m2, 25.37 USD/m2, 21.40 USD/m2, and 33.27 USD/m2, respectively. Meanwhile, the values of Urumqi city, Harbin city, Zhengzhou city, Changsha city, Guiyang city, and Haikou city were 4.01 USD/m2, 8.13 USD/m2, 40.63 USD/m2, 49.85 USD/m2, 29.14 USD/m2, and 105.76 USD/m2, respectively. The ranking of the economic benefits of the six typical cities was Urumqi < Harbin < Guiyang < Zhengzhou < Changsha < Haikou. Therefore, Haikou city achieved the best economic benefits among the six typical cities, followed by Changsha city; Harbin city and Urumqi city had smaller economic benefits. As Harbin city and Urumqi city, with their natural climatic conditions, can meet the requirements of low-temperature grain storage in most cases, the energy consumption saved using low-temperature grain storage technology is less compared to that of the other cities, and thus, the economic benefits it brings are not significant.
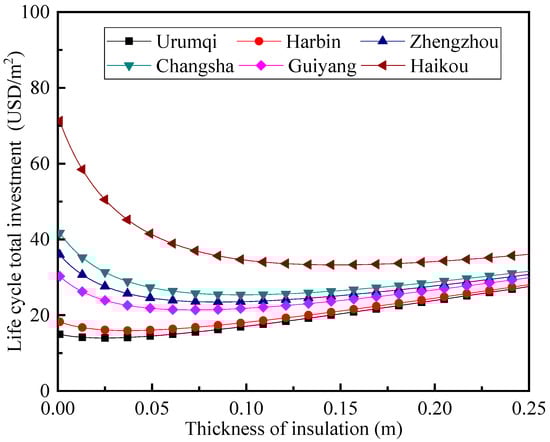
Figure 8.
Life cycle investment of granary roof insulation.
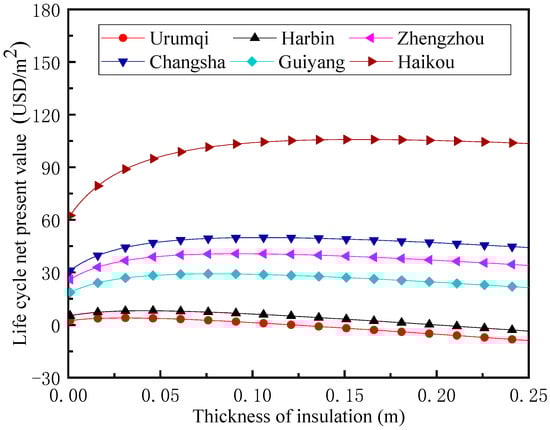
Figure 9.
Life cycle net present value of granary roof insulation.
4.2. Roof Insulation Optimal Insulation Layer Thicknesses
When the carbon emission costs of roof insulation were not considered, the optimal insulation layer thicknesses in the low-temperature granaries of Urumqi city, Harbin city, Zhengzhou city, Changsha city, Guiyang city, and Haikou city were 0.026 m, 0.039 m, 0.088 m, 0.101 m, 0.075 m, and 0.152 m, respectively. When the carbon emission costs of roof insulation were considered, the optimal insulation layer thicknesses in the low-temperature granaries of Urumqi city, Harbin city, Zhengzhou city, Changsha city, Guiyang city, and Haikou city were 0.025 m, 0.037 m, 0.085 m, 0.097 m, 0.072 m, and 0.148 m, respectively. Therefore, the carbon emission costs because of roof insulation decreased by 3.85~5.13% for the six selected typical cities. After determining the optimal insulation layer thicknesses in the low-temperature granaries, the payback periods of roof insulation were determined using Equation (15). When the carbon emission costs of roof insulation were not considered, the payback periods of roof insulation in the low-temperature granaries of Urumqi city, Harbin city, Zhengzhou city, Changsha city, Guiyang city, and Haikou city were 2.62 years, 2.55 years, 1.95 years, 1.86 years, 2.17 years, and 1.45 years, respectively. When the carbon emission costs of for roof insulation were considered, the payback periods of roof insulation in the low-temperature granaries of Urumqi city, Harbin city, Zhengzhou city, Changsha city, Guiyang city, and Haikou city were 2.58 years, 2.43 years, 1.89 years, 1.79 years, 2.09 years, and 1.41 years, respectively. As shown in Figure 10, the carbon emission costs of roof insulation cause the payback periods to be reduced by 1.52~4.71%. The smaller the payback period, the better the economic performance of the insulation material.
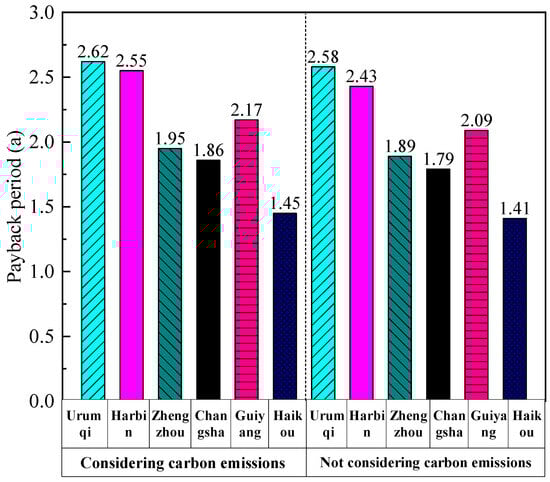
Figure 10.
Payback periods without and with considering carbon emission costs.
4.3. Effect of Carbon Emission Costs on Economic Performance of Roof Insulation
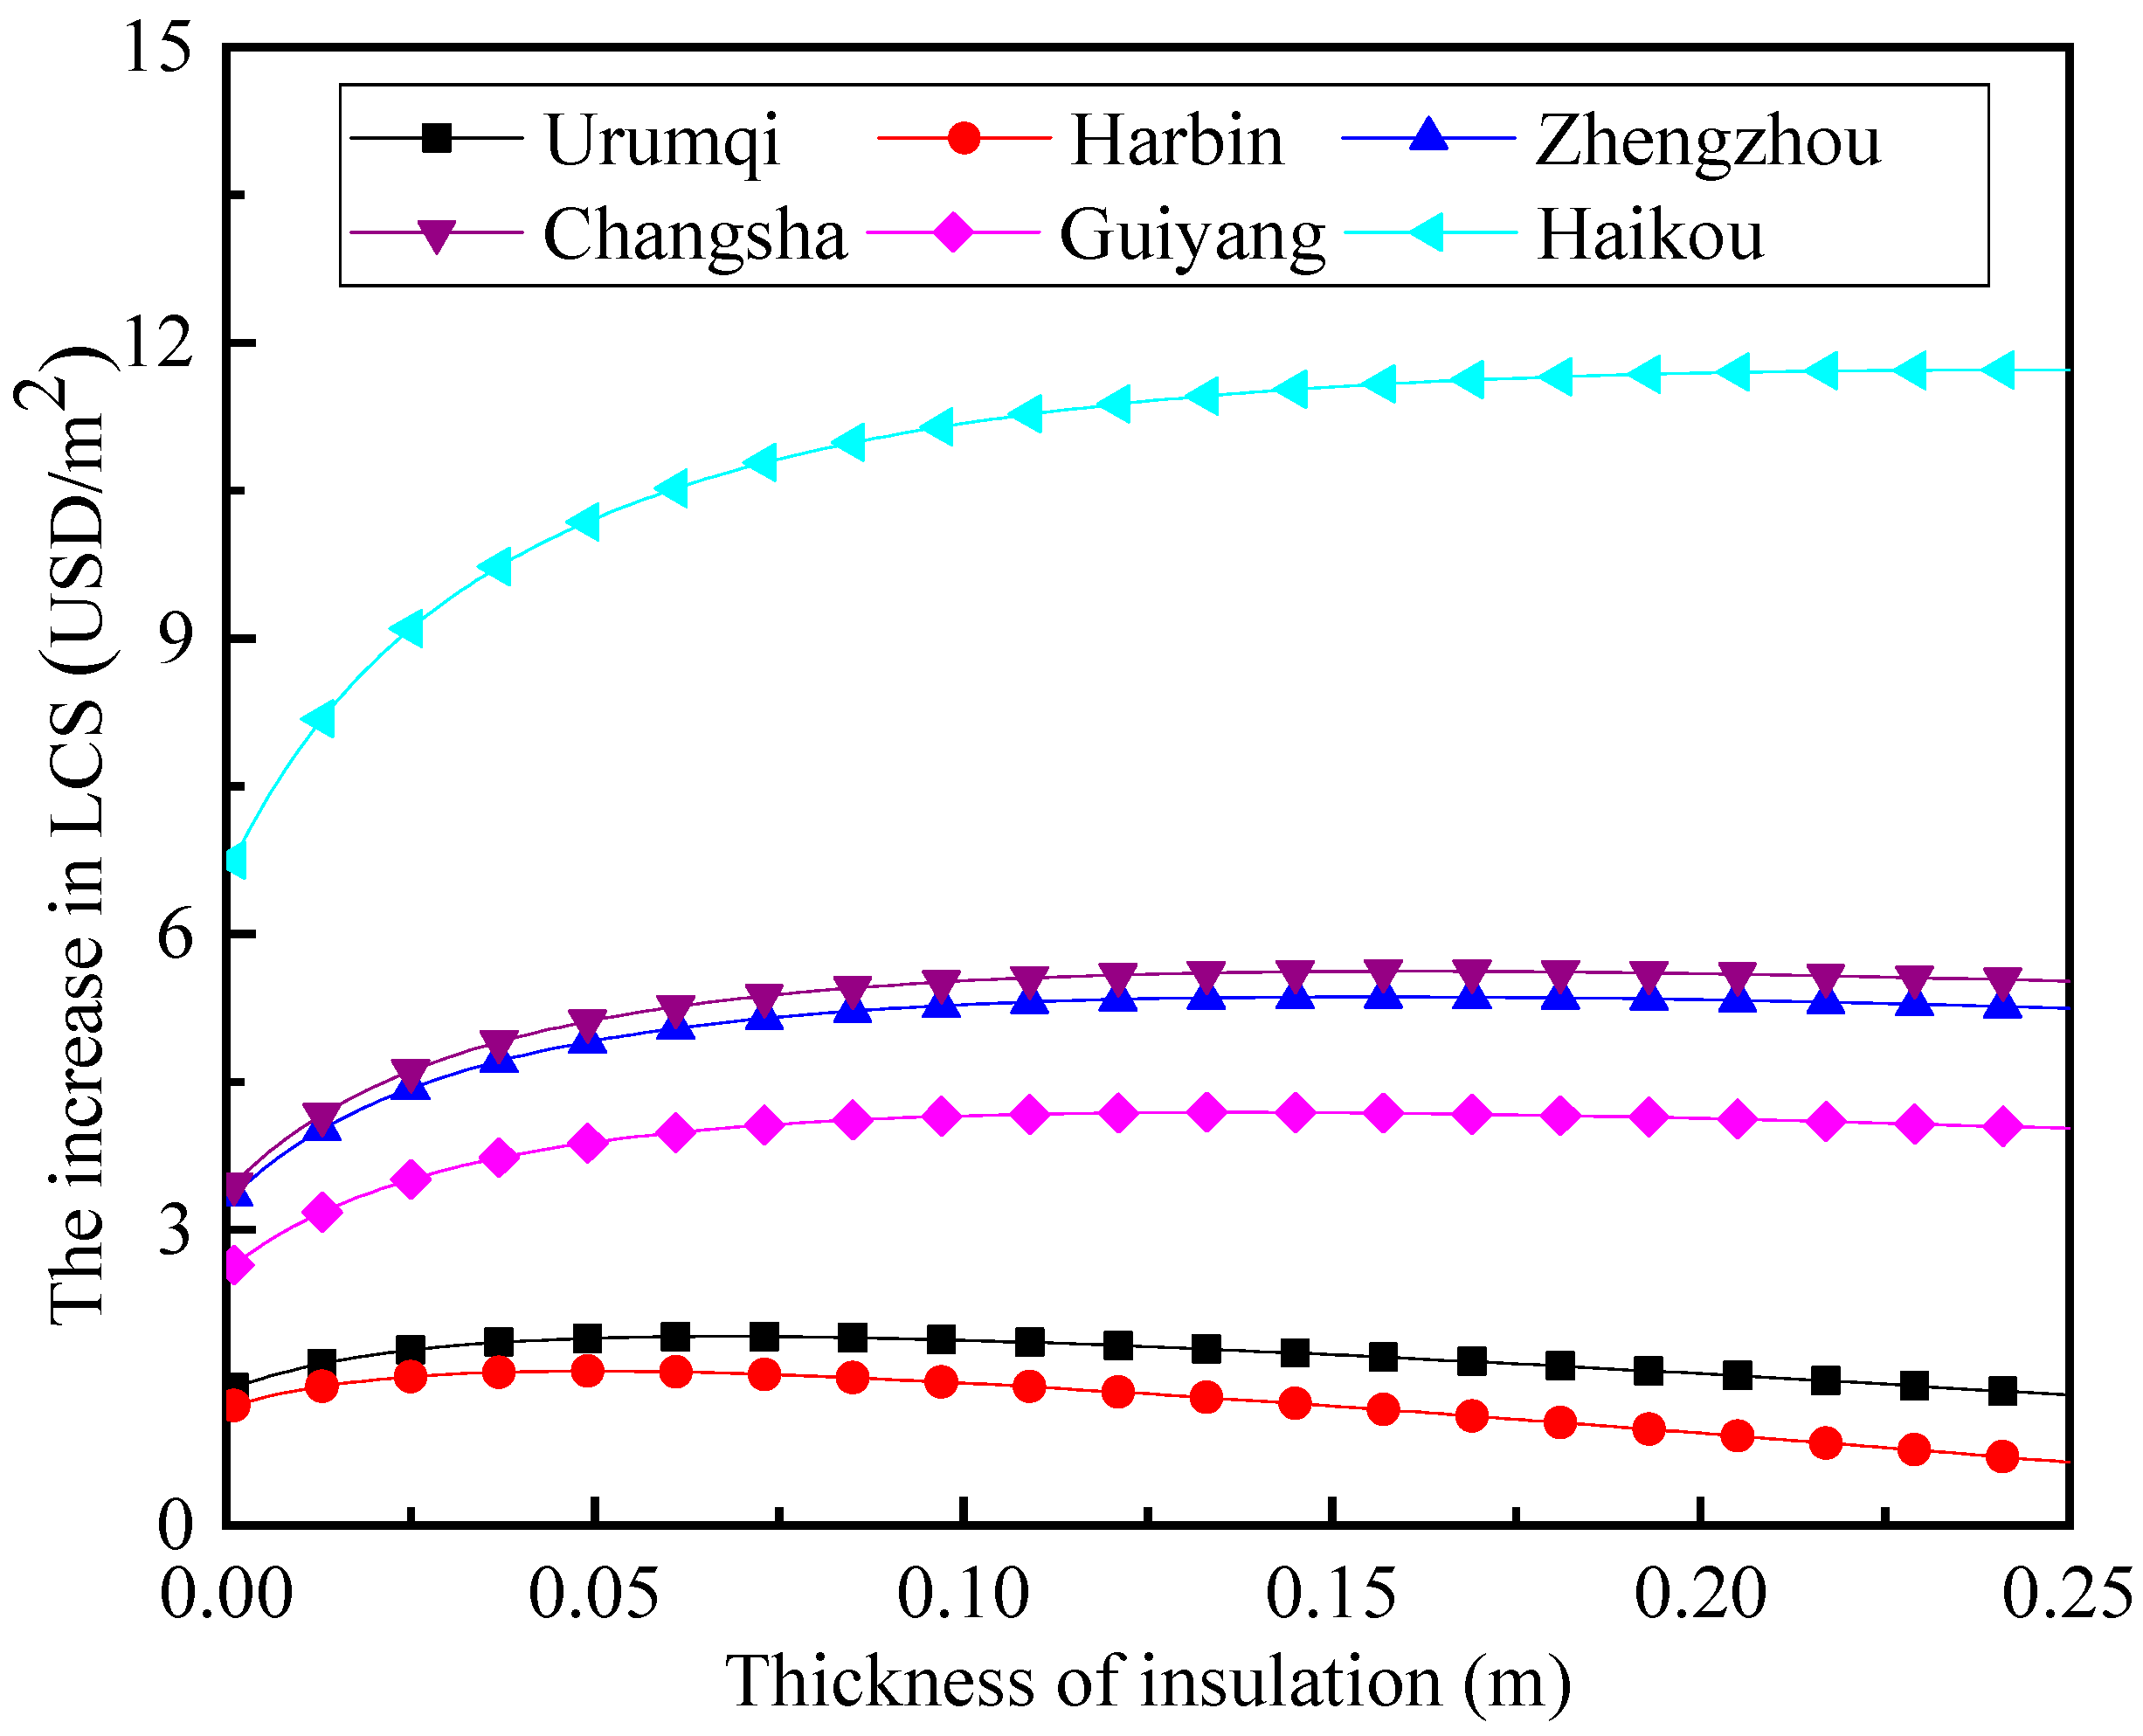
The lifecycle carbon emission costs due to roof insulation can increase the lifecycle total investment of building roof insulation. Figure 11 shows the increased LCT after considering carbon emission costs of the roof insulation. Considering the carbon emission costs, the increase in values for the six typical cities was 0.67% to 1.69%. Figure 12 shows the increased after cost consideration of carbon emission for roof insulation. The energy consumption reduction due to insulation decreases the carbon emissions due to energy consumption. The reduction in carbon emission costs brings about the increase in for roof insulation. The values increased by 1.78 USD/m2, 1.55 USD/m2, 5.22 USD/m2, 5.51 USD/m2, 4.06 USD/m2, and 11.54 USD/m2 for Urumqi city, Harbin city, Zhengzhou city, Changsha city, Guiyang city, and Haikou city, respectively. The increase in after considering carbon emission costs was 12.25~24.06%. It is worth noting that the increase in (12.25~24.06%) is much higher than the increase in (0.67~1.69%). Therefore, considering carbon emission costs can significantly improve the economic benefits of roof insulation in a low-temperature granary.
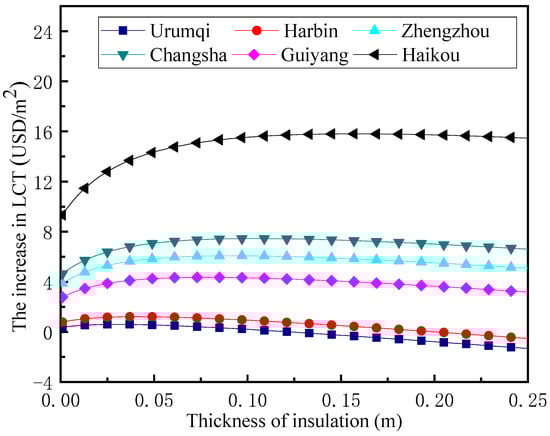
Figure 11.
Increased LCT after considering carbon emission costs.
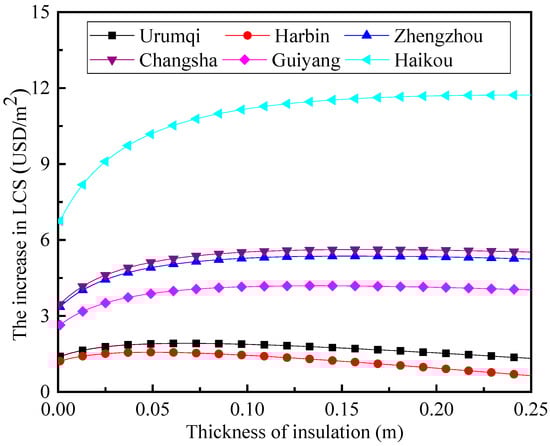
Figure 12.
Increased LCS after considering carbon emission costs.
4.4. Calculated Balanced Indexes for Different Ecological Grain Storage Zones
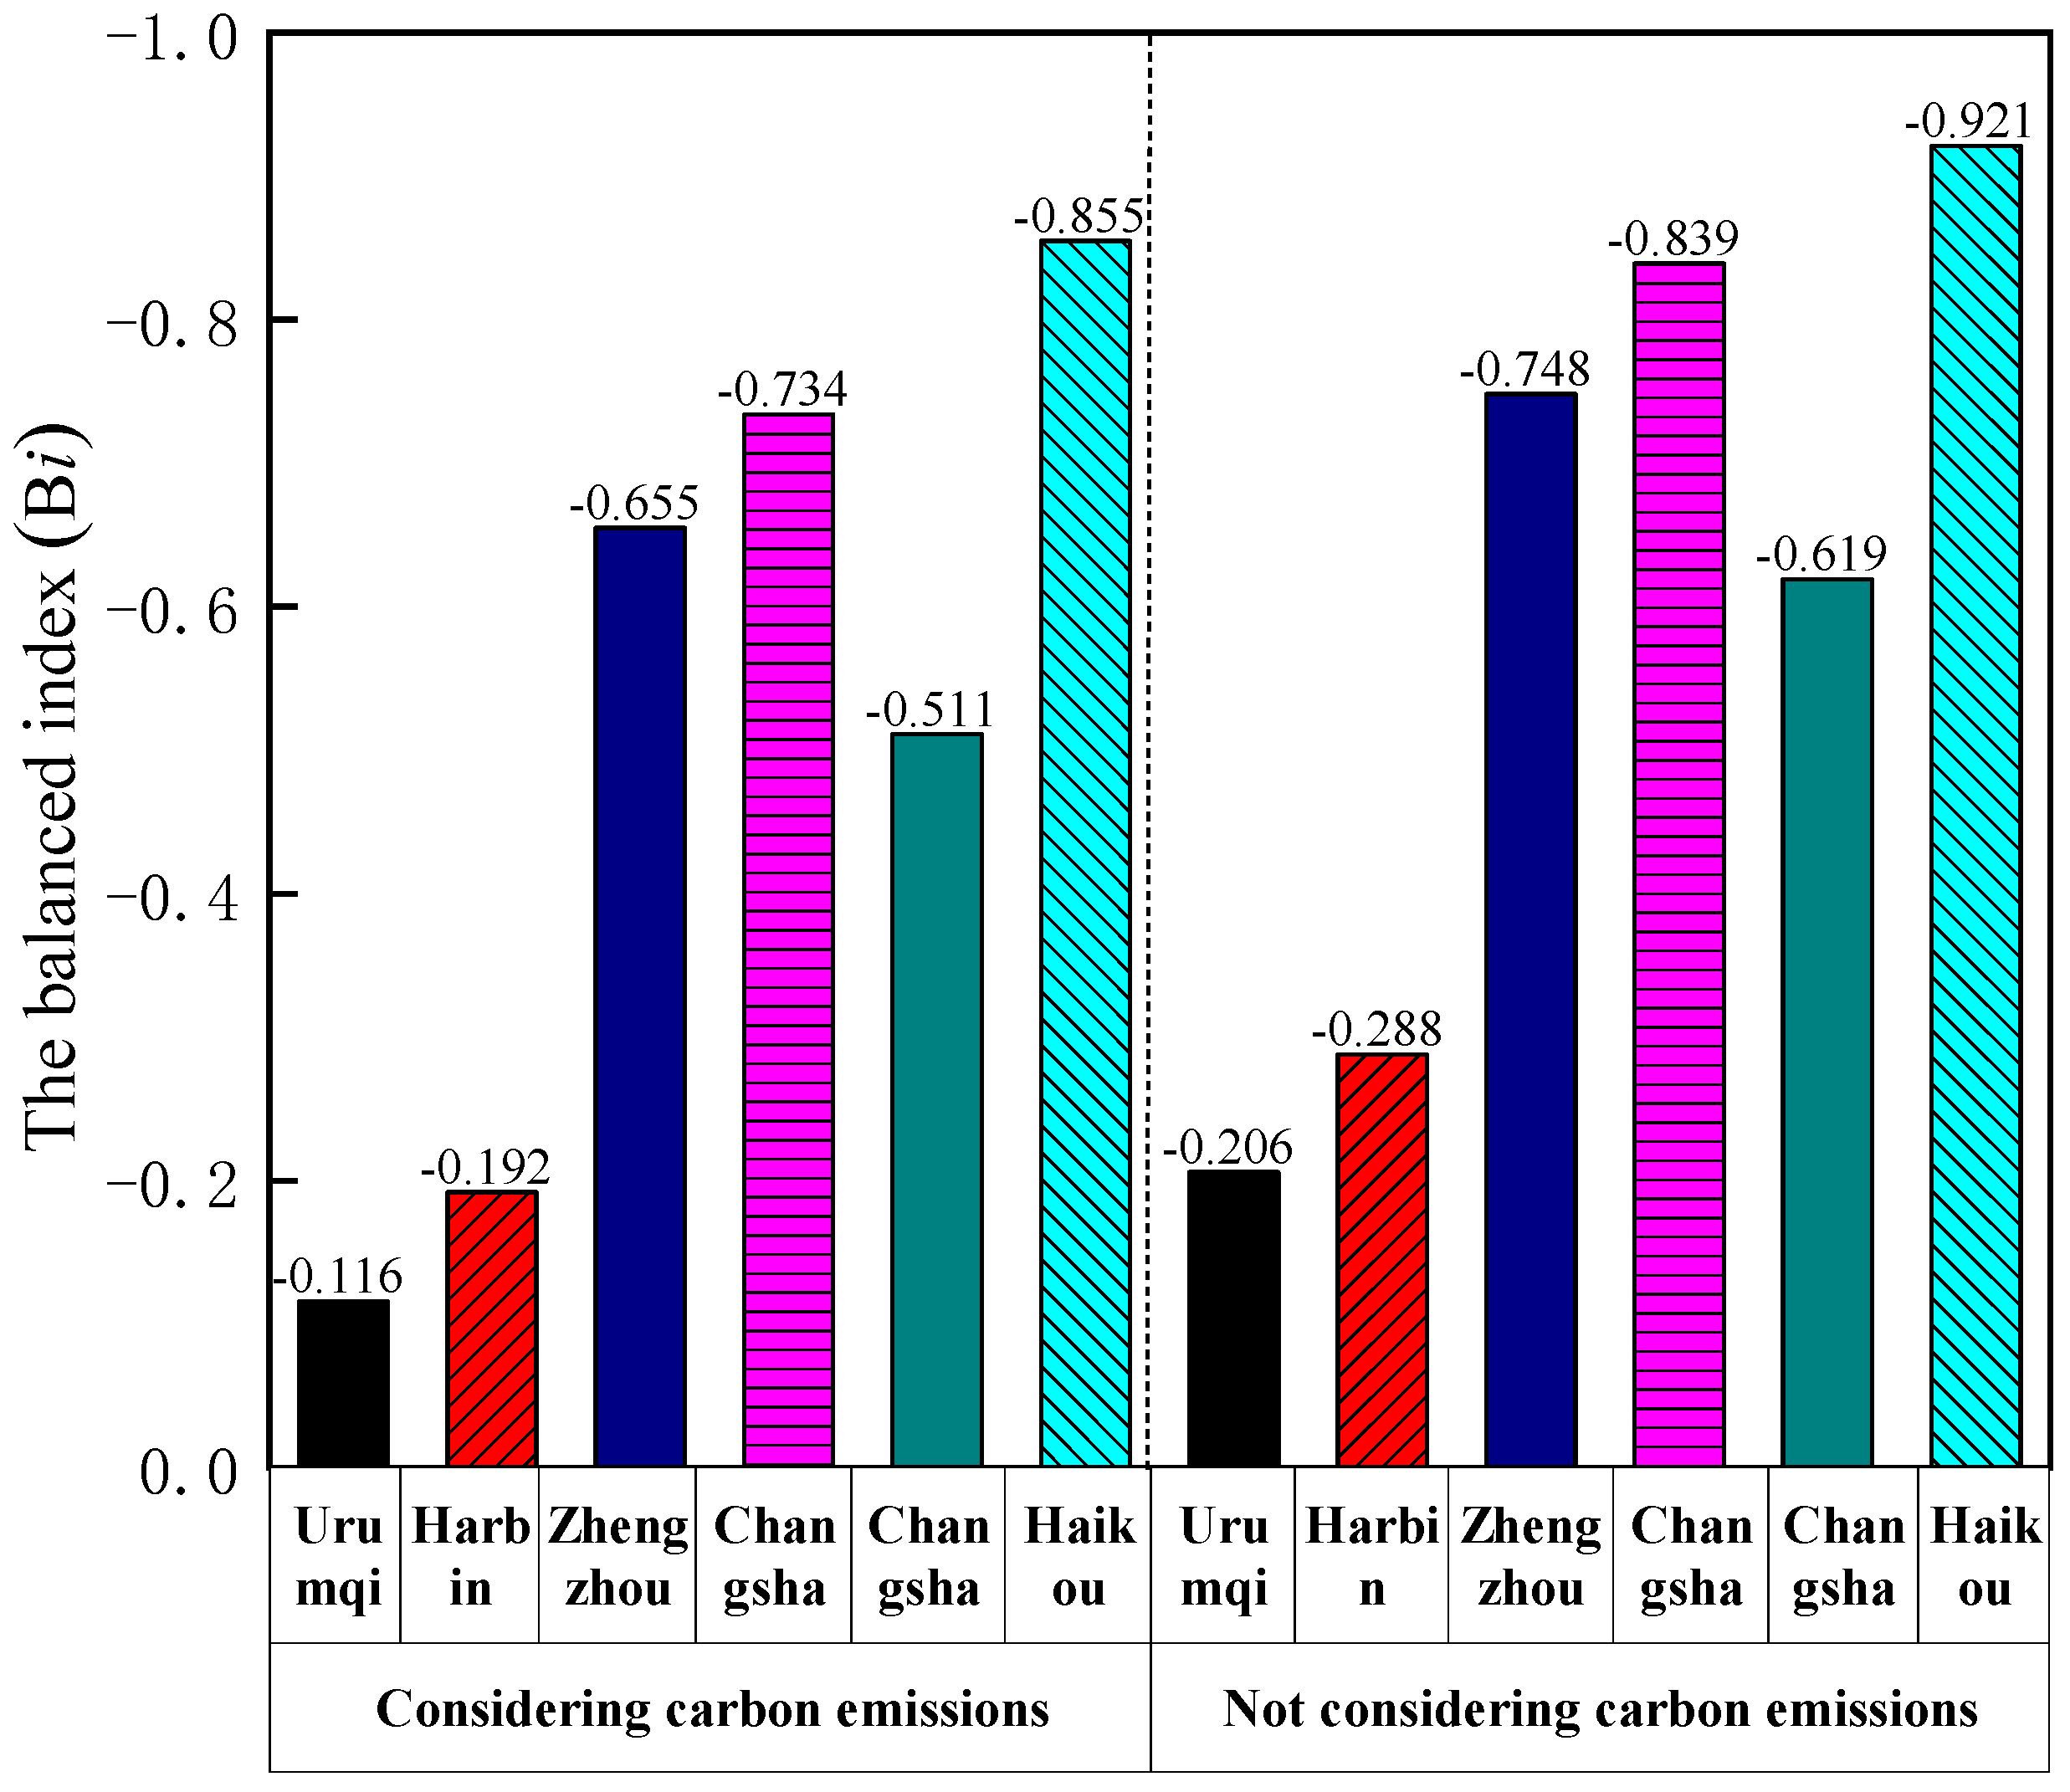
The balanced indexes of the roof insulation in the low-temperature granaries were calculated using Equation (16). Figure 13 shows the balanced indexes of the roof insulation with and without considering the carbon emission costs for the six typical cities. For each city, the balanced index of roof insulation after considering carbon emission costs was lower than that without consideration carbon emission costs. When the carbon emission costs were considered, the variation values of the balanced indexes of the roof insulation for the six typical cities were 0.066~0.108. The priority order of the balanced indexes of the roof insulation for the six typical cities was Haikou city > Changsha city > Zhengzhou city > Guiyang city > Harbin city > Urumqi city. The economic benefit of the roof insulation in the low-temperature granary for Haikou city was the greatest among the six typical cities in China.
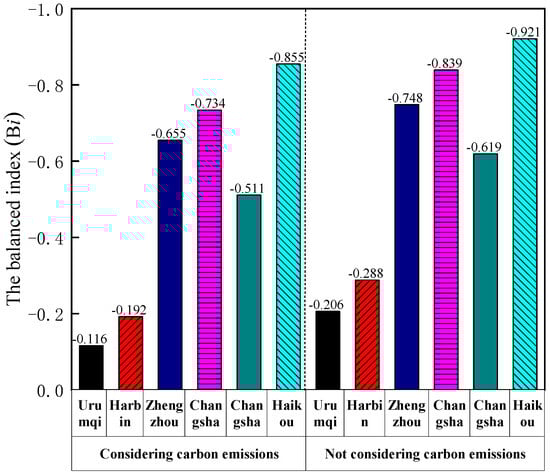
Figure 13.
Balanced indexes with and without consideration of carbon emission costs.
5. Conclusions
Although the carbon trading mechanism, carbon tax, and the other carbon reduction policies and measures are beneficial to urban environmental protection and building sustainable development, the studies on the low-carbon optimization design of buildings are still highly insufficient. In this paper, the low-temperature granary roof insulation for different ecological grain storage zones in China was optimized in terms of carbon reduction. The following conclusions were obtained:
- (1)
- A novel low-carbon design optimization method of roof insulation is very useful for determining the best insulation design scheme in a low-temperature granary roof;
- (2)
- The P1–P2 economic analysis model was modified to cope with the carbon emissions of roof insulation. The carbon emission costs were found to have certain influences on the economic performance of the low-temperature granary roof insulation;
- (3)
- The outdoor climates of the different ecological grain storage zones in China have significant impacts on the economic performance and carbon reduction effect of low-temperature granary roof insulation;
- (4)
- The priority order of the balanced indexes of roof insulation for the six typical cities is Haikou city > Changsha city > Zhengzhou city > Guiyang city > Harbin city > Urumqi city. The economic benefit of roof insulation in the low-temperature granary of Haikou city is the greatest among the six typical cities in China.
This paper only takes the roof insulation materials in buildings as the research object and investigates the low-carbon design optimization of roof insulation. In the future, the research scope can be extended to the low-carbon design optimization of the whole building. Although the carbon trading mechanism, carbon tax, and the other carbon reduction policies and measures are very helpful in reducing carbon emissions in buildings, more low-carbon economic analysis methods and more insulation material types should be studied to achieve the goal of building energy conservation and emission reduction.
Author Contributions
D.L., conceptualization, methodology, and investigation; Y.H., writing—review and editing, data curation, and conceptualization; C.G., supervision and formal analysis; H.W., writing—original draft; J.J., validation; L.H., validation. All authors have read and agreed to the published version of the manuscript.
Funding
The research work presented in this paper is financially supported by the Science and Technology Planning Project of Henan Province of China (No. 232102320225), the Open Project Program of Henan Key Laboratory of Grain and Oil Storage Facility & Safety (NO. 2022KF05), the Cultivation Programme for Young Backbone Teachers of Henan University of Technology (No. 21420069), and the Innovative Funds Plan of Henan University of Technology (No. 2020ZKCJ05, 2020ZKCJ022).
Institutional Review Board Statement
The study did not require ethical approval.
Informed Consent Statement
Informed consent was obtained from all subjects involved in the study.
Data Availability Statement
Not applicable.
Conflicts of Interest
The authors declare no conflict of interest.
References
- Nie, S.; Zhou, J.; Yang, F.; Lan, M.; Li, J.; Zhang, Z.; Chen, Z.; Xu, M.; Li, H.; Sanjayan, J. Analysis of theoretical carbon dioxide emissions from cement production: Methodology and application. J. Clean. Prod. 2022, 334, 130270. [Google Scholar] [CrossRef]
- Li, Y.; Li, S.; Xia, S.; Li, B.; Zhang, X.; Wang, B.; Ye, T.; Zheng, W. A review on the policy, technology and evaluation method of low-carbon buildings and communities. Energies 2023, 16, 1773. [Google Scholar] [CrossRef]
- Du, X.; Meng, C.; Guo, Z.; Yan, H. An improved approach for measuring the efficiency of low carbon city practice in China. Energy 2023, 268, 126678. [Google Scholar] [CrossRef]
- Liu, Y.; Xue, S.; Guo, X.; Zhang, B.; Sun, X.; Zhang, Q.; Wang, Y.; Dong, Y. Towards the goal of zero-carbon building retrofitting with variant application degrees of low-carbon technologies: Mitigation potential and cost-benefit analysis for a kindergarten in Beijing. J. Clean. Prod. 2023, 393, 136316. [Google Scholar] [CrossRef]
- Yu, J.; Qian, C.; Yang, Q.; Xu, T.; Zhao, J.; Xu, X. The energy saving potential of a new ventilation roof with stabilized phase change material in hot summer region. Renew. Energy 2023, 212, 111–127. [Google Scholar] [CrossRef]
- Speich, M.; Ulli-Beer, S. Applying an ecosystem lens to low-carbon energy transitions: A conceptual framework. J. Clean. Prod. 2023, 398, 136429. [Google Scholar] [CrossRef]
- Zhang, X.; Wang, F. Influence of parameter uncertainty on the low-carbon design optimization of reinforced concrete continuous beams. Struct. Concr. 2022, 24, 855–871. [Google Scholar] [CrossRef]
- Luo, T.; Tan, Y.T.; Langston, C.; Xue, X.L. Mapping the knowledge roadmap of low carbon building: Ascientometric analysis. Energy Build. 2019, 194, 163–176. [Google Scholar] [CrossRef]
- Zhang, Y.; Qin, M.; Lv, M.; Li, Y. Data-based analysis of environmental attractiveness towards low-carbon development in seaside cities. Buildings 2022, 12, 2197. [Google Scholar] [CrossRef]
- Andrade, I.; Land, J.; Gallardo, P.; Krumdieck, S. Application of the InTIME methodology for the transition of office buildings to low carbon—A case study. Sustainability 2022, 14, 12053. [Google Scholar] [CrossRef]
- Yang, X.; Sima, Y.; Lv, Y.; Li, M. Research on influencing factors of residential building carbon emissions and carbon peak: A case of Henan province in China. Sustainability 2023, 15, 10243. [Google Scholar] [CrossRef]
- Yang, L.; Wang, S.; Zhang, Z.; Lin, K.; Zheng, M. Current Development Status, Policy Support and Promotion Path of China’s Green Hydrogen Industries under the Target of Carbon Emission Peaking and Carbon Neutrality. Sustainability 2023, 15, 10118. [Google Scholar] [CrossRef]
- Liu, C.; Sharples, S.; Mohammadpourkarbasi, H. A review of building energy retrofit measures, passive design strategies and building regulation for the low carbon development of existing dwellings in the hot summer–cold winter region of China. Energies 2023, 16, 4115. [Google Scholar] [CrossRef]
- Wei, J.; Shi, W.; Ran, J.; Pu, J.; Li, J.; Wang, K. Exploring the Driving Factors and Their Spatial Effects on Carbon Emissions in the Building Sector. Energies 2023, 16, 3094. [Google Scholar] [CrossRef]
- Xiang, J.; Liu, H.; Li, X.; Jones, P.; Perisoglou, E. Multi-objective optimization of ultra-low energy housing in hot summer cold winter climate zone of China based on a probabilistic behavioral model. Buildings 2023, 13, 1172. [Google Scholar] [CrossRef]
- Wang, Z.; Zhang, S.; Qiu, L. A new low-carbon design method based on multi-agent interactive reinforcement learning. Proc. IMechE Part C J. Mech. Eng. Sci. 2019, 233, 539–553. [Google Scholar] [CrossRef]
- Han, Y.; Li, J.; Lou, X.; Fan, C.; Geng, Z. Energy saving of buildings for reducing carbon dioxide emissions using novel dendrite net integrated adaptive mean square gradient. Appl. Energy 2021, 309, 118409. [Google Scholar] [CrossRef]
- Liu, J.; Zhang, Y. Has carbon emissions trading system promoted non-fossil energy development in China? Appl. Energy 2021, 302, 117613. [Google Scholar] [CrossRef]
- Su, S.; Wang, Q.; Han, L.; Hong, J.; Liu, Z. BIM-DLCA: An integrated dynamic environmental impact assessment model for buildings. Build. Environ. 2020, 183, 107218. [Google Scholar] [CrossRef]
- Cang, Y.; Luo, Z.; Yang, L.; Han, B. A new method for calculating the embodied carbon emissions from buildings in schematic design: Taking “building element” as basic unit. Build. Environ. 2020, 185, 107306. [Google Scholar] [CrossRef]
- Peng, J.; Li, W.Q.; Li, Y.; Xie, Y.M.; Xu, Z.L. Innovative product design method for low-carbon footprint based on multi-layer carbon footprint information. J. Clean. Prod. 2019, 228, 729–745. [Google Scholar] [CrossRef]
- Sandoval Aguilar, R.; Michaelides, E.E. Microgrid for a cluster of grid independent buildings powered by solar and wind energy. Appl. Sci. 2021, 11, 9214. [Google Scholar] [CrossRef]
- Ylmen, P.; Mjornell, K.; Berlin, J.; Arfvidsson, J. Approach to manage parameter and choice uncertainty in life cycle optimisation of building design: Case study of optimal insulation thickness. Build. Environ. 2021, 191, 107544. [Google Scholar] [CrossRef]
- Mohsin, M.; Rasheed, A.K.; Sun, H.P. Developing low carbon economies: An aggregated composite index based on carbon emissions. Sustain. Energy Technol. 2019, 35, 365–374. [Google Scholar] [CrossRef]
- Saad, M.M.; Menon, R.P.; Eicker, U. Supporting Decision Making for Building Decarbonization: Developing Surrogate Models for Multi-Criteria Building Retrofitting Analysis. Energies 2023, 16, 6030. [Google Scholar] [CrossRef]
- Habibi, S.; Valladares, O.P.; Peña, D.M. Sustainability performance by ten representative intelligent Façade technologies: A systematic review. Sustain. Energy Technol. 2022, 52, 102001. [Google Scholar] [CrossRef]
- Rosti, B.; Omidvar, A.; Monghasemi, N. Optimal insulation thickness of common classic and modern exterior walls in different climate zones of Iran. J. Build. Eng. 2020, 27, 100954. [Google Scholar] [CrossRef]
- Khastar, M.; Aslani, A.; Nejati, M.; Bekhrad, K.; Naaranoja, M. Evaluation of the carbon tax effects on the structure of Finnish industries: A computable general equilibrium analysis. Sustain. Energy Technol. 2020, 37, 100611. [Google Scholar] [CrossRef]
- Timilsina, G.R. Carbon tax under the Clean Development Mechanism: A unique approach for reducing greenhouse gas emissions in developing countries. Clim. Policy 2009, 9, 139–154. [Google Scholar] [CrossRef]
- Jia, Z.; Lin, B. Rethinking the choice of carbon tax and carbon trading in China. Technol. Forecast. Soc. Chang. 2020, 159, 120187. [Google Scholar] [CrossRef]
- Quan, B.; Shan, H.; Li, J. Interpretation of IPCC AR6 on buildings. Adv. Clim. Chang. Res. 2022, 18, 557. [Google Scholar]
- Garbaccio, R.; Ho, M.; Jorgenson, D. Controlling carbon emissions in China. Environ. Dev. Econ. 1999, 4, 493–518. [Google Scholar] [CrossRef]
- Li, D.Z.; Chen, H.X.; Hui, E.M.; Zhang, J.B.; Li, Q.M. A methodology for estimating the life-cycle carbon efficiency of a residential building. Build. Environ. 2013, 59, 448–455. [Google Scholar] [CrossRef]
- Zhang, X.; Wang, F. Life-cycle assessment and control measures for carbon emissions of typical buildings in China. Build. Environ. 2015, 86, 89–97. [Google Scholar] [CrossRef]
- Lou, Y.; Yang, Y.; Ye, Y.; He, C.; Zuo, W. The economic impacts of carbon emission trading scheme on building retrofits: A case study with U.S. medium office buildings. Build. Environ. 2022, 221, 109311. [Google Scholar] [CrossRef]
- Duffie, J.; Beckman, W. Solar energy thermal processes. Phys. Today 1976, 29, 62–67. [Google Scholar] [CrossRef]
- FRED Economic Data. Interest Rates, Discount Rate for China. 2020. Available online: https://fred.stlouisfed.org/series/INTDSRCNM193N (accessed on 21 July 2020).
- Trading Economics. China Inflation Rate. 2020. Available online: https://tradingeconomics.com/china/inflation-cpi (accessed on 21 July 2020).
- Yu, J.; Yang, C.; Tian, L.; Liao, D. A study on optimum insulation thicknesses of external walls in hot summer and cold winter zone of China. Appl. Energy 2009, 86, 2520–2529. [Google Scholar] [CrossRef]
- Jiang, Y.; Hu, Y.; Asante, D.; Ampaw, E.; Asante, B. The Effects of Executives’ low-carbon cognition on corporate low-carbon performance: A study of managerial discretion in China. J. Clean Prod. 2022, 357, 132015. [Google Scholar] [CrossRef]
- Ramesh, T.; Prakash, R.; Shukla, K.K. Life cycle energy analysis of buildings: An overview. Energy Build. 2010, 42, 1592–1600. [Google Scholar] [CrossRef]
- Zhao, S.; Zhu, Y.; Lou, P.; Hu, Y.; Xu, C.; Chen, Y. Optimization model of substation building envelope–renewable energy utilization based on life-cycle minimum carbon emissions. Buildings 2023, 13, 1602. [Google Scholar] [CrossRef]
- Wang, Q.; Guo, W.; Xu, X.; Deng, R.; Ding, X.; Chen, T. Analysis of carbon emission reduction paths for the production of prefabricated building components based on evolutionary game theory. Buildings 2023, 13, 1557. [Google Scholar] [CrossRef]


Disclaimer/Publisher’s Note: The statements, opinions and data contained in all publications are solely those of the individual author(s) and contributor(s) and not of MDPI and/or the editor(s). MDPI and/or the editor(s) disclaim responsibility for any injury to people or property resulting from any ideas, methods, instructions or products referred to in the content. |
© 2023 by the authors. Licensee MDPI, Basel, Switzerland. This article is an open access article distributed under the terms and conditions of the Creative Commons Attribution (CC BY) license (https://creativecommons.org/licenses/by/4.0/).